
Compatibility between Continental Shelf Deposits and Sediments of Adjacent Beaches along Western Sardinia (Mediterranean Sea)
 and
and
Abstract
:1. Introduction
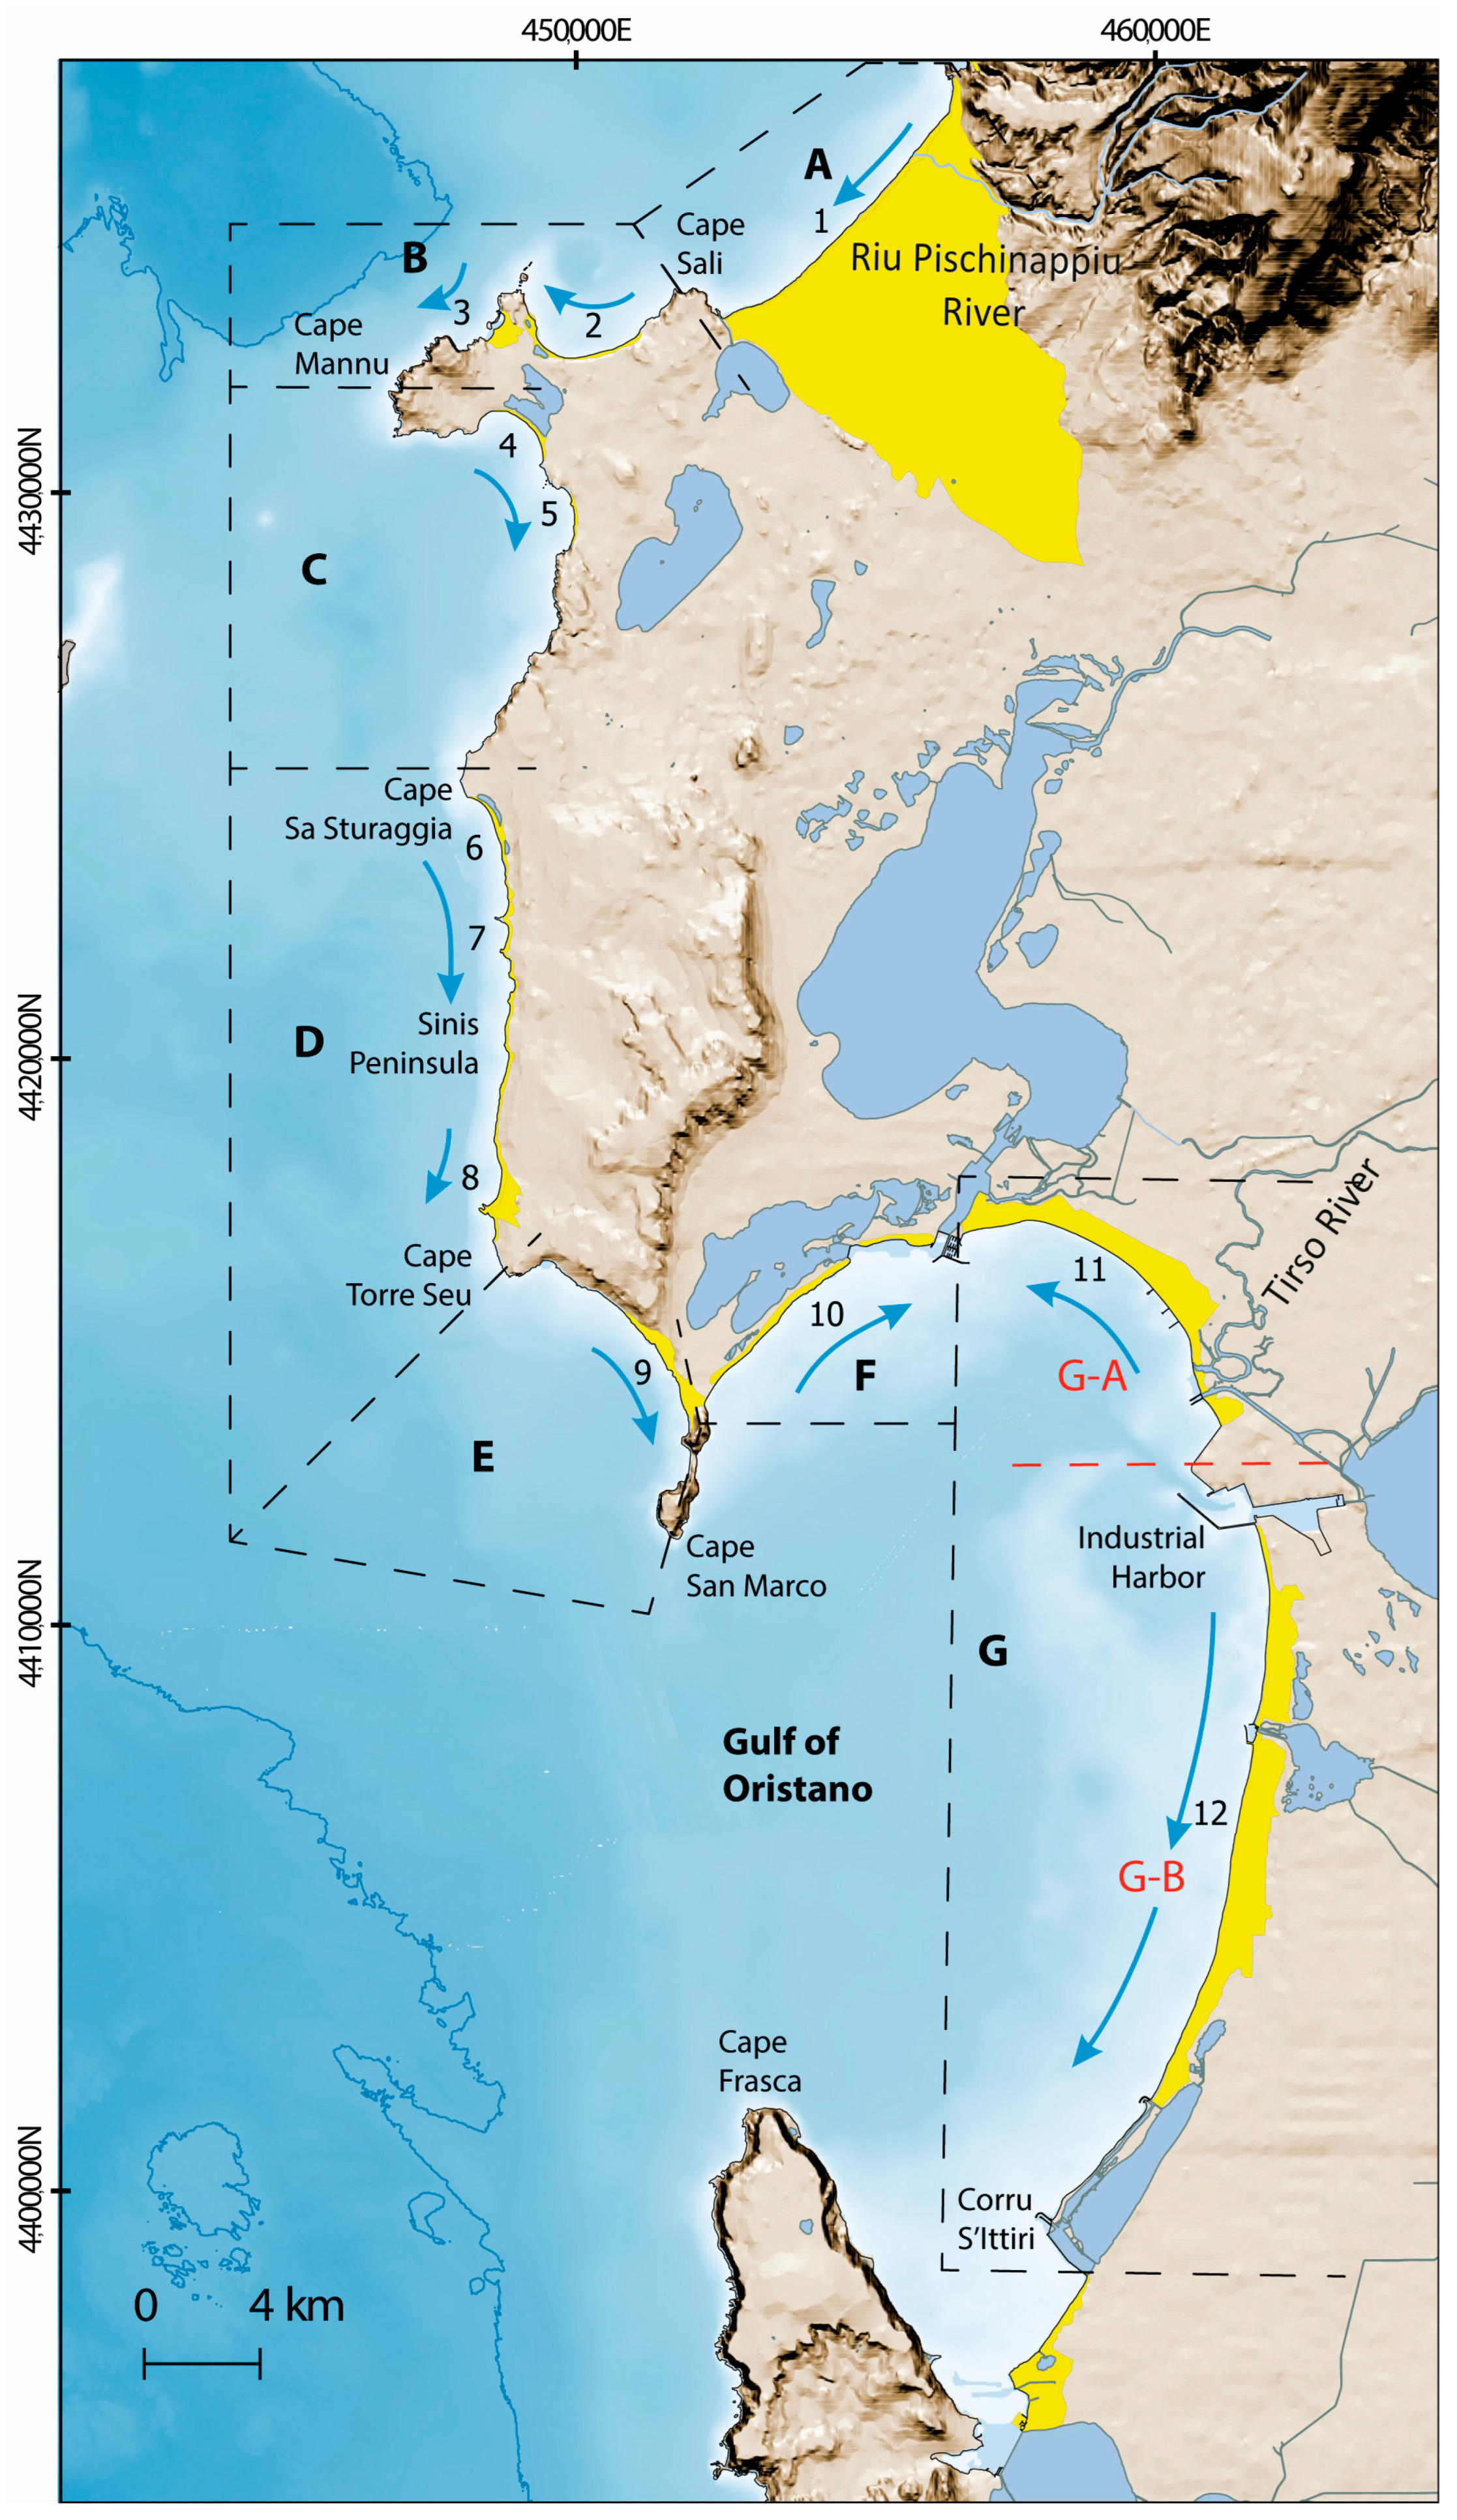
2. Study Area
3. Materials and Methods
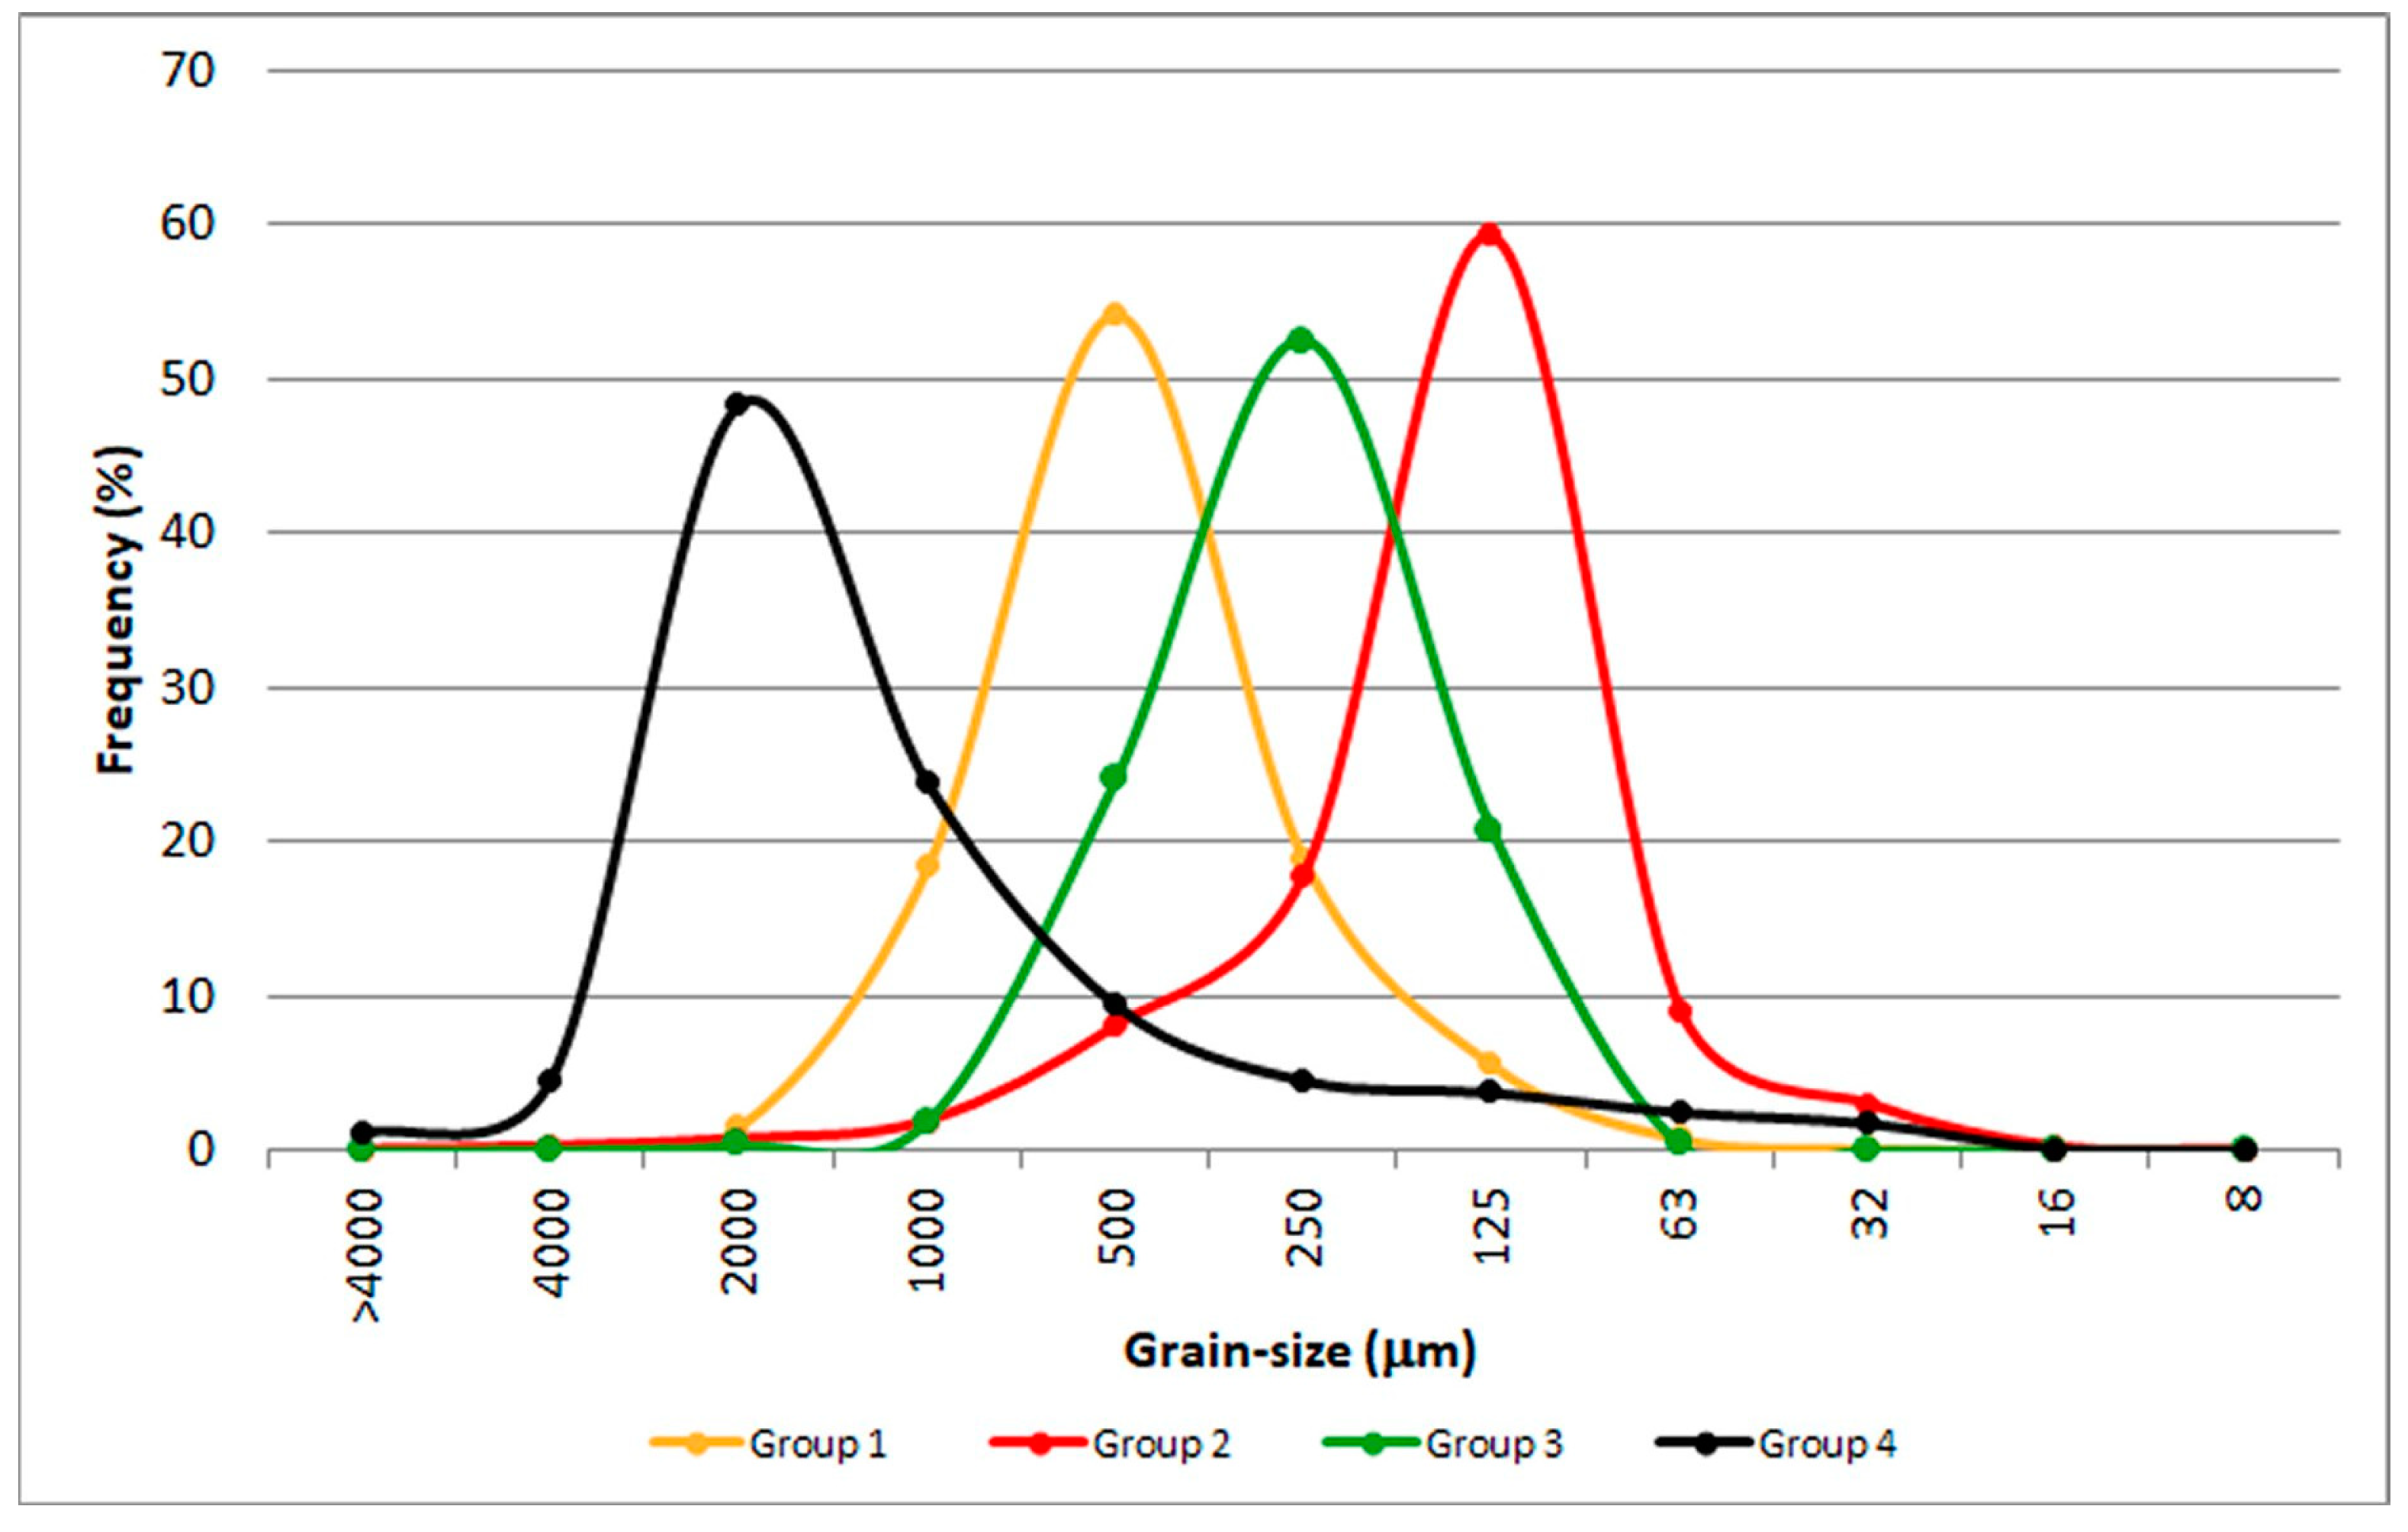
3.1. Sedimentological Data Set
3.2. Littoral Cells
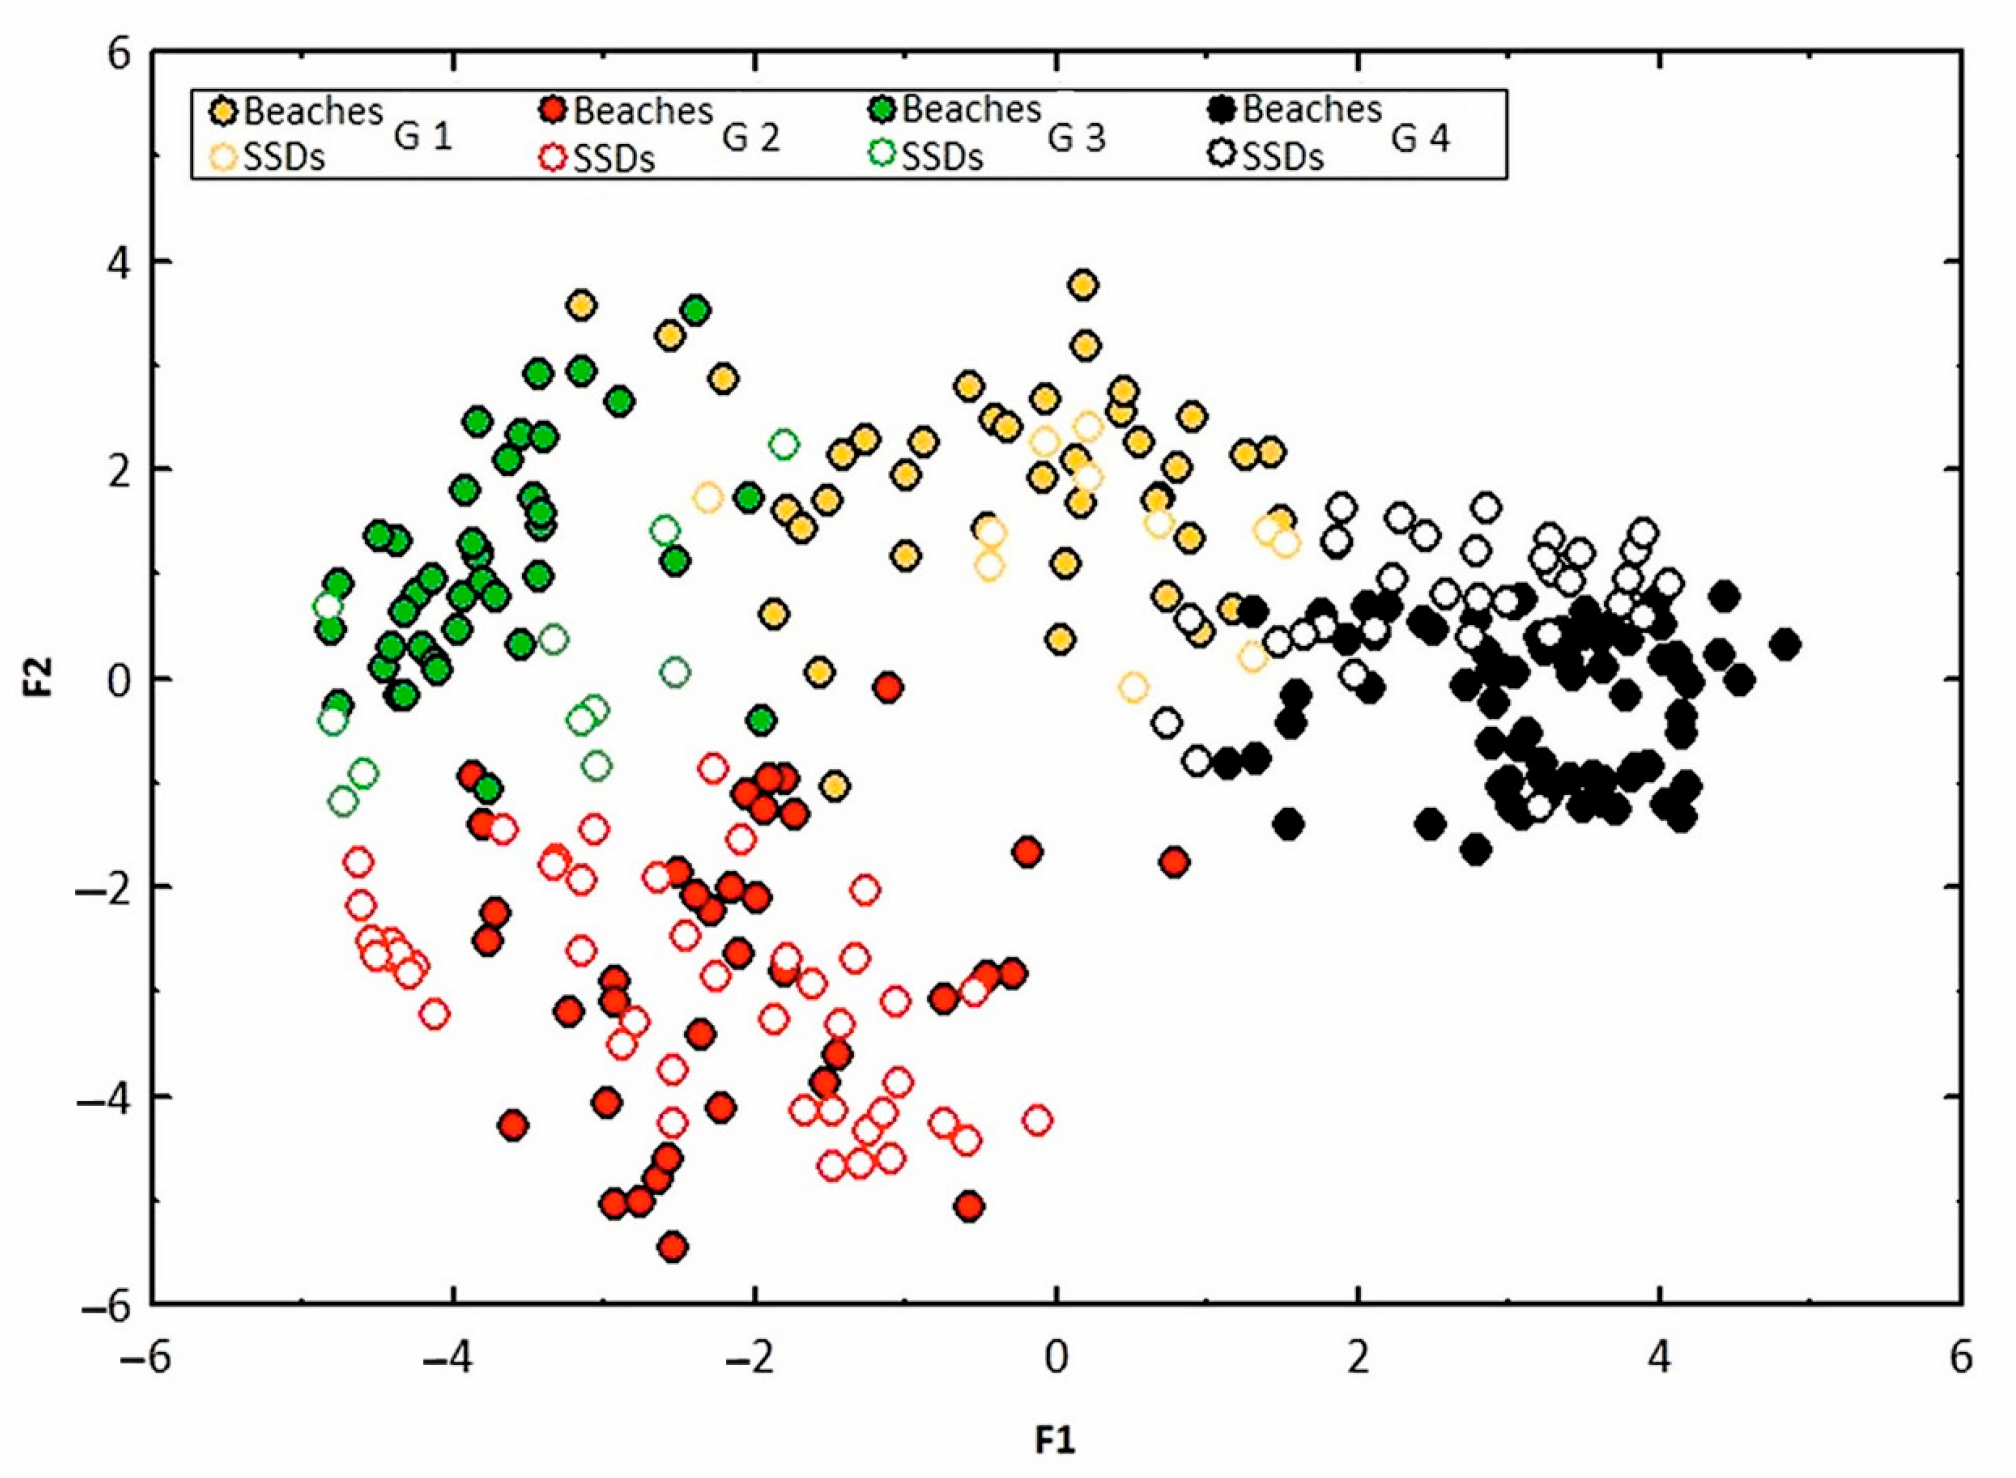
3.3. Multivariate Statistics
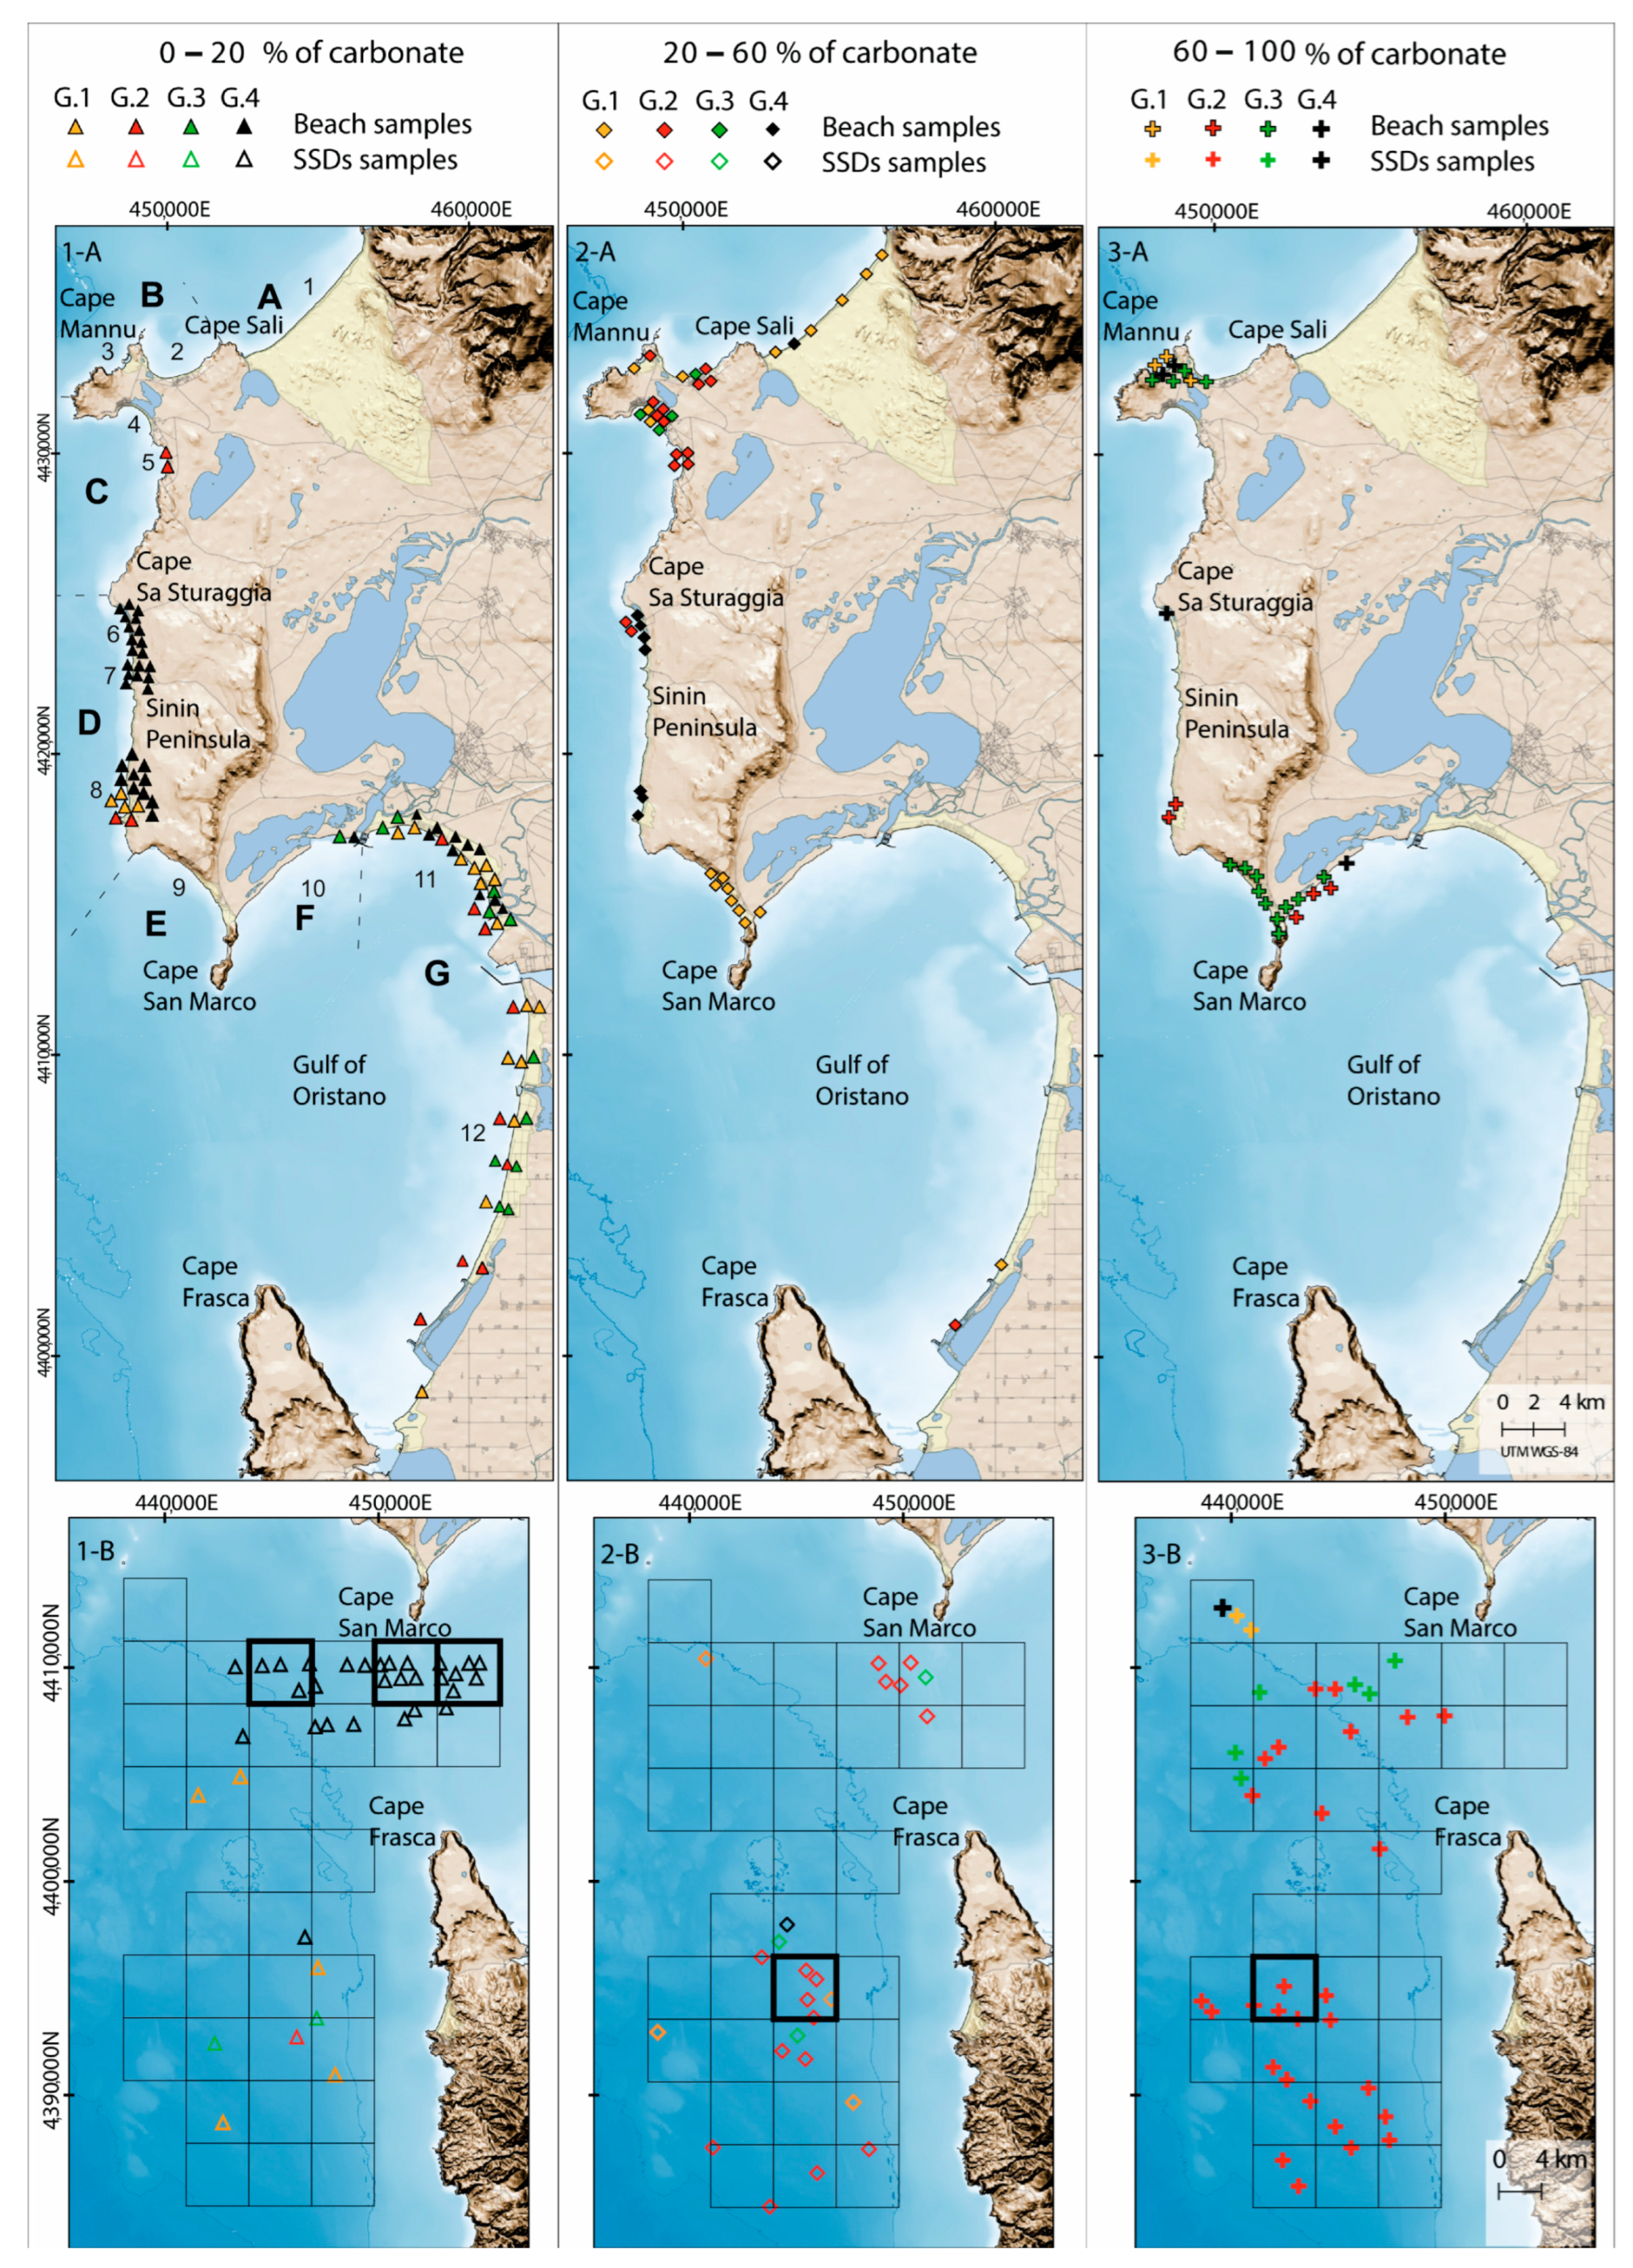
3.4. Assessment of the Availability of SSDs
4. Results
4.1. Beach Geomorphology and Littoral Cells
4.2. SSDs vs. Beach Sediments
5. Discussion
6. Conclusions
- A novel approach was presented to compare beach and SSDs sediments. The adopted method was based on multivariate statistics and applied to whole grain size spectra to assess the compatibility between the SSDs and the sediments of adjacent beaches. This methodology can be applied to sediments with a multimodal distribution, originating from the mixture of different populations. This new approach might be applied to other beaches mainly conditioned by geological control.
- The compatibility of sediments in terms of grain size and composition occurred for most of the studied beaches, 8 out of 12. Additionally, considering the sediment colour, only 2 out of 12 beaches showed chromatic compatibility with the SSDs.
- The source to sink process of SSDs and beach sediments are quite different, thus producing marked differences in sediment grain size and composition therefore, in chromatic appearance. This is due to the compartmentalization of sediments cells resulting in a high variability of beach sediment grain size and composition.
- Adaptation and retreat options of coastal infrastructures over protection interventions would be necessary to counteract coastal erosion when compatible sediments are not fully available.
Supplementary Materials
Author Contributions
Funding
Data Availability Statement
Acknowledgments
Conflicts of Interest
References
- Luijendijk, A.; Hagenaars, G.; Ranasinghe, R.; Baart, F.; Donchyts, G.; Aarninkhof, S. The State of the World’s Beaches. Sci. Rep. 2018, 8, 6641. [Google Scholar] [CrossRef] [PubMed]
- Neumann, B.; Vafeidis, A.T.; Zimmermann, J.; Nicholls, R.J. Future Coastal Population Growth and Exposure to Sea-Level Rise and Coastal Flooding—A Global Assessment. PLoS ONE 2015, 10, e0131375. [Google Scholar] [CrossRef] [PubMed] [Green Version]
- Monioudi, I.A.; Velegrakis, A.F.; Chatzipavlis, A.E.; Rigos, A.; Karambas, T.; Vousdoukas, M.I.; Hasiotis, T.; Koukourouvli, N.; Peduzzi, P.; Manoutsoglou, E.; et al. Assessment of island beach erosion due to sea level rise: The case of the Aegean archipelago (eastern Mediterranean). Nat. Hazards Earth Syst. Sci. 2017, 17, 449–466. [Google Scholar] [CrossRef] [Green Version]
- Mentaschi, L.; Vousdoukas, M.I.; Pekel, J.F.; Voukouvalas, E.; Feyen, L. Global long-term observations of coastal erosion and accretion. Sci. Rep. 2018, 8, 12876. [Google Scholar] [CrossRef] [PubMed] [Green Version]
- Hinkel, J.; Nicholls, R.J.; Tol, R.S.J.; Wang, Z.B.; Hamiltong, J.M.; Boot, G.; Vafeidis, A.T.; McFadden, L.; Ganopolski, A.; Klein, R.J.T. A global analysis of erosion of sandy beaches and sea-level rise: An application of DIVA. Glob. Planet. Chang. 2013, 111, 150–158. [Google Scholar] [CrossRef]
- Vousdoukas, M.I.; Ranasinghe, R.; Mentaschi, L.; Plomaritis, T.A.; Athanasiou, P.; Luijendijk, A.; Feyen, L. Sandy coastlines under threat of erosion. Nat. Clim. Chang. 2020, 10, 260–263. [Google Scholar] [CrossRef]
- Jiménez, J.A.; Valdemoro, H.I.; Bosom, E.; Sánchez-Arcilla, A.; Nicholls, R.J. Impacts of sea-level rise-induced erosion on the Catalan coast. Reg. Environ. Chang. 2017, 17, 593–603. [Google Scholar] [CrossRef] [Green Version]
- Lionello, P.; Cogo, S.; Galati, M.B.; Sanna, A. The Mediterranean surface wave climate inferred from future scenario simulations. Glob. Planet. Chang. 2008, 63, 152–162. [Google Scholar] [CrossRef]
- Conte, D.; Lionello, P. Characteristics of large positive and negative surges in the Mediterranean Sea and their attenuation in future climate scenarios. Glob. Planet. Chang. 2013, 111, 159–173. [Google Scholar] [CrossRef]
- Antonioli, F.M.; Anzidei, A.; Amorosi, V.; Lo Presti, G.; Mastronuzzi, G.; Deiana, G.; De Falco, G.; Fontana, A.; Fontolan, G.; Lisco, S.; et al. Sea-level rise and potential drowning of the Italian coastal plains: Flooding risk scenarios for 2100. Quat. Sci. Rev 2017, 158, 29–43. [Google Scholar] [CrossRef]
- Antonioli, F.; De Falco, G.; Lo Presti, V.; Moretti, L.; Scardino, G.; Anzidei, M.; Bonaldo, D.; Carniel, S.; Leoni, G.; Furlani, S.; et al. Relative sea-level rise and potential submersion risk for 2100 on 16 coastal plains of the Mediterranean sea. Water 2020, 12, 2173. [Google Scholar] [CrossRef]
- Vousdoukas, M.I.; Ranasinghe, R.; Mentaschi, L.; Plomaritis, T.A.; Athanasiou, P.; Luijendijk, A.; Feyen, L. Reply to: Sandy beaches can survive sea-level rise. Nat. Clim. Chang. 2020, 10, 996–997. [Google Scholar] [CrossRef]
- Cooper, J.A.G.; Pile, J. The adaptation-resistance spectrum: A classification of contemporary adaptation approaches to climate-related coastal change. Ocean. Coast. Manag. 2014, 94, 90–98. [Google Scholar] [CrossRef]
- Simeone, S.; Molinaroli, E.; Conforti, A.; De Falco, G. Impact of ocean acidification on the carbonate sediment budget of a temperate mixed beach. Clim. Chang. 2018, 150, 227–242. [Google Scholar] [CrossRef]
- Nicholls, R.J.; Cazenave, A. Sea-Level Rise and Its Impact on Coastal Zones. Science 2010, 328, 1517–1520. [Google Scholar] [CrossRef]
- Masselink, G.; Russel, P. Impacts of climate change on coastal erosion. Mar. Clim. Chang. Impacts Partnersh. Sci. Rev. MCCIP Sci. Rev. 2013, 2013, 71–86. [Google Scholar] [CrossRef]
- Jiménez, J.A.; Gracia, V.; Valdemoro, H.I.; Mendoza, E.T.; Sánchez-Arcilla, A. Managing erosion induced problems in NW Mediterranean urban beaches. Ocean Coast. Manag. 2011, 54, 907–918. [Google Scholar] [CrossRef]
- Marchand, M.; Sanchez-Arcilla, A.; Ferreira, M.; Gault, J.; Jiménez, J.A.; Markovic, M.; Mulder, J.; van Rijn, L.; Stanic, A.; Sulisz, W.; et al. Concepts and science forcoastal erosion management an introduction to the CONSCIENCE framework. Ocean Coast. Manag. 2011, 54, 859–866. [Google Scholar] [CrossRef]
- Correggiari, A.; Remia, A.; Foglini, F.; Grande, V.; Nicoletti, L.; Perini, L.; Piazza, R.; Bertaggia, R. Research and exploitation of shelf marine sand deposit for coastal nourishment: Geodatabase guidelines from northern Adriatic Shelf experience, SHAPE—Shaping an Holistic Approach to Protect the Adriatic Environment between coast and sea. IPA Project, In Proceeding of Final Meeting of IPA project, Lignano, Italy, 16–17 October 2013. [Google Scholar]
- Correggiari, A.; Perini, L.; Remia, A.; Luciani, P.; Foglini, F.; Grande, V.; Moscon, G.; Calabrese, L.; Lorito, S. Sistema Informativo per L’utilizzo Della Risorsa Sabbia Offshore nei Progetti di Protezione Costiera: Geodatabase in_Sand. Servizio Geologico Sismico e dei Suoli, Regione Emilia Romagna. Technical Report 2016. Available online: https://ambiente.regione.emilia-romagna.it/it/geologia/temi/costa/pdf/in_sand_web.pdf (accessed on 11 April 2019).
- Trobec, A.; Busetti, M.; Zgur, F.; Baradello, L.; Babich, A.; Cova, A.; Gordini, E.; Romeo, R.; Tomini, I.; Poglajen, S.; et al. Thickness of marine Holocene sediment in the Gulf of Trieste (northern Adriatic Sea). Earth Syst. Sci. Data 2018, 10, 1077–1092. [Google Scholar] [CrossRef] [Green Version]
- Brambilla, W.; Conforti, A.; Simeone, S.; Carrara, P.; Lanucara, S.; De Falco, G. Data set of submerged sand deposits organised in an interoperable spatial data infrastructure (Western Sardinia). Earth Syst. Sci. Data 2019, 11, 515–527. [Google Scholar] [CrossRef]
- De Falco, G.; Molinaroli, E.; Baroli, M.; Bellacicco, S. Grain size and compositional trends of sediments from Posidonia oceanica meadows to beach shore, Sardinia, Western Mediterranean. Est. Coast. Shelf Sci. 2003, 58, 299–309. [Google Scholar] [CrossRef]
- Tecchiato, S.; Collins, L.; Stevens, A.; Soldati, M.; Pevzner, R. Carbonate sediment dynamics and compartmentalisation of a highly modified coast: Geraldton, Western Australia. Geomorphology 2016, 254, 57–72. [Google Scholar] [CrossRef]
- De Muro, S.; Pusceddu, N.; Buosi, C.; Ibba, A. Morphodynamic of a Mediterranean microtidal wave-dominated beach: Forms, processes and insights for coastal management. J. Maps 2017, 13, 26–36. [Google Scholar] [CrossRef] [Green Version]
- Jackson, D.W.T.; Cooper, J.A.G. Geological Control on Beach Form: Accommodation Space and Contemporary Dynamics. J. Coast. Res. 2009, I, 69–72. [Google Scholar]
- Marini, A.; Murru, M. Rilevamento geologico della penisola del Sinis (Sardegna centro-occidentale). Rend. Sem. Fac. Sc. Univ. Cagliari. 1977, 43, 459–466. [Google Scholar]
- De Falco, G.; Carannante, A.; Del Vais, C.; Gasperini, L.; Pascucci, V.; Sanna, I.; Simeone, S.; Conforti, A. Evolution of a single incised valley related to inherited geology, sea level rise and climate changes during the Holocene (Tirso river, Sardinia, western Mediterranean Sea). Mar. Geol. 2022, 451, 106885. [Google Scholar] [CrossRef]
- De Falco, G.; Baroli, M.; Cucco, A.; Simeone, S. Intrabasinal conditions promoting the development of a biogenic carbonate sedimentary facies associated with the seagrass Posidonia oceanica. Cont. Shelf Res. 2008, 28, 797–812. [Google Scholar] [CrossRef]
- De Falco, G.; Tonielli, R.; Di Martino, G.; Innangi, S.; Simeone, S.; Parnum, I.M. Relationships between multibeam backscatter, sediment grain size, and Posidonia oceanica seagrass distribution. Cont. Shelf Res. 2010, 30, 1941–1950. [Google Scholar] [CrossRef]
- De Falco, G.; Boudillon, F.; Conforti, A.; Di Bitetto, M.; Di Martino, G.; Innangi, S.; Simeone, S.; Tonielli, R. Sorted bedforms over trangressive deposits along the continental shelf of western Sardina (Mediterranean Sea). Mar. Geol. 2015, 359, 75–88. [Google Scholar] [CrossRef]
- De Falco, G.; Antonioli, A.; Fontolan, G.; Lo Presti, V.; Simeone, S.; Tonielli, R. Early cementation and accommodation space dictate the evolution of an overstepping barrier system during the Holocene. Mar. Geol. 2015, 369, 52–66. [Google Scholar] [CrossRef]
- De Falco, G.; Molinaroli, E.; Conforti, A.; Simeone, S.; Tonielli, R. Biogenic Sediments from Coastal Ecosystems to Beach-Dune Systems: Implications for the Adaptation of Mixed and Carbonate Beaches to Future Sea Level Rise. Biogeosciences 2017, 14, 3191–3205. [Google Scholar] [CrossRef] [Green Version]
- Carboni, S.; Lecca, L.; Ferrara, C. La discordanza versiliana sulla piattaforma occidentale della Sardegna. Boll. Soc. Geol. Ital. 1989, 108, 503–519. [Google Scholar]
- Simeone, S.; Palombo, L.; De Falco, G. Morphodynamics of a Nontidal Embayed Beach: The Case Study of Is Arutas (Western Mediterranean). Coast. Res. 2013, 291, 63–71. [Google Scholar] [CrossRef]
- Marsico, A.; Lisco, S.; Lo Presti, V.; Antonioli, F.; Amorosi, A.; Anzidei, M.; Deiana, G.; De Falco, G.; Fontana, A.; Fontolan, G.; et al. Flooding scenario for four Italian coastal plains using three relative sea level rise models. J. Maps 2017, 13, 961–967. [Google Scholar] [CrossRef] [Green Version]
- Pranzini, E. Protection Projects at Poetto and Cala Gonone Beaches (Sardinia, Italy). In Beach Management, Principle and Practices; Williams, A., Micallef, A., Eds.; Routledge: London, UK, 2009. [Google Scholar]
- Simeone, S.; Palombo, L.; Molinaroli, E.; Brambilla, W.; Conforti, A.; De Falco, G. Shoreline response to wave forcing and sea level rise along a geomorphological complex coastline (western Sardinia, Mediterranean Sea). Appl. Sci. 2021, 11, 4009. [Google Scholar] [CrossRef]
- Simeone, S.; Palombo, A.G.L.; Antognarelli, F.; Brambilla, W.; Conforti, A.; De Falco, G. Sediment budget implications from Posidonia oceanica banquette removal in a starved beach system. Water 2022, 14, 2411. [Google Scholar] [CrossRef]
- Simeone, S.; De Falco, G. Morphology and composition of beach-cast Posidonia oceanica litter on beaches with different exposures. Geomorphology 2012, 151, 224–233. [Google Scholar] [CrossRef]
- Pascucci, V.; De Falco, G.; Del Vais, C.; Sanna, I.; Melis, R.T.; Andreucci, S. Climate changes and human impact on the Mistras coastal barrier system (W Sardinia, Italy). Mar. Geol. 2018, 395, 271–284. [Google Scholar] [CrossRef]
- Molinaroli, E.; Guerzoni, S.; De Falco, G.; Sarretta, A.; Cucco, A.; Como, S.; Simeone, S.; Perilli, A.; Magni, P. Relationships between hydrodynamic parameters and grain size in two contrasting transitional environments: The Lagoons of Venice and Cabras, Italy. Sed. Geol. 2009, 219, 196–207. [Google Scholar] [CrossRef] [Green Version]
- Blott, S.J.; Pye, K. GRADISTAT: A grain size distribution and statistics package for the analysis of unconsolidated sediments. Earth Surf. Process. Landf. 2001, 26, 1237–1248. [Google Scholar] [CrossRef]
- Ewing, L. Shoreline Protection and Beach Nourishment Projects. Procedural Guidance Document: Monitoring. California Coastal Commission. 1997. Available online: http://www.coastal.ca.gov/pdg/pdg-mon-html (accessed on 1 December 2022).
- ASTM D1535; Standard Test Method for Specifying Color by the Munsell System. Available online: http://www.astm.org (accessed on 1 December 2022).
- Pranzini, E.; Vitale, G. Beach Sand Colour: The Need for a Standardised Assessment Procedure. J. Coast. Res. 2011, 61, 66–69. [Google Scholar] [CrossRef]
- Pranzini, E.; Anfuso, G.; Botero, C.M.; Cabrera, A.; Campos, Y.A.; Martinez, G.C.; Williams, A.T. Sand colour at Cuba and its influence on beach nourishment and management. Ocean Coast. Manag. 2016, 126, 51–60. [Google Scholar] [CrossRef]
- Inman, D.L. Littoral Cells. In Encycopledia of Coastal Science; Schwartz, M.L., Ed.; Earth and Science Series; Springer: Dordrecht, The Netherlands, 2018. [Google Scholar] [CrossRef]
- Bray, M.J.; Carter, D.J.; Hooke, J.M. Littoral cell definition and budgets for central Southern England. J. Coast. Res. 1995, 11, 381–400. [Google Scholar]
- Anfuso, G.; Pranzini, E.; Vitale, G. An integrated approach to coastal erosion problems in northern Tuscany (Italy): Littoral morphological evolution and cell distribution. Geomorphology 2011, 129, 204–214. [Google Scholar] [CrossRef]
- Atzeni, A. Effetti idrodinamici sulle spiagge della costa occidentale della Sardegna. Studi Costieri 2003, 7, 61–80. [Google Scholar]
- Sulis, S.; Annis, A. Morphological response of a sandy shoreline to a natural obstacle at Sa Mesa Longa Beach, Italy. Coast. Eng. 2014, 84, 10–22. [Google Scholar] [CrossRef]
- Tigny, V.; Ozer, A.; De Falco, G.; Baroli, M.; Djenidi, S. Relationship between the Evolution of the Shoreline and the Posidonia oceanica Meadow Limit in a Sardinian Coastal Zone. J. Coast. Res. 2007, 23, 787–793. [Google Scholar] [CrossRef]
- Simeone, S.; De Falco, G.; Quattrocchi, G.; Cucco, A. Morphological changes of a Mediterranean beach over one year (San Giovanni Sinis, western Mediterranean). J. Coast. Res. 2014, 70, 217–222. [Google Scholar] [CrossRef]
- Woolfe, K.J.; Michibayashi, K. Basic entropy grouping of laser-derived grain size data: An example from the Great Barrier Reef. Comput. Geosci. 1995, 21, 447–462. [Google Scholar] [CrossRef]
- Stewart, L.K.; Kostylev, V.E.; Orpin, A.R. Windowsbased software for optimising entropy-based groupings of textural data. Comput. Geosci. 2009, 35, 1552–1556. [Google Scholar]
- Molinaroli, E.; Sarretta, A.; Ferrarin, C.; Masiero, E.; Specchiulli, A.; Guerzoni, S. Sediment grain size and hydrodynamics in Mediterranean coastal lagoons: Integrated classification of abiotic parameters. J. Earth Syst. Sci. 2014, 123, 1097–1114. [Google Scholar] [CrossRef] [Green Version]
- Guerzoni, S.; Portaro, R.; Trincardi, F.; Molinaroli, E.; Langone, L.; Correggiari, A.; Vigliotti, L.; Pistolato, M.; De Falco, G.; Boccini, V. Statistical analyses of grain-size, geochemical and mineralogical data in core CM92-43, Central Adriatic basin. In Palaeoenvironmental Analysis of Italian Crater Lake and Adriatic Sediments; Guilizzoni, P., Oldfield, F., Eds.; Memorie dell’Istituto Italiano di Idrobiologia: Pallanza, Italy, 1996; Volume 55, pp. 231–245. [Google Scholar]
- Linham, M.M.; Nicholls, R. Adaptation technologies for coastal erosion and flooding: A review. Environ. Sci. 2012, 165, 95–112. [Google Scholar] [CrossRef]
- Pranzini, E.; Cinelli, I.; Cipriani, L.E.; Anfuso, G. An Integrated Coastal Sediment Management Plan: The Example of the Tuscany Region (Italy). J. Mar. Sci. Eng. 2020, 8, 33. [Google Scholar] [CrossRef] [Green Version]
- Pranzini, E.; Anfuso, G.; Muňoz-Perez, J.J. A probabilistic approach to borrow sediment selection in beach nourishment projects. Coast. Eng. 2018, 139, 32–35. [Google Scholar] [CrossRef]
- USACE. Coastal Engineering Manual. 2002. V-4-24 EM 1110-2-1100. Available online: http://www.publications.usace.army.mil/USACE-Publications/Engineer-Manuals/ (accessed on 1 March 2021).
- Pranzini, E.; Simonetti, D.; Vitale, G. Sand colour rating and chromatic compatibilities. J. Coast. Res. 2010, 265, 798–808. [Google Scholar] [CrossRef]
- Tsujimoto, G.; Tamai, M. Analysis of beach sand colour and its application to sedimentation. In Proceedings of the 7th International Conference on Asian and Pacific Coasts (APAC 2013), Bali, Indonesia, 24–26 September 2013; pp. 141–146. [Google Scholar]
- Wiegel, R.L. Waimea River mouth to Kekaha beach, Kauai, Hawaii: Two distinctive natural sands. Shore Beach 2006, 74, 25–32. [Google Scholar]
- Kasper-Zubillaga, J.J.; Ortiz-Zamora, G.; Dickinson, W.W.; Urrutia-Fucugauchi, J.; Soler-Arechalde, A.M. Textural and compositional controls on modern beach and dune sands, New Zealand. Earth Surf. Process. Landf. 2007, 32, 366–389. [Google Scholar] [CrossRef]
- Calhoun, R.S.; Field, M.E. Sand composition and transport history on a fringing coral reef, Molokai, Hawaii. J. Coast. Res. 2008, 24, 1151–1160. [Google Scholar] [CrossRef]
- Short, A.D.; Woodroffe, C.D. The Coast of Australia; Cambridge University Press: New York, NY, USA, 2009; p. 288. [Google Scholar]
- Carey, M.; Haig, D.; Hegge, B. Origin of the grey carbonate sands on the beaches of Owen Anchorage, Western Australia. In Proceedings of the 19th Australasian Coastal and Ocean Engineering Conference and the 12th Australasian Port and Harbour Conference, Wellington, New Zealand, 16–18 September 2009; pp. 83–89. [Google Scholar]
- Gomez-Pujol, L.; Roig-Munar, F.X.; Fornos, J.J.; Balaguer, P.; Mateu, J. Provenance-related characteristics of beach sediments around the island of Menorca, Balearic Islands (western Mediterranean). Geo-Mar. Lett. 2013, 33, 195–208. [Google Scholar] [CrossRef]
- Williams, A.T.; Morgan, R. Beach awards and rating systems. Shore Beach 1995, 63, 29–33. [Google Scholar]
- Serrano, O.; Mateo, M.A.; REnom, P.; Julià, R. Characterization of soils beneath a Posidonia oceanica meadow. Geoderma 2012, 185, 26–36. [Google Scholar] [CrossRef]
- Vacchi, M.; De Falco, G.; Simeone, S.; Montefalcone, M.; Morri, C.; Ferrari, M.; Bianchi, C.N. Biogeomorphology of the Mediterranean Posidonia oceanica seagrass meadows. Earth Surf. Process. Landf. 2016, 42, 42–54. [Google Scholar] [CrossRef] [Green Version]
- Forti, S.; Orru, P. Geomorfologia costiera e sottomarina della Penisola del Sinis (Sardegna Occidentale). Boll. Della Soc. Geol. Ital. 1995, 114, 3–21. [Google Scholar]
- De Falco, G.; Conforti, A.; Brambilla, W.; Boudillon, F.; Ceccherelli, G.; De Luca, M.; Di Martino, G.; Guala, I.; Innangi, S.; Pascucci, V.; et al. Coralligenous banks along western and northern continental shelf of Sardinia Island (Mediterranean Sea). J. Maps 2022, in press. [Google Scholar] [CrossRef]
- Piazzi, L.; De Falco, G.; De Luca, M.; Guala, I.; Borras Palomard, A.; Conforti, A.; Pascucci, V.; Simeone, S.; Ceccherelli, G. Coralligenous assemblages of continental shelf: Multiple spatial scale variability in the western Sardinia. Cont. Shelf Res. 2022, 245, 104790. [Google Scholar] [CrossRef]
- Martorelli, E.; Chiocchi, L. Overview of the variability of Late Quaternary continental shelf deposits of the Italian peninsula. Geol. Soc. Lond. Mem. 2014, 41, 171. [Google Scholar] [CrossRef]


| Sediments | Sediment Source | |||||||||||||
|---|---|---|---|---|---|---|---|---|---|---|---|---|---|---|
| Cell | Sub-Cell | Beach Name | Morphology | Textural Description | % Carbonate | D50 µm | % Gravel | % Sand | ||||||
| A | 1 | Is Arenas | Beach–dune | Gravelly Sand/Slightly Gravelly Sand | Mean SD | 47 | 4 | 833 | 380 | 11% | 12% | 89% | 12% | Riverine and transgressive relict sediments; ecosystem carbonate-producers |
| Min–Max | 42 | 51 | 441 | 1514 | 3% | 28% | 72% | 97% | ||||||
| B | 2 | Sa Rocca Tunda | Embayed | Sand | Mean SD | 57 | 13 | 421 | 334 | 0% | 0% | 100% | 0% | Ecosystem carbonate-producers; cliff erosion |
| Min–Max | 34 | 72 | 177 | 1140 | 0% | 0% | 100% | 100% | ||||||
| 3 | Sa Mesa Longa | Beach–dune | Slightly Gravelly Sand/Sandy Gravel | Mean SD | 65 | 5 | 658 | 624 | 9% | 18% | 91% | 18% | ||
| Min–Max | 55 | 76 | 220 | 2449 | 0% | 63% | 37% | 100% | ||||||
| C | 4 | Putzu Idu | Barrier–lagoon | Slightly Gravelly Sand | Mean SD | 32 | 4 | 371 | 167 | 1% | 1% | 99% | 1% | Relict sediment; cliff erosion; ecosystem carbonate-producers |
| Min–Max | 27 | 40 | 182 | 597 | 0% | 5% | 95% | 100% | ||||||
| 5 | S’Arena Scoada | Embayed | Slightly Gravelly Sand | Mean SD | 25 | 14 | 185 | 7 | 1% | 1% | 99% | 1% | ||
| Min–Max | 2 | 43 | 178 | 195 | 0% | 3% | 97% | 100% | ||||||
| D | 6 | Mari Ermi | Barrier–lagoon | Gravel/Muddy Sandy Gravel | Mean SD | 15 | 23 | 2289 | 1093 | 66% | 26% | 26% | 17% | Transgressive relict sediments; ecosystem carbonate-producers [23,38,39] |
| Min–Max | 0 | 76 | 81 | 4986 | 0% | 100% | 0% | 61% | ||||||
| 7 | Is Arutas | Embayed | Gravel/Sandy Gravel | Mean SD | 0 | 2682 | 263 | 83% | 13% | 17% | 13% | |||
| Min–Max | 2094 | 3140 | 54% | 100% | 0% | 46% | ||||||||
| 8 | Maimoni | Beach–dune/barrier | Gravel/Sandy Gravel/Gravelly Sand/Slightly Gravelly Sand | Mean SD | 9 | 21 | 1417 | 958 | 35% | 35% | 63% | 34% | ||
| Min–Max | 0 | 70 | 224 | 3063 | 0% | 100% | 0% | 96% | ||||||
| E | 9 | San Giovanni | Beach–dune | Slightly Gravelly Sand/Sand | Mean SD | 62 | 22 | 506 | 219 | 1% | 3% | 99% | 3% | Ecosystem carbonate-producers; transgressive relict sediments; [14,33] |
| Min–Max | 22 | 100 | 285 | 1069 | 0% | 16% | 84% | 100% | ||||||
| F | 10 | Mistras | Barrier–lagoon | Slightly Gravelly Sand | Mean SD | 56 | 24 | 553 | 451 | 7% | 13% | 91% | 13% | Ecosystem carbonate-producers; riverine sediments; [40,41] |
| Min–Max | 15 | 74 | 117 | 1331 | 0% | 33% | 67% | 100% | ||||||
| G | 11 | Torregrande | Beach–dune | Sandy Gravel/Gravelly Sand/Slightly Gravelly Sand/ | Mean SD | 0 | 996 | 563 | 0.10 | 0.17 | 0.90 | 0.17 | Riverine sediments [28] | |
| Min–Max | 209 | 2327 | 0% | 62% | 38% | 100% | ||||||||
| 12 | Arborea | Beach–dune | Slightly Gravelly Sand/Sand | Mean SD | 6 | 6 | 381 | 196 | 1% | 2% | 99% | 2% | Riverine and transgressive relict sediments [29] | |
| Min–Max | 1 | 24 | 159 | 812 | 0% | 7% | 93% | 100% | ||||||
| Cell | Sub-Cell | Munsell Colour Description | Munsell Colour Code |
|---|---|---|---|
| A | 1 | Light Yellowish/Pale Brown | 10YR6/4–10YR6/3 |
| B | 2 | Light Grey/Pink | 10YR7/2–7.5YR7/3 |
| 3 | Pink | 7.5YR7/4 | |
| C | 4 | White/Light Grey | 10YR8/1–10YR7/1 |
| 5 | Light Grey/White | 10YR7/1–10YR8/1 | |
| D | 6 | Pinkish Grey/White | 7.5YR7/2–7.5YR8/1 |
| 7 | Pinkish White/White | 7.5YR8/2–5YR8/1 | |
| 8 | Pinkish Grey/White | 7.5YR7/1–7.5YR8/1 | |
| E | 9 | Pale Brown/Light Brownish Grey | 10YR6/3–10YR6/2 |
| F | 10 | Light Brownish Grey/Pale Brown | 10YR6/2–10YR6/3 |
| G | 11 | Ligth Grey/Pale Brown | 10YR7/2–10YR6/3 |
| 12 | Grey/Ligth Grey | 10YR6/1–10YR7/2 | |
| SSDs Groups | |||
| G1 | Reddish Yellow/Very Pale Brown | 7.5YR6/6–10YR7/4 | |
| G2 | Light Grey/Very Pale Brown | 10YR7/2–10YR7/3–10YR6/2 | |
| G3 | Very Pale/Ligth Brown | 10YR7/4–10YR7/3–10YR6/3 | |
| G4 | Reddish Yellow/Ligth Brown | 7.5YR6/6–7.5YR6/4–10YR6/4 | |
| Group | 4000 mm | 2000 mm | 500 mm | 250 mm | 125 mm | 63 mm |
|---|---|---|---|---|---|---|
| 1 | 3 | 5 | 44 | 20 | 6 | 1 |
| 2 | 0 | 1 | 6 | 18 | 54 | 18 |
| 3 | 0 | 0 | 20 | 50 | 28 | 1 |
| 4 | 6 | 31 | 15 | 10 | 8 | 2 |
| Cell | Sub-Cell | Grain Size /Composition | Colour |
|---|---|---|---|
| A | 1 | No | No |
| B | 2 | Yes | No |
| 3 | No | No | |
| C | 4 | Yes | No |
| 5 | Yes | No | |
| D | 6 | Yes | No |
| 7 | Yes | No | |
| 8 | Yes | No | |
| E | 9 | No | No |
| F | 10 | Yes | Yes |
| G | 11 | Yes | Yes |
| 12 | No | No |
Publisher’s Note: MDPI stays neutral with regard to jurisdictional claims in published maps and institutional affiliations. |
© 2022 by the authors. Licensee MDPI, Basel, Switzerland. This article is an open access article distributed under the terms and conditions of the Creative Commons Attribution (CC BY) license (https://creativecommons.org/licenses/by/4.0/).
Share and Cite
De Falco, G.; Simeone, S.; Conforti, A.; Brambilla, W.; Molinaroli, E. Compatibility between Continental Shelf Deposits and Sediments of Adjacent Beaches along Western Sardinia (Mediterranean Sea). Water 2022, 14, 3971. https://doi.org/10.3390/w14233971
De Falco G, Simeone S, Conforti A, Brambilla W, Molinaroli E. Compatibility between Continental Shelf Deposits and Sediments of Adjacent Beaches along Western Sardinia (Mediterranean Sea). Water. 2022; 14(23):3971. https://doi.org/10.3390/w14233971
Chicago/Turabian StyleDe Falco, Giovanni, Simone Simeone, Alessandro Conforti, Walter Brambilla, and Emanuela Molinaroli. 2022. "Compatibility between Continental Shelf Deposits and Sediments of Adjacent Beaches along Western Sardinia (Mediterranean Sea)" Water 14, no. 23: 3971. https://doi.org/10.3390/w14233971