1. Introduction
1.1. Context and Motivation
To ensure a reliable supply of drinking water in the future, several drinking water utilities in the Netherlands and Belgium are currently reviewing the structure of their drinking water distribution networks (WDNs). The results of these reevaluations are masterplans and rehabilitation schemes. In the Netherlands and Belgium, a masterplan is defined as an ideal redesign of the current WDN, based on company-specific objectives and constraints as well as the currently existing infrastructure. These masterplans are used by water companies as a reference when rehabilitating their networks and replacing pipes [
1].
Currently, utilities design these masterplans manually, using geographical information systems and hydraulic models. This is a time-consuming and complex process: modelers spend months, if not years, designing these masterplans for their supply areas, using their experience, domain knowledge and trial and error. The resulting designs are feasible but may be far from optimal. Moreover, masterplans may need to be redesigned on a regular basis (approx. every 5 years) to respond to developments in the supply areas, changes in utility objectives, and new prognoses for the future. This means that the manual approach may be prohibitively laborious.
Numerical optimization may be a suitable approach to support the design process. These techniques make it possible to systematically (but efficiently) search through the enormous solution space, compare various designs and converge to an optimized design. Numerical optimization of drinking water distribution networks is a well-studied challenge in academia [
2]. These techniques are gradually finding their way into the practical world of drinking water utilities as well. This approach offers utilities:
Time savings, thanks to partial automation of the design process;
A more explicit understanding of the hydraulic performance of the current water distribution network (e.g., minimum pressure, velocity in pipes, resilience, continuity and security of supply) under different scenarios (e.g., changes in water demand and pipe breaks);
Greater confidence in design choices, thanks to the ability to thoroughly explore the various trade-offs and thanks to the possibility of reproducing the design choice in the future in an objective way;
More efficient investments, thanks to the optimization of cost vs. performance within the design.
For application in practice, it is most important to keep the problem definition flexible while working together on its formulation with a panel of water utility experts. This is because for every real life WDN design problem, the design goals and performance indicators tend to be uniquely specific to the network owners and the network characteristics (where one utility aims to use the design to solve local pressure issues within 10 years, for instance, another may seek to optimize residence times with a complete redesign of the network, leading to very different optimization problems). Network owners heed the solutions provided by optimization techniques only when the underlying approach and performance criteria match these specific goals and criteria.
1.2. Simultaneous Layout and Pipe-Sizing Optimization in the Scientific Literature
Some of the first academic papers about optimization of WDNs date back to more than 40 years ago [
3]. In terms of optimization algorithms, initially, the researchers were applying deterministic mathematical methods such as linear [
3], nonlinear [
4] and mixed integer nonlinear programming [
5]. However, since the 1990s, stochastic methods based on biological evolution and natural genetics have taken primacy because of their ability to solve complex real-world problems and to include multiple objectives [
6]. Thus, according to [
2], which reviewed a set of 124 scientific papers from the field, 84% used stochastic, while 9% used deterministic and only 7% used hybrid methods. In the same study, besides the classification of the reviewed papers based on optimization model, solution methodology and test network, the authors also suggested classification based on application area. Therefore, one can distinguish the following four application areas:
New network design—determining optimal pipe sizes to minimize the project cost;
Strengthening/paralleling of an existing network—determining optimal pipe sizes to reinforce an existing network to meet future demands through lying duplicated pipes in parallel with existing pipes, with objective to minimize the project cost;
Rehabilitation of an existing network—determining optimal rehabilitation alternative between replacement of pipes with the same or larger diameters, cleaning or cleaning and lining existing pipes, with the objective to minimize the project cost;
Expansion of an existing network—developing or expanding the existing network beyond its current boundaries.
A research problem from the field of the optimization of WDNs that has rarely been addressed, even in the academic literature, is simultaneous layout/topology and pipe-sizing optimization (SLaPSO). Confirmation of this statement is the fact that all 124 papers reviewed by [
5] considered only pre-specified network layouts. A conventional new network design problem with pre-specified layout can simply be transformed to a SLaPSO problem by relaxing the set of permissible pipe diameters to include zero pipe diameter, that is, no pipe option [
7]. However, this seemingly small change in the problem formulation can induce many topologically infeasible layouts (layouts with disconnect nodes and pipes), thus creating a fitness landscape with very few feasible spikes, which may cause convergence at suboptimal solutions [
8]. In addition, it has been proven in the literature that performing SLaPSO with the objective to minimize cost in absence of any reliability constraint leads to a fully branched network [
9], which is unsuitable for drinking water practice.
The few papers that addressed this problem may be classified in two categories: pseudo and true SLaPSO. The former are sequential procedures dividing problem into two or more stages. Two approaches could be distinguished among the methodologies from this category. The first stage of the ones following first approach consisted in finding the optimal branched layout and optimizing its diameters to minimize the cost, while the second stage consisted of heuristic procedures for adding loop-completing pipes to provide reliability [
10,
11,
12]. On the other hand, the methodologies following the second approach firstly optimized diameters for maximum layout network in stage 1 and then applied iterative heuristic approaches for pipe removal to reduce the cost without violating reliability constraints in stage two [
13,
14,
15,
16].
The first true SLaPSO was conducted by Afshar [
7]. The single objective was a penalized cost function, which—besides the common penalty terms corresponding to head and velocity constraints—included a term that penalizes the solutions whose demand nodes do not have at least two independent supply paths from the sources. Reliability defined in this way is known as the engineering formulation in the literature. The hydraulic constraints corresponding to mass and energy conservation equations were satisfied using an external hydraulic solver developed previously by the author. For the convergence towards the optimal solution the methodology employed a max-min ant system algorithm. The methodology was applied to two case study networks, namely a nine-node grid network and a part of the Winnipeg network (2 reservoirs, 20 nodes and 37 possible links). Almost all SLaPSO studies used these two benchmark networks to test their methodologies. The lower cost of the obtained optimal designs proved the superiority of true SLaPSO in comparison to the previously proposed sequential procedures. A year later Afshar applied a self-developed GA with a roulette wheel selection scheme for the same formulation of the problem [
17]. To prevent the dominance of the extraordinarily fit strings in the early stages of the search, Afshar and Jabbari used three modified versions of roulette wheel scheme on the same problem [
9].
The true SLaPSO studies previously cited all handled the head and reliability constraints with penalty terms added to the cost objective. To assure good optimization results, such implementations of constraints usually require that the penalty coefficients are calibrated for each case study [
18]. To handle the constraints in a better way, Saleh and Tanyimboh implemented a separate objective function quantifying total infeasibility of the solutions [
19]. Using the new methodology, they attained better (cheaper) designs for both case studies. The authors attributed the better results to the ability of the algorithm to approach the optimal solution from both feasible and infeasible parts of the solution space. To further improve the reliability of the optimal solutions, the same authors augmented the total infeasibility objective to consider statistical entropy as a proxy for the network’s reliability [
20].
The latest published research addressing SLaPSO problems was conducted by Jung and Kim [
8]. The study conducted SLaPSO as a multi-objective problem with metrics for cost and reliability. A penalty cost term ensured that the topologically infeasible layouts were excluded from the population. The results of the optimization analyses showed that topological reliability measures did not guarantee the desired hydraulic system performance.
1.3. Aim and Novelties of the Contribution
In this contribution, we demonstrate how numerical optimization can be applied to the design of a real-life WDN and what the added value of doing so is. To this end, we address a real-life study aimed at redesigning the (organically grown over many decades) pipe network providing water to a city in Belgium. Key to this redesign was that the utility De Watergroep not only wanted to reinforce its distribution network but to also structurally modify the network’s topology to enhance the quality of water delivered in the future.
Interestingly, the formulated mathematical problem represents a type of optimization problem—simultaneous layout and pipe-sizing optimization (SLaPSO)—that has not been conducted for a real-life-sized distribution network. As discussed in the previous subsection, the studies that addressed this problem usually preserved the reliability of a network by penalizing design solutions whose nodes are not all double fed. However, such a formulation is not appropriate for real-world networks. Firstly, such a formulation would lead to unjustifiably expensive designs, and secondly, such designs are not even desirable in practice because of the larger accumulation of sediments and water age resulting from lower pipe velocities. The key novelty of the presented paper lies in a novel approach to secure a network’s reliability using a constraint that penalizes the designs whose branched sections exceed a set threshold for the number of connections.
2. Materials and Methods
2.1. Practical Approach
In order to successfully apply numerical optimization to the design of real-life network masterplans, a close collaboration between researchers and the experts of the water utilities is crucial. To maximize cooperation, these types of projects are organized into an iterative joint design process, consisting of the following steps:
Discussion of the objective(s), constraints and decision variables of the optimization problem and inventory of the necessary data;
Evaluation of preliminary results, identification of eventual bottlenecks and (if necessary) fine-tuning of the optimization problem and required data;
Interpretation and discussion of definitive results, and the added value of applying numerical optimization.
Steps 1 and 2 are typically repeated several times to thoroughly explore various possible choices in the design problem at hand, to gain insights into trade-offs and boundary conditions and to iteratively arrive at a well-grounded design that matches the strategic goals of the water utility.
KWR has implemented evolutionary algorithms [
21] in an in-house developed optimization platform aimed specifically at drinking water distribution systems: Gondwana [
22,
23]. The platform uses EPANET 2.3 [
24] to assess the hydraulic performance of solutions and uses the specific implementation of the evolutionary optimization methods contained in the Inspyred library [
25]. This platform focusses on a highly flexible and versatile way of defining the optimization problem in a graphical interface. Using the platform to adjust the problem formulation on the fly suits the iterative design approach well and makes the concepts more accessible for the utility experts.
Thus far, the platform has been capable of solving different single- and multi-objective optimization problems related to WDN design, such as the classical design problem of finding the optimal pipe diameters to minimize construction costs, dividing network in District Metered Areas and finding optimal locations for placing water quality or quantity sensors, among several others. To solve the mathematical problem formulated in this study, which fits to the area of scientific literature known as SLaPSO, new Python modules were added to Gondwana to expand its functionality. As described in
Section 1.3., in the previous studies that addressed the problem of SLaPSO, the reliability of the supply is usually secured by penalizing design solutions in which nodes are not double fed. However, such a formulation is less appropriate for real-world networks, as making designs where each node is double fed would be too expensive. Moreover, such designs are not even desirable in practice because of the larger accumulation of sediments and water age resulting from lower pipe velocities. Consequently, a novel approach to secure reliability suitable for real-world networks is proposed in this study. Namely, the novel methodology implemented in Gondwana secures the reliability of the looped part of the network implicitly by introducing a constraint that penalizes the designs whose branched sections exceed a set threshold for the number of connections. The new formulation is described in details in
Section 2.3.
2.2. Case Study Objective
For the case study, an anonymous City X in Belgium with around 35 thousand inhabitants was considered. The utility De Watergroep supplies City X with water through a pipe network that has grown organically over the years under the management of different utilities. Within this network, De Watergroep distinguishes transport mains and distribution pipes. The ambition is to work towards an alternative design that leads to lower residence times, higher flow speeds and less sedimentation. This design philosophy reorganizes the network into primary pipes (transport mains), secondary pipes (meshed distribution mains) and tertiary pipes (branched distribution mains). This approach, aimed at robustness of service and water quality, is considered the best practice in the Netherlands [
26] (
Table 1,
Figure 1). In addition, De Watergroep wants to achieve the leanest possible design for the pipe network, further improving water quality and costs.
2.3. Optimization Problem Formulation
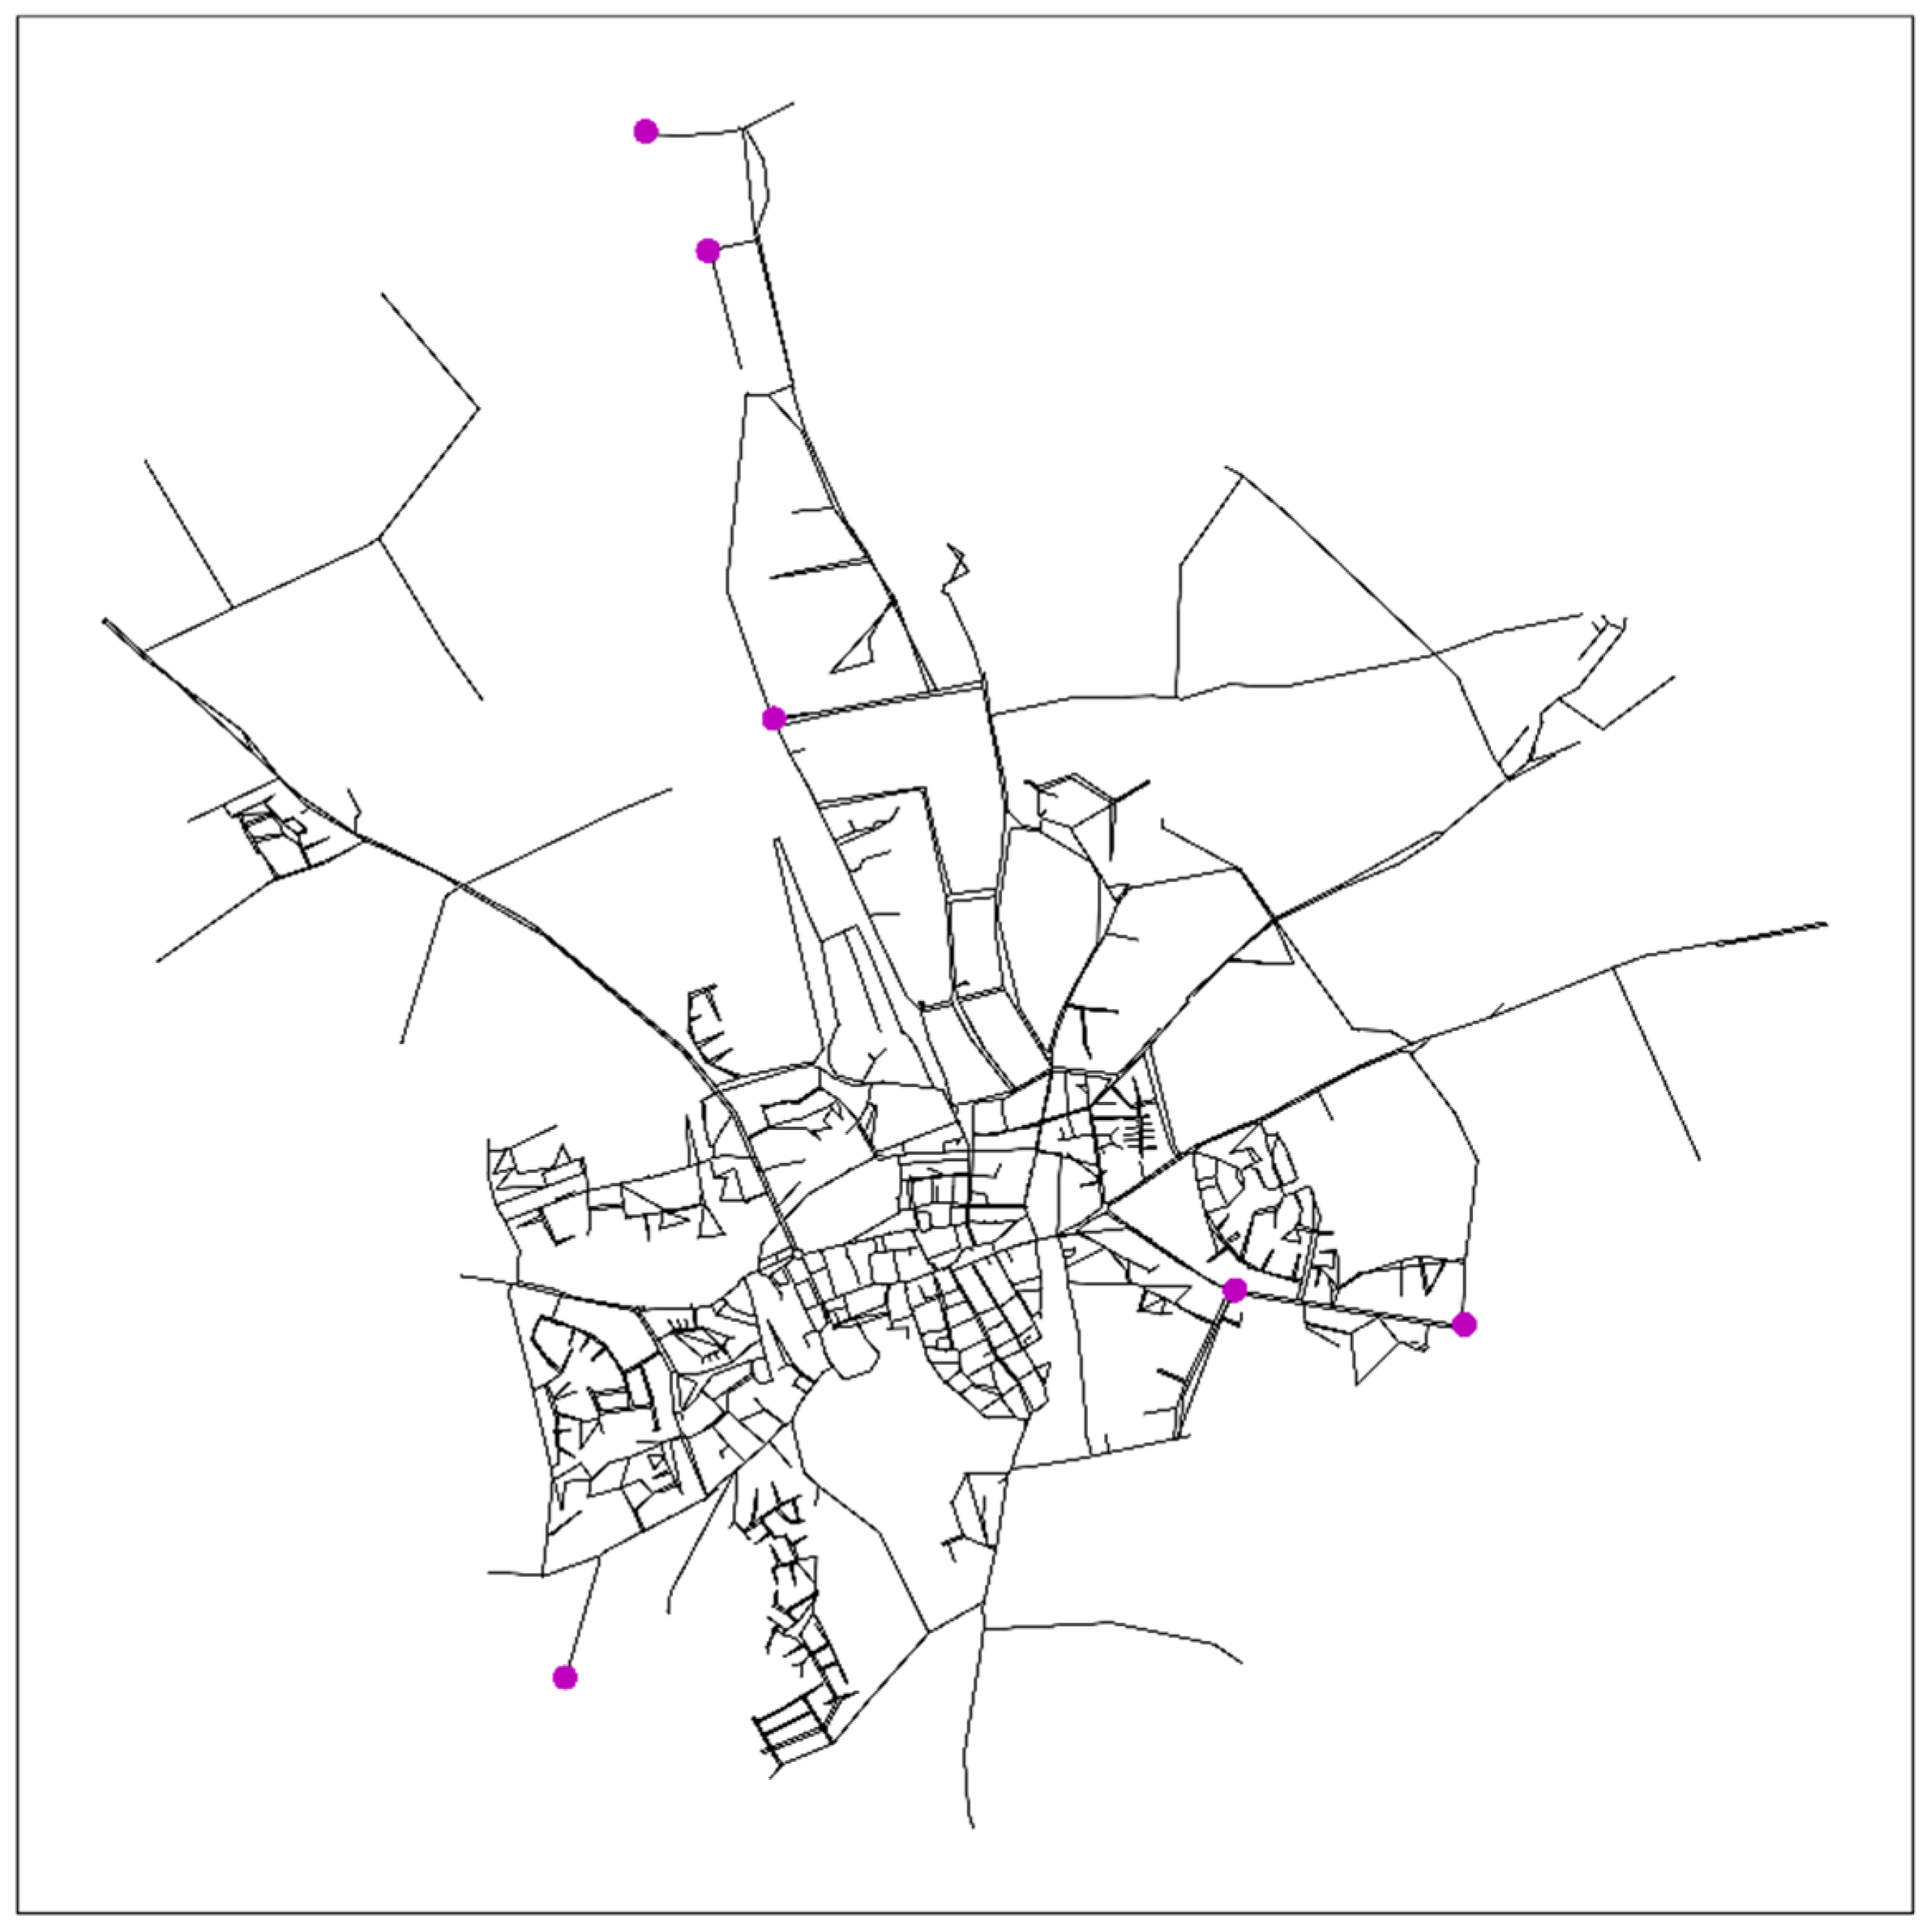
The backbone of the problem formulation is a hydraulic model of the present-day network of City X, which serves as a template for potential solutions. The hydraulic model, shown in
Figure 2, has 4792 nodes, 6 reservoirs and 5183 pipes. The water demand in the model is that of the peak hour (9 am) on the maximum day (day with the highest demand in the past 10 years), increased by 10% to account for potentially higher demand in the future. This particular demand is used because the water utility evaluates its service requirements under this scenario.
2.3.1. Decision Variables
The properties of the template network model that the algorithm changes to arrive at new solutions are the diameters (
) of the pipes in the network. The largest transport main in the network, which connects the two main sources in the model, was precluded from change, following the utility’s preference. Possible values of the diameter of pipes are limited to a list of commercially available diameters (set
) and materials, summarized in
Table 2. In addition to the commercially available diameters, the possibility of taking pipes out of use has also been provided for, by adding a permissible diameter equal to near-zero mm (0.0001 mm, so EPANET can handle these diameters correctly). This is an important aspect that allows for the network topology to change. Setting the diameters of pipes to zero may create branched structures or may widen meshed structures. As De Watergroep aims to reduce the number of loops and increase the branched sections, the algorithm does not permit the addition of new pipes.
2.3.2. Objective Function
The performance criterion driving the search for new designs is chosen to minimize the product of the length (
) and diameter (
) of those pipes that are topologically part of the looped section of the network (the ‘primary’ (set
) and ‘secondary’ (set
) pipes) as a surrogate for costs. The sets
and
(set of tertiary pipes) are not predefined. Instead, in each iteration and for each topology solution, the algorithm finds the nodes, i.e., pipes which are double fed and defines these sets so that the objective can be evaluated. This is one of the key novelties of the proposed algorithm.
where
to
are the penalty functions that are described in
Section 2.3.3.
This drives the search towards the case study objective stated above in two ways:
Every time the removal of a pipe leads to part of the network becoming branched, the objective is minimized further, reflecting De Watergroep’s desire to introduce branched sections into the network;
Every time the diameter of a part of the looped network is reduced, the objective is minimized further, reflecting De Watergroep’s wish to have a network design with as small as possible volume.
It should be noted that the volume (
) of the branched parts of the network (set
) has deliberately been left out of the objective function. This is because these parts of the network need to be designed according to deterministic dimensioning rules in the Dutch code of practice [
8] and therefore need no optimization in this step (although the algorithm assigns diameter values to these pipes, as it is not known in advance which pipes belong to this set). For the purposes of the optimization, the design of these sections is a post-processing step.
2.3.3. Constraints
Finally, the optimization is constrained as follows:
At every junction in the looped part of the network (set
) that also connects to a branched section, a pressure (
) is enforced to be equal to 22.5 m plus the elevation difference (
) between that junction and the highest junction in the branched section (solutions that do not satisfy this constraint are discarded);
where
is a penalty coefficient.
At every other junction, also in the branched structure, a pressure of >0 is enforced. This is important to reject infeasible topologies.
where
and
is a set of all junctions in the network.
For every junction in the looped part of the network that also connects to a branched section, the objective is penalized with a value of
= 1 × 10
5 for every meter the pressure is below 28 m plus the elevation difference between that junction and the highest junction in the branched section;
The objective is penalized for every branched cluster in the network that contains more than 50 equivalent customer connections (
). The penalty coefficient is
=100.
2.4. Optimization Settings
The evolutionary algorithm was executed with a population of 50, a tournament selection strategy with an elitism rate of 10% and a convergence criterion of 5000 generations. Proximity mutation with proximity degree 1 and with a rate of 0.01, and 1-point crossover with a rate of 0.85 were used as variators. The diameters of the initial population were initialized to reflect the current, fully connected network of De Watergroep.
2.5. Post-Optimization Checks
Two sets of hydraulic requirements for the design are too computationally intensive to comfortably check them during optimization: fire flow requirements (the checking of which requires a hydraulic calculation for every junction) and continuity of supply (requiring a hydraulic computation for every pipe contained in the meshed part of the network). It is hypothesized, however, that the pressure requirements captured in the constraints are far more stringent, so that meeting the pressure requirements leads to meeting the other requirements as well. This hypothesis is tested with two post-optimization checks.
Fire flow requirements—to ensure sufficient firefighting capacity in the network, it was verified with one hydraulic computation per junction in the meshed part of the network that, on an average day, an additional water demand of 30 m3 h−1 could be supplied at that junction while maintaining at least 5 m of pressure on all other junctions.
Continuity of supply—De Watergroep requires that, on an average day, regular demand may be satisfied in any part of the network even during a (single) maintenance or repair activity. In order to verify this, several worst-case scenarios are identified: the closure of any one pipe at the end of a loop in the branched part of the network. If pressures are sufficient during any of these scenario’s in which the pressure drop across the partially disconnected loop is at its maximum, it is assumed that the requirements are met in any scenario. The specific pressure requirements for regular service are that, at every junction in the looped part of the network that also connects to a branched section, the pressure must be equal to 22.5 m plus the elevation difference between that junction and the highest junction in the branched section. The requirement is checked with one hydraulic computation per scenario, each time using the demand corresponding to the peak hour of an average day.
3. Results
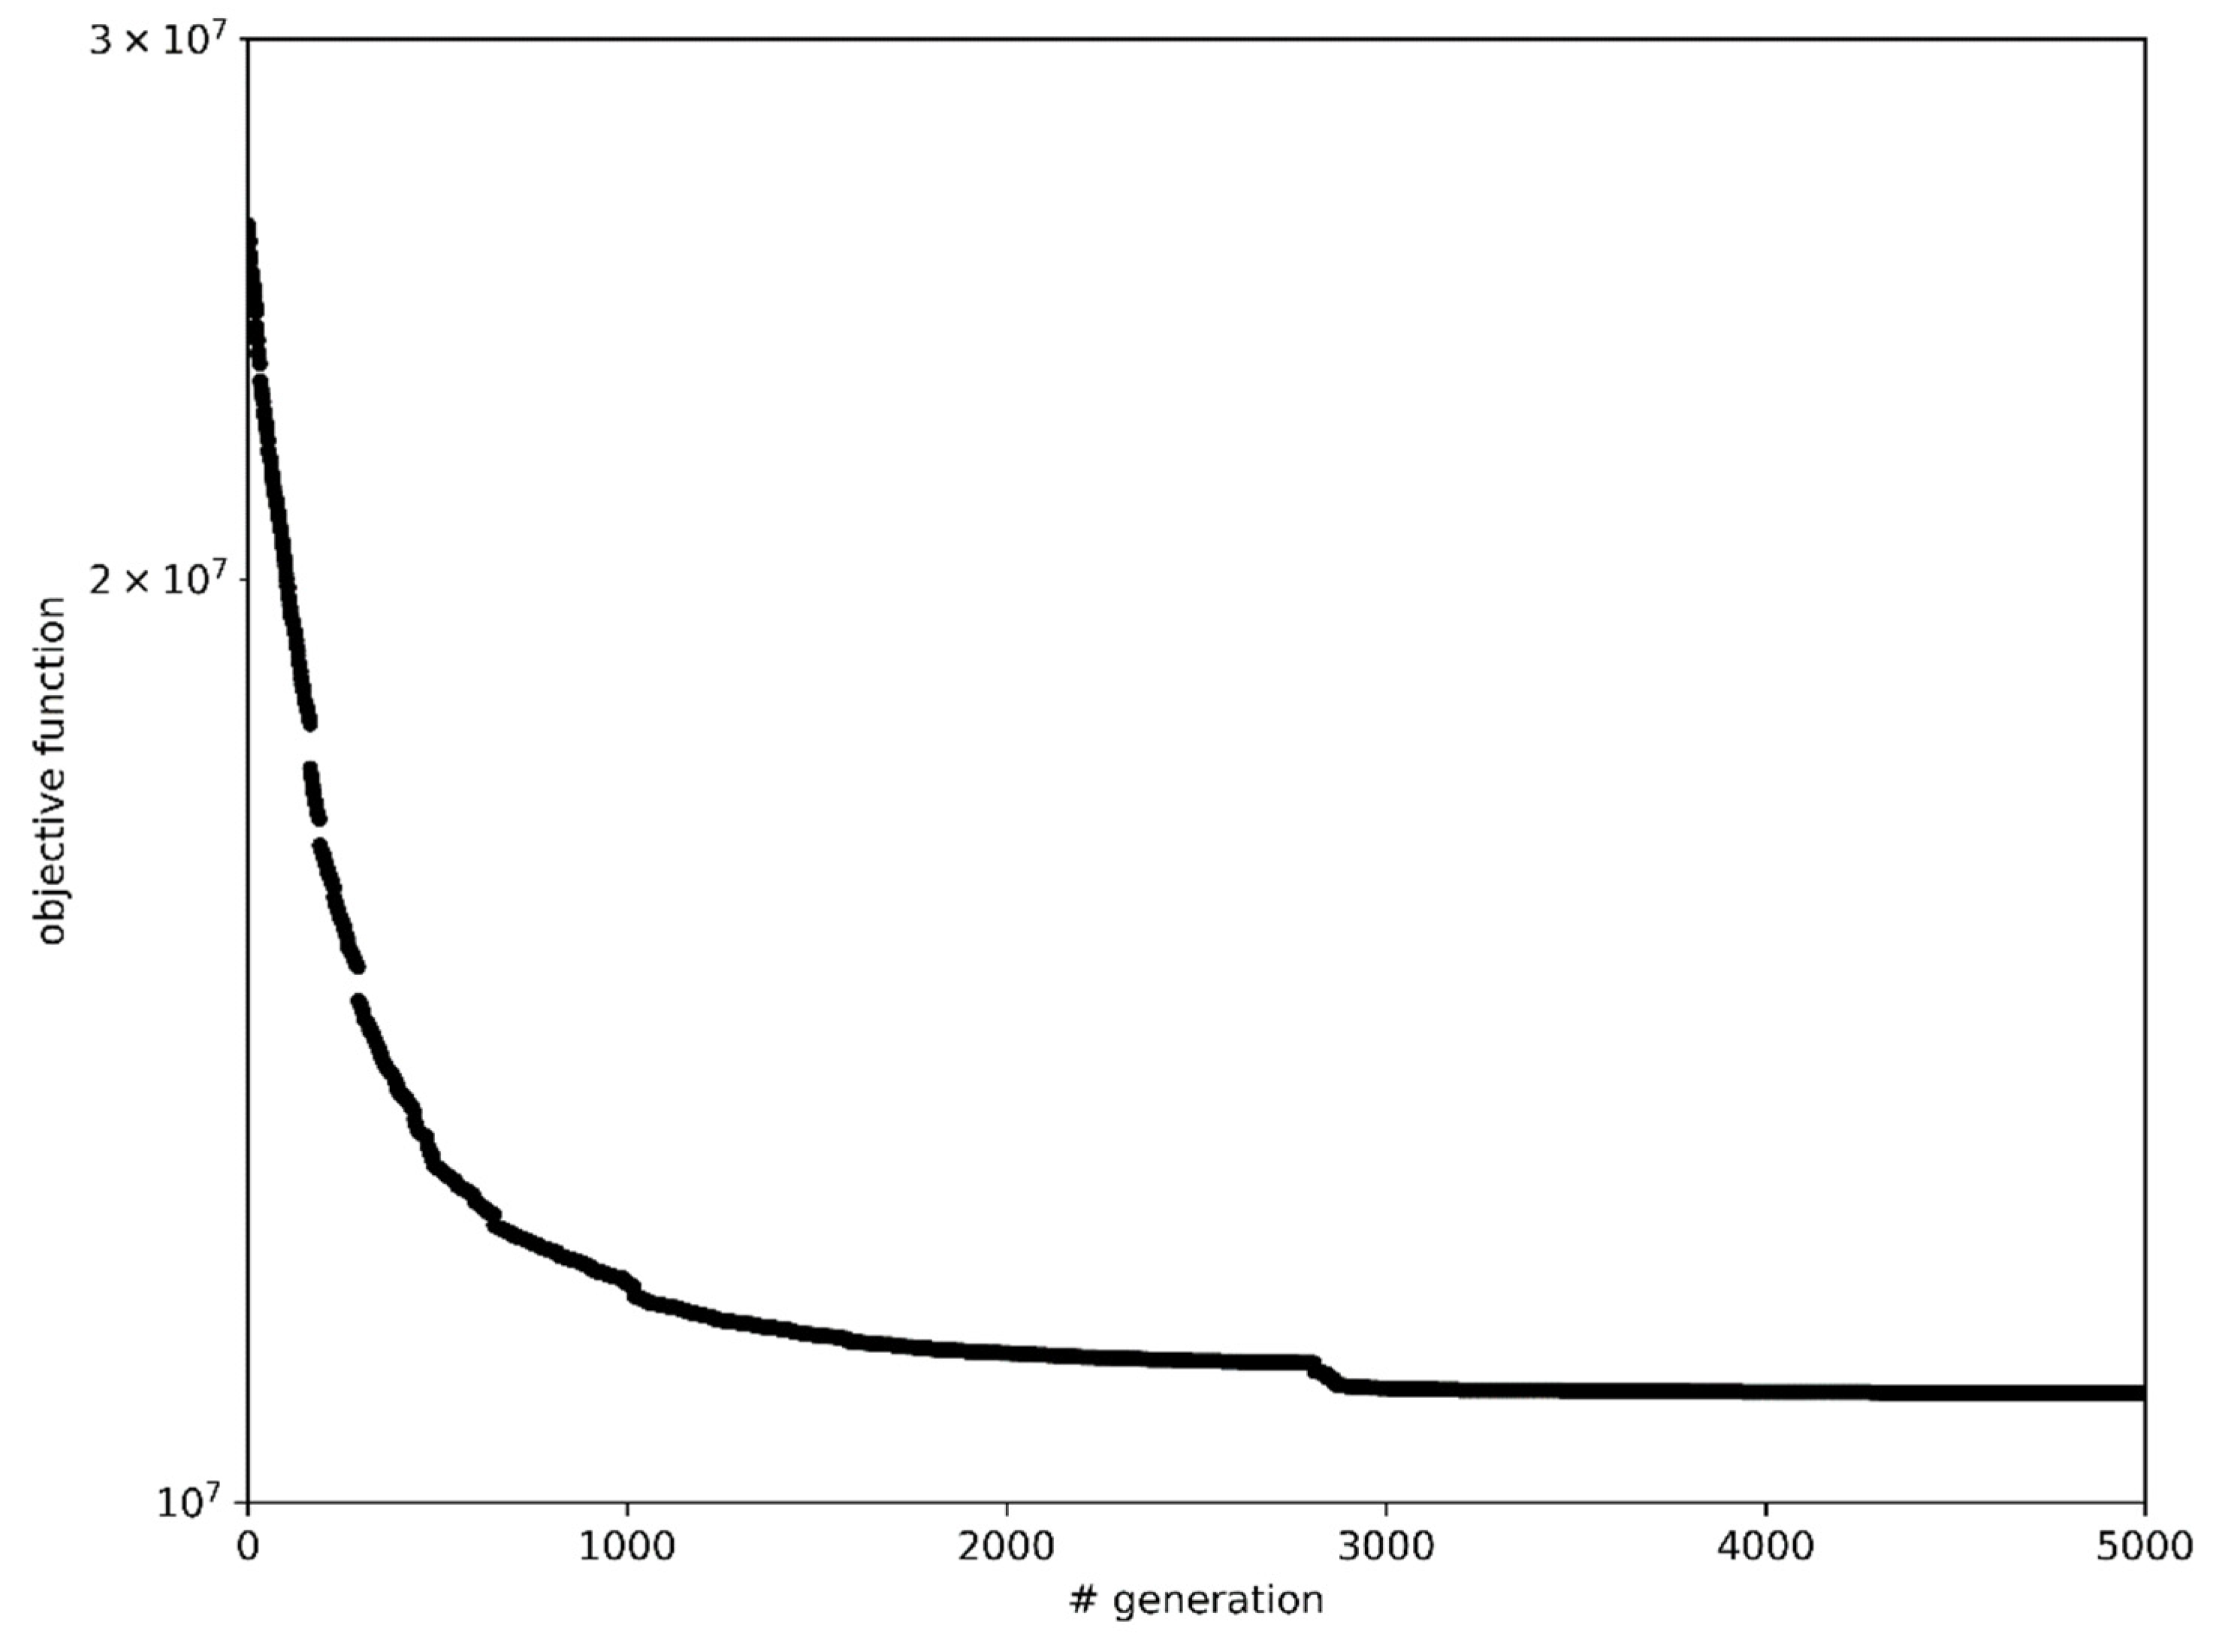
Figure 3 shows the convergence curve of the optimization problem. The curve starts to attenuate around 2500 generations, indicating 5000 generations in total were sufficient for reasonable convergence. Three repetitions of the computation resulted in final performance scores within 1% of each other.
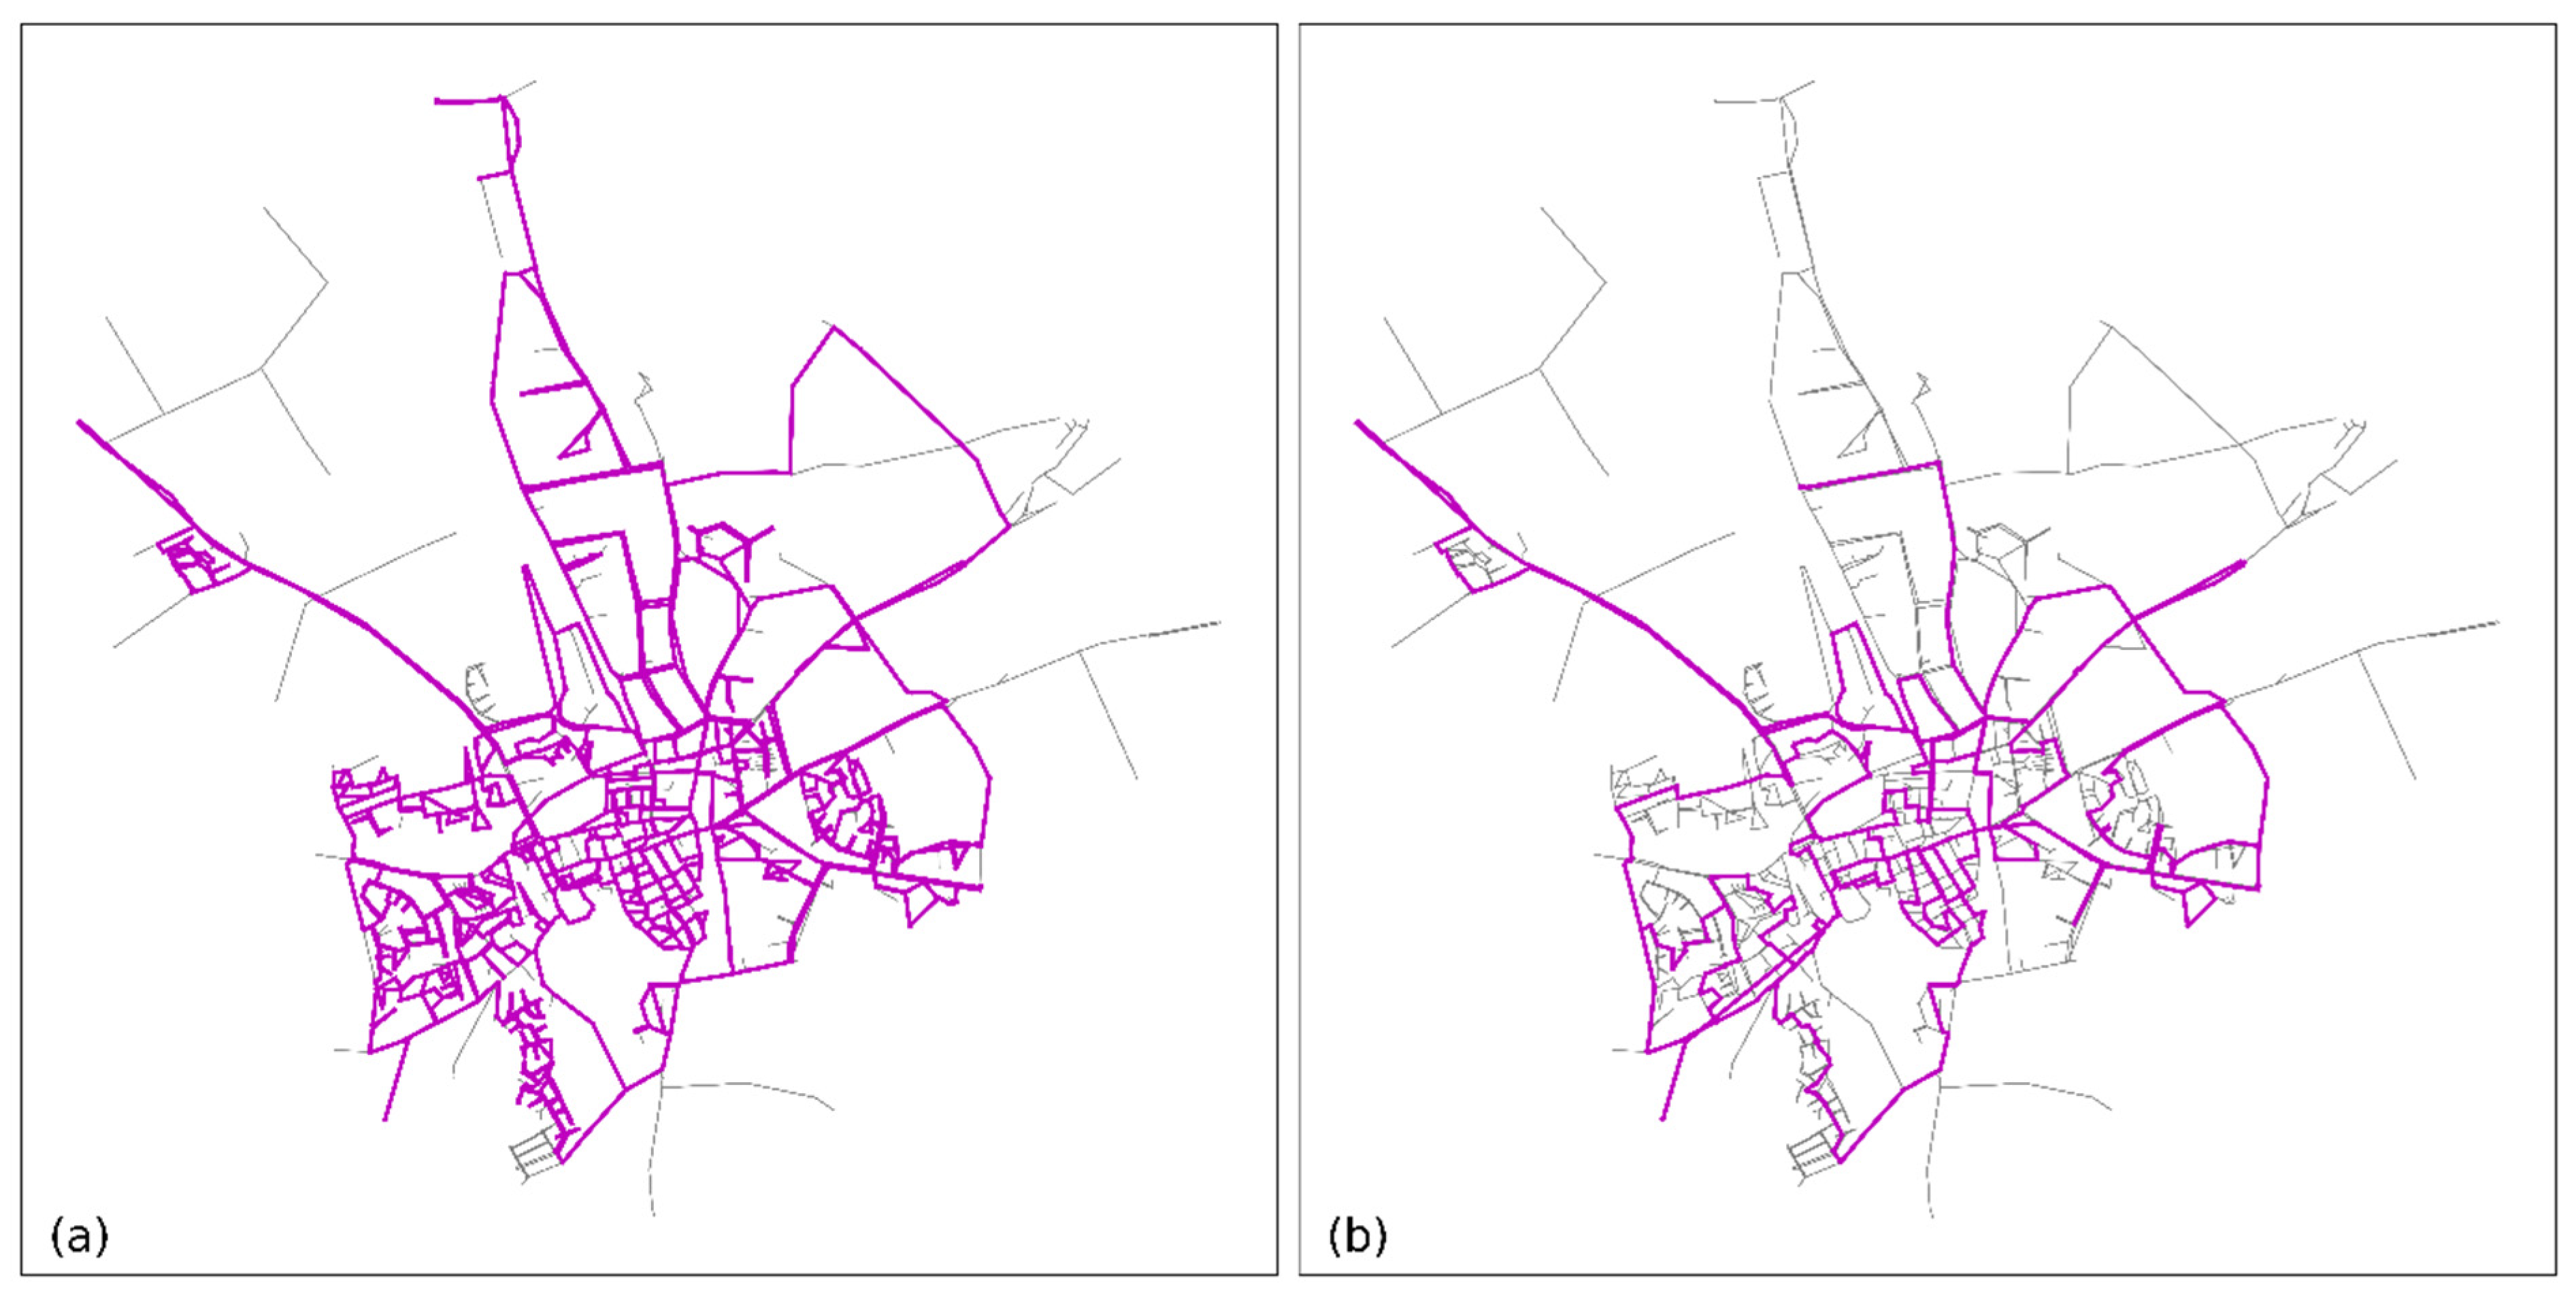
Optimization of the network created a clear division into primary–secondary–tertiary pipes. Primary pipes were not included in the optimization, so the diameters of these are unchanged. The secondary–tertiary classification has changed significantly: many secondary pipes (meshed in the current design) are designed as branched, tertiary pipes in the optimized network. In the optimized design, 4% of the pipes are primary, 29% secondary and 67% tertiary. An impression of the change from the meshed to branched design is given in
Figure 4.
Moreover, the chosen formulation for the optimization problem has resulted in a leaner and tighter design with fewer, often smaller pipes (in diameter). In a rough approximation, considering a meter price of EUR 1 per mm diameter for the pipes, the cost of the optimized design is around EUR 5M less than the current replacement value of the network.
Although water quality has not been explicitly included in the optimization formulation, as expected, the optimized design with fewer loops and reduced pipe diameters led to higher velocities and consequently a reduction of residence time. Namely, it has been calculated by De Watergroep’s hydraulic experts that the average residence time decreases from 7.5 to 3.6 h. A comparison of the new design with the current network is summarized in
Table 3.
In the optimized design, the pressure at all tertiary nodes in the pipeline network is equal to or greater than 195 kPa, under regular conditions and during the peak hour of the max-day. In practice, the pressure has been assessed at secondary nodes, considering 30 kPa pressure loss and the elevation of the highest customer connected to the tertiary network (i.e., basically P > 225 kPa + elevation highest customer). The pressure at secondary nodes is always higher than 195 kPa, even in situations where no tertiary pipes are connected to the secondary nodes. This may be formulated differently for other areas. In the current pipe network, the pressure is very high in some areas (>400 kPa). This means there is room to build a leaner network. The optimization algorithm made use of this space to reduce pipe diameters until the minimum pressure was reached at several nodes. In the optimized network the pressures are lower, and a larger number of nodes have pressures between 250 and 300 kPa. The desired minimum pressure of 250 kPa, under regular conditions and during peak hour of max-day, has been achieved at all but four nodes in the network. The maximum deficit of the pressure in these situations is 12 kPa, during peak hour of max-day. This is acceptable for the water utility.
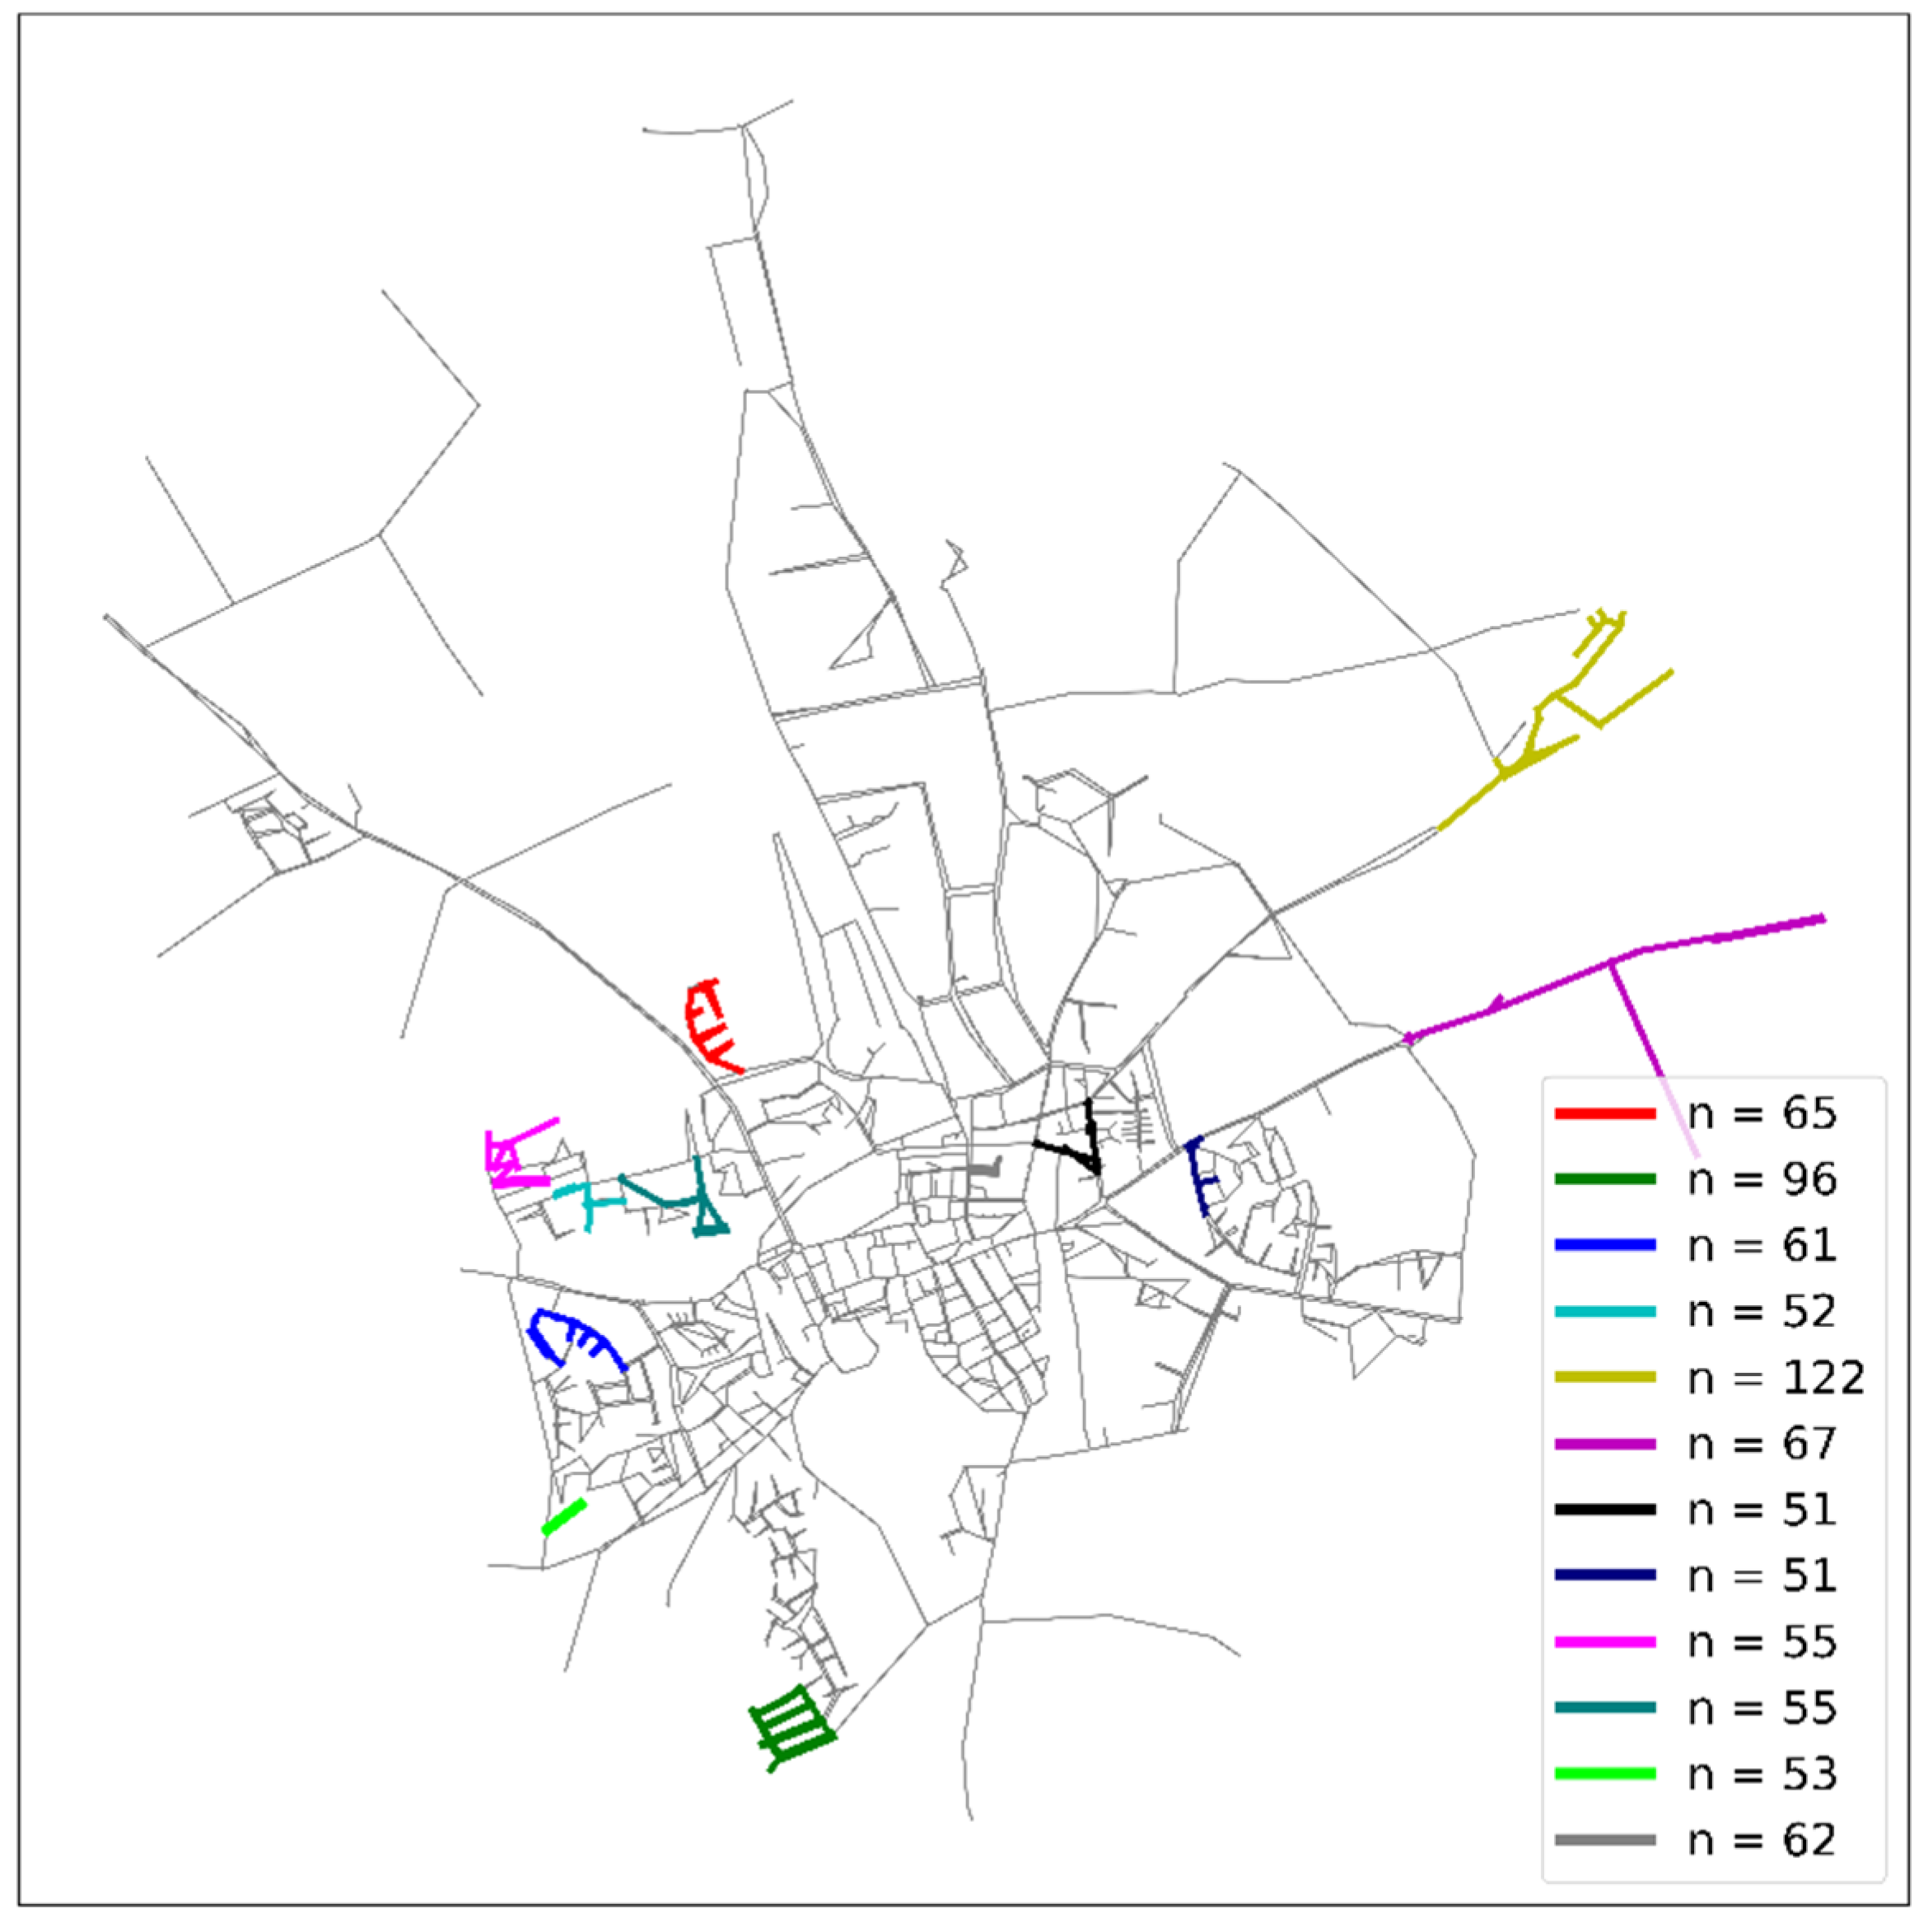
In terms of section size, the water utility aims for section sizes of up to 50 connections for single-fed sections. That is, sections with more than 50 connections should ideally be double fed. In the current design, 5 single-fed sections have more than 50 connections. In the optimized target structure, this number increases to 10 sections. This is because of creating a more branched structure.
Figure 5 illustrates these sections and shows how many connections belong to each of these sections. A large proportion of these sections have only slightly more than 50 connections. This is acceptable for the water utility. Other sections are considerably larger. These are the sections that also fail to meet the requirement in the current design (sections with 62 to 122 connections). In this optimization problem, these problems cannot be solved, given that in the way the optimization problem is set up, there is no freedom to add new pipes. In these cases, it is therefore necessary for the water utility to work out local solutions, such as laying additional pipes.
A further impression of the optimized design is given in
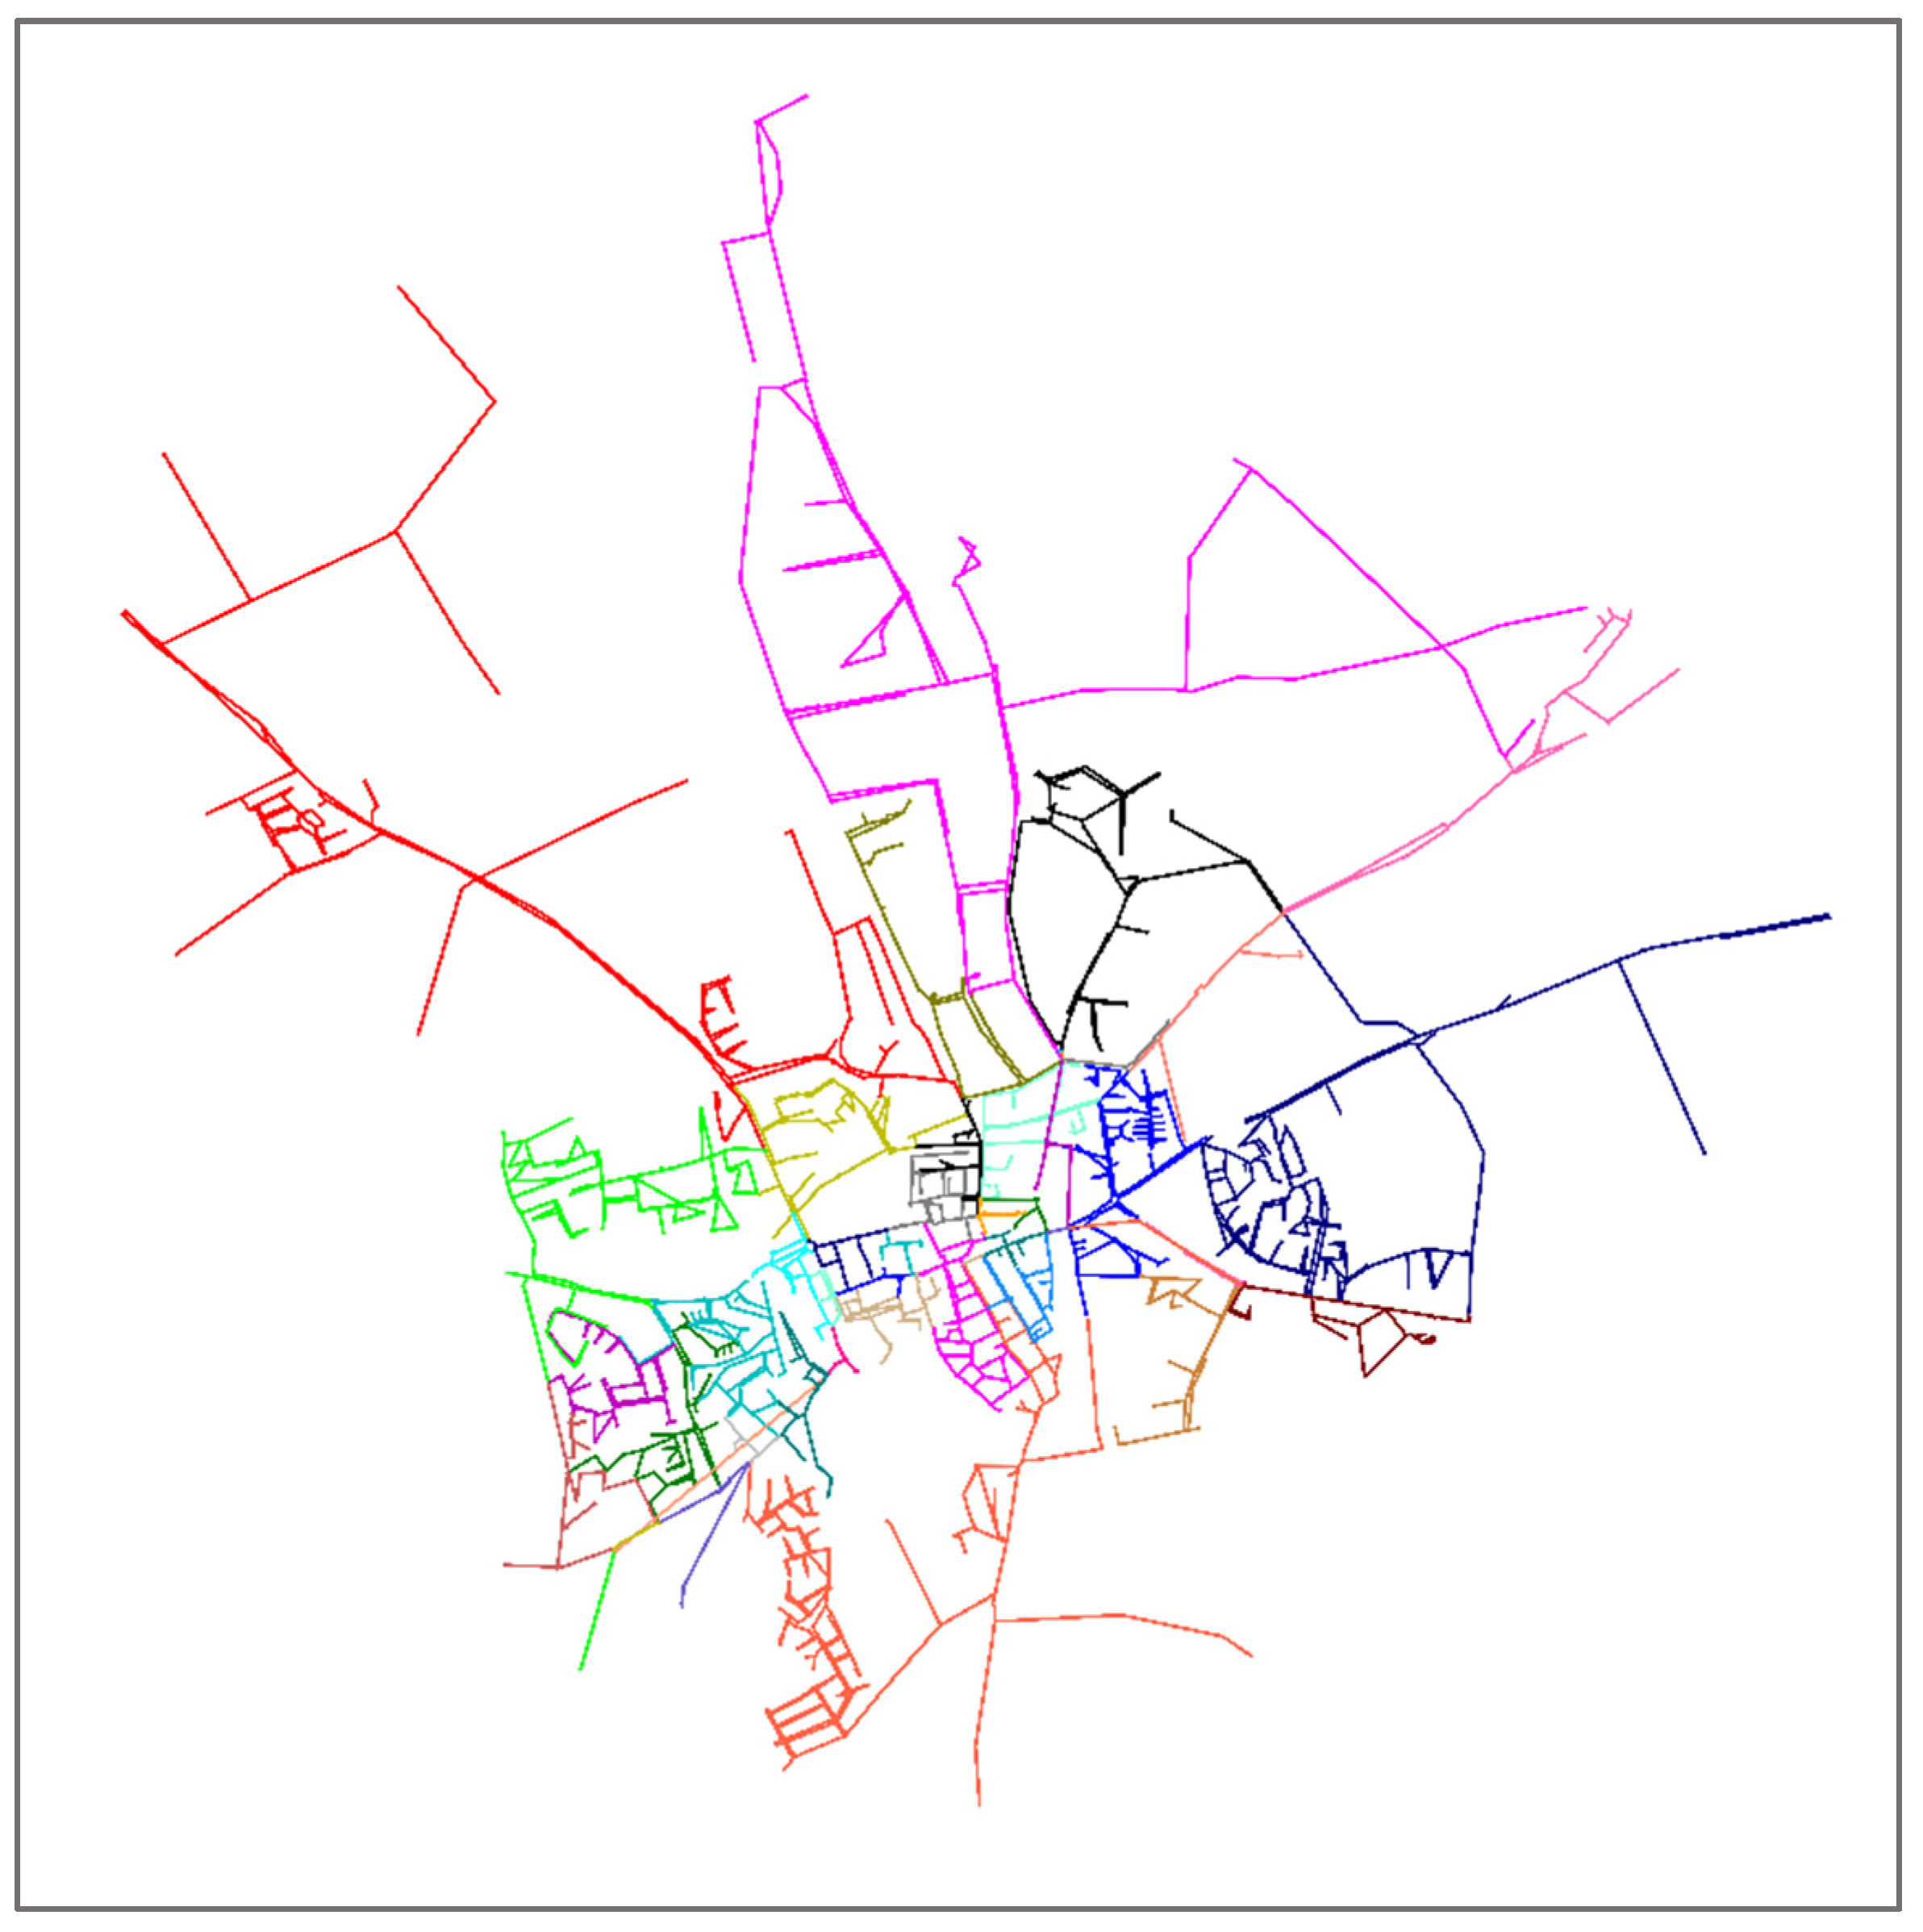
Figure 6: it shows the 49 double-fed clusters, i.e., the parts of the network fed by the different loops in the meshed, secondary part of the network.
The post optimization checks for fire flow showed that, as hypothesized, the pressure requirements were met on every junction of the looped part of the network.
The post-optimization checks for continuity of supply consisted of the 98 outage scenarios (two ends of each of the 49 double-fed clusters). In each of these the residual pressure was evaluated. Results show a violation of the requirements in the case of failure scenarios on the ends of two specific loops: the long loop supplying the north–west (red in
Figure 6), and the easternmost loop (navy in
Figure 6). In both cases, the problems were found to be inherent to the local structure of the network as both loops coincided with two original loops that were exactly as longwinded to begin with. Since no amount of optimization of existing pipes would change that, it was rather proposed to remedy the issues in these two sections by creating additional crosslinks with the rest of the network.
4. Conclusions and Outlook
In this study, a masterplan for the WDN serving City X, in Belgium, was designed. Established academic approaches to WDN design optimization were used, with a focus on adjusting these general approaches to match the specific operational and strategic design goals of the water utility. In this way, the design problem is formulated in a formal yet relatable way that matches the experience of the utility experts. This, in turn, helps them to trust the obtained solutions enough to consider them for inclusion in the long-term financial plans and maintenance strategies. The use of numerical optimization techniques made it possible to elaborately explore and to quantitatively test different design philosophies. The iterative approach to formulating the optimization problem led to well-informed choices for objectives and constraints. This, in turn, led to a masterplan that best fits the water utility’s vision and strategy for the considered supply area. The results obtained show that numerical optimization techniques are useful and valuable for the design of WDNs in practice.
For City X, the optimized network is 18.5% smaller than the currently installed pipe network. When only secondary pipes are considered, the optimized structure is 64% smaller. Optimizing the network also resulted in a clearer classification into primary, secondary and tertiary pipes. 764 locations have been identified where meshed pipes can be ‘cut open’ to achieve a structure in which 67% of the network length can be branched without severe consequences to the hydraulic performance and robustness. This, in turn, has a positive effect on water quality, with average residence time decreasing from 7.5 to 3.6 h. In addition to water quality, the optimized network also has financial benefits: in a rough approximation, using a meter price of EUR 1 per mm diameter for pipe costs, the replacement value of the optimized design is about EUR 5M less than the replacement value of the current pipe network if the pipes were now completely re-laid. Moreover, it is expected that these costs will further decrease when the branched structures of the network are (deterministically) further optimized according to the Dutch best practices [
8].
A key contribution of this work is a set of heuristics that allow the SLaPSO-type problem to be applied to a real-life network. The constraint enforcing positive pressures was sufficient for dealing with infeasible topologies. Initialization of the first population with fully connected solutions should allow the optimization to explore the complete topology solution landscape, but a more rigorous analysis of convergence—beyond the repetitions performed here—might be needed to fully prove the approach is robust against convergence into local optima.
Moreover, the constraints on pressure and topological cluster size proved to be sufficient to guarantee network continuity of supply (robustness), avoiding the need for a direct evaluation of robustness under all possible failure scenario’s, which would be prohibitively expensive. It is worth pointing out, however, that these heuristics were primarily inspired by the best practices of De Watergroep and the Dutch utilities. Although the heuristics are flexible in their use, explicit consideration of continuity of supply might still be needed for the optimization of different areas operated by different utilities with different goals.
From experience, we have learned that applying numerical optimization techniques is an iterative process. Good and frequent consultation between researchers and utility experts is crucial. In this case study, too, the many moments of interactions and the constructive cooperation between all involved were essential success factors. The value for researchers to be able to benefit from a broad collection of domain knowledge and practical perspectives cannot be overstated. Moreover, from the perspective of the utility experts, such interaction enables one to build insight and confidence in the numerical approach.
Compared to the required computation time, by far the most time and effort involved with optimization of networks lies in bringing together strategic goals, practical constraints and company data. Now that that work is done, however, the utility may reuse the design philosophy captured in this optimization problem and apply it to other parts of the supply area, unlocking the true power of automation and optimization. It is however important to notice that the design of a masterplan for a WDN remains tailor-made to some extent. When designing masterplans for other areas, area-specific key features and boundary conditions should always be carefully considered.
When it comes to the practical implementation of optimized masterplans such as the one presented here, one of the most interesting next steps is to look at its gradual realization. Due to the substantial effort and costs involved, utilities can only make small changes to the network over time. Moreover, utilities are limited in their freedom to change any given location to the network at-will due to many internal and external factors. Finally, as goals and the environment will change in an uncertain future, so must the masterplan and its path to realization. Navigating this transition in an effective way is an optimization problem in its own right.
Author Contributions
Conceptualization, I.V., K.v.L., P.P. and M.T.; Formal Analysis, Funding Aquisition, I.V. and K.v.L.; Methodology, Software, Visualization, K.v.L.; Data Curation, I.V., P.P. and M.T.; Writing—Original Draft, I.V.; Writing—Review and Editing, I.V., K.v.L. and D.M. All authors have read and agreed to the published version of the manuscript.
Funding
This research was funded by De Watergroep, project number 402960/001 and partially by the Water-Futures project which has received funding from the European Research Council (ERC) under the European Union’s Horizon 2020 research and innovation program (Grant agreement No. 951424).
Data Availability Statement
Restrictions apply to the availability of these data. Data were obtained from Water Utilities and are available from the authors only with the permission of the Water Utilities.
Acknowledgments
The authors would like to thank Peter van Thienen (KWR) for the constructive discussions, suggestions and guidance through the development of the project.
Conflicts of Interest
The authors declare no conflict of interest.
References
- Vertommen, I.; van Laarhoven, K.; van Thienen, P.; Agudelo-Vera, C.; Haaijer, T.; Diemel, R. Optimal Design of and Transition towards Water Distribution Network Blueprints. EWaS3 2018 2018, 2, 584. [Google Scholar] [CrossRef] [Green Version]
- Mala-Jetmarova, H.; Sultanova, N.; Savic, D. Lost in Optimisation of Water Distribution Systems? A Literature Review of System Design. Water 2018, 10, 307. [Google Scholar] [CrossRef] [Green Version]
- Alperovits, E.; Shamir, U. Design of optimal water distribution systems. Water Resour. Res. 1977, 13, 885–900. [Google Scholar] [CrossRef]
- Lansey, K.E.; Mays, L.W. Optimization Model for Water Distribution System Design. J. Hydraul. Eng. 1989, 115, 1401–1418. [Google Scholar] [CrossRef]
- Kim, J.H.; Mays, L.W. Optimal Rehabilitation Model for Water-Distribution Systems. J. Water Resour. Plan. Manag. 1994, 120, 674–692. [Google Scholar] [CrossRef]
- Nicklow, J.; Reed, P.; Savic, D.; Dessalegne, T.; Harrell, L.; Chan-Hilton, A.; Karamouz, M.; Minsker, B.; Ostfeld, A.; Singh, A.; et al. State of the Art for Genetic Algorithms and Beyond in Water Resources Planning and Management. J. Water Resour. Plan. Manag. 2010, 136, 412–432. [Google Scholar] [CrossRef]
- Afshar, M.H. Application of a max–min ant system to joint layout and size optimization of pipe networks. Eng. Optim. 2006, 38, 299–317. [Google Scholar] [CrossRef]
- Jung, D.; Kim, J.H. Water Distribution System Design to Minimize Costs and Maximize Topological and Hydraulic Reliability. J. Water Resour. Plan. Manag. 2018, 144, 06018005. [Google Scholar] [CrossRef]
- Afshar, M.H.; Jabbari, E. Simultaneous Layout and Pipe Size Optimization of Pipe Networks using Genetic Algorithm. Arab. J. Sci. Eng. 2008, 33, 391–409. [Google Scholar]
- Rowell, W.F.; Barnes, J.W. Obtaining Layout of Water Distribution Systems. J. Hydraul. Div. 1982, 108, 137–148. [Google Scholar] [CrossRef]
- Morgan, D.R.; Coulter, I.C. Least Cost Layout and Design of Looped Water Distribution Systems. Civ. Eng. Syst. 1982, 28, 3555–3575. [Google Scholar]
- Awumah, K.; Bhatt, S.K.; Goulter, I.C. An Integer Programming Model for Layout Design of Water Distribution Networks. Eng. Optim. 1989, 15, 57–70. [Google Scholar] [CrossRef]
- Kessler, A.; Ormsbee, L.; Shamir, U. A methodology for least-cost design of invulnerable water distribution networks. Civ. Eng. Syst. 1990, 7, 20–28. [Google Scholar] [CrossRef]
- Cembrowicz, R.G. Water Supply Systems Optimization for Developing Countries. In Pipeline Systems; Coulbeck, B., Evans, E.P., Eds.; Springer: Dordrecht, The Netherlands, 1992; pp. 59–76. [Google Scholar] [CrossRef]
- Awumah, K.; Goulter, I. Maximizing Entropy Defined Reliability of Water Distribution Networks. Eng. Optim. 1992, 20, 57–80. [Google Scholar] [CrossRef]
- Afshar, M.H.; Akbari, M.; Mariño, M.A. Simultaneous Layout and Size Optimization of Water Distribution Networks: Engineering Approach. J. Infrastruct. Syst. 2005, 11, 221–230. [Google Scholar] [CrossRef]
- Afshar, M.H. Evaluation of Selection Algorithms for Simultaneous Layout and Pipe Size Optimization of Water Distribu286tion Networks. Sci. Iran. 2007, 14, 274–286. [Google Scholar]
- Prasad, T.D.; Park, N.-S. Multiobjective Genetic Algorithms for Design of Water Distribution Networks. J. Water Resour. Plan. Manag. 2004, 130, 73–82. [Google Scholar] [CrossRef]
- Saleh, S.H.A.; Tanyimboh, T.T. Coupled Topology and Pipe Size Optimization of Water Distribution Systems. Water Resour. Manag. 2013, 27, 4795–4814. [Google Scholar] [CrossRef] [Green Version]
- Saleh, S.H.A.; Tanyimboh, T.T. Optimal Design of Water Distribution Systems Based on Entropy and Topology. Water Resour. Manag. 2014, 28, 3555–3575. [Google Scholar] [CrossRef] [Green Version]
- Goldberg, D.E. Genetic Algorithms in Search, Optimization, and Machine Learning; Addison-Wesley: Boston, MA, USA, 1989. [Google Scholar]
- van Thienen, P.; Vertommen, I. Gondwana: A Generic Optimization Tool for Drinking Water Distribution Systems Design and Operation. Procedia Eng. 2015, 119, 1212–1220. [Google Scholar] [CrossRef] [Green Version]
- van Laarhoven, K.; Vertommen, I.; van Thienen, P. Technical note: Problem-specific variators in a genetic algorithm for the optimization of drinking water networks. Drink. Water Eng. Sci. 2018, 11, 101–105. [Google Scholar] [CrossRef]
- Rossman, L.A.; Woo, H.; Tryby, M.; Shang, F.; Janke, R.; Haxton, T. EPANET 2.2 User Manual. 2020. Available online: https://epanet22.readthedocs.io/_/downloads/en/latest/pdf/ (accessed on 1 June 2020).
- Garrett, A. Overview—Inspyred 1.0.1 Documentation. 2012. Available online: https://aarongarrett.github.io/inspyred/overview.html (accessed on 26 September 2022).
- Vogelaar, A.; Blokker, E.J. Ontwerpen Secundair Leidingnet; KWR Watercycle Research Institute: Neieuwegein, The Netherlands, 2011. [Google Scholar]
| Publisher’s Note: MDPI stays neutral with regard to jurisdictional claims in published maps and institutional affiliations. |
© 2022 by the authors. Licensee MDPI, Basel, Switzerland. This article is an open access article distributed under the terms and conditions of the Creative Commons Attribution (CC BY) license (https://creativecommons.org/licenses/by/4.0/).

 ,
, 


