Article

Risk-Based Inspection and Rehabilitation Planning of Service Connections in Intermittent Water Supply Systems for Leakage Management in Arid Regions

by
Husnain Haider
1,*,
Muath Abdullah Almutlaq
1,
Abdullah Alodah
1,
Abdul Razzaq Ghumman
1,
Ibrahim Saleh AlSalamah
1,
Yousry Mahmoud Ghazaw
2 and
Md. Shafiquzzaman
1
1
Department of Civil Engineering, College of Engineering, Qassim University, Buraydah 51452, Qassim, Saudi Arabia
2
Department of Irrigation and Hydraulics, Faculty of Engineering, Alexandria University, Alexandria 21544, Egypt
*
Author to whom correspondence should be addressed.
Water 2022, 14(24), 3994; https://doi.org/10.3390/w14243994
Submission received: 3 November 2022 / Revised: 30 November 2022 / Accepted: 3 December 2022 / Published: 7 December 2022
(This article belongs to the Special Issue Infrastructure Asset Management of Urban Water Systems)

Abstract

:
Most of the leakage in water distribution systems operating with plastic pipes occurs at service connections (SCs), while the existing tools plan rehabilitation of pipes. With limited water resources, intermittent supplies in arid regions further enhance the failure vulnerability of metal fittings on water mains due to scale formation and large pressure transients. The present research developed a risk-based methodology for the proactive maintenance of SCs in intermittent water supply systems. A five-generation bottom-up hierarchical approach aggregated the basic hydraulic, physical, and water quality factors to determine the vulnerability of structural failures of SCs. Hydraulic parameters (pressure and velocity) were estimated by simulating a distribution network of 366 water mains of diameters ranging from 110 mm to 225 mm serving 371 SCs in a residential neighborhood located in the Qassim region of Saudi Arabia. Age, depth, and length of SCs’ estimated the condition index, while soil corrosivity and condition of the water mains were also counted when assessing the structural failure index for each SC. Water quality parameters, e.g., pH, turbidity, and iron, that can contribute to the vulnerability of an SC’s failure were also included. Fuzzy-based methods first assessed the relative importance weights of the basic input parameters at the bottom of the hierarchy and the risk factors in the middle of the hierarchy. Subsequently, the performance and condition scores were aggregated to develop respective indices. As the consequence of structural failure is high for the SCs serving households with a large number of residents, the final risk index aggregates the vulnerability and consequence at the hierarchy’s top. The developed model was effectively validated by comparing the SCs of high priority with the leaking and repaired SCs in the past. The method will be a useful tool for planning proactive inspection and rehabilitation of SCs of intermittent supply systems to minimize water losses (less than 8% of the national benchmark) in Saudi Arabia and elsewhere.

1. Introduction

Water stress conditions prevail in arid environmental regions around the globe, particularly in some of the African and Gulf countries [1]. Ever-increasing rates of population and industrial growth have headed to the overuse of limited freshwater resources in the Kingdom of Saudi Arabia (KSA) [2], and the production cost of treated (i.e., desalination, reverse osmosis) saline and brackish water is high [3]. Water losses of up to 40 percent were reported in some cities of the KSA [4]. Unlike well-managed and relatively expensive public and privately-owned suppliers in developed countries, it is challenging for the municipalities to achieve the bare minimum of 8% of the KSA’s national water loss benchmark with generous subsidies for public water supplies [5,6,7]. At this point, adopting aggressive asset management strategies for further water loss reductions is certainly ever more strenuous. Facing limited water resources or energy-related issues such as those in other parts of the world, the municipalities found intermittent supply (two to three days per week) as an acceptable water loss solution [8,9]. Conversely, the reliance on intermittent supply declines the reliability of buried infrastructure, leading to high losses and rehabilitation costs [10,11]. With the existing environmental value, water loss reduction is a matter of utmost importance for water utilities in arid regions, such as the KSA.
Predominantly, two types of intermittent water supply (IWS) systems exist, (i) a few hours’ supply in a day, or (ii) a few days’ supply in a week. The first type prevails in South-Asian countries mainly for energy saving [12], while the latter is common to reduce water losses in the Gulf region for conserving diminishing natural resources [6]. Water quality problems in IWS are frequently reported in the literature, such as increasing levels of turbidity, heterotrophic plate count bacteria, and coliform bacteria due to water stagnation, contaminants’ infiltration, and lack of residual chlorine due to long in-house storage [13,14]. Authors in a previous study evaluated the root causes of water quality failures from source to tap for the IWS systems in Qassim, KSA. In addition to the above-stated problems, the reoccurrence of total dissolved solids (TDS) and iron (Fe) in the distribution system through soil intrusion was also observed during the no-supply period. Details can be seen in Haider et al. [15]. As the present research focuses on the structural failure of service connections (SCs) for leakage management, water quality parameters are considered in the context of the structural performance of mains and SCs. As most of the water supplies in the KSA have been using plastic pipes for more than three decades due to their superior reliability (structure and water quality) over steel and cement pipes, this study considered the IWS primarily operating with plastic pipes. Nevertheless, the developed concept is applicable to all types of water mains with the required modifications.
Plastic retains most benefits over steel, cast iron, ductile iron, concrete, and asbestos cement pipes, including corrosion resistance, lowest break rate, resistance to disinfectants, easy installation, durability (up to 100-year life expectancy), low life cycle cost (due to less breakage and easy repairs), sustenance against high traffic loadings, resistance to intrusion of tree roots, low transportation cost due to being lightweight, and safe for public health with non-toxic and inert polymerous characteristics [16]. The common causes of plastic pipe failure include leaks of brass connectors (if used instead of plastic at junctions), the existence of sharp rocks in backfill material, manufacturing defects, detrimental traffic loading due to improper bedding or shallow trench depth, pipe freezing, poor jointing due to the use of inadequate gluing procedures (e.g., insufficient humidity and ignoring manufacturer’s specifications), overheating during jointing, water hammer due to pressure variations (particularly in IWS), and insufficient tightening or inaccurate positioning of a service connection (see details in the subsequent section) [17]. In addition, the corrosion of metal fittings used at SCs on plastic pipes can also lead to structural failure and leakage problems [18].
Identification of leakage points in a water distribution network is a daunting task. In activate leakage control programs for reducing water loss in IWS, leaking points are located with the help of acoustic equipment [19], pressure management through pressure and flow monitoring [6] and sectioning of the network with pressure-reducing valves [20], and water audits [21]. IWS systems reach higher water losses earlier than the continuous systems after an active leakage control. For passive leakage control during the operational phase, continuous pressure monitoring and the use of acoustic equipment is not economically viable in most situations [10]. Reliability-based modeling approaches for water main deterioration use past data of failure incidents to predict failure behavior [22]. When the past data are limited, inspection and rehabilitation (I&R) planning of buried infrastructure using a knowledge-based system is a practical water loss control solution.
Past studies have developed different types of risk-based rehabilitation planning tools for the proactive maintenance of water mains. Some studies used multi-objective optimization as a tradeoff between the investments (rehabilitation, renewal, and replacement) and the benefits of reduction in pipe bursts [23,24,25,26]. D’Ercole et al. [27] used an input–output analysis model for the rehabilitation planning of water mains by optimizing energy consumption, resource availability, and pressure deficit. Other studies used hierarchical approaches to consider physical, environmental, and operational factors that contribute to the deterioration of water mains. Such index-based approaches used a weighting scheme for estimating the relative importance and an aggregation scheme to combine the weights and performance scores of the influencing factors. Finally, the Geographic Information System (GIS) demonstrated the prioritization of all the water mains in the distribution network for proactive rehabilitation. Some studies used the only vulnerability of structural failure [28], while others included factors affecting consequences in risk-based decision-making, e.g., population density and land use [29].
As per the field investigations, most (up to 90%) of the leakage occurs at service connections, including fittings on the water main and the service pipe that connect the individual household to the main [30]. The same outcomes were also received through personal communications with the operational staff responsible for leakage management in the study area (as detailed in the following sections). In addition to energy savings due to less frictional losses, easier installation, and recyclability, plastic mains are less susceptible to leakage in comparison to metallic and cement pipes [31]. The existing rehabilitation planning tools are more useful for metallic and cement pipes, while primary leakage in plastic mains occurs at service connections.
The present study developed a risk-based I&R planning methodology for SCs functioning in IWS systems of arid regions. The main objectives are to, (i) identify important physical, hydraulic, and water quality factors that contribute to leakage at SCs, (ii) develop a risk-based hierarchical bottom-up approach to estimate the risk of SCs’ failure using fuzzy-based decision-making making methods addressing uncertainties due to imprecisions in data and expert judgment, (iii) verify the model results with field data of past SC failures, and (iv) develop GIS-based risk maps exhibiting proactive I&R planning of SCs. For pragmatism, the methodology was applied to a water distribution system of a residential neighborhood in Buraydah city of the Qassim Region in the KSA. The methodology will aid the municipalities in passive leakage control in Qassim and other regions of the KSA.

2. Materials and Methods

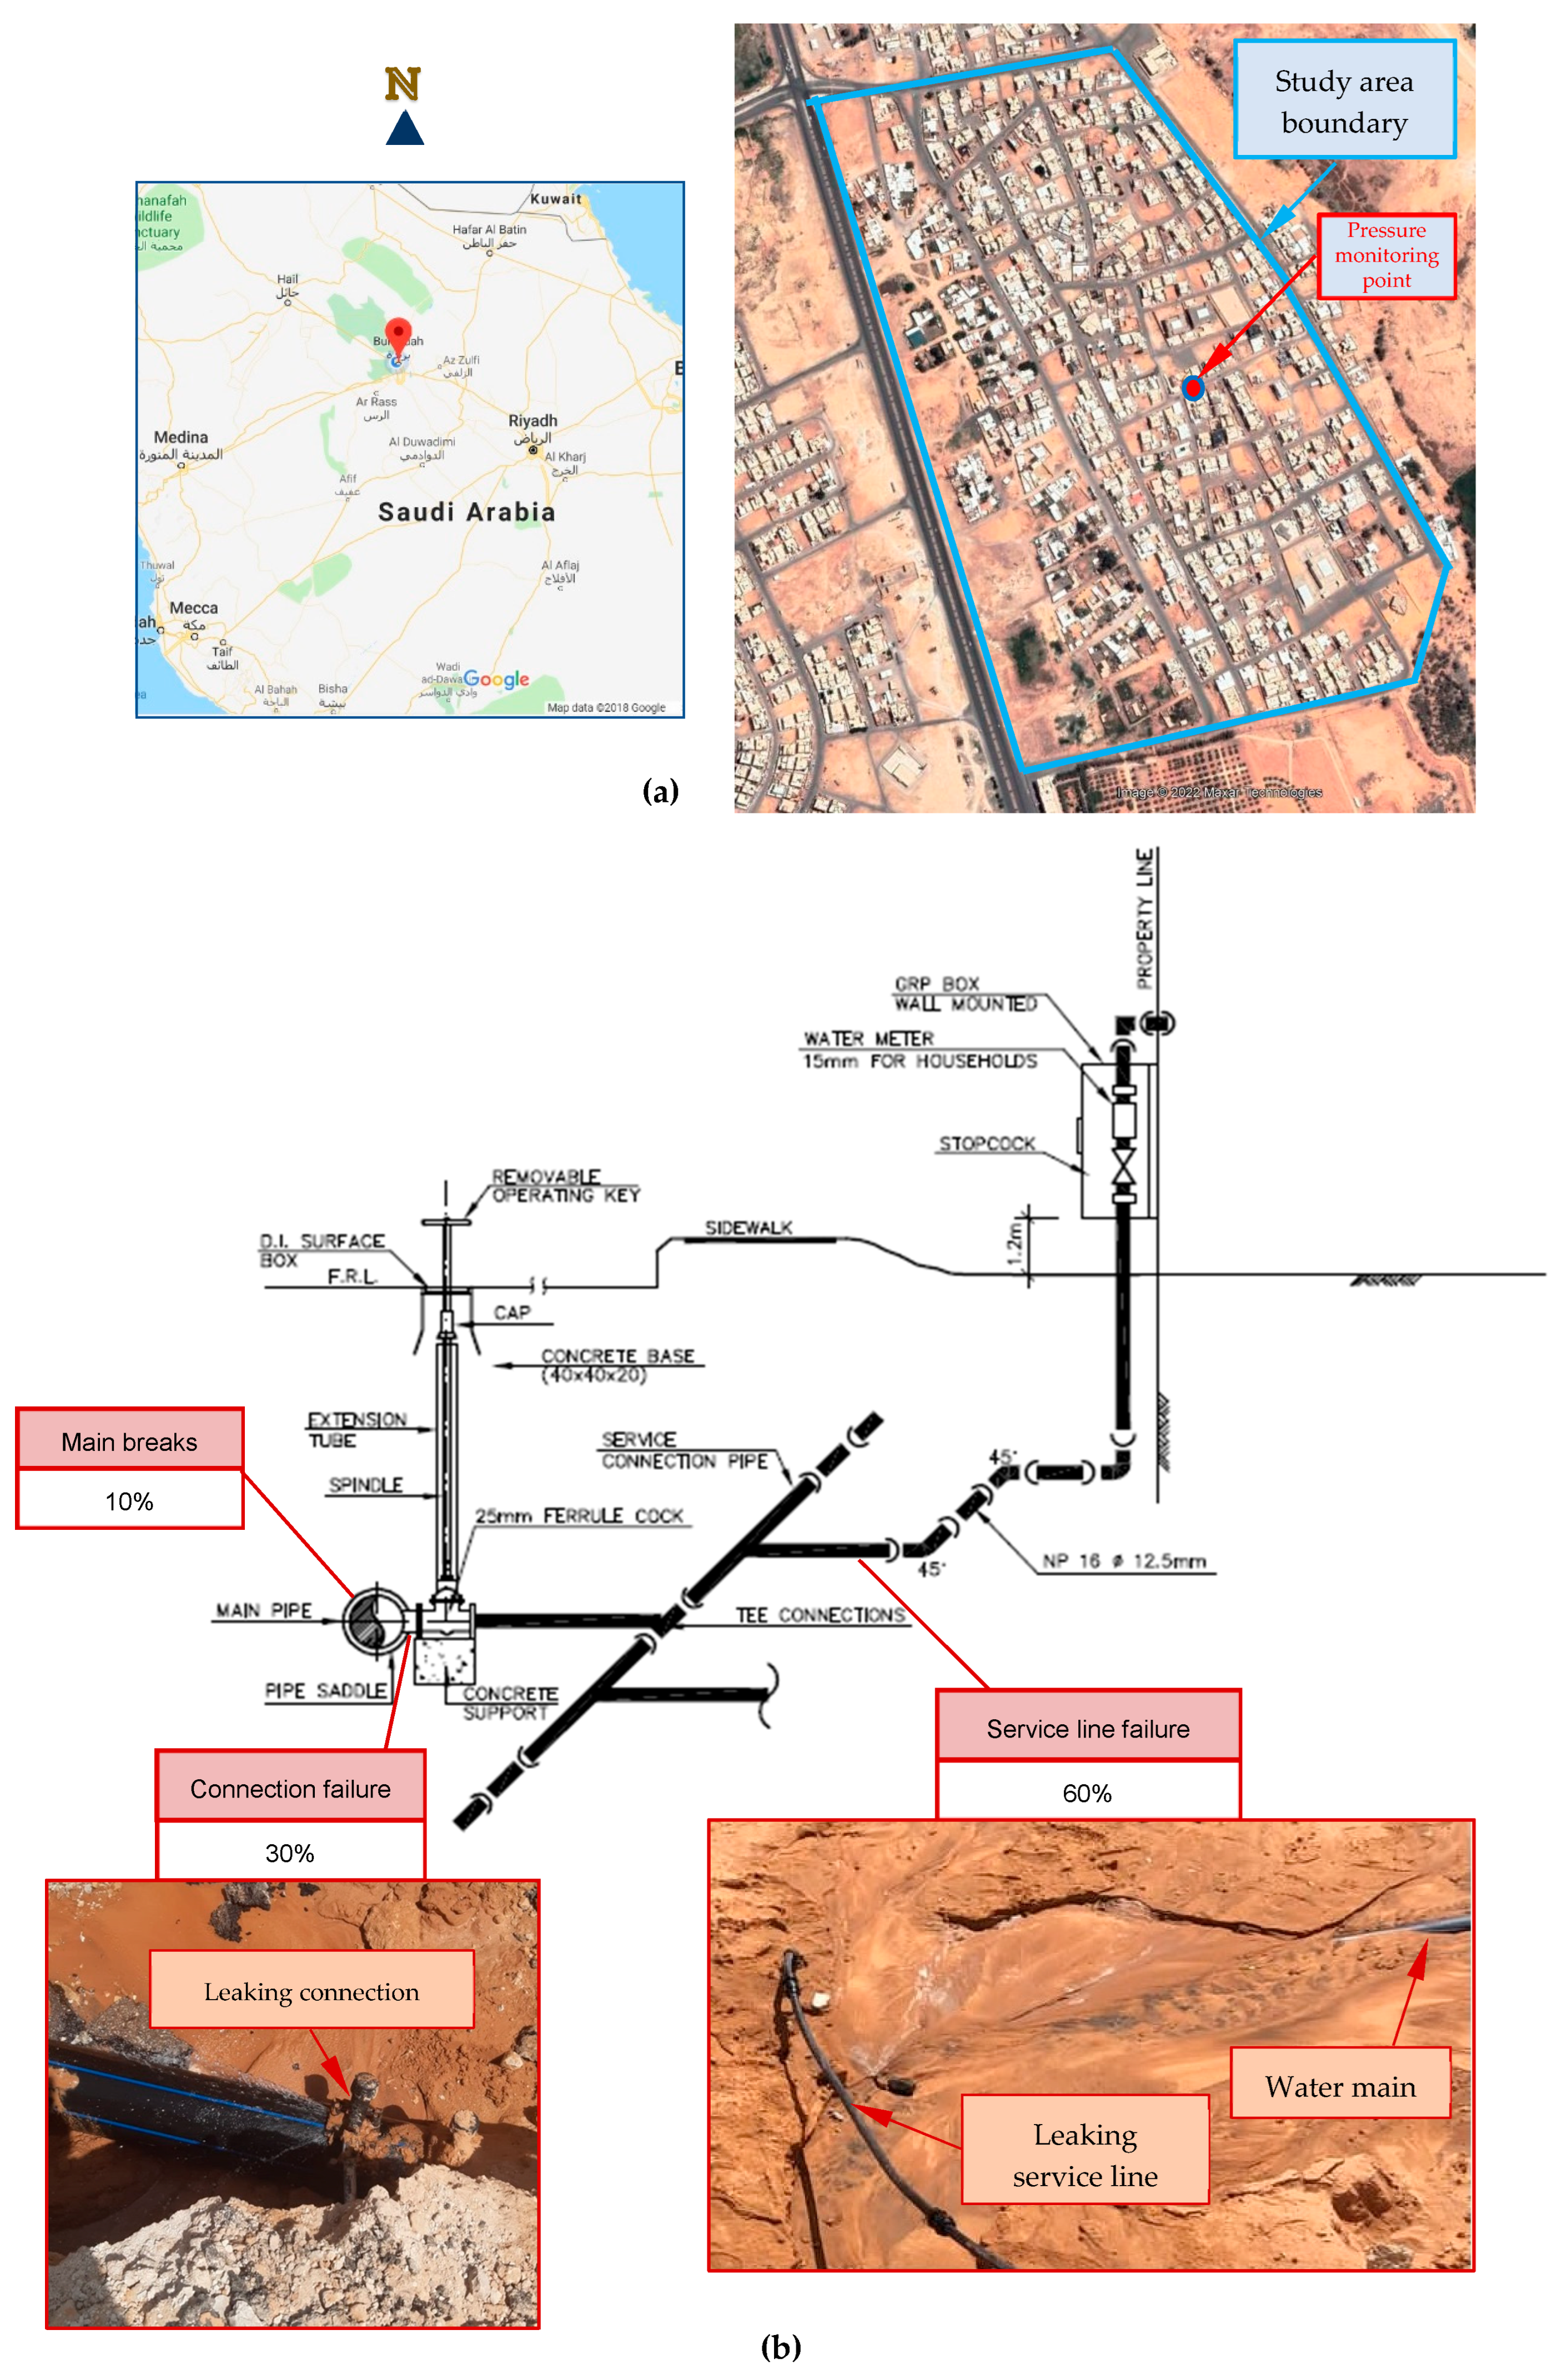
2.1. Study Area and Baseline Data

The selected study area, shown in Figure 1, is an urban residential neighborhood that lies on the East side of the City of Buraydah, which is the capital of Qassim Region in KSA. The ground elevations of the study area lie between 598 m and 618 m above mean sea level (MSL). Most of the city is served by the National Water Company (NWC). Groundwater in the study area is brackish with TDS levels ranging between 800 and 1220 mg/L [3,32], which is treated, through reverse osmosis, prior to supply. The type of water supply is intermittent with 2 days supply per week. The distribution network within the boundaries of the study area (see Figure 1a) consists of 366 water mains of size range between 110 mm and 225 mm. All the water mains are made of plastic material and distributed as <1% high-density polyethylene (HDPE), 2.5% unplasticized polyvinyl chloride (UPVC), and over 96% polyethylene (PE) pipes. The age of the pipes varies from 20 to 27 years. Personal communication with the NWC staff revealed that distribution networks in the city are facing high water losses (supplied–measured) and need efficient solutions for water loss control. A recent survey in 2020 conducted by the NWC found over 40% nonrevenue water in the study area at test pressure ranging between 17 m and 21 m (personal communication with NWC staff). Leakage at service connections and high operating pressures were the primary reasons for such a high loss of supplied water.
The distribution network serves 371 customers (households) through the service connection shown in Figure 1b. All the service connections connect the water supply main with the in-house plumbing system using allied fittings in the following sequence, (i) clips connected with mainline, (ii) ball valve, (iii) male–female adopter, (iv) 25 mm diameter PE pipe, (v) male–female adopter elbow, (vi) 3/4″ diameter SS pipe, (vii) 3/4″ brass elbow, (viii) 3/4″ diameter brass or stainless steel nipple, (ix) 3/4″ diameter ball valve, (x) 7 cm long 3/4″ diameter brass tank connector, (xi) 3/4″ diameter water meter, (xii) 7 cm long 3/4″ diameter brass tank connector, (xiii) 3/4″ diameter brass elbow, (xiv) 3/4″ diameter stainless steel pipe (30 cm length), and a fitting of homeowner’s choice to underground storage tank. After the infrastructure development of the neighborhood, service connections were provided with the start of the construction of each house. Consequently, some of the service connections are as old as 26 years old, while others were recently provided to newly constructed homes around 6 years ago.
The Operation and Maintenance Division of NWC, KSA receives regular complaints regarding service connection failure. As this division is serving most parts of the public water supply in the entire city, the data for 21 complaints registered during 2019 and 2021 were obtained for model validation. The personal communication with the NWC staff revealed that only 10% of the leakage complaints occur due to water main failure, while the remaining 90% of complaints originate from service connection failure. In total, 30% of these complaints (either reported by operational staff or customers) originate from the failure of the first three components stated above, while the rest of the 60% register in case of a service pipe break.

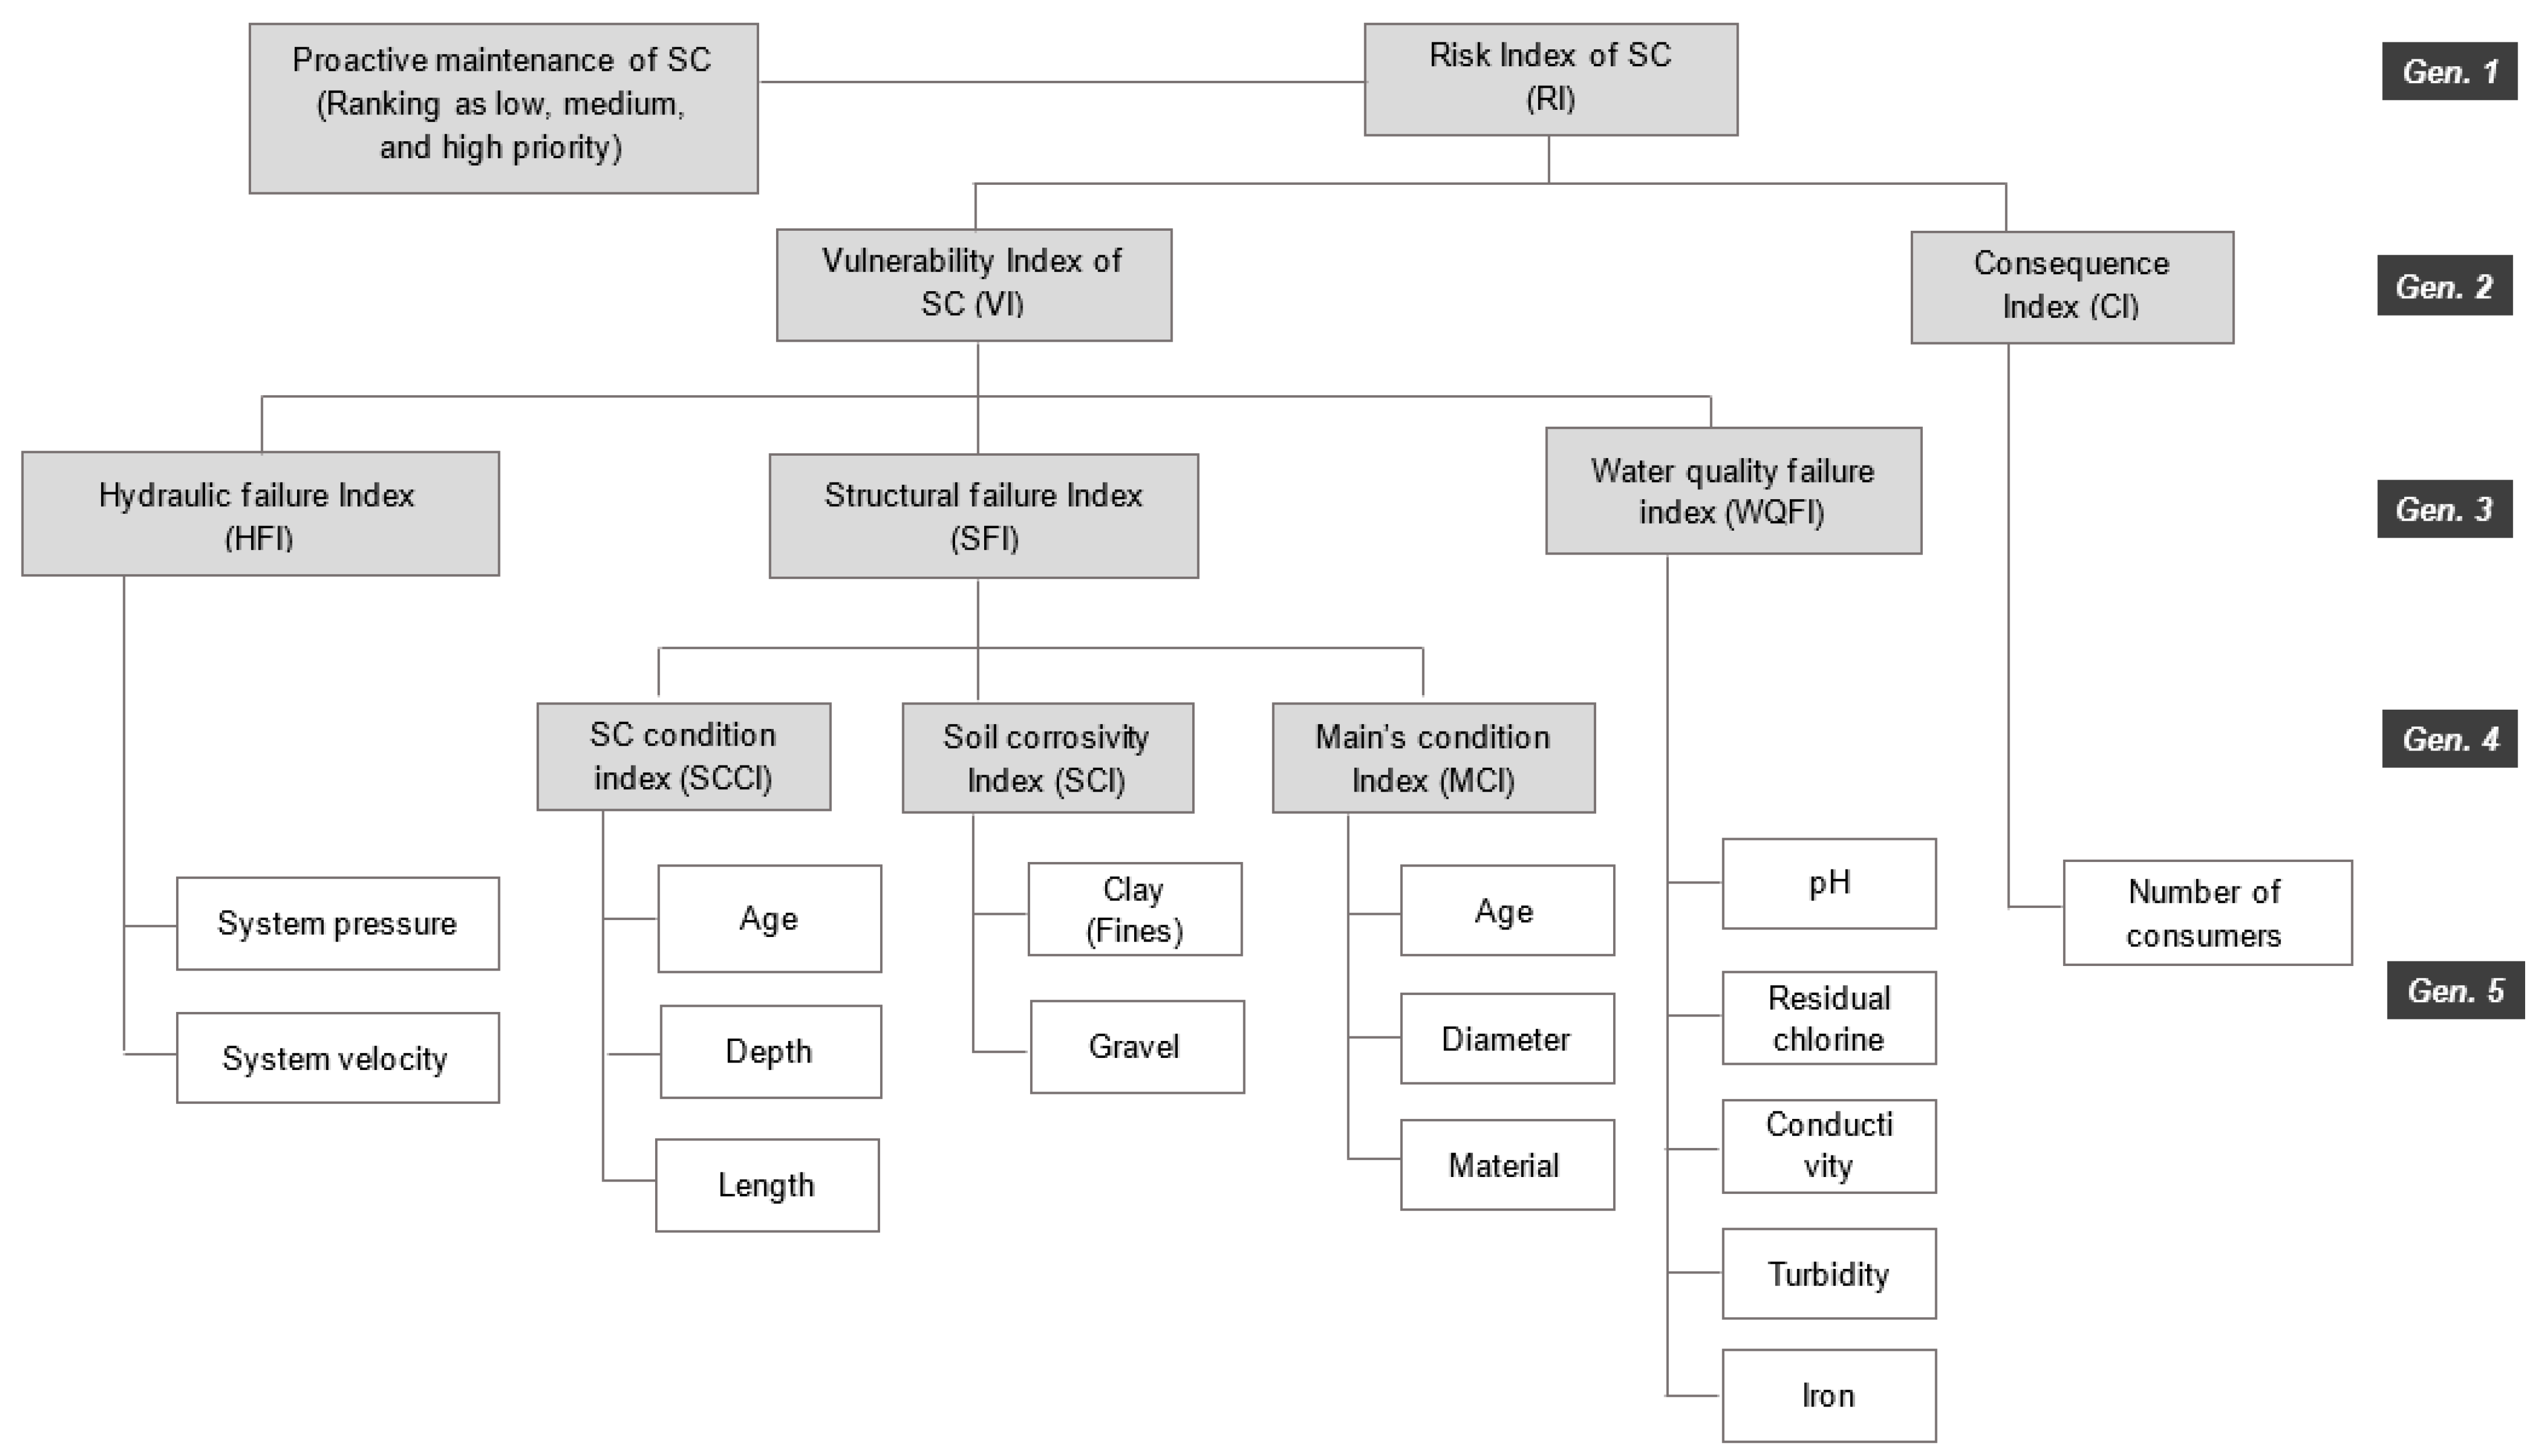
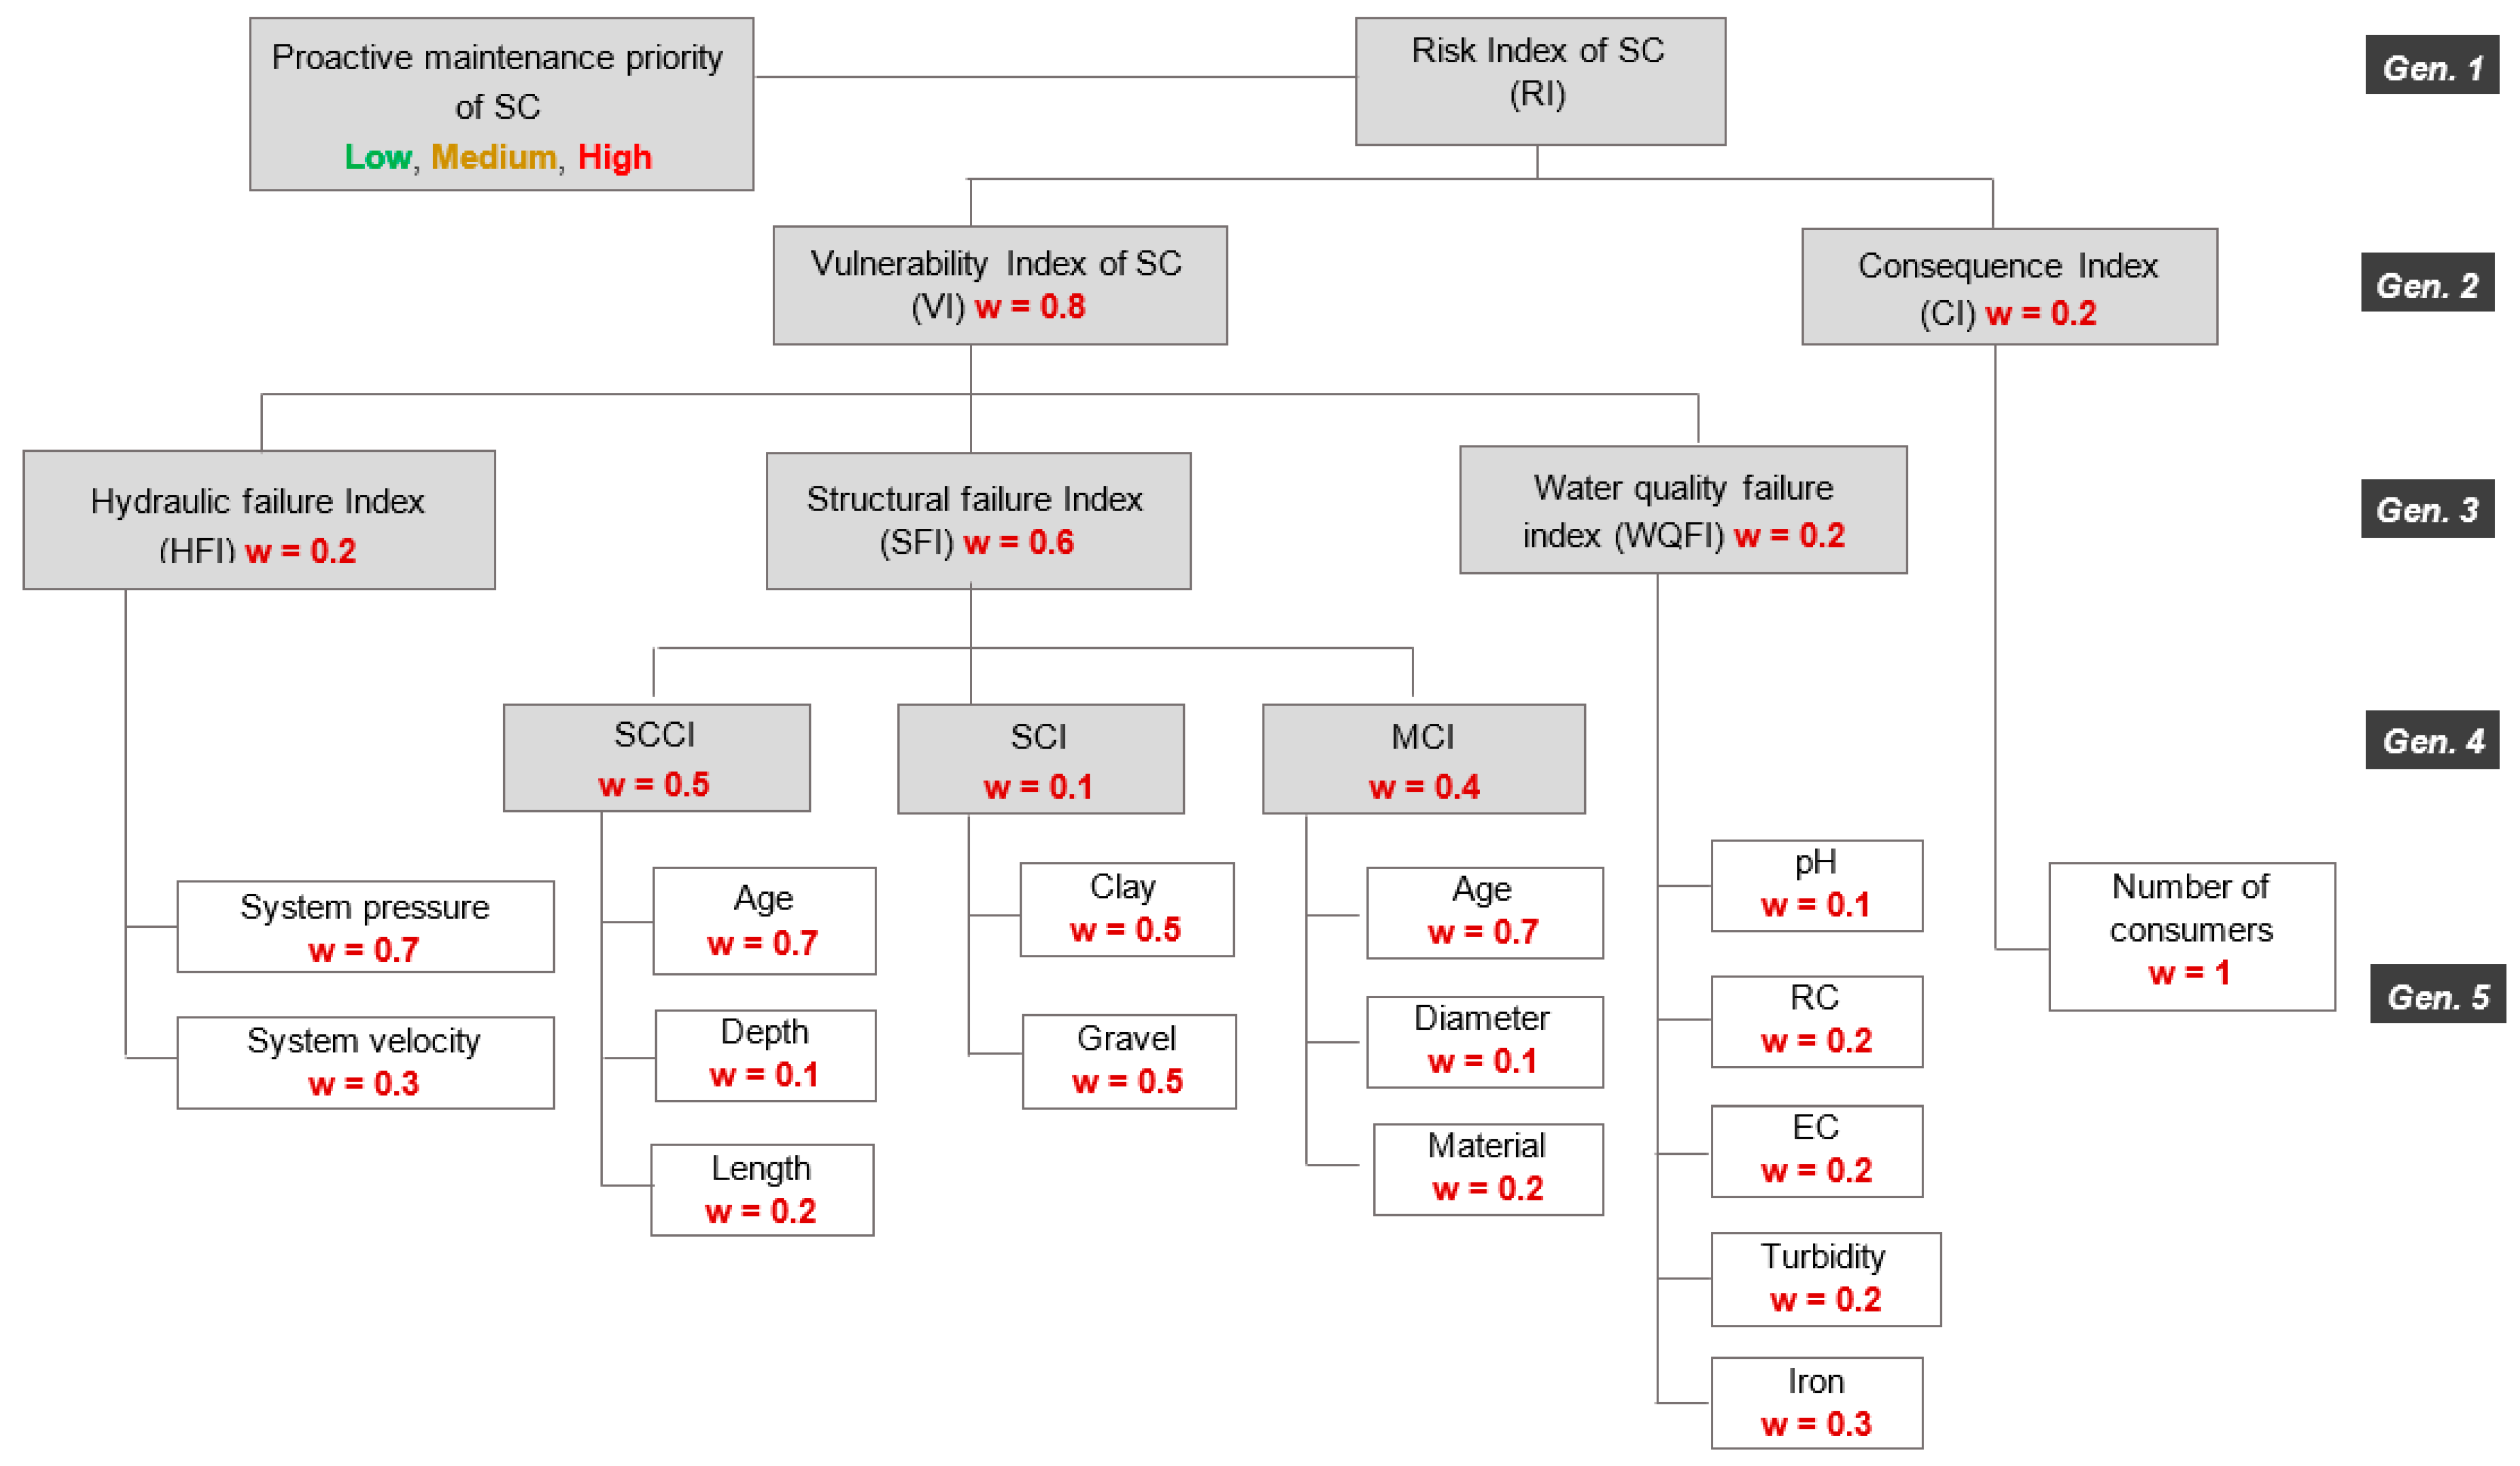
2.2. Risk-Based Inspection and Rehabilitation Methodology

Figure 2 illustrates the 5-generation hierarchical-based decision support system (DSS) developed in the present research for I&R planning of CSs in IWS systems. The basic structural and hydraulic parameters of Gen. 5 at the bottom of the hierarchy are the primary inputs and essentially the main building blocks of the DSS. Structural integrity of the water main plays an important role in the vulnerability of SCs as there is a lesser chance of SC failure if the water main is structurally stable. Therefore, three sub-indices at Gen. 4 are used to assess the structural integrity of the water mains. As the hydraulic performance of the main network contributes to the vulnerability of SCs, high pressure and velocity can result in high leakage at SCs. The other two sub-indices at this level are soil corrosivity index (SCI) and main condition index (MCI). Hydraulic failure index (HFI), structural failure indices of mains and service connections at Gen. 3 collectively estimate the overall vulnerability index (VI) of an SC. For Gen. 2, the consequence index (CI) takes in the number of consumers in a household. Finally, an overall risk index prioritizes each service connection for proactive maintenance scheduling. Table 1 presents the universe of discourse (UoD) of all the input parameters of Gen. 5. The baseline data were obtained from the Office of Water Directorate in Buraydah.

2.3. Vulnerability of Service Connections

Vulnerability defines the potential failure of a service connection leading to leakage, which can occur due to a hydraulic or structural failure or the combined impact of both. In addition, some water quality parameters contribute to such failure. This section presents the estimation and significance of basic input parameters (Gen. 5 of Figure 2) for each sub-index. Weight estimation and aggregation process are explained in the following section. High values of all the indices at Gen. 3 and Gen. 4 correspond to higher vulnerability.

2.3.1. Hydraulic Failure

Both the pressure at nodes and velocities in the pipes can increase the leakage at any service connection. As the distribution system operates with intermittent supply, each household essentially stores the water in an underground storage tank. Therefore, 5 m pressure at a service connection is sufficient. As per a past study, doubling the pressure can theoretically increase the leakage by up to 40% in water mains [33]. Pressure higher than 15 m is considered “high” in terms of hydraulic failure. Likewise, velocities higher than 1 m/s in water mains may also contribute to leakage.
To estimate pressure and velocity at the SCs, hydraulic simulations were performed using well-known EPANET 2.2 public domain software developed by the United States Environmental Protection Agency [34]. Nodal demand at each junction was estimated using the record of meter readings of all the service connections served by the node. For nodal demand estimation, the Voronoi diagram method was adopted to allocate the service connections to each node. Water main data, including pipe material, diameters, and lengths, were obtained from the Water Directorate of Qassim Region. Figure 3 presents the summary of hydraulic simulation results. Finally, hydraulic failure index (HFI) was estimated by aggregating estimated scores at each service connection using corresponding weights.

2.3.2. Structural Failure

Structural failure of a service connection is subject to deterioration of the water main, assembly used to make the service connection, and the supply pipe from the assembly to the meter (also see Figure 2). The structural failure index (SFI) consisted of three sub-indices, including the service connection condition index (SCCI), soil corrosivity index (SCI), and water main condition index (MCI). The SCCI, caused by assembly or service line failure, was estimated with the help of age (year of installation), depth of connection, and length of service connection pipe. Installation age was reported as the most significant parameter for structure failure [35]. Longer pipes can go through beam failure [36]. The depth of the service connection defines the backfill height, which is important to distribute traffic loading (thrust force) on the soil instead of the pipe. As the thrust force increases in the case of larger diameter mains [37], the service connections in the study area are small-sized 25 mm diameter PE pipes, which potentially face low thrust forces at depths of 1 m or more.
Both the mains and service connection pipes are plastic pipes. Percentages of fines (clay) and gravel play an important role in the structural performance of pipes. Clay particles (<0.002 mm in size) define the drainage characteristics as well as the presence of sulfate-reducing bacteria in soil, which cause corrosion of pipes. A percentage of gravel with sharp edges can break the plastic pipes [38]. Therefore, SCI was estimated using the percentages of clay and gravel in the soil of the study area.
The MCI, related to the water main failure, was estimated for each service connection using age of installation, diameter, and pipe material. Older and larger mains have more potential for structural failure and consequently high leakage. Fortunately, all the distribution networks in the study area operate with plastic pipes, resulting in a minimum contribution of material to structural failure.

2.3.3. Water Quality Failure

There are several water quality parameters that can affect the structural condition of water mains’ material. Out of the relevant parameters, the regular monitoring data at the Water Directorate Office were available for the following parameters, Electrical conductivity (EC), pH, turbidity, residual chlorine, and iron. These water quality parameters can potentially increase the vulnerability of a service connection failure. EC is a measure of dissolved salts, cations (calcium, magnesium, sodium, potassium), and anions (chlorides, sulfates, nitrates, carbonates, and bicarbonates). Scale formation on the walls of plastic pipes due to precipitation of calcium carbonate was reported in a recent study in Algeria [39], which further leads to corrosion and finally structural failure [40]. pH represents the aggressiveness of water, which primarily causes wall leaching and deterioration in cement and metal pipes [18]. Therefore, pH can also cause corrosion of metal fittings on plastic pipes used for the SC in the study area.
Water with high turbidity contains suspended solids, which can deposit at the fittings of SC and may contribute to structural failure. Moreover, turbidity > 1 NTU (Nephelometric turbidity units) in supplied water demands high residual chlorine. As high residual chlorine can increase the rate of corrosion [41], turbidity indirectly contributes to corrosion. Considering the importance of residual chlorine for pathogen control in water supply, both the positive and negative polarities were considered in the present study (refer to Table 1). Iron values higher than 0.05 mg/L may lead to the growth of an iron-based bacterium (Crenothrix) due to accumulation in plastic pipes and corrosion of metal fittings at service connections [42].

2.4. Consequence

The household units accommodating large family sizes (e.g., more than 8 residents or multiple families living in two or more stories) generally consume large water quantities, as reflected in their meter readings. The impact of the reduction in flow rate or head due to a leaking connection is greater in the large household in comparison to a single or two-story house with four to five residents. Using monthly consumption records of meter readings and 250 L/capita/day consumption [43], the number of consumers for each service connection was calculated. Consequence rating was established as low for a service connection if the number of residents is less than 8 and high in the case of more than 12 residents. The range of residents based on consumption records was found between 1 and 114 (three-story residential apartments).

2.5. Risk Index

Finally, the risk index (RI) for each service connection was estimated by aggregating the scores and weights of vulnerability and consequence indices. Based on the risk classification given in Table 2, all the SC were ranked for proactive maintenance. The risk classification used in the present study matches the classification used by Francisque et al. [41] for rehabilitation and renewal planning of water mains in smaller Canadian utilities, i.e., low RI < 0.30, medium RI = 0.30 to < 0.45, and high RI > 0.45. The SCs with high RI need to be inspected and rehabilitate on the highest priority basis to minimize leakage losses in the network as well as structural complaints.

2.6. Weighting and Aggregation Process

Fuzzy Analytical Hierarchy Process (Fuzzy-AHP) estimated the importance weights of the input parameters and indices at each generation level. The Fuzzy Weighted Sum Method (Fuzzy-WSM) aggregated the parameters and indices to generate the top-level risk index (RI) of service connection (RI-SC) and ranked the SCs according to priorities for proactive maintenance.

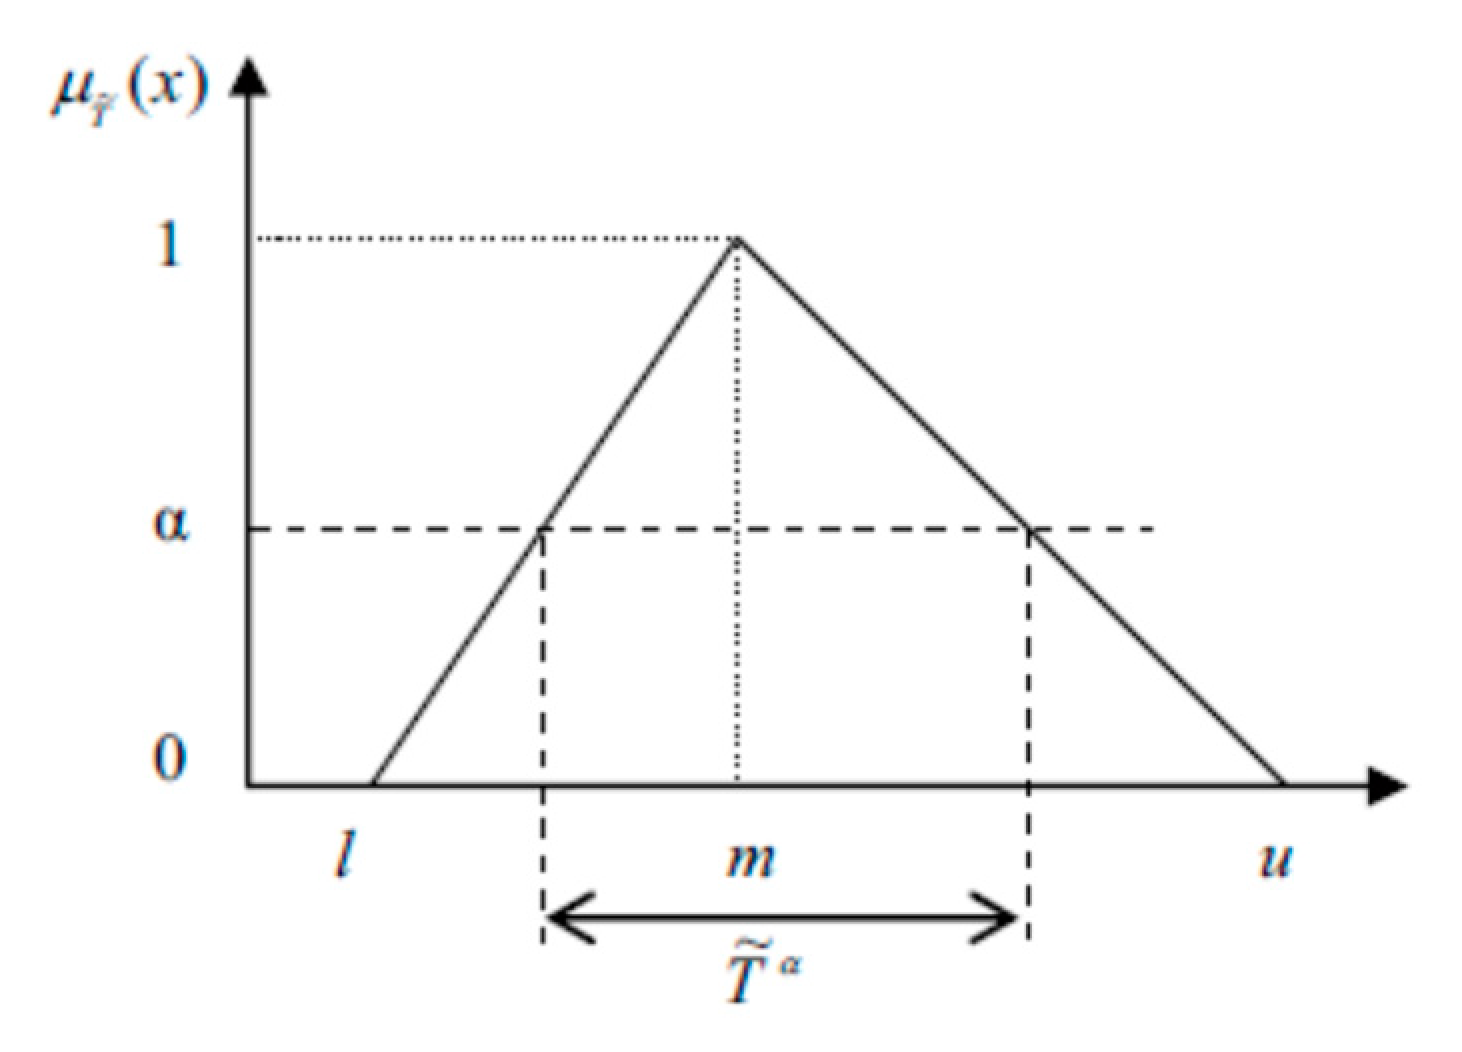
2.6.1. Fuzzy Analytic Hierarchy Process

Fuzzy-AHP performed a pairwise comparison amongst the risk factors, including basic inputs at Gen. 5 and indices at other generations shown in Figure 2. The method adopted linguistic terms (e.g., ‘essential important’ and ‘extreme unimportance’), characterized by triangular fuzzy numbers (TFN) as shown in Figure 3, to establish priorities and/ or posteriorities between the risk factors and basic inputs. TFNs are simple to use and effectively approximated linguistically defined subjective judgments of decision-makers (DMs) in past studies on water resources management [44]. Five DMs, who were highly academically qualified and have several years of experience in water supply system design, operation, and management, used TFNs to approximate their subjective opinions. The present study used the α-cut based Fuzzy-AHP method to minimize the possible uncertainties in the fuzzy numbers designated by the DMs. The α-cut approach checks the consistency of the pair-wise matrix established by each DM and sufficiently accommodates the possible differences in the fuzzy ranges chosen by the DMs.
Figure 3. α-cut of a triangular fuzzy number T ˜ (Source: [45]).
Water 14 03994 g003
The following stepwise procedure of Fuzzy-AHP method was used to estimate the relative fuzzy weights of the inputs and risk factors [45].
Step 1:
Pairwise comparison matrix.
Table 3 provides the 9-point rating scale used by K number of DMs to develop the pairwise comparison matrix at each generation level. Initially, each DM completed one fuzzy reciprocal judgment matrix A ˜ k   as:
A ˜ k = [ a ˜ i j ] k
where i is the input or risk factor and j represents its number in the matrix, j = 1,2, …, n.
A complete fuzzy reciprocal matrix R ˜ k was defined as:
R ˜ k = [ r ˜ i j ] k
where r ˜ i j denotes the relative difference of importance amongst the inputs (or factors) i and j and is a TFN as r ˜ i j = ( l i j , m i j , u i j ) . Here, r ˜ 11 = ( 1 , 1 , 1 ) ,   i = j   and   r ˜ i j = 1 r ˜ i j   k ,   i = j = 1 , 2 , , n .  
Step 2:
Consistency check.
The following equation evaluated the consistency in each DM’s opinion on each factor and the fuzzy positive reciprocal matrix, R ˜ k = [ r ˜ i j ] , was developed, where r ˜ i j = ( α i j , β i j , γ i j ) :
C I = λ m a x n n 1
where λ m a x is the matrix’s dimension representing the maximum Eigenvalue.
Next, the following equation estimated the consistency ratio (CR):
C R = C I R I
where RI represents the random index obtained from Table 4, which corresponds to n number of risk factors at each generation in Figure 2. A value of CR < 1 depicts the consistency in DMs’ opinions.
Step 3:
Fuzzy weights estimation.
For each decision maker, the following equation was applied to the positive matrix ‘k’:
T ˜ α = [ ( m 1 ) α + l ,   u ( u m ) α ] , 0 1
R ˜ m k = [ r ˜ i j ] m k was estimated by setting = 1 , while the lower bound R ˜ l k = [ r ˜ i j ] l k and the upper bound R ˜ u k = [ r ˜ i j ] u k were estimated by setting = 0 .
The weights for all risk factors allocated by all the DMs were estimated by means of Equation (1) and the following equation:
w i = ( j = 1 n a i j ) 1 / n j = 1 n ( j = 1 n a i j ) 1 / n
where w i represents the weight of each risk factor and W = ( w i ) , i = 1,2, …, n is the weight vector.
Equation (6) was applied to the l, m, and u bounds of TFNs to estimate the weight vertices as W l k = ( w i ) l k , W m k = ( w i ) m k , W u k = ( w i ) u k .
The smallest and largest possible constants S l k and S l u k were determined to minimize the weights’ fuzziness using the following equations:
S l k = m i n { ( w i m k w i l k | 1 i n ) }
S u k = m a x { ( w i m k w i u k | 1 i n ) }
Next, the following equation estimated the lower and upper bounds of the weight vectors as:
w i l * k = S l k w i l k , i = 1 ,   2 , , n
w i u * k = S u k w i u k , i = 1 ,   2 , , n
Lastly, Equation (11) estimated the fuzzy-weighed matrix for each DM as:
W ˜ i k = ( w i l * k , w i m * k , w i u * k ) ,   i = 1 ,   2 , , n
Step 4:
Combined judgment of all DMs.
The fuzzy weights matrices from Equation (11) were combined as:
W ¯ i ˜ = 1 K ( W ˜ i 1 W ˜ i 2   W ˜ i k )
where W ¯ i ˜ is the aggregated fuzzified weight of the input (or risk) factor i based on the combined judgments of K number of DMs.

2.6.2. Aggregation Method

Fuzzy Weighted Sum Method (Fuzzy-WSM) aggregated the estimated performance scores (S) for each input (or risk) factor and their corresponding weights estimated by Fuzzy-AHP. After obtaining all the performance scores for each service ranged between 1 and 10, the indices at each generation level in Figure 2 were estimated using the following equation:
I = i n S ^ i j w ^ i ,   i = 1 ,   2 ,   3 ,   ,   m .
where I is the index value, S ^ i j is the performance score of the input (or risk) factor as a TFN given in Table 1, and w ^ i is the corresponding weight from Equation (12).

2.7. Risk Prioritization Using Spatial Mapping

After estimating the indices, ArcGIS Version 10.8 spatially displayed risk priorities (low, medium, and high) for all the SCs to help the field staff plan their inspection visits.

3. Results

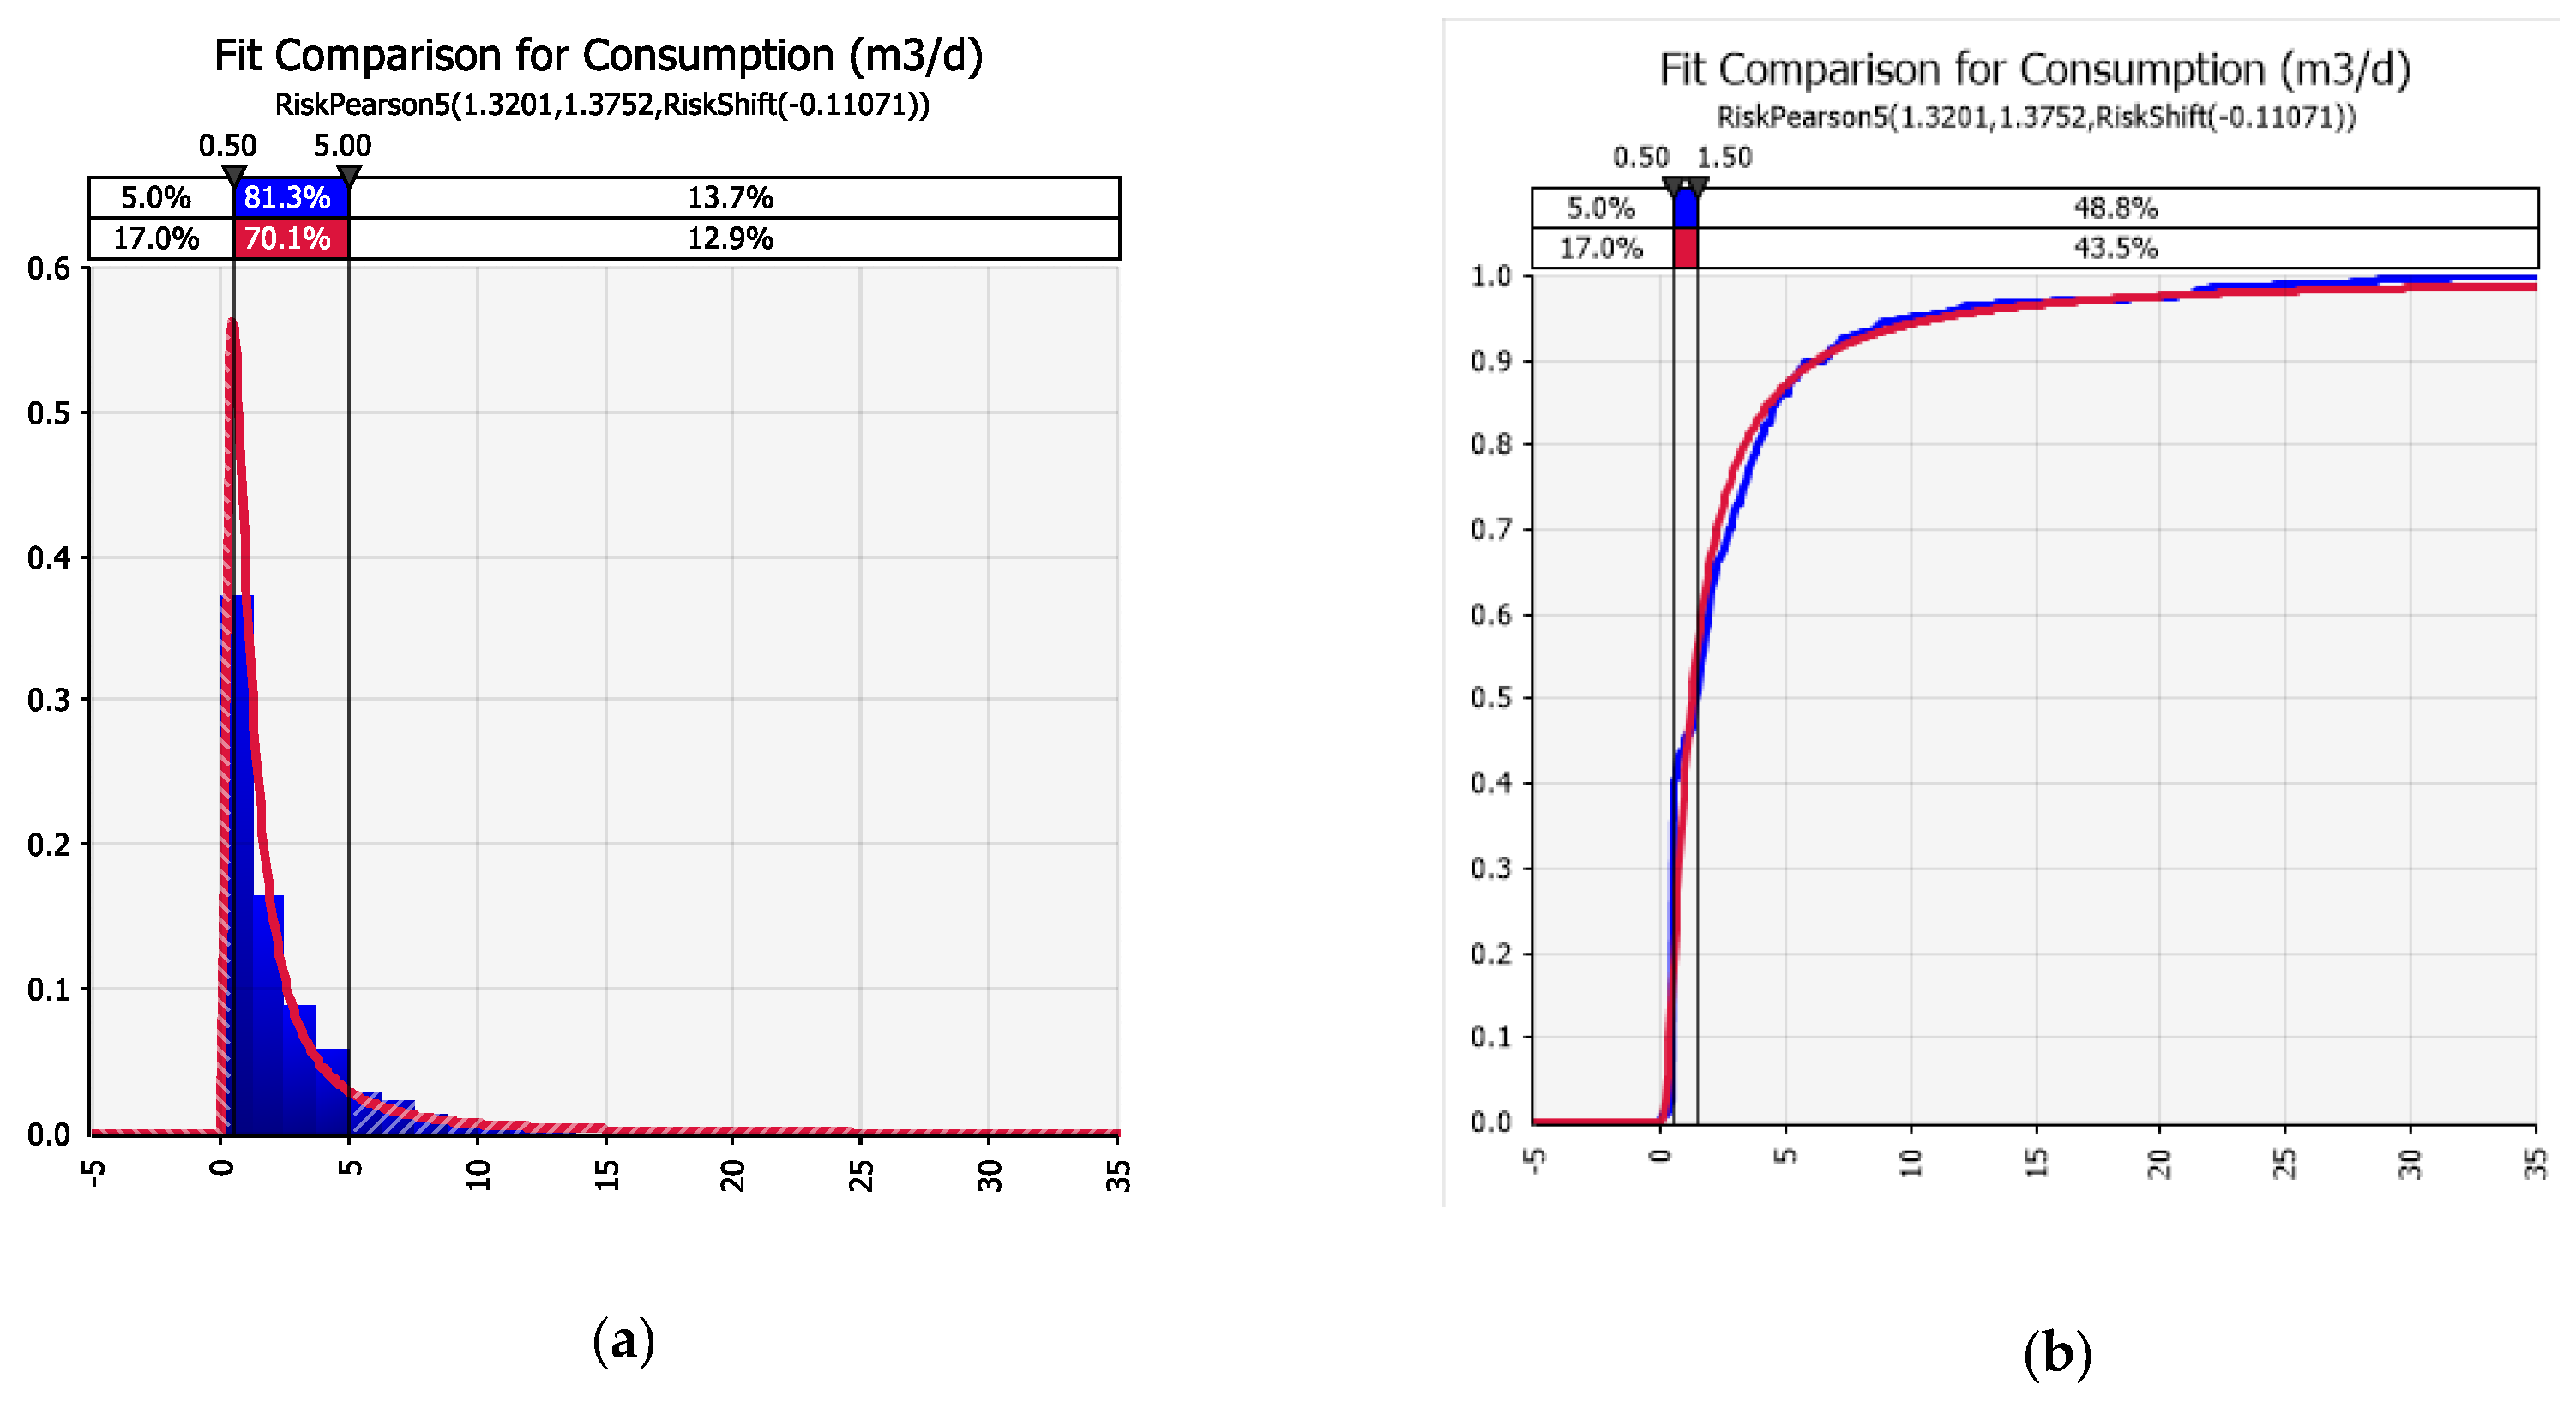
3.1. Hydraulic Capacity

To develop the hydraulic simulation model for the study area, monthly water meter records and the required data (length, material, and diameter of the water mains) for the distribution network were obtained. EPANET 2.2 simulations generated the pressures at each node and velocity in each water main. A Voronoi diagram apportioned the SCs served by each node for pressure estimation, while the water mains connection stated the velocity at a service connection. The hydraulic model was validated by comparing the estimated pressure (13.1 m) with the measured pressure (13–14.9 m range) observed by the field staff at the highlighted node in Figure 1. Figure 4 shows the percentage distribution of hydraulic parameters at the SCs. It can be seen that the pressure lay in the medium range (5–15 m) at 61% of the service connections, while the velocity was found low (<0.2 m/s) in over 75% of cases. Figure 5 shows that water consumption fits the Pearson five distribution. Figure 5a illustrates that 85% of the households consume less than 5 m3/day and around 50% consume less than 1.5 m3/day in the service area.

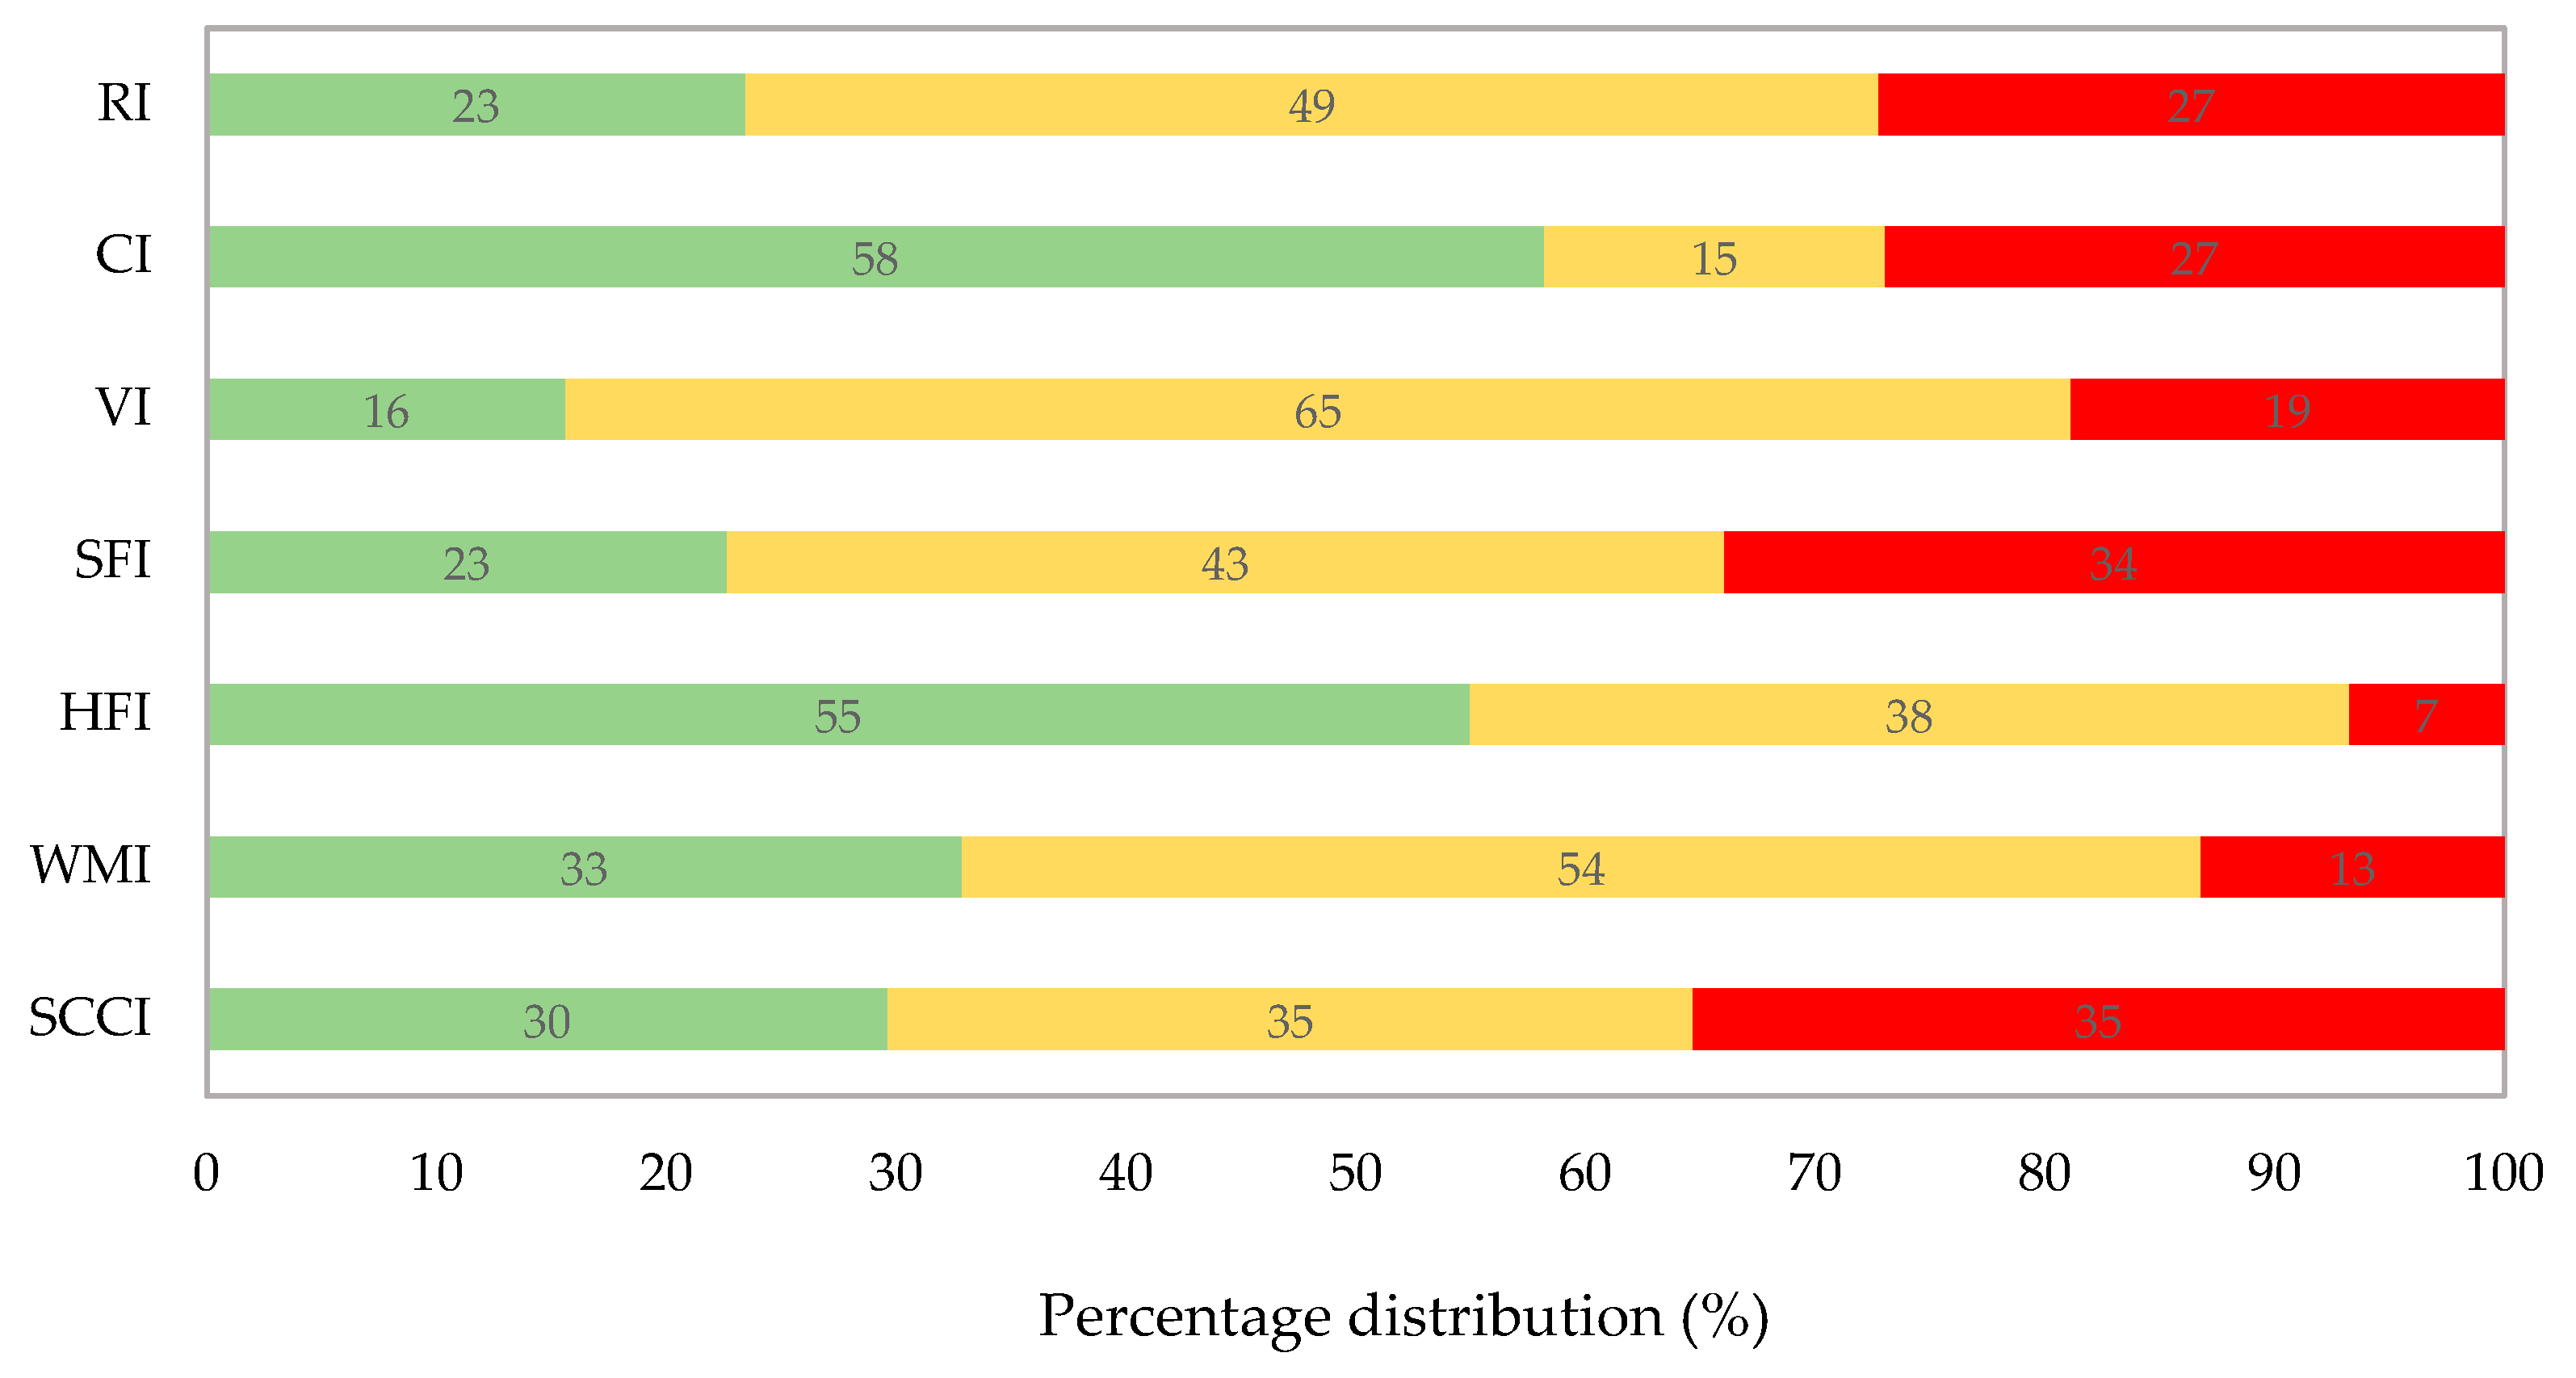
3.2. Performance, Condition, and Risk Indices

Figure 6a,b show the age of water mains and service connections. More than 85% of the water mains are over 20 years of age, while around 50% of the SCs were installed 15 years ago. The fuzzy-AHP methodology described in Section 2.6.1 was used to develop the weighting scheme at all generation levels. The CR values for all the decision matrices filled by the DMs were found to be less than one. Figure 7 presents the estimated weights for the input variables at Gen. 5 and indices at Gen. 2 to Gen. 4. It can be seen that pressure was given higher importance weight over velocity as it plays an important role in leakage management. For SCCI and MCI, age (estimated from installation year) was given significant importance over depth, length, and diameter. Pipe material obtained less weight than expected as the DMs were informed about the present practice of the use of plastic pipes in the entire KSA.
For each service connection, performance scores were determined by mapping the actual values of hydraulics, physical condition, soil corrosivity, and water quality parameters, determined from hydraulic simulations and monitoring reports, to the UoD defined in Table 1. Table 5 presents an example of the performance scores translated to fuzzy scores and aggregated indices using Fuzzy-WSM as described in Section 2.6.2 for the SCCI of some selected SCs. The rows highlighted in red represent the SCs that have already been repaired in response to a service complaint or routine maintenance.
Figure 8 summarizes the percentages of the low, medium, and high priority levels of all the indices estimated for 371 service connections in the study area. It can be seen that more than 55% of SCs achieved low HFI, while WQFI for the entire service area was found to be medium. The condition levels (low, medium, and high) were found to be equally distributed for the SSCI (also see Table 5 for examples). The year of installation (age) played the most significant (with an importance weight of 0.7) role in defining the SSCI of a service connection. The length of a service pipe widely varies from 1 m to around 62 m, depending on the siting of a house.
Around 54% of the SCs obtained a “medium” score of WMI. Once again, the age of the mains was given the highest importance by the decision-makers in comparison to diameter and material. The HFI was found to be “low” due to medium (5–15 m) pressure and low (<0.2) velocities for most of the SCs. SCI was found to be “low” throughout the distribution network. After integrating the SCCI, SCI, and MCI scores, SFI was found to be “high” for 34%, “medium” for 43%, and “low” for only 23 percent of SCs (also see Figure 8). VI, CI, and RI are explained in the following section with their geographical illustrations.

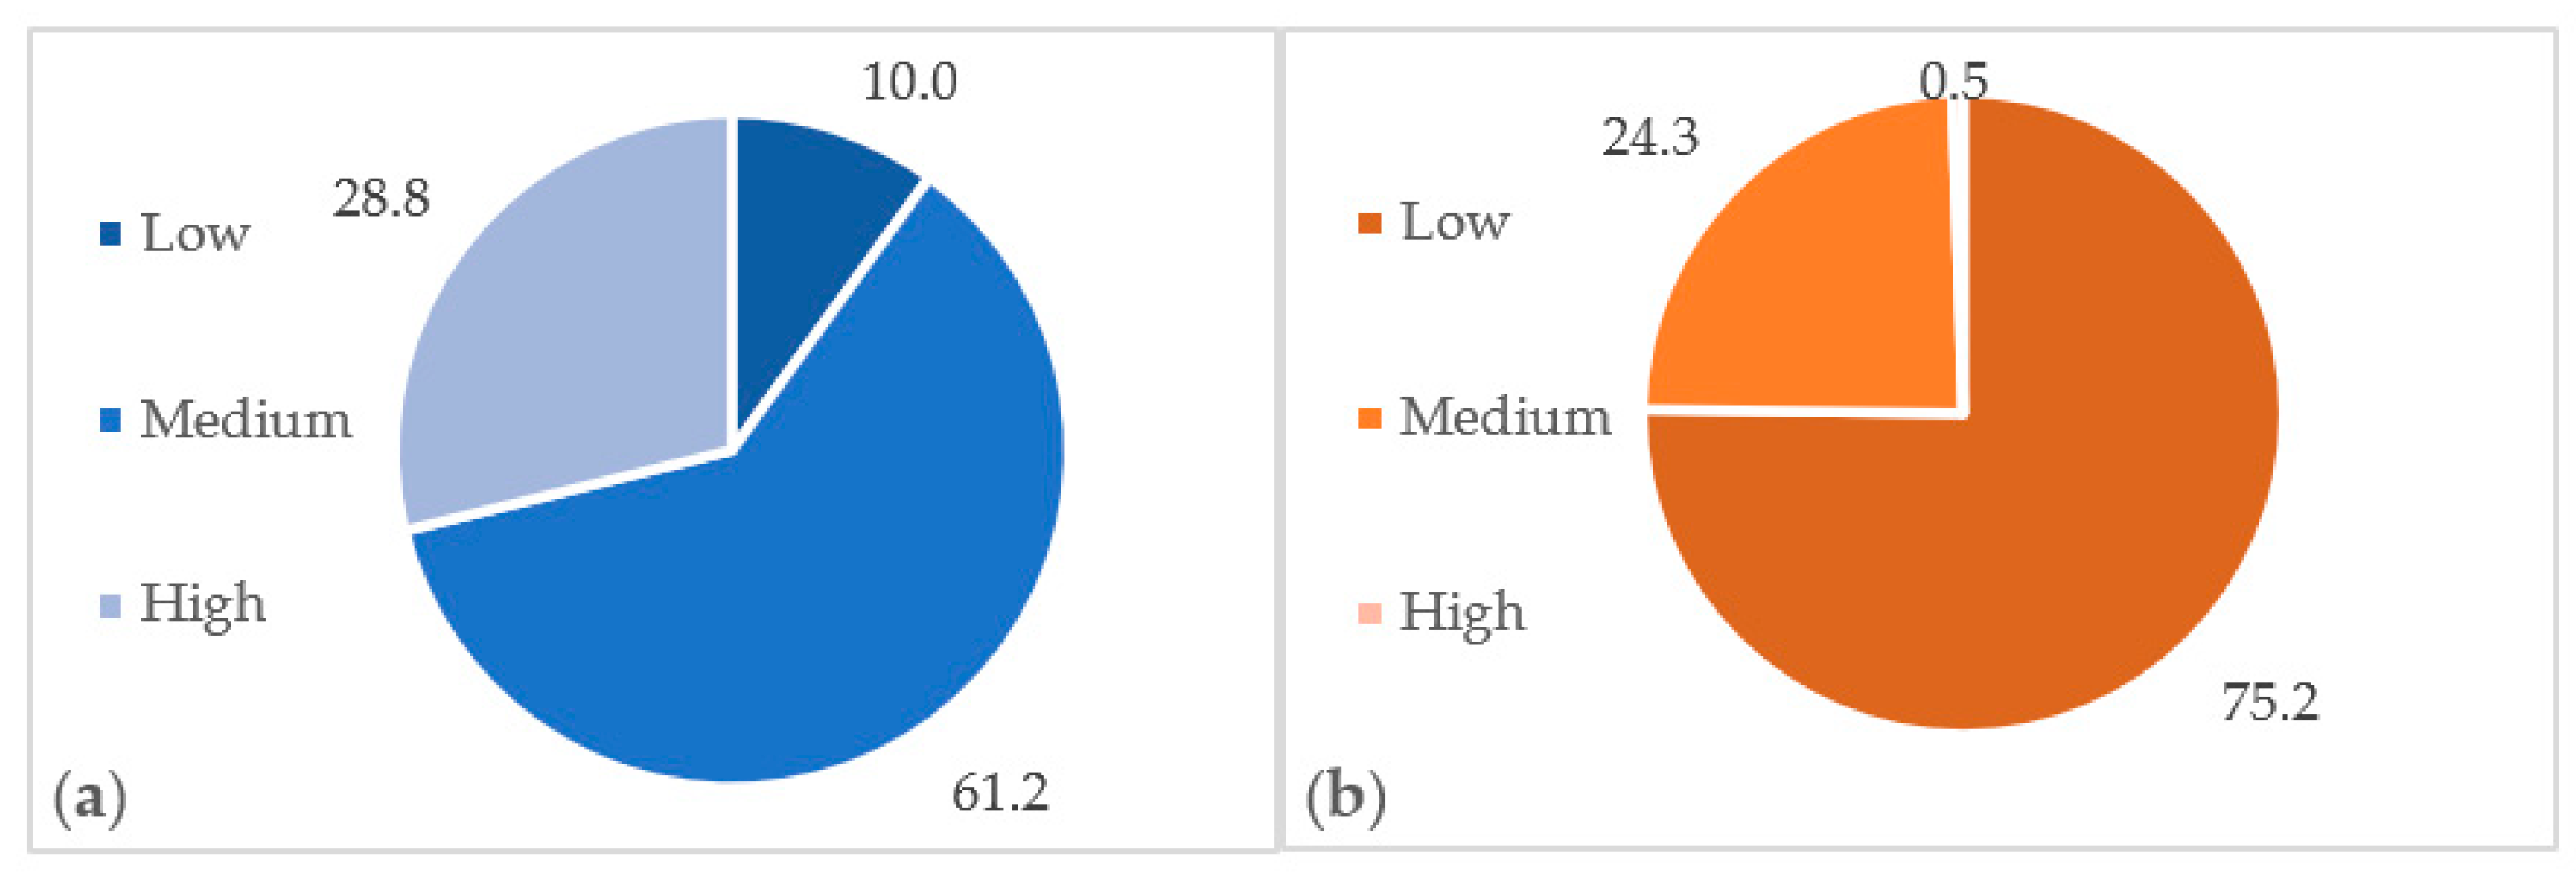
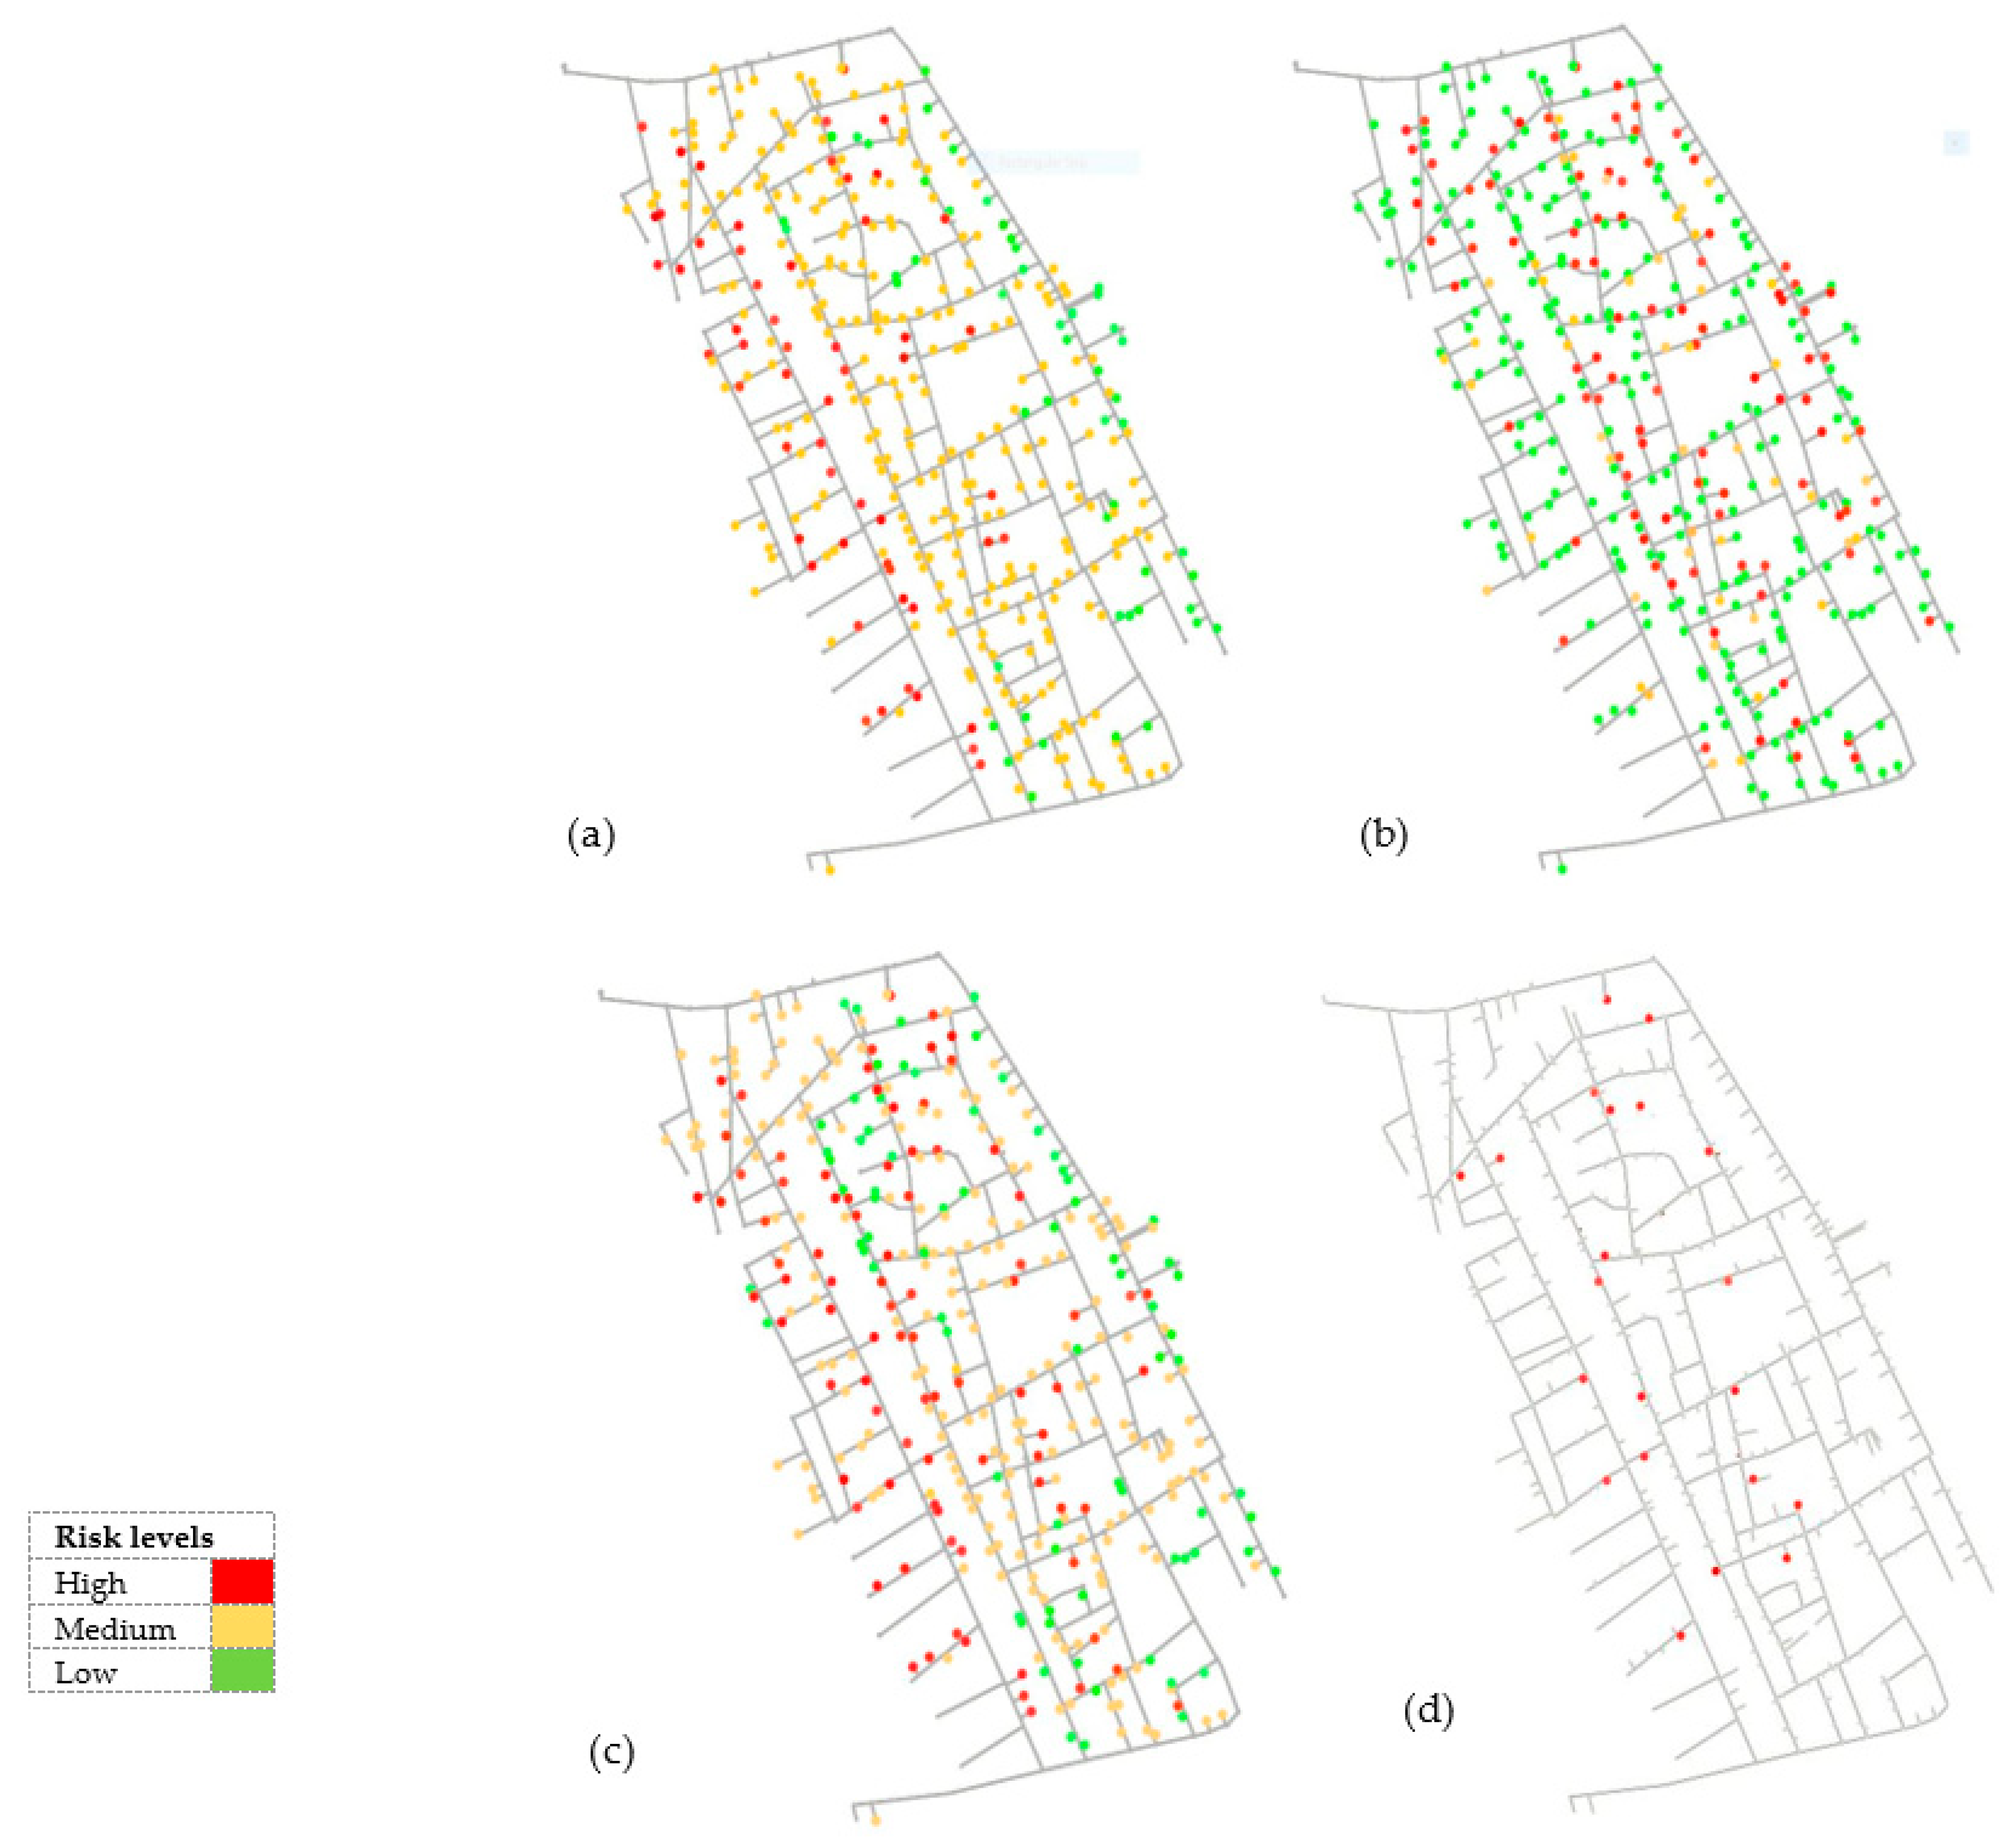
3.3. Risk-Based Prioritization of Service Connections

Figure 9a–c displays the spatial distribution of VI, CI, and RI for all the SCs in the study area. Figure 9a explains that VI was found to be “medium” for most (65%) of the SCs and “high” for 19% (70) of the service connections. Conversely, 58% of the SCs achieved a “low” CI in Figure 9b due to water consumption of up to 2 m3/day or less (also see Figure 5). Finally, Figure 9c displaying VI informs about the final risk priority of SCs. It can be seen in Figure 9c that 27% (around 100) of SCs are at a high risk of leakage. These SCs need to be proactively inspected and rehabilitated (if required) for water loss reduction.

3.4. Model Validation

Data on some of the SCs repaired between 2019 and 2021 were obtained from NWC’s office in Qassim and were used for model validation in the present study. Figure 9d shows the locations of the 21 repaired SCs as a result of leakage detection by the operational staff during leakage investigations or a complaint registered by the homeowner. The model results rank all 21 SCs as “high” risk priority, showing these SCs have already failed in the past. Therefore, the inspection and rehabilitation of the remaining SCs can be planned with a reasonable level of precision and confidence. In the case of major rehabilitation (replacement of the service line and all or most of the fittings), the age of the service connection should be updated in the input data.

4. Discussion

As per the Center for Clean Water and Clean Energy, around 35% of the supplied water in the country is being wasted through leakage in distribution systems [46]. High water loss (up to 35%) through leakage in water distribution systems is one of the primary concerns of decision-makers, policymakers, engineers, and municipality managers in the KSA. In the past, various efforts were made towards water loss management, such as the use of plastic pipes in new systems, replacing old cement and metallic pipes with plastic ones, intermittent supply, pressure management, and active leakage control (ALC) [6]. However, asset management practices are still in the development stage.
Reliance on IWS for water loss control has instigated other issues contributing to water quality failure and leakage when the system is unpressurized, such as bacterial regrowth and contaminants intrusion [5,10], meter malfunctioning [47], operating pressures higher than required in case of underground storage [6,8]. IWS systems in the KSA mainly operate with plastic (PVC, HDPE, UPVC) water mains, which are less prone to leakage due to higher reliability over cement and metallic pipes [31]. However, the metallic fittings used at SCs cause leakage due to corrosion, water aggressivity, and careless workmanship. Similar to the present study’s findings, the vulnerability of the service pipe from the connection to the meter to leakage was identified as a major problem in past studies [48].
It is important to understand that a complaint registers as a result of significant leakage noticeable to the naked eye due to a wet ground surface. A small leakage is difficult to identify in the study area, where groundwater temperature and associated evaporation loss are high due to the warm climate in arid regions. Long service mains of 25 mm diameter are susceptible to damage from backfill material with spiky gravel, vehicular loading, and possible bends in the case of houses not located at the right angle to the mains. Although all the SCs are 1.5 m deep at the point of connection, depth varies along the length (particularly for long service pipes) from the connection point to the customer meter. Hence, leaking SCs may not be identified between the two planned ALC programs. A cumulative impact of many leaking SCs can lead to the loss of limited water of very high environmental value in arid regions [6].
The present study provides an efficient and cost-effective solution for water loss control through proactive I&R of SCs in water distribution systems. The risk-based I&R model can prioritize hundreds of SCs in a distribution network based on their potential risk of leakage. Such data-driven decision-making tools not only enhance the service life of infrastructure but these tools also provide a low-cost solution to water loss control [49]. It is suggested that a small team of two to three field personnel can visit and inspect the SCs with “high” priority and make or plan (if the required parts are not available on the same day) the desired repair. It is also suggested that the field staff should check the meter operations and can note the pressure reading during the inspection. Such data can later be used for planning for other controls, e.g., meter repair and pressure management. As an IWS with underground storage in households can operate with low pressures, pressure management by optimal reduction can reduce leakage at SCs.
The model inherits the main assumption, based on personal communication, the literature, and observations, that most of the leakage occurs at SCs, i.e., 30% at the connection point on the water main and 60% at the service pipe. Hence, the I&R of service connections can significantly minimize water loss. In addition, the model holds the following limitations, (i) hydraulic parameters (pressure and velocity) were estimated through hydraulic simulations and can vary from the values used, (ii) only two regular water quality monitoring stations of National Water Company lay within the study area, which results in some approximation for allocating water quality to SCs, and (iii) although soil behavior does not change in smaller study areas, detailed soil data (i.e., multiple bore logs) can further improve the level of uncertainty. Future research can improve the model’s precision with more detailed data.

5. Conclusions

The municipalities in arid regions, including the KSA, operate water supply systems with low water rates, which constrain taking up aggressive rehabilitation and renewal of buried infrastructure. Consequently, the municipalities opt for intermittent supplies with the intention of minimizing water loss by reducing the supply duration. Although water savings are obvious, the intermittent supply adds to the deterioration of infrastructure through the intrusion of soil and the growth of biofilm. Presently, most of the systems in the KSA operate with plastic pipes, which have a low vulnerability to corrosion. The primary (around 90%) water loss occurs at service connections, either at poor or corroded metallic fittings on the water main or due to the failure of the service line.
The present study developed a new risk-based DSS to prioritize the SCs of intermittent water supply systems for proactive inspection and rehabilitation. The age of water mains, the installation year of service connections, water quality, and the pressure are the main contributing factors to the structural failure of SCs. The use of non-metallic fittings might minimize the loss of water through service connections. The risk-based decision-making entails the consequence of SCs′ failure on the number of consumers, which improves customer satisfaction. The developed methodology can facilitate the National Water Company and municipalities for significant (lower than 8% national benchmark) water loss reduction in water distribution systems in the KSA. Further, the DSS is adequately robust to include additional data, if available in the future, to improve the reliability of results. In general, the study established guidelines for risk-based asset management of buried water infrastructure in arid environmental regions.

Author Contributions

Conceptualization, methodology, supervision, and writing—original draft preparation: H.H.; data curation, formal analysis, validation, software: M.A.A.; conceptualization, supervision, writing—review and editing: A.A.; resources, visualization, writing—review and editing: A.R.G., I.S.A., Y.M.G. and M.S. All authors have read and agreed to the published version of the manuscript.

Funding

This research was funded by the Deanship of Scientific Research, Qassim University with grant No. QEC-1-1-2019-Q-9922.

Data Availability Statement

All the shareable data are given in the main text.

Acknowledgments

The authors gratefully acknowledge Qassim University, represented by the Deanship of Scientific Research, for the financial support for this research under the number (QEC-1-1-2019-Q-9922) during the academic year 1442 AH/2020 AD. The authors also extend their gratitude to the National Water Company for data sharing.

Conflicts of Interest

The authors declare no conflict of interest.

References

  1. World Resources Institute. Water Stress by Country. Available online: http://www.wri.org/resources/charts-graphs/water-stress-country (accessed on 17 August 2022).
  2. Ahmed, I.; Nazzal, Y.; Zaidi, F.K.; Al-Arifi, N.S.N.; Ghrefat, H.; Naeem, M. Hydrogeological vulnerability and pollution risk mapping of groundwater in the Saq and overlying aquifers using the DRASTIC model and GIS techniques. Environ. Earth Sci. 2015, 74, 1303–1318. [Google Scholar] [CrossRef]
  3. Haider, H. Performance assessment framework for groundwater treatment plants in Arid Environments: A case of Buraydah, Saudi Arabia. Environ. Monit. Assess. 2017, 189, 544. [Google Scholar] [CrossRef] [PubMed]
  4. Global Water Market. Meeting the World’s Water and Wastewater Needs Until 2020. In Global Water Market Volume 4: Middle East and Africa. Saudi Arabia; Global Water Intelligence: Oxford, UK, 2017; pp. 1379–1385. [Google Scholar]
  5. Hashwa, F.; Tokajian, S. Intermittent Water Supply and Domestic Water Quality in the Middle East. In Water in the Middle East and North Africa; Springer: Berlin/Heidelberg, Germany, 2004; Chapter 2; pp. 157–166. [Google Scholar] [CrossRef]
  6. Haider, H.; Al-Salamah, I.S.; Ghazaw, Y.M.; Abdel-Maguid, R.H.; Shafiquzzaman, M.; Ghumman, A.R. Framework to establish economic level of leakage for intermittent water supplies in arid environments. J. Water Resour. Plan. Manag. 2019, 145, 05018018. [Google Scholar] [CrossRef]
  7. Granit, I. The Impact of Water Insecurity on GuIf Countries’ SociaI Contracts: A Call to Action. Available online: https://gulfif.org/the-impact-of-water-insecurity-on-guif-countries-sociai-contracts-a-call-to-action/ (accessed on 17 October 2022).
  8. Andey, S.P.; Kelkar, P.S. Performance of water distribution systems during intermittent versus continuous water supply. J. Am. Water Works Assoc. 2007, 99, 99–106. [Google Scholar] [CrossRef]
  9. Hussein, M.H.; Magram, S.F. Domestic water quality in Jeddah, Saudi Arabia. J. King Abdulaziz Univ. Eng. Sci. 2012, 23, 207–223. [Google Scholar] [CrossRef]
  10. Erickson, J.J.; Smith, C.D.; Goodridge, A.; Nelson, K.L. Water quality effects of intermittent water supply in Arraiján, Panama. Water Res. 2017, 114, 338–350. [Google Scholar] [CrossRef]
  11. Agathokleous, A.; Christodoulou, S. The impact of intermittent water supply policies on urban water distribution networks. Procedia Eng. 2016, 162, 204–211. [Google Scholar] [CrossRef]
  12. Charalambous, B.; Laspidou, C. Dealing with the Complex Interrelation of Intermittent Supply and Water Losses; IWA Publishing: London, UK, 2017. [Google Scholar]
  13. Tokajian, S.; Hashwa, F. Water quality problems associated with intermittent water supply. Water Sci. Technol. 2003, 47, 229–234. [Google Scholar] [CrossRef]
  14. Avvedimento, S.; Todeschini, S.; Manenti, S.; Creaco, E. Comparison of Techniques for Maintaining Adequate Disinfectant Residuals in a Full-Scale Water Distribution Network. Water 2022, 14, 1029. [Google Scholar] [CrossRef]
  15. Haider, H.; Alkhowaiter, M.H.; Shafiquzzaman, M.; Alresheedi, M.; AlSaleem, S.S.; Ghumman, A.R. Source to Tap Risk Assessment for Intermittent Water Supply Systems in Arid Regions: An Integrated FTA—Fuzzy FMEA Methodology. Environ. Manag. 2021, 67, 324–341. [Google Scholar] [CrossRef]
  16. Accurate Leak and Line. Available online: https://www.accurateleak.com/the-importance-of-pvc-pipes/ (accessed on 15 September 2022).
  17. InspectAPedia. Available online: https://inspectapedia.com/plumbing/Plastic_Pipe_Leaks.php#Causes (accessed on 22 September 2022).
  18. Monfared, Z.; Molavi, N.M.; Bayat, A. A review of water quality factors in water main failure prediction models. Water Pract. Technol. 2022, 17, 60–74. [Google Scholar] [CrossRef]
  19. Hunaidi, Q.; Chu, W.T. Acoustical characteristics of leak signals in plastic water distribution pipes. Appl. Acoust. 1999, 58, 235–254. [Google Scholar] [CrossRef] [Green Version]
  20. Rajakumar, A.G.; Cornelio, A.A.; Mohan Kumar, M.S. Leak management in district metered areas with internal-pressure reducing valves. Urban Water J. 2020, 17, 714–722. [Google Scholar] [CrossRef]
  21. Ghorpade, A.; Sinha, A.K.; Kalbar, P.P. Drivers for Intermittent Water Supply in India: Critical Review and Perspectives. Front. Water 2021, 3, 696630. [Google Scholar] [CrossRef]
  22. Valis, D.; Hasilová, K.; Forbelská, M.; Pietrucha-Urbanik, K. Modelling water distribution network failures and deterioration. In Proceedings of the 2017 IEEE International Conference on Industrial Engineering and Engineering Management (IEEM), Singapore, 10–13 December 2017; IEEE: New York, NY, USA, 2017; pp. 924–928. [Google Scholar] [CrossRef]
  23. Cheung, P.B.; Reis, L.F.R.; Carrijo, I.B. Multi-Objective Optimization to the Rehabilitation of a Water Distribution Network. In Advances Water Supply Manage; CRC Press: New York, NY, USA, 2003; pp. 315–325. ISBN 9780203833667. [Google Scholar]
  24. Giustolisi, O.; Laucelli, D.; Savic, D.A. Development of rehabilitation plans for water mains replacement considering risk and cost-benefit assessment. Civ. Eng. Environ. Syst. 2006, 23, 175–190. [Google Scholar] [CrossRef]
  25. Nafi, A.; Werey, C.; Llerena, P. Water pipe renewal using a multiobjective optimization approach. Can. J. Civ. Eng. 2008, 35, 87–94. [Google Scholar] [CrossRef]
  26. Jin, X.; Zhang, J.; Gao, J.L.; Wu, W.Y. Multi-objective optimization of water supply network rehabilitation with non-dominated sorting genetic algorithm-II. J. Zhejiang Univ. -Sci. A 2008, 9, 391–400. [Google Scholar] [CrossRef]
  27. D’Ercole, M.; Righetti, M.; Raspati, G.S.; Bertola, P.; Maria Ugarelli, R. Rehabilitation planning of water distribution network through a reliability—Based risk assessment. Water 2018, 10, 277. [Google Scholar] [CrossRef]
  28. Marzouk, M.; Hamid, S.A.; El-Said, M. A methodology for prioritizing water mains rehabilitation in Egypt. HBRC J. 2015, 11, 114–128. [Google Scholar] [CrossRef] [Green Version]
  29. Kabir, G.; Tesfamariam, S.; Francisque, A.; Sadiq, R. Evaluating risk of water mains failure using a Bayesian belief network model. Eur. J. Oper. Res. 2015, 240, 220–234. [Google Scholar] [CrossRef]
  30. Nickel Institute. Available online: https://www.dtkhydronet.com/post/leakages-in-water-distribution-networks (accessed on 25 October 2022).
  31. Aliaxis. Available online: https://aliaxis.com/the-benefits-of-plastic-pipe-systems/ (accessed on 17 September 2022).
  32. Haider, H.; Ghumman, A.R.; Al-Salamah, I.S.; Thabit, H. Assessment framework for natural groundwater contamination in arid regions: Development of indices and wells ranking system using fuzzy VIKOR method. Water 2020, 12, 423. [Google Scholar] [CrossRef] [Green Version]
  33. Van Zyl, J.; Clayton, C.R.I. The effect of pressure on leakage in water distribution systems. In Proceedings of the Institution of Civil Engineers-Water Management; Thomas Telford Ltd.: London, UK, 2007; Volume 160, pp. 109–114. [Google Scholar] [CrossRef]
  34. USEPA. Available online: https://www.epa.gov/water-research/epanet (accessed on 13 January 2022).
  35. Berardi, L.; Giustolisi, O.; Kapelan, Z.; Savic, D.A. Development of pipe deterioration models for water distribution systems using EPR. J. Hydroinform. 2008, 10, 113–126. [Google Scholar] [CrossRef] [Green Version]
  36. Hu, Y.; Hubble, D.W. Factors contributing to the failure of asbestos cement water mains. Can. J. Civ. Eng. 2007, 34, 608–621. [Google Scholar] [CrossRef]
  37. Alzabeebee, S.; Chapman, D.; Jefferson, I.; Faramarzi, A. The response of buried pipes to UK standard traffic loading. Proc. Inst. Civ. Eng.-Geotech. Eng. 2017, 170, 38–50. [Google Scholar] [CrossRef] [Green Version]
  38. Sadiq, R.; Veitch, B.; Husain, T.; Bose, N. Prioritising Environmental Effects Monitoring (EEM) Programs: A Risk-Based Strategy. In Offshore Oil and Gas Environmental Effects Monitoring Workshop: Approaches and Technologies; University of Tasmania: Hobart, Australia, 2003; pp. 71–86. [Google Scholar]
  39. Ketrane, R.; Yahiaoui, C. Scale precipitation on HDPE pipe by degassing of CO2 dissolved in water. AQUA—Water Infrastruct. Ecosyst. Soc. 2021, 70, 1204–1216. [Google Scholar] [CrossRef]
  40. Mounce, S.R.; Mounce, R.B.; Jackson, T.; Austin, J.; Boxall, J.B. Pattern matching and associative artificial neural networks for water distribution system time series data analysis. J. Hydroinform. 2014, 16, 617–632. [Google Scholar] [CrossRef] [Green Version]
  41. Francisque, A.; Tesfamariam, S.; Kabir, G.; Haider, H.; Reeder, A.; Sadiq, R. Water mains renewal planning framework for small to medium sized water utilities: A life cycle cost analysis approach. Urban Water J. 2017, 14, 493–501. [Google Scholar] [CrossRef]
  42. McGhee, T.J. Water Supply and Sewerage, 6th ed.; McGraw-Hill Publishing Company: New York, NY, USA, 2007. [Google Scholar]
  43. UN Habitat. Buraydah City Profile, Ministry of Municipal and Rural Affairs and United Nations Human Settlements Programme; UN Habitat: Riyadh, Saudi Arabia, 2019. [Google Scholar]
  44. Haider, H.; Ghumman, A.R.; Al-Salamah, I.S.; Ghazaw, Y.; Abdel-Maguid, R.H. Sustainability evaluation of rainwater harvesting-based flood risk management strategies: A multilevel decision-making framework for arid environments. Arab. J. Sci. Eng. 2019, 44, 8465–8488. [Google Scholar] [CrossRef]
  45. Wang, C.; Chou, M.; Pang, C. Applying Fuzzy Analytic Hierarchy Process for Evaluating Service Quality of Online Auction. Int. J. Comput. Inf. Eng. 2012, 6, 586–593. [Google Scholar] [CrossRef]
  46. Utilities. Available online: https://www.utilities-me.com/water/11332-special-report-preventing-leaks (accessed on 20 October 2022).
  47. Totsuka, N.; Trifunovic, N.; Vairavamoorthy, K. Intermittent urban water supply under water starving situations. In People-Centred Approaches to Water and Environmental Sanitation, Proceedings of the 30th WEDC International Conference, Vientiane, Laos, 25–29 October 2004; Godfrey, S., Ed.; Loughborough University: Loughborough, UK; pp. 505–512. Available online: https://repository.lboro.ac.uk/articles/conference_contribution/Intermittent_urban_water_supply_under_water_starving_situations/9595109/ (accessed on 2 November 2022).
  48. Hawle. Available online: https://www.hawle.com/en/hawle-knowledge/how-to/leaks-repair/ (accessed on 22 October 2022).
  49. Okwori, E.; Pericault, Y.; Ugarelli, R.; Viklander, M.; Hedström, A. Data-driven asset management in urban water pipe networks: A proposed conceptual framework. J. Hydroinform. 2021, 23, 1014–1029. [Google Scholar] [CrossRef]
Figure 1. Study area and problem identification, (a) location of the study area the in Buraydah City of Qassim Region, (b) service connection details showing percentage contribution of each structural failure, 60% leaking service line, and 30% leaking connections.
Water 14 03994 g001
Figure 2. Risk-based methodology of the decision support system (DSS) for service connections’ proactive maintenance planning.
Water 14 03994 g002
Figure 4. Hydraulic simulation results for 371 service connections, (a) pressure distribution, (b) velocity distribution.
Water 14 03994 g004
Figure 5. Water consumption in the study area, (a) probability density graph, (b) cumulative density graph (drawn using licensed version of @Risk Version 8 software). Horizontal axis shows water consumption (m3/day) and vertical axis represents probability values. Input data are shown in blue color and red line represents the Pearson 5 distribution.
Water 14 03994 g005
Figure 6. Age of infrastructure, (a) water mains, (b) service connections.
Water 14 03994 g006
Figure 7. Weighting scheme by Fuzzy-AHP showing input data variables at Gen. 5, risk factors at Gen. 2 to Gen. 4, and risk index (RI) at the top.
Water 14 03994 g007
Figure 8. Summary of calculated indices. Risk index (RI), consequence index (CI), vulnerability index (VI), structural failure index (SFI), hydraulic failure index (HFI), water main condition index (WMI), and service connection condition index (SCCI).
Water 14 03994 g008
Figure 9. Spatial display of risk-based priority levels for service connections for inspection and rehabilitation of service connections, (a) consequence index, (b) vulnerability index, and (c) overall risk index, (d) model validation results, where all the 21 service connections repaired in response to customer complaints were ranked as high-risk connections by the developed model.
Water 14 03994 g009
Table 1. Baseline data and universe of discourse (UoD).
No.ParameterUnitsLow (1,2,4)Medium (3,5,7)High (6,8,10)RangePolarity
1.0Hydraulic
1.1Pressurem0.5–55–15>150.5–20Positive
1.2Velocitym/s<0.20.2–1>1<1Positive
2.0Service connection
2.1AgeYears<1515–20>206–26Positive
2.2Depthm>22–1.5<1.51.5Negative
2.3Lengthm<33–10>101–62Positive
3.0Water main
3.1AgeYears≤2020–25>2520–27Positive
3.2Material-PlasticSteelCement--
3.3Diameterm<150150–250>250110–225Positive
4.0Soil corrosivity
4.1Clay%<2020–40≥402Positive
4.2Gravel%<88–30≥304Positive
5.0Water Quality
5.1TurbidityNTU<11–5>50.08–0.215Positive
5.2PH-->87–8<77.75–7.76Negative
5.3Electrical conductivityMS/cm<10001000–1200>12001040–1117Positive
5.4Free residual chlorinemg/L0.3–0.80.1–0.3 OR
0.8–1.2
>1.2 OR <0.10.18–0.19Positive/Negative
5.5Ironmg/L<0.050.05–0.3>0.30.005–0.02Positive
6.0Consequence
6.1Number of consumers servedPerson<88–12>121–114Positive
Table 2. Risk classification and color-coding scheme.
ScoreVulnerability/Consequence/Risk IndexColor-Coding Scheme
0–3.5Low
3.6–5.5Medium
>5.5High
Table 3. Fuzzy scales and triangular fuzzy numbers (TFN) used for linguistic variables.
Linguistic TermFuzzy NumberTFN (l, m, u)Linguistic TermFuzzy NumberTFN (l, m, u)
Extreme unimportance 9 ˜ 1 1/9, 1/9, 1/9 Intermediate   value   between   1 ˜   and   3 ˜ 2 ˜ 1, 2, 3
Intermediate   values   between   7 ˜ 1   and   9 ˜ 1 8 ˜ 1 1/9, 1/8, 1/7Moderate importance 3 ˜ 2, 3, 4
Very unimportant 7 ˜ 1 1/8, 1/7, 1/6 Intermediate   value   between   3 ˜   and   5 ˜ 4 ˜ 3, 4, 5
Intermediate   value   between   5 ˜ 1   and   7 ˜ 1 6 ˜ 1 1/7, 1/6, 1/5Essential importance 5 ˜ 4, 5, 6
Essential unimportance 5 ˜ 1 1/6, 1/5, 1/4 Intermediate   value   between   5 ˜   and   7 ˜ 6 ˜ 5, 6, 7
Intermediate   value   between   3 ˜ 1   and   5 ˜ 1 4 ˜ 1 1/5, 1/4, 1/3Very vital importance 7 ˜ 6, 7, 8
Moderate unimportance 3 ˜ 1 1/4, 1/3, 1/2 Intermediate   value   between   7 ˜   and   9 ˜ 8 ˜ 7, 8, 9
Intermediate   value   between   1 ˜   and   3 ˜ 1 2 1 1/3, 1/2, 1Extreme importance 9 ˜ 9, 9, 9
Equally importance11, 1, 1---
Table 4. Randomly generated values of consistency index (RI).
n12345688910
RI000.580.901.121.241.321.411.451.49
Table 5. Excel-based DSS results for service connection condition index (SCCI).
CodeAge (Year)PS 1Fuzzy ScoreDepth (m)PSFuzzy ScoreLength (m)PSFuzzy ScoreSCCI Priority
Wi 0.620.690.73 0.120.120.130.150.190.22lmuCrisp
SC622H 268101.5M35718H68105.027.6510.47.67HIGH
SC722H68101.5M3575.5M3574.557.079.747.1HIGH
SC823H68101.5M35710.8H68105.027.6510.47.67HIGH
SC919M 33571.5M3577.7M3572.6857.555.04MEDIUM
SC1021H68101.5M35710M3574.557.079.747.1HIGH
SC1122H68101.5M35714H68105.027.6510.47.67HIGH
SC1223H68101.5M35713.2H68105.027.6510.47.67HIGH
SC1721H68101.5M3577M3574.557.079.747.1HIGH
SC1817M3571.5M3576.1M3572.6857.555.04MEDIUM
SC1921H68101.5M35711.9H68105.027.6510.47.67HIGH
SC2023H68101.5M35711.8H68105.027.6510.47.67HIGH
SC2114L 41241.5M35712.1H68101.93.56.013.65MEDIUM
SC2221H68101.5M3574M3574.557.079.747.1HIGH
SC2324H68101.5M3573.8M3574.557.079.747.1HIGH
SC2420M3571.5M3574M3572.6857.555.04MEDIUM
SC2514L1241.5M3572.7L1241.132.354.72.54LOW
SC2621H68101.5M3573M3574.557.079.747.1HIGH
SC2720M3571.5M3572.5L1242.384.436.94.5MEDIUM
SC2815M3571.5M35711.4H68103.145.578.25.61HIGH
SC3119M3571.5M35713.3H68103.145.578.25.61HIGH
SC3220M3571.5M3576.4M3572.6857.555.04MEDIUM
SC3417M3571.5M3573.5M3562.6857.335MEDIUM
SC3624H68101.5M35711H68105.027.6510.47.67HIGH
SC3712L1241.5M35749.2H68101.93.56.013.65MEDIUM
SC3822H68101.5M3577.6M3574.557.079.747.1HIGH
SC3916M3571.5M3572.9L1242.384.436.94.5MEDIUM
SC4023H68101.5M35716.5H68105.027.6510.47.67HIGH
SC4415M3571.5M3576.3M3572.6857.555.04MEDIUM
SC4513L1241.5M3572.8L1241.132.354.72.54LOW
SC466L1241.5M3571L1241.132.354.72.54LOW
SC4723H68101.5M3573M3574.557.079.747.1HIGH
Note: 1 Performance score (PS), 2 High (H), 3 Medium (M), 4 Low (L).
Publisher’s Note: MDPI stays neutral with regard to jurisdictional claims in published maps and institutional affiliations.

