
Evaluation of Potential Seawater Intrusion in the Coastal Aquifers System of Benin and Effect of Countermeasures Considering Future Sea Level Rise

School of Civil and Environmental Engineering, Kookmin University, Seoul 02707, Republic of Korea
*
Author to whom correspondence should be addressed.
Water 2022, 14(24), 4001; https://doi.org/10.3390/w14244001
Submission received: 16 October 2022
/
Revised: 1 December 2022
/
Accepted: 6 December 2022
/
Published: 8 December 2022
(This article belongs to the Special Issue Coastal Aquifers: Seawater/Saltwater Intrusion)
Abstract
:In the present study, a three-dimensional SEAWAT model was developed to generally simulate the impact of climate change and anthropogenic activities on seawater intrusion (SWI) in the coastal region of Benin by the end of 2050. The model was calibrated and validated from 2015 to 2020, considering groundwater head and salt concentration measured in 30 wells. After calibration, a sensitivity analysis was performed with the model parameters (hydraulic conductivity, recharge, storage coefficient and boundary conditions). For the calibration, model computed and observed values displayed good correlation, approximatively 0.82 with a root mean square error (RMSE) of 0.97 m and 13.38 mg/L for groundwater head and salt concentration, respectively. The simulation results indicate that freshwater head had declined by 1.65 m from 2015 to 2020 (taking reference from the average groundwater head in 2015: 27.08 m), while the seawater intrusion area increased in the same period by an average of 1.92 km2 (taking reference from the seawater intrusion area in 2015: 20.03 km2). The model is therefore used to predict groundwater level decline and seawater intrusion area increase by the end of 2050, considering the predicted sea level rise (SLR) and estimated groundwater pumping rate. Furthermore, the interface fresh groundwater–saltwater change was studied using the SHARP interface developed by USGS in 1990. The interface variation was found to be influenced by the distance from shoreline, sea level, groundwater level and geological formation hydraulic conductivity. Finally, the 3D model was used to simulate the effect of a managed aquifer recharge system on reducing SWI rate in the study region.
1. Introduction
Groundwater resources represent more than 30.1 percent of worldwide freshwater resources. In coastal areas, this precious resource is strongly affected by seawater intrusion (SWI). SWI is causing hydrologic concern all over the world [1]; Italy [2], Libya [3], Tunisia [4], Israel [5], Mexico [6], Palestine [7], Lebanon [8], United States [9], South Korea [10]. In recent decades, this issue in coastal regions has been intensified by climate change, sea level rise (SLR), groundwater over pumping and land cover changes, leading to groundwater quality degradation and, consequently, groundwater quantity diminution. In Benin, more than 3 million Beninese are living in the coastal region, and this is gradually increasing; groundwater usage due to agricultural development and drinking water supply is also increasing proportionally to the increasing population [11]. As a result, groundwater overexploitation and pollution are becoming a widespread problem resulting in the important degradation of groundwater quality and quantity. Due to the importance of this resource and its vulnerability to seawater intrusion in the coastal region, numerical modeling is useful in helping hydrologists and decision-makers to understand and predict seawater intrusion scenarios in the region for better groundwater resource management.
SWI is a density-dependent problem between both fresh groundwater and saltwater [12,13]. To tackle the SWI problem in coastal regions, it is important to understand coastal aquifers system and predict their behavior under different scenarios of natural occurrences and human interventions. The SWI modeling process needs to couple the groundwater flow equation with the contaminant transport equation [14]. Considerable efforts have been put into developing a numerical modeling tool for groundwater analysis that can represent the physical complexity and the spatio-temporal variations in coastal systems. The developed numerical models have been successfully and widely applied to simulate seawater intrusion into coastal aquifers: SEAWAT [15,16,17,18], FEFLOW [19], SUTRA [20].
The impact of climate change and anthropogenic activities on SWI has been studied by many researchers using various models. El Hamidi et al. [21] used computational groundwater and solute transport models to determine how climate change, SLR and overpumping affect SWI in the Rmel-Oulad Ogbane coastal aquifer (Morocco). Ranjbar et al. [22] used a coupled transient density-dependent finite element model to simulate SWI in the Gaza aquifer considering the individual and combined effect of SLR and groundwater over abstraction. Tiruneh et al. [23] coupled the rise in sea level and associated pumping to investigate the advance of the saltwater–freshwater interface further inland using a three-dimensional numerical code SEAWAT. All these previous researchers have proved and demonstrated that the numerical modeling method is an important key in the successful management of coastal aquifer. Sea level rise reduces the land surface and significantly impacts groundwater resources [24]; the sea level is expected to globally rise from 0.09 to 0.88 m by 2100 in relation to the level in 2000 [25]. SLR affects groundwater by increasing the hydrostatic head of the sea, which results in the saltwater–fresh groundwater interface inland movement. Overexploitation of groundwater coupled with SLR has been proven to be a key factor in the extension of the transition zone in unconfined aquifers [26,27,28,29]. With the increasing groundwater use and climate change, which is expected to be severe in the coming years all over the world, we contend that it is urgent to investigate and explore saltwater–freshwater interface migration in coastal aquifers in response to the changing sea level. Werner and Simmons [1] used a conceptual framework to assess SWI changes in coastal aquifers in response to SLR. The study tested two conceptual model: the first model is a flux-controlled system in which groundwater persistently discharges to the sea despite the SLR, and the second model is a head-controlled system in which groundwater head in the aquifer is maintained constant. Priyanka and Maheshab [14] simulated the effect of freshwater draft and predicted SLR due to climate change on saltwater intrusion in a conceptual coastal unconfined aquifer using MODFLOW, MT3DMS and SEAWAT.
Since SWI was suspected in the south of Benin, numerous studies have been conducted including laboratory-scale investigations and analytical and numerical modeling. Sognon et al. [30] studied seawater intrusion depth in the study area using Archie’s law and the resistivity map obtained from field work. Hounsinou [31] has produced spatial seawater intrusion map of Abomey-Calavi, which is part of our study area, to show the potential seawater intrusion in Abomey-Calavi using only groundwater major ion concentrations; the results confirmed SWI into the aquifer of the study region. All these studies have assessed the actual seawater intrusion in the coastal area of Benin using salt concentration and resistivity methods without considering both SLR and pumping rate, but the present study uses a 3D model (SEAWAT) to simulate the actual and future SWI, considering the predicted SLR and groundwater pumping rate increase. The goals of this paper are to evaluate the general expansion of saltwater intrusion into Benin’s coastal aquifers by modeling the region using the SEAWAT engine in Visual MODFLOW and to simulate the saline distribution in 2050, considering climate change impacts and change in pumping rate. Furthermore, this study contends that it is important to understand the vertical migration of the saltwater–freshwater interface, which is in function of vertical coordinates and time; therefore, the SHARP interface model developed by USGS in 1990 was used to simulate the vertical migration of the interface in the coastal aquifer of Benin. In earlier research, numerical models are used to develop solutions to retard and reduce SWI; a variety of methods have been suggested, such as the relocation of pumping wells [32], desalination and recharge approach [33], artificial recharge [34,35] and reducing the groundwater pumping rate [36]. Taking steps from the previous research, the present study has investigated a managed aquifer recharge approach (artificial recharge using wells and pond) to retard the saltwater intrusion in the coastal region of Benin in the coming 30 years.
2. Materials and Methods
2.1. Study Area
The study area is in the Gulf of Guinea in West Africa. The coastline 121 km long and bounded to the north by the crystalline peneplain of central Benin, to the south by the Atlantic Ocean, to the east by Nigeria and to the west by Togo. Manufacturing industries and urbanization are expanding in the area, making it the most populated and high-groundwater-use region in Benin. The climate over the area is known as a subequatorial climate characterized by four seasons: main dry season (from December to mid-March), main rainy season (from mid-March to mid-August), small dry season (from mid-August to mid-September) and small rainy season (from mid-September to November). The annual average precipitation within the area increases from the west (900 mm/yr) to the east (1400 mm/yr). The land use ranges from large metropolis developments (Cotonou) to small rural settlements. Significant parts of the land surface inside Cotonou have been modified, resulting in less local recharge and more runoff. This is leading to major surface flooding in the metropolitan zone’s southern sections during the rainy season. Its vegetation is made up of a coastal maritime grassland, dense humid semideciduous forests, savannahs, mangroves savannahs, mangroves, swamp forests, fallows and plantations.
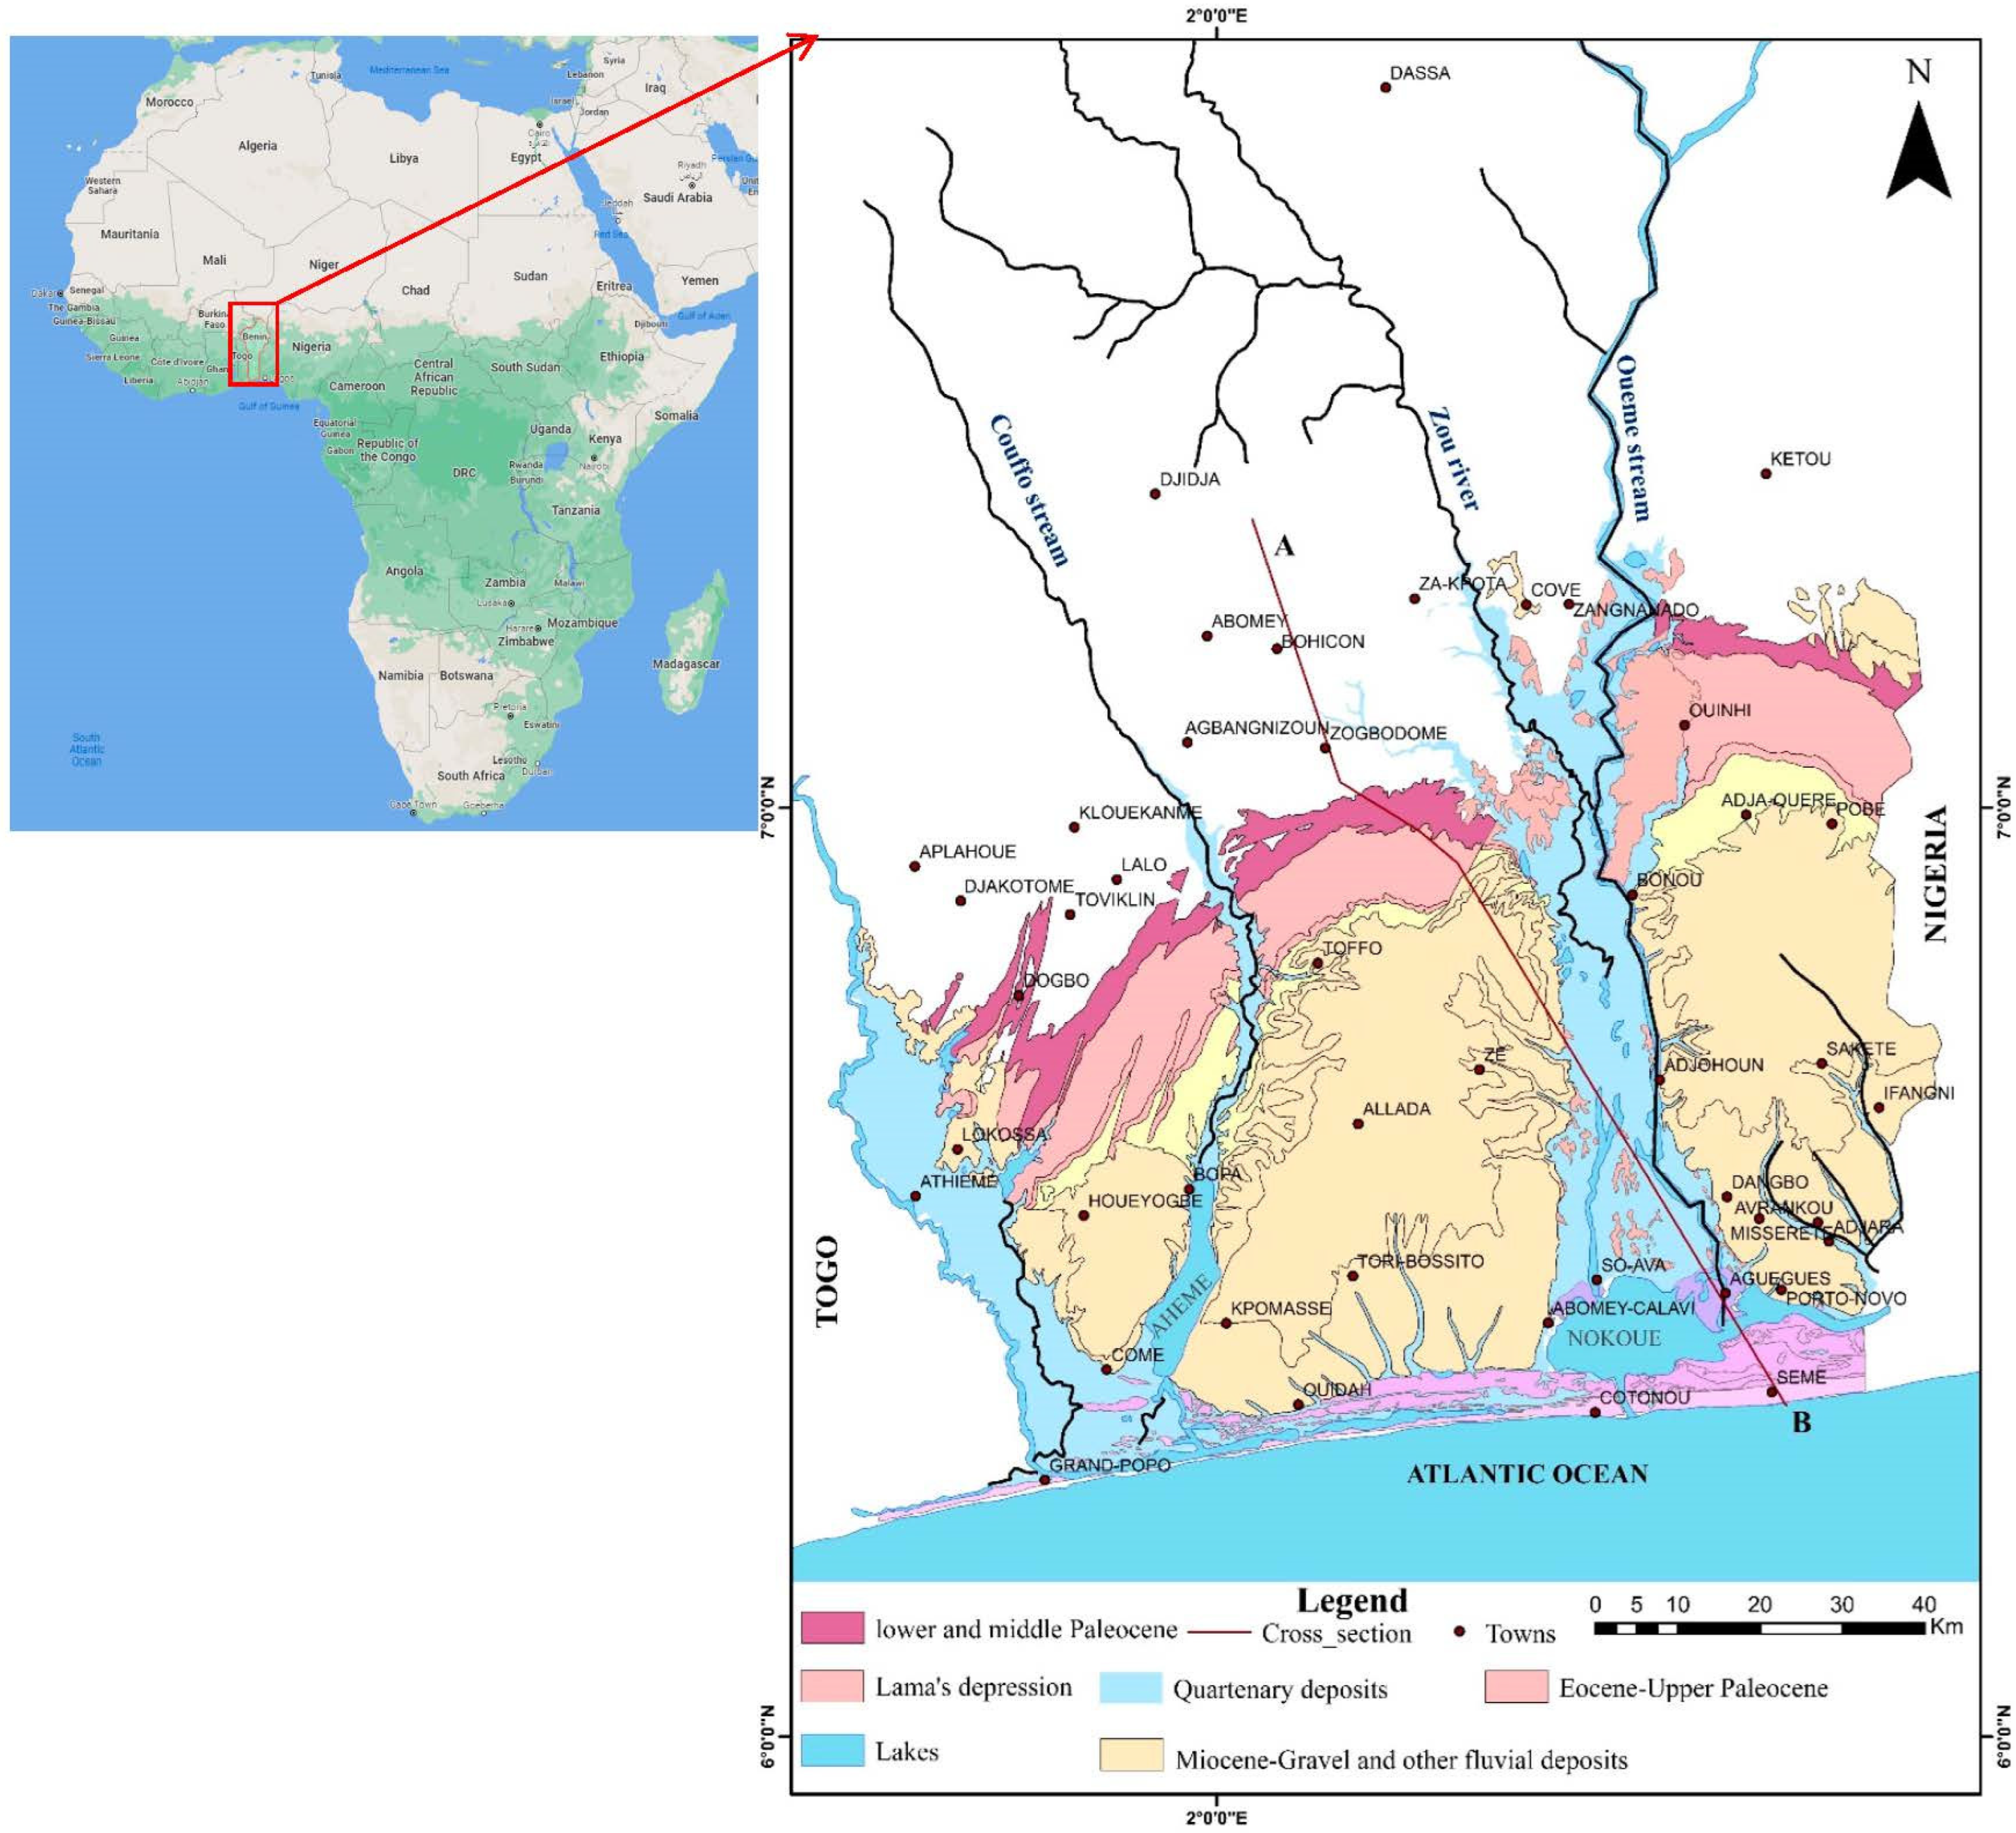
The area is relatively flat with an increasing slope from south to north (maximum 5.5). The geological units found across the area are classified in three groups [37]. The geological units belong to the Guinea Gulf sedimentary, shared by four West African countries (Benin, Ghana, Togo and Nigeria). Quaternary sand is widely distributed across the area, along the coastline, east and northwestern region. Sand–gravel formations are found in the center of the study region at a few kilometers from the shoreline, and the sand with high infiltration rate deposits are mainly located in the western region of the study area (Figure 1).
Mainly two aquifers are captured by hand-dug wells and boreholes within the area: Continental Terminal and Quaternary aquifers. Except the borders, the Continental Terminal aquifer is buried in Miocene–Pliocene–Pleistocene continental layers and is characterized by direct rainwater infiltration recharge [38]. It begins with a glauconite-bearing clayey sand layer, on top of which lie the continental deposits of sand followed by sandy clay, clay and sandstone. The thickness of the Continental Terminal aquifer ranges from 40 m to about 280 m, with groundwater flowing from north to south. Its transmissivity ranges from 4 × 10⁻³ to 14 × 10−3 m2/s [37]. The Quaternary aquifer is found near rivers, streams and coastline (Figure 1). It is made up of alluvial deposits (coarse and fine sands that alternate with silt and clay materials). The Quaternary deposits’ thickness gradually increases from north to south and is generally less than 50 m. Its transmissivity values are ranged between 10−3 and 3 × 10⁻² m2/s. The area is potentially exposed to seawater because most of its geological units extend below the bight of Benin. The aquifer system in the region is assessed via a number of hand-dug wells and boreholes, mainly the stations of Ouèdo and Godomey (located in the south few kilometers from Nokoué lake). The two big stations each have more than a dozen pumping wells and represent the source of water supplying megacities (Cotonou, Abomey-Calavi and surrounding regions); this makes the aquifer system in the region very important, and models are required for better understanding and management because megacities in the south of Benin rely on the study area’s groundwater resources for their water supply.
2.2. Model Configuration
The numerical simulation model of solute transport in groundwater flow (SEAWAT) was used in this study to simulate groundwater flow and solute transport in the coastal aquifer of Benin. The model was created in various steps: model setup, grid creation and importation of pumping wells, importation of observation wells for groundwater head and salt concentration, hydrological properties and boundary conditions assigning.
2.2.1. Conceptual Model
The model domain was discretized as a rectangular area that covers the coastal region of Benin, approximating an area of 3000 km2. The model setup was initiated in Visual MODFLOW where SEAWAT was assigned as the numerical engine, and the parameter’s units were defined as follows: length (m), time (day), conductivity (m/s), pumping rate (m3/day), recharge (mm/yr), mass (kg) and concentration (mg/L).
The grid used for the model discretization was set to 350 m × 350 m with three layers; the maximum depth was set to 280 m considering the Continental Terminal aquifer maximum thickness. The model grid elevation was prepared in ArcGIS using the digital elevation map (DEM) with a resolution of 30 m × 30 m. The other parameters in the next dialogue page were set to default values to be modified during the calibration.
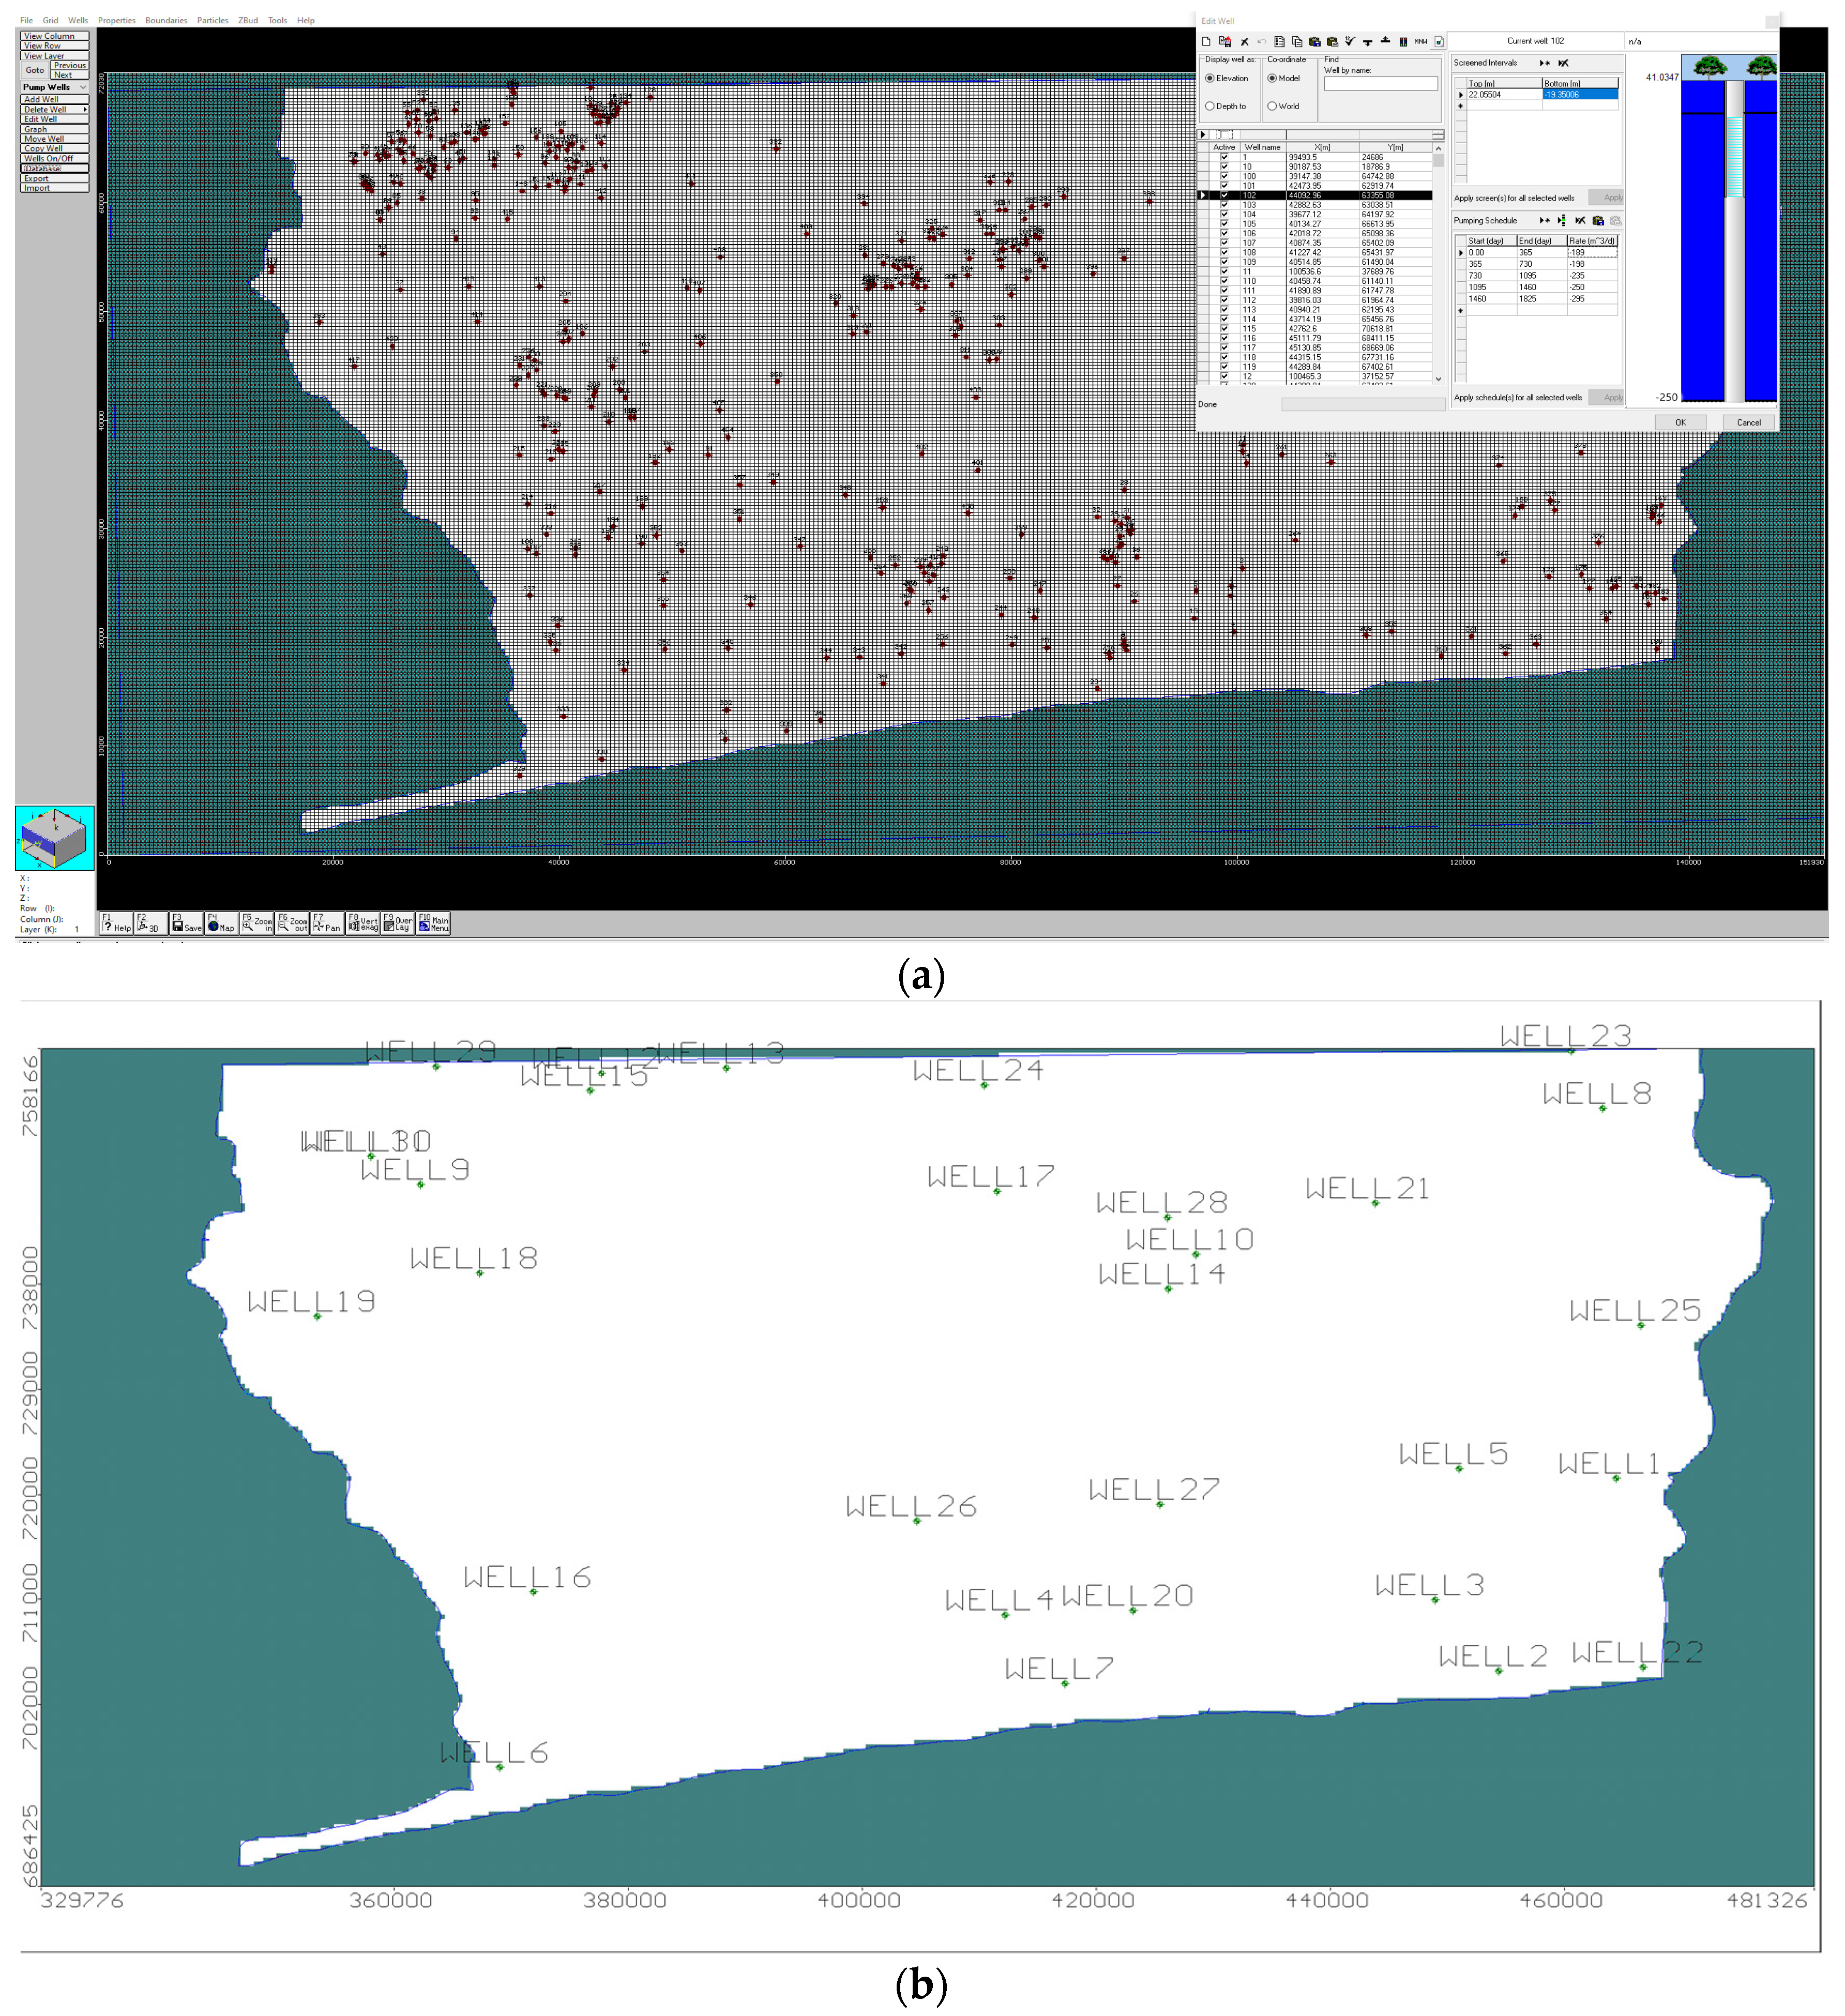
To create the three different layers, more than 200 borehole digging log data were analyzed and sorted. The borehole log data describing the vertical lithologic structure of the study area were collected from DGEau Benin (Direction Générale de l’Eau du Benin). The top of the first layer was set to the ground elevation using the DEM map, top and bottom of the second layer were estimated using the borehole digging log data and the borehole depths within the study region were between 21 and 307 m. The active area is in white color and the inactive area is in green color (Figure 2a).
2.2.2. Hydrogeologic Parameters and Observation Wells
The groundwater abstraction rates used in the study were collected from SONEB; the values ranged from 0.016 to 1881 m3/d/well. The location of pumping wells is shown in Figure 2a. Groundwater abstraction from the unlicensed wells was estimated using population, daily water use per capita, population growth rate, historic and actual pumping rate and number of wells. The abstraction rates estimated for unlicensed wells ranged between 21 and 41% of the licensed abstraction rate per township. Using the estimated abstraction rate, licensed and unlicensed pumping rates were integrated to the model.
Groundwater level and salt concentration collected from 30 wells across the area were used for the observation. Figure 2b shows the location of monitoring wells used for the model calibration. The data contains well’s location, groundwater head in the well, electrical conductivity (which has been used as indicator of SWI), taken time of the sample and the screen elevation. Five years data from 2015 to 2020 for groundwater head observation and salt concentration were gathered and imported to the model. The discharge data used for the model calibration was estimated in ArcGIS using the collected groundwater head and specific storage. The discharge estimation process used in this study is described by Dunlop et al. [17], and calculated using Equation (1):
where Q is the discharge, A is the area of influence of the well—which was estimated using Thiessen polygon in ArcGIS—Δh is the head change in well and Δt is the time period of the observed head change.
Q = A1 × Ss × Δs/Δt
2.2.3. Boundary and Initial Conditions
Groundwater head data in 167 pumping wells within the study region for year 2015 were collected from DGEau, interpolated in ArcGIS using the inverse distance weight method and imported into the model to be used as initial head. To avoid initial artificial correction, the initial salt concentration was set to an earlier time (2014) than the period of interest (period of calibration and validation from 2015 to 2020). Alassane et al. [38] used multivariate factor analysis to study the chemical evolution of the Continental Terminal aquifer in the study region in 2015; the salt concentration measured in wells and boreholes presented in the research was collected and added to the available database. The data ere interpolated in ArcGIS and used as the initial concentration for the transient state.
The conceptualization of the model considered four main boundary conditions: constant head, rivers, constant concentration and flow boundaries. The south border of the model domain, which represents the coastline, was defined as constant head boundary based on the mean sea level (MSL) values observed in Nigeria and Ghana in the past five years (www.psmsl.org, accessed on 10 December 2021)), and a constant concentration boundary set to 35,000 mg/L for salt concentration (value used for the Atlantic Ocean). The river boundary depicts the various tributaries of the rivers that run through the model domain. This step is critical for simulating the impact of surface water body on groundwater flow. River stage, river bottom, salt concentration and river width are all required data for a river boundary. For the river stage, the average river level value was used, and the river bottom elevation was calculated by subtracting the average river level with respect to MSL from soil surface elevation. Few rivers widths are known and reported by previous research on the study region; the unknown river width was estimated using two different locations on each side of the river, and the distance between the two points was estimated using Google Earth and was used as average width of the river. Ground elevation map with a resolution of 30 × 30 m, river level, river depth and salt concentration data were all collected from DGEau and SONEB. The soil surface elevation at each river level gauge point was estimated by projecting the point on the digital elevation map using ArcGIS, and by applying the “add surface information” tool, the soil surface elevation at each concerning point was determined. Nokoué lake is connected to the Atlantic Ocean in the south by the lagoon of Cotonou, which makes the lakes’ salinity considerably seasonally variable. The lagoon salinity observed from 2018 to 2020 is between 16,000 mg/L to 25 mg/L, where the highest value is observed in the dry season when water level decreases. In this study, the average salinity of 18,000 mg/L was used for the lagoon in the south. In the southeast of the study region, the lagoon of Grand Popo has a salinity varying from 2000 mg/L to 16,000 mg/L. All other rivers’ and lakes’ salinities were set to zero for the model configuration.
The water balance equation, illustrated in Equation (2), was used to estimate the yearly groundwater recharge from 2015 to 2020 [39,40]. The methodology used in this research is described by [41,42]:
where P is the total amount of precipitation (mm), Ia is the initial abstraction (mm), F (mm) is the actual infiltration and Q is the direct runoff.
P = Ia + F + Q for P > Ia
Equation (3) was used to calculate direct runoff:
Q = (P − 0.2S)2/(P + 0.8S)
The initial abstraction is equal to 20 percent of the soil’s maximum water retention capacity S (mm). It is illustrated in Equation (4):
Ia = 0.2S
The Soil maximum retention capacity S was calculated using CN values with the formula below:
S = (25400/CN) − 254
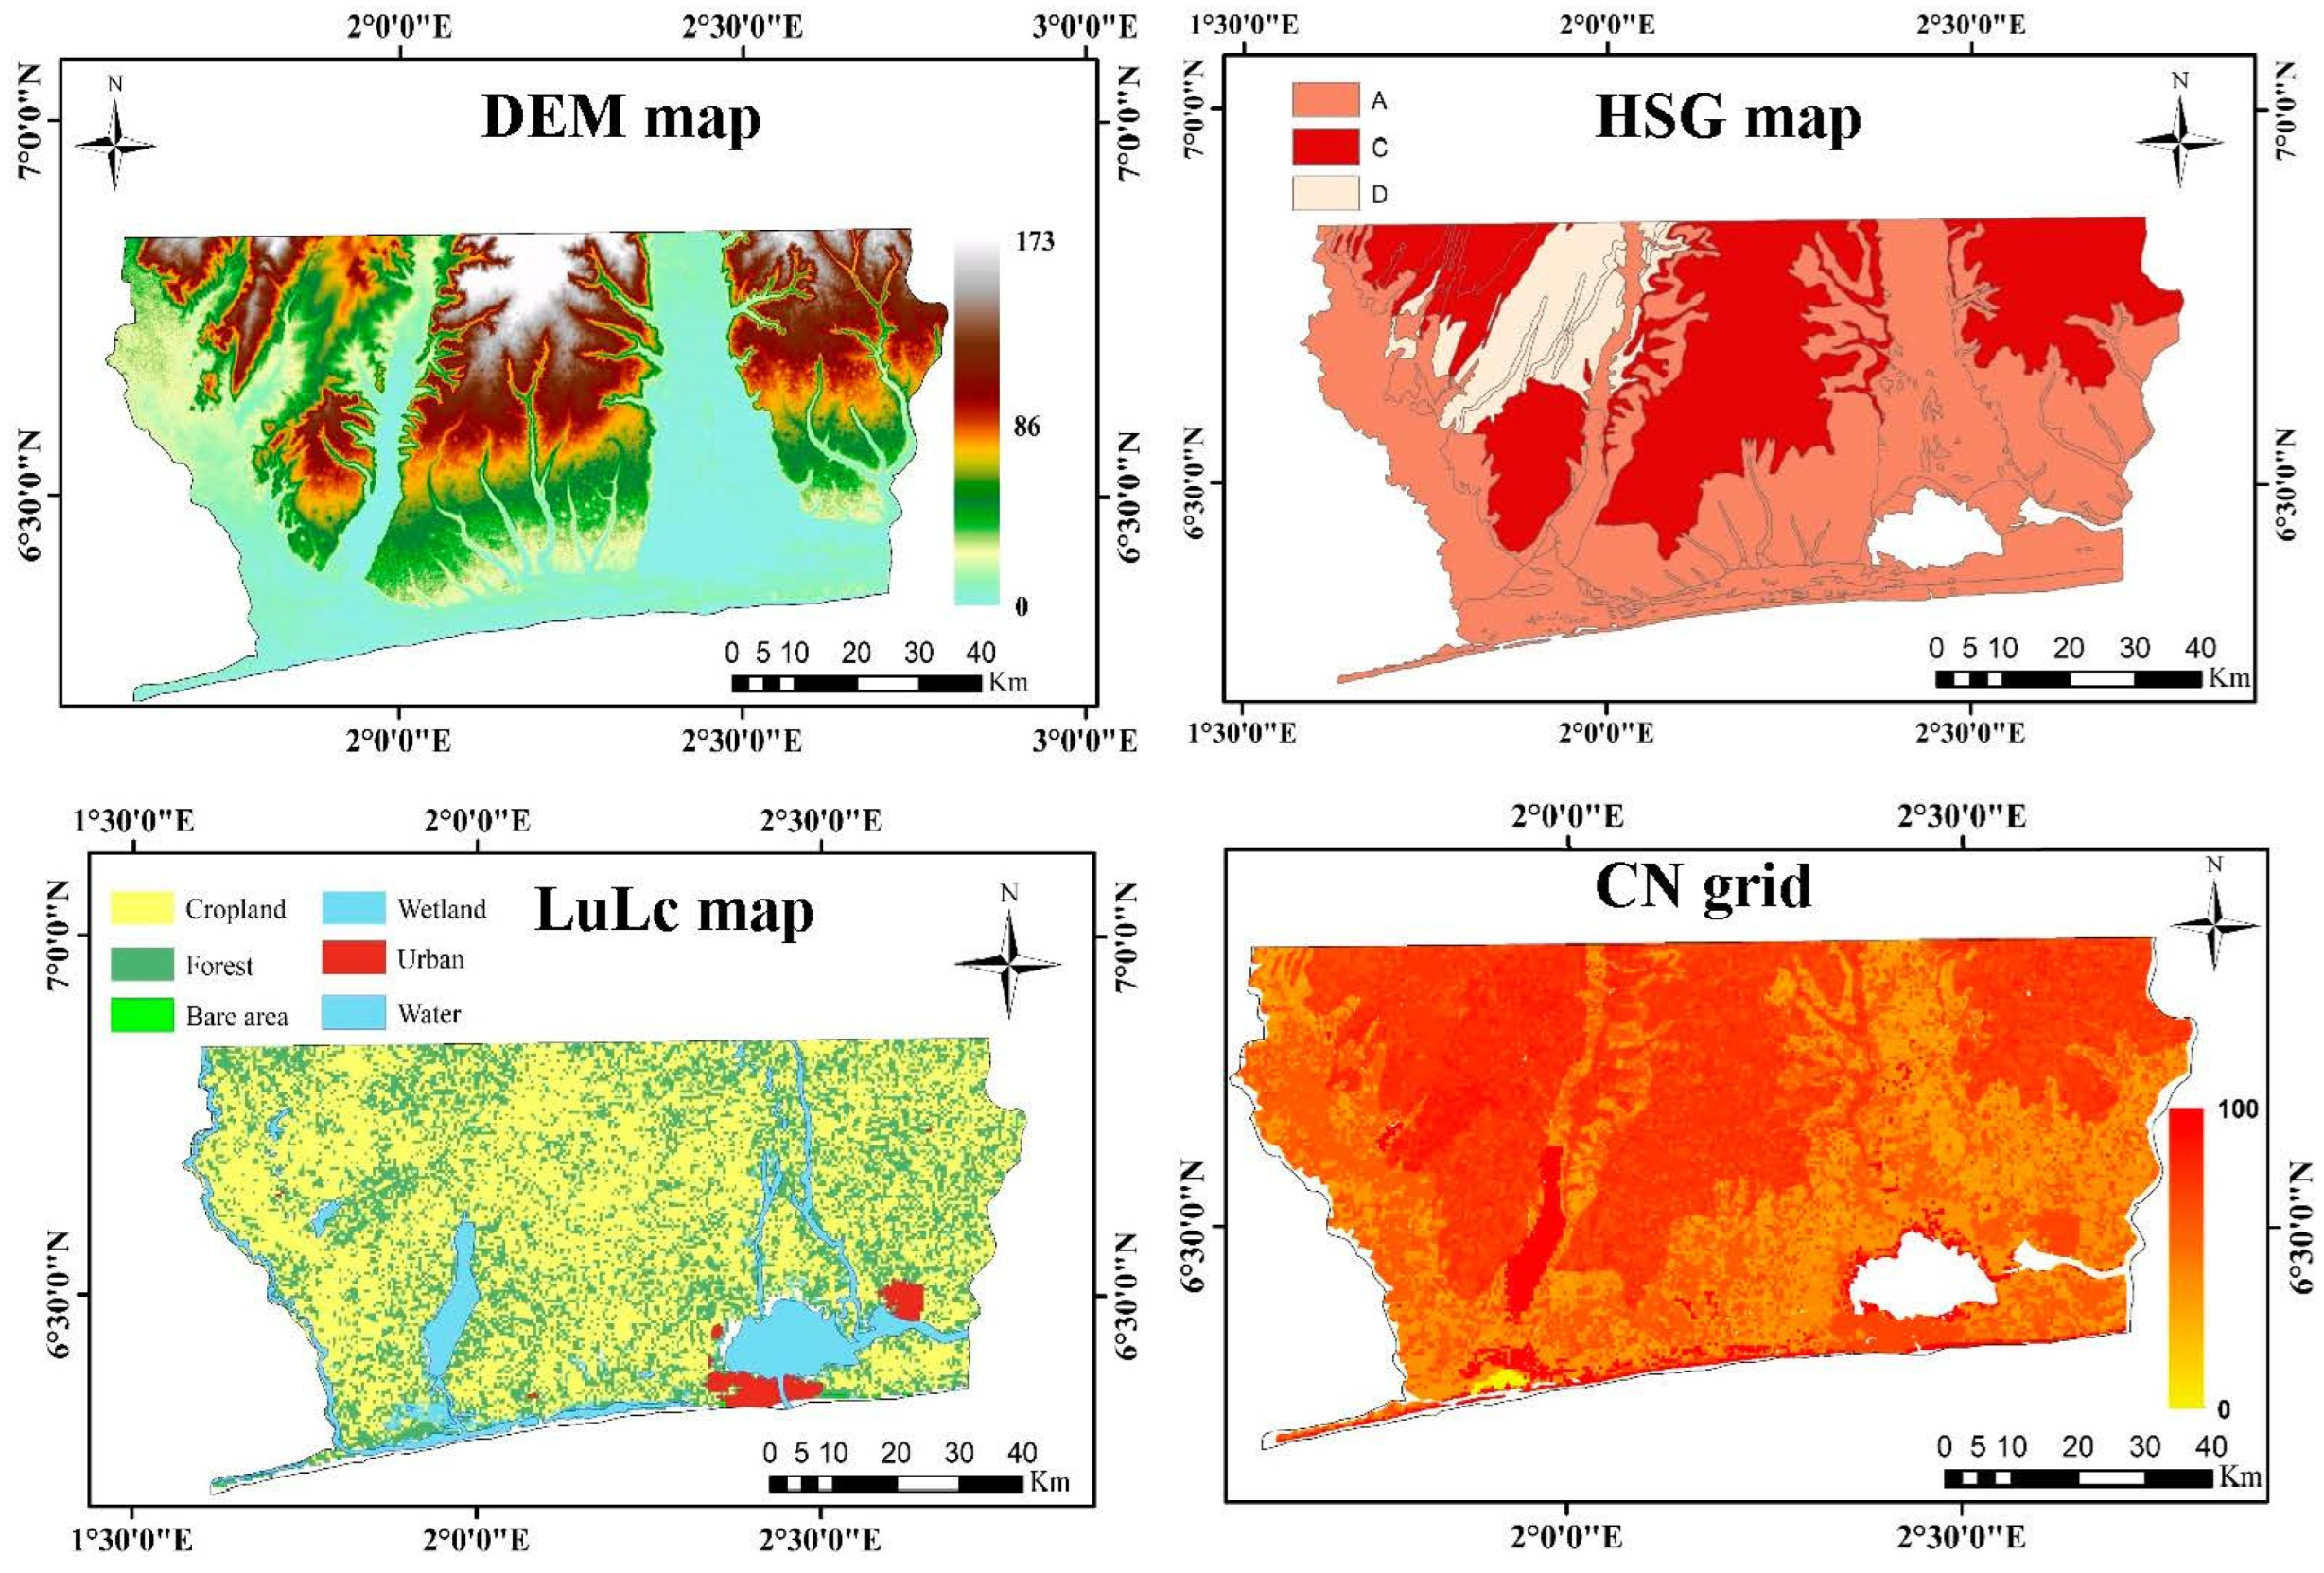
The soil map of the study area was classified into three hydrological soil groups (A, C, and D, as shown in Figure 3), which referred to the soil’s infiltration potential after prolonged wetting. Soil map, DEM map and LuLc map were used to generate the CN grid of the study region and are shown in Figure 3. The study area’s topography is relatively low, with an altitude range of 0 to 173 m and a slope range of 0 to 5.5. Yearly groundwater recharge from 2015 to 2020 was estimated using the CN grid and rainfall data. The estimated recharge was then imported to Visual MODFLOW as a shapefile polygon, which was prepared in ArcGIS.
2.3. Model Calibration
Model calibration is accomplished by changing the model’s parameters until an acceptable fit between model-computed and observed groundwater head and salt concentration is observed. In this study, the model was calibrated and validated over a period of five years, starting in 2015 and ending in 2020. The horizontal hydraulic conductivity (Kx, Ky: hydraulic conductivity in the direction of the model X-axis, Y-axis) was assumed to be ten times the vertical hydraulic conductivity (Kz: hydraulic conductivity in the direction of the model Z-axis). Average observed groundwater head and salt concentration in each year of the calibration period were set as target for the calibration. PEST software of Visual MODFLOW classic interface was used to assist during the calibration for parameters optimization, and the sensitivity of the model to each parameter was studied by decreasing and increasing the parameter value by 20%.
2.4. Impact of SLR and Pumping Rate Increase in 2050
The main climate hazard that Benin’s coastal area faces is SLR, which is likely causing coastal erosion. The IPCC [43] has predicted that SLR would have a negative impact on the coastal system, particularly in the Gulf of Guinea, where the average scenarios (IPCC scenario IS92a) have predicted that the sea level would rise by 20 cm in 2050 in the region of Cotonou, in the coastal region of Benin. In this study, only the average scenario was considered, after calibration and validation; the average sea level rise was used to simulate the impact of SLR on SWI for a 35-year period, taking reference from 2015. Boukari et al. [44] have studied the change in the groundwater pumping rate at the station of Godomey (south of the study area). The research concluded that the groundwater pumping rate in the region has been increasing since approximately 1970; from 1.7 × 10⁶ m3/yr in 1970 to over 17 × 106 m3/yr in 2006, which is ten times higher. Over the period 1996–2006, the annual rate of increase was constant at 0.9 × 10⁶ m3/yr; considering the constant increasing rate from 1996 to 2006, the pumping rate in 2050 was estimated and then used to simulate groundwater head and the saltwater intrusion area in 2050.
3. Results
3.1. Model Calibration
The main goal of the calibration is to produce results close to the field data by modifying the model parameters. It consists of adjusting the aquifer parameters until model-computed groundwater heads and salt concentration match with the observed values. Groundwater head and salt concentration collected in 167 pumping wells within the study area were interpolated using the inverse-distance weight method and used as the initial head for the model calibration. The run solver used was set to geometric multigrid solver (GMG); max. outer iterations and max. inner iterations were set to 50 and 20, respectively. The head change criterion was set to 0.0001 with a residual criterion of 10 and relaxation parameter of 1. Due to the scarcity of field measurement data, default dispersion parameters were chosen, where longitudinal dispersivity, horizontal/longitudinal dispersivity and vertical/longitudinal dispersivity were set to 10 m, 0.1 and 0.01, respectively. The model was set to run from 1 January 2015 to 31 December 2050. During the calibration and validation, each year from 2015 to 2020 was set as a target where the root mean square error (RMSE) and correlation coefficient were calculated between the model-computed and observed values from thirty wells in order to evaluate the performance of the model. The first run of the model produced a moderate correlation between the observed and model-computed hydraulic head, approximately 0.53 and very low correlation for the concentration, which was about 0.21. In order to get a better result with optimal calibration, PEST software of Visual MODFLOW was used for the model’s parameter optimization, considering the scale of field data. The PEST module was conceived to assist in model calibration; it works by adjusting the model parameters and disturbance until the fit between model outputs and field observations is optimized. Hydraulic conductivity, aquifer storage and specific yield were chosen for the optimization. PEST can change the parameters in such a way to minimize the objective function. It was configured considering that Kx, Ky are ten times Kz (logKx − logKz = 1) and bounded between 1 × 10⁻⁶ m/s and 1 m/s, and the boundaries were set considering the initial range of values calculated from the pumping test. All thirty observation wells were used for the objective function during the parameter optimization process. After a successful run, hydraulic conductivity values considerably changed and ranged from 2 × 10⁻⁶ m/s to 4 × 10⁻³ m/s. The optimized hydraulic conductivity values in the south of the study area were lightly lower than the initial values; at a few kilometers from the coastline and near the Nokoué lake, optimized hydraulic conductivity values were five to ten times higher than the initial. PEST modifies the hydraulic conductivity without considering the geological units; this could lead to an optimized value of hydraulic conductivity that does not correspond to the actual geological formation. Therefore, after a successful run, the optimized values were analyzed; in areas where the hydraulic conductivity values did not correspond to the geological units and/or were not included in the range of values calculated from pumping test, the initial values were maintained for the calibration. Ss and Sy were also modified after optimization, and the optimized values are summarized in Table 1. The optimized value of Sy was not considered for the calibration because the value increased from 0.21 to 0.33, which is likely high for the Continental Terminal aquifer of Benin. After reviewing the optimized parameters, they were manually updated to the model and ran again. The model run with optimized parameters produced a better result: the RMSE between the observed and model-computed groundwater head at the end of calibration was 0.97 m with a correlation coefficient of 0.82; the best fit was achieved when the standard deviation of the computed and observed head was less than 0.79 m. Furthermore, the solute transport calibration and validation produced acceptable results for the purpose of this study; RMSE, mean error and correlation coefficient between observed salt concentration and the calculated values were 13.38 mg/L, 13.01 mg/L and 0.79, respectively. Figure 4 shows the scatter diagram of groundwater head and salt concentration calibration result at the end of 2020, issued from the calibration in SEAWAT. The results indicated that the errors had been minimized and, generally, the simulation of groundwater head and salt concentration within the study area was closer to reality. The interval of statistics values obtained were compared to the results from El Hamidi et al. [21], and our model showed a similar match. The acceptable fit between the model-computed and observed values was reached based on the available data (5 years data), but due to the short length and monitoring data points scarcity, more evidence on data points and more field measurement are needed in the future for a better calibration and seawater intrusion wedge depth studies.
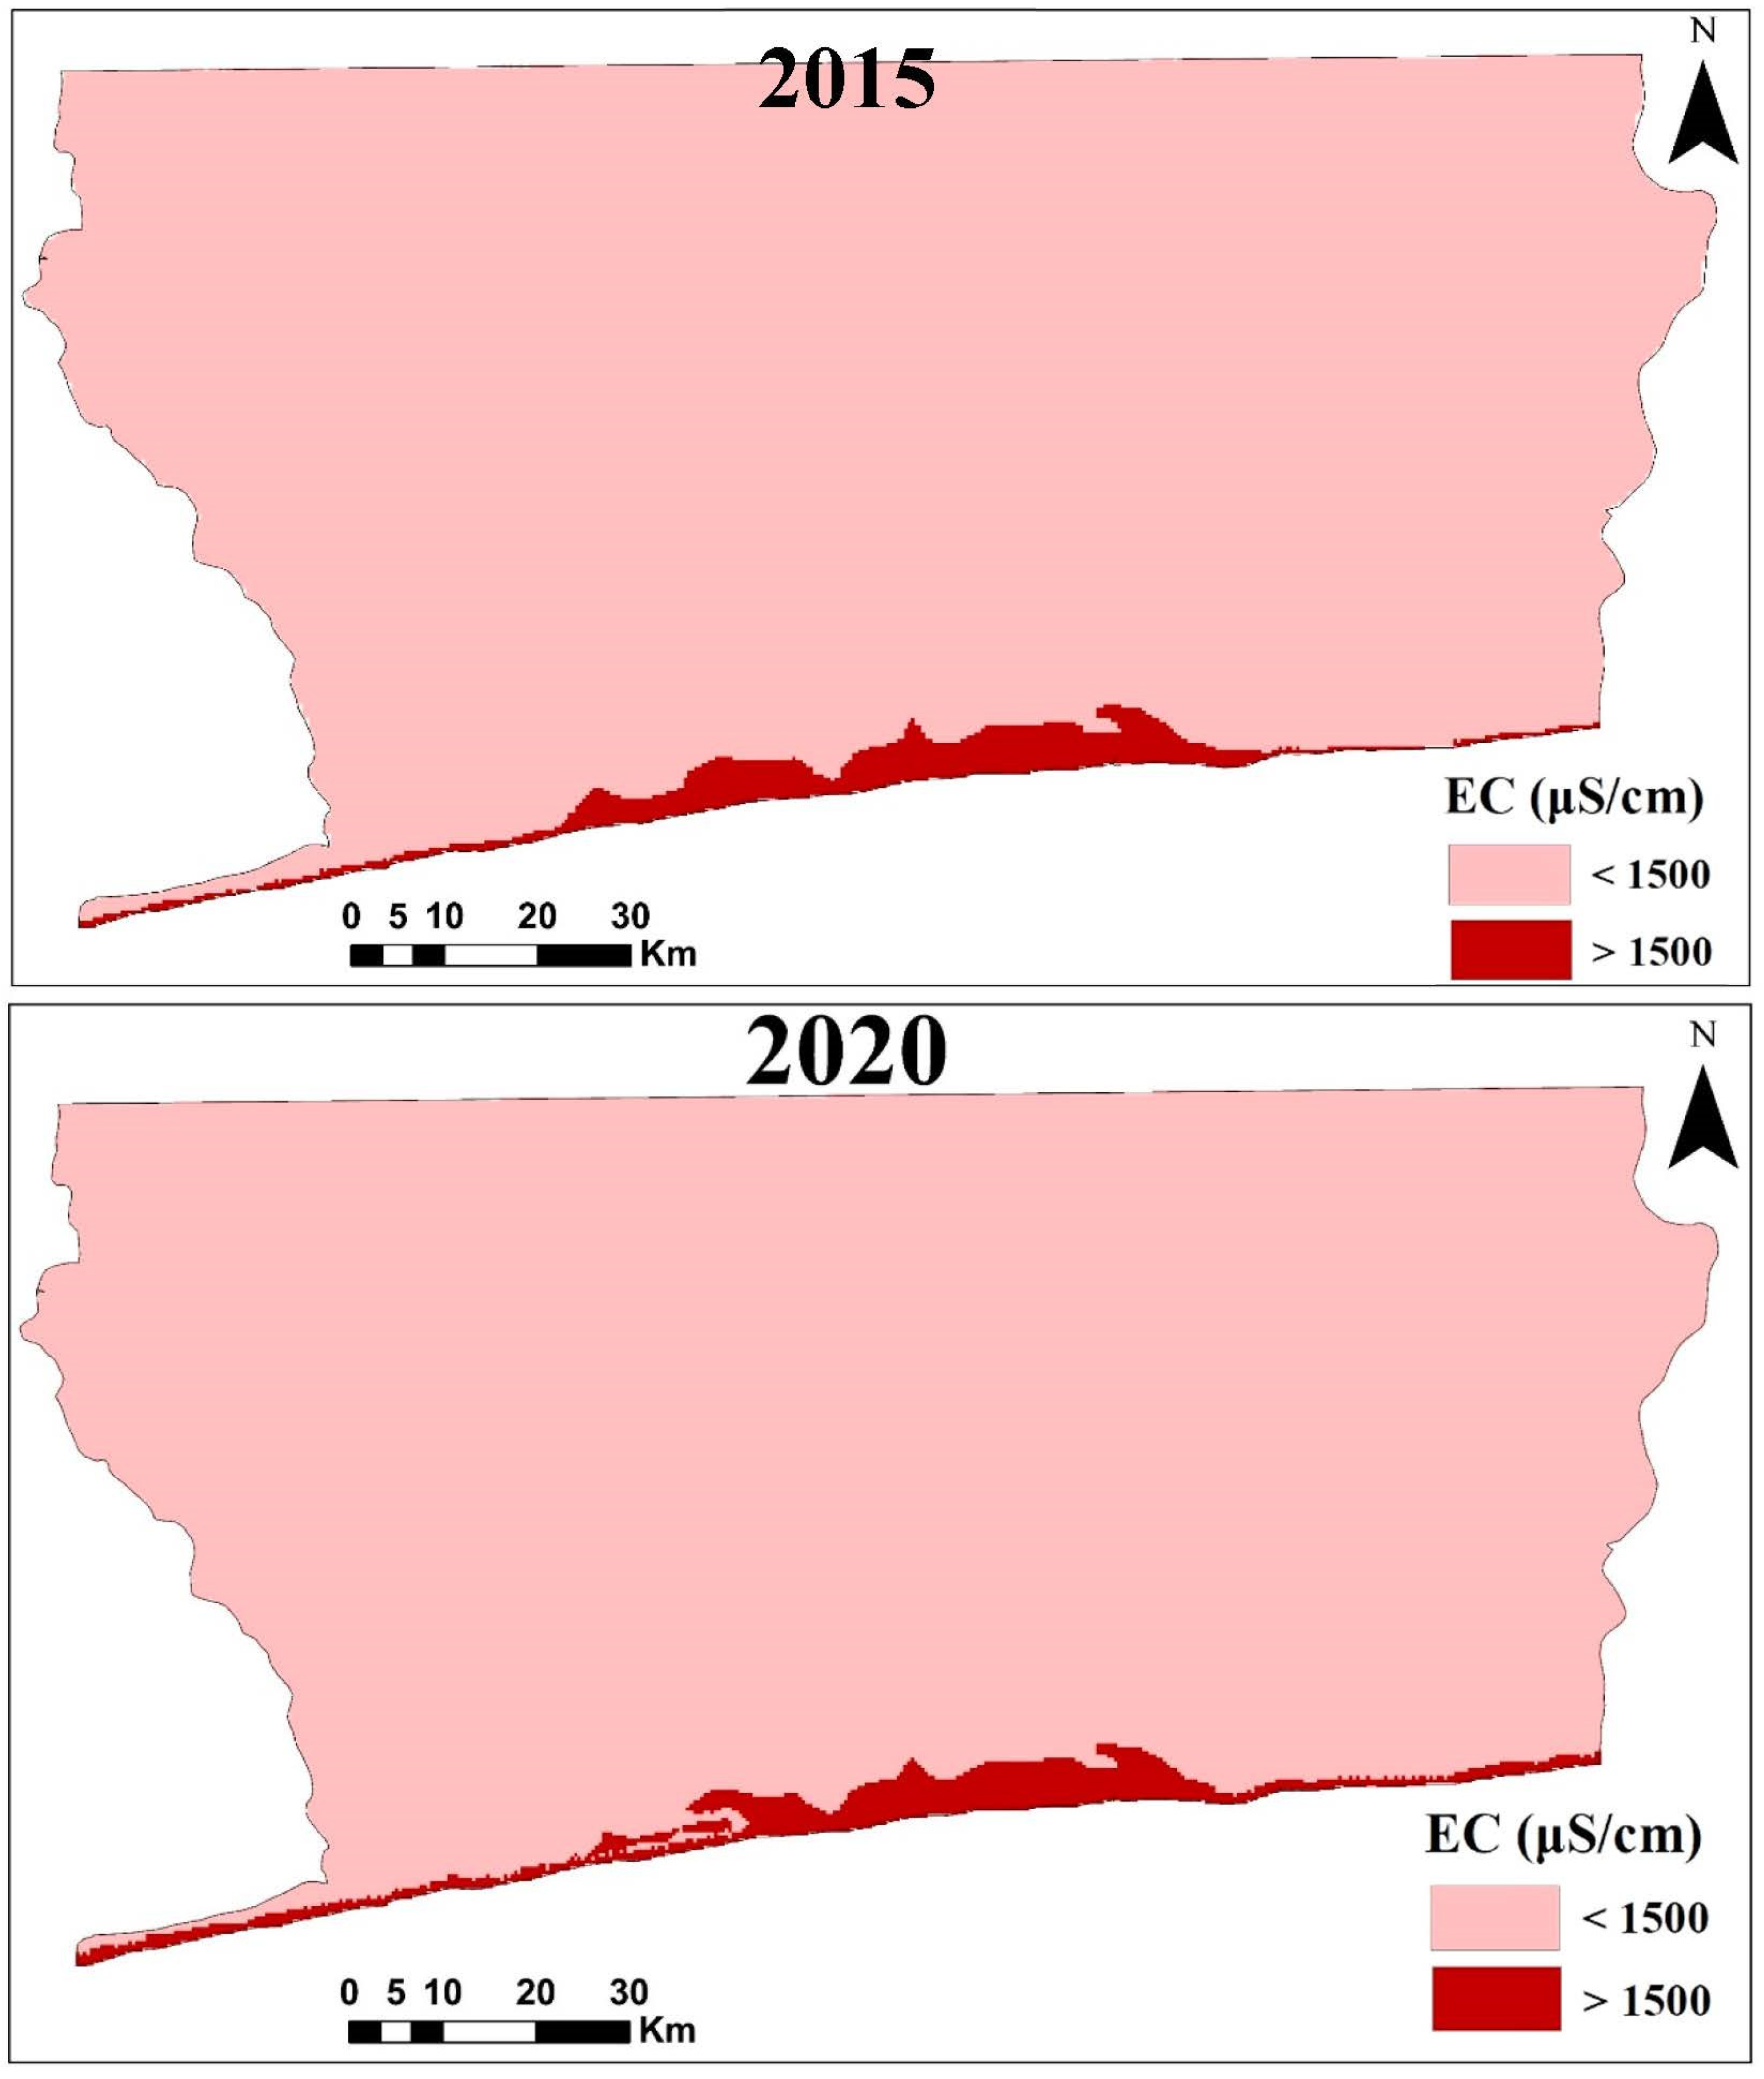
From 2015 to 2020, the model simulation shows that groundwater head decreased from 27.08 to 25.43 m, an average drawdown of 1.65 m in the period of calibration and validation, while in the same period, seawater intrusion area increased by 1.92 km2; taking reference from seawater intrusion area in 2015, which was estimated at 20.03 km2, the area increased to reach 21.95 km2. The spatial representation of SWI area in 2015 and 2020 is shown in Figure 5.
3.2. Zone Budget
The model simulations show that the area is over recharged from 2015 to 2019 because the annual inflow is lightly higher than the annual outflow. In 2020, the difference between input and output was negative, indicating that the outflow was higher than the inflow due to groundwater recharge decrease, which was caused by the annual rainfall decrease in 2020. The major sources of aquifer recharge are precipitation and river discharge. The amount of recharge varies from 2.91 million m3/d to 5.68 million m3/d, and the groundwater recharge peak was reached in 2019, the year of high precipitation. Zone budget results indicate that the aquifer storage lightly increased from 2015 to 2016, and dramatically start decreasing from 2017; this decreasing trend was mainly caused by the increasing pumping rate, because the government of Benin built more infrastructure and pumping stations in 2016 in order to satisfy the demand of drinking water (SONEB 2018). The difference in aquifer storage at the end of simulation was relatively small, indicating that the model reached the steady state.
3.3. Parameter Sensitivity Analysis
The sensitivity analysis was used to understand the role and importance of each single parameter in the model output assessment. It was studied by modifying each parameter at a time. The model sensitivity to groundwater recharge and boundary conditions was evaluated by increasing and decreasing each parameter by 20%. Aquifer hydraulic conductivity and storage coefficient were not used for the sensitivity analysis because the sensitivity of the simulation results to these parameters was proved during the calibration process, as they were repeatedly modified until the model gave a better result. The aquifer system in the study region is mainly recharged by infiltration of rainfall, which makes groundwater recharge an important parameter that can have greater impact on groundwater flow and solute transport simulation results. The annual groundwater recharge of each year during the calibration and validation period was firstly increased by 20% and secondly decreased by 20%; the results indicate that groundwater recharge slightly affected the simulation results when the values increased by 20% and when the values decreased by 20%; only the RMSE has slightly changed. In case of boundary conditions, river levels and MSL also increased or decreased by 20%; the increase and decrease in river level and MSL in both ways affected the model output, but their low impact on the model proved that the model is less dependent on boundary conditions.
3.4. Fresh Groundwater–Saltwater Interface (SHARP Interface)
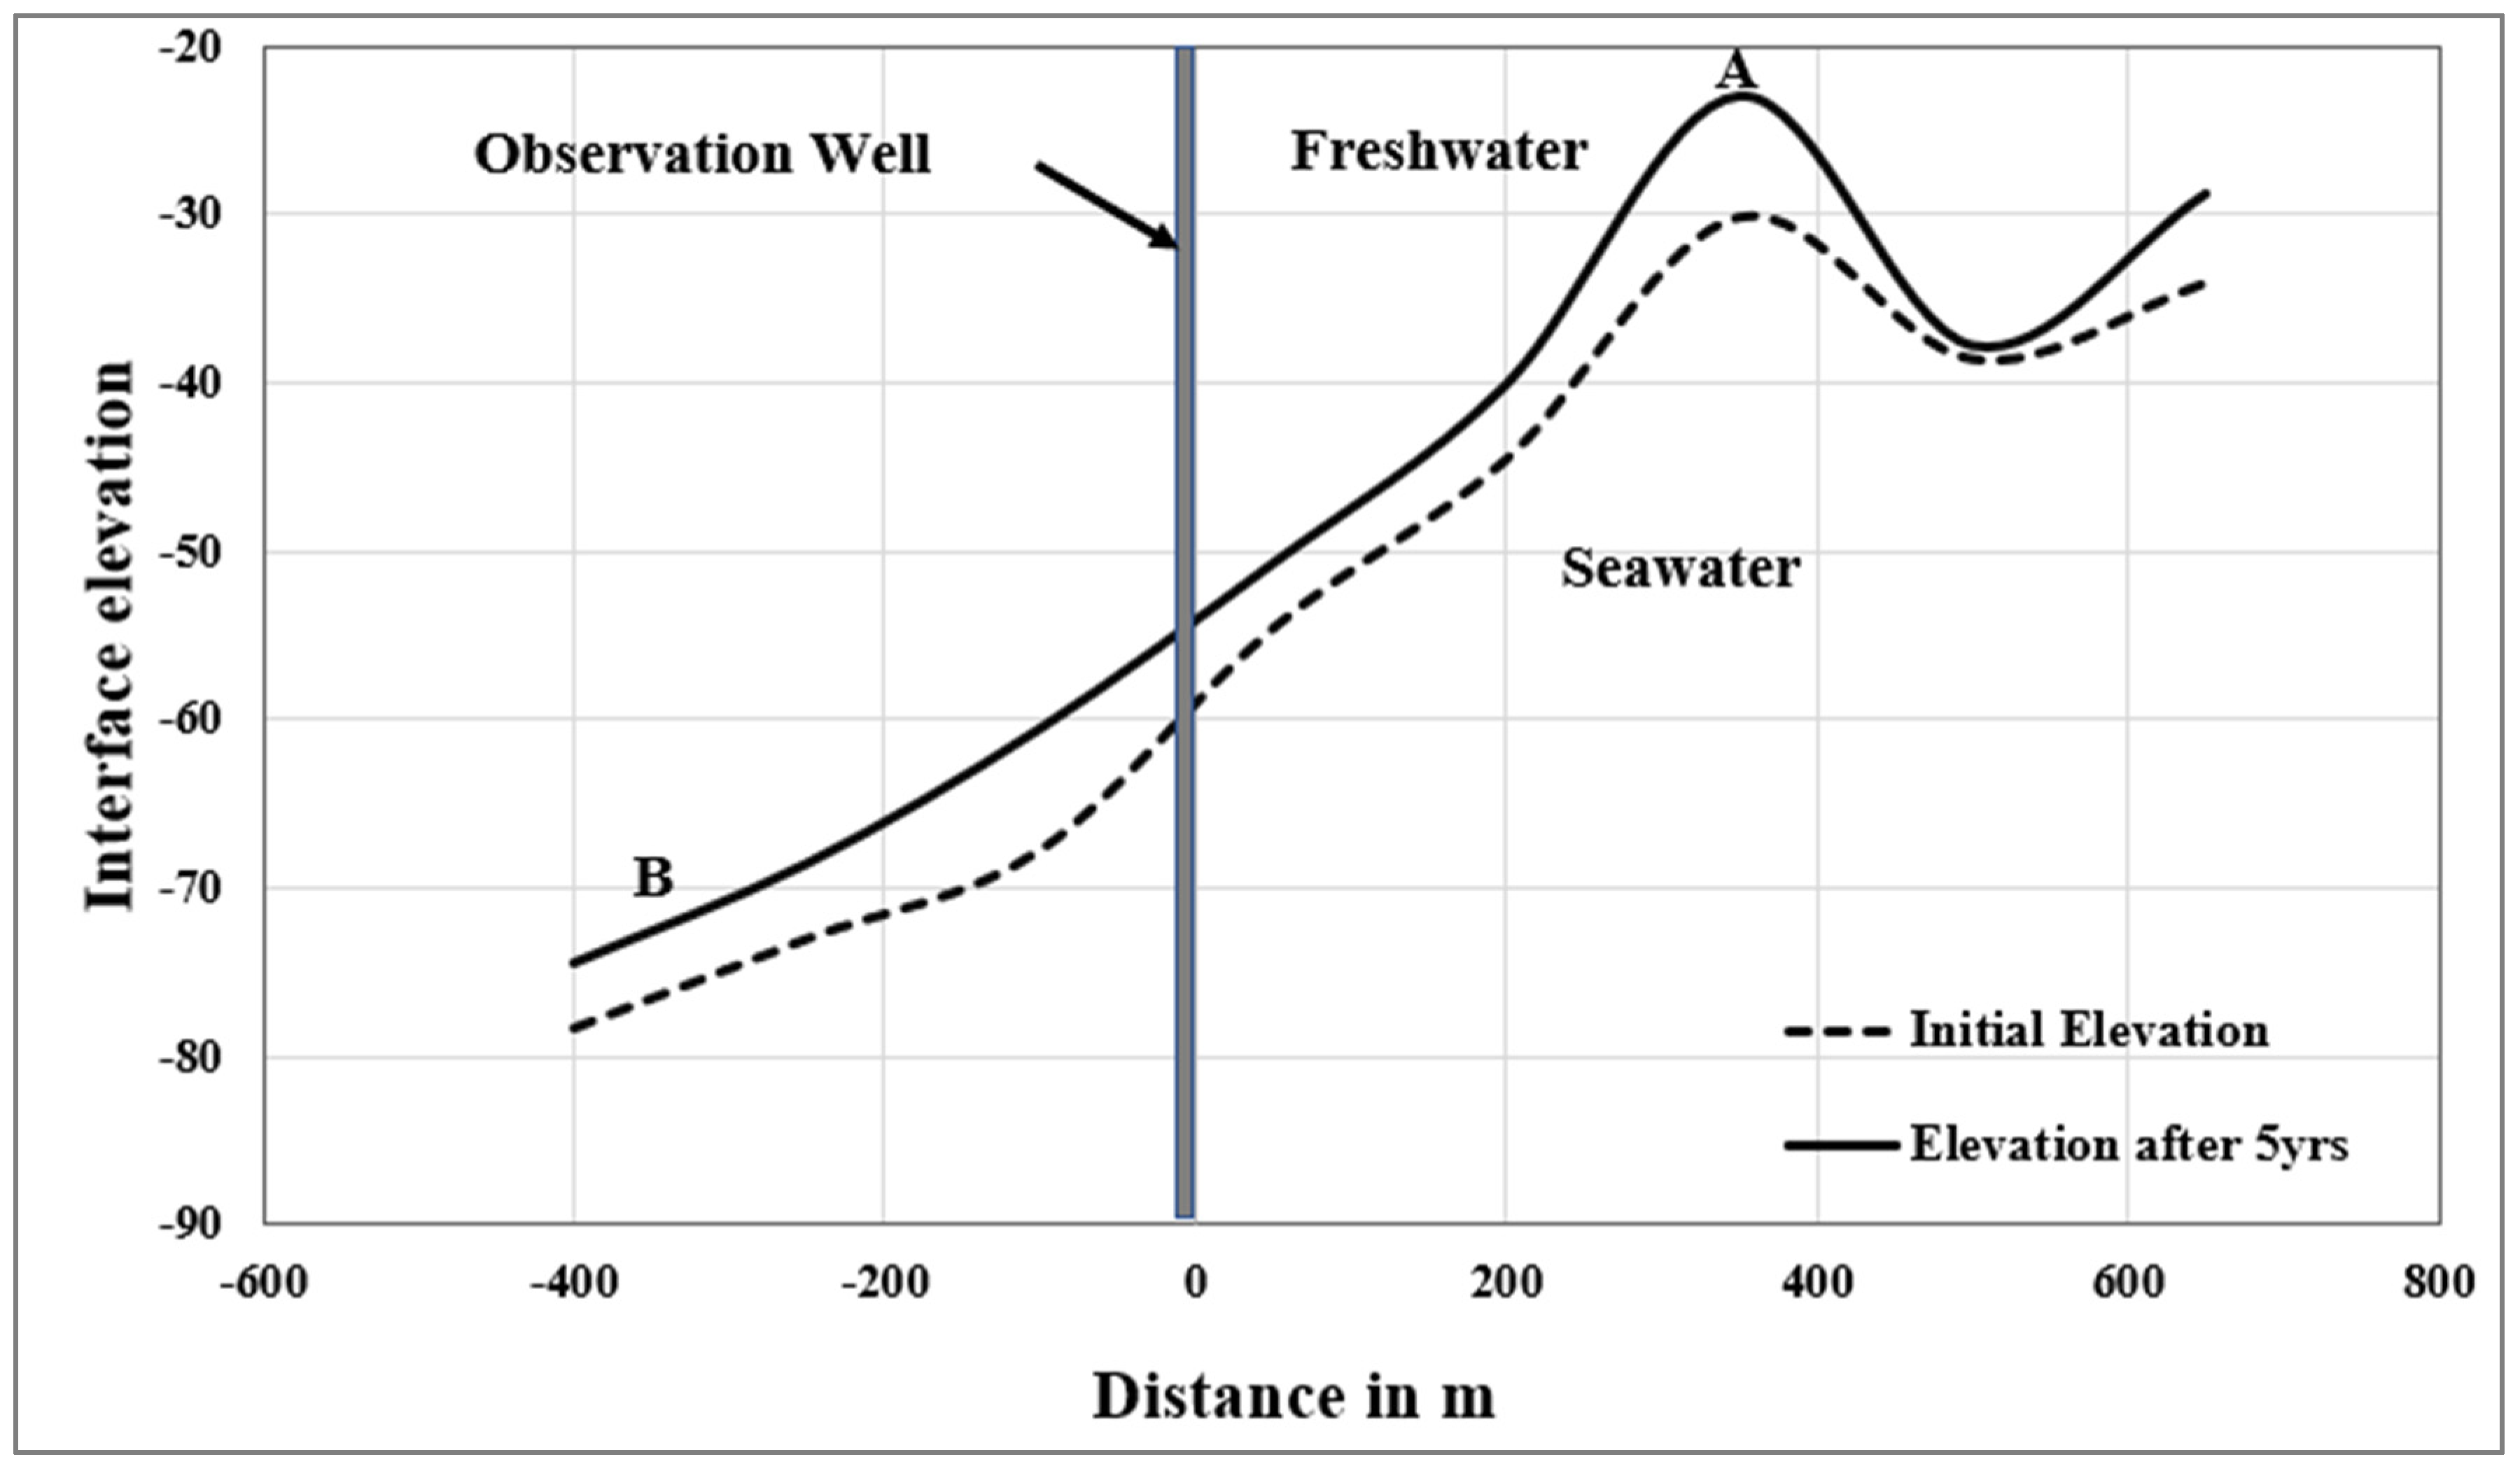
In a porous coastal aquifer system, fresh groundwater and saltwater are separated by a sharp interface when the freshwater–saltwater transition zone’s width is smaller than the thickness of the aquifer. In this study, the interface elevation variation of this transition zone under the influence of sea level fluctuation and groundwater pumping, which causes groundwater level fluctuation, was studied using the computer model SHARP, which is a quasi-three-dimensional numerical finite-difference model that simulates freshwater and saltwater flow separated by a sharp interface in layered coastal aquifer system; it was developed by USGS in 1990 [45]. The model was used to simulate the transition zone elevation variation in five years based on the observed data of groundwater level and seawater level. The model array dimensions were set to a vertical distance of 1000 m and a depth of 80 m, with an observation point located at 655 m from the coast.
The SHARP interface model has a variety of inputs such as groundwater level, aquifer hydraulic conductivity, aquifer thickness, effective porosity, specific gravity of freshwater and saltwater, viscosity of freshwater and saltwater, seawater level and seabed. The model was run for five years, and the transition zone elevation variation is shown in Figure 6. The simulation results show that the transition zone depth is between 20 and 80 m. Two different points, A and B, with different geographical locations were considered to study the interface elevation variation (Figure 6). At point A (about 250 m from the coast), when groundwater level declines about 1.06 m, the interface elevation has increased by about 7.22 m (from an initial elevation of −30.22 to −23 m) in a period of 5 years. At point B, which is located at 859 m from the coast, the groundwater level has declined by 0.5 m, causing an increase of 3.87 m of the freshwater–saltwater interface.
The sensitivity of the model to sea level rise was also studied by maintaining all other parameters and modifying only the sea level. The initial sea level was raised by 0.2 m (IPCC 2007 scenario), and the stress of the model was evaluated. When sea level rises by 0.2 m, the interface elevation rises by an average of 0.84 m, which means that a sea level rise of 0.2 m would intensify the process of seawater intrusion into the coastal aquifer of Benin, resulting in a migration of the transition zone. When groundwater level declines or seawater level rises, saltwater intrudes into the aquifer, resulting in the rise of the initial freshwater–saltwater transition zone, while moving away from the coast, the transition zone becomes deeper.
3.5. Impact of SLR and Pumping Rate Increase in 2050
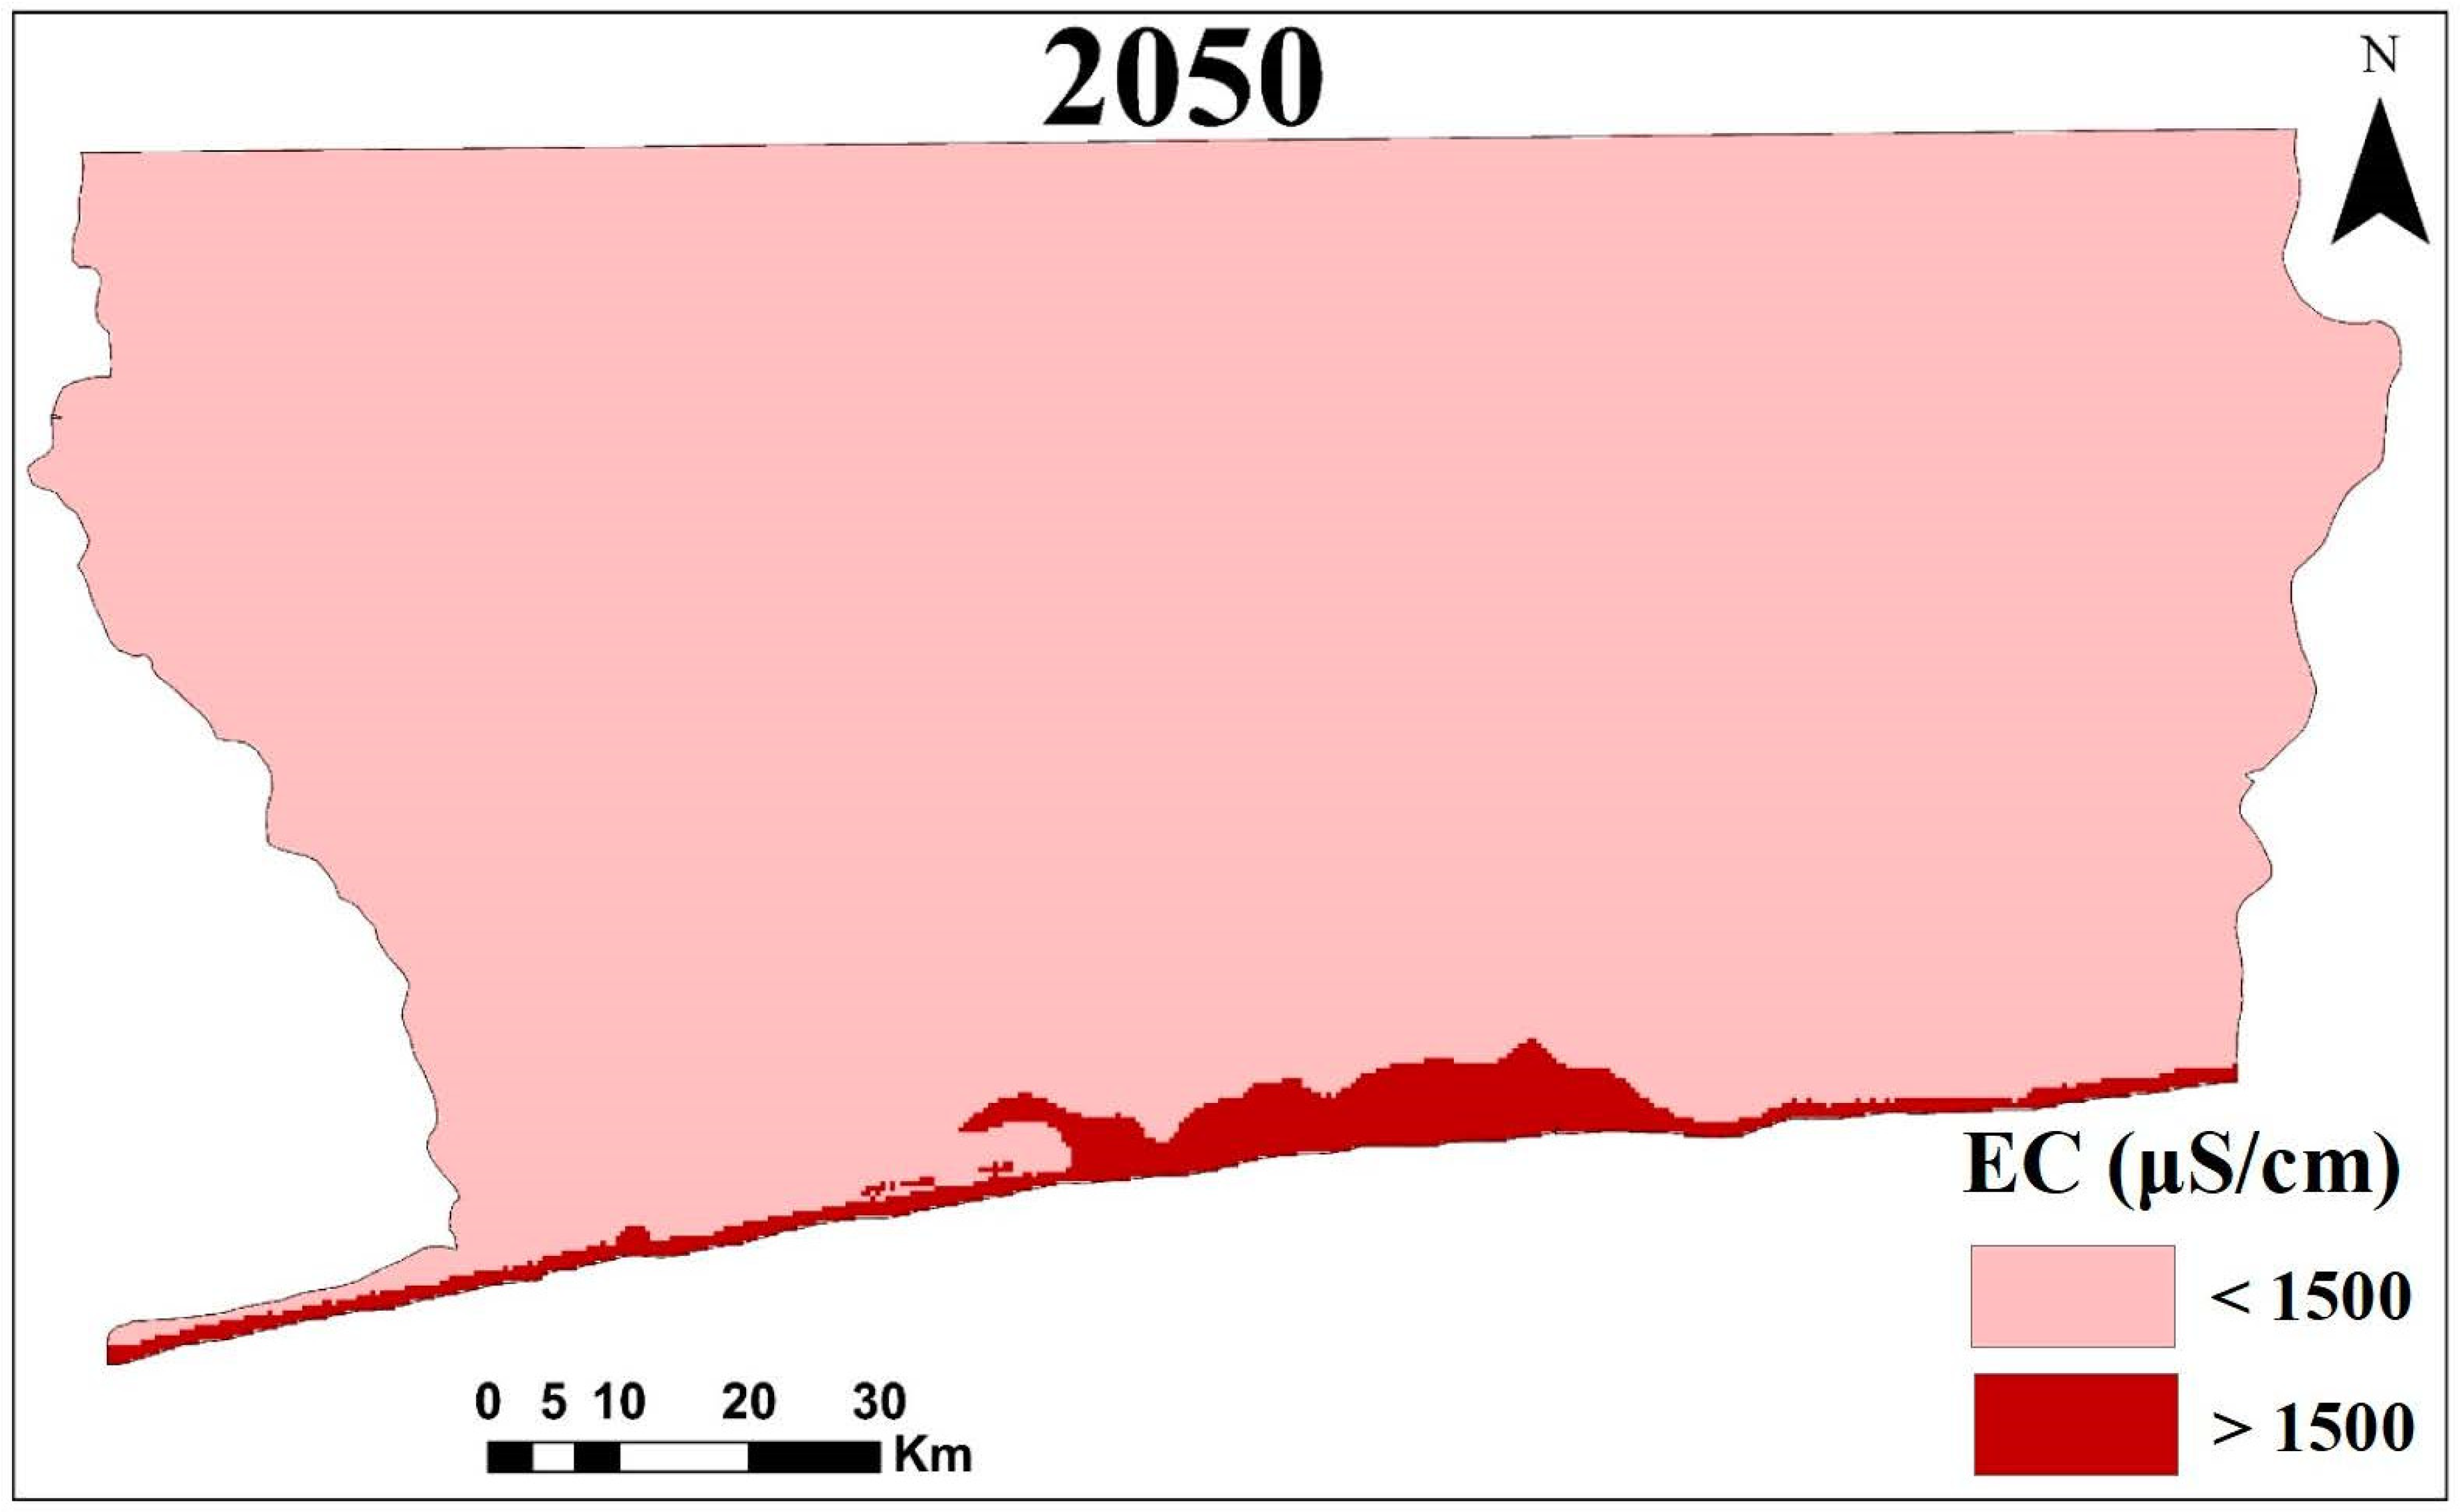
In order to evaluate the future trend of SWI, the 3D variable density model was used to predict SWI in 2050. The model inputs and settings were maintained from the previous run, and only groundwater abstraction rate and sea level were modified. The effect of the pumping rate increase, sea level rise and the combination of sea level rise with pumping rate increase were studied. The model predicts that in 2050, an average SLR of 20 cm would lead to additional intrusion of 21.2 km2 relatively to the intrusion area in 2020 (Figure 7); the intrusion would be observed up to 1 km, 150 m inland, where townships such as Cotonou, Abomey-Calavi, Grand-Popo, Ouidah and Seme would be more affected by the SLR. Considering the yearly groundwater abstraction rate increase of 0.9 × 10⁶ m3/yr, the model has predicted that SWI area would increase by 19.66 km2, mainly in the town of Cotonou, where the inland distance is estimated at 1 km, 60 m. The effect of combined SLR and groundwater pumping rate increase would result in the most severe SWI, leading to an additional intrusion area of 35.53 km2 in a period of 30 years, taking reference from 2020 (Table 2). The severe effect would mainly affect the townships of Cotonou and Abomey-Calavi, where the intrusion would expand about 2 km, 750 m inland.
3.6. Effect of Countermeasures
It is necessary to recognize that SLR and anthropogenic activities will cause, in the future, a severe salinization of coastal aquifers. Groundwater salinization takes time to be observed because it requires an enormous volume of fresh water to be replaced by brackish water or saltwater. The approach of solutions is important to prevent, compensate and/or retard the salinization process. Various countermeasures are used around the world such as freshwater injection, groundwater pumping rate reduction, saline groundwater abstraction, underground barrier by creating a foreland to delay saline groundwater flow and artificial recharge increase. Artificial recharge is a well-known, common approach used to increase the total available groundwater resources; it has been successfully used in many countries such as Israel [46]. Artificial recharge methods are carried out for many reasons: to use the aquifer as temporarily storage, to prevent or retard seawater intrusion, to conserve surplus water during a low-demand period and to increase the water storage of the aquifer. In this study, artificial recharge was investigated using a 3D conceptual model to retard the saline intrusion in the coastal region of Benin. Two techniques of artificial recharge were studied: water spill onto the surface using an infiltration pond and water injection through a multipurpose well or single-injection well. These techniques were chosen based on the realization cost, the availability of a source of water and the geologic units of the study region; the hydrogeological formations of the study region were largely described by [37,38,47,48,49]. The three-dimensional model developed in this study was used for the simulation, injection wells were implanted at a few kilometers from the coastline in the most severe salinization area and the water injection rate was set based on the rate suggested by national report of DGEau, [50]. The infiltration pond installation area was chosen considering the topographic condition, land availability, the proximity to a river and the bed geological unit. The technique of freshwater injection through deep wells has been used in several countries [51,52], using surface water and/or rainfall. This study has performed a simulation using ten injection wells with 200 m3/d/well. The suggested location for managed aquifer recharge facilities is shown in Figure 8 (figure showing only the cells’ location). The model sensitivity to injection wells was studied by adding a single well at once; the results proved that the model is less sensitive to injection wells, and the impact was observed only after adding five injection wells at a total injection rate of 1000 m3/d. After increasing the total injection volume to 2000 m3/d, this lightly retarded the seawater intrusion by reducing the SWI rate (Table 3). The pond used for the simulation has a volume of 250,000 m3, and the location grid cells are shown in Figure 8. After adding a pond, the model was run for 12,775 days, and the results show that seawater intrusion rate was retarded by reducing the intrusion area by about 4.20 km2. The pond, combined with the recharge wells, has reduced the intrusion area by about 4.24 km2 for the simulation period (Table 3).
4. Discussion
SWI and groundwater flow in the coastal region of Benin were modeled considering several key parameters such as the pumping rate, hydraulic conductivity, groundwater recharge and the surface water–groundwater interaction. The model was calibrated and validated over a five-year period and used to simulate the seawater intrusion in 2050 under the influence of SLR and groundwater pumping increase. The model accuracy was evaluated using RMSE and coefficient of determination between the observed and model-computed values. The validation parameters were in agreement with the values produced by Dunlop et al. [17] and Mastrocicco et al. [18].
The acceptable match observed between the calculated and observed values is based on the small length of the data used in this research. For further research and in order to improve the calibration from this research, a long length of accurate data, more observation points and field measurements, such as data related to the estimation of dispersivity and seawater intrusion depth, are required. The model results show that groundwater head decreased from 2015 to 2020 by about 1.65 m. Groundwater head decline in the study area has been previously highlighted by Kambiri [53] and Angelo [54]; both researchers have proved the occurrence of groundwater level decrease in hand-dug wells in the cities of Ouèdo and Kpomasse in the southern region of our study area. Amoussou et al. [55] have reported rainfall diminution in Benin, which has literally led to groundwater recharge decrease, mainly in the south, while the population keeps increasing with a yearly growth rate of 2.7%, resulting in the increase in groundwater abstraction in public, hand-dug and private wells for domestic, agricultural and industrial use. The groundwater level decline is a result of groundwater recharge decrease caused by the diminution of precipitation and the overexploitation of groundwater resources; the overexploitation has advanced the groundwater level depletion at the biggest pumping station of Godomey and its surrounding areas. The overpumping of groundwater at the pumping station of Godomey is causing groundwater level decline in the region, which is consequently leading to an intrusion of brackish water from Lake Nokoué [30].
In a five-year period, the SWI area increased by about 1.92 km2; the intrusion area increase is the result of groundwater level depletion leaving place for saltwater to move inland. For a preliminary check purpose, the results of our research were compared to the results of a geophysical survey performed in the Continental Terminal aquifer at the southern edge of Lake Nokoué by Sognon et al. [30]. The geophysical survey estimates the average depth of the saline intrusion to 20 m away from the Lake Nokoué, proving the occurrence of SWI into the aquifer from the salted lagoon in the southern edge of Lake Nokoué, which connects the lake to the Atlantic Ocean. The results from the geophysical survey were confirmed by the previous studies of Boukari et al. [44], which use only electrical conductivity to reveal an effective salt intrusion from Lake Nokoué at the pumping station of Godomey. The results from the present research come to confirm the previous research and show an advanced seawater intrusion in the pumping station of Godomey from the ocean as well as Lake Nokoué; about 200 m away from the lake, the model showed high salt concentration in the groundwater. From the model results, the advanced seawater intrusion in the cities of Cotonou, Abomey-Calavi and Ouidah is in good match with the results of Yang et al. [56], who used a modified GALDIT method to classify these cities as area with very high vulnerability to seawater intrusion.
Fresh groundwater–saltwater transition zone migration was simulated using the SHARP model. The goal of the use of the SHARP interface model in this section is to show fresh groundwater–saltwater transition zone vertical profile variation in the function of the groundwater level and sea level fluctuation in the coastal region of Benin. The transition zone is heavily influenced by the groundwater level decrease and sea level rise. In a period of five years, when groundwater level decreased by 1.06 m, the transition zone elevation increased by about 7.22 m at an observation point located at 250 m from the coast. From 2015 to 2020, the groundwater level decrease was spatially varying between 0.45 and 2.98 m; based on the model results, this led to the interface rise between 1.65 and 7.22 m. The effect of groundwater level decrease on the transition zone is severe compared to the SLR; the results proved that the problem of groundwater level decline in the coastal region of Benin is severely emphasizing the SWI.
In order to study the future trends of SWI, the 3D variable density model was used to predict SWI for the next 30 years from 2020 to 2050. The previous model parameters were maintained, and only the groundwater pumping rate and sea level were modified. The effect of SLR, groundwater pumping rate increase and the combination of groundwater pumping rate increase with the SLR were studied. The model simulations show that saltwater may mostly intrude into the south middle of the domain, into the cities of Cotonou, Abomey-Calavi, Ouidah and Allada, about 57.48 km2 would be affected and the saltwater intrusion would move to approximately 2 km 750 m inland. Some cities such as Cotonou and Abomey-Calavi would be more affected by the SWI, with an almost 1 km 500 m additional intrusion. The combination of increasing the groundwater pumping rate and SLR would lead to severe seawater intrusion, which will affect the population living in the region by decreasing the available freshwater. People living at a distance less than 2 km from the coast would be more vulnerable because the water salinity in hand-dug wells would also increase.
Climate scenarios have predicted that by 2100 the annual precipitation will decrease in Benin [57]. Similarly, Batablinlè [58] used climate change scenarios RCP4.5 and RCP8.5 to forecast future changes in evapotranspiration and rainfall in the south of Benin (basin of Mono). Both scenario results predict a decrease in rainfall, while evapotranspiration will increase. These conditions, combined with the SLR and a groundwater pumping increase, could be disastrous for the coastal region of Benin. Therefore, it is important to develop solutions to increase the groundwater level and retard SWI.
The 3D variable-density groundwater flow model of the study area built in SEAWAT was used to simulate a managed aquifer recharge system, which aims to retard the SWI and balance the variability in supply and demand. Little research has worked on SWI control using the SEAWAT model. Abd-Elhamid et al. [59] presented a solution to mitigate seawater intrusion in coastal aquifers with coastal earth fill, considering future sea level rise, using SEAWAT model applied to a real case study of the Biscayne aquifer, Florida, USA. Abd-Elhamid et al. [60] studied a new methodology to control seawater intrusion in the Nile Delta aquifer, Egypt. The study used the SEAWAT model to simulate the effectiveness of TRAD (treatment of wastewater and recharge to the aquifer, abstraction of brackish water and desalinization) to control SWI in the Nile Delta aquifer of Egypt. Taking steps from this research, the present study used SEAWAT to simulate a managed aquifer recharge system in the study region in order to control the SWI. The mitigation measures attempted in this research have showed acceptable results, but their practicability must be discussed. The first scenario applied is the injection of freshwater through deep wells. A daily injection of 2000 m3/d lightly impacted the SWI by reducing the affected area from 57.48 to 57.45 km2 (about 0.03 km2) and decreasing the inland intrusion distance by about 2.5 m in the region of Abomey-Calavi. The sensitivity of the model to deep freshwater injection proved that a minimum daily injection of 1000 m3 is required, and the effectiveness of this method requires an important amount of water. The low effect of the deep injection wells is probably caused by the difference between the injection rate and the abstraction rate, as the pumping rate is extremely higher than the daily injection rate. Harvested rainwater and/or surface water could be the source of water for deep wells injection. The second scenario applied a pond to retard the SWI. The volume of the pond was estimated considering the nearest river head and the model cells’ size; the pond will be installed in area allowing easy percolation and will collect storm water and rainfall. The pond installation aims to ease both shallow and deep infiltration, with boreholes installed at the bottom of the pond. South Korea has adopted a practical case in Jeju, where wells are installed in the pond’s bed to facilitate deep infiltration; the facilities have increased groundwater recharge by 3.8% from 2010 to 2015 [61]. In this study simulation, the pond has increased the groundwater level in the surrounding region and reduced the SWI area from 57.48 to 53.28 km2, resulting in the movement of the fresh groundwater/saltwater interface towards the sea by about 190 m in the township of Abomey-Calavi and 160 m in the township of Cotonou. The third scenario combined the pond with recharge wells, which showed a better result on SWI control by reducing the intrusion rate and consequently retarding the SWI.
The effect of each countermeasure on groundwater head was studied, and all the scenarios have showed low increase in groundwater level. The impact of managed aquifer recharge facilities on groundwater head is less effective than the effect on the SWI area because the artificial recharge facilities are installed near the coast where the saline distribution is severe. For future research, accurate data, more observation wells and long length data are required to improve the model calibration and validation, as well as SLR prediction from recent scenarios to include recent climate change conditions.
5. Discussion and Conclusions
The present study focuses on the coastal area of Benin where groundwater is persistently used. Taking steps from previous research, the study evaluated by means of modeling tools the moderate SWI area in the coastal region of Benin and conducted an application of simple conceptual mitigation measures by installing artificial recharge wells and a pond. The model was built using SEAWAT in Visual MODFLOW, and it was calibrated and validated from 2015 to 2020 using 30 observation wells’ data for groundwater head and salt concentration in groundwater. The calibration result showed an acceptable match between the model-computed and observed values for both hydraulic head and salt concentration, with acceptable statistical results for the purpose of this research; therefore, the model is close to the reality. Based on the model’s results, groundwater hydraulic head dropped from 2015 to 2020 (about 1.65 m) while SWI area increased by about 1.92 km2 (taking reference from 2015). The area increase was evident due the decrease in precipitation and the increase in the groundwater pumping rate, because the government of Benin has recently, in 2016, constructed more groundwater pumping facilities to respond to the increasing water demand. SWI was not only from the ocean but also an intrusion from the salted bevel in the southern edge of Lake Nokoué. Considering the predicted average SLR at Benin’s coast and the increase in groundwater use, the model forecasted the impact of climate change and anthropogenic activities on salt distribution in the coastal aquifers in 2050.
Finally, the research has attempted to retard SWI by suggesting pond and artificial recharge wells installation. The model prediction for the recharge pond showed a considerable reduction of the SWI area in the year 2050. Research results show that, because of SLR due to climate change combined with the groundwater pumping rate increase in the coastal area of Benin for agricultural, domestic and industrial use, the region aquifers are more vulnerable to SWI, and the SWI intrusion area keep increasing while groundwater head keep decreasing. Based on the results from this study and previous research, it is urged to take actions from the countermeasures proposed. This is expected to be the basic standard in future studies; furthermore, data length, long-period-monitored groundwater head and observed salt concentration data, dispersivity and salinity vertical profiles’ observation from field measurements are required in the future to improve calibration and the reliability of the model. The effectiveness in the application of each mitigation measure is important for groundwater resource protection and management in the coastal area of Benin; in addition, basin-wide water conservation measures and the restoration of natural ecosystems that slow surface water flow and promote percolation, such as wetlands, will be carried out in future research.
Author Contributions
Conceptualization, A.A. and J.-B.L.; methodology, J.-S.Y. and A.A.; software, A.A.; validation, J.-S.Y., A.A.; formal analysis, J.-S.Y.; investigation, A.A.; resources, J.-B.L.; data curation, A.A. and J.-B.L.; writing—original draft preparation, A.A., J.-B.L. and J.-S.Y.; writing—review and editing, J.-S.Y.; visualization, J.-S.Y.; supervision, J.-S.Y.; project administration, J.-S.Y.; funding acquisition, J.-S.Y. All authors have read and agreed to the published version of the manuscript.
Funding
This research is supported by Basic Science Research Program through the National Research Foundation of Korea (NRF) funded by the Ministry of Education (NRF-2021R1A2C2007595).
Institutional Review Board Statement
Not applicable.
Informed Consent Statement
Not applicable.
Data Availability Statement
Please contact the first author.
Acknowledgments
This study was conducted in the hydraulic laboratory of Kookmin University (Seoul, Republich of Korea) to provide an update on the situation of seawater intrusion in Benin’s coastal region. We thank the editors and reviewers for their constructive comments that helped to significantly improve this manuscript.
Conflicts of Interest
The authors declare no conflict of interest.
References
- Werner, A.D. Simmons CT Impact of sea-level rise on seawater intrusion in coastal aquifers. Ground Water 2009, 47, 197–204. [Google Scholar] [CrossRef] [PubMed]
- Antonellini, M.; Mollema, P.; Giambastiani, B.; Bishop, K.; Caruso, L.; Minchio, A.; Pellegrini, L.; Sabia, M.; Ulazzi, E.; Gabbianelli, G. Saltwater intrusion in the coastal aquifer of the southern Po Plain, Italy. Hydrogeol. J. 2008, 16, 1541–1556. [Google Scholar] [CrossRef]
- Alfarrah, N.; Walraevens, K. Groundwater Overexploitation and Seawater Intrusion in Coastal Areas of Arid and Semi-Arid Regions. Water 2018, 10, 143. [Google Scholar] [CrossRef] [Green Version]
- Kouzana, L.; Benassi, R.; Ben Mammou, A.; Sfar Felfoul, M. Geophysical and hydrochemical study of the seawater intrusion in Mediterranean semi-arid zones. Case of the Korba coastal aquifer (Cap-Bon, Tuni-sia). J. Afr. Earth Sci. 2010, 58, 242–254. [Google Scholar] [CrossRef]
- Goldman, M.; Gilad, D.; Ronen, A.; Melloul, A. Mapping of seawater intrusion into the coastal aquifer of Israel by the time domain electromagnetic method. Geoexploration 1991, 28, 153–174. [Google Scholar] [CrossRef]
- Torres-Martinez, J.A.; Mora, A.; Ramos-Leal, J.A. Constraining a density-dependent flow model with the transient electromagnetic method in a coastal aquifer in Mexico to assess seawater intrusion. Hydrogeol. J. 2019, 27, 2955–2972. [Google Scholar] [CrossRef] [Green Version]
- Qahman, K.; Larabi, A. Evaluation and numerical modeling of seawater intrusion in the Gaza aquifer (Pal-estine). Hydrogeol. J. 2006, 14, 713–728. [Google Scholar] [CrossRef]
- Saadeh, M. Seawater Intrusion in Greater Beirut, Lebanon. In Climatic Changes and Water Resources in the Middle East and North Africa; Environmental Science and Engineering; Springer: Berlin, Germany, 2008. [Google Scholar]
- Barlow, P.; Reichard, E. Saltwater intrusion in coastal regions of North America. Hydrogeol. J. 2010, 18, 247–260. [Google Scholar] [CrossRef]
- Chang, S.W.; Chung, I.-M.; Kim, M.-G.; Tolera, M.; Koh, G.-W. Application of GALDIT in Assessing the Sea-waterIntrusion Vulnerability of Jeju Island, South Korea. Water 2019, 11, 1824. [Google Scholar] [CrossRef] [Green Version]
- Krystel, M.R.D. The vulnerability to climate change of Cotonou (Benin): The rise in sea level. Environ. Urban. 2007, 19, 65–79. [Google Scholar] [CrossRef]
- Hu, B.X.; Cao, Y.; Zhao, W.; Bao, F. Identification of hydraulic conductivity distributions in density dependent flow fields of submarine groundwater discharge modeling using adjoint-state sensitivities. Sci. China Earth Sci. 2016, 59, 770–779. [Google Scholar] [CrossRef]
- Chang, Y.; Hu, B.X.; Xu, Z.; Li, X.; Tong, J.; Chen, L.; Zhang, H.; Miao, J.; Liu, H.; Ma, Z. Numerical simulation of sea-water intrusion to coastal aquifers and brine water/freshwater interaction in south coast of Laizhou Bay, China. J. Contam. Hydrol. 2018, 215, 1–10. [Google Scholar] [CrossRef] [PubMed] [Green Version]
- Priyanka, B.N.; Maheshab, A. Parametric studies on saltwater intrusion into coastal aquifers for anticipate sea level rise. Aquat. Procedia 2015, 4, 103–108. [Google Scholar] [CrossRef]
- Rajabi, M.M.; Ataie-Ashtiani, B.; Simmons, C.T. Polynomial chaos expansions for uncertainty propagation and moment independent sensitivity analysis of seawater intrusion simulations. J. Hydrol. 2015, 520, 101–122. [Google Scholar] [CrossRef]
- Langevin, C.D.; Shoemaker, W.B.; Guo, W. MODFLOW-2000, the U.S. Geological Survey Modular Ground-Water Model: Documentation of the SEAWAT-2000 Version with Variable Density Flow Process (VDF) and the Integrated MT3DMS Transport Process (IMT); Open File Report 2003-426; U.S. Geological Survey: Reston, VA, USA, 2003. [CrossRef]
- Dunlop, G.; Palanichamy, J.; Kokkat, A.; James, E.J.; Palani, S. Simulation of saltwater intrusion into coastal aquifer of Nagapattinam in the lower cauvery basin using SEAWAT. Groundw. Sustain. Dev. 2019, 8, 294–301. [Google Scholar] [CrossRef]
- Mastrocicco, M.; Busico, G.; Colombani, N.; Vigliotti, M.; Ruberti, D. Modeling actual and future seawater intrusion in the Variconi coastal wetland (Italy) due to climate and landscape changes. Water 2019, 11, 1502. [Google Scholar] [CrossRef] [Green Version]
- Diersch, H.J.G. Feflow Finite Element Subsurface Flow and Transport Simulation System-Reference Manual; Uer’s Manual, White Papers-Release 5.3; DHI-WASY: Berlin, Germany, 2006. [Google Scholar]
- Voss, C.I.; Provost, A.M. SUTRA, a Model for Saturated–Unsaturated Variable Density Ground-Water Flow with Energy or Solute Transport; U.S. Geological Survey: Reston, VA, USA, 2002; Volume 2, p. 4231.
- ELHamidi, M.J.; Larabi, A.; Faouzi, M. Numerical Modeling of Saltwater Intrusion in the Rmel-Oulad Og-bane Coastal Aquifer (Larache, Morocco) in the Climate Change and Sea-Level Rise Context (2040). Water 2021, 13, 2167. [Google Scholar] [CrossRef]
- Ranjbar, A.; Cherubini, C.; Saber, A. Investigation of transient sea level rise impacts on water quality of unconfined shallow coastal aquifers. Int. J. Environ. Sci. Technol. 2020, 17, 2607–2622. [Google Scholar] [CrossRef]
- Tiruneh, N.D.; Motz, L.H. Three Dimensional Modeling of Saltwater Intrusion Coupled with the Impact of Climate Change and Pumping. In Proceedings of the World Water and Environmental Resources Congress, Philadelphia, PA, USA, 23–26 June 2003; pp. 1–9. [Google Scholar]
- Ferguson, G.; Gleeson, T. Vulnerability of coastal aquifers to groundwater use and climate change. Nat. Clim. Chang. 2012, 2, 342. [Google Scholar] [CrossRef]
- Solomon, S.; Qin, D.; Manning, M.; Averyt, K.; Marquis, M. Climate Change 2007: The Physical Science Basis: Working Group I Contribution to the Fourth Assessment Report of the IPCC; Cambridge University Press: Cambridge, UK, 2007. [Google Scholar]
- Sefelnasr, A.; Sherif, M. Impacts of seawater rise on seawater intrusion in the Nile Delta aquifer, Egypt. Groundwater 2014, 52, 264–276. [Google Scholar] [CrossRef]
- Rasmussen, P.; Sonnenborg, T.; Goncear, G.; Hinsby, K. Assessing impacts of climate change, sea level rise, and drainage canals on saltwater intrusion to coastal aquifer. Hydrol. Earth Syst. Sci. 2013, 17, 421–443. [Google Scholar] [CrossRef] [Green Version]
- Uddameri, V.; Singaraju, S.; Hernandez, E.A. Impacts of sea-level rise and urbanization on groundwater availability and sustainability of coastal communities in semi-arid South Texas. Environ. Earth Sci. 2014, 71, 2503–2515. [Google Scholar] [CrossRef]
- Dibaj, M.; Javadi, A.A.; Akrami, M. Modelling seawater intrusion in the Pingtung coastal aquifer in Taiwan, under the influence of sea-level rise and changing abstraction regime. Hydrogeol. J. 2020, 28, 2085–2103. [Google Scholar] [CrossRef]
- Sognon, L.M.; Yalo, N.; Lawson, F.A.; Alle, C. Geophysical characterization of salted bevel of the continental terminal aquifer at the southwestern edge of lake Nokoué in Benin. Larhyss J. 2018, 34, 69–95. [Google Scholar]
- Hounsinou, S.P. Assessment of potential seawater intrusion in a coastal aquifer system at Abomey—Ca-lavi Benin. Heliyon 2020, 6, e03173. [Google Scholar] [CrossRef]
- Datta, B.; Vennalakanti, H.; Dhar, A. Modeling and control of saltwater intrusion in a coastal aquifer of Andhra Pradesh, India. J. Hydrol. Environ. Res. 2009, 3, 148–159. [Google Scholar] [CrossRef]
- Abd-Elhamid, H.F.; Javadi, A.A. A Cost-Effective Method to Control Seawater Intrusion in Coastal Aquifers. Water Resour. Manag. 2011, 25, 2755–2780. [Google Scholar] [CrossRef]
- Yang, Y.; Song, J.; Simmons, C.T.; Ataie-Ashtiani, B.; Wu, J.; Wang, J.; Wu, J. A conjunctive management framework for the optimal design of pumping and injection strategies to mitigate seawater intrusion. J. Environ. Manag. 2021, 282, 111964. [Google Scholar] [CrossRef]
- Hussain, M.S.; Javadi, A.A.; Sherif, M.M. Three Dimensional Simulation of Seawater Intrusion in a Regional Coastal Aquifer in UAE. Procedia Eng. 2015, 119, 1153–1160. [Google Scholar] [CrossRef] [Green Version]
- Rejani, R.; Jha, M.K.; Panda, S.N.; Mull, R. Simulation Modeling for Efficient Groundwater Management in Balasore Coastal Basin, India. Water Resour. Manag. 2007, 22, 23–50. [Google Scholar] [CrossRef]
- Boukari, M.; Alassane, A. Les ressources en eaux souterraines du bassin sédimentaire côtier de la Répu-blique du Bénin. Afr. Geosci. Rev. 2007, 14, 283–301. [Google Scholar]
- Alassane, A.; Dovonon, L.F.; Trabelsi, R.; Boukar, M.; Zouari, K.; Odeloui, D.J.; Mama, D. Chemical evolu-tion of the continental terminal shallow aquifer in the south of coastal sedimentary basin of Benin (West- Africa) using multivariate factor analysis. J. Water Resour. Prot. 2015, 7, 496–515. [Google Scholar] [CrossRef] [Green Version]
- Kumar, C.P. Estimation of Natural Ground Water Recharge. ISH J. Hydraul. Eng. 1977, 3, 61–74. [Google Scholar] [CrossRef]
- Gomaa, M.A.; Mohallel, S.A.; Elsheikh, A.E. Estimation of Recharge Quantity of the Fractured Basement Aquifer in the Southern Portion of Eastern Desert, Egypt; Critical Importance of the Hydrological and Chemical Criteria. Middle East J. Appl. Sci. 2016, 6, 759–773. [Google Scholar]
- Ezz, H.; Gomaah, M.; Abdelwares, M. Watershed Delineation and Estimation of Groundwater Recharge for Ras Gharib Region, Egypt. J. Geosci. Environ. Prot. 2019, 7, 202–213. [Google Scholar] [CrossRef] [Green Version]
- Caletka, M.; Šulc, M.M.; Karásek, P.; Fučík, P. Improvement of SCS-CN initial abstraction coefficient in the Czech Republic: A study of five catchment. Water 2020, 12, 1964. [Google Scholar] [CrossRef]
- International Panel on Climate Change (IPCC). AR5 Synthesis Report: Climate Change; IPCC: Geneva, Switzerland, 2007. [Google Scholar]
- Boukari, M.; Viaene, P.; Azonsi, F. Three-dimensional modeling of a coastal sedimentary basin of south-ern Benin (West Africa). In Applied Groundwater Studies in Africa; IAH Selected Papers Volume 13; Ad-elana, S., MacDonald, A., Eds.; CRC Press: New York, NY, USA, 2008; Chapter 26; pp. 437–456. [Google Scholar]
- Essaid, H.I. The Computer Model SHARP, A Quasi-Three-Dimensional Finite-Difference Model to Simulate Freshwater and Saltwater Flow in Layered Coastal Aquifer Systems; Water-Resources Investigations Report 90-4130; U.S. Geological Survey: Reston, VA, USA, 1990; 181p.
- Guttman, J.; Negev, I.; Rubin, G. Design and Testing of Recharge Wells in a Coastal Aquifer: Summary of Field Scale Pilot Tests. Water 2017, 9, 53. [Google Scholar] [CrossRef] [Green Version]
- Agossou, A.; Yang, J. Comparative study of groundwater vulnerability to contamination assessment meth-ods applied to the southern coastal sedimentary basin of Benin. J. Hydrol. Reg. Stud. 2021, 35, 100803. [Google Scholar] [CrossRef]
- IRB. Etude de Cartographie Géologique et Prospection Minérale de Reconnaissance au Sud du 9ème Paral-Lèle. Report; Istituto Recerche Breda, FED-OBEMINES: Milano, Italy, 1987. [Google Scholar]
- Géohydraulique. Notice Explicative de la Carte Hydrogéologique á L’échelle 1/200 000 du Bassin Sédi-mentaire Côtier du Benin Report; Direction Générale de l’Hydraulique: Cotonou, Benin, 1985; 23p. [Google Scholar]
- EIES/PGES. Projet de renforcement du systeme d’alimentation en eau potable de Cotonou et de ses agglomérations—Phase III. In Rapport d’EIES/PGES validé par ABE—Volume I; SONEB: Cotonou, Benin, 2017. [Google Scholar]
- Bouwer, H. Artificial recharge of groundwater: Hydrogeology and engineering. Hydrogeol. J. 2002, 10, 121–142. [Google Scholar] [CrossRef] [Green Version]
- Yang, J.S.; Lee, J.B.; Kim, I.l.H. Analysis of the effects of the seawater intrusion countermeasures considering future SLR in Yeosu region using SEAWAT. J. Korea Water Resour. Assoc. 2018, 51, 515–521. [Google Scholar]
- Kambiri, S.C. An Investigation of Decreasing Groundwater Levels in Hand-Dug Wells in Ouédo, Southern Benin. The Fate of Shallow Groundwater Resources in a Fast-Growing Suburban Area. Master’s Thesis, IHE Delft Institute for Water Education, Igrac, France, 2018. [Google Scholar]
- Angelo, F.K. Impact du Changement Climatique sur L’approvisionnement en eau Potable des Populations: Cas de la Commune de Kpomasse en Republic de Benin; Projet de Travail Personnel 2010–2011; Mairie de Kpomasse: Segbohoué, Bénin, 2011. [Google Scholar]
- Amoussou, E.; Camberlin, P.; Mahé, G. Impact de la variabilité climatique et du barrage Nangbéto sur l’hydrologie du système Mono- Couffo (Afrique de l’Ouest) l’hydrologie du système Mono-Couffo (Afrique de l’Ouest). Hydrol. Sci. J. 2016, 57, 37–41. [Google Scholar]
- Yang, J.-S.; Jeong, Y.-W.; Agossou, A.; Sohn, J.-S.; Lee, J.-B. GALDIT Modification for Seasonal Seawater Intrusion Mapping Using Multi Criteria Decision Making Methods. Water 2022, 14, 2258. [Google Scholar] [CrossRef]
- Ministère de l’Environnement de l’Habitat et de l’Urbanisme (MEHU). Deuxième Communication National sur les Changements Climatiques; Ministère de l’Environnement de l’Habitat et de l’Urbanisme (MEHU): Cotonou, Benin, 2011. [Google Scholar]
- Batablinlè, L.E.; Agnidé, K.D.; Japhet, A.; Ernest, V.E. Future changes in precipitation, evapotranspiration and streamflows in the Mono Basin of West Africa. Proc. IAHS 2021, 384, 283–288. [Google Scholar] [CrossRef]
- Abd-Elhamid, H.F.; Abd-Elaty, I.; Hussain, M.S. Mitigation of seawater intrusion in coastal aquifers using coastal earth fill considering future sea level rise. Environ. Sci. Pollut. Res. 2020, 27, 23234–23245. [Google Scholar] [CrossRef] [PubMed]
- Abd-Elhamid, H.; Abd-Elaty, I. Application of A new Methodology (TRAD) to Control Sea-water Intrusion in the Nile Delta Aquifer, Egypt. In Proceedings of the Solutions to Water Challenges in MENA Region Proceedings of the Regional Workshop, Cairo, Egypt, 25–30 April 2017. [Google Scholar]
- K-water. Research Planning for the Key Technology Development of Riverbank Filtration in Korea; K-Water: Daejeon, Korea, 2016; 162p. (In Korean) [Google Scholar]
Figure 1.
Geographic location and geological formations of the coastal zone of Benin.

Figure 2.
(a): Geographic location of pumping wells imported to the model and used for simulation in Visual MODFLOW; (b): spatial distribution of monitoring wells.
Figure 2.
(a): Geographic location of pumping wells imported to the model and used for simulation in Visual MODFLOW; (b): spatial distribution of monitoring wells.

Figure 3.
DEM, HSG, LuLc and generated CN grid map used to estimate groundwater recharge within the study region.
Figure 3.
DEM, HSG, LuLc and generated CN grid map used to estimate groundwater recharge within the study region.

Figure 4.
Scatter diagram of groundwater head and salt concentration at the end of calibration showing the match between observed and model-computed values.
Figure 4.
Scatter diagram of groundwater head and salt concentration at the end of calibration showing the match between observed and model-computed values.

Figure 5.
SWI area estimated in 2015 and 2020 using Visual MODFLOW.

Figure 6.
Fresh groundwater-saltwater transition zone elevation variation in function of groundwater level and sea level fluctuation.
Figure 6.
Fresh groundwater-saltwater transition zone elevation variation in function of groundwater level and sea level fluctuation.

Figure 7.
Potential future SWI area in 2050 considering SLR and groundwater abstraction rate increase.
Figure 7.
Potential future SWI area in 2050 considering SLR and groundwater abstraction rate increase.

Figure 8.
Recharge wells and pond cells location for the simulation.


Table 1.
Parameters’ initial and optimized values.
| Parameter | Initial Value | Optimized Value |
|---|---|---|
| Hydraulic conductivity | 2 × 10⁻⁵–7 × 10⁻³ m/s | 2 × 10⁻⁶–4 × 10⁻³ m/s |
| Specific storage | 2 × 10⁻⁴–9 × 10⁻⁴ | 5 × 10⁻⁶–3 × 10⁻⁴ |
| Specific yield | 0.21 | 0.33 |
Table 2.
SWI area in km2.
| Inland SWI Area in km2 | |||
|---|---|---|---|
| Groundwater Pumping Increase | SLR | SLR + Groundwater Pumping Increase | |
| 2015 | 20.03 | ||
| 2020 | 21.95 | ||
| 2050 | 41.61 | 43.15 | 57.48 |
Table 3.
Impact of countermeasures on SWI area variation.
| SWI Area (km2) | |||
|---|---|---|---|
| Artificial recharge well | SLR + Groundwater Pumping Increase | ||
| Storage | SWI Area (km2) in 2050 Without Countermeasures | SWI Area (km2) in 2050 Countermeasures Applied | |
| 200 m3/d | 57.48 | 57.48 | |
| 400 m3/d | |||
| 600 m3/d | |||
| 800 m3/d | |||
| 1000 m3/d | 57.47 | ||
| 2000 m3/d | 57.45 | ||
| Pond | 250,000 m3 | 53.28 | |
| Pond + Artificial recharge well | 250,000 m3 + 2000 m3/d | 53.24 | |
Publisher’s Note: MDPI stays neutral with regard to jurisdictional claims in published maps and institutional affiliations. |
© 2022 by the authors. Licensee MDPI, Basel, Switzerland. This article is an open access article distributed under the terms and conditions of the Creative Commons Attribution (CC BY) license (https://creativecommons.org/licenses/by/4.0/).
Share and Cite
MDPI and ACS Style
Agossou, A.; Yang, J.-S.; Lee, J.-B. Evaluation of Potential Seawater Intrusion in the Coastal Aquifers System of Benin and Effect of Countermeasures Considering Future Sea Level Rise. Water 2022, 14, 4001. https://doi.org/10.3390/w14244001
AMA Style
Agossou A, Yang J-S, Lee J-B. Evaluation of Potential Seawater Intrusion in the Coastal Aquifers System of Benin and Effect of Countermeasures Considering Future Sea Level Rise. Water. 2022; 14(24):4001. https://doi.org/10.3390/w14244001
Chicago/Turabian StyleAgossou, Amos, Jeong-Seok Yang, and Jae-Boem Lee. 2022. "Evaluation of Potential Seawater Intrusion in the Coastal Aquifers System of Benin and Effect of Countermeasures Considering Future Sea Level Rise" Water 14, no. 24: 4001. https://doi.org/10.3390/w14244001
Note that from the first issue of 2016, this journal uses article numbers instead of page numbers. See further details here.