
Water Efficiency of Coriander under Flows of Application of Nutritive Solutions Prepared in Brackish Waters

 , ,
, , 
Abstract
:1. Introduction
2. Materials and Methods
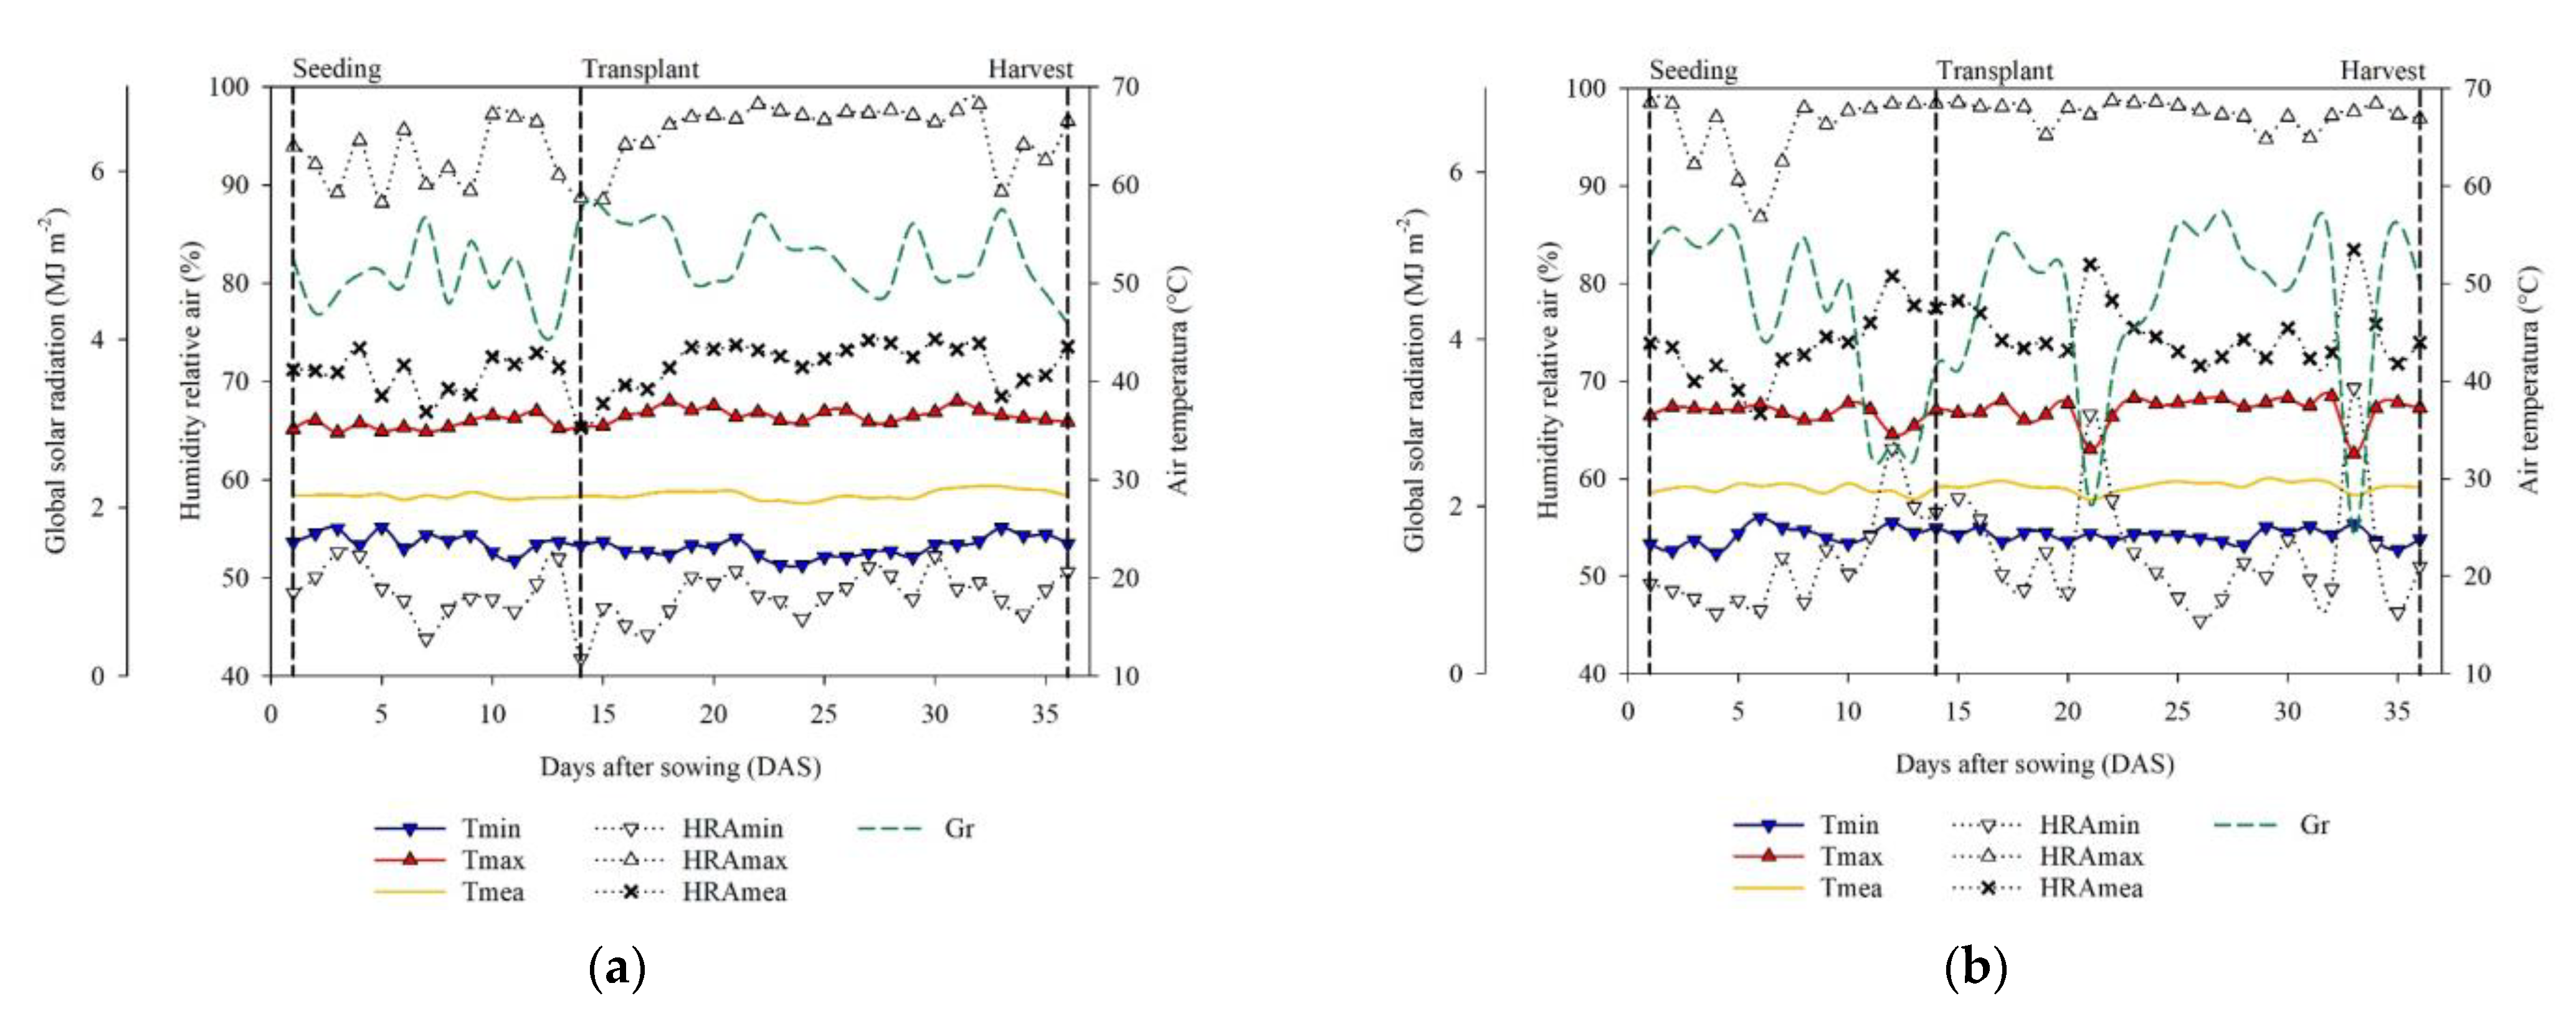
2.1. Experimental Conditions
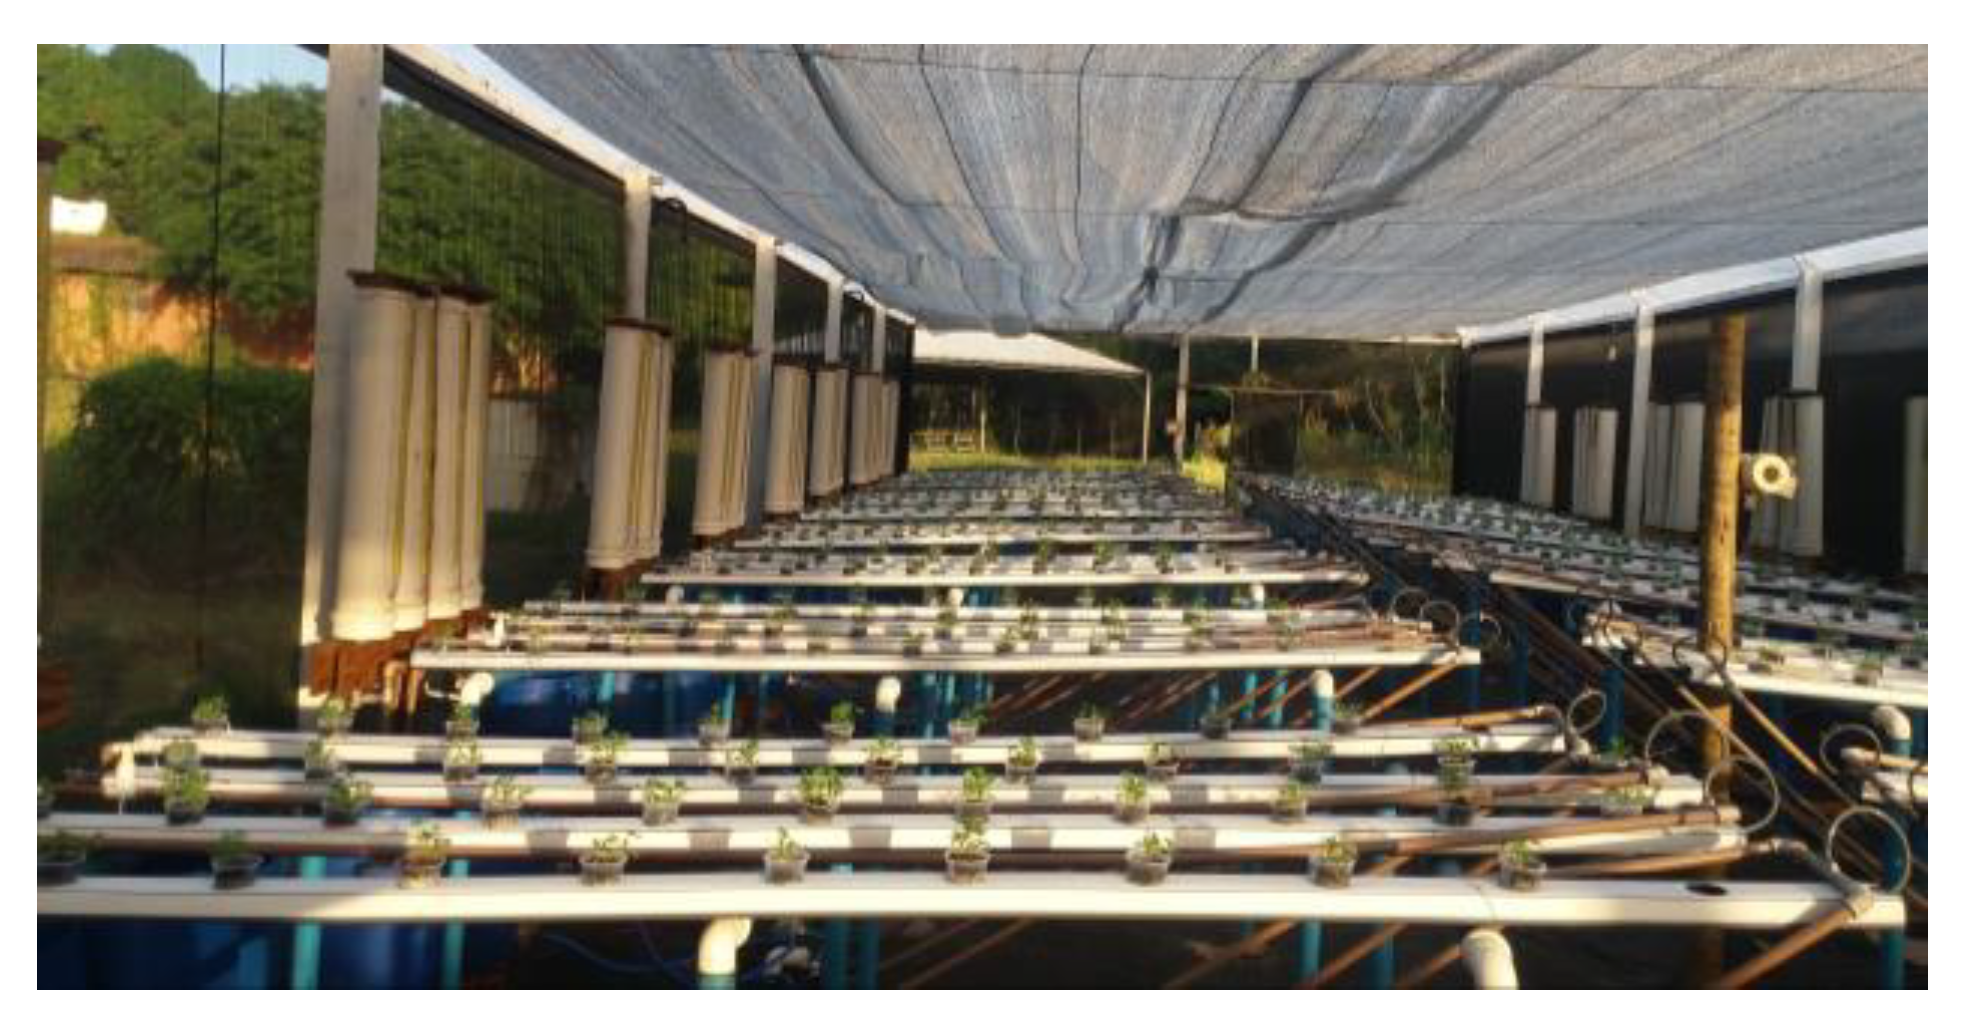
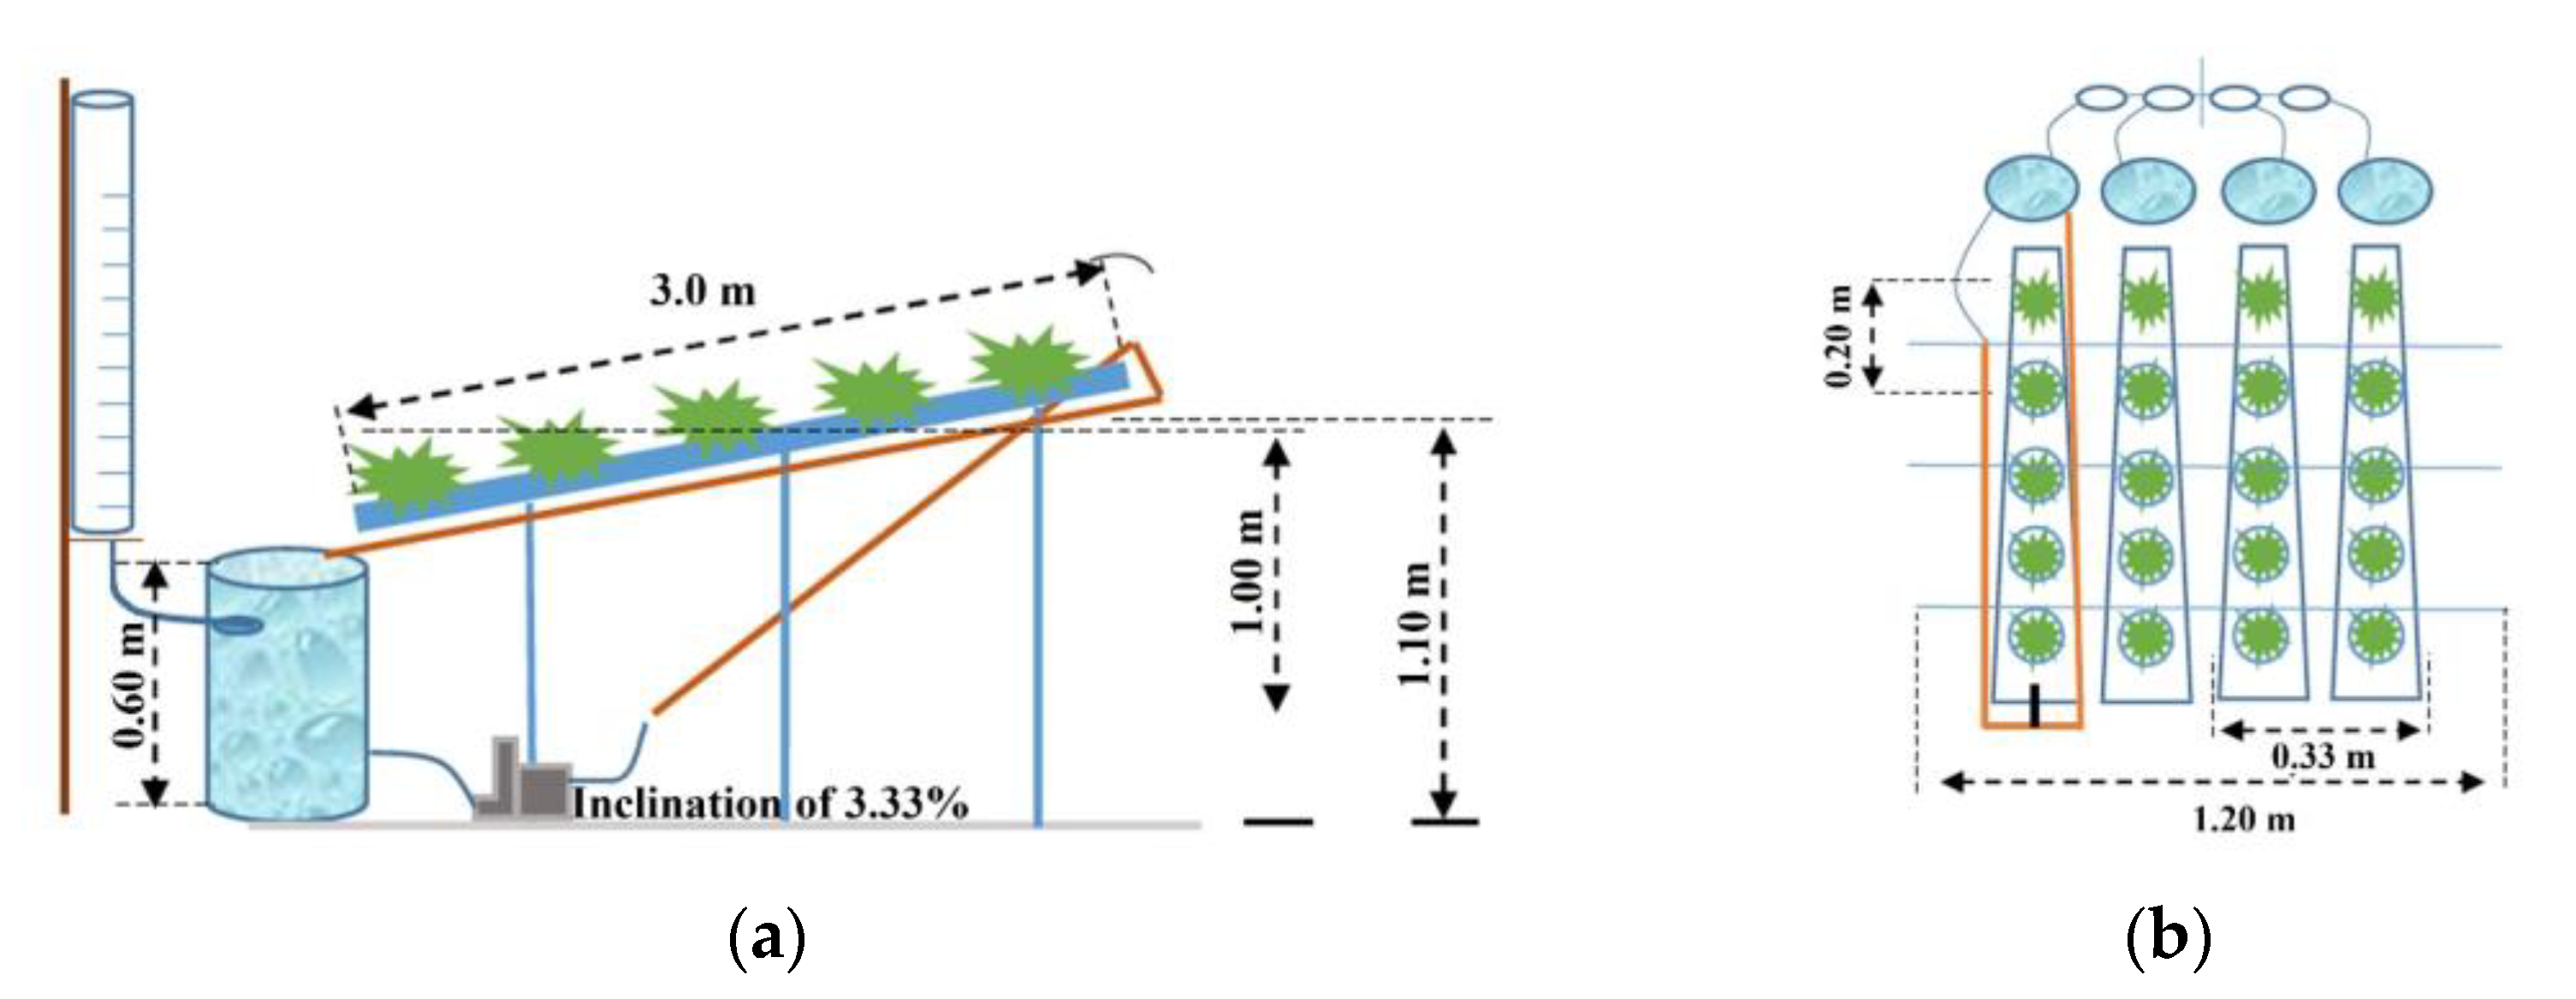
2.2. Hydroponic System
2.3. Experimental Treatments
2.4. Variables Analyzed
3. Results
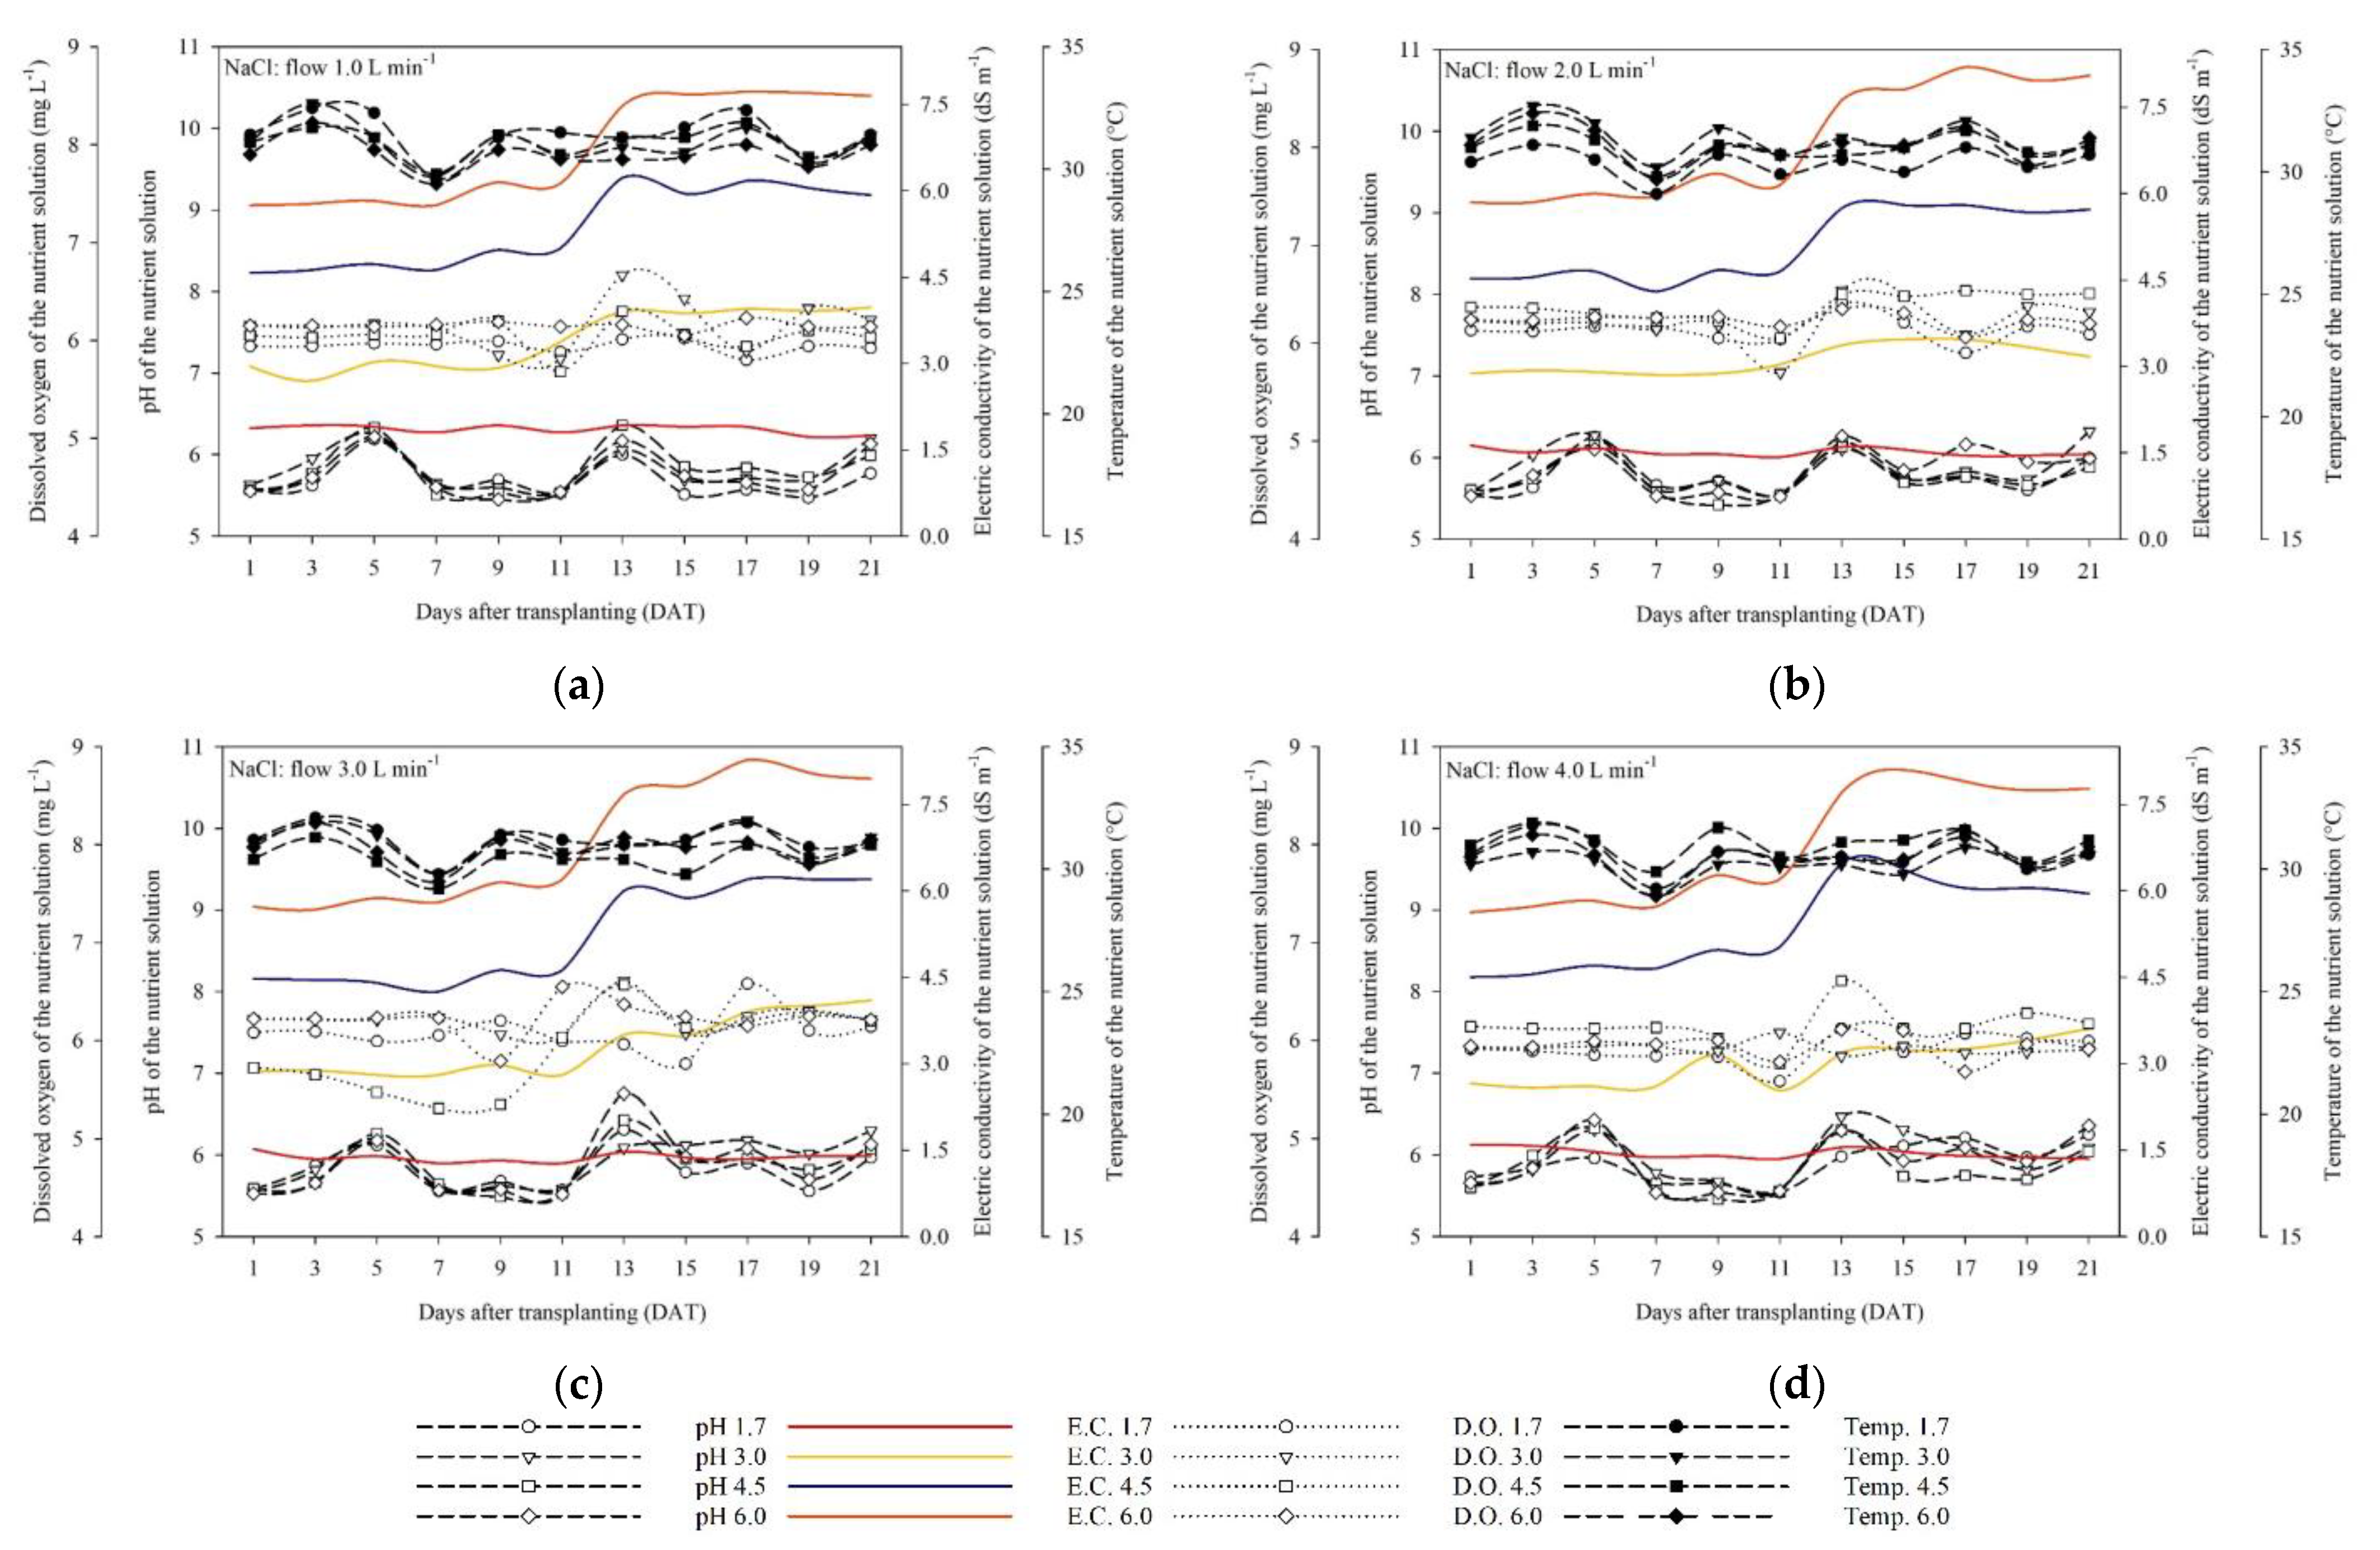
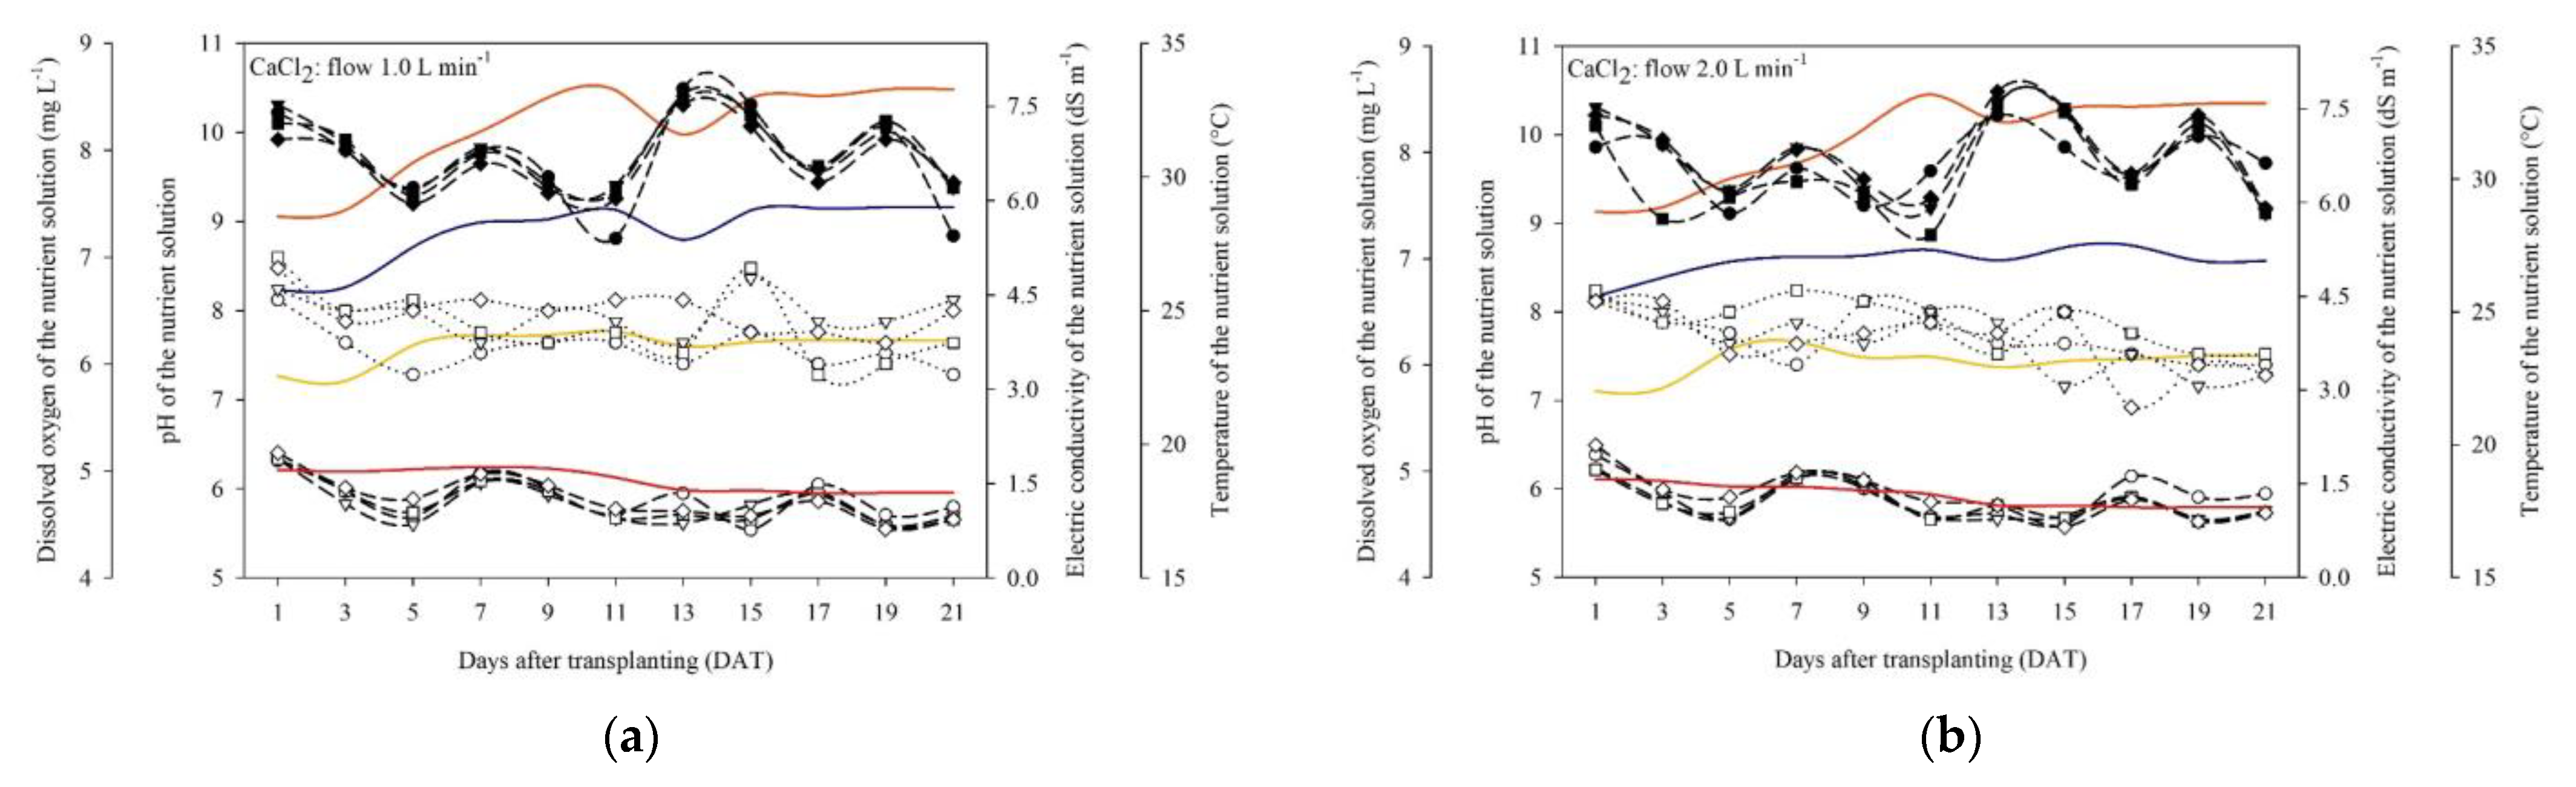
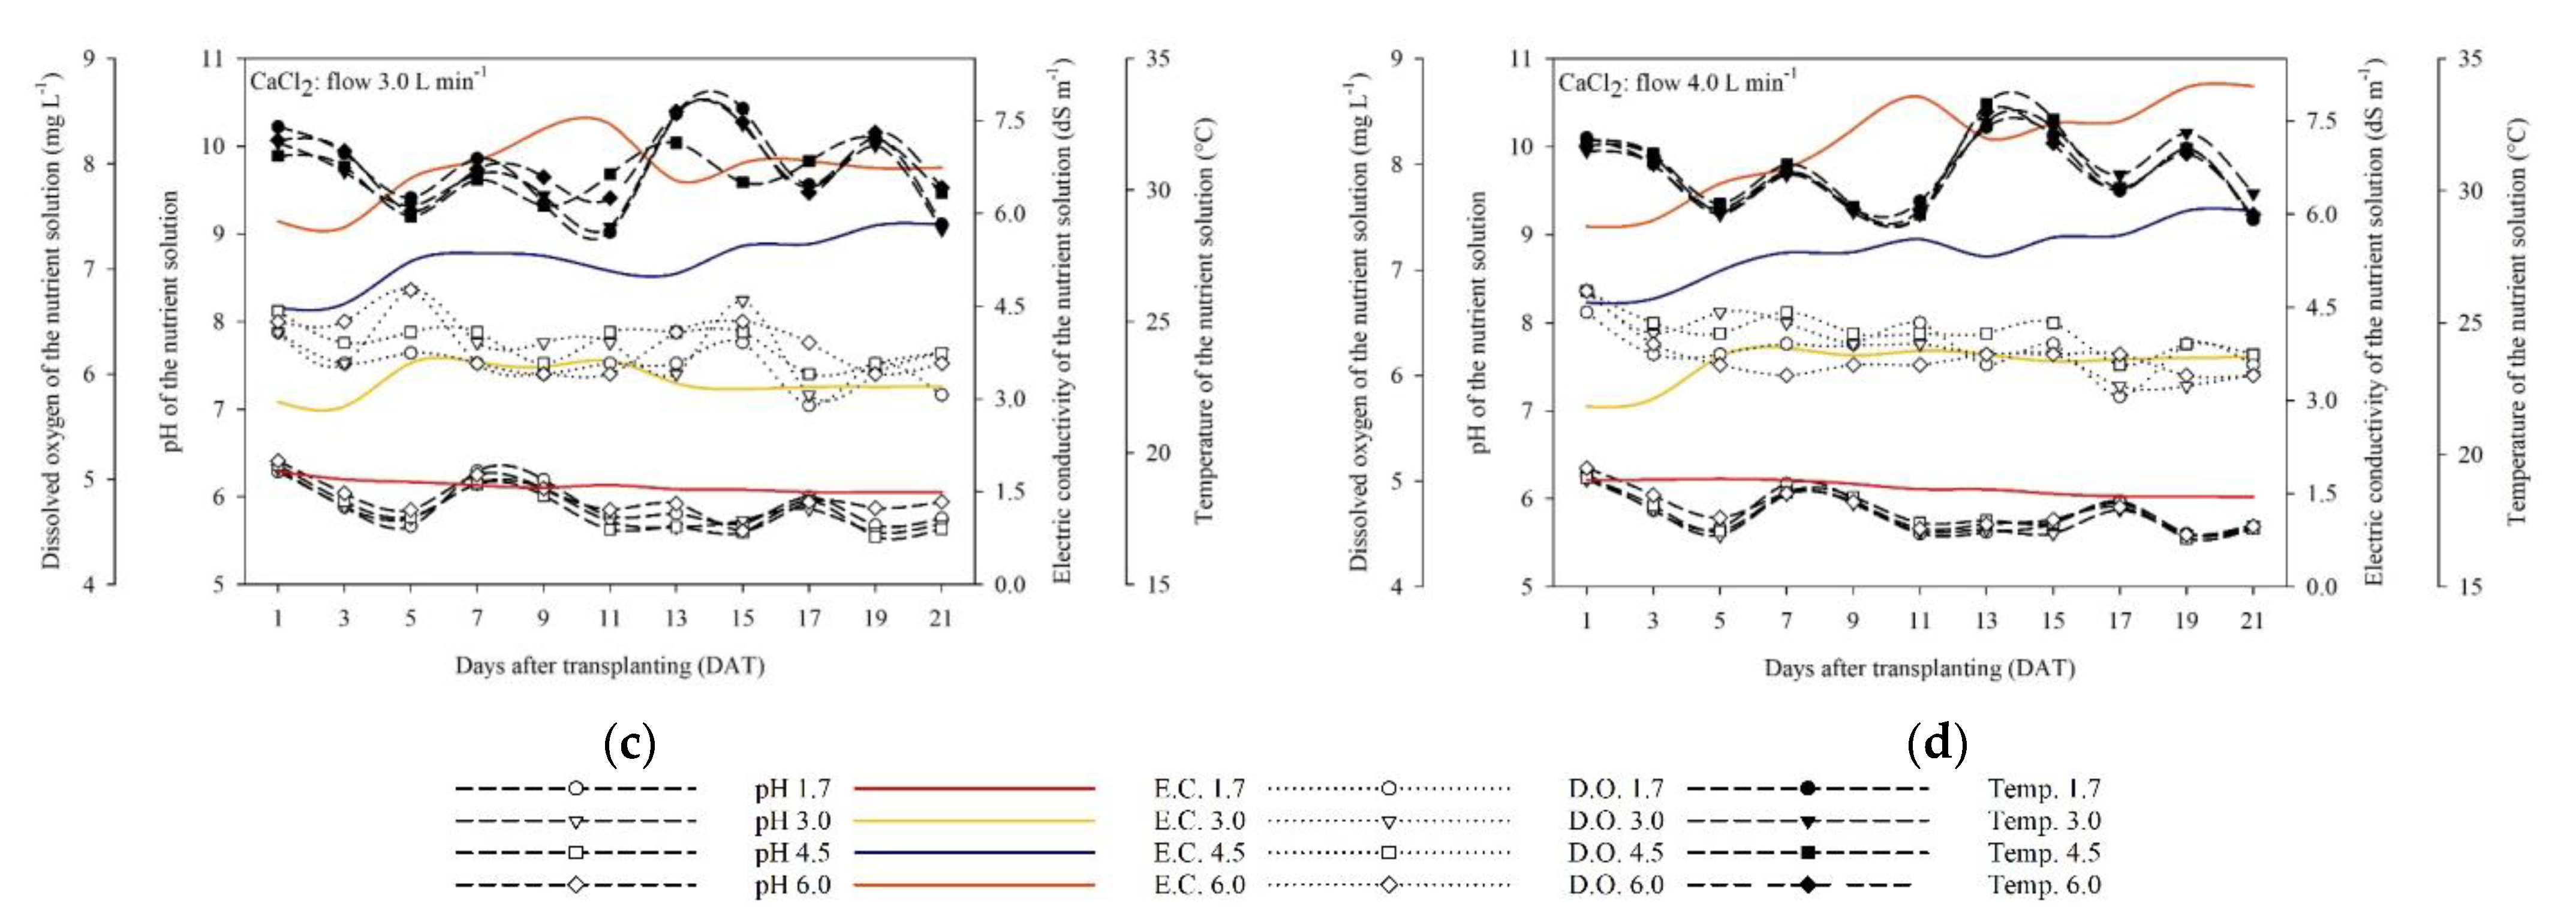
3.1. Subsection
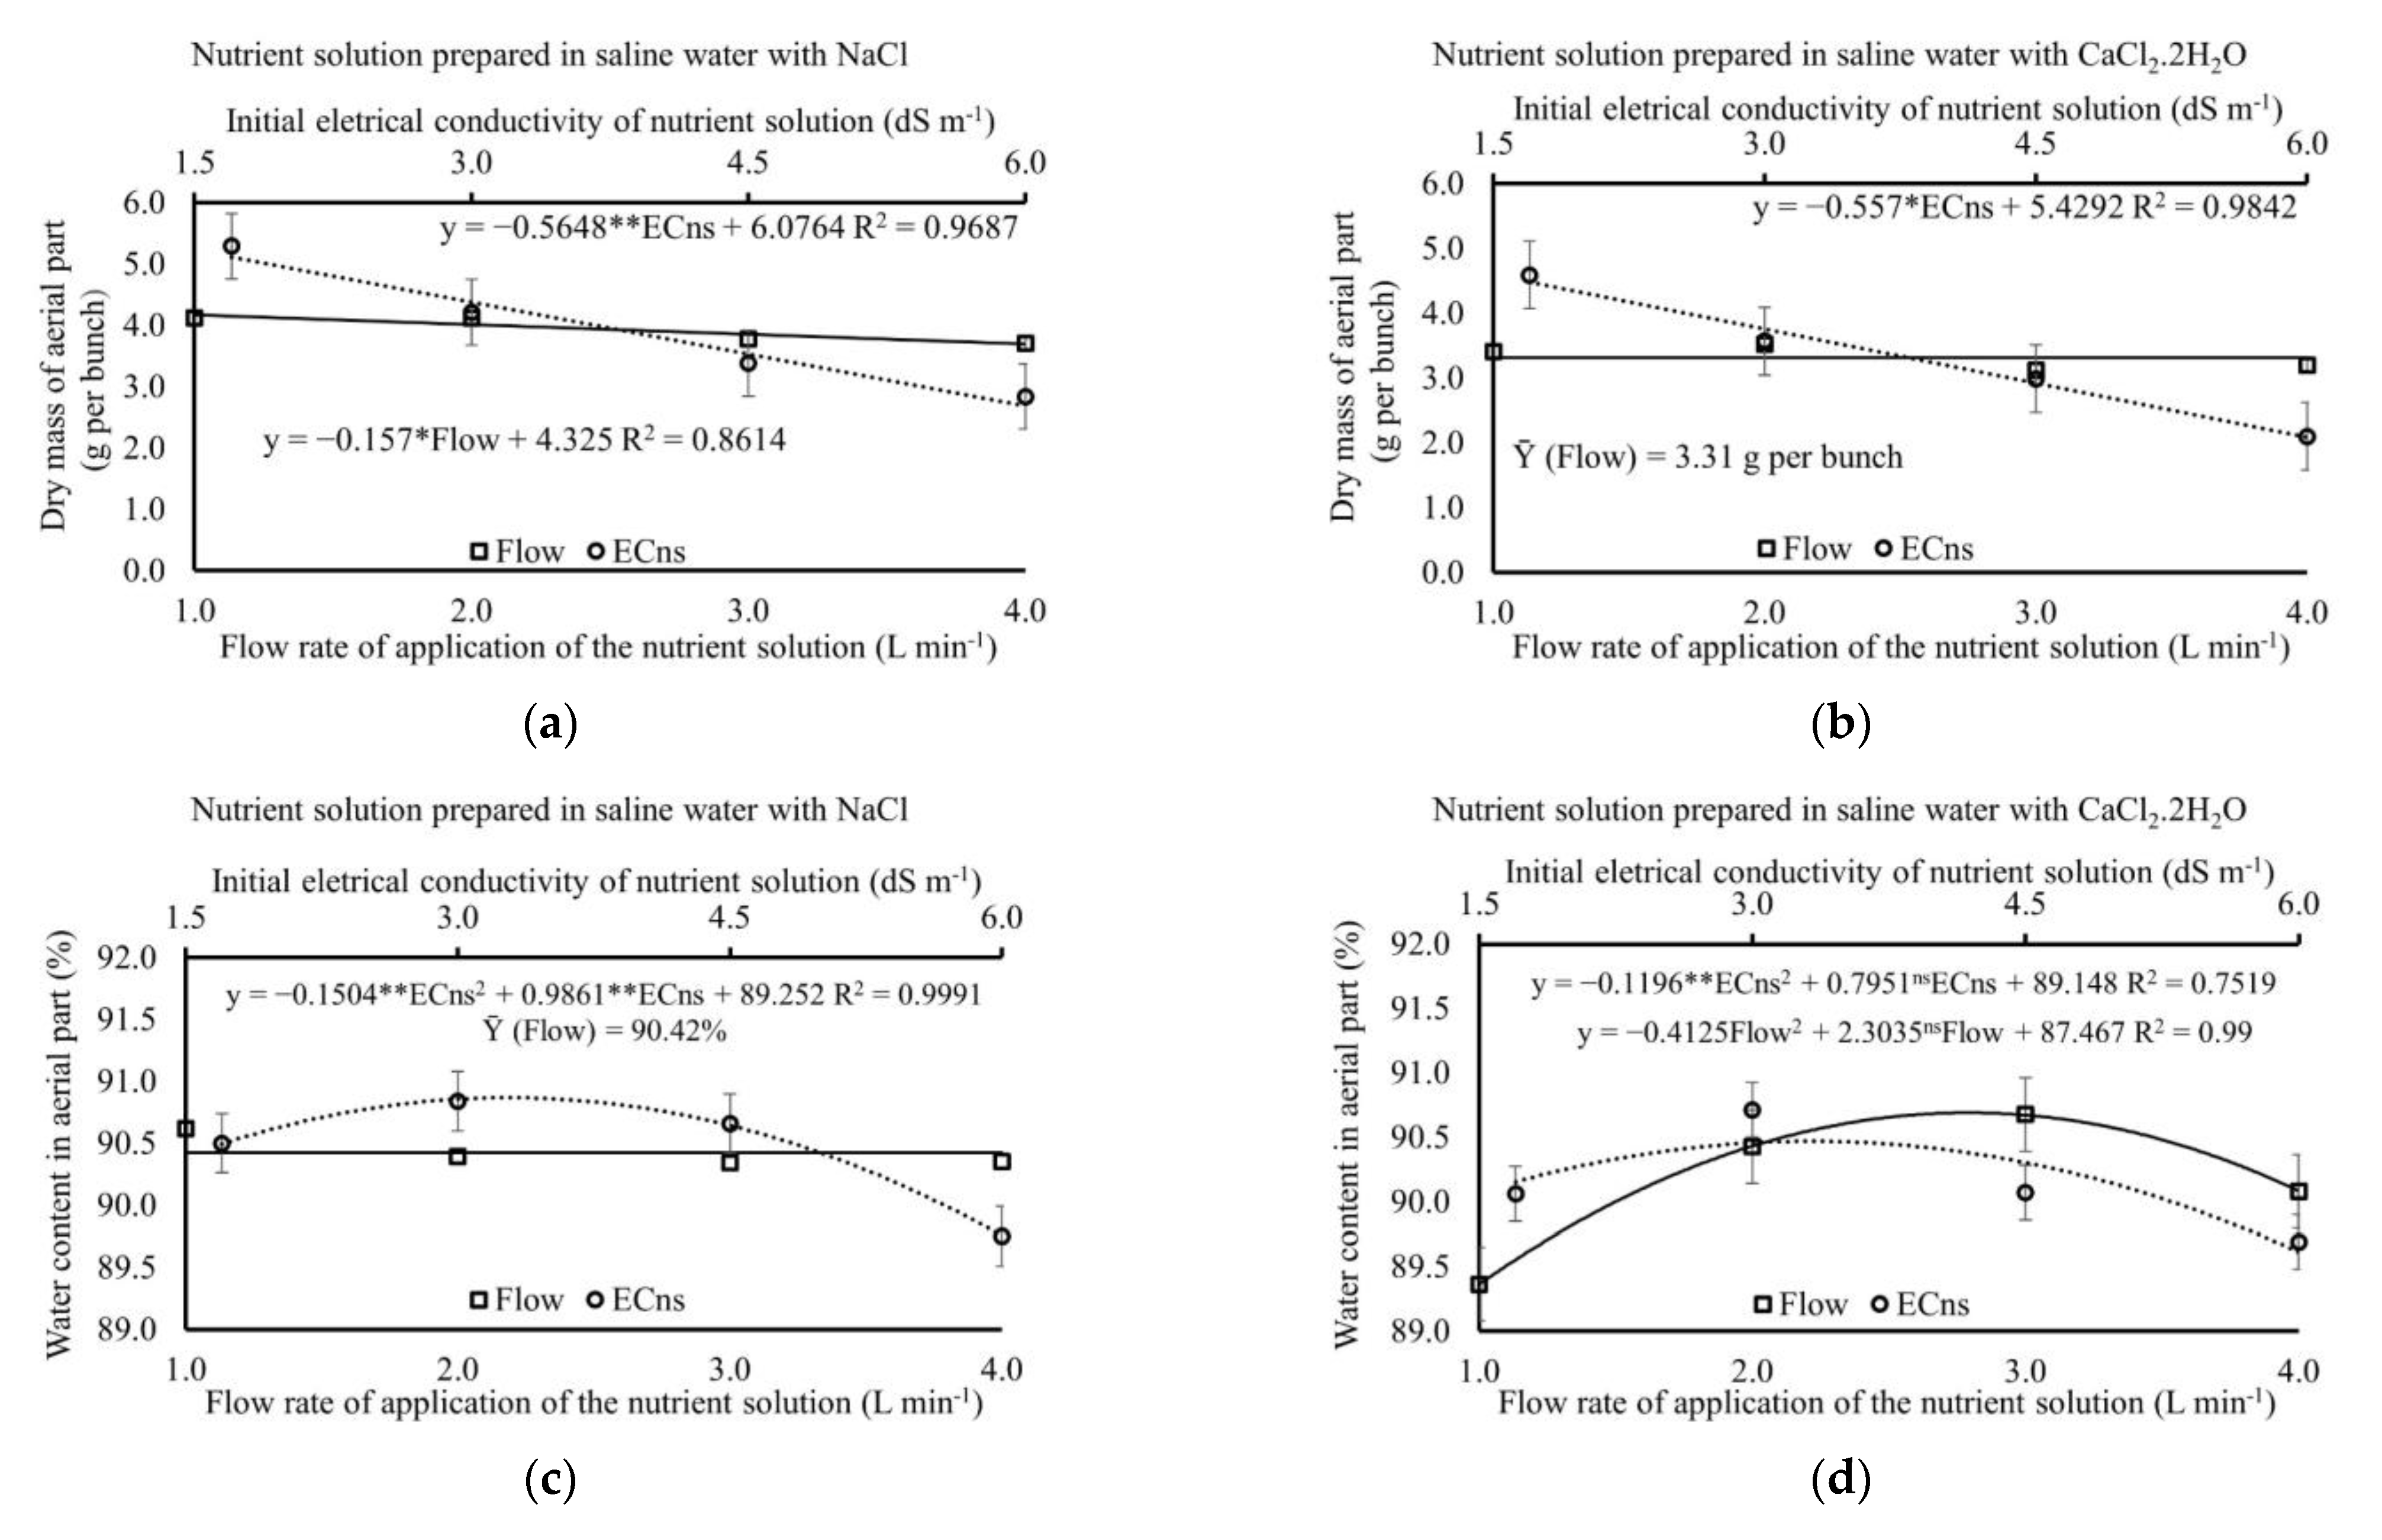
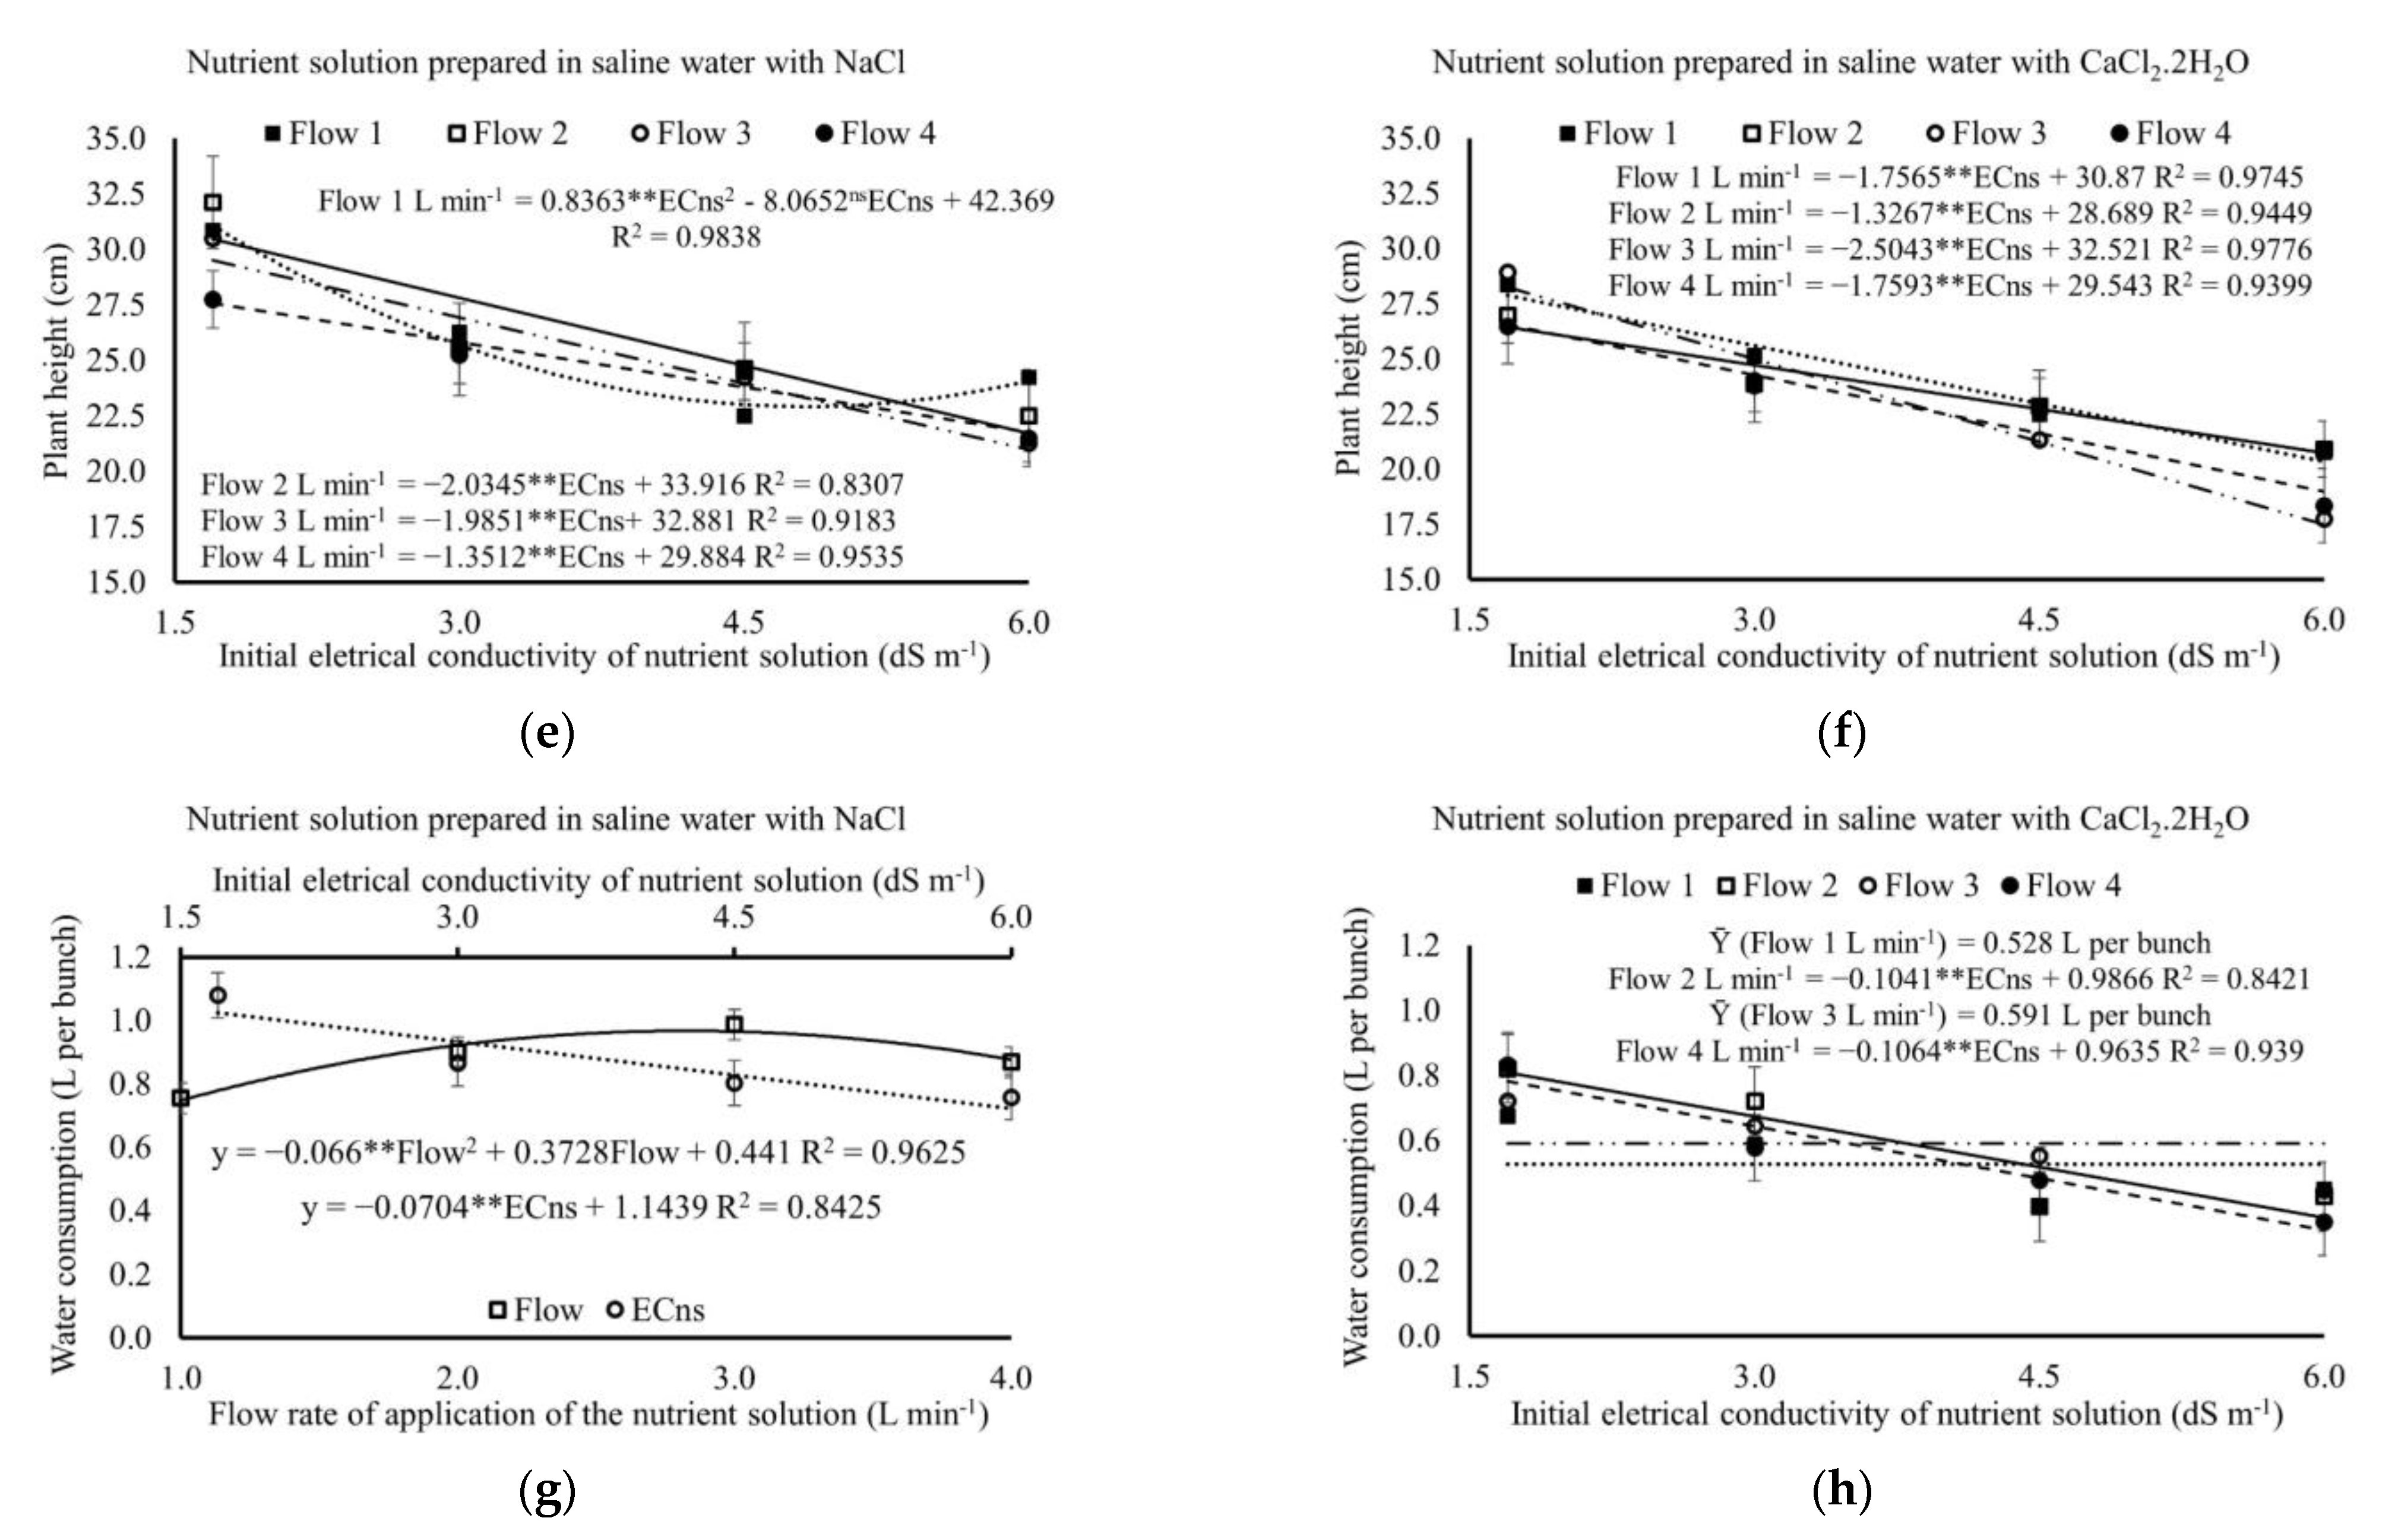
3.2. Dry Mass, Plant Height, Water Content, and Water Consumption
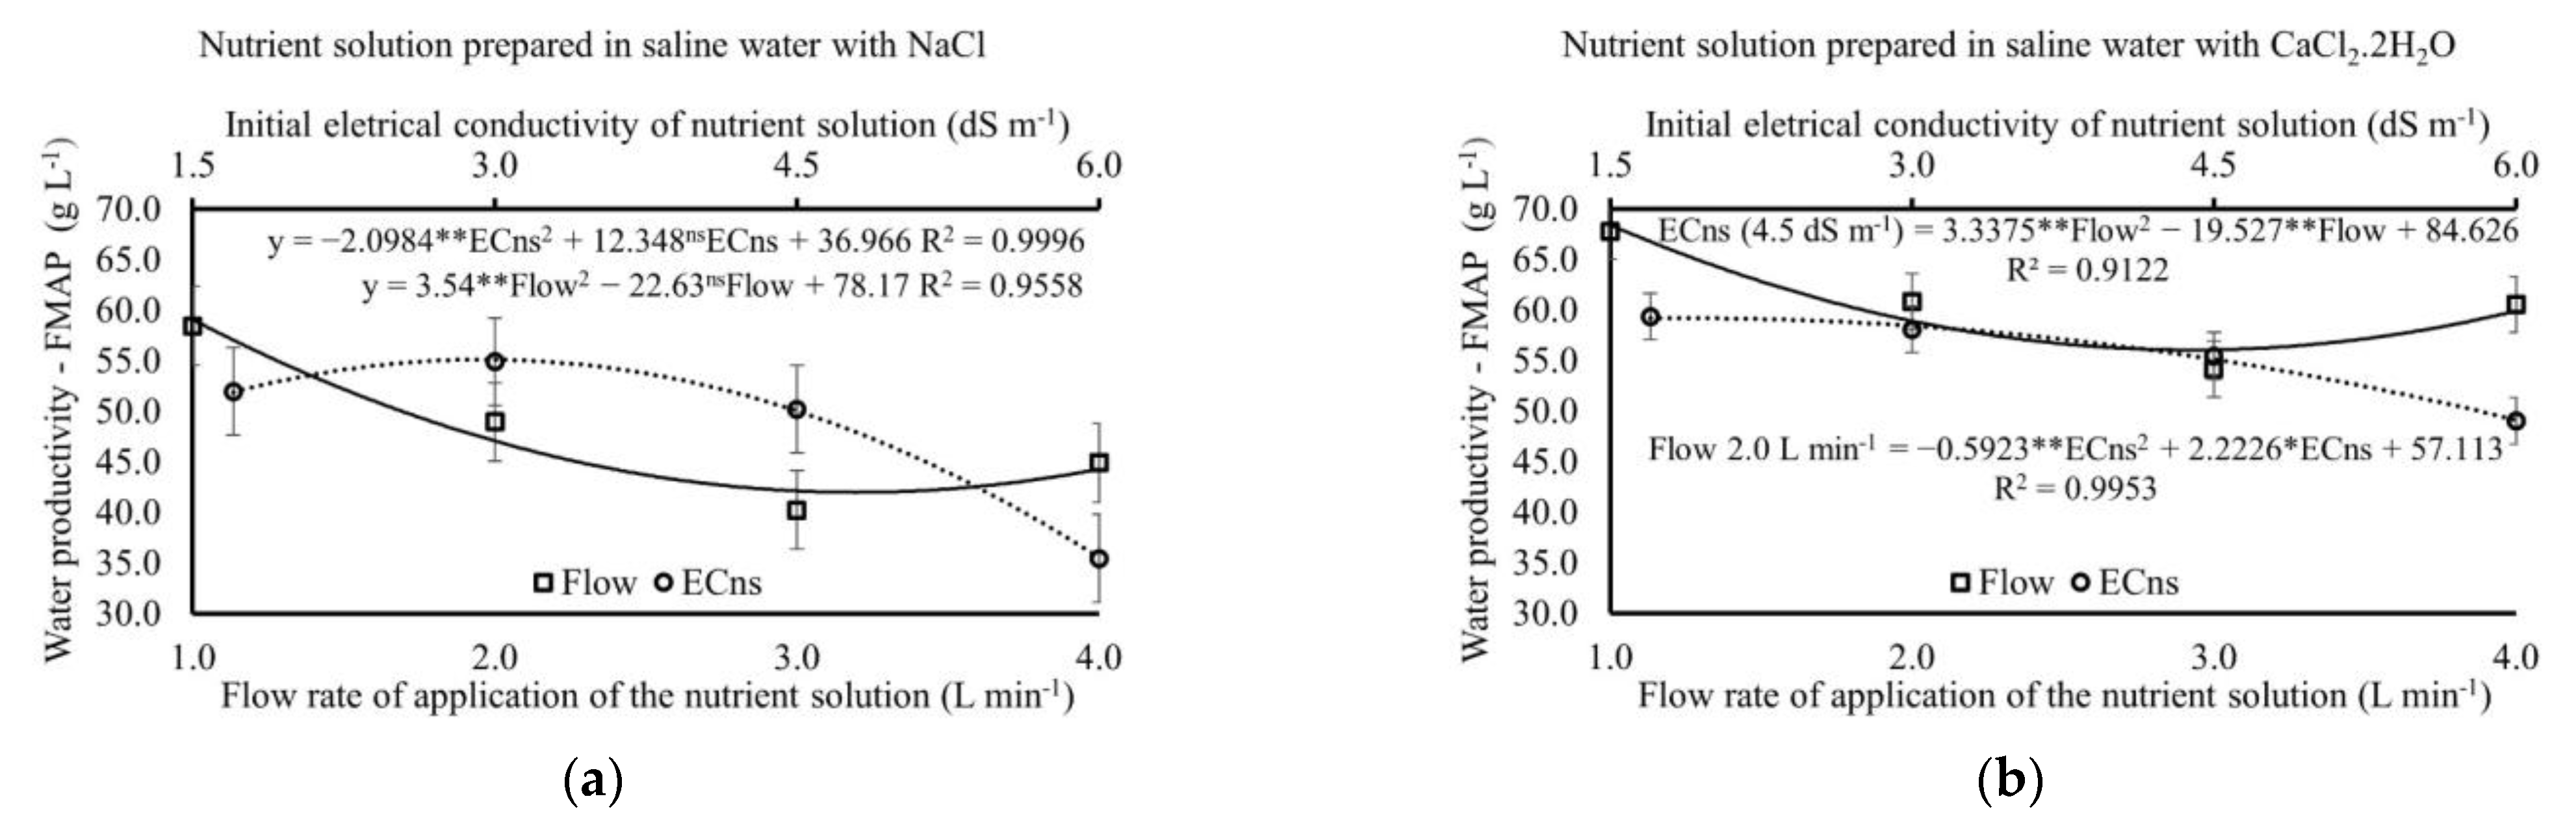
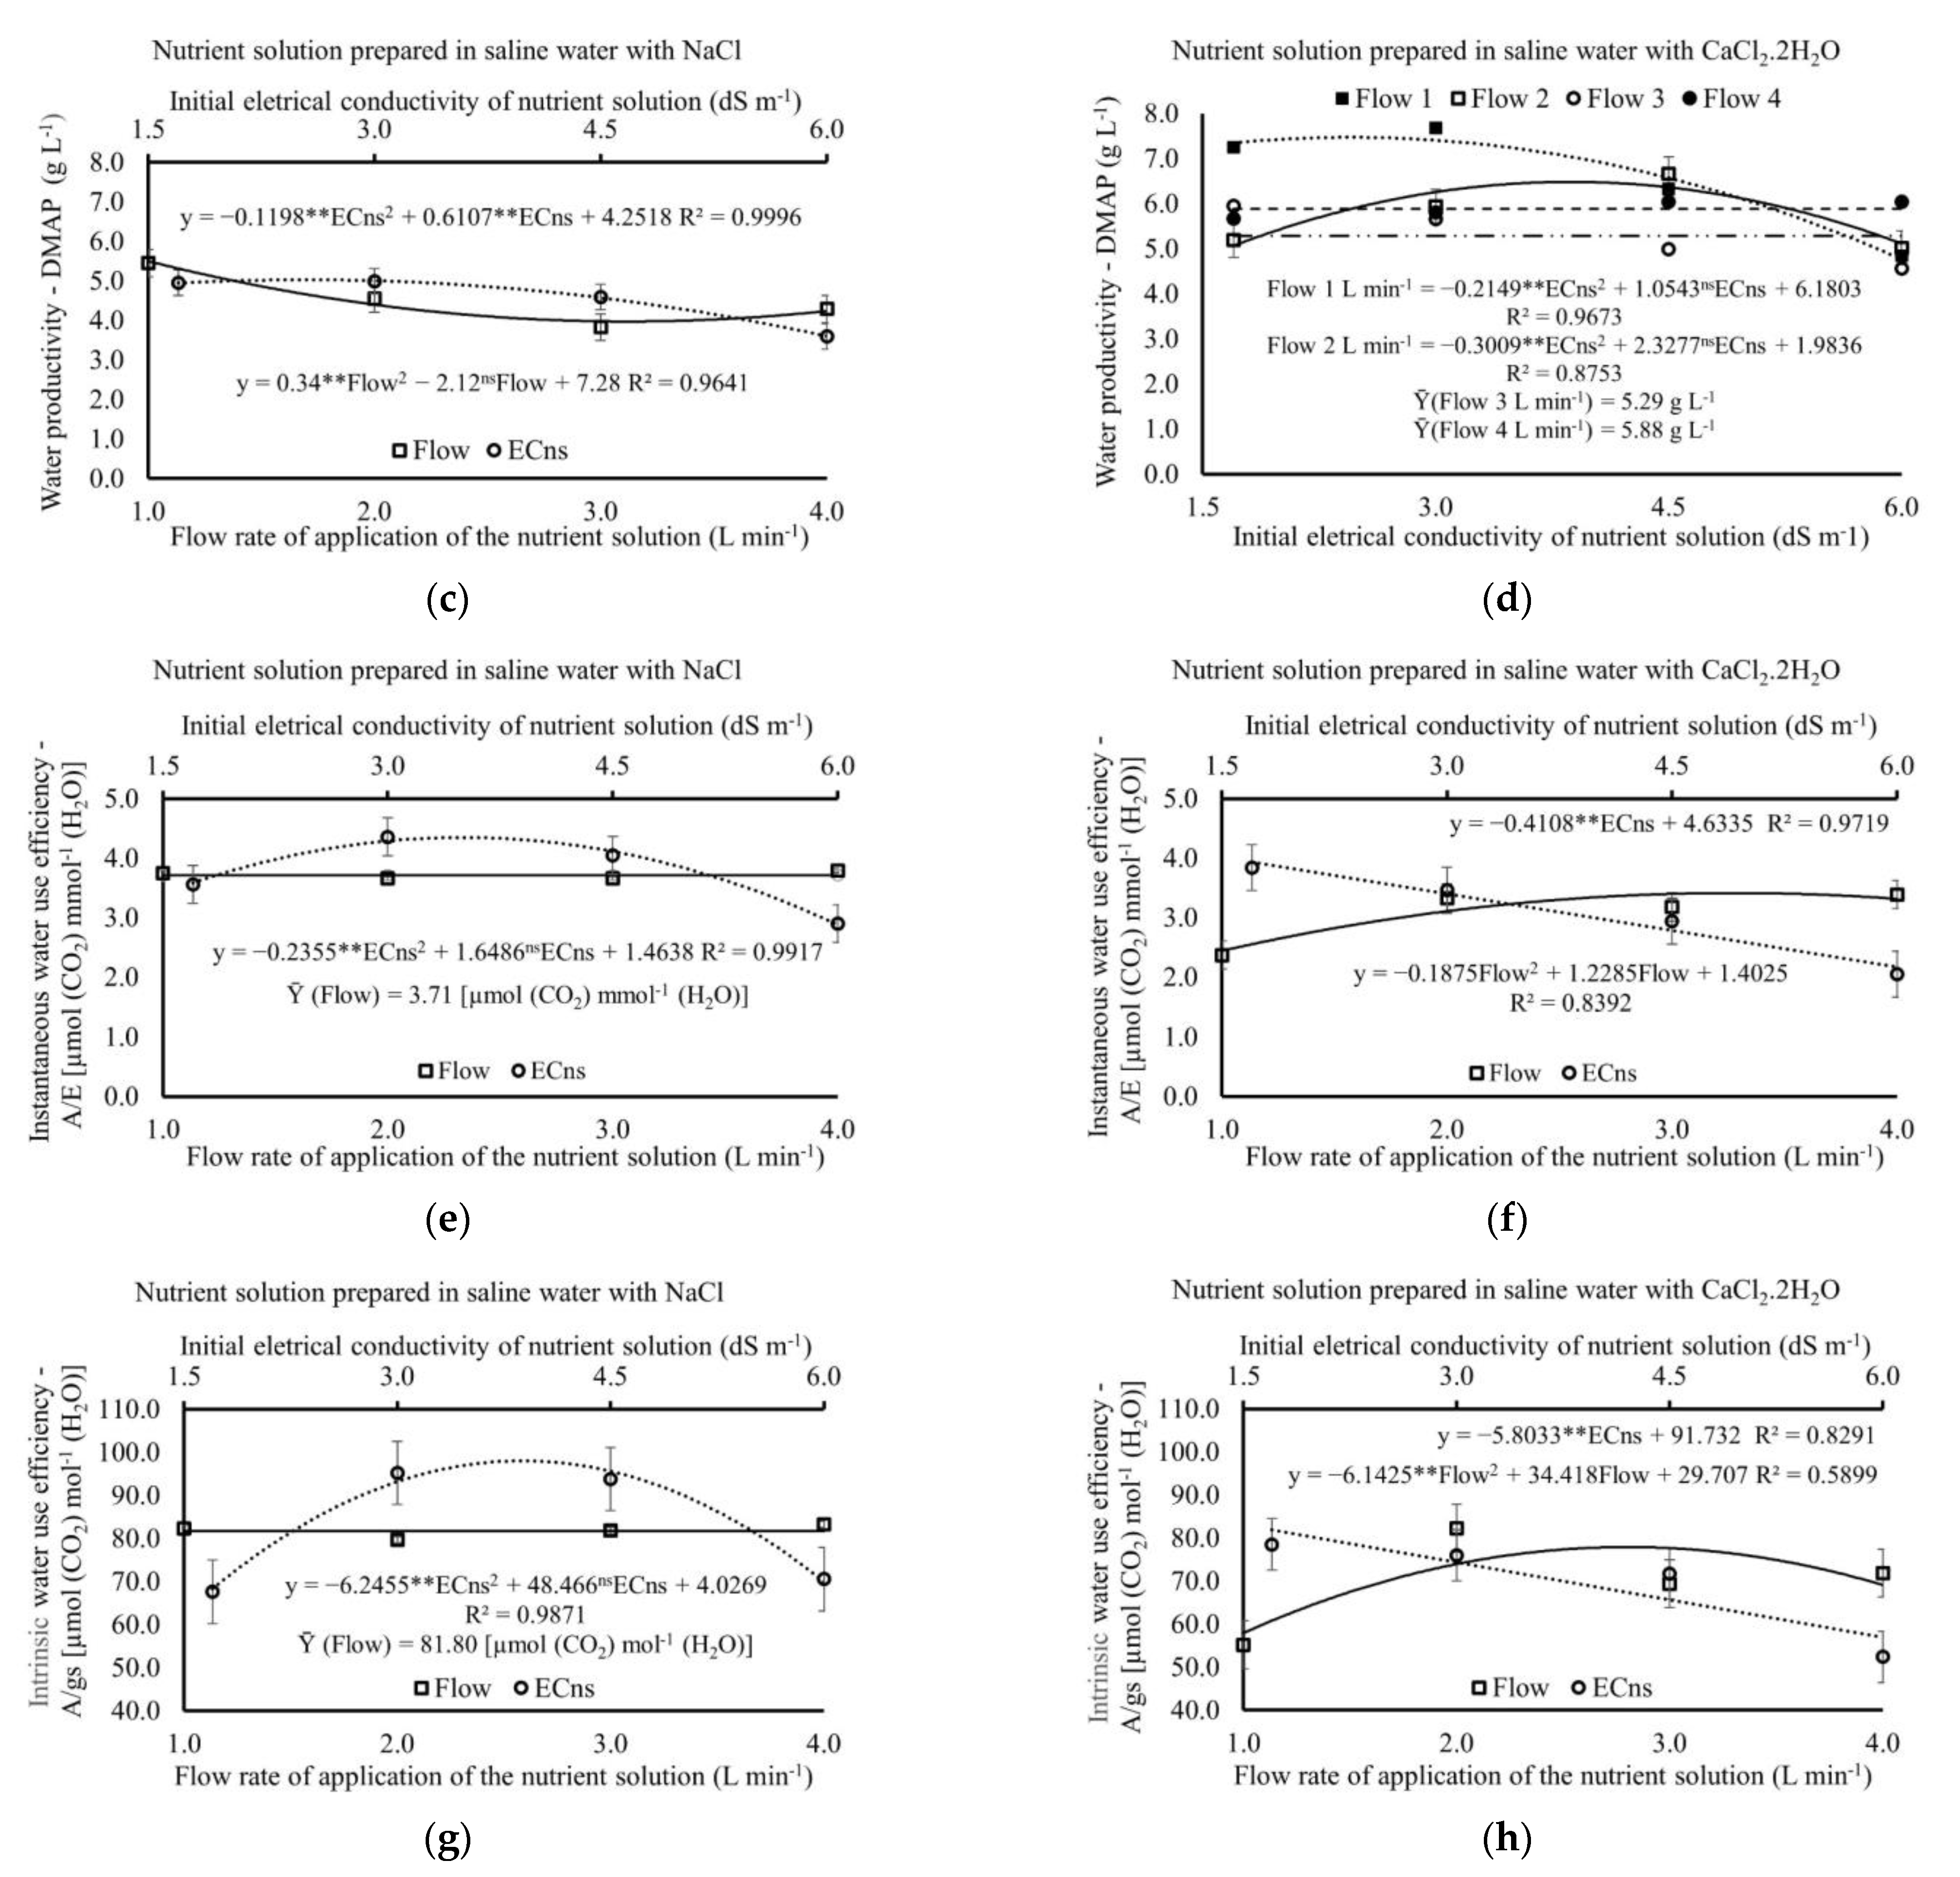
3.3. Productivity and Water Use Efficiency
4. Discussion
5. Conclusions
Author Contributions
Funding
Institutional Review Board Statement
Informed Consent Statement
Data Availability Statement
Conflicts of Interest
References
- Machado, R.M.A.; Alves-Pereira, I.; Faty, Y.; Perdigão, S.; Ferreira, R. Influence of Nitrogen Sources Applied by Fertigation to an Enriched Soil with Organic Compost on Growth, Mineral Nutrition, and Phytochemicals Content of Coriander (Coriandrum sativum L.) in Two Successive Harvests. Plants 2022, 11, 22. [Google Scholar] [CrossRef]
- Cavalcante, A.R.; Santos Júnior, J.A.; Gheyi, H.R.; Dias, N.S.; Paz, V.P.S. Produção e composição mineral do coentro em sistema hidropônico de baixo custo. Irriga 2016, 21, 685–696. [Google Scholar] [CrossRef]
- Soares, H.R.; Silva, Ê.F.F.; Silva, G.F.D.; Cruz, A.F.D.S.; Santos Júnior, J.A.; Rolim, M.M. Salinity and flow rates of nutrient solution on cauliflower biometrics in NFT hydroponic system. R. Bras. Eng. Agríc. Ambient. 2020, 24, 258–265. [Google Scholar] [CrossRef]
- Silva, A.C.; Silva, G.F.; Menezes, S.M.; Cruz, R.Í.; Santos Júnior, J.A.; Rolim, M.M. Accumulation of cations in lettuce cultivars under low-cost hydroponic system with brackish waters. R. Bras. Eng. Agríc. Ambient. 2021, 25, 833–839. [Google Scholar] [CrossRef]
- Muchecua, S.M.; Santos Júnior, J.A.; Menezes, S.M.; Silva, G.F.; Chaves, L.H.; Cruz, R.I. Ionic relationships between macronutrients and sodium in parsley under nutrient solutions prepared with brackish water. R. Bras. Eng. Agríc. Ambient. 2022, 26, 11–20. [Google Scholar] [CrossRef]
- Santos, B.D.; Silva, P.F.; Matos, R.M.; Neto, J.D.; Lima, V.L.; Bonou, S.I.; Melo, A.S.; Melo, Y.L. Induction of Salt Stress Tolerance in Chives by Priming with H2O2 in Hydroponic Cultivation. Chil. J. Agric. Res. 2021, 81, 317–325. [Google Scholar] [CrossRef]
- Silva, M.G.; Soares, T.M.; Gheyi, H.R.; Santos, C.C.; Oliveira, M.G.B. Hydroponic cultivation of coriander intercropped with rocket subjected to saline and thermal stresses in the root-zone. Rev. Ceres 2022, 69, 148–157. [Google Scholar] [CrossRef]
- Avdouli, D.; Max, J.F.; Katsoulas, N.; Levizou, E. Basil as Secondary Crop in Cascade Hydroponics: Exploring Salinity Tolerance Limits in Terms of Growth, Amino Acid Profile, and Nutrient Composition. Horticulturae 2021, 7, 203. [Google Scholar] [CrossRef]
- Carbajal-Vázquez, V.H.; Gómez-Merino, F.C.; Alcántar-González, E.G.; Sánchez-García, P.; Trejo-Téllez, L.I. Titanium Increases the Antioxidant Activity and Macronutrient Concentration in Tomato Seedlings Exposed to Salinity in Hydroponics. Plants 2022, 11, 1036. [Google Scholar] [CrossRef]
- Holanda, J.S.; Amorim, J.R.A.; Ferreira Neto, M.; Holanda, A.C.; Sá, F.V.S. Qualidade da água para irrigação. In Manejo da Salinidade na Agricultura: Estudos Básicos e Aplicados, 2nd ed.; Gheyi, H.R., Dias, N.S., Lacerda, C.F., Gomes Filho, E., Eds.; INCTSal: Fortaleza, Brazil, 2016; pp. 35–50. [Google Scholar]
- Genuncio, G.C.; Silva, R.A.C.; Sá, N.M.; Mary, W.; Zonta, E. Produtividade de rúcula hidropônica cultivada em diferentes épocas e vazões de solução nutritiva. Hortic. Bras. 2011, 29, 605–608. [Google Scholar] [CrossRef]
- Mendonça, M.A.; Oliveira, R.A.; Duda, R.M.; Fujita, A.T.; Millan, R.N. Remoção de íons Cu2+, Mn2+ e Zn2+ em solução aquosa utilizando lodo biológico de reatores anaeróbios de alta taxa. Semin. Ciênc. Exatas E Tec. 2017, 38, 17–27. [Google Scholar] [CrossRef]
- Cruz, A.F.S.; Silva, G.F.; Silva, Ê.F.F.; Soares, H.R.; Santos, J.S.G.; Lira, R.M. Stress index, water potentials and leaf succulence in cauliflower cultivated hydroponically with brackish water. R. Bras. Eng. Agríc. Ambient. 2018, 22, 622–627. [Google Scholar] [CrossRef]
- Campos Júnior, J.E.; Santos Júnior, J.A.; Martins, J.B.; Silva, Ê.F.F.; Almeida, C.D.G.C. Rocket production in a low cost hydroponic system using brackish water. Rev. Caatinga 2018, 31, 1008–1016. [Google Scholar] [CrossRef] [Green Version]
- Silva, M.G.; Oliveira, I.S.; Soares, T.M.; Gheyi, H.R.; Santana, G.O.; Pinho, J.S. Growth, production and water consumption of coriander in hydroponic system using brackish waters. R. Bras. Eng. Agríc. Ambient. 2018, 22, 547–552. [Google Scholar] [CrossRef] [Green Version]
- Silva, M.G.; Soares, T.M.; Gheyi, H.R.; Costa, I.P.; Vasconcelos, R.S. Growth, production and water consumption of coriander grown under different recirculation intervals and nutrient solution depths in hydroponic channels. Emir. J. Food Agric. 2020, 32, 281–294. [Google Scholar] [CrossRef]
- Furlani, P.R. Cultivo Hidropônico de Plantas; Instituto Agronômico: Campinas, Brazil, 1999. [Google Scholar]
- Rhoades, J.D.; Kandiah, A.; Mashali, A.M. Uso de Águas Salinas Para Produção Agrícola; UFPB: Campina Grande, Brazil, 2000; p. 117. [Google Scholar]
- Benincasa, M.M.P. Análise de Crescimento de Plantas: Noções Básicas; Funep: Jaboticabal, Brazil, 2003; p. 42. [Google Scholar]
- Ferreira, D.F. SISVAR: A computer analysis system to fixed effects split plot type designs. Rev. Bras. Biom. 2019, 37, 529–535. [Google Scholar] [CrossRef] [Green Version]
- Martins, J.B.; Santos Júnior, J.A.; Bartusch, V.P.; Gheyi, H.R.; Bezerra Neto, E.; Silva, M.M. Water relations in parsley plants cultivated in brackish nutrient solutions of different cationic natures. R. Bras. Eng. Agríc. Ambient. 2019, 23, 662–668. [Google Scholar] [CrossRef] [Green Version]
- Ropokis, A.; Ntatsi, G.; Kittas, C.; Katsoulas, N.; Savvas, D. Impact of cultivar and grafting on nutrient and water uptake by sweet pepper (Capsicum annuum L.) grown hydroponically under Mediterranean climatic conditions. Front. Plant Sci. 2018, 9, 1244. [Google Scholar] [CrossRef] [PubMed] [Green Version]
- Silva, J.S.; Paz, V.P.S.; Soares, T.M.; Almeida, W.F.; Fernandes, J.P. Production of lettuce with brackish water in NFT hydroponic system. Semina Ciênc. Agr. 2018, 39, 947–961. [Google Scholar] [CrossRef]
- Soares, H.R.; Santos Júnior, J.A.; Silva, Ê.F.F.; Rolim, M.M.; Silva, G.F. Water and physiological relationships of lettuce cultivated in hydroponics with brackish waters. Rev. Ciênc. Agron. 2019, 50, 216–222. [Google Scholar] [CrossRef]
- Prisco, J.T.; Filho, E.G.; Miranda, R.S. Physiology and biochemistry of plants growing under salt stress. In Manejo da Salinidade na Agricultura: Estudos Básicos e Aplicados, 2nd ed.; Gheyi, H.R., Dias, N.S., Lacerda, C.F., Filho, E.G., Eds.; INCTSal: Fortaleza, Brazil, 2016; pp. 163–180. [Google Scholar]
- Butcher, K.; Wick, A.F.; DeSutter, T.; Chatterjee, A.; Harmon, J. Soil salinity: A threat to global food security. Agron. J. 2016, 108, 2189–2200. [Google Scholar] [CrossRef]
- Abrahão, C.; Bôas, R.L.V.; Bull, L.T. Relação K:Ca:Mg na solução nutritiva para a produção de minitomate cultivado em substrato. Irriga 2014, 19, 214–224. [Google Scholar] [CrossRef] [Green Version]
- Silva, M.L.S.; Trevizam, A.R. Interações iônicas e seus efeitos na nutrição das plantas. Info. Agron. 2015, 49, 16. [Google Scholar]
- Ghatak, A.; Chaturvedi, P.; Weckwerth, W. Metabolomics in plant stress physiology. Plant Genet. Mol. Biol. 2018, 50, 187–236. [Google Scholar] [CrossRef]
- Silva, L.; Gasca-Leyva, E.; Escalante, E.; Fitzsimmons, K.M.; Lozano, D.V. Evaluation of biomass yield and water treatment in two aquaponic systems using the dynamic root floating technique (DRF). Sustainability 2015, 7, 15384–15399. [Google Scholar] [CrossRef] [Green Version]
- Jensen, M.H. Hydroponics. HortScience 1997, 32, 1018–1021. [Google Scholar] [CrossRef] [Green Version]
- Lenzi, A.; Baldi, A.; Tesi, R. Growing spinach in a floating system with different volumes of aerated or non aerated nutrient solution. Adv. Hortic. Sci. 2011, 25, 21–25. [Google Scholar] [CrossRef]
- Mobini, S.H.; Ismail, M.R.; Aroiuee, H. The impact of aeration on potato (Solanum tuberosum L.) minituber production under soilless conditions. Afr. J. Biotechnol. 2015, 14, 910–921. [Google Scholar] [CrossRef]
- Niñirola, D.; Fernández, J.A.; Conesa, E.; Martinez, J.A.; Egea-Gilabert, C. Combined effects of growth cycle and different levels of aeration in nutrient solution on productivity, quality, and shelf life of watercress (Nasturtium officinale R. Br.) plants. HortScience 2014, 49, 567–573. [Google Scholar] [CrossRef]
- Silva, M.G.; Soares, T.M.; Gheyi, H.R.; Oliveira, M.G.; Santos, C.C. Hydroponic cultivation of coriander using fresh and brackish waters with different temperatures of the nutrient solution. Eng. Agríc. 2020, 40, 674–683. [Google Scholar] [CrossRef]
- He, F.; Thiele, B.; Watt, M.; Kraska, T.; Ulbrich, A.; Kuhn, A.J. Effects of root cooling on plant growth and fruit quality of cocktail tomato during two consecutive seasons. J. Food Qual. 2019, 2019, 3598172. [Google Scholar] [CrossRef]
- Cometti, N.N.; Bremenkamp, D.M.; Galon, K.; Hell, L.R.; Zanotelli, M.F. Cooling and concentration of nutrient solution in hydroponic lettuce crop. Hortic. Bras. 2013, 31, 287–292. [Google Scholar] [CrossRef] [Green Version]
- Silva Junior, F.J.; Santos Júnior, J.A.; Dias, N.S.; Gheyi, H.R.; Rivera, R.C.; Silva, G.F.; Fernandes, C.S. Green onion production under strategies of replacement and frequencies of circulation of brackish nutritive solutions. Biosci. J. 2019, 35, 796–805. [Google Scholar] [CrossRef]
- Munns, R.; Tester, M. Mechanisms of Salinity Tolerance. Annu. Rev. Plant Biol. 2008, 59, 651–681. [Google Scholar] [CrossRef] [Green Version]
- Tabela Brasileira de Composição de Alimentos. Available online: http://www.fcf.usp.br/tbca (accessed on 13 May 2022).
- Abbasi, H.; Jamil, M.; Haq, A.; Ali, S.; Ahmad, R.; Malik, Z.; Parveen, Z. Salt stress manifestation on plants, mechanism of salt tolerance and potassium role in alleviating it: A review. Zemdirb. Agric. 2016, 103, 229–238. [Google Scholar] [CrossRef] [Green Version]
- Silva, M.G.; Soares, T.M.; Gheyi, H.R.; Oliveira, I.S.; Silva Filho, J.A.; Carmo, F.F. Frequency of recirculation of nutrient solution in hydroponic cultivation of coriander with brackish water. R. Bras. Eng. Agríc. Ambient. 2016, 20, 447–454. [Google Scholar] [CrossRef] [Green Version]
- Paranychianakis, N.V.; Chartzoulakis, K.S. Irrigation of mediterranean crops with saline water: From physiology to management practices. Agric. Ecosyst. Environ. 2005, 106, 171–187. [Google Scholar] [CrossRef]
- Lira, R.M.; Silva, Ê.F.F.; Silva, G.F.; Soares, H.R.; Willadino, L.G. Growth, water consumption and mineral composition of watercress under hydroponic system with brackish water. Hortic. Bras. 2018, 36, 13–19. [Google Scholar] [CrossRef]
- Alves, L.S.; Silva, M.G.; Gheyi, H.R.; Paz, V.P.S.; Soares, T.M.; Rafael, M.R.S. Uso de águas salobras no cultivo da chicória em condições hidropônicas. Irriga 2019, 24, 758–769. [Google Scholar] [CrossRef]
- Baiyin, B.; Tagawa, K.; Yamada, M.; Wang, X.; Yamada, S.; Yamamoto, S.; Ibaraki, Y. Effect of the flow rate on plant growth and flow visualization of nutrient solution in hydroponics. Horticulturae 2021, 7, 225. [Google Scholar] [CrossRef]
- Baiyin, B.; Tagawa, K.; Yamada, M.; Wang, X.; Yamada, S.; Shao, Y.; An, P.; Yamamoto, S.; Ibaraki, Y. Effect of nutrient solution flow rate on hydroponic plant growth and root morphology. Plants 2021, 10, 1840. [Google Scholar] [CrossRef] [PubMed]
- Guimarães, R.F.B.; Maia Júnior, S.O.; Nascimento, R.; Melo, D.F.; Ramos, J.G.; Andrade, J.R. Trocas gasosas em cultivares de alface crespa em cultivo hidropônico com água salina. Rev. Bras. Agric. Irrig. 2019, 13, 3599. [Google Scholar] [CrossRef]
- Yang, H.; Shukla, M.K.; Mao, X.; Kang, S.; Du, T. Interactive regimes of reduced irrigation and salt stress depressed tomato water use efficiency at leaf and plant scales by affecting leaf physiology and stem sap flow. Front. Plant Sci. 2019, 10, 160. [Google Scholar] [CrossRef] [PubMed]
- Bañón, D.; Alarcón, J.J.; Sánchez-Blanco, M.J.; Ortuño, M.F.; Bañón, S.; Lorente, B.; Ochoa, J. Response of Potted Hebe andersonii to Salinity under an Efficient Irrigation Management. Agronomy 2022, 12, 1696. [Google Scholar] [CrossRef]
- Taiz, L.; Zeiger, E. Fisiologia Vegetal, 4th ed.; Artmed: Porto Alegre, Brazil, 2009; p. 819. [Google Scholar]
- Larcher, W. Ecofisiologia Vegetal, 1st ed.; Rima: São Carlos, Brazil, 2004; p. 531. [Google Scholar]
- Carvalho, R.C.; Mota, F.D.; Gabriel Filho, L.R.A.; Klar, A.E.; Grassi Filho, H. Lisímetro para medida da evapotranspiração na cultura do pimentão em sistema hidropônico com substrato1. Irriga 2020, 25, 361–376. [Google Scholar] [CrossRef]


| Treatment (Initial ECns) | ECns 1 | ECw 2 | Saline Water | |
|---|---|---|---|---|
| NaCl | CaCl2·2H2O | |||
| (dS m−1) | (mmol L−1) | |||
| 1.7 | 1.58 | 0.12 | 0 | 0 |
| 3.0 | 1.58 | 1.42 | 13.00 | 9.81 |
| 4.5 | 1.58 | 3.12 | 28.06 | 21.13 |
| 6.0 | 1.58 | 4.62 | 43.12 | 32.46 |
| SV | DF | Mean Squares | |||||||
|---|---|---|---|---|---|---|---|---|---|
| DMAP | WCAP | PH | WC | ||||||
| NaCl | CaCl2 | NaCl | CaCl2 | NaCl | CaCl2 | NaCl | CaCl2 | ||
| ECns | 3 | 18.22 ** | 17.33 ** | 4.04 ns | 2.88 * | 188.07 ** | 190.45 ** | 0.34 ** | 0.41 ** |
| LR | 1 | 52.95 ** | 51.15 ** | 5.74 ns | 2.66 ns | 517.40 ** | 564.21 ** | 0.71 ** | 1.15 ** |
| QR | 1 | 1.69 ** | 0.20 ns | 6.37 * | 3.78 * | 39.22 ** | 1.17 ns | 0.31 ** | 0.05 * |
| Flow | 3 | 0.78 * | 0.54 ** | 0.28 ns | 5.19 ** | 6.75 ns | 6.09 * | 0.15 ** | 0.01 ns |
| LR | 1 | 2.01 ** | 0.84 ** | 0.62 ns | 4.60 * | 16.24 * | 17.37 ** | 0.15 ** | 0.01 ns |
| QR | 1 | 0.02 ns | 0.00 ns | 0.22 ns | 10.98 ** | 2.60 ns | 0.64 ns | 0.28 ** | 0.04 * |
| ECns × Flow | 9 | 0.49 ns | 0.15 ns | 1.89 ns | 0.94 ns | 6.34 ** | 4.51 ** | 0.01 ns | 0.02 * |
| Residue | 48 | 0.22 | 0.07 | 1.36 | 0.87 | 2.79 | 1.52 | 0.01 | 0.01 |
| CV% | 11.90 | 8.06 | 1.29 | 1.04 | 6.54 | 5.27 | 10.82 | 15.31 | |
| SV | DF | Mean Squares | |||||||
|---|---|---|---|---|---|---|---|---|---|
| WP-FMAP | WP-DMAP | A/E | A/gs | ||||||
| NaCl | CaCl2 | NaCl | CaCl2 | NaCl | CaCl2 | NaCl | CaCl2 | ||
| ECns | 3 | 1205.04 ** | 1064.43 ** | 6.67 ** | 8.50 ** | 6.50 ** | 9.59 ** | 3471.45 ** | 2248.82 ** |
| LR | 1 | 2455.48 ** | 798.38 ** | 16.19 ** | 3.82 ns | 4.71 ** | 27.95 ** | 11.95 ns | 5593.97 ** |
| QR | 1 | 1158.21 ** | 1531.19 ** | 3.82 ** | 7.07 ** | 14.65 ** | 0.75 ns | 10,267.56 ** | 1022.25 * |
| Flow | 3 | 957.51 ** | 176.81 ns | 7.45 ** | 4.41 ** | 0.06 ns | 3.59 ** | 36.29 ns | 1985.26 ** |
| LR | 1 | 1942.76 ** | 102.47 ns | 14.18 ** | 6.41 ** | 0.02 ns | 6.76 ** | 19.11 ns | 1097.53 * |
| QR | 1 | 802.23 ** | 12.69 ns | 7.38 ** | 3.35 ns | 0.17 ns | 2.22 * | 67.44 ns | 2415.60 ** |
| ECns × Flow | 9 | 76.64 ns | 489.83 ** | 0.71 ns | 3.62 ** | 0.39 ns | 0.28 ns | 117.70 ns | 70.59 ns |
| Residue | 48 | 60.48 | 101.63 | 0.52 | 0.89 | 0.31 | 0.42 | 177.41 | 200.79 |
| CV% | 16.15 | 16.51 | 15.91 | 15.81 | 14.90 | 21.08 | 16.28 | 20.33 | |
Publisher’s Note: MDPI stays neutral with regard to jurisdictional claims in published maps and institutional affiliations. |
© 2022 by the authors. Licensee MDPI, Basel, Switzerland. This article is an open access article distributed under the terms and conditions of the Creative Commons Attribution (CC BY) license (https://creativecommons.org/licenses/by/4.0/).
Share and Cite
Bezerra, R.R.; Santos Júnior, J.A.; Pessoa, U.C.; Silva, Ê.F.d.F.e.; Oliveira, T.F.d.; Nogueira, K.F.; Souza, E.R.d. Water Efficiency of Coriander under Flows of Application of Nutritive Solutions Prepared in Brackish Waters. Water 2022, 14, 4005. https://doi.org/10.3390/w14244005
Bezerra RR, Santos Júnior JA, Pessoa UC, Silva ÊFdFe, Oliveira TFd, Nogueira KF, Souza ERd. Water Efficiency of Coriander under Flows of Application of Nutritive Solutions Prepared in Brackish Waters. Water. 2022; 14(24):4005. https://doi.org/10.3390/w14244005
Chicago/Turabian StyleBezerra, Raphaela Revorêdo, José Amilton Santos Júnior, Uriel Calisto Pessoa, Ênio Farias de França e Silva, Tarcísio Ferreira de Oliveira, Kézia Ferreira Nogueira, and Edivan Rodrigues de Souza. 2022. "Water Efficiency of Coriander under Flows of Application of Nutritive Solutions Prepared in Brackish Waters" Water 14, no. 24: 4005. https://doi.org/10.3390/w14244005