
Potential of GTL-Derived Biosolids for Water Treatment: Fractionization, Leachate, and Environmental Risk Analysis

1
Division of Sustainable Development, College of Science and Engineering, Hamad Bin Khalifa University, Education City, Qatar Foundation, Doha P.O. Box 34110, Qatar
2
Qatar Environment and Energy Research Institute, Hamad Bin Khalifa University, Qatar Foundation, Doha P.O. Box 34110, Qatar
*
Author to whom correspondence should be addressed.
Water 2022, 14(24), 4016; https://doi.org/10.3390/w14244016
Submission received: 31 October 2022
/
Revised: 29 November 2022
/
Accepted: 3 December 2022
/
Published: 9 December 2022
(This article belongs to the Section Water Quality and Contamination)
Abstract
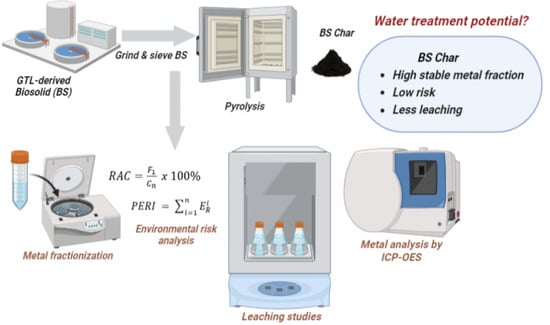
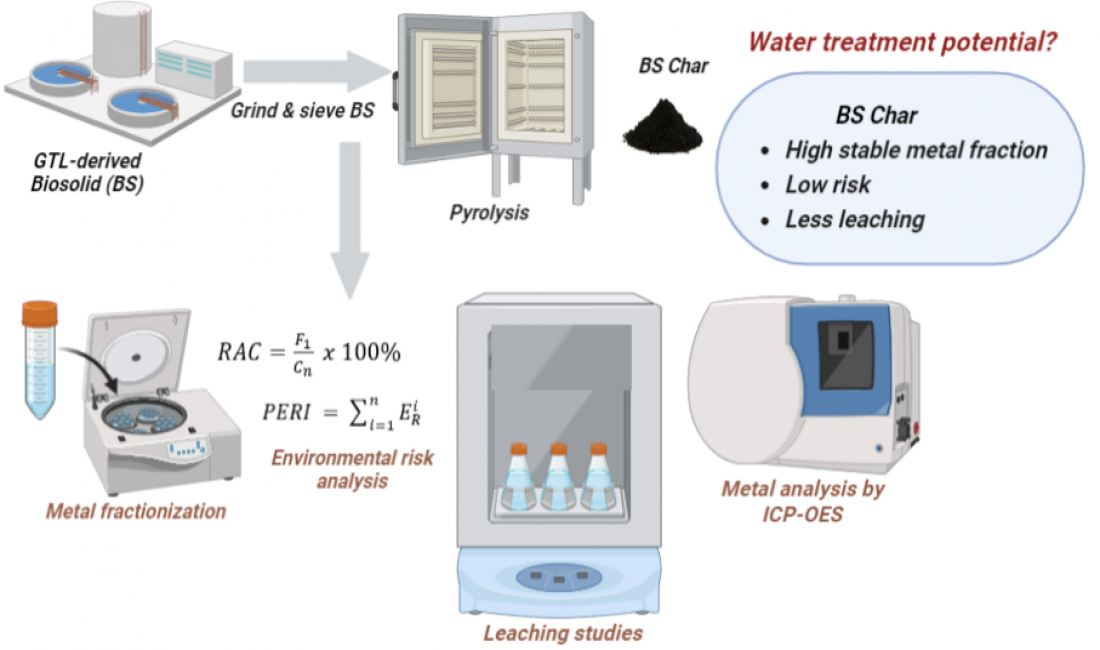
:This study aims to understand the potential of using biosolids produced from the world’s largest gas-to-liquid (GTL) plant for water treatment applications. The metal fractionization of the two samples: raw biosolid (BS) and the pyrolyzed biosolid-BS char (BSC) (temperature: 450 °C, heating rate: 5 °C/min, residence time: 30 min) into exchangeables (F1), reducible (F2), oxidizable (F3), and residual (F4) were carried out following the Community Bureau of Reference (BCR) procedure. Characterization showed an increased carbon content and reduced oxygen content in the biochar sample. Additionally, the presence of calcium, magnesium, and iron were detected in smaller quantities in both samples. Based on the extraction results for metals, the environmental risk analysis was determined based on RAC (Risk Assessment Code) and PERI (Potential Ecological Risk Index) indices. Furthermore, leaching studies following the TCLP (Toxicity Characteristic Leaching Procedure) were conducted. The results prove that pyrolyzing stabilizes the metals present in the raw material as BS sample had high F1 fractions, and the BS char had a greater F4 fraction. While the RAC and PERI indices show that the pyrolyzed BS has a ‘low risk’, much reduced compared to the original BS sample, this is confirmed by the leaching studies that displayed minimal leaching from the pyrolyzed sample. Overall, this study proves that the GTL biosolids can best be applied for water treatment after pyrolysis.
1. Introduction
The global population increase is known to be causing an almost exponential rise in the solid waste and wastewater produced. The current global environmental pollution scenario is a long-term problem that needs concrete solutions. In recent times, waste management has been considered a closed-loop system—coined ‘circular economy’—wherein the economic value of the waste is increased. There are thermochemical conversion methods that are employed on waste to produce value-added products. One such process is pyrolysis, which is known to convert wastes—at temperatures above 300 °C in a pyrolysis unit—into different products such as biogas, bio-oil, and biochar based on the temperature, heating rate, and residence time [1,2]. Although biochar is often considered a by-product, it has been used for agricultural and water treatment purposes. All kinds of wastes—including biomass, plastic, textile sewage sludge, and pharmaceuticals, among others—have been studied in the literature [3,4,5,6,7]. This not only increases market opportunities for these products but also delivers specific products for various industrial uses [8].
One significant waste coming from wastewater treatment processes is sewage sludge, which is complex containing varying concentrations of organic and mineral components, metal ions, and pathogenic microorganisms [9]. Since sewage sludge contaminant limits are stringent, they are usually treated prior to disposal. They are used for various wastewater treatment applications—a paper on the application of sludge for wastewater treatment discusses its potential for being used as a coagulant in wastewater treatment plants, as a substrate in constructed wetlands, for dewatering sewage sludge, and—more importantly—to remove contaminants and heavy metals from wastewater [10]. A study removed reasonable amounts of boron, copper, chromium, lead, and selenium in the reverse osmosis concentrate using sludge as a low-cost adsorbent [11]. If the pH is controlled, metals and metalloids can be selectively removed [10]. Treated sewage sludge, often termed biosolids (BS) and usually dry, is known to have limited after-use options. Similarly, biosolids from the treated wastewater from the oil and gas industry are also known to be generated in large quantities. For example, a wastewater treatment plant from the largest gas-to-liquid (GTL) plant in Qatar, located in North Doha, generates about 6000 tons of dry biosolids annually, and all the treated water is industrial in nature with no sewage included [12].
Around the world, there have been studies to understand the useability and suitability of biosolids produced from different types of wastewater [13,14,15,16] to avoid the associated environmental risk; the environmental risk includes emission of greenhouse gas (CO2, CH4, N2O) emissions leading to global warming—around 30–40% of the carbon in biosolids is converted to carbon dioxide during process and disposal or use [17]. Additionally, the risk of leaching of nutrients leading to eutrophication and heavy metals leading to biomagnification affecting the food chain is concerning [18]. In general, the trace metal content in sludge, soils, and sediments is analyzed to understand the bioavailable fractions and the mobility of the metals. Further leaching studies of the metals are deemed necessary in order to use biosolids for water treatment and soil applications.
This paper focuses on conducting the following:
- Characterization of the biosolids (BS) and pyrolyzed BS: BS char (BSC) samples.
- Determination of the metal content in the samples using the acid digestion method.
- Fractionization of some common metals present in both samples following the Community Bureau of Reference (BCR) sequential extraction procedure.
- Leaching of metals in water for both samples following the TCLP (Toxicity Characteristic Leaching Procedure).
- Environmental risk assessment based on the Risk Assessment Code (RAC) and Potential Ecological Risk Index (PERI) methods.
Although there are some similar studies on biosolids obtained from wastewater treatment from sewage plants [8], this study uniquely investigates the potential of using biosolids procured from a GTL plant for water treatment applications, especially for heavy metal removal. The conclusion from this research will prove helpful for the appropriate usage of this complex waste. Currently, the biosolids used for this study are fully landfilled; therefore, finding more environmentally friendly management options will prove beneficial.
2. Materials and Methods
2.1. Pyrolysis
For pyrolyzing the biosolid samples, the dried raw material/feedstock is directly ground and sieved to ≤700 µm. About 50 g samples were placed in a ceramic dish with no pre-treatment. The samples were then placed in a pyrolysis furnace—namely, a UL standard 1200 °C compact split tube furnace (OTF-1200X-S, MTI Corporation, Richmond, UT, USA) at 450 °C at a heating rate of 5 °C/min for 30 min residence time. This study chooses these conditions trying to keep the time and energy requirements for pyrolysis at a minimum while still producing biochar that is applicable for water treatment and agricultural purposes. After pyrolysis, the samples were left inside the furnace to cool down and then weighed to determine the yield by the following equation [19].
The yield of biochar (%) = Weight of biochar (g)/Weight of oven-dried wastes(g) × 100
2.2. Feedstock and Biochar Characterization
The biosolids for this study are provided by Qatar Shell’s GTL plant in the dried form.
2.2.1. Proximate and Ultimate Analysis
The proximate analysis was carried out using a thermos-analyzer (SDT650, TA Instruments, New Castle, DE, USA) following the ASTM (American Society for Testing and Materials): ASTM D7582-15 (ASTM International, 2015) method. In triplicate, samples weighing 10 mg on average were prepared, and heating was started from 105 °C in an inert environment for 30 min to evaluate the moisture content. Furthermore, the temperature was steadily increased to 950 °C at a rate of 30 °C/min. It was maintained at this temperature for 7 min before adding oxygen to the system, enabling the samples to be combusted for 10 min to determine the ash content. The amount of fixed carbon was calculated on a weight basis by subtracting the rest (moisture, volatile matter, and ash) from the original mass.
The ultimate analysis was carried out using an EA3000 CHNS elemental analyzer (EuroVector, Pavia, Italy) in triplicate. Samples were weighed between 1 and 2 mg to determine the carbon, nitrogen, and hydrogen content. The oxygen content was calculated by the difference in weight of the elements in addition to the ash content obtained from the samples’ total mass.
2.2.2. pH
The pH of the sample was determined using a modified ASTM standard method D3838-99 (ASTM, 217 2005). About 1 g of dried sample was put into a beaker containing 10 mL of boiling de-ionized water. The solution mixture was heated and allowed to boil for about 15 min in a sealed tube. Then, the solution was filtered employing a pre-moistened filter paper (Whatman No. 2, 110 mm diameter, Sigma-Aldrich, Burlington, United States). The pH of the filtrate that was obtained at 323 ± 5K was considered as the sample pH in Section 2.2.1.
2.2.3. Calorific Value
For Combustion, A 6300 Fixed Bomb Parr calorimeter(Parr Instrument Company, Moline, IL, USA) in an oxygen atmosphere was used to measure the calorific values of the samples. About 0.6 g of dried samples was accurately weighed and placed in the bomb with a magnetic thread and at 4000 psi oxygen filled; the bomb was then placed in two liters of water, and the further increase in temperature was measured using mercury-in-glass thermometers, platinum resistance thermometers, quartz oscillators, and thermistor systems.
2.2.4. XRD
For this study, a D8 Advance X-ray diffractometer (XRD) (Bruker, Billerica, MA, USA) with Cu Ka radiation (λ = 1.5418 Å) was used at instrument settings of 40 kV and 40 mA. The scan range was set from 3° to 90°. The step size was set at 0.020°.
2.2.5. Surface Area and Pore Volume
The surface area was characterized by BET (Brunauer–Emmett–Teller) nitrogen sorption at 77 K temperature with a relative pressure between 0.05 and 0.35 using a Nova 2200e surface area analyzer (Tristar3200, Micromeritics, Norcross, GA, USA) [15]. The degassing of the samples was carried out at 105 °C for 480 min. The pore volume was also analyzed by BET and estimated by the liquid adsorbate volume of nitrogen at a relative pressure of 0.99.
2.2.6. Surface Zeta Potential
A zeta potential analyzer (Zetasizer Nano-ZS, Malvern P analytical, Malvern, United Kingdom) was used to analyze the charge of the BSC sample. Prior to using the instrument, 0.1 g of the char sample was added to 200 mL of distilled water in order to make a suspension of 0.5 ppm, with further shaking at 150 rpm for 12 h to ensure adequate mixing.
2.2.7. SEM-EDS
Scanning electron microscopy (SEM) and energy dispersive X-ray spectroscopy (EDS) were carried out to understand the morphology and the elemental microanalysis of the surface of the samples. The powdered samples were sprinkled onto adhesive carbon tape, and any excess was blown away using compressed air. The sample was then coated with 5 nm of gold (using Quoram Q150 sputter) to make it electrically conductive for SEM analysis. Imaging was performed at 5 KV using an ETD secondary electron detector and a Quanta 650FEG FEI SEM (Field Electron and Ion Company, Hillsboro, OR, USA). The elemental microanalysis was performed at 15 KV using Bruker Quantax EDS detector (Bruker, Billerica, MA, USA). Gold was deconvoluted to zero to obtain a semi-quantitative result.
2.2.8. Metal Analysis by Acid Digestion
The content of metals in the feedstock was analyzed to understand the concentration and stability of metals in the samples. First, 0.3 g of each of the samples was digested in a microwave digester tank using 9 mL pure nitric acid and 1 mL H2O2 for 30 min; the mixture was shaken well and then put aside for 1 h after tightening the piston before placing it in the microwave digestion instrument (High-Performance Microwave Digestion System, Milestone, I-24100, Bergamo, Italy). After digestion, the samples were cooled and diluted 10 times before analyzing using Inductively Coupled Plasma Optical Emission Spectroscopy (ICP-OES) (The Agilent 5800 ICP-OES, Palo Alto, CA, USA).
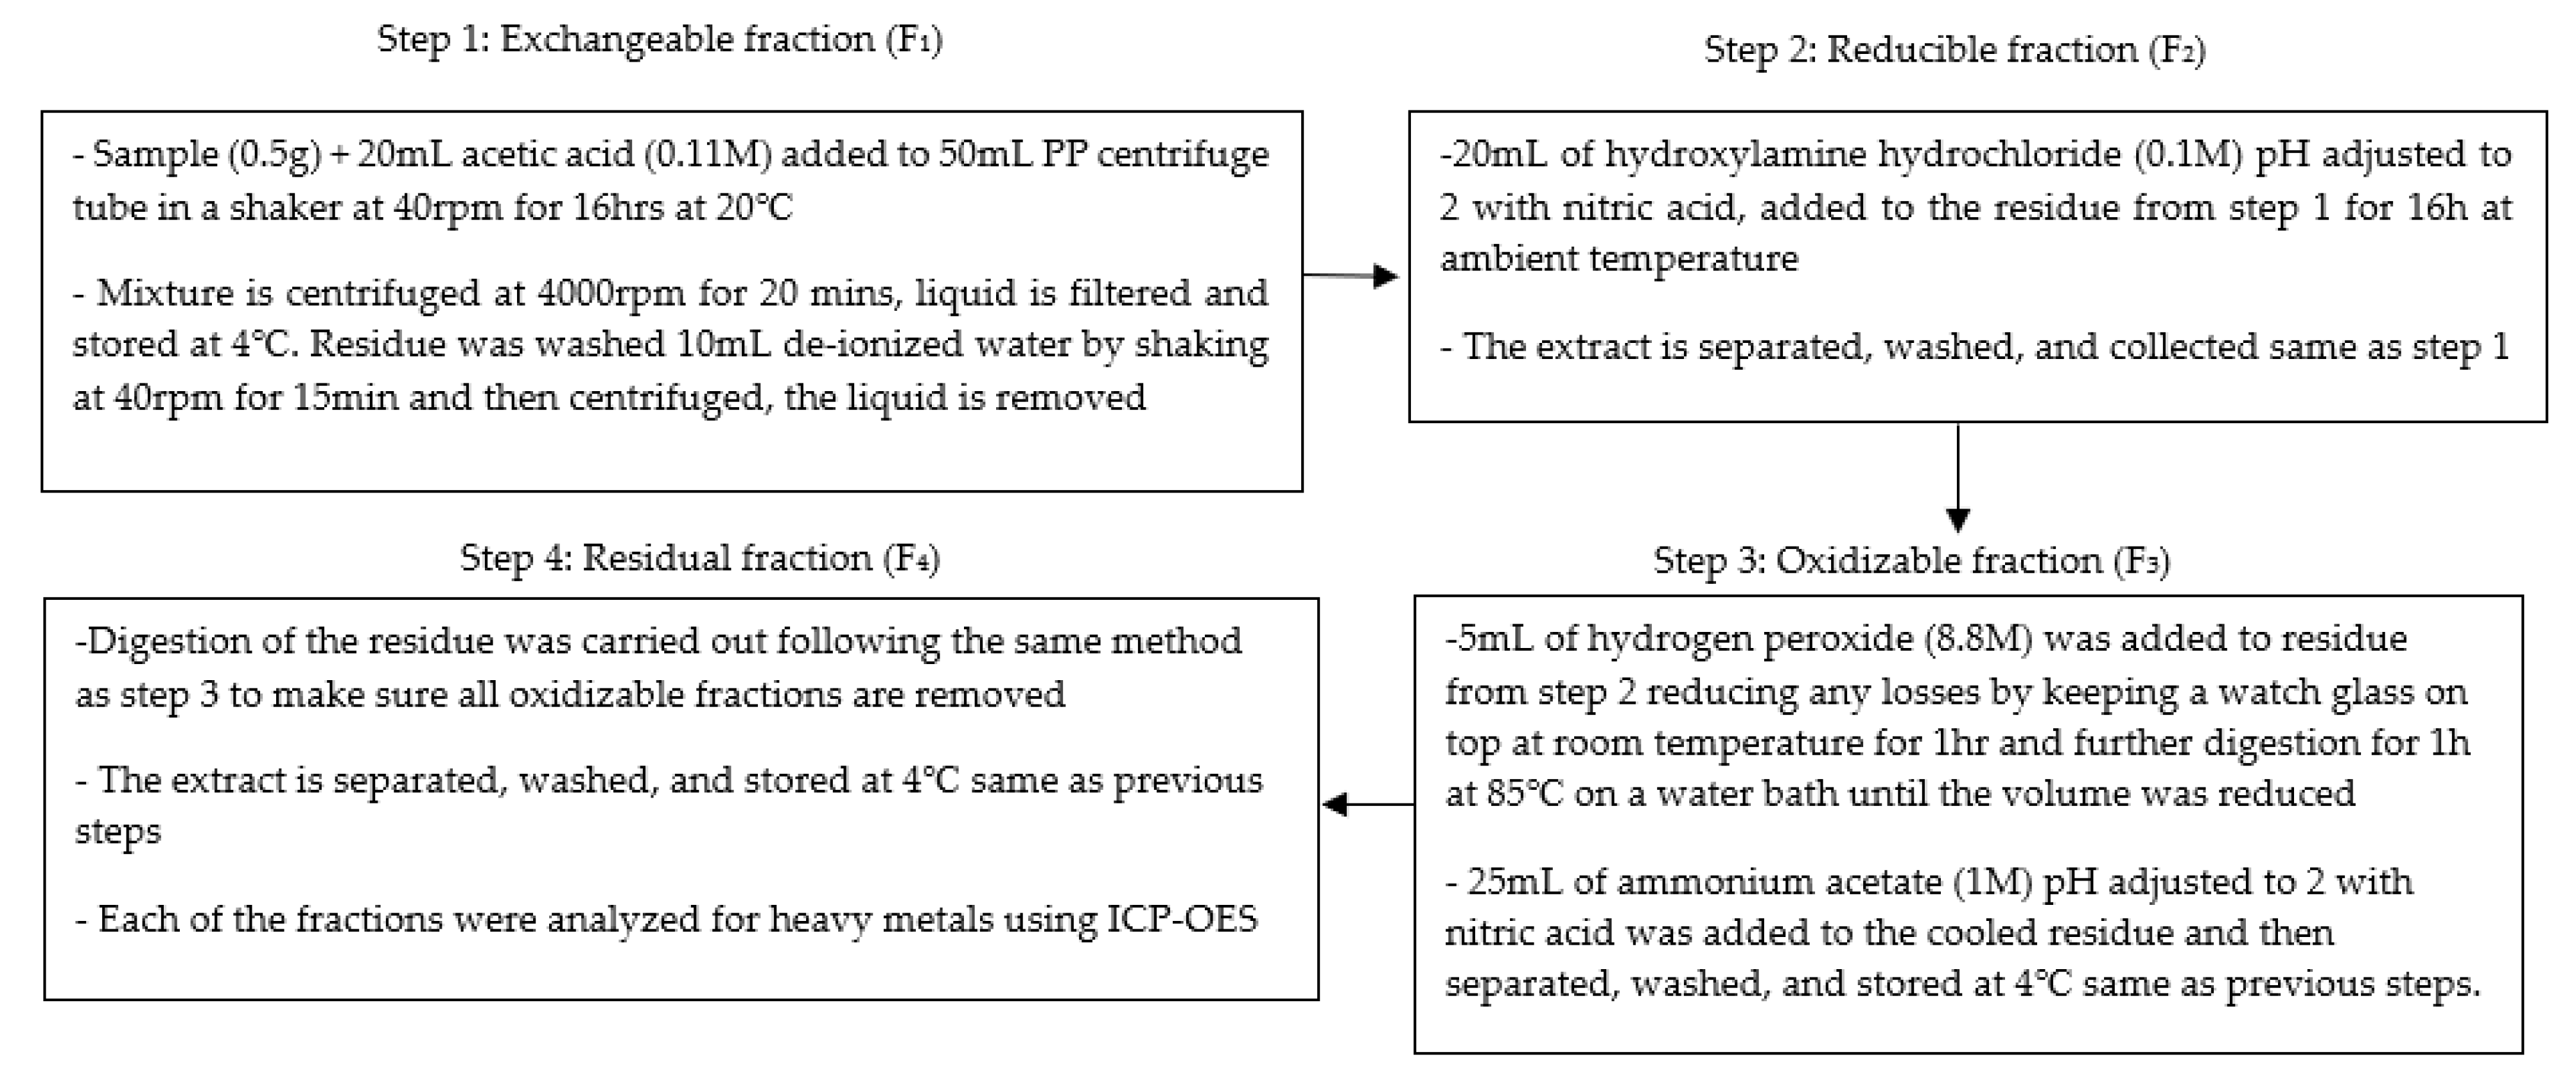
2.3. Metal Fractionization Following the BCR Procedure
2.4. Environmental Risk Analysis
Two risk analysis Equations (2) and (5) were used to understand the environmental risk associated with the biosolid samples. The first is the Risk Assessment Code (RAC), usually used to evaluate the heavy metal content in the soil, sediments, ash, and sludge samples. The equation used is as follows [21]:
where F1 is the heavy metal content in the first fraction, is the content of corresponding heavy metal; the RAC can be divided into five levels of risk: no risk (lower than 1%), low risk (1–10%), medium risk (11–30%), high risk (31–50%), and very high risk (>50%). The second risk analysis is based on the Potential Ecological Risk Index (PERI), and the equations to calculate PERI are as follows [22], and the risk levels are shown in Table 1.
Contamination index factor (Cf i):
is each heavy metal content; is the heavy metal background concentration values.
The potential risk of individual heavy metal ():
is the heavy metal toxic response factor.
The risk index is the sum of Er i (PERI):
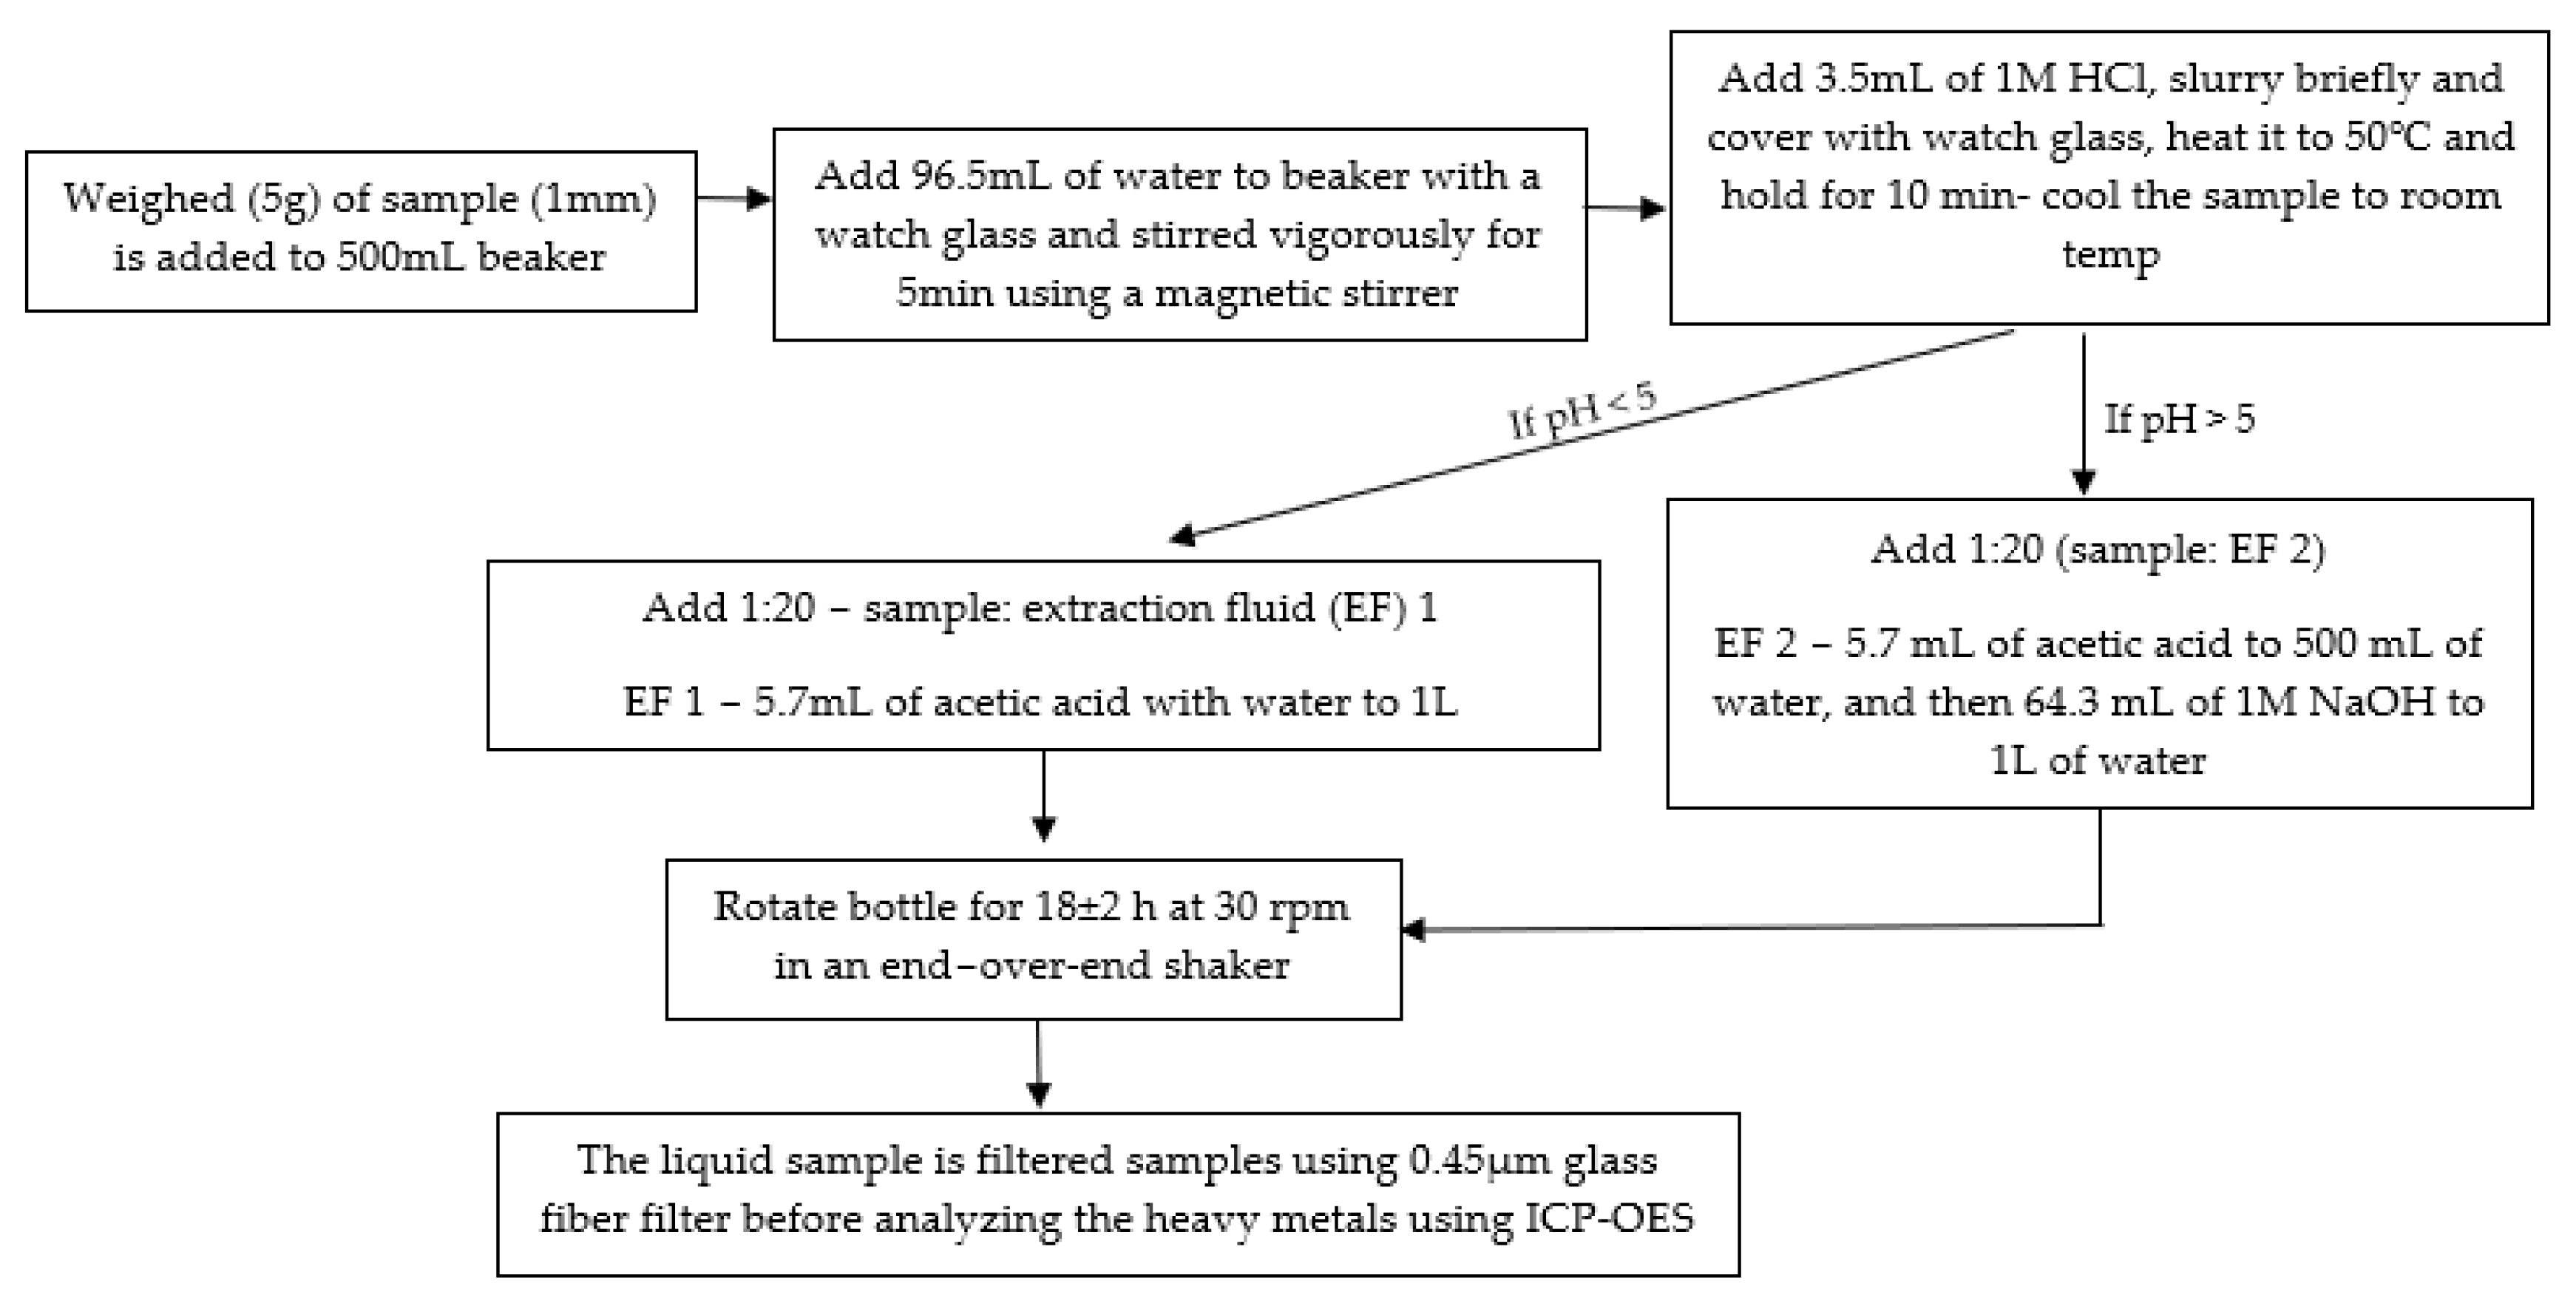
2.5. Leaching Analysis Following TCLP
It is essential to conduct leaching studies for the biosolid samples before conducting any water treatment studies, as it is necessary to understand if the metals present in them contaminate the water during adsorption studies. The following Figure 2 details the steps of leaching studies following the TCLP procedure [23].
3. Results and Discussion
3.1. Characterization of Samples
Figure S1 shows how the char looks after pyrolysis—the brownish color suggests the presence of iron due to the iron coagulant used during wastewater treatment. The yield of biochar obtained from the samples is high (≈45%), comparable to reported sludge studies [24,25]. The quality and other characteristics of the feedstock and biochar sample are shown in Table 2. Like other biochar produced from waste samples, the carbon and fixed carbon content is higher in the biochar samples compared to the feedstock. However, the surface area and pore volume are not significant enough to be directly used for water treatment applications (Table 2). Therefore, further chemical or physical activation methods may need to be employed to improve its surface properties [2]. Finally, the calorific and surface charge values indicate the potential for energy and agricultural application (respectively) using the samples.
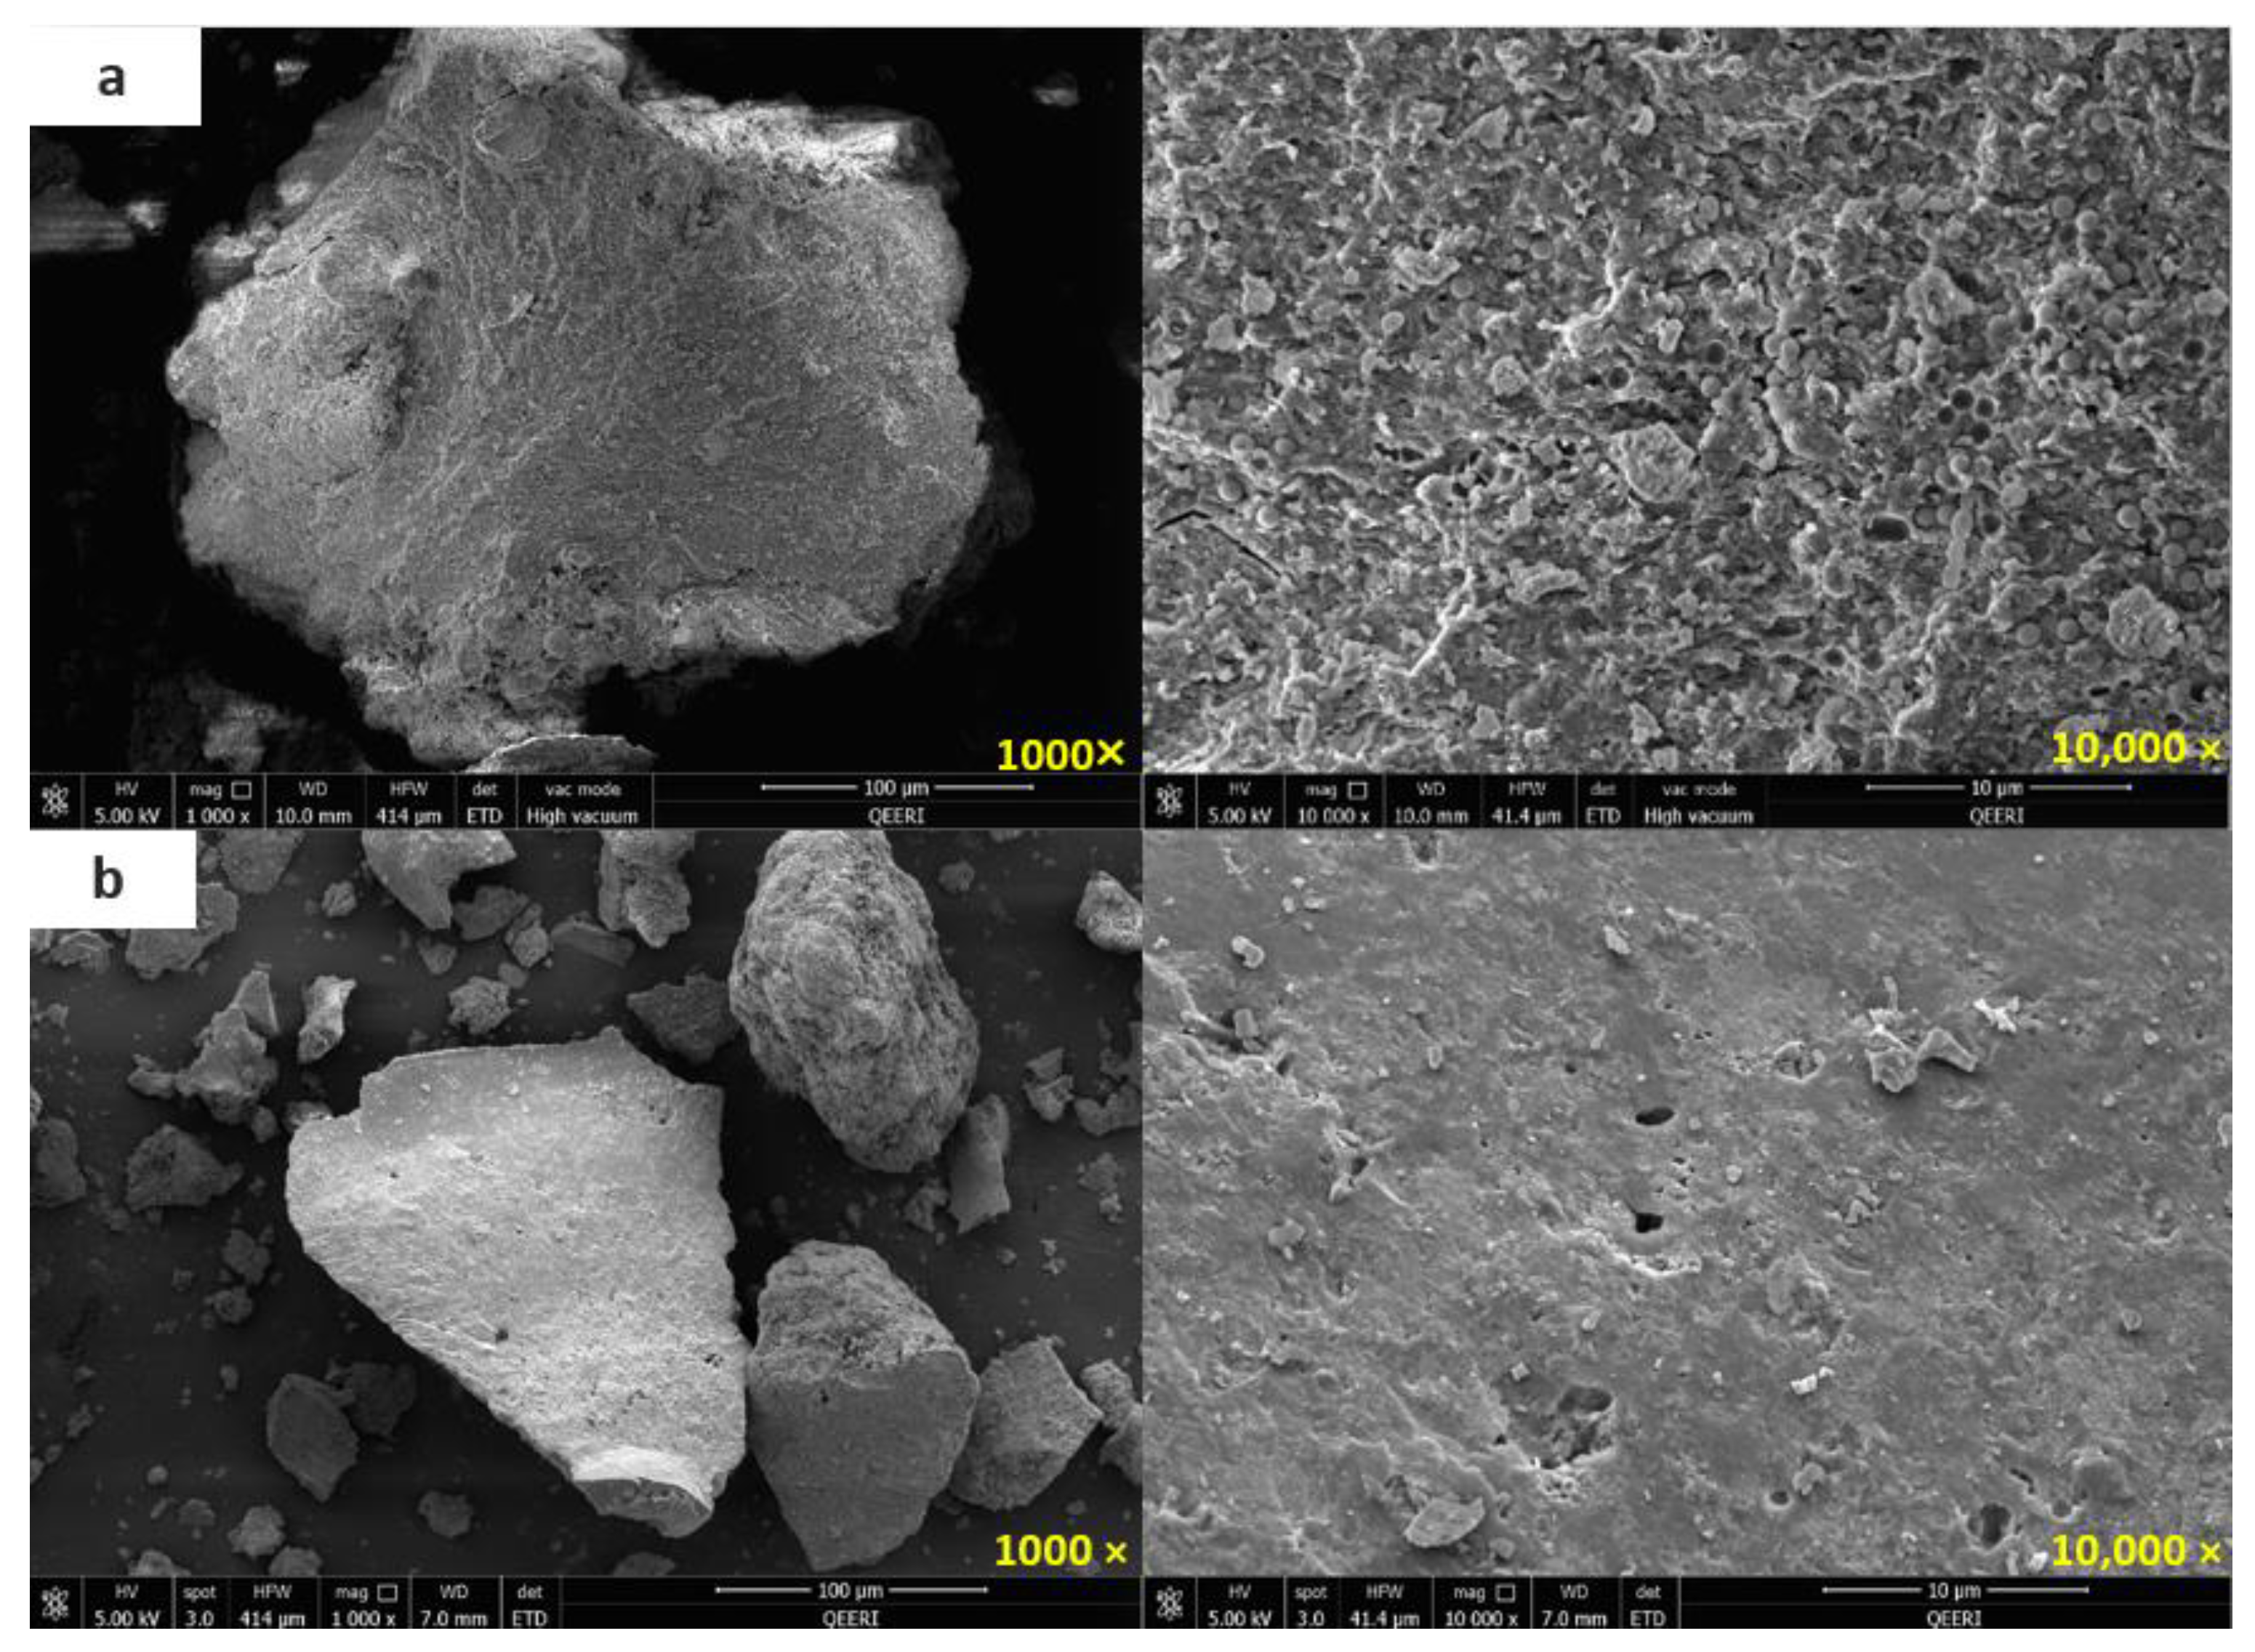
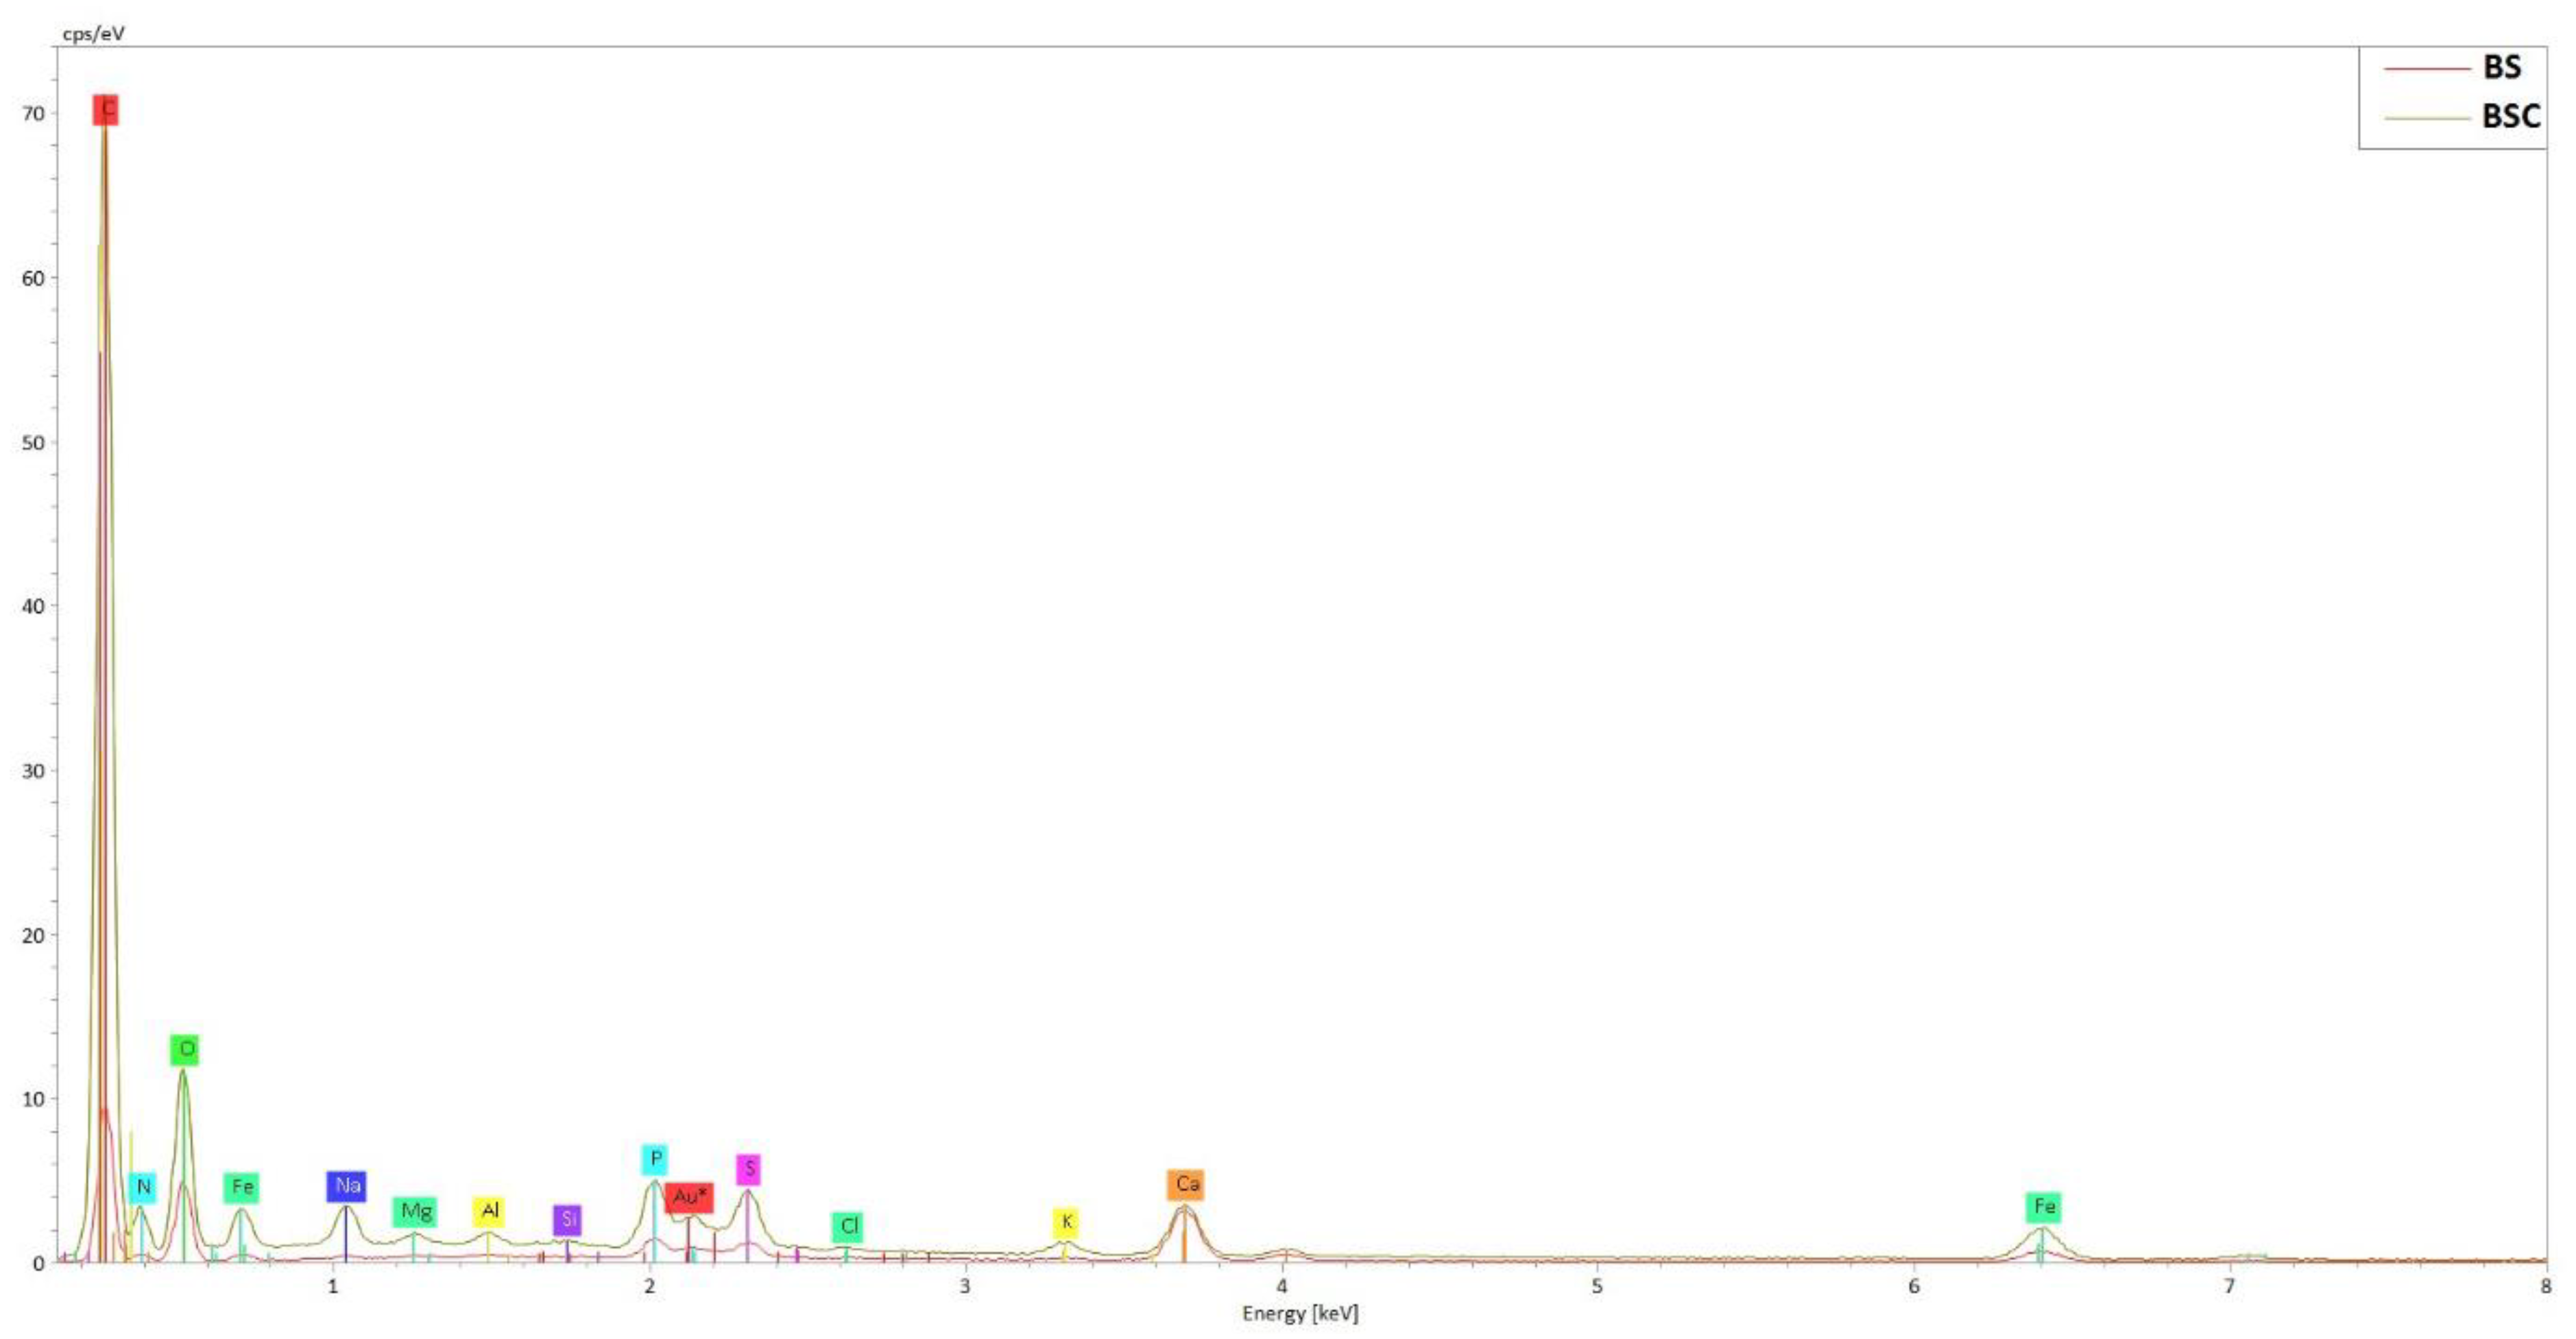
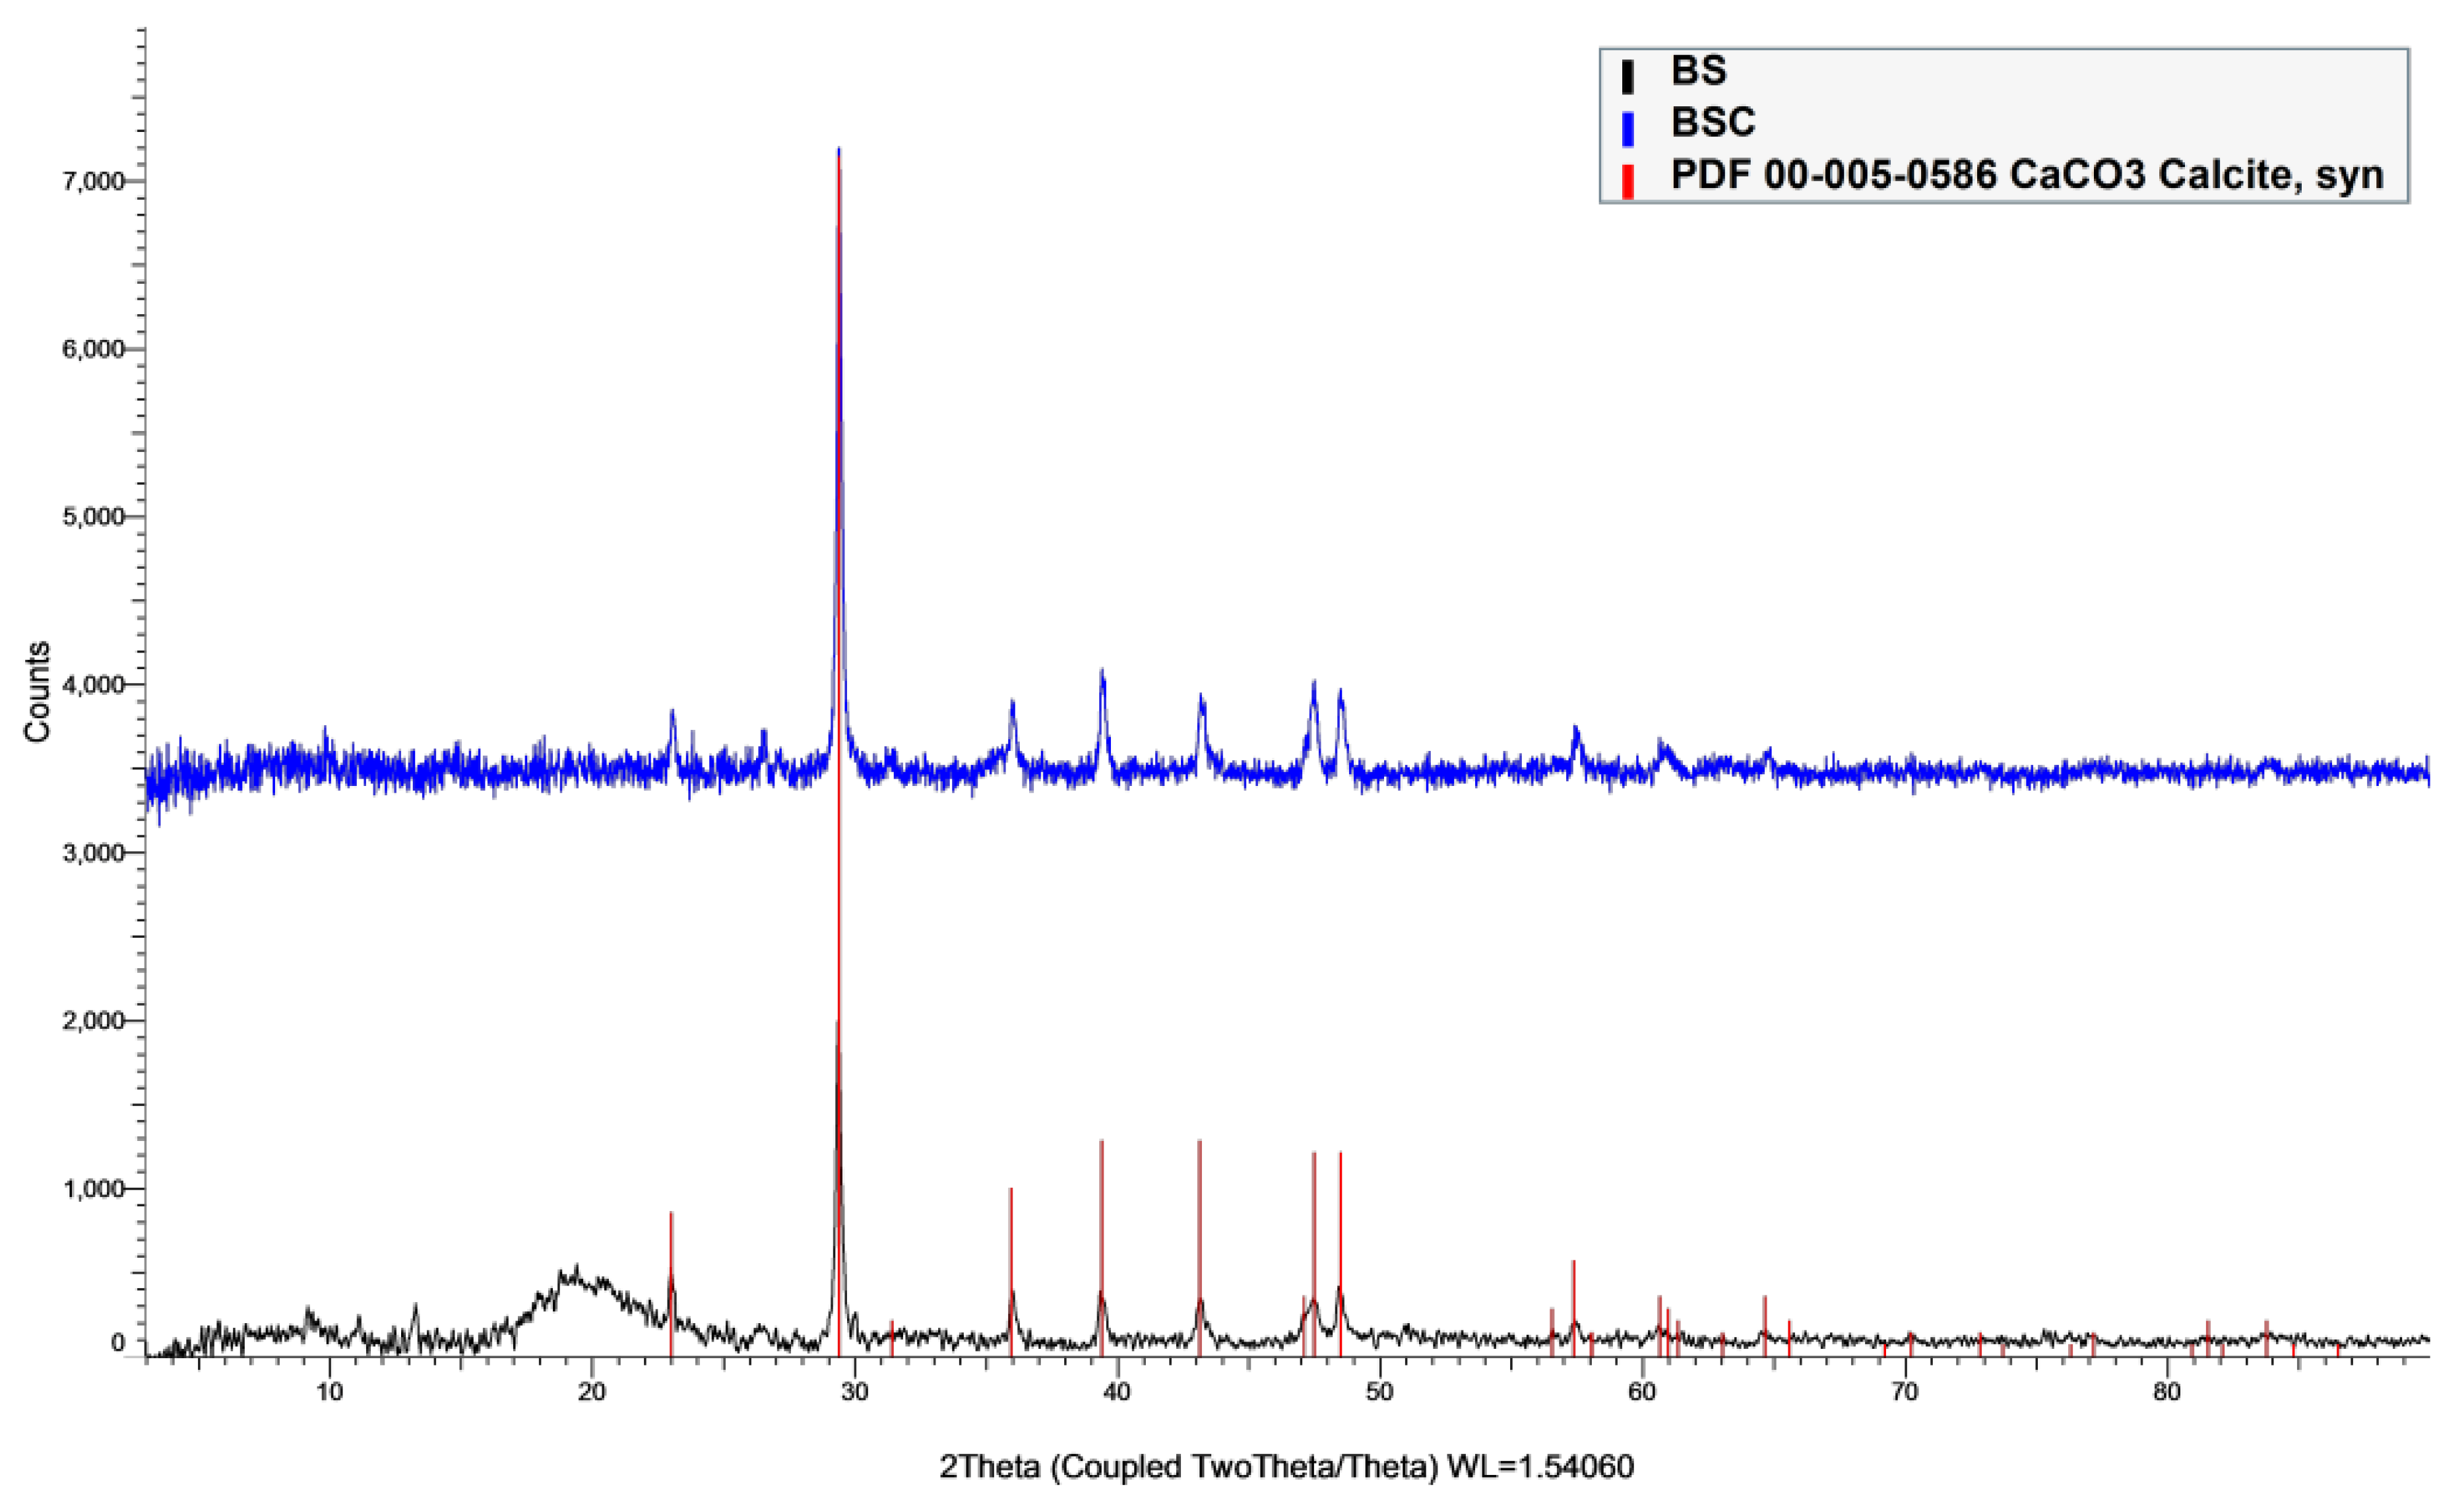
The SEM images show that the biochar samples are fragmented due to the temperature; however, no apparent pore or surface area changes are observed (Figure 3). This observation complies with the surface area, and pore volume measured using the BET (Table 2) analysis. Although EDS shows the elemental presence on the surface of the samples, it is following results obtained from the proximate and ultimate analysis showing higher carbon and nitrogen content in the biochar samples; additionally, there was a reduction in the oxygen content upon pyrolysis—such observations were made in previous studies as well (Table 3, Figure 4) [20,21,22]. The presence of other metals—such as Fe, Mn, Ca, Al, Mg, K, and Na—was found in both samples at lower levels. Since the C content is higher and the element composition is relative, some of the trace metals are observed to be in lower concentrations in the biochar samples. Furthermore, the XRD results show the presence of calcite in both samples (Figure 5).
The metal results from the acid-digested samples show that, as the temperature increased, the overall metal concentrations were also enhanced (Table 4). For all samples, the obtained values were below the threshold limits specified by ISO standards [26]. However, to check the applicability of the biosolid and biochar samples for water treatment, the fractionization of the samples into the four fractions based on the BCR method (Section 2.3) and associated risk analysis (Section 2.4) in addition to leaching studies using the TCLP procedure is required (Section 2.5).
3.2. Fractionization of BS Samples
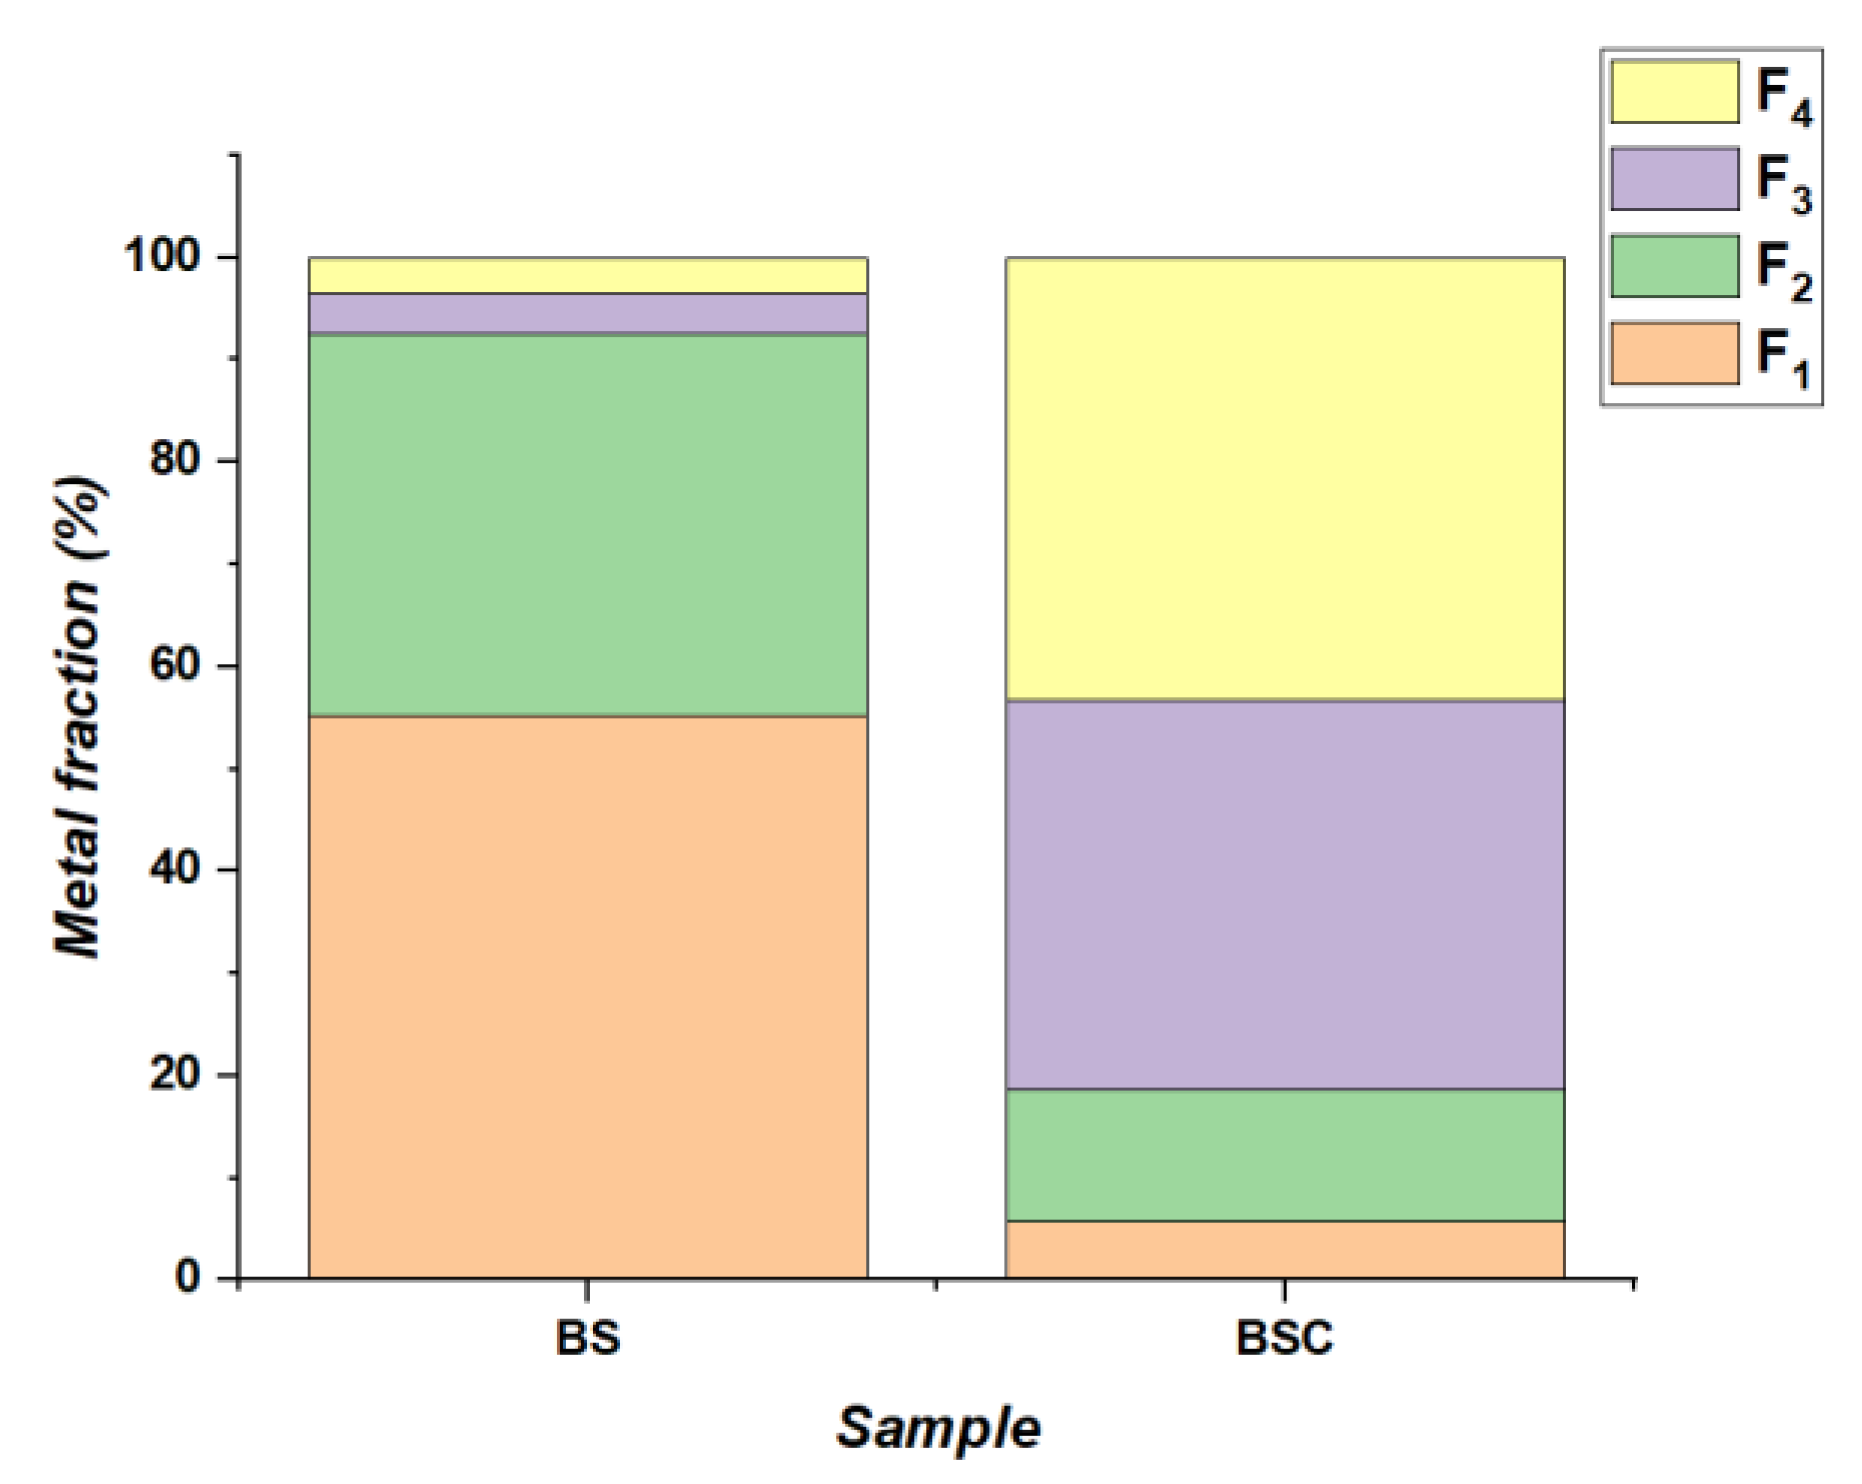
The BCR procedure generated results comparable to the acid-digested samples (Table 5), revealing a standard deviation of ≈4 and 6 for the BS and BS char, respectively. However, the reduced metal measurement in both cases can be attributed to the inevitable loss of samples, while following the four-step BCR procedure. As for the fractionization and extraction results, the metal content increased in the order F1 > F2 > F3 ≈ F4 for BS and F4 > F3 > F2 > F1 for the char sample (Figure 6). Positively, the active, bioavailable fractions (F1: exchangeable, F2: reducible, and F3: oxidizable fractions) were much lower in the char sample compared to the raw material, proving there is reduced toxicity after pyrolysis. Furthermore, although the total metal content is higher in the pyrolyzed sample, it is evident from the measured fractions in the four metal contents—in the residual fraction—that the majority of the metal has been stabilized in the biochar samples and is still present in the sample even after the three prior extraction steps. Therefore, it has been confirmed that the increased temperature has stabilized the metal content present in the raw materials.
3.3. Risk Analysis Studies
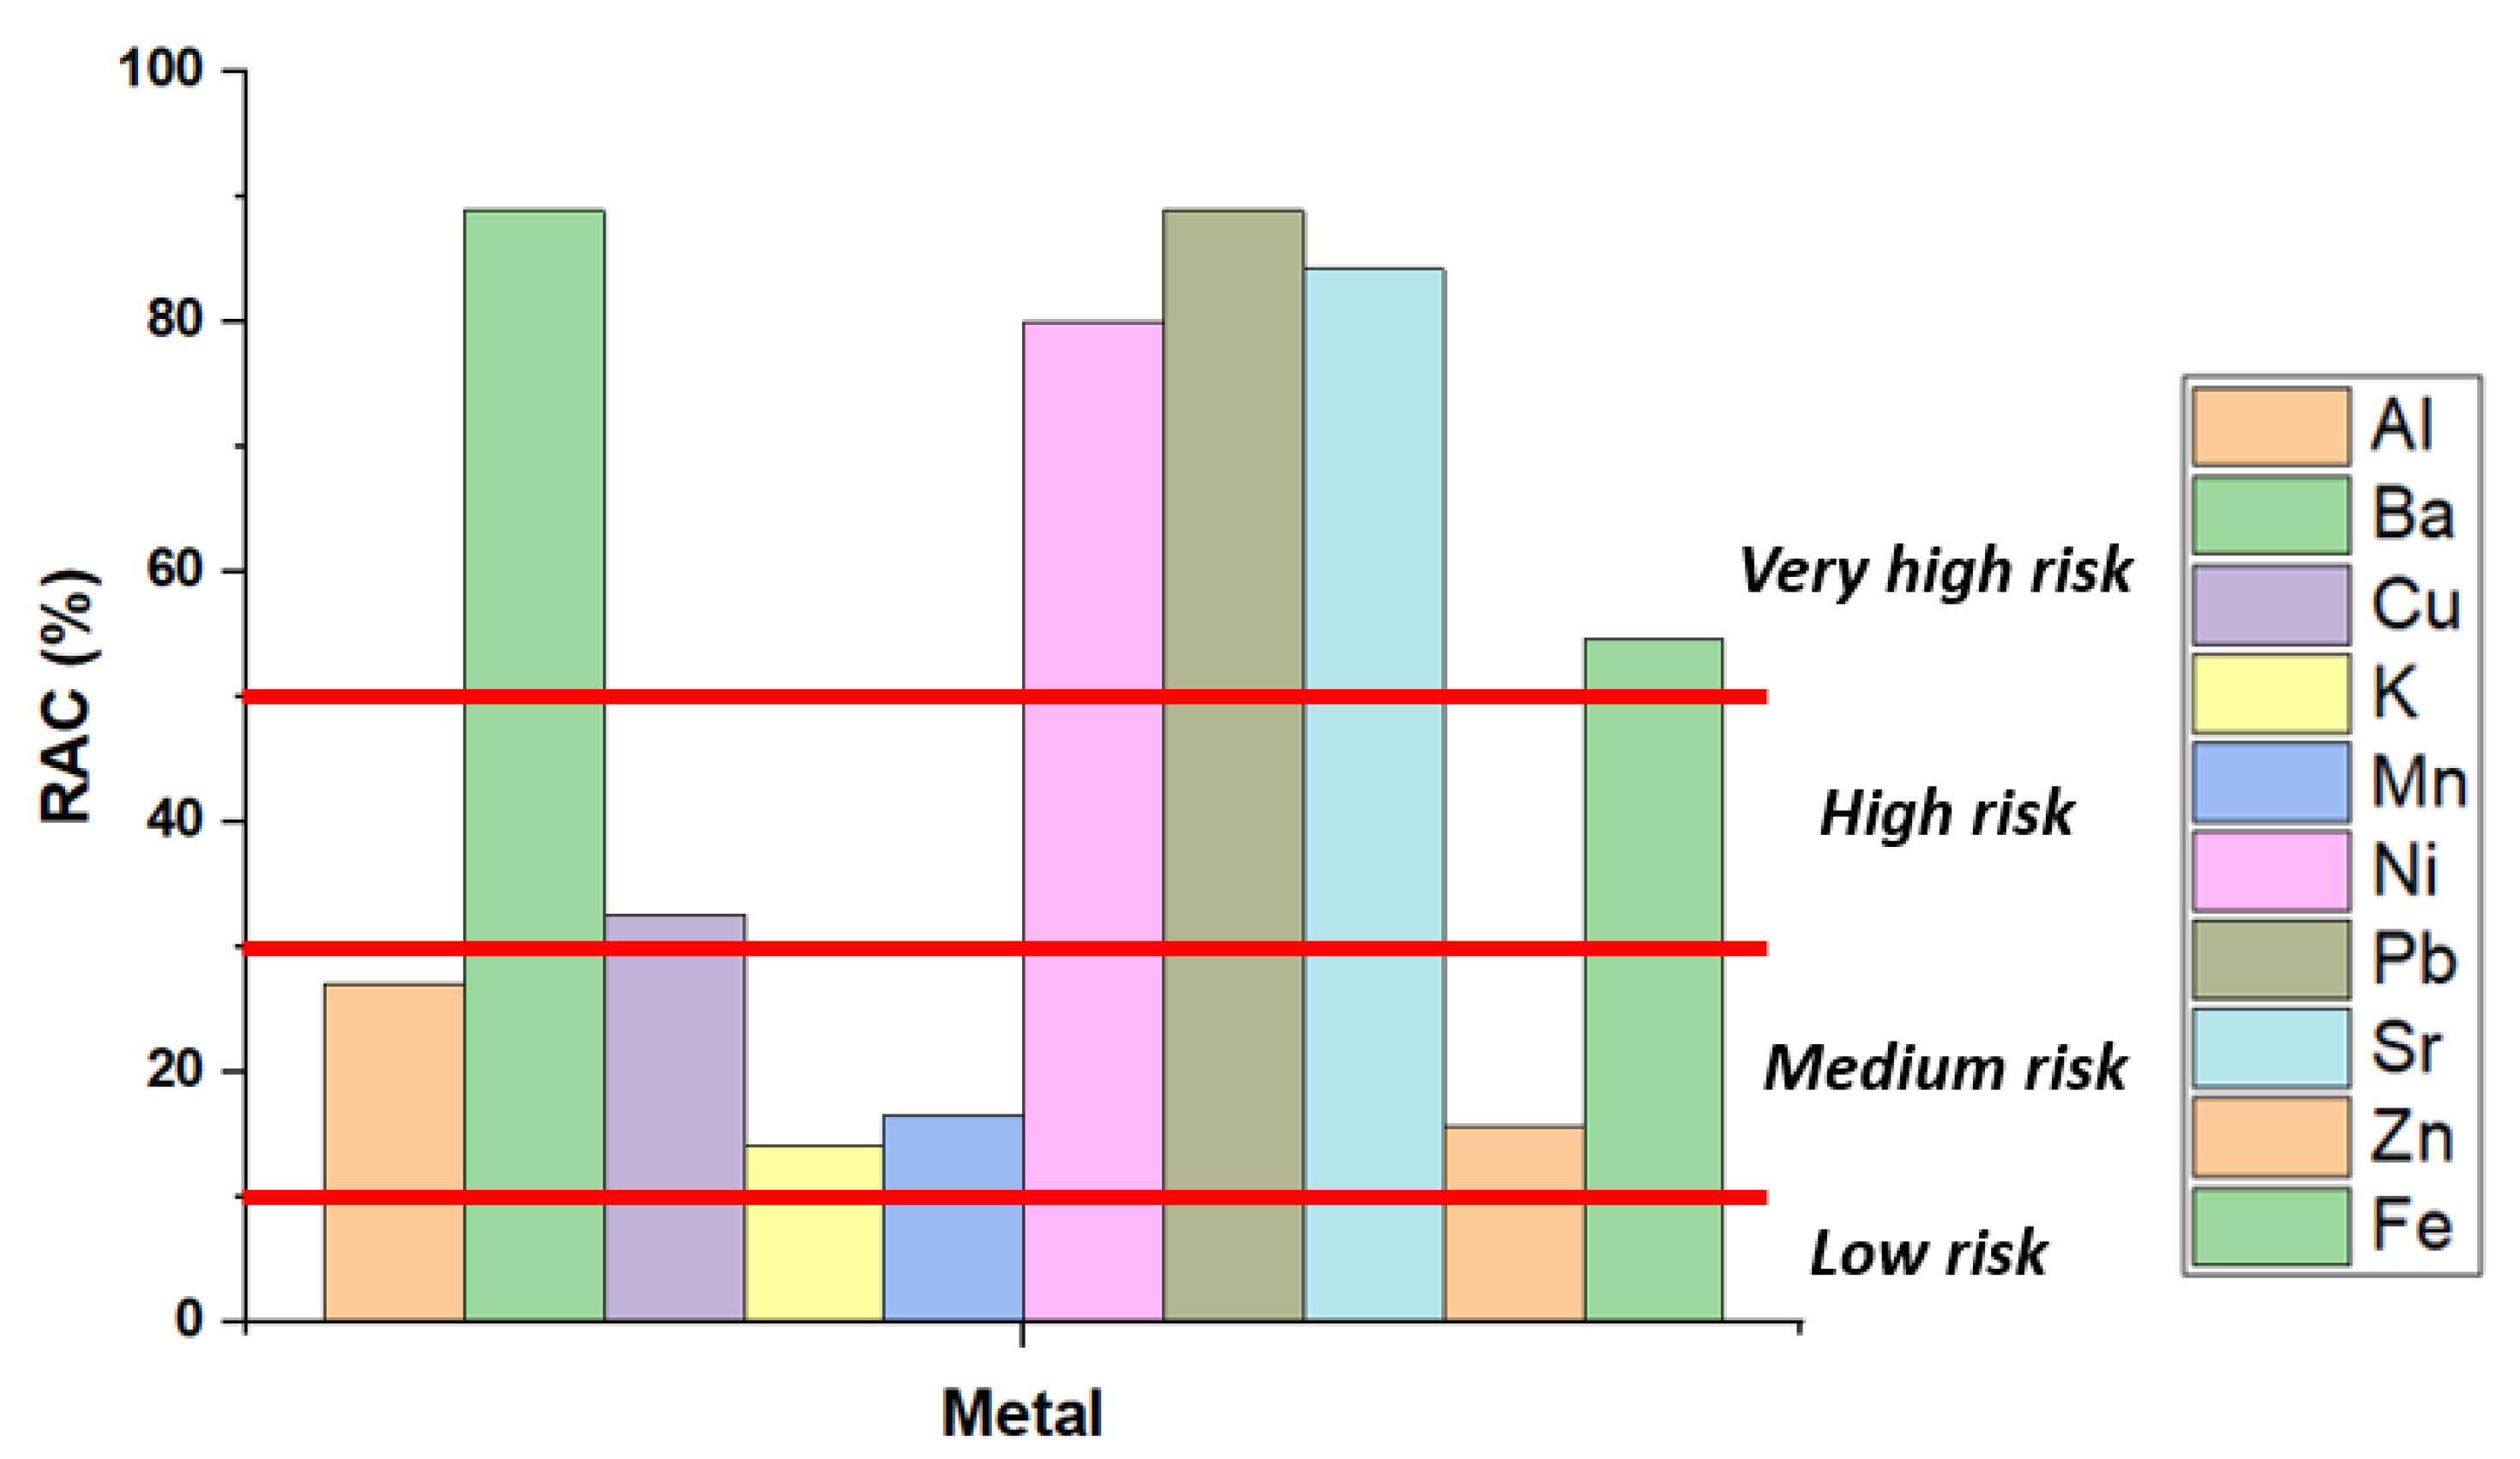
Two risk analysis studies have been assessed in order to understand the potential risk of the BS and BS sample: an RAC (risk assessment content) and an ecological risk index conducted using the equations in Section 2.4 and their limits in Table 1. Overall, the char samples had a lower risk based on the metal fractions than the BS sample. RAC analysis showed that the environmental risk of the metals reduced from ‘very high risk’ (RAC: 55) to ‘medium risk’ (RAC: 9) for the BS and BS char samples, respectively, for the overall metal content. Individual metal content RAC calculations showed that the metals were in the range of medium risk (Al, K, Mn, Zn) to very high risk (Ba, Ni, Pb, Sr, Fe As, Cr, Cd, Co, Mo, Se) for the BS sample. Furthermore, As, Cr, Cd, Co, Mo, Ca, and Se were all extracted in the first fraction showing high mobility and toxicity (RAC:100, very high risk) of these metals in the BS sample (Figure 7). On the other hand, after pyrolysis, the BS char had RAC values lower than 1 or below 10—showing no risk or low risk, respectively, for all the metals (Table S1). This indicates that pyrolyzing BS effectively decreases that risk; therefore, the char can be utilized for further water treatment applications.
The second type of risk analysis, PERI, is based on the concentrations of zinc, manganese, chromium, copper, nickel, and lead for both samples, indicating similar results. For both cases, the sum of Eri, which is the potential risk of an individual metal, showed low ecological risk. The overall potential ecological risk index (PERI) revealed considerable (PERI: 129.05) and low risk (PERI: 4.83) for BS and BS char samples respectively, proving that the latter will not affect the ecology negatively.
The result from this study reveals less risk than some reported literature on risk assessment of sludge samples. One study focusing on sewage sludge composts showed a high risk for nickel and a medium for copper and lead following the RAC index [27]. A similar risk assessment study on sewage sludge concluded high mobile fractions with high risk for Ni, Cu, Zn, Cd, Cr, Co, Sr, Ca, Mn, Mo, Re, and W [28]. Furthermore, another study calculated risk using PERI index showed a high risk for cadmium and a moderate risk for zinc for sludge samples [29]; a similar conclusion was made by another study on heavy metal risk analysis in sewage sludge from a wastewater treatment plant in Poland as well [30].
3.4. Leaching Studies
Further leaching studies on this char sample were carried out to understand its actual applicability in water treatment. Table S2 reveals the TCLP leaching experiment results showed that only copper, potassium, zinc, and iron leached into the water in the order Cu < K < Fe < Zn. It was also observed that the char samples, although having higher concentrations of metals than the raw material, had immobilized metals due to the high pyrolysis temperature, and therefore metal leaching was much lower from the char. This conclusion is consistent with leaching studies on manure and sludge samples [31,32,33] due to the immobilization of metals. Furthermore, positively, the leaching tests confirm that the char sample is in the range of the standard set by the (US) EPA as the leached zinc and copper concentration is less than 5 µg/mg; however, there are no limits set for Fe and K set by the organization for comparison [31]. The fractionization, risk analysis, and leaching studies show that for water treatment, these samples can be considered safer than some other sludge samples reported in the literature [31,34].
4. Conclusions
This study concluded that biosolid from the GTL wastewater treatment plant could best be applied for water treatment, soil, or agricultural purposes after pyrolysis. Characterization showed an increased carbon content and reduced oxygen content in the biochar sample. Additionally, the presence of calcium, magnesium, and iron was detected in smaller quantities in both samples. The biochar metal fractionization results showed F4 (residual) > F3 (oxidizable) > F2 (reducible) > F1 (exchangeables), which was the opposite of the biosolid raw material in the order F1 > F2 > F3 > F4, showing more stable fractions in the pyrolyzed sample. The RAC and PERI indices show that the pyrolyzed BS has a ‘low risk’, much reduced compared to the BS sample, this is further confirmed by the leaching studies that displayed minimal leaching from the pyrolyzed sample. Future studies will include understanding the risks of organic contaminants in biosolids.
Supplementary Materials
The following supporting information can be downloaded at: https://www.mdpi.com/article/10.3390/w14244016/s1, Figure S1: (a) BS (b) BSC; Table S1: RAC calculations of the metals in BS and BSC samples; Table S2: Metal content in the samples and leachate in mg/g.
Author Contributions
Conceptualization, methodology, formal analysis, writing—S.Z.; Methodology, investigation, visualization—S.P.; Characterization of samples—M.P.; Supervision, reviewing, and editing—G.M. All authors have read and agreed to the published version of the manuscript.
Funding
This research was funded by Qatar National Research Fund (NPRP11S-0117-180328) and Hamad Bin Khalifa University.
Data Availability Statement
Research data not available in the manuscript can be obtained from the corresponding author through email.
Acknowledgments
The authors would like to acknowledge the financial support provided by Qatar National Research Fund and Hamad Bin Khalifa University. A special appreciation is expressed to Qatar Shell Research and Technology Center—Qatar for the collaboration and for providing the biosolid samples. Additional thanks to Qatar Environment and Energy Research Institute for conducting the XRD and SEM analysis. Any opinions, findings, and conclusions, or recommendations expressed in this material are those of the authors and do not necessarily reflect the views of any of the parties. Finally, the authors would also like to express thanks to Qatar National Library for access to articles.
Conflicts of Interest
The authors have no competing interest to declare that are relevant to the content of this article.
Abbreviation
| American Society for Testing and Materials | ASTM |
| Community Bureau of Reference | BCR |
| Brunauer–Emmett–Teller | BET |
| Biosolid | BS |
| Biosolid biochar | BSC |
| Gas-to-Liquids | GTL |
| Scanning electron microscopy (SEM) and energy dispersive X-ray spectroscopy (EDS) | SEM-EDS |
| Toxicity Characteristic Leaching Procedure | TCLP |
| X-ray diffractometer | XRD |
References
- Mariyam, S.; Shahbaz, M.; Al-Ansari, T.; Mackey, H.R.; McKay, G. A Critical Review on Co-Gasification and Co-Pyrolysis for Gas Production. Renew. Sustain. Energy Rev. 2022, 161, 112349. [Google Scholar] [CrossRef]
- Zuhara, S.; Mackey, H.R.; Al-Ansari, T.; McKay, G. A Review of Prospects and Current Scenarios of Biomass Co-Pyrolysis for Water Treatment. Biomass Convers. Biorefin. 2022. [Google Scholar] [CrossRef]
- Ghodke, P.K.; Sharma, A.K.; Pandey, J.K.; Chen, W.H.; Patel, A.; Ashokkumar, V. Pyrolysis of Sewage Sludge for Sustainable Biofuels and Value-Added Biochar Production. J. Environ. Manag. 2021, 298, 113450. [Google Scholar] [CrossRef] [PubMed]
- Papari, S.; Bamdad, H.; Berruti, F. Pyrolytic Conversion of Plastic Waste to Value-Added Products and Fuels: A Review. Materials 2021, 14, 2586. [Google Scholar] [CrossRef] [PubMed]
- Batista Meneses, D.; Montes de Oca-Vásquez, G.; Vega-Baudrit, J.R.; Rojas-Álvarez, M.; Corrales-Castillo, J.; Murillo-Araya, L.C. Pretreatment Methods of Lignocellulosic Wastes into Value-Added Products: Recent Advances and Possibilities. Biomass Convers. Biorefin. 2022, 12, 547–564. [Google Scholar] [CrossRef]
- Wadhwa, M.; Bakshi, M.P.S.; Makkar, H.P.S. Wastes to Worth: Value Added Products from Fruit and Vegetable Wastes. CAB Rev. Perspect. Agric. Vet. Sci. Nutr. Nat. Resour. 2015, 10. [Google Scholar] [CrossRef]
- Subramanian, K.; Sarkar, M.K.; Wang, H.; Qin, Z.H.; Chopra, S.S.; Jin, M.; Kumar, V.; Chen, C.; Tsang, C.W.; Lin, C.S.K. An Overview of Cotton and Polyester, and Their Blended Waste Textile Valorisation to Value-Added Products: A Circular Economy Approach–Research Trends, Opportunities and Challenges. Crit. Rev. Environ. Sci. Technol. 2022, 52, 3921–3942. [Google Scholar] [CrossRef]
- Elkhalifa, S.; Mackey, H.R.; Al-Ansari, T.; McKay, G. Pyrolysis of Biosolids to Produce Biochars: A Review. Sustainability 2022, 14, 9626. [Google Scholar] [CrossRef]
- Hurynovich, A.; Kwietniewski, M.; Romanovski, V. Evaluation of the Possibility of Utilization of Sewage Sludge from a Wastewater Treatment Plant—Case Study. Desalin. Water Treat. 2021, 227, 16–25. [Google Scholar] [CrossRef]
- Ahmad, T.; Ahmad, K.; Alam, M. Sustainable Management of Water Treatment Sludge through 3′R’ Concept. J. Clean. Prod. 2016, 124, 1–13. [Google Scholar] [CrossRef]
- Lin, L.; Xu, X.; Papelis, C.; Cath, T.Y.; Xu, P. Sorption of Metals and Metalloids from Reverse Osmosis Concentrate on Drinking Water Treatment Solids. Sep. Purif. Technol. 2014, 134, 37–45. [Google Scholar] [CrossRef]
- Kogbara, R.B.; Yiming, W.; Iyengar, S.R.; Onwusogh, U.C.; Youssef, K.; Al-Ansary, M.; Sunifar, P.A.; Arora, D.; Al-Sharshani, A.; Abdalla, O.A.E.; et al. Recycling Industrial Biosludge for Buffel Grass Production in Qatar: Impact on Soil, Leachate and Plant Characteristics. Chemosphere 2020, 247, 125886. [Google Scholar] [CrossRef]
- Hosseini Koupaie, E.; Eskicioglu, C. Health Risk Assessment of Heavy Metals through the Consumption of Food Crops Fertilized by Biosolids: A Probabilistic-Based Analysis. J. Hazard. Mater. 2015, 300, 855–865. [Google Scholar] [CrossRef] [PubMed]
- Wang, Z.; Flury, M. Effects of Freezing–Thawing and Wetting–Drying on Heavy Metal Leaching from Biosolids. Water Environ. Res. 2019, 91, 465–474. [Google Scholar] [CrossRef] [PubMed]
- Christensen, T.; Nielsen, C. Leaching from Land Disposed Municipal Composts: 1. Organic Matter. Waste Manag. Res. 1983, 1, 83–94. [Google Scholar] [CrossRef]
- Yang, Y.; He, Z.; Stoffella, P.J.; Banks, D.J.; Yang, Y.; He, Z.; Graetz, D.A.; Yang, X. Leaching Behavior of Heavy Metals In Biosolids Amended Sandy Soils. Compost Sci. Util. 2008, 16, 144–151. [Google Scholar] [CrossRef]
- Brown, S.; Beecher, N.; Carpenter, A. Calculator Tool for Determining Greenhouse Gas Emissions for Biosolids Processing and End Use. Environ. Sci. Technol. 2010, 44, 9509–9515. [Google Scholar] [CrossRef]
- Kanteraki, A.E.; Isari, E.A.; Svarnas, P.; Kalavrouziotis, I.K. Biosolids: The Trojan Horse or the Beautiful Helen for Soil Fertilization? Sci. Total Environ. 2022, 839, 156270. [Google Scholar] [CrossRef]
- Hossain, M.Z.; Bahar, M.M.; Sarkar, B.; Donne, S.W.; Wade, P.; Bolan, N. Assessment of the Fertilizer Potential of Biochars Produced from Slow Pyrolysis of Biosolid and Animal Manures. J. Anal. Appl. Pyrolysis 2021, 155, 105043. [Google Scholar] [CrossRef]
- He, Y.D.; Zhai, Y.B.; Li, C.T.; Yang, F.; Chen, L.; Fan, X.P.; Peng, W.F.; Fu, Z.M. The Fate of Cu, Zn, Pb and Cd during the Pyrolysis of Sewage Sludge at Different Temperatures. Environ. Technol. 2010, 31, 567–574. [Google Scholar] [CrossRef]
- Liu, X.; Wang, Y.; Gui, C.; Li, P.; Zhang, J.; Zhong, H.; Wei, Y. Chemical Forms and Risk Assessment of Heavy Metals in Sludge-Biochar Produced by Microwave-Induced Low Temperature Pyrolysis. RSC Adv. 2016, 6, 101960–101967. [Google Scholar] [CrossRef]
- Tang, J.; Tang, H.; Sima, W.; Wang, H.; Zou, D.; Qiu, B.; Qu, J.; Liang, R.; Dong, J.; Liao, Y.; et al. Heavy Metal Pollution Level and Potential Ecological Risk Assessment of Sludge Landfill. Environ. Prog. Sustain. Energy 2022, 41, 1–10. [Google Scholar] [CrossRef]
- Ukwatta, A.; Mohajerani, A. Leachate Analysis of Green and Fired-Clay Bricks Incorporated with Biosolids. Waste Manag. 2017, 66, 134–144. [Google Scholar] [CrossRef] [PubMed]
- Nuagah, M.B.; Boakye, P.; Oduro-Kwarteng, S.; Sokama-Neuyam, Y.A. Valorization of Faecal and Sewage Sludge via Pyrolysis for Application as Crop Organic Fertilizer. J. Anal. Appl. Pyrolysis 2020, 151, 104903. [Google Scholar] [CrossRef]
- Bolognesi, S.; Bernardi, G.; Callegari, A.; Dondi, D.; Capodaglio, A.G. Biochar Production from Sewage Sludge and Microalgae Mixtures: Properties, Sustainability and Possible Role in Circular Economy. Biomass Convers. Biorefin. 2021, 11, 289–299. [Google Scholar] [CrossRef]
- Phoungthong, K.; Zhang, H.; Shao, L.M.; He, P.J. Leaching Characteristics and Phytotoxic Effects of Sewage Sludge Biochar. J. Mater. Cycles Waste Manag. 2018, 20, 2089–2099. [Google Scholar] [CrossRef]
- Gusiatin, Z.M.; Kulikowska, D. The Usability of the IR, RAC and MRI Indices of Heavy Metal Distribution to Assess the Environmental Quality of Sewage Sludge Composts. Waste Manag. 2014, 34, 1227–1236. [Google Scholar] [CrossRef]
- Nkinahamira, F.; Suanon, F.; Chi, Q.; Li, Y.; Feng, M.; Huang, X.; Yu, C.P.; Sun, Q. Occurrence, Geochemical Fractionation, and Environmental Risk Assessment of Major and Trace Elements in Sewage Sludge. J. Environ. Manage. 2019, 249, 109427. [Google Scholar] [CrossRef]
- Latosińska, J.; Kowalik, R.; Gawdzik, J. Risk Assessment of Soil Contamination with Heavy Metals from Municipal Sewage Sludge. Appl. Sci. 2021, 11, 548. [Google Scholar] [CrossRef]
- Kowalik, R.; Latosińska, J.; Gawdzik, J. Risk Analysis of Heavy Metal Accumulation from Sewage Sludge of Selected Wastewater Treatment Plants in Poland. Water 2021, 13, 2070. [Google Scholar] [CrossRef]
- Zhang, P.; Zhang, X.; Li, Y.; Han, L. Influence of Pyrolysis Temperature on Chemical Speciation, Leaching Ability, and Environmental Risk of Heavy Metals in Biochar Derived from Cow Manure. Bioresour. Technol. 2020, 302, 122850. [Google Scholar] [CrossRef]
- Wang, A.; Zou, D.; Zeng, X.; Chen, B.; Zheng, X.; Li, L.; Zhang, L.; Xiao, Z.; Wang, H. Speciation and Environmental Risk of Heavy Metals in Biochars Produced by Pyrolysis of Chicken Manure and Water-Washed Swine Manure. Sci. Rep. 2021, 11, 1–14. [Google Scholar] [CrossRef] [PubMed]
- Zhang, X.; Zhao, B.; Liu, H.; Zhao, Y.; Li, L. Effects of Pyrolysis Temperature on Biochar’s Characteristics and Speciation and Environmental Risks of Heavy Metals in Sewage Sludge Biochars. Environ. Technol. Innov. 2022, 26, 102288. [Google Scholar] [CrossRef]
- Chanaka, C.U.; Veksha, A.; Giannis, A.; Liang, Y.N.; Lisak, G.; Hu, X.; Lim, T.T. Insights into the Speciation of Heavy Metals during Pyrolysis of Industrial Sludge. Sci. Total Environ. 2019, 691, 232–242. [Google Scholar] [CrossRef]
Figure 1.
BCR sequential procedure for fractionization of metals.

Figure 2.
TCLP leaching procedure steps.

Figure 3.
SEM imaging results. (a) Biosolid (BS); (b) Biosolid char (BSC).

Figure 4.
EDS results of Biosolid (BS) and Biosolid biochar (BSC).

Figure 5.
XRD results of Biosolid (BS) and Biosolid biochar (BSC).

Figure 6.
Fractions of metals in biosolid (BS) and biosolid char (BSC) samples.

Figure 7.
RAC index comparison of metals in the BS sample.


Table 1.
Ecological risk level using the PERI method.
| Risk Analysis | Range | Level |
|---|---|---|
| Risk Assessment Code (RAC) [21] | Less than 1% | No risk (NR) |
| 1–10% | Low risk | |
| 11–30% | Medium risk | |
| 31–50% | High risk | |
| >50% | Very high risk | |
| The potential risk of individual heavy metal, [22] | <40 | Low risk |
| 40 ≤ Er < 80 | Moderate risk | |
| 80 ≤ Er < 160 | Considerable | |
| 160 ≤ Er < 320 | High potential | |
| Er ≥ 320 | Very high | |
| Sum of the potential risk of individual heavy metal, PERI [22] | <150 | Low risk |
| 150 ≤ RI < 300 | Moderate risk | |
| 300 ≤ RI < 600 | Considerable | |
| RI > 600 | Very high |
Table 2.
Characteristic of BS and BS char samples.
| Sample | pH | Surface Area (m2/g) | Pore Volume (cm3/g) | Calorific Value (MJ/kg) | Surface Charge (mV) | Yield (%) |
|---|---|---|---|---|---|---|
| BS | 8.42 | 0.0100 | 0.0210 | 19.4 | −29.5 | N/A |
| BSC | 9.23 | 0.0185 | 0.0137 | 21.4 | −25.3 | ≈45 |
| Proximate analysis (% w/w) | ||||||
| Sample | Moisture | Volatile matter | Ash | Fixed carbon | ||
| BS | 12.29 | 47.47 | 26.07 | 14.16 | ||
| BSC | 4.82 | 15.75 | 37.57 | 41.86 | ||
| Ultimate analysis (% w/w) | ||||||
| Sample | C | H | O | N | S | |
| BS | 33.69 | 6.18 | 29.03 | 5.03 | - | |
| BSC | 43.87 | 2.90 | 4.07 | 5.16 | 6.43 | |
Table 3.
EDS microanalysis of Biosolid (BS) and Biosolid biochar (BSC) samples.
| Sample | BS | BSC | ||
|---|---|---|---|---|
| Element | Mass (%) | Atom (%) | Mass (%) | Atom (%) |
| Carbon | 40.3 | 53.0 | 58.2 | 68.2 |
| Nitrogen | 5.60 | 6.31 | 8.64 | 8.68 |
| Oxygen | 33.0 | 32.5 | 21.4 | 18.8 |
| Sodium | 0.280 | 0.200 | 0.920 | 0.570 |
| Magnesium | 0.140 | 0.0900 | 0.170 | 0.100 |
| Aluminum | 0.160 | 0.0900 | 0.190 | 0.100 |
| Silicon | 1.66 | 0.850 | 0.0500 | 0.0200 |
| Phosphorous | 1.58 | 0.780 | 1.49 | 0.680 |
| Sulfur | 0.120 | 0.0500 | 1.45 | 0.640 |
| Chlorine | 0.230 | 0.0900 | 0.110 | 0.0500 |
| Potassium | 10.1 | 3.98 | 0.470 | 0.170 |
| Calcium | 0.270 | 0.0800 | 2.56 | 0.900 |
| Iron | 6.53 | 1.85 | 4.29 | 1.08 |
Table 4.
Metal analysis of BS and BSC samples using the acid-digested method.
| Sample | Metal Concentration (mg/g) | ||||||||||||
|---|---|---|---|---|---|---|---|---|---|---|---|---|---|
| Al | Ba | Co | Cr | Cu | K | Mn | Ni | Pb | Sr | Ca | Zn | Fe | |
| BS | 0.410 | 0.0100 | 0.0500 | 0.0300 | 0.0200 | 0.160 | 0.740 | 0.0300 | 0.0100 | 0.0300 | 0.540 | 0.580 | 46.2 |
| BSC | 0.460 | 0.0100 | 0.0600 | 0.0500 | 0.0400 | 0.200 | 0.930 | 0.0400 | 0.0200 | 0.0400 | 0.610 | 0.770 | 52.5 |
Table 5.
Comparison of total metal content in BS and BSC samples.
| Sample | Acid Digested (mg/g) | BCR (mg/g) | Standard Deviation |
|---|---|---|---|
| BS | 48.8 | 43.7 | 3.58 |
| BSC | 55.7 | 47.4 | 5.85 |
Publisher’s Note: MDPI stays neutral with regard to jurisdictional claims in published maps and institutional affiliations. |
© 2022 by the authors. Licensee MDPI, Basel, Switzerland. This article is an open access article distributed under the terms and conditions of the Creative Commons Attribution (CC BY) license (https://creativecommons.org/licenses/by/4.0/).
Share and Cite
MDPI and ACS Style
Zuhara, S.; Pradhan, S.; Pasha, M.; McKay, G. Potential of GTL-Derived Biosolids for Water Treatment: Fractionization, Leachate, and Environmental Risk Analysis. Water 2022, 14, 4016. https://doi.org/10.3390/w14244016
AMA Style
Zuhara S, Pradhan S, Pasha M, McKay G. Potential of GTL-Derived Biosolids for Water Treatment: Fractionization, Leachate, and Environmental Risk Analysis. Water. 2022; 14(24):4016. https://doi.org/10.3390/w14244016
Chicago/Turabian StyleZuhara, Shifa, Snigdhendubala Pradhan, Mujaheed Pasha, and Gordon McKay. 2022. "Potential of GTL-Derived Biosolids for Water Treatment: Fractionization, Leachate, and Environmental Risk Analysis" Water 14, no. 24: 4016. https://doi.org/10.3390/w14244016
Note that from the first issue of 2016, this journal uses article numbers instead of page numbers. See further details here.