
Coagulation and Flocculation Optimization Process Applied to the Sidestream of an Urban Wastewater Treatment Plant

1
Chemical Engineering Department, Escola d’Enginyeria de Barcelona Est (EEBE), Universitat Politècnica de Catalunya (UPC)-BarcelonaTECH, C/Eduard Maristany 10-14, Campus Diagonal-Besòs, 08930 Barcelona, Spain
2
Barcelona Research Center for Multiscale Science and Engineering, Campus Diagonal-Besòs, 08930 Barcelona, Spain
3
Research Center in Technologies, Energy and Industrial Processes (CINTECX), Chemical Engineering Department, Campus As Lagoas-Marcosende, University of Vigo, 36310 Vigo, Spain
4
Water Technology Centre (CETaqua), Carretera d’Esplugues, 75, 08940 Cornellà de Llobregat, Spain
*
Author to whom correspondence should be addressed.
Water 2022, 14(24), 4024; https://doi.org/10.3390/w14244024
Submission received: 4 November 2022
/
Revised: 30 November 2022
/
Accepted: 7 December 2022
/
Published: 9 December 2022
(This article belongs to the Special Issue Valorization of Liquid Streams or Byproducts from Wastewater Treatments as High-Added-Value Products for a Resource Recovery Model)
Abstract
:Ammonium (NH4+) recirculation from the streams generated in the dehydration stage of the sludge generated in the anaerobic digestion of urban wastewater treatment plants (WWTPs), known as centrate or sidestream, produces a reduction in the efficiency of WWTPs. Given this scenario and the formulation that a WWTP should be considered a by-product generating facility (biofactory), solutions for ammonia/ammonium recovery are being promoted. These include a nitrogen source that reduces the need for ammonia production through the Haber–Bosch process. Therefore, the recovery of nutrients from urban cycles is a potential and promising line of research. In the case of nitrogen, this has been aimed at recovering NH4+ to produce high-quality fertilizers through membrane or ion exchange processes. However, these techniques usually require a pretreatment, which could include an ultrafiltration stage, to eliminate suspended solids and organic matter. In this case, the coagulation/flocculation (C/F) process is an economical alternative for this purpose. In this work, the sidestream from Vilanova i la Geltrú WWTP (Barcelona, Spain) was characterized to optimize a C/F process before being treated by other processes for ammonium recovery. The optimization was performed considering a bibliographic and experimental analysis of several operating parameters: coagulant and flocculant agents, mixing velocity, and operation time, among others. Then, the removal efficiency of control parameters such as turbidity, chemical oxygen demand (COD), and total suspended solids (TSS) was calculated. This optimization resulted in the use of 25 mg/L of ferric chloride (FeCl3) combined with 25 mg/L of a flocculant composed of silicon (SiO2 3%), aluminum (Al2SO4 64.5%), and iron salts (Fe2O3 32.5%), into a 1 min rapid mixing process at 200 rpm and a slow mixing for 30 min at 30 rpm, followed by a final 30 min settling process. The numerical and statistical results of the process optimization reached 91.5%, 59.1%, and 95.2% removal efficiency for turbidity, COD, and TSS, respectively. These efficiencies theoretically support the enhanced coagulation/flocculation process as a pretreatment for a higher NH4+ recovery rate, achieving 570.6 mgNH4+/L, and a reduction in the dimensioning or substitution of other membrane processes process due to its high TSS removal value.
1. Introduction
In wastewater treatment plants (WWTPs), sidestreams are generated from the solid–liquid separation process of the undigested sludge after its anaerobic digestion stage, usually using centrifugation or dehydration stages [1,2]. This liquid phase returns to the mainstream to reduce the sludge system volume and continuously treat the nutrient excess in the WWTPs [3,4].
This sidestream possesses high nutrient concentration values, such as ammonium as nitrogen up to 1.5 g N-NH4+/L and phosphate as phosphorous up to 0.3 g P-PO43−/L, which returns to the WWTP’s mainstream, creating an increase in these elements in the biological treatment load [3,5,6]. This solution represents an increase in the energy costs of the aeration stage of the activated sludge reactor, which means 75% of the electricity consumption of the whole treatment.
Currently, two solutions, with more significant implementation, have proposed: (i) installing a stage of biological elimination via conversion to N2(g) through the Cannon or Anammox processes [7] and (ii) a partial elimination through the installation of a crystallizer to recover the phosphorous present in these streams via the formation of struvite (MgNH4PO4(s)) [8,9,10,11]. While in the first case, more than 95% of ammonium can be eliminated, in the second case, only 15% of this compound present in the sidestream can be recovered.
In response to this and considering a WWTP as a by-product generating facility, biofactory or biorefinery, different solutions are being promoted for ammonia recovery as a nitrogen source [12,13,14]. Indeed, ammonia recovery from a WWTP to produce liquid fertilizers has been recently studied by several authors through the development of extraction, separation, and concentration processes integrating ion exchange and membrane contactors technologies [15,16,17,18].
As reported elsewhere, ammonium recovery by these processes requires a pretreatment stage, which usually includes an ultrafiltration (UF) process [19,20,21] to remove suspended solids and organic matter. Thus, the coagulation/flocculation process (C/F) could be an economical alternative for this purpose [22,23,24].
A bibliographic review of different coagulant and flocculant reagents was carried out to select the list of reagents that would be evaluated in the next stage of this study.
Among the different coagulants used for wastewater (WW) treatment (municipal or industrial), the following materials, shown in Table 1, were found in the literature.
These studies require specific operational parameters shown in Table 2. These parameters are rapid mix time (RMT), rapid mix speed (RMS), slow mix time (SMT), slow mix speed (SMS), settling time (ST), and WW’s initial pH.
As shown in Table 1, some studies have reported the efficiency of the C/F process in removing organic matter, TSS, and turbidity. These works studied the type of coagulant, flocculant, and the operating parameters of this process (mixing and time speed).
All these parameters shown in Table 2 were considered operational parameters for the experimental process, except for pH, which was considered an indirect parameter to determine if the reagents used in this study affect the C/F process removal efficiency.
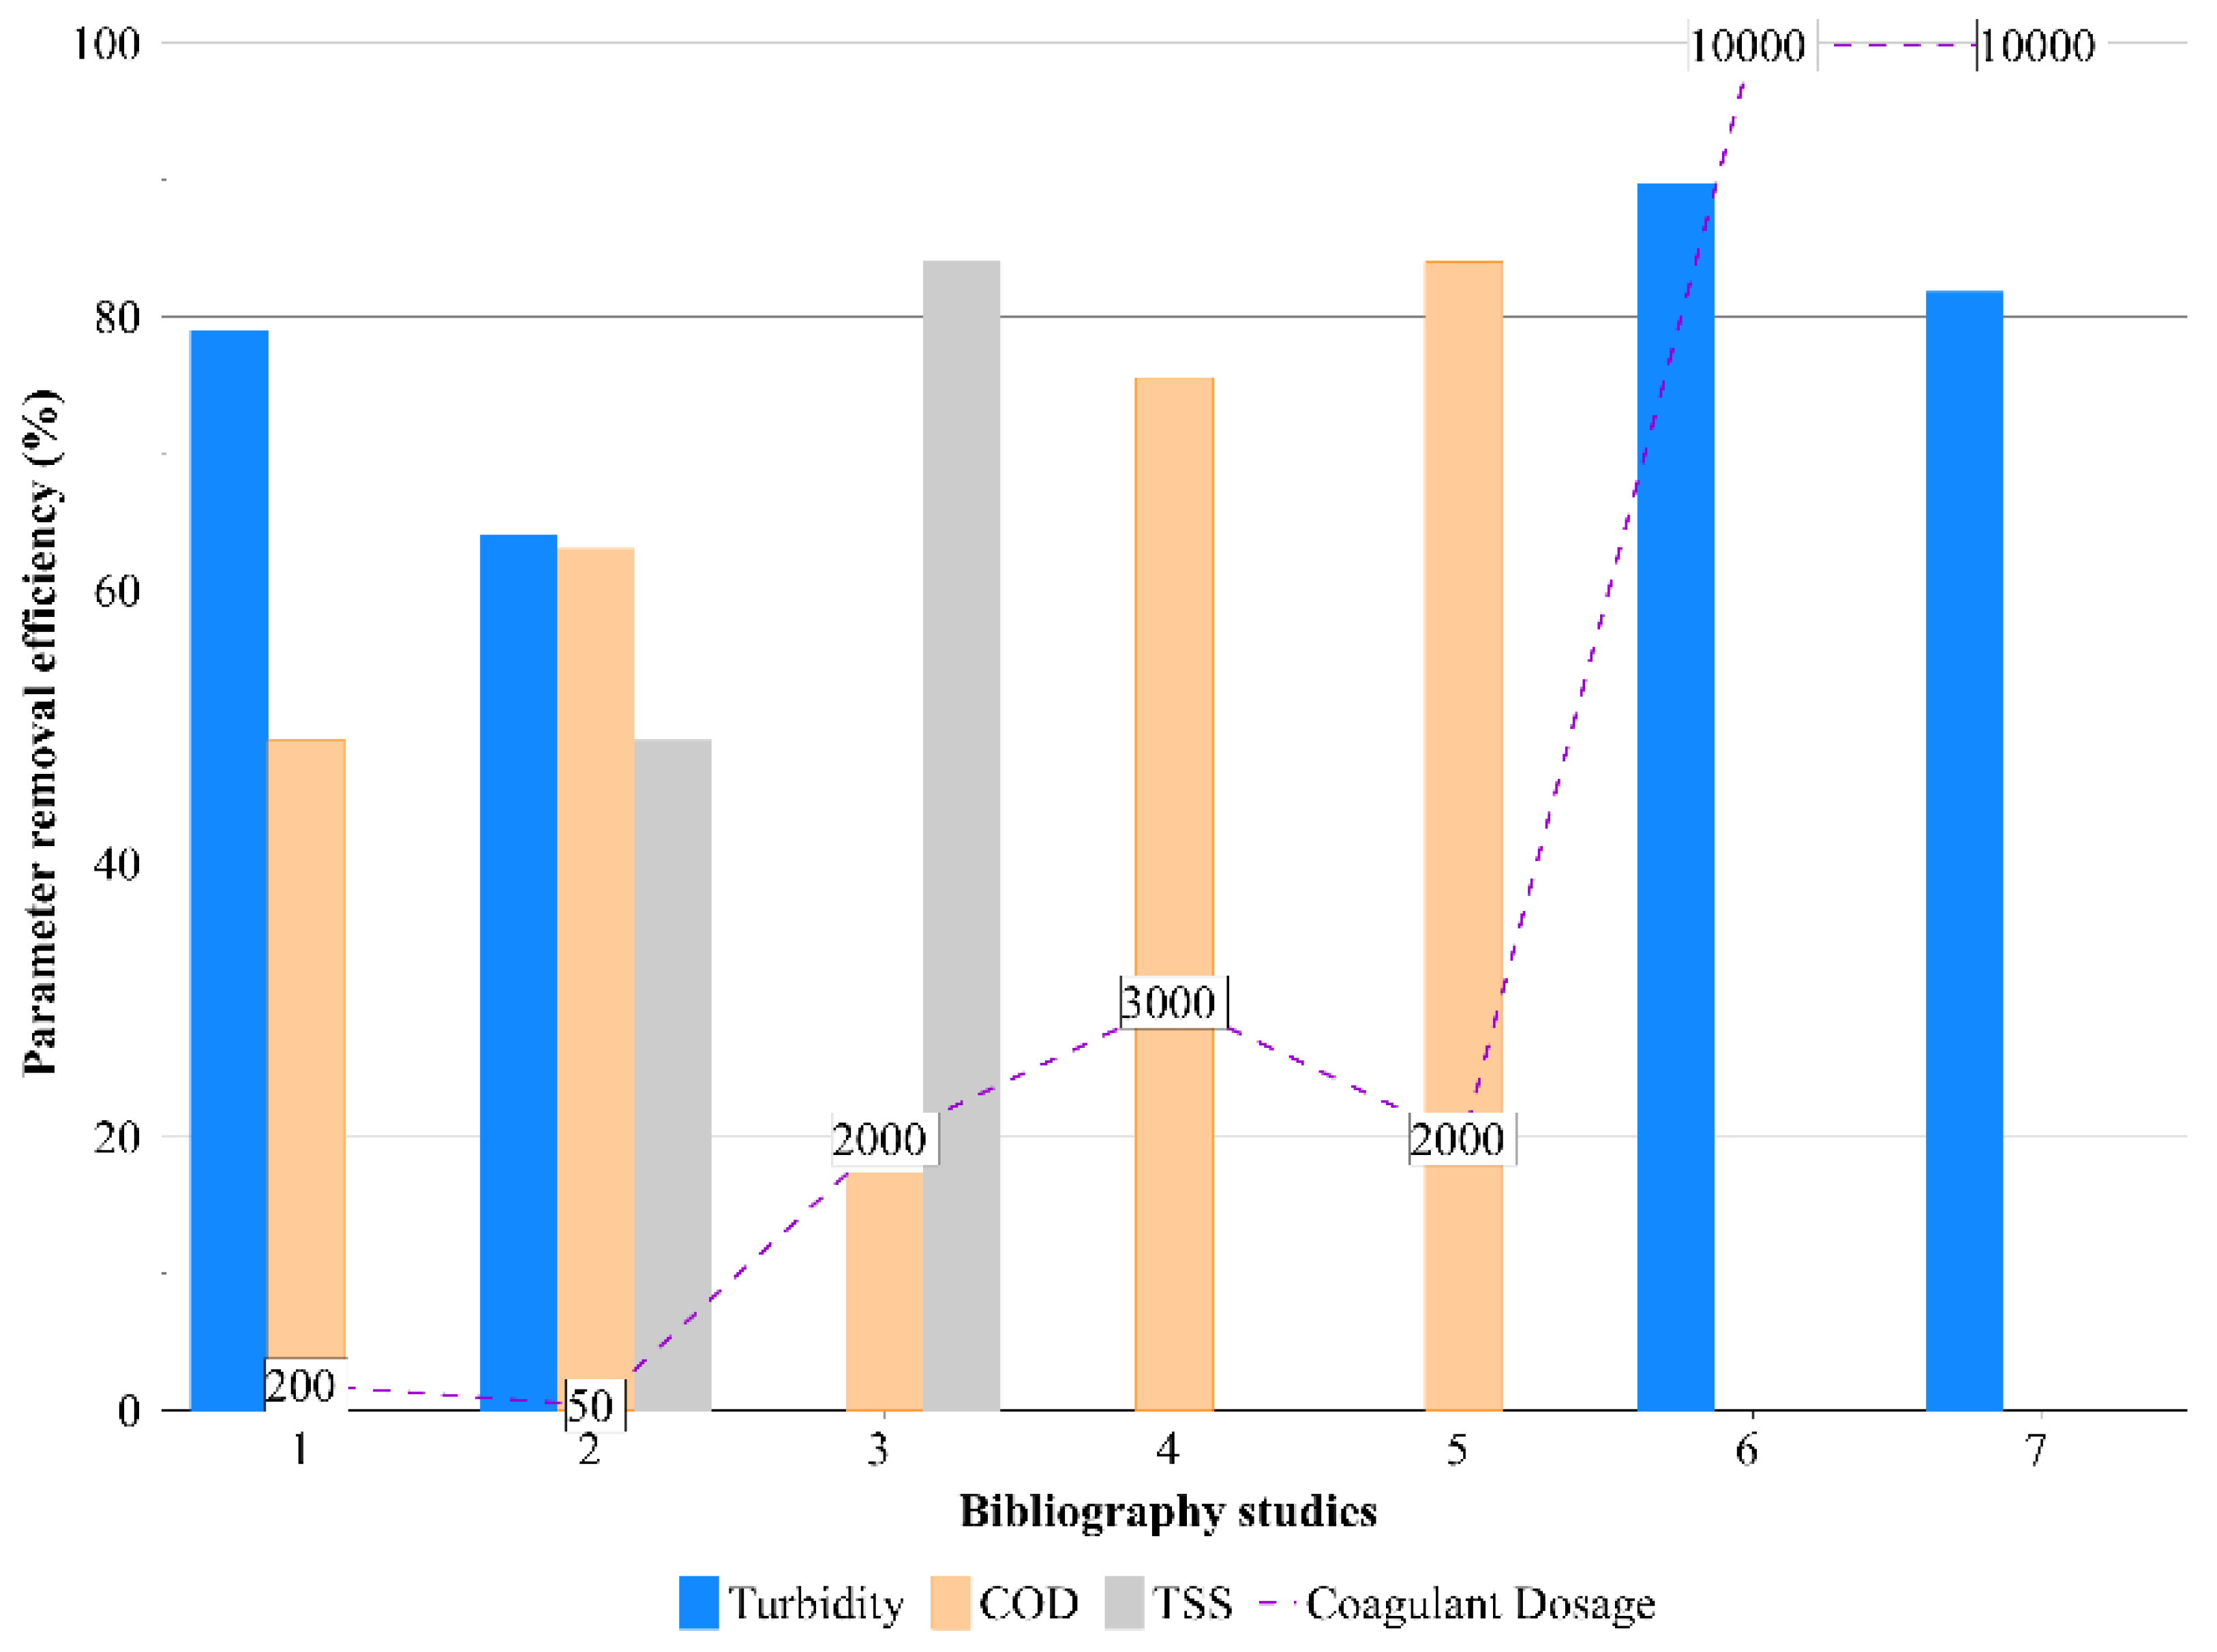
Thus, to select the most optimal reagents, these studied values of turbidity, COD and TSS removal efficiency, and the reagent dosage were considered and compared, as shown in Figure 1.
Figure 1 shows the different efficiency values for control parameters found in the literature. As a first comparison, iron-based reagents (study # 4 [28] and 5 [29]) provide better COD removal for the WW sidestream, although its dosage value is higher than the other studies. On the other hand, all reagents (studies # 1 [25], 2 [26], # 6 [29] and # 7 [30]) that consider turbidity as a control parameter offer good performance values to remove turbidity, with a removal efficiency value over 60%. Finally, this can be correlated with study # 3 [27], where an aluminum-based reagent also offers a high TSS removal value above 80%. The next step to determine the optimal reagents for this work is analyzed further in this document (Section 2.2.1 Coagulant/flocculant reagent selection) with its proper numerical comparison.
This work aimed to study the optimization of the physical–chemical process of coagulation/flocculation for the elimination of organic and suspended matter from a WWTP’s sidestream, looking for an alternative to actual WW pretreatment. On the other hand, the adaptation of this stage (C/F), as a pretreatment of an ion-exchange process for ammonium recovery, was also evaluated, following the circular economy concept.
Indeed, nowadays, the UF process is used as a pretreatment for removing suspended solids and organic matter before ammonia recovery through ion-exchange and/or membrane-contactors technologies. As we know, the UF process is a very effective but also expensive process. So, the novelty of the work is focused on the study of coagulation/flocculation, as a replacement of UF, to improve the pretreatment process for ammonia recovery.
2. Materials and Methods
2.1. Urban Wastewater Samples
The sidestream wastewater samples treated in this study were provided by the Vilanova i la Geltrù WWTP (Barcelona, Spain). Currently, this facility treats an inflow of 99,205 equivalent population. The WWTP was upgraded in 2005 and possesses a primary and secondary treatment to remove biological oxygen demand (BOD), chemical oxygen demand (COD), and TSS. To achieve this, the following processes are conducted: a pretreatment stage: composed of 2 lines (coarse screens, roughing process, and grease traps), followed by a primary settling tank and a mid-range load-activated sludge process (secondary treatment). Afterwards, gravity and flotation processes are carried out to achieve the sludge thickening, followed by anaerobic digestion and the sludge dehydration by a centrifuge.
The liquid waste from this sludge treatment is known as sidestream. Sidestream can contribute less than 1% of the WWTP total flow, but it can increase nutrients up to 30%. For this study, Vilanova i la Geltrù WWTP’s sidestream was collected and analyzed.
2.2. Optimization of Coagulation/Flocculation (C/F) Process
To optimize the C/F process, the methodology of this work was divided into four main stages:
- The selection of the coagulant/flocculant reagent.
- The C/F process through the establishment of an experimental matrix.
- The experimental execution of this matrix to obtain the optimal parameters of the C/F process.
- The theoretical comparison with the ion exchange process to analyze the effect of the C/F process for ammonia recovery.
These stages are schematically represented in Figure 2. As shown in this figure, the first stage allowed the selection of the coagulating material among the different ones in the bibliography. The second stage established the experimental parameters for this study, resulting in an experimental matrix for optimizing the C/F process from the selected coagulating and flocculating reagents. Finally, the third stage developed the experimental method of this matrix and obtained the different wastewater contaminant removal values. Moreover, these stages are complemented by the theoretical comparison with the ion exchange process.
2.2.1. Coagulant/Flocculant Reagent Selection
In this stage, after the first comparison, the turbidity, COD, TSS, pH, and mixing operational parameters were compared numerically to obtain the most compatible reagents for the wastewater analyzed in this study. This mathematical comparison was based on weight values assigned (on a scale of 0 or 1) corresponding to the previously named parameters, except for the pH, whose scale was 0 or 0.5. The pH was only considered as an indirect indicator of the operational parameters of the C/F process and was not part of the experimental process in this study. These parameters are presented below in Table 3.
In the case of turbidity, the study of Muiños Lázaro et al. [25] (where Derypol® HT20 + Derypol® DR4000 were used) was considered the optimum. Indeed, it had the highest elimination value of this parameter (79%), considering its low dosage requirement (200 mg flocculant/L). In comparison, studies from Devesa-Rey et al. [30], where lactic acid and AlCl3 were used, respectively, achieved a higher turbidity elimination value, although a 500-times higher dosage was needed.
In the case of COD, the values resulting from Fragoso et al. [26] (Al2(SO4)3) and Aygun et al. [29] (FeCl3 + clay minerals) were considered optimal. Verma et al. [28] study was not considered optimal due to its high reagent dosage compared to Aygun’s study. In this case, an extra 0.5 weight value was assigned to Aygun’s study due to the major difference in efficiency in eliminating this parameter (63% and 84%, respectively). Thus, a total weight value of 1.5 was achieved.
Regarding the TSS, the analysis of the efficiency of elimination of this parameter compared to the dosage value is like the case of turbidity, so the reagent from Fragoso et al. [26] (Al2(SO4)3) was considered optimal.
In the case of pH, as mentioned above, a weight of 0.5 was assigned for the optimum study, which was determined to be the cases of study from Muiños Lázaro et al. [25] (Derypol® HT20 + Derypol® DR4000) and Fragoso et al. [26] (Al2(SO4)3) due its initial WW’s pH value close to 8.5–9.0, which is the optimum value to recover phosphorous and ammonia [2].
Finally, in the study considered optimal in terms of operational conditions (mixing time and speed), Teh et al. [27] (Al2(SO4)3·18H2O) presented the lowest combined values of mixing time and speed (Table 2), which mean a lower energy requirement of the operation. The values resulting from this final comparison through the methodology proposed above are found in Table 4.
Therefore, the selected reagents for the C/F process used in this study were: (1) Derypol® HT20 + Derypol® DR4000, (2) Al2(SO4)3, and (3) FeCl3 + clay materials.
In the case of the flocculant reagent composed of clay material, found in study # 5, its composition was established as seen in the literature, considering its three main components: silicon dioxide (SiO2), aluminum sulfate (Al2SO4), and iron(III) oxide (Fe2O3) with their respective concentrations of 3%, 64.5%, and 32.5% [29]. From now on, this flocculant will be named Flocculant 1.
2.2.2. Process Set-Up: Operational Parameters
The operational parameters were selected among those found in the bibliography, reported in Table 2. The variable parameters considered for this study were: coagulant and flocculant dosage, RMT and RMS; keeping SMT, SMS and ST as constants, these proposed values are shown in Table 5.
Once reagents and operational parameters were selected, a configuration of the experimental process was established to obtain the optimal operating conditions (to obtain the highest parameter removal value) with the least number of resources, such as reagents and energy.
The proposed experimental matrix aimed to evaluate, through a continuous series of experiments, the effect of parameters by varying them within the C/F process, as shown in Table 6.
2.2.3. Experimental Process Technique
The experimental process consisted of a Jar Test for each series of the matrix shown previously in Table 6, performed in the jar tester model JT60E by OVAN using 1-litre beakers (called jars).
First, 500 mL of sample was measured with the help of a graduated cylinder and transferred to each jar for analysis. Subsequently, the different jars were introduced into the jar tester, and the mixing paddles were set in position. Once the mechanical part of the equipment was installed, the coagulant concentration specified in the experiment matrix was introduced into the different jars.
From this moment on, the process of rapid mixing began, from the introduction of the RMT and RMS parameters established in the experimental matrix, and providing a start to the mechanical mixing process. Once the rapid mixing process was finished, the different flocculant concentrations specified in the experimental matrix were introduced. Then, the slow mixing process was carried out, which was analogous to the rapid mixing process.
To finish the Jar Test, the jar sedimentation process was carried out, and after the ST, a 250 mL sample was extracted from the top of each jar to extract the clarified phase of this process.
Some considerations were considered when conducting the experiments with the jar test kit:
- (a)
- A manual shaking of the main sample container was carried out before the extraction of the 500 mL for the test. This confers greater homogeneity between the extracted samples by avoiding solid deposits that alter the result.
- (b)
- The jar test was performed in duplicate for each experiment in each series to reinforce the confidence of the results obtained by the test.
- (c)
- The process of adding the flocculant and starting the rapid mixing was carried out in the shortest possible time concerning the end of the SMT to avoid the premature generation of the sedimentation process arranged for the end of the procedure.
- (d)
- Regarding the addition of the flocculant in the experiment, this was carried out in the most controlled way to avoid the rupture of the flocs created in the SM process.
- (e)
- The extraction of the jars before the sedimentation or decantation process was carried out, avoiding movements that could produce the re-suspension of the sludge generated by the flocs.
2.3. Analysis Techniques
The following analysis techniques were performed to determine the physical/chemical characteristics of the residual water samples to be analyzed, as well as their characterization after the C/F process:
The GLP 22 pH meter by CRISON Instruments was used to determine the pH of the wastewater samples. On the other hand, the conductivity values were determined using the Sension+ EC7 conductivity meter by HACH Instruments.
To obtain turbidity values of the samples, the HI 93703 turbidity meter by HANNA Instruments was used.
The total organic carbon (TOC) values were obtained with the TOC-V CPH meter by Shimadzu. This value was obtained by the numeric difference between the total carbon (TC) and inorganic carbon (IC) values measured in the equipment.
Chemical oxygen demand (COD) values were obtained with the HI 83224 photometer by HANNA Instruments, after 2 h digestion stage at 150 °C, followed by a 20 min cooling stage completed for every sample, including the blank ones.
The ionic chromatography system used in this study was the DIONEX ICS-1000 and DIONEX ICS-1100, along with an automatic sampler by Thermo Fisher Scientific. This equipment was controlled by the Chromeleon® chromatographic system. For ionic determination and quantification, a CS16 column (5 × 250 mm) and an AS23 column (4 × 250 mm), along with its precolumns (CG16 (5 × 50 mm) and AG23 (4 × 50 mm)) were used for cation and anion determination, respectively.
2.4. Data Analysis
Once the characterization of the treated water was carried out, as well as the previous characterization of the WW, the efficiency of elimination of the control parameters (turbidity, COD and TSS) was numerically evaluated utilizing Equation (1):
where Ci is the initial concentration of the analyzed parameter (mg/L) and Cf is the final concentration of the analyzed parameter (mg/L).
Efficiency (%) = 100 × ((Ci − Cf)/Ci)
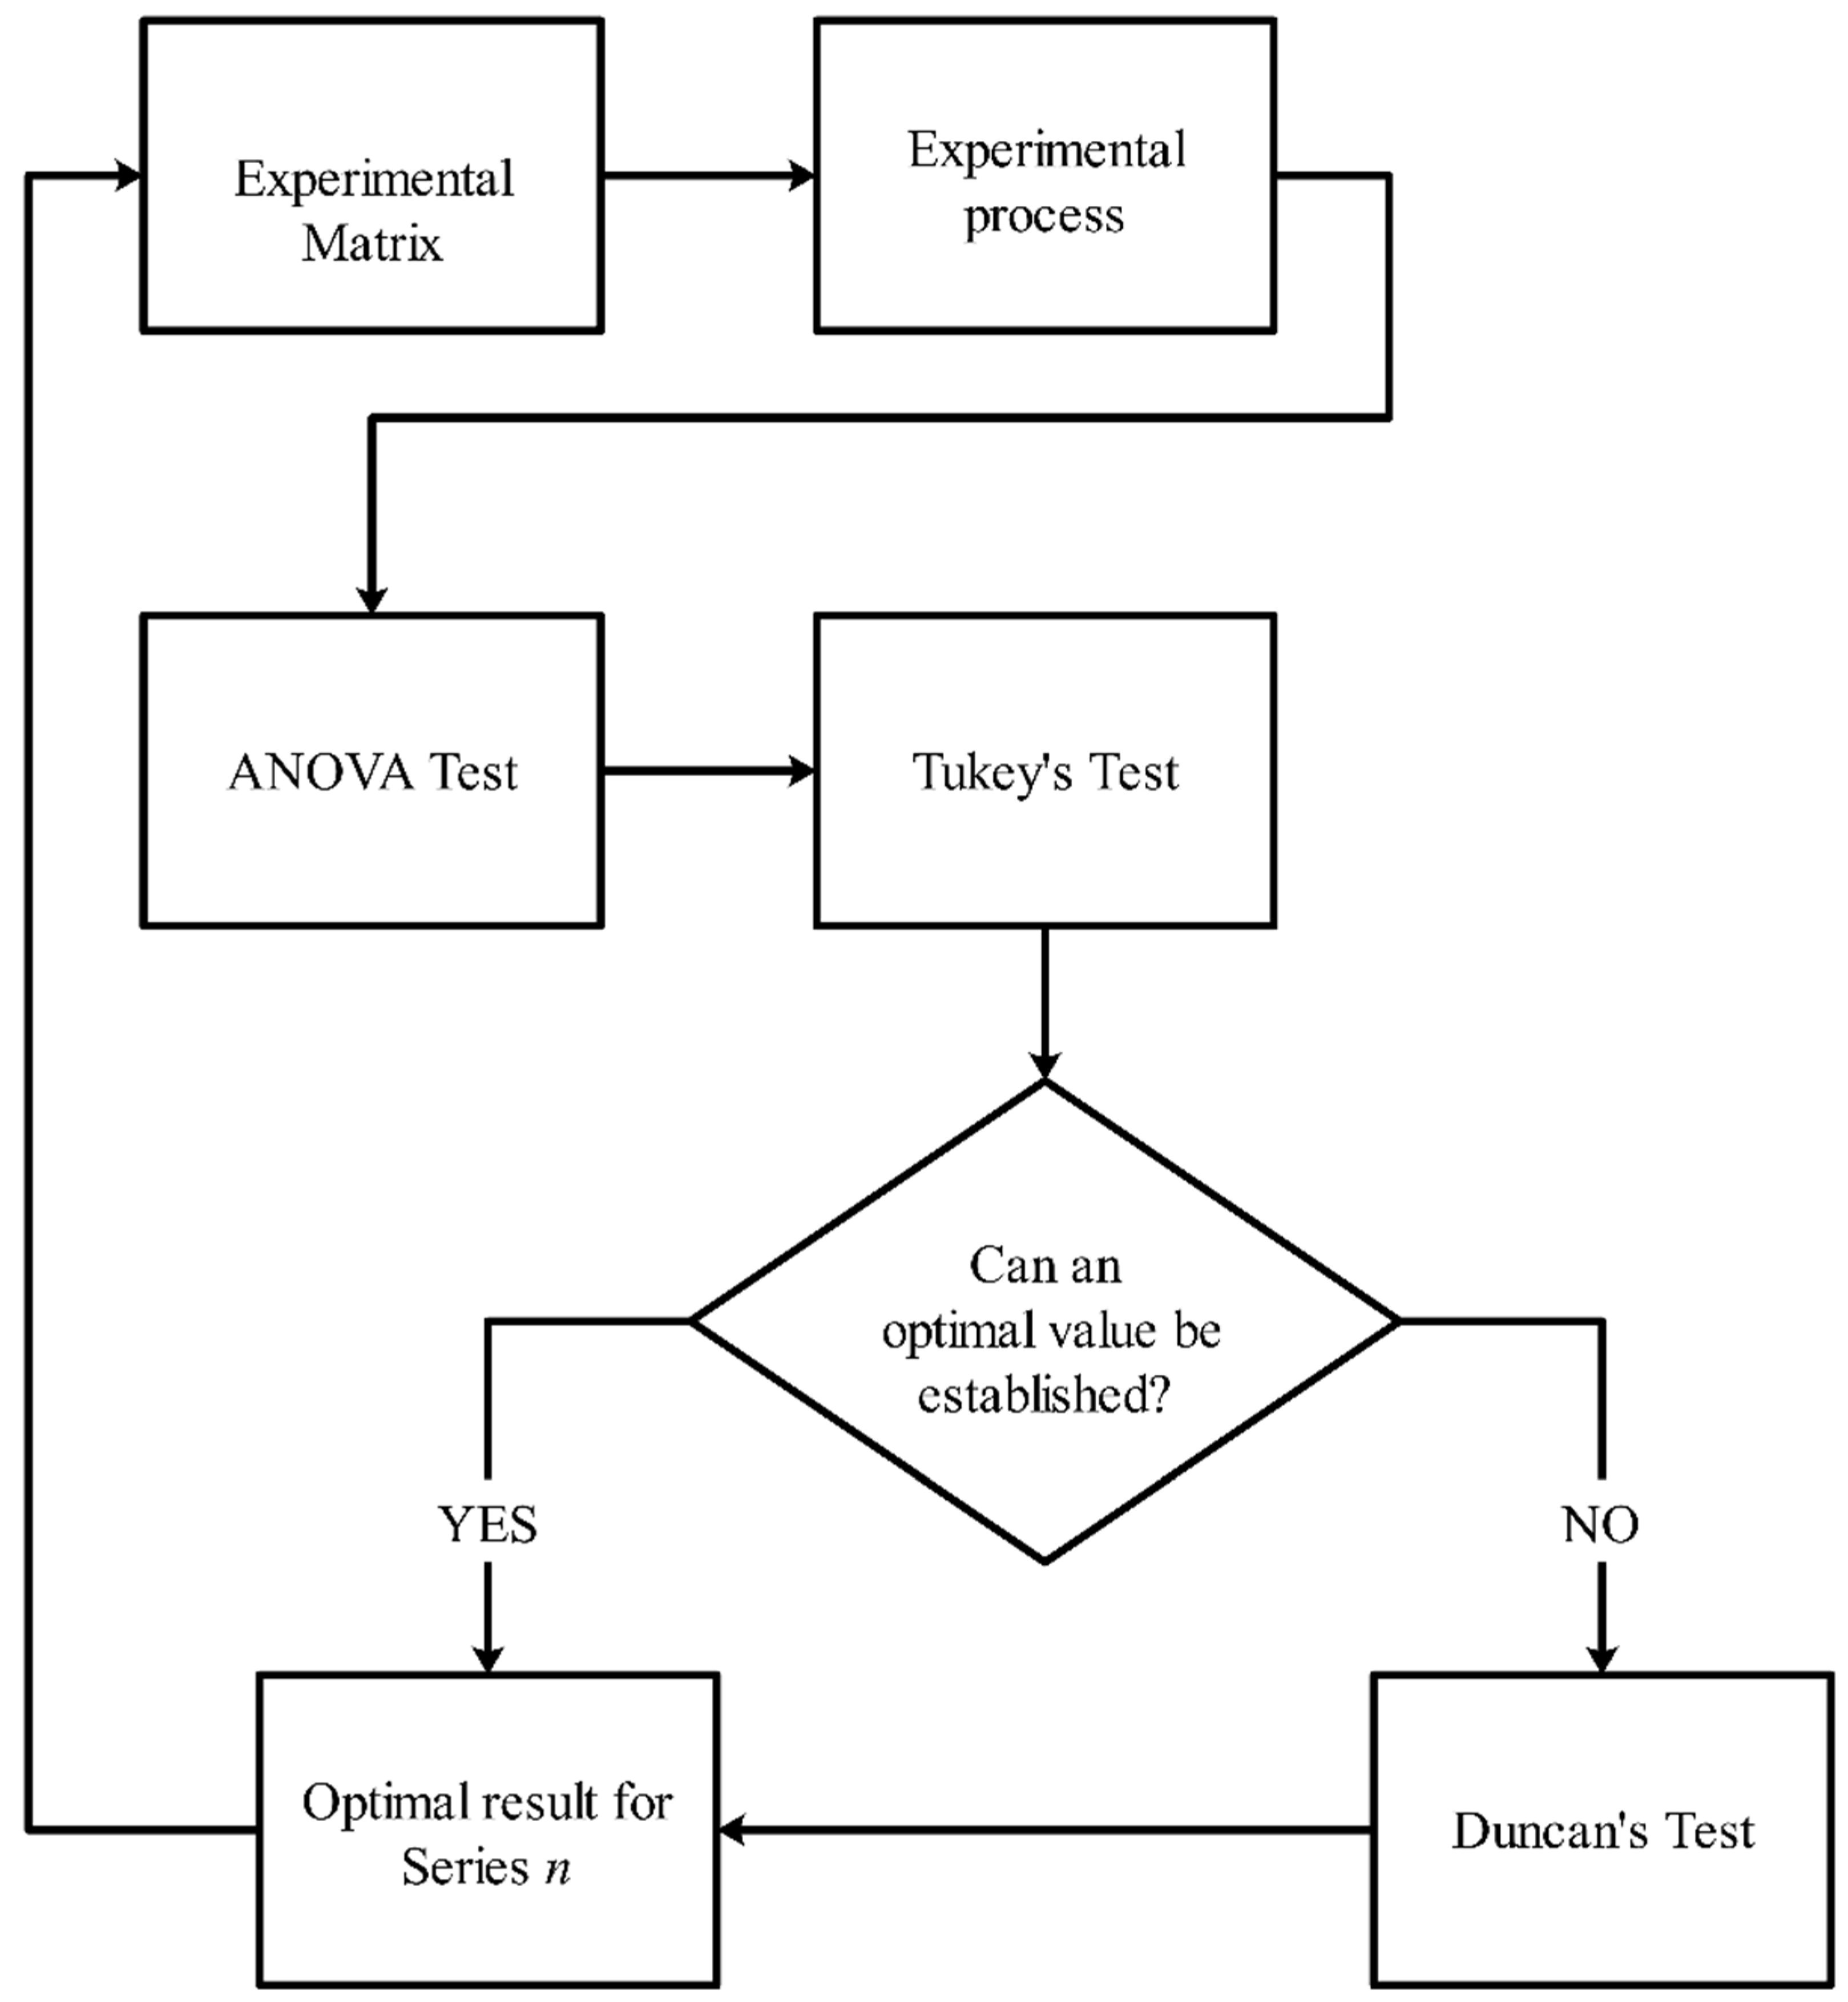
Once the elimination efficiencies of the control parameters were calculated for each series of the experiment matrix, it was decided to perform a statistical check of the efficiency results. In summary, the statistical analysis and decision-making methodology used in this study are outlined in Figure 3.
The statistical process consisted of two stages. The first was to estimate whether there was a numerical difference (called statistical significance) between the elimination efficiency values for each parameter of each series. If the first was fulfilled, then the idea was to find which were these different values from the group of results.
The first stage was estimated through the analysis of variances (ANOVA). This ANOVA tests the hypothesis that the means of two or more populations are equal. Therefore, the null hypothesis establishes that all the analyzed measures are identical, while the alternative hypothesis confirms that at least one value is different from the rest.
The result of this test obtains the statistical significance value p; if this value is lower than the established significance level of 0.05, it is concluded that at least one mean of the analyzed values is different from the rest of the values.
The second stage required a multiple comparisons method. For this study, two approaches were considered: Tukey’s and Duncan’s tests. Both tests compare the value of the means with a threshold established by the initial significance or confidence value; Duncan’s test differs by using a variable threshold depending on the number of means involved in the comparison [31].
Therefore, it was deduced that if the results of Tukey’s test were not sufficiently interpretable, it was necessary to apply the Duncan test, which consists of a more remarkable ability to find significant differences between the analyzed values.
3. Results and Discussion
3.1. Urban Wastewater Characterization
The average results of the initial characterization of the sidestream WW of the Vilanova i la Geltrú WWTP are detailed in Table 7.
As shown in Table 7, the initial COD value of the tested WW in this study was much lower than those established in the literature [25,26,27,28,29,30]. This fact was mainly because WWs analyzed in previous studies were based on mainstreams, while the WW of this work belonged to a sidestream. WW sidestream has already suffered a reduction in organic matter during purification. Indeed, this fact was repeated for the case of the initial value of TSS (considering that the WW used in this work was a sidestream), but not so in the turbidity value, which was within the range of parameters previously found in bibliography studies [25,26,27,28,29,30]. Thus, these three parameters were considered to establish the operating parameters of the C/F process.
It is worth mentioning that the initial characterization of the WW used for Series # 2 and # 5 presented remarkably high values of their control parameters (turbidity > 5000 NTU, COD > 70,000 mg O2/L, and TSS > 8000 mg/L). Hence, a previous process of settling the sample was necessary during 18 h.
This process did not substantially affect the initial concentration values of the anions, cations, and physical–chemical properties, such as pH (average removal percentage of anions, cations, and pH of 2.2% during the settling process). However, the control parameter (turbidity, COD, and TSS) values showed a considerable standard deviation in their mean values. The detailed initial characterization values of the different experimental series are found in Table 8 below:
As shown in Table 8, the settling process in the sample from Series # 2 and # 5 produced a notable reduction in the TSS value without affecting the turbidity and COD values.
3.2. Experimental Process Results: C/F Process Optimization
This section presents the results of the experimental C/F process of each of the series of the experimental matrix. These results were summarized considering the C/F process efficiency and the statistical analysis.
In the case of Series # 1, the numerical analysis is shown by the final control parameters removal efficiency (Table 9). For the rest of the series, only a final summarized figure is shown.
3.2.1. Series # 1: Reagent selection
Series # 1 was established with two variable parameters: the coagulant and the flocculant reagent for the C/F process. This series aimed to make a comparison under equal conditions of different reagents to determine the optimal materials for treating the wastewater from this study.
The dosage of the coagulant reagents (Derypol HT20, Al2(SO4)3 and FeCl3) was 500 mg/L, while the flocculant reagents (Derypol DR4000 and Flocculant 1) were used in an 800 mg/L dosage, according to the experimental matrix. Removal efficiency values achieved by this experimental series are presented in Table 9.
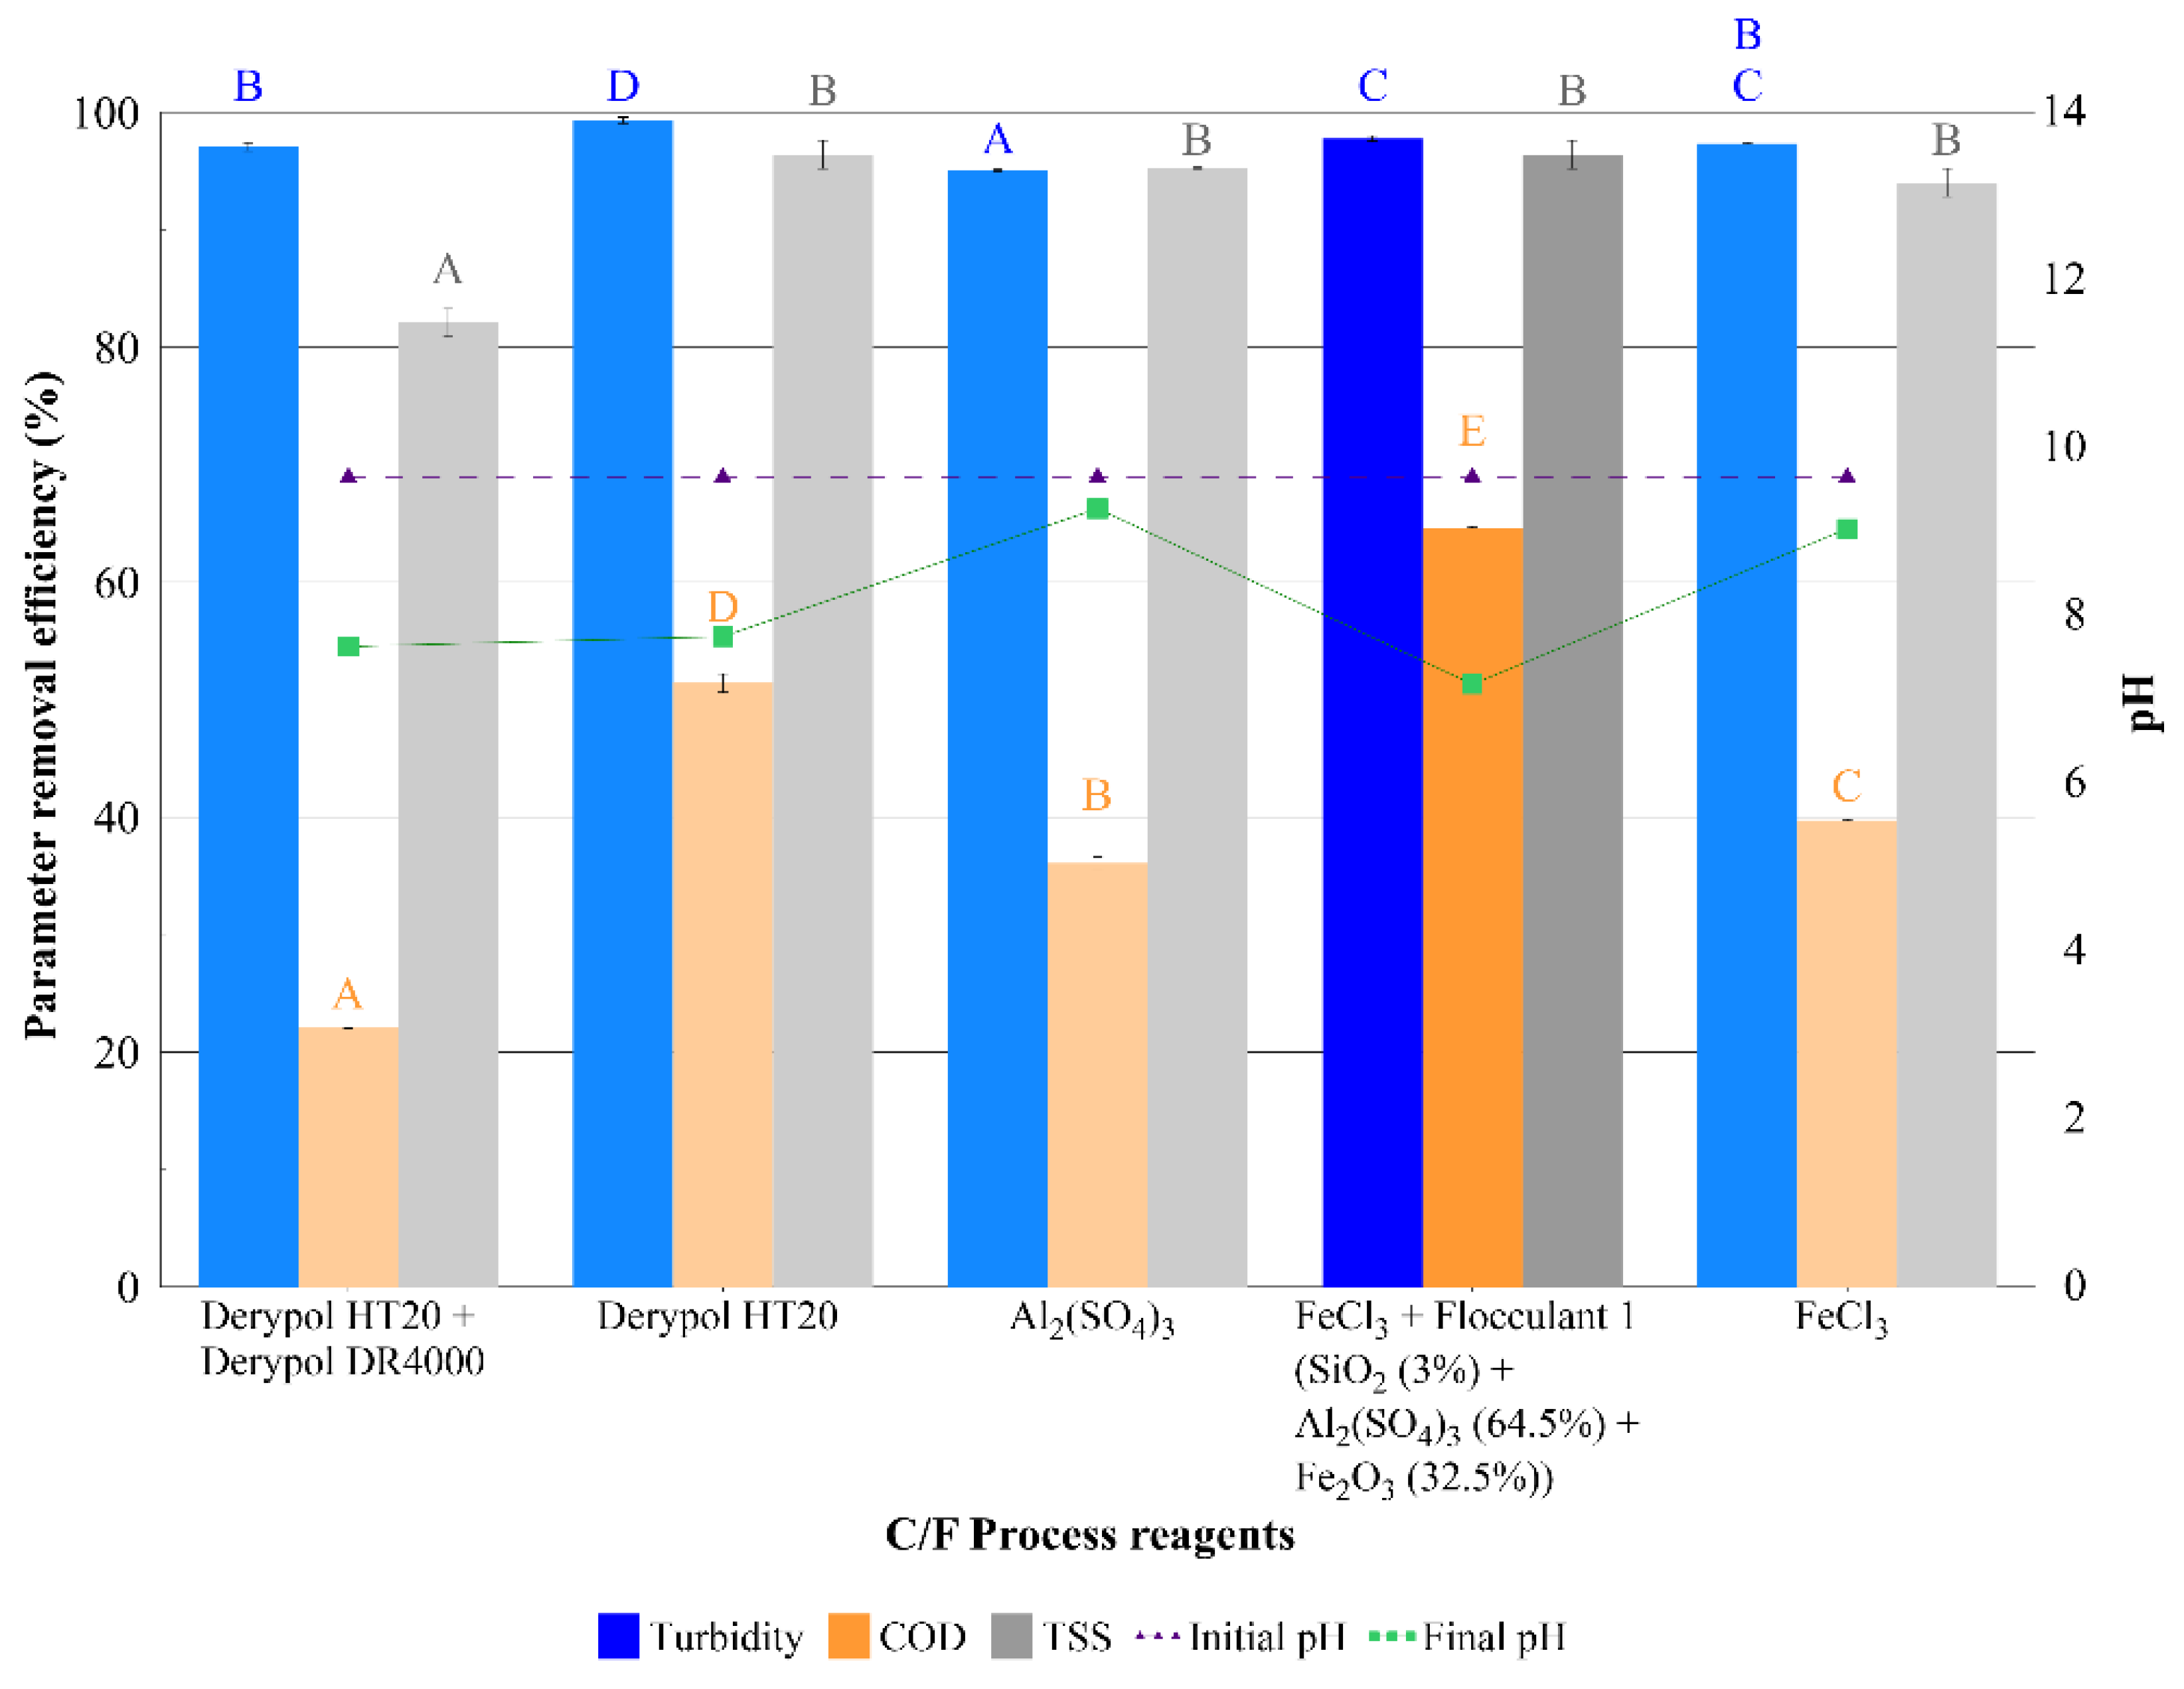
Since the mathematical difference was too small to determine the optimal reagents, the corresponding statistical analysis was carried out using the ANOVA and Tukey’s tests (Figure 4).
Figure 4 shows the removal efficiency values of turbidity, COD, and TSS plotted in blue, orange, and gray, respectively, as well as the results of Tukey’s test labeled in ascending alphabetical order with the same color as its control parameter.
The results of the Tukey test for this series showed that in the case of turbidity, the experiment with Derypol HT20 as a coagulant reagent achieved the best result for this control parameter. The second-best results were achieved by the experiments carried out with FeCl3, with and without the addition of Flocculant 1, that were statistically equivalent (there was no statistical significance between these values) and whose value was numerically slightly lower than using Derypol HT20.
On the other hand, regarding the efficiency of COD removal, it was observed that the FeCl3 + Flocculant 1 combination reached the highest removal efficiency value of this parameter. Finally, the TSS Tukey test showed that the efficiency value obtained by all the experiments, except for the combination of Derypol HT20 + Derypol DR4000, was not statistically significant and, therefore it was optimal for the elimination of this parameter.
Therefore, the experiment carried out with the FeCl3 coagulant, together with the flocculant named “Flocculant 1”, was considered optimal for Series # 1, achieving an efficiency of 97.8 ± 0.3%, 64.7 ± 0.1%, and 96.4 ± 1.2% for removal of turbidity, COD, and TSS, respectively.
3.2.2. Series # 2: Coagulant Dosage
Series # 2 was established to study another operational parameter: the coagulant dose (mg/L). In this series, the optimal C/F reagents obtained from Series # 1 were used: FeCl3 and Flocculant 1; along with the rest of the parameters established in the experimental matrix.
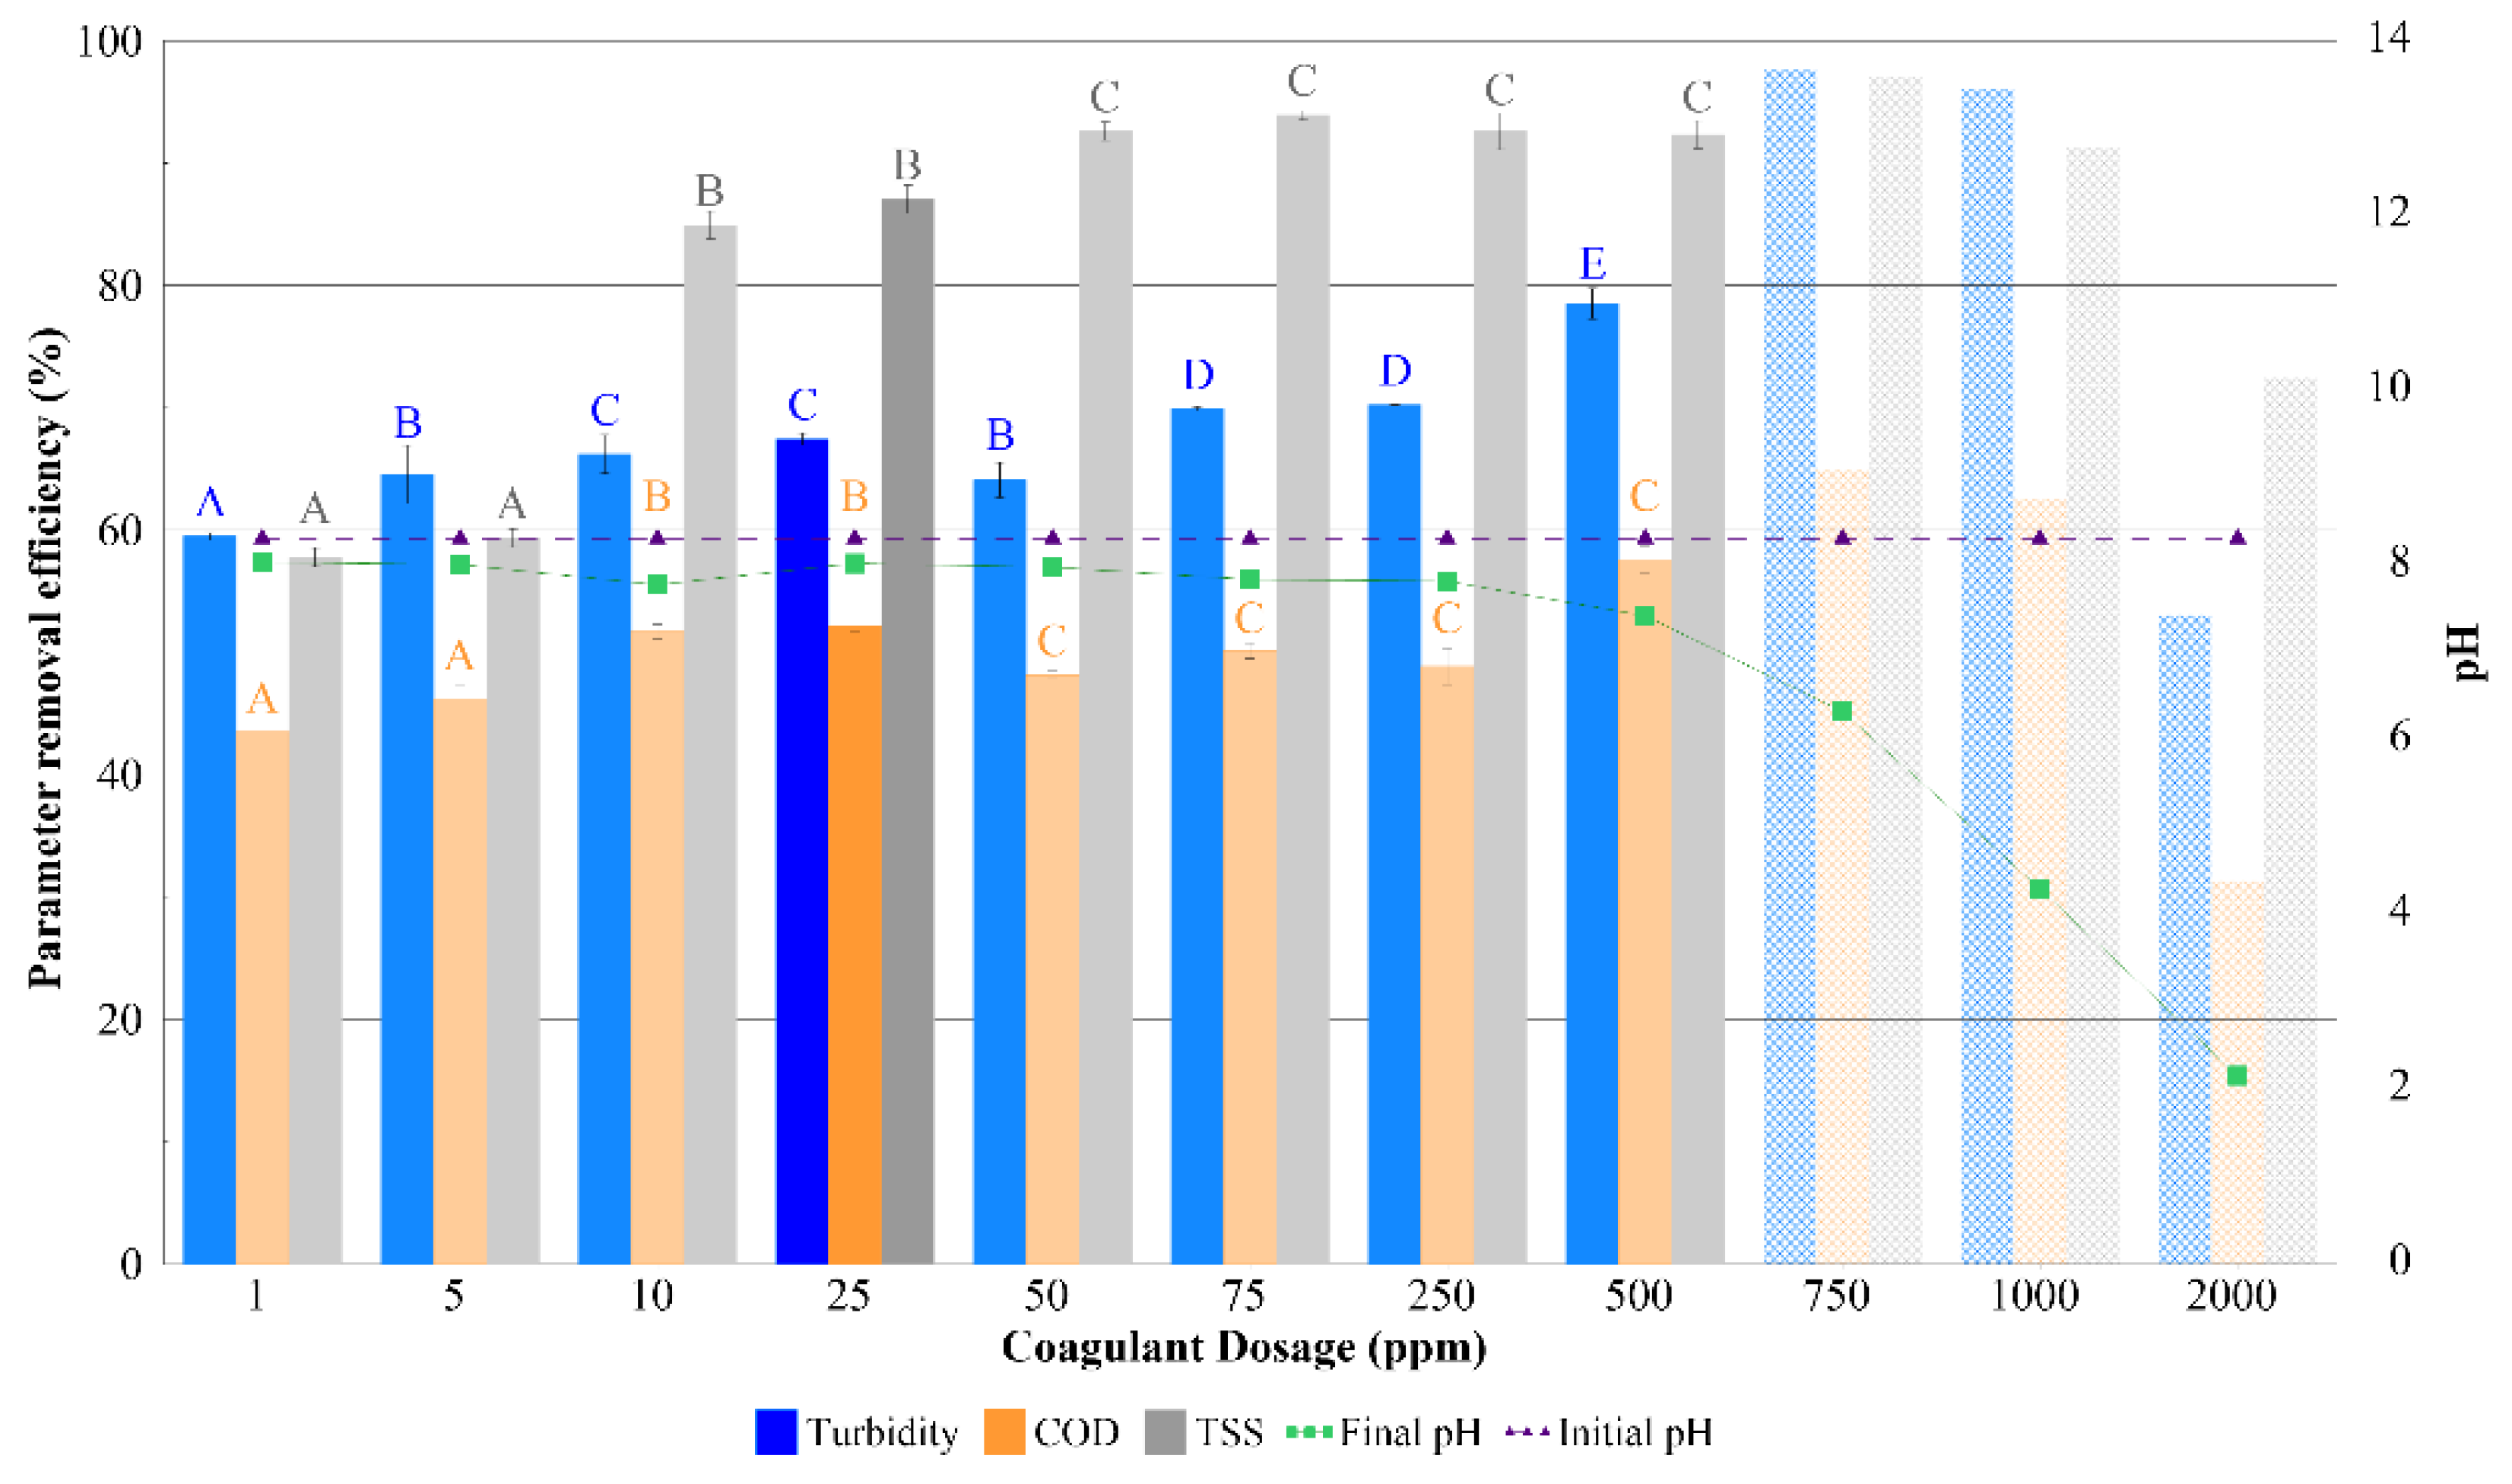
This series aimed to evaluate the variation of the removal efficiency of the control parameters (turbidity, COD, and TSS) in comparison to the dosage of the coagulant material, and thus to obtain the optimal dosage value (Figure 5).
As can be seen in Figure 5, the turbidity and COD efficiency values showed a distribution with an increase in the efficiency value up to the first maximum value (between 10 and 25 mg/L), followed by a reduction in their values up to the second increase in their values up to a second maximum value (between 750 and 1000 mg/L). This behavior happened due to a phenomenon known as coagulation zones, in which there are two increasing and two decreasing efficiency zones interspersed depending on the dosage of the reagent with the following characteristics: in the first zone (load reduction), the dosage value is not sufficient to destabilize the particles; in the second zone (optimal dose), the first maximum agglomeration of colloids occurs; by increasing the dose in the third zone (charge inversion), the colloids stabilize again due to the supersaturation of the coagulant, generating a breakdown of the flocs formed; and finally, in the fourth zone (sweep coagulation), there is a supersaturation in the medium that leads to a sweep and precipitation effect of these colloids [32,33,34].
On the other hand, it is observed in Figure 5 that the final pH values decreased in an accelerated manner from a dosage of 750 mg/L. In the same way, it is observed that these values are close to <6, which is considered a very acidic value for a subsequent process of the treated wastewater. Thus, experiments with a dosage greater than 750 mg/L were discarded due to excess coagulant reagent.
Therefore, the numerical and statistical analyses were carried out based on the experiments with a concentration from 1 to 500 mg/L. Regarding the numerical analysis, it was found that the optimal turbidity removal results were reached with a dosage of 75, 250, and 500 mg/L, whereas the elimination of COD obtained better results with the dosage of 10, 25, and 500 mg/L. Finally, the experiments with a dosage of 50, 75, and 250 mg/L reached the best results for the removal of TSS. On the other hand, the statistical analysis showed that the experiment with the highest efficiency corresponded to a dosage of 500 mg/L, and it was statistically significant to the experiments with a dosage of 75 and 250 mg/L, which were not statistically significant (equivalent) to each other for removing turbidity. In the case of COD, in the same way, the experiment with a dosage of 500 mg/L was statistically significant to the experiments with 10 and 25 mg/L, which were equivalent. Finally, in the case of TSS removal, the three best results (500, 250, and 75 mg/L) were not statistically significant, even with a dosage of 50 mg/L. Due to this, the experiment that obtained the highest removal results corresponded to a dosage of 500 mg/L. However, the optimal dose of coagulant material was 25 mg/L. Due to this, the experiment obtained slightly lower values of elimination of turbidity, COD and TSS, in 11.1%, 5.4%, and 5.3%, respectively, concerning the dose of 500 mg/L, but with a requirement of coagulant material 20 times lower.
Therefore, the experiment with a dosage of 25 mg/L was considered optimal for Series # 2, achieving an efficiency of 67.5 ± 0.3%, 52.2 ± 0.4% and 87.1 ± 0.8% for removal of turbidity, COD and TSS, respectively.
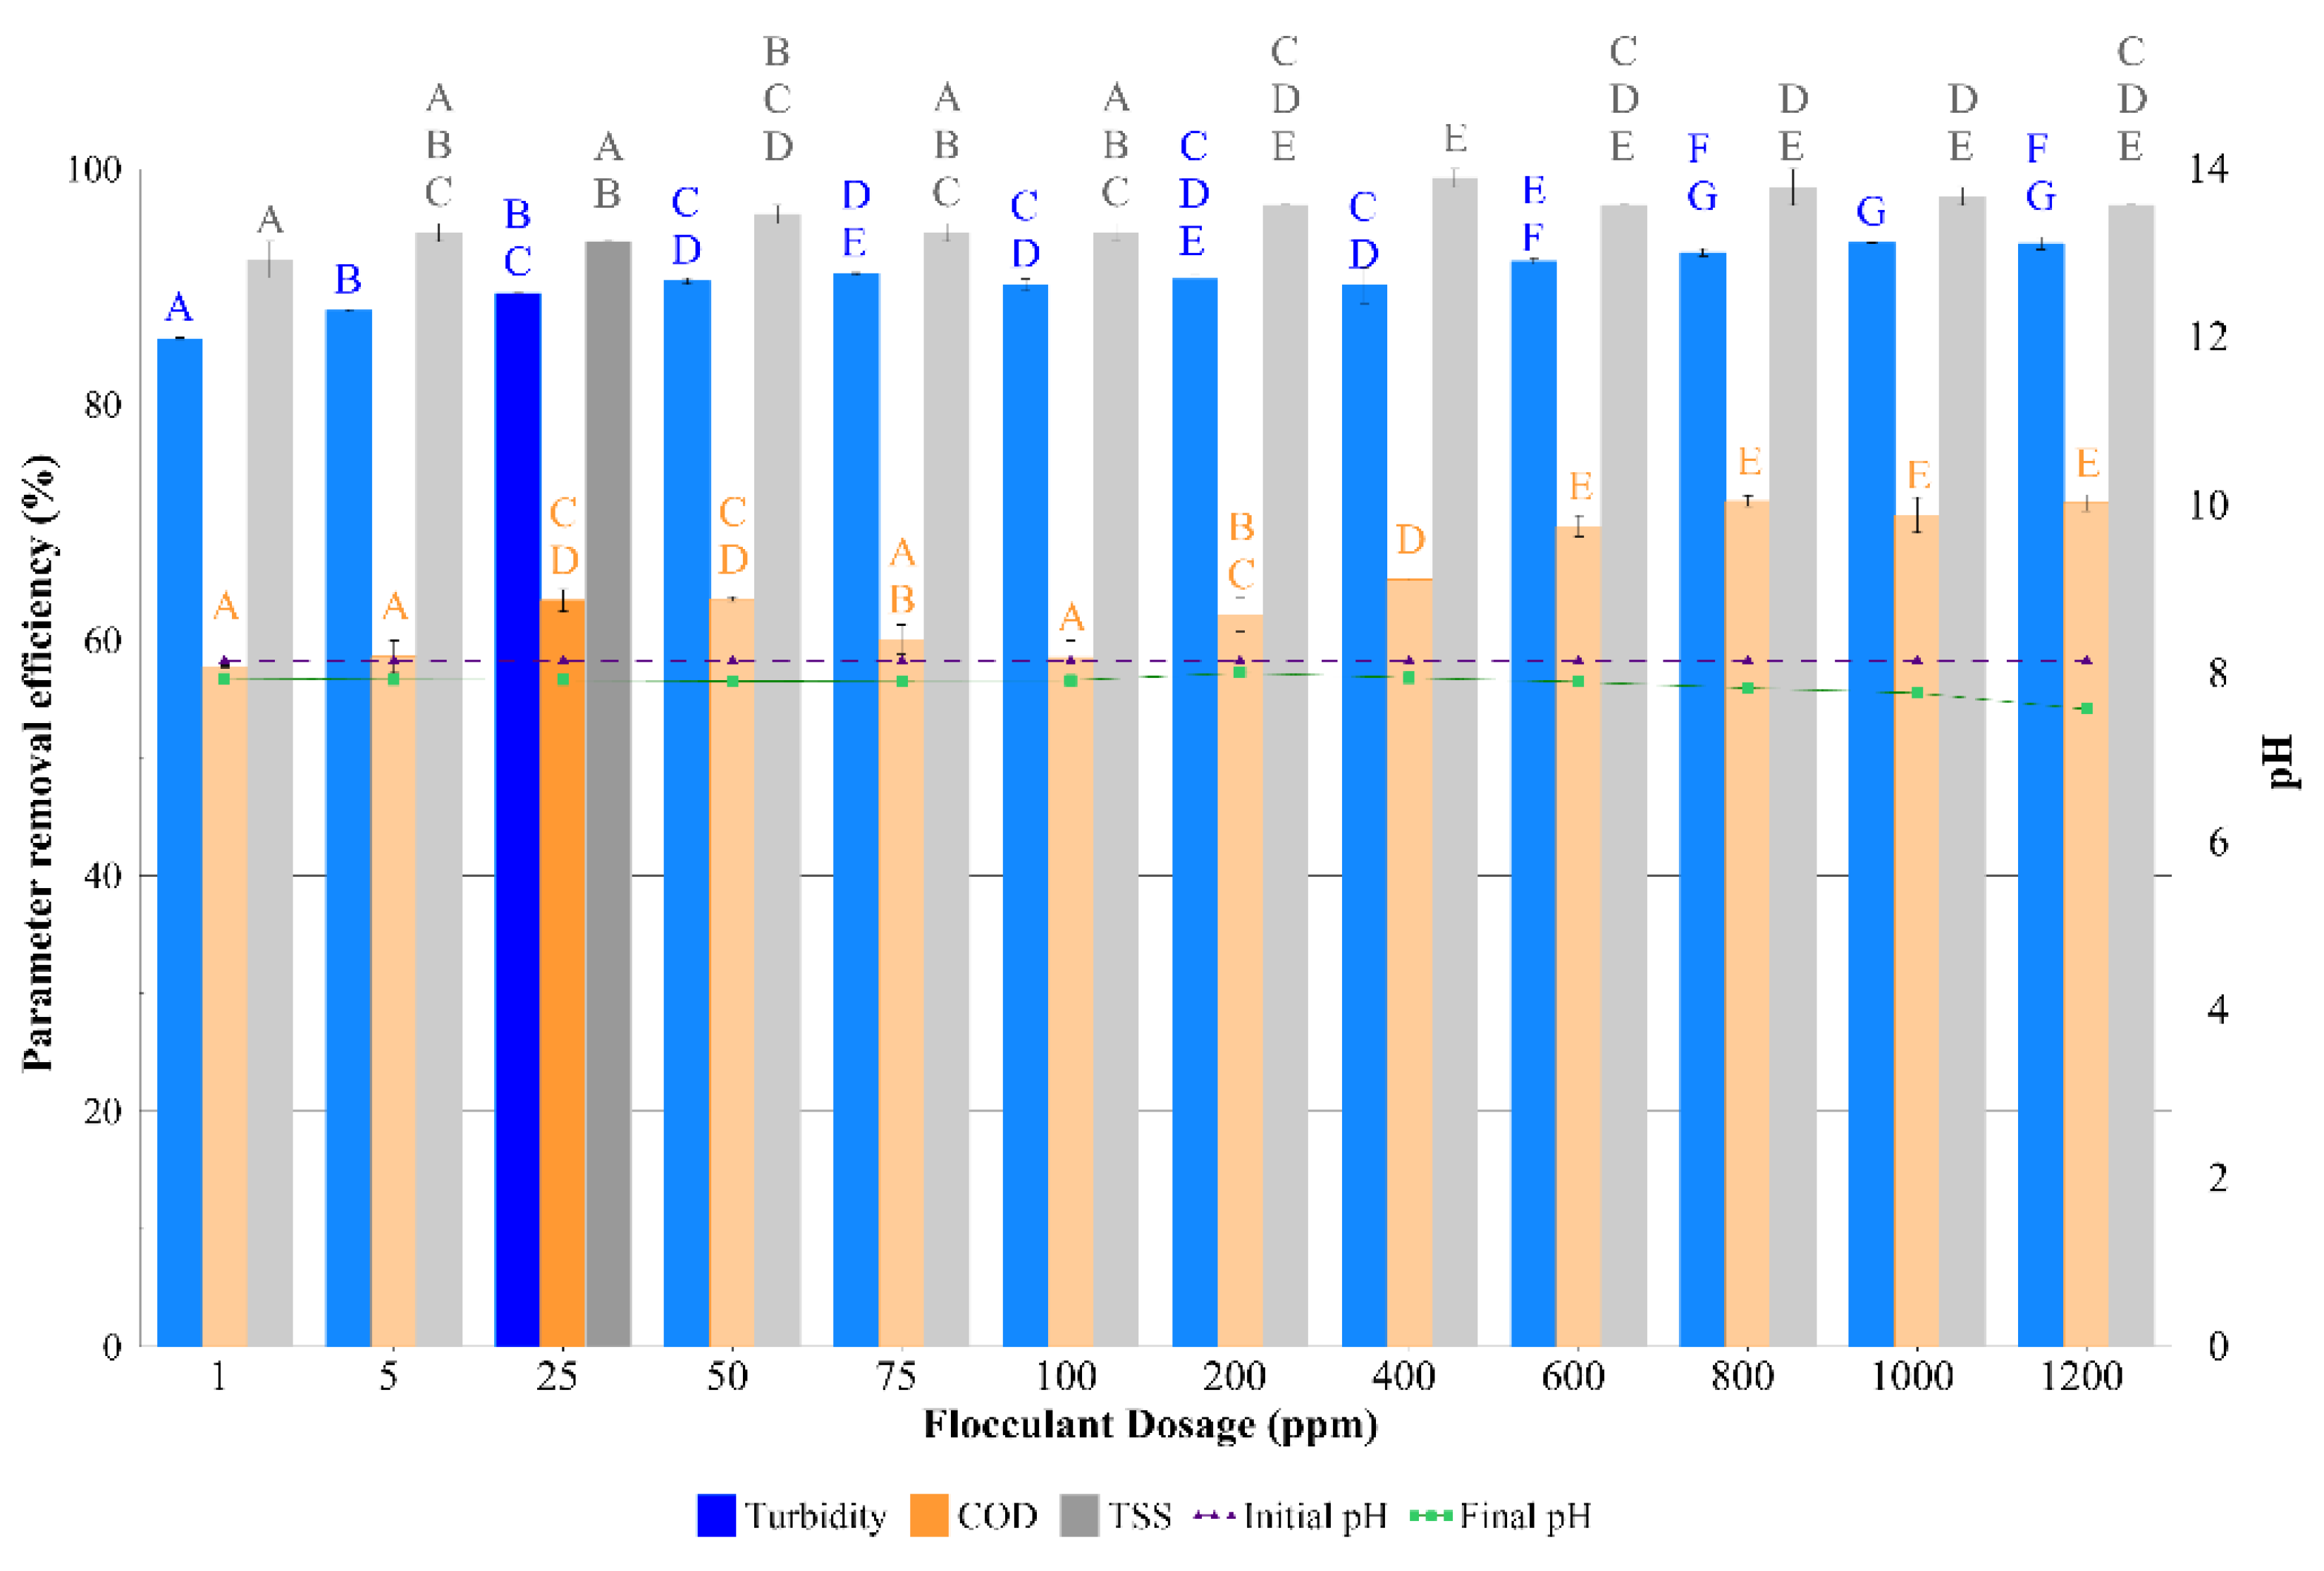
3.2.3. Series # 3: Flocculant Dosage
Series # 3 was established to determine the optimal flocculant dose (mg/L). Therefore, this series aimed to evaluate the removal efficiency of the control parameters in comparison to the flocculant dosage, thus obtaining its optimal value. Therefore, from the experimental process already established, the experiments and the numerical and statistical analysis were carried out. These results of Series # 3 are represented in Figure 6.
In the results found in Figure 6, it was observed that unlike Series # 2, adding flocculating material in the range of experimentation did not considerably modify the final pH, so in the first instance, the dosage of Flocculant 1 was considered adequate for the whole series.
Similarly, in Figure 6, it was observed that turbidity and COD removal percentages followed a similar pattern as that seen while studying the coagulant dose. Indeed, there was an initial increase up to the dose of 50 mg/L, followed by a decrease, and again, a boost from the value of 200 mg/L onwards. Again, this is because known as coagulation zones [32,33,34], mentioned previously.
Regarding the numerical analysis of the removal results, the experiments with a dosage of 800, 1000, and 1200 mg/L obtained the highest values of turbidity and COD removal, whereas in the case of TSS removal, the highest removal values were obtained by experiments with dosages of 400, 800, and 1000 mg/L. However, graphically, it was observed that the elimination values belonging to a dosage of 600, 50, and 25 mg/L were quite similar, so the significances were verified through the statistical analysis of the series.
The result of Tukey’s test for the elimination of COD determined that there were no significant differences between the removal values with a dose of 600, 800, 1000, and 1200 mg/L, although there were significant differences at the values of 25 and 50 mg/L. However, the dosage of 25 mg/L was considered the optimum for the case of the COD removal due to 24 times lower dosage being used with only a reduction of 6.2% in the removal of this parameter.
On the other hand, the COD value was considered the main parameter of statistical comparison, since the differences between the maximum and minimum turbidity removal and TSS represent a total variation of 3.6% and 6.9%, respectively. Therefore, the selection of the experiments based on these two parameters was considered secondary compared to the elimination of COD.
Finally, the experiment with a dosage of 25 mg/L was considered optimal for Series # 3, achieving an efficiency of 89.4 ± 0.1%, 63.4 ± 0.9% and 93.9 ± 0.1% for removal of turbidity, COD, and TSS, respectively.
3.2.4. Series # 4: Rapid Mixing Time
Series # 4 was established to evaluate the rapid mixing time (RMT, expressed in min). This series aimed to determine the optimal RMT associated with the flocculating reagent to obtain the maximum removal efficiency. Again, the experimental process was carried out, and the numerical and statistical analyses are shown below in Figure 7.
Firstly, it is observed in Figure 7 that the final pH level was almost constant throughout the series, which indicates that the rapid agitation of the C/F process did not influence the efficiency of the coagulant and flocculating material.
Secondly, regarding the numerical analysis, the results with the highest turbidity removal values corresponded to an RMT of 1 and 20 min. In the case of COD removal, these results were obtained with a RMT of 5 and 10 min. Finally, a RMT of 1, 10, 20, and 25 min was required to obtain the best TSS removal results. Statistical analysis confirmed that any result was statistically significant (i.e., equivalent results were achieved) in removing turbidity and COD; while in the case of the elimination of TSS, the RMT of 1, 10, 20, and 25 min were equivalent and showed the best results of the series.
Therefore, the optimal RMT for this series corresponded to the experiments with a RMT of 1, 10, 20, and 25 min. Thus, the experiment with a lower time (1 min) was selected, which implied lower energy consumption and a shorter experimental time.
Therefore, based on the above considerations, the experiment carried out with a rapid mixing time of 1 min was considered optimal for Series # 4, achieving an efficiency of 91.5 ± 0.3%, 59.1 ± 1.2% and 95.2 ± 0.1% for removal of turbidity, COD, and TSS, respectively.
3.2.5. Series # 5: Rapid Mixing Speed
Series # 5 was established with another variable parameter: rapid mixing speed (RMS, expressed in rpm). This last series pretended to analyze the RMS of the flocculating material effect on the control parameters to obtain the optimal RMS value. In the same way as the previous series, the experimental process was carried out, and the numerical and statistical analysis of the results of Series # 5 are represented in Figure 8.
As can be seen in Figure 8, the variation of the final pH value in comparison with its initial one was negligible. This indicated that the range of experiments of the C/F process did not affect the removal efficiency of the reagent with the studied operational parameters. So, it could be concluded that the range of experimentation for this series was optimal.
When considering the numerical analysis of the series, it was found that the experiments with RMS of 200 and 225 rpm reached the highest values of elimination of turbidity, COD, and TSS. On the other hand, the Tukey test statistical analysis determined that all the experiments in the series were equivalent in the case of TSS elimination values. In the case of turbidity removal, experiments with RMS of 125, 175, 200, 225, and 250 rpm were statistically equivalent. In the same way, Tukey’s test determined that the experiments with RMS of 200, 225, and 250 rpm were statistically significant concerning the rest of the series for the elimination of COD.
In the same way as in Series # 4, the experiment that supposed the highest removal efficiency of all parameters with a lower experimental energy consumption was selected; this corresponded to the experiment with a RMS of 200 rpm.
Therefore, the experiment with a fast speed of 200 rpm was considered optimal for Series # 5, achieving an efficiency of 50.5 ± 0.1%, 26.5 ± 0.1%, and 55.1 ± 5.8% for the removal of turbidity, COD, and TSS, respectively.
The results of the five series studied are analyzed in the next section. These are called optimal operation parameters and C/F process final removal efficiency. This next section pretends to determine the optimal operation parameters of the C/F process considering the optimal removal values obtained from Section 3.2.1, Section 3.2.2, Section 3.2.3, Section 3.2.4 and Section 3.2.5, to obtain the final process removal efficiency for the C/F process.
3.3. Optimal Operation Parameters and C/F Process Final Removal Efficiency
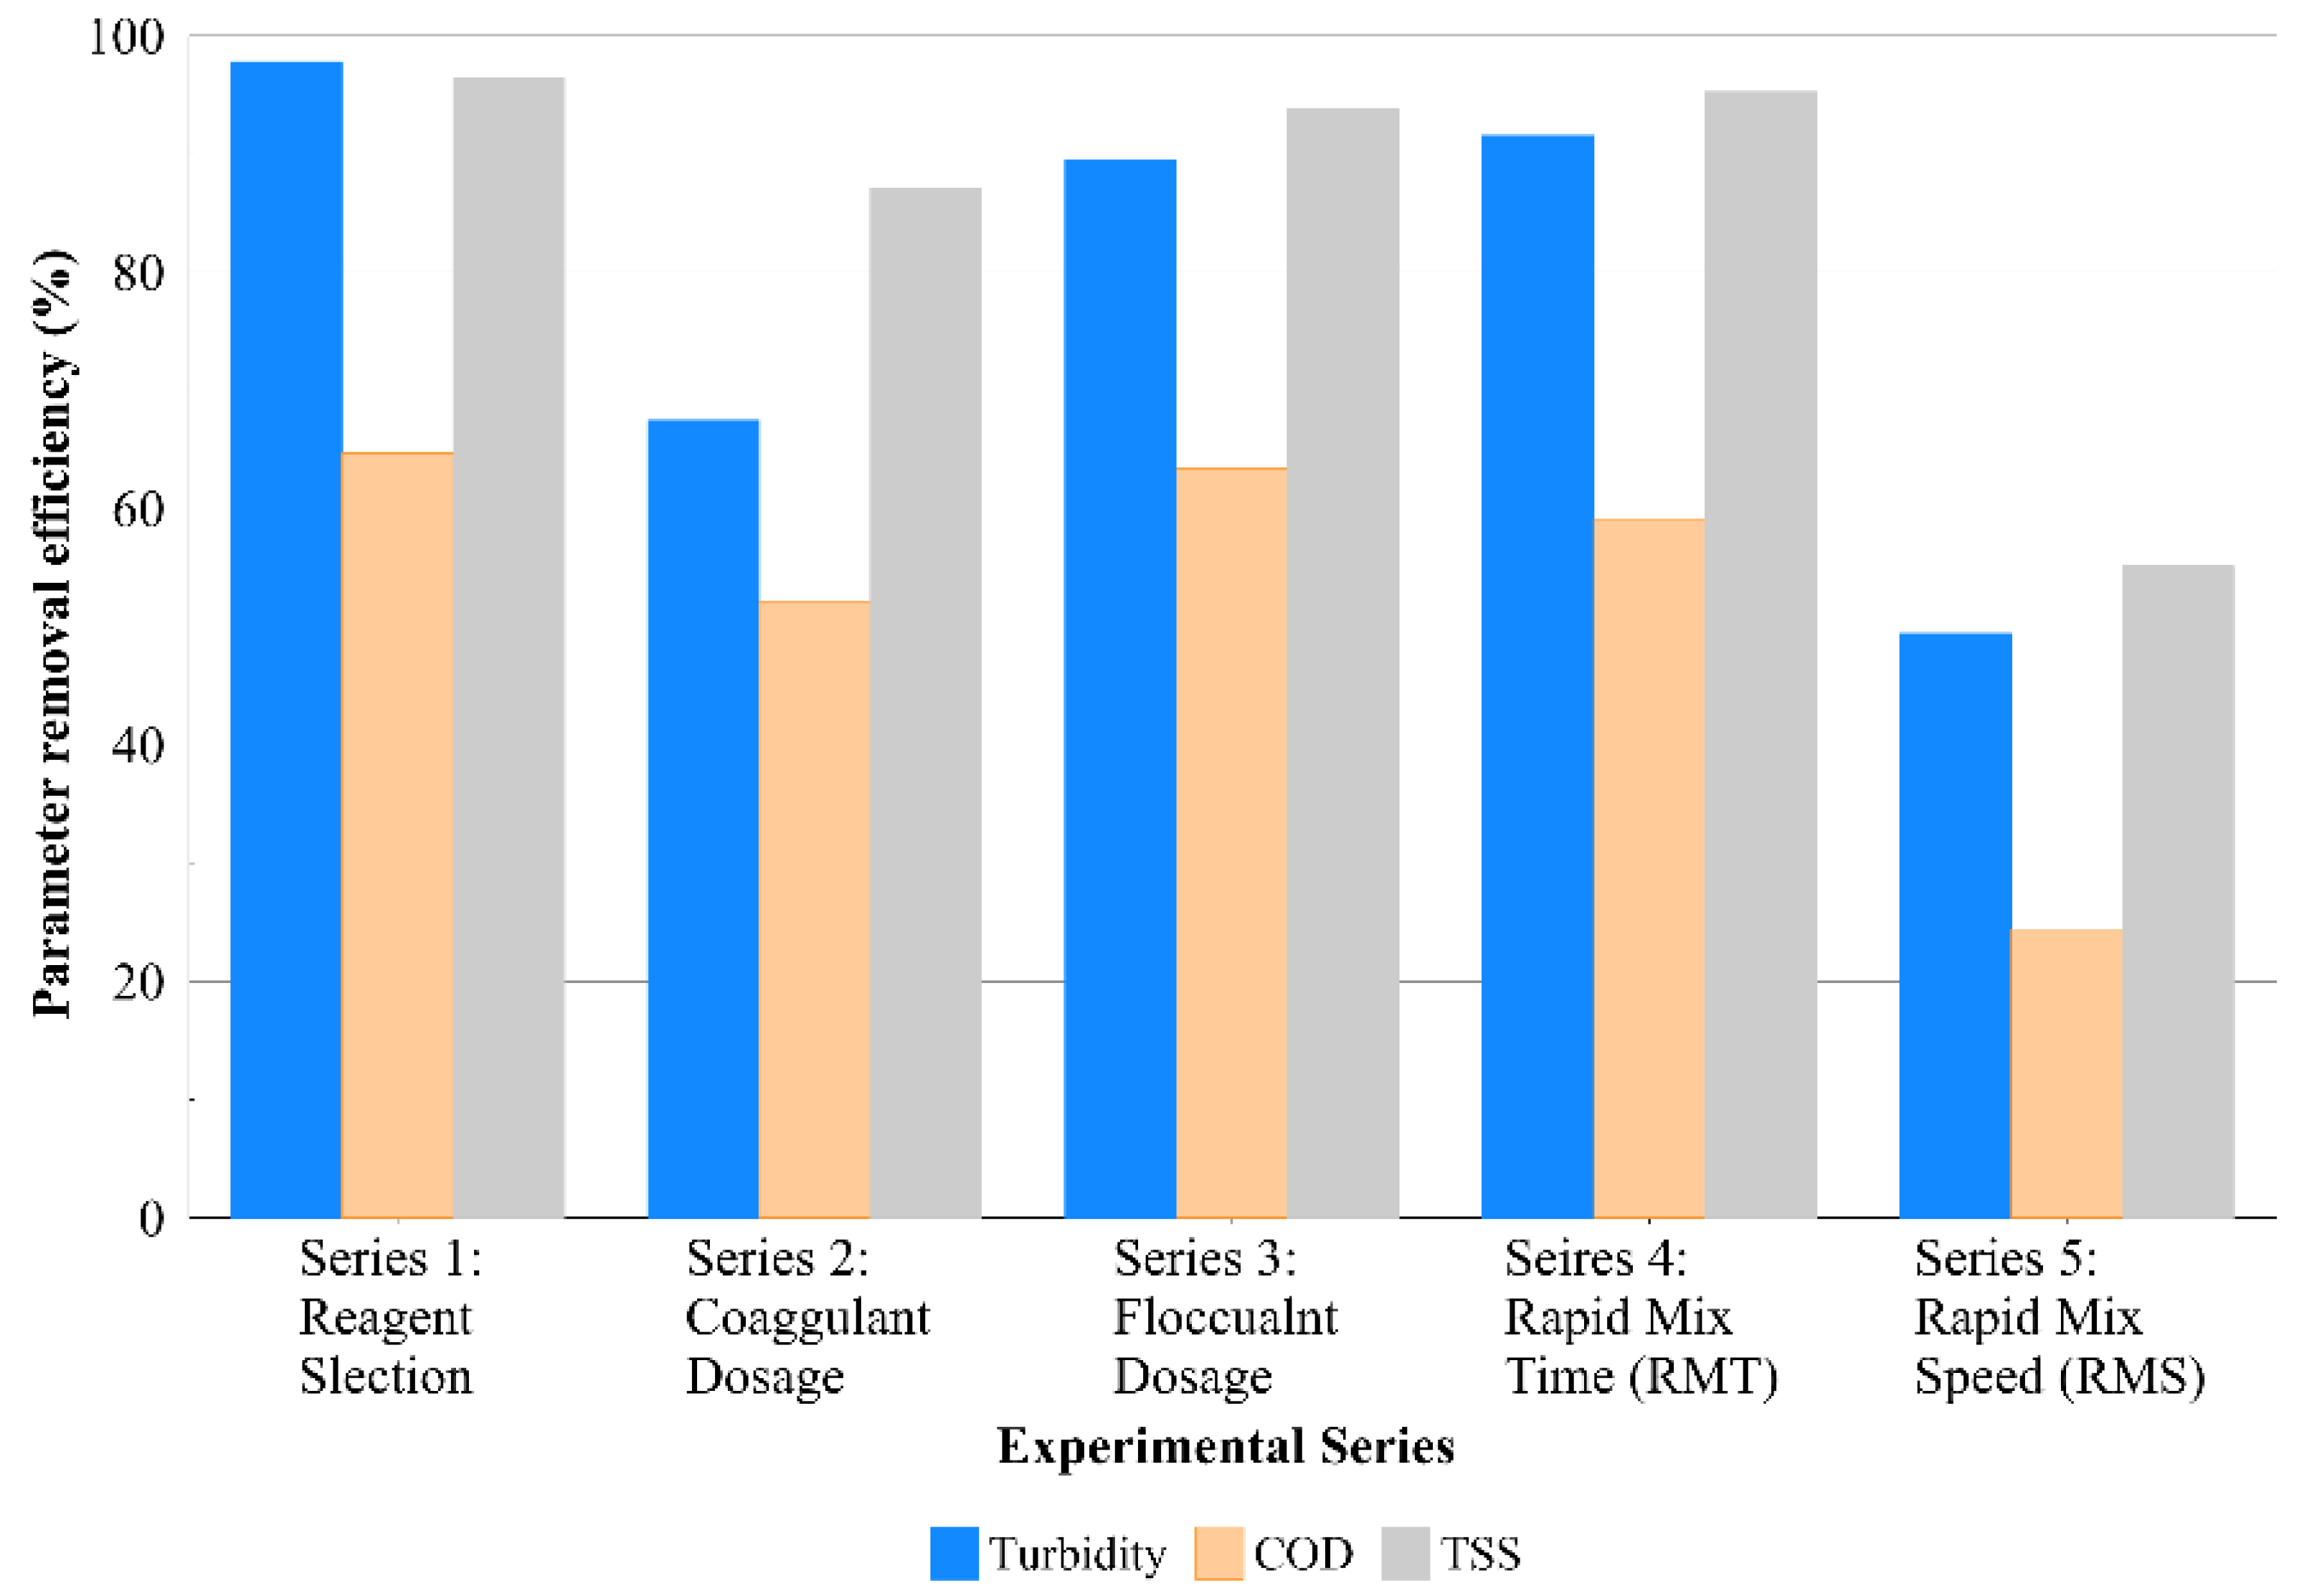
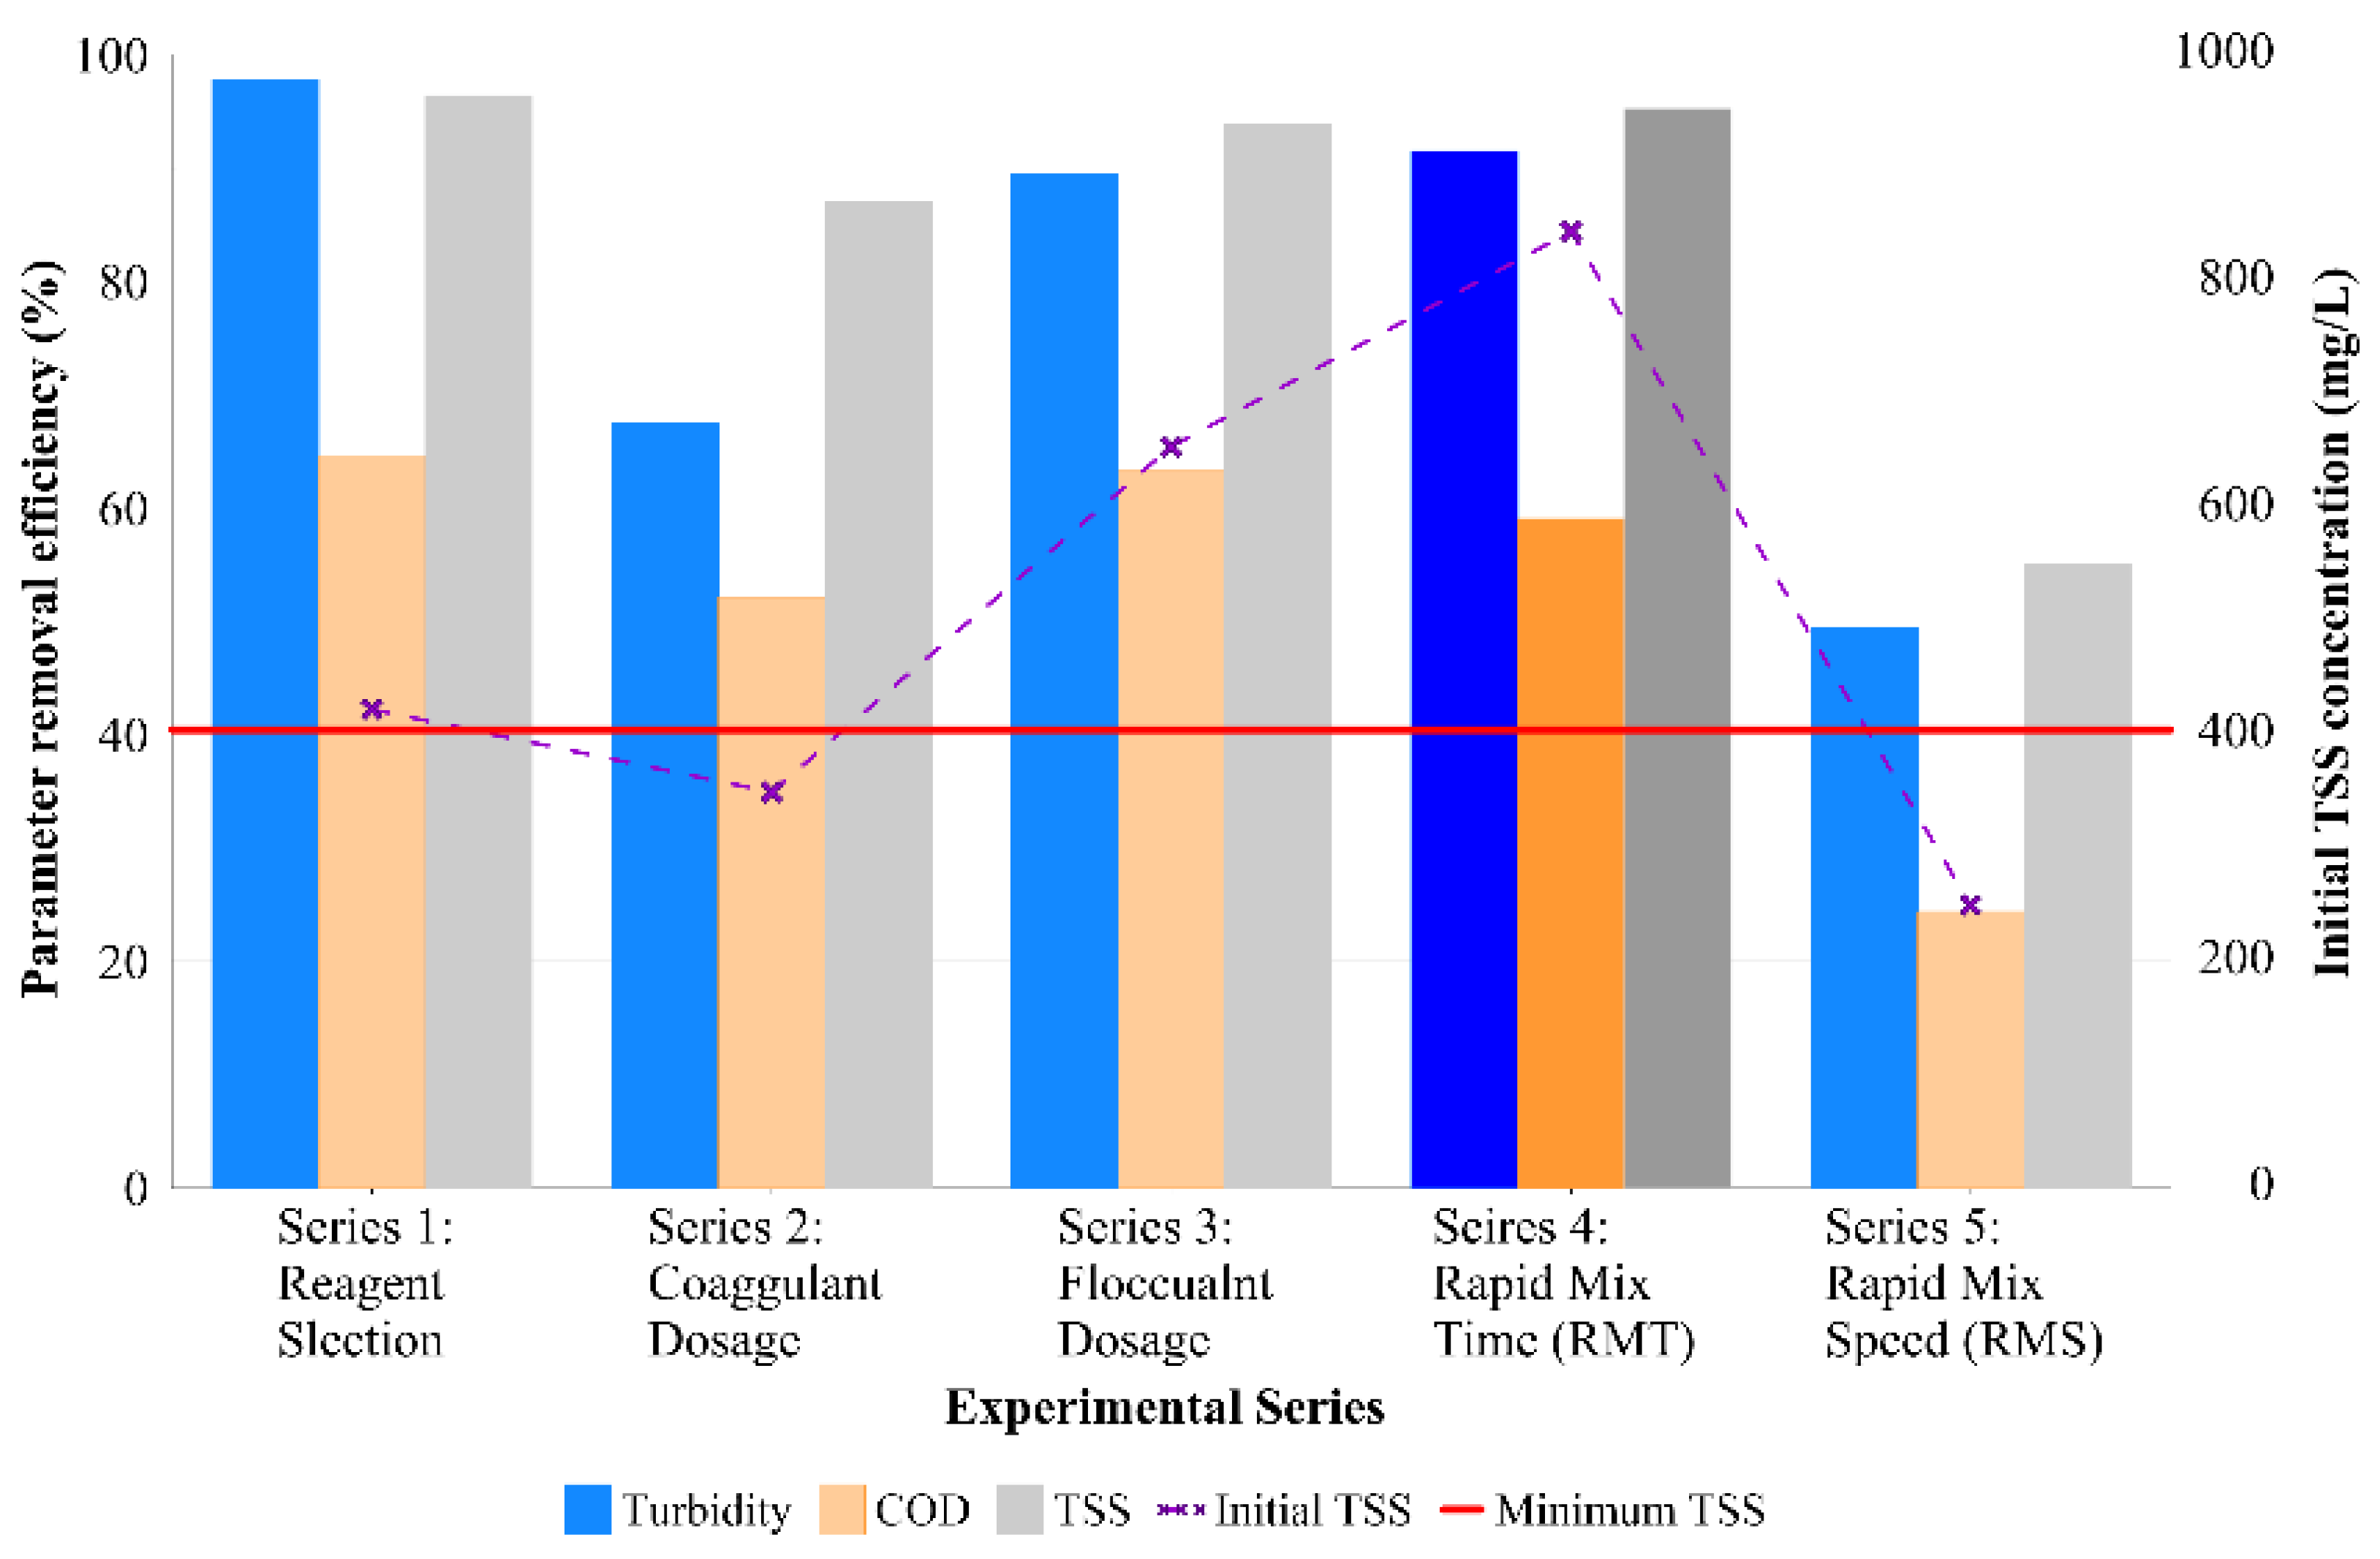
Once all the experiments foreseen in the experimental matrix were carried out, the mean removal efficiency values for turbidity, COD, and TSS from all five series studied are shown in Figure 9.
As seen in Figure 9, the removal efficiencies obtained by Series # 1, # 3, and # 4 were very similar. In contrast, Series # 2 obtained very similar removal values in terms of COD and TSS, but not turbidity removal, for which a notable reduction was observed in comparison to these three series. Finally, it was observed that the removal efficiency obtained by Series # 5 was much lower than the rest of the series of the experimental process. As mentioned above, the residual water samples for Series # 2 and # 5 were subjected to a previous decantation process. Therefore, the reduction in efficiency was related to the characteristics of the centrate current.
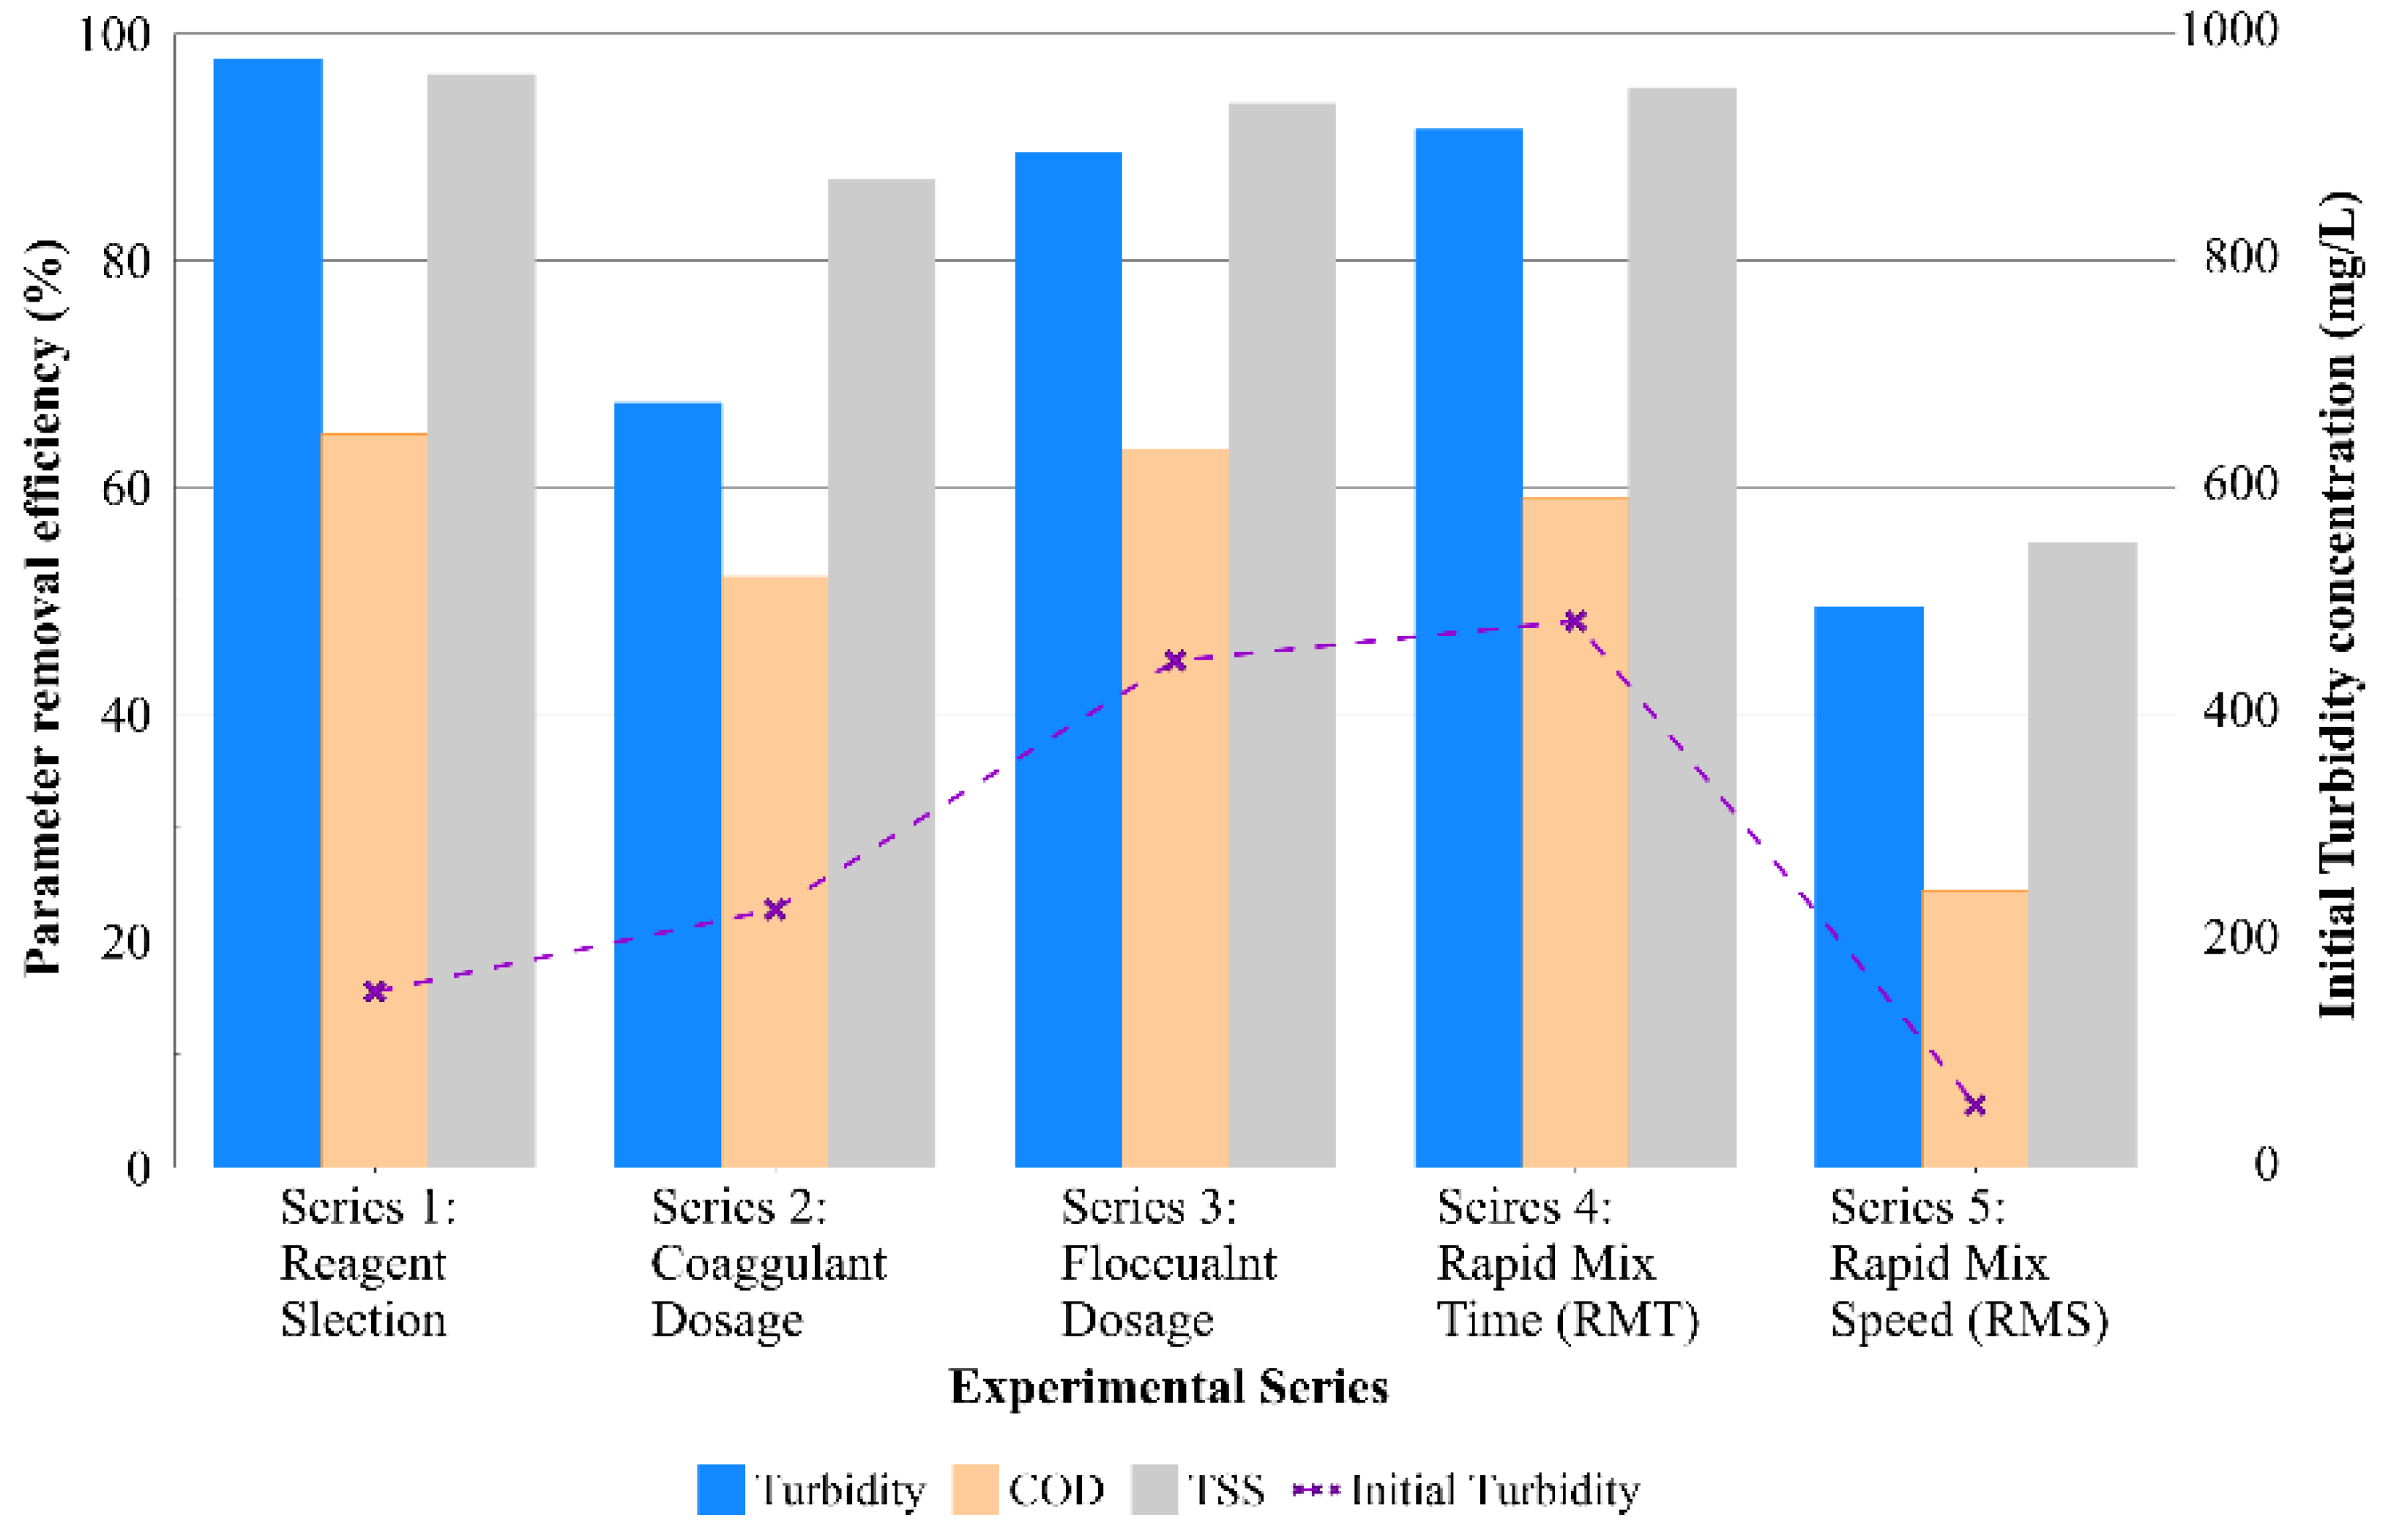
3.3.1. Evaluation of Initial Turbidity, COD, and TSS Effects on the C/F Process
As mentioned above, the removal efficiency for each experimental series was conditioned by the characteristics of the initial centrate current concerning the experimental process implemented in the studied experimental series.
Therefore, the removal efficiency values for all the series were analyzed, considering the WW’s initial turbidity, as shown in Figure 10.
It is observed in Figure 10 that the initial turbidity value was variable depending on the experimental process. For instance, the initial turbidity value of Series # 5 was much lower than for the rest of the series. However, this parameter cannot be directly related to the reduction in the elimination efficiency of the control parameters. In fact, the initial turbidity value of Series # 1 was lower than that of Series # 2, # 3, and # 4. Meanwhile, its efficiency value of elimination of the parameters was like these last two series but not to the one obtained in Series # 2, where this reduction was appreciated, especially in the elimination of turbidity. Therefore, it was determined that the variation in the initial turbidity value did not affect or limit the removal efficiency of the control parameters.
In the same way, the effect of the WW initial COD concentration on the removal efficiency for each studied series was analyzed and represented in Figure 11.
When analyzing the initial COD values for the experimental process, represented graphically in Figure 11, it can be observed that the initial values of this parameter were similar in Series # 2, # 3, # 4, and # 5, while Series # 1 presented a much lower value. However, the reduction in efficiency in the elimination of the studied parameters occurred in Series # 2 and # 5, so it was determined that the variation in the initial value of COD did not affect or limit the efficiency of elimination of the control parameters.
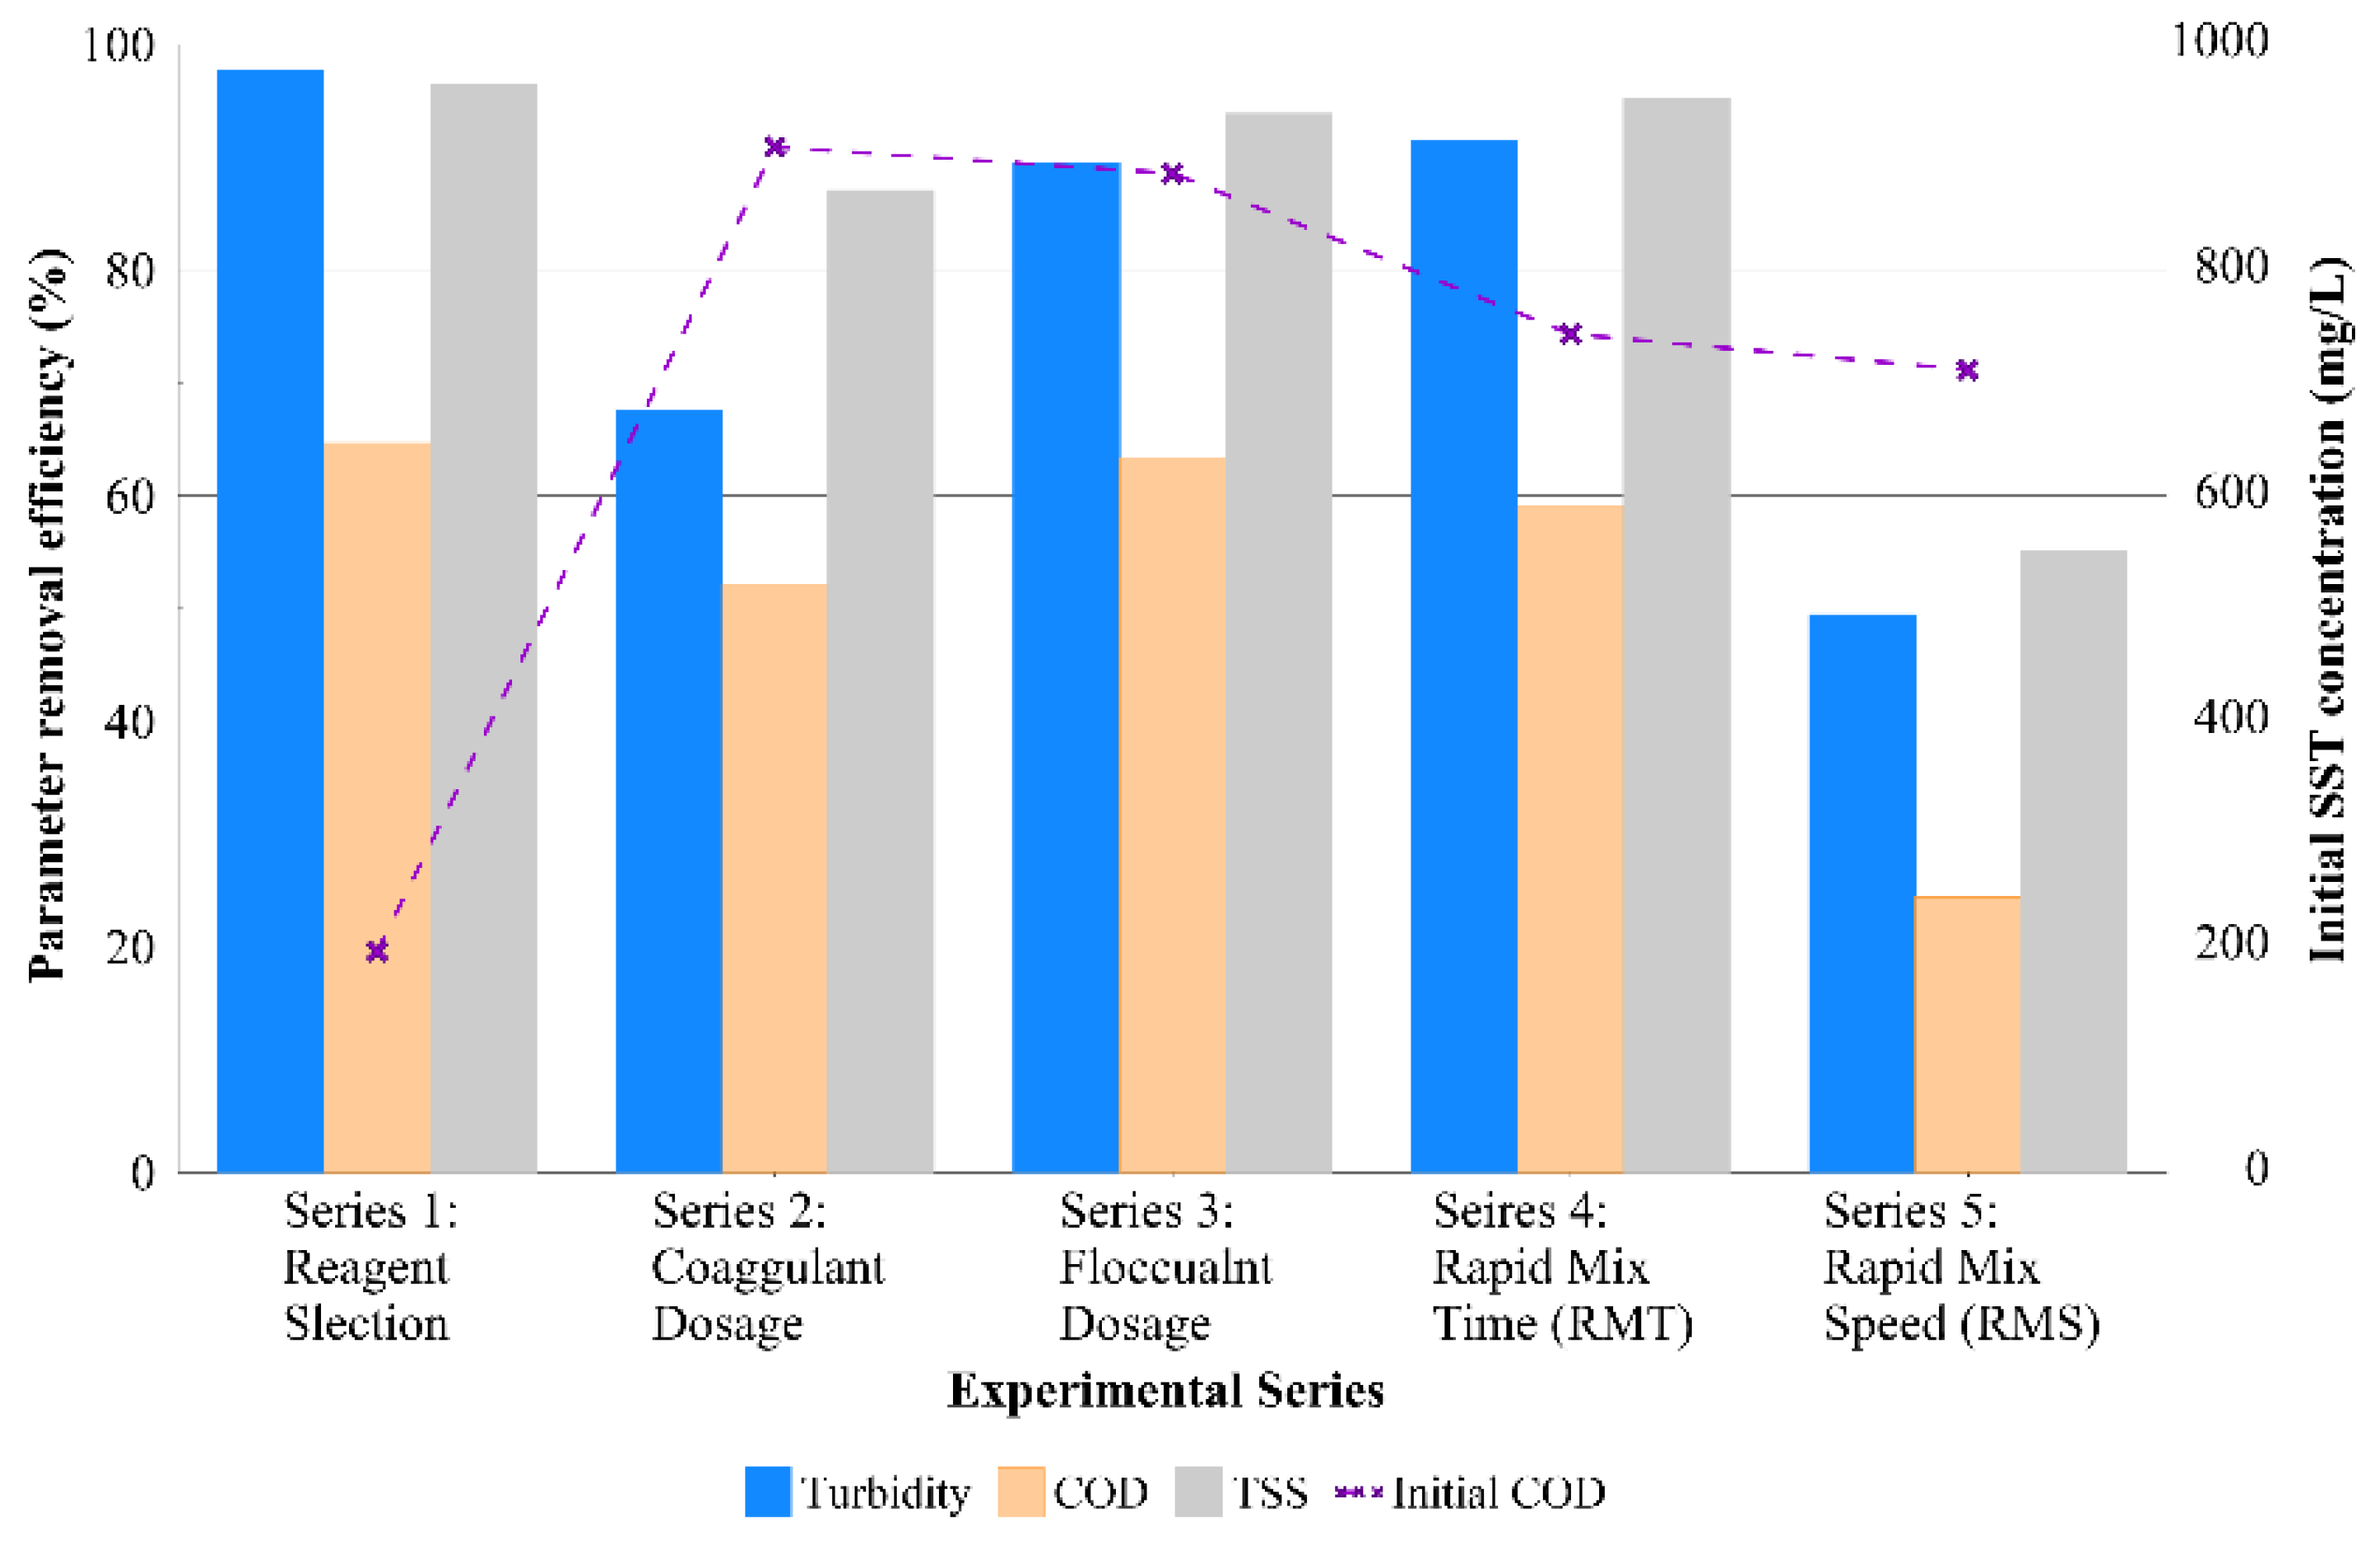
Finally, the effect of the WW initial TSS concentration on the removal efficiency for each studied series was analyzed and represented in Figure 12.
When analyzing the results shown in Figure 12, it was observed that the series that obtained similar efficiencies (Series # 1, # 3, and # 4) corresponded to initial TSS values greater than 400 mg/L; whereas Series # 2, whose reduction in the efficiency of elimination of parameters was slightly lower (except for the elimination of turbidity), corresponded to an initial TSS value of 345 mg/L. Finally, Series # 5, whose reduction in the removal efficiency of parameters was markedly higher, corresponded to an initial value of TSS of 245 mg/L.
Therefore, it was deduced that the efficiency of the C/F process was sensitive to the initial value of TSS in the sidestream, with a reduction in the elimination values of the control parameters in values lower than 400 mg/L, as is observed in Figure 12.
In conclusion, it was determined not to consider the removal efficiencies obtained by Series # 5 due to the influence of the initial concentration of TSS on this series, but only to consider the optimal RMS for the C/F operational parameters.
3.3.2. Final Operational Parameters and Removal Efficiency of the C/F Process
Once the effect of the initial parameters on the C/F process was analyzed, it was concluded that the selected operational parameters reached a high level of removal efficiency for the control parameters.
As mentioned above, all the optimal values from the experimental series were considered to determine the final operational parameters of the C/F process. These optimal values are presented in Table 10.
From the operating parameters shown in Table 10, the final efficiency of the C/F process optimization reached the following elimination values, shown in Table 11.
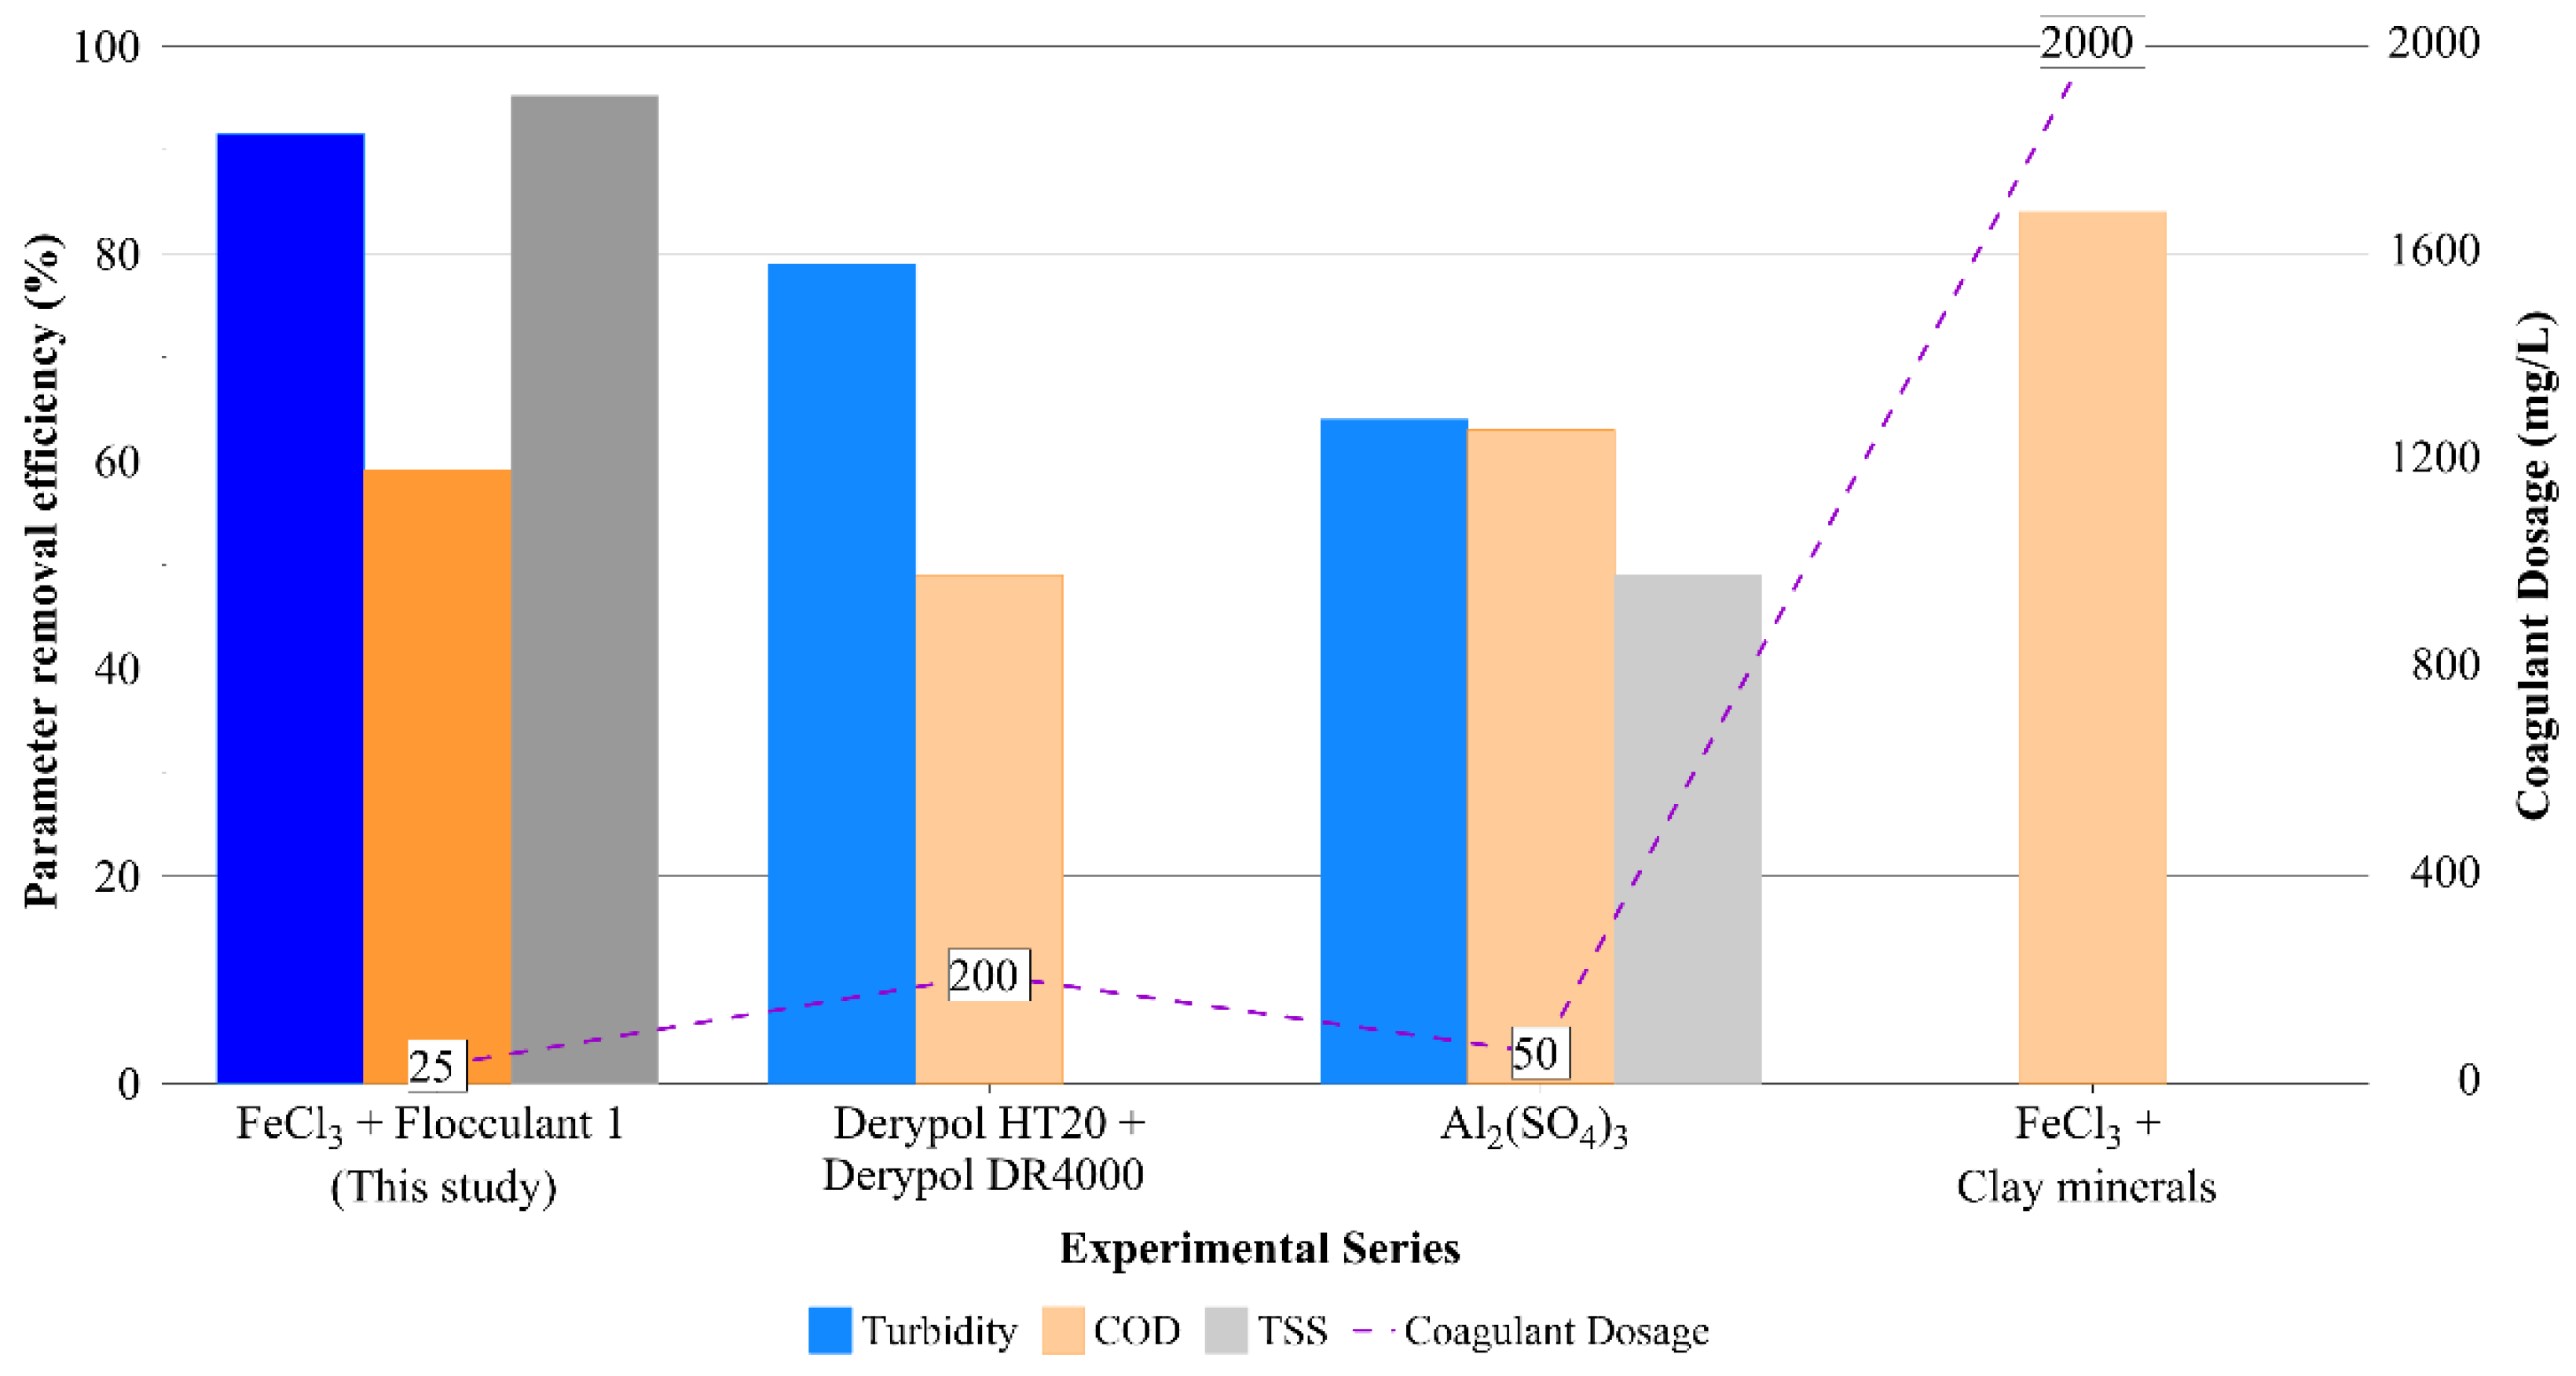
Finally, the results obtained by the C/F optimization process (Table 11) were compared to the different bibliographic references to determine their importance and potential use. First, the optimized C/F removal values were compared to the same studies from Section 2.2.1, as shown in Figure 13.
As seen in Figure 13, the results of the optimization of the C/F process in this study were superior in eliminating turbidity and TSS, compared with selected studies from the literature. This selection was made according to the three best studies, which offered a better removal efficiency–reagent dosage relation, in Section 2.2.1.
Regarding the efficiency of COD removal, this study obtained a similar value to the study that used Al2(SO4)3, but with a dosage of coagulant twice lower; as well as an 80-times lower dosage than the study that used FeCl3. Although the effectiveness of different doses (not active ion, but salt) for different wastewater cannot be compared, this analogy was made to highlight the good efficiency/dosage relation found in this work. Overall, it can be concluded that values corresponding to removal efficiency and reagent material dosage achieved in this study were superior in comparison to the bibliographic studies.
The use of FeCl3 as a coagulant reagent for this optimization coincide with what was mentioned by Chellam et al. [35] and Sun et al. [36], who commented that it is usual to prefer the use of iron-based coagulants due to the high concentrations of contaminants in municipal wastewater.
Additionally, the high removal value for turbidity (91%) and TSS (95%) agree with Abdessemed et al. [37]. In their work, it was concluded that the removal of suspended and organic material plays a crucial role in the efficiency of nutrient separation by UF, whose theoretical modeling will be carried out in the next section.
3.4. Theoretical Comparison with the Ion-Exchange Process
Wongcharee et al. [38] work was analyzed for this final stage of the study. This study showed the increase in ammonium recovery using technology called enhanced coagulation with ion exchange (IX). Enhanced coagulation refers to improving the amount of organic matter removed with excess coagulating material or combining this material with another with greater adsorption power [38].
This study analyzed the separation and combination effect of the C/F process with Alumina as coagulating material, and the IX process with a compound of zeolite and activated carbon known as ACZ for its acronym (Activated Carbon–Zeolite composite) as IX adsorbent material.
Therefore, the first theoretical comparison was made between the organic matter removal results of the study performed by Wongcharre et al. [38] and the optimized C/F process, as well as the NH4+ removal results of this work (Table 12).
Table 12 shows the efficiency values for removing turbidity, COD, and NH4+ obtained by Wongcharee et al. [38]. Although these results were based on a surface water stream, the similarity to the COD removal and turbidity values (as an indirect indicator of the suspended matter) achieved in this study indicated the positive effect that the C/F offers to the NH4+ recovery, for ion exchange processes with zeolites, as a feasible pretreatment instead of Alumina.
Therefore, the experimental process proposed in this study is theoretically compatible with increasing the efficiency of ammonium recovery through combined use with the zeolite IX process up to theoretical values of approximately 75%.
However, the subsequent execution of the optimized C/F process, in addition to zeolite IX, is necessary to determine the ammonium recovery values that the optimized C/F process of this study can achieve through the enhanced C/F process.
On the other hand, Sancho Lacalle et al. [18] analyzed and validated a new configuration for WWTP based on an ion IX unit to recover inorganic forms of nitrogen, such as ammonia.
Within the study, a pretreatment stage was carried out to protect the IX columns with zeolites through a slow filtration (SF) unit by using a filter glass plate, and another UF unit from five columns of hollow fiber membranes. The results of the removal of COD and turbidity obtained using Sancho Lacalle et al. [18] proposed pretreatment is found in Table 13, along with the results obtained in this study.
As observed in Table 13, the removal efficiencies for turbidity and COD achieved by the pretreatment proposed by Sancho Lacalle et al. [18] were remarkably like the efficiencies obtained by the C/F process optimized in this present study. Therefore, it is concluded that the C/F process could replace the SF + UF process as a pretreatment of the IX process.
Sancho Lacalle et al. [18] also determined the removal-efficiency values of the ion-exchange process with zeolites. This process was conducted using columns with natural granular clinoptilolite and reached efficiency in the elimination of turbidity, COD, and NH4+ of 50.0%, 24.1%, and 98.1%, respectively.
In another study carried out by Vecino et al. [21], a NH4+ recovery value of 76.1% was reported using hollow fiber liquid–liquid membrane contactors (HF-LLMC) from a stream rich in ammonia obtained from a regeneration process with zeolites and sodium hydroxide (NaOH) after the IX process.
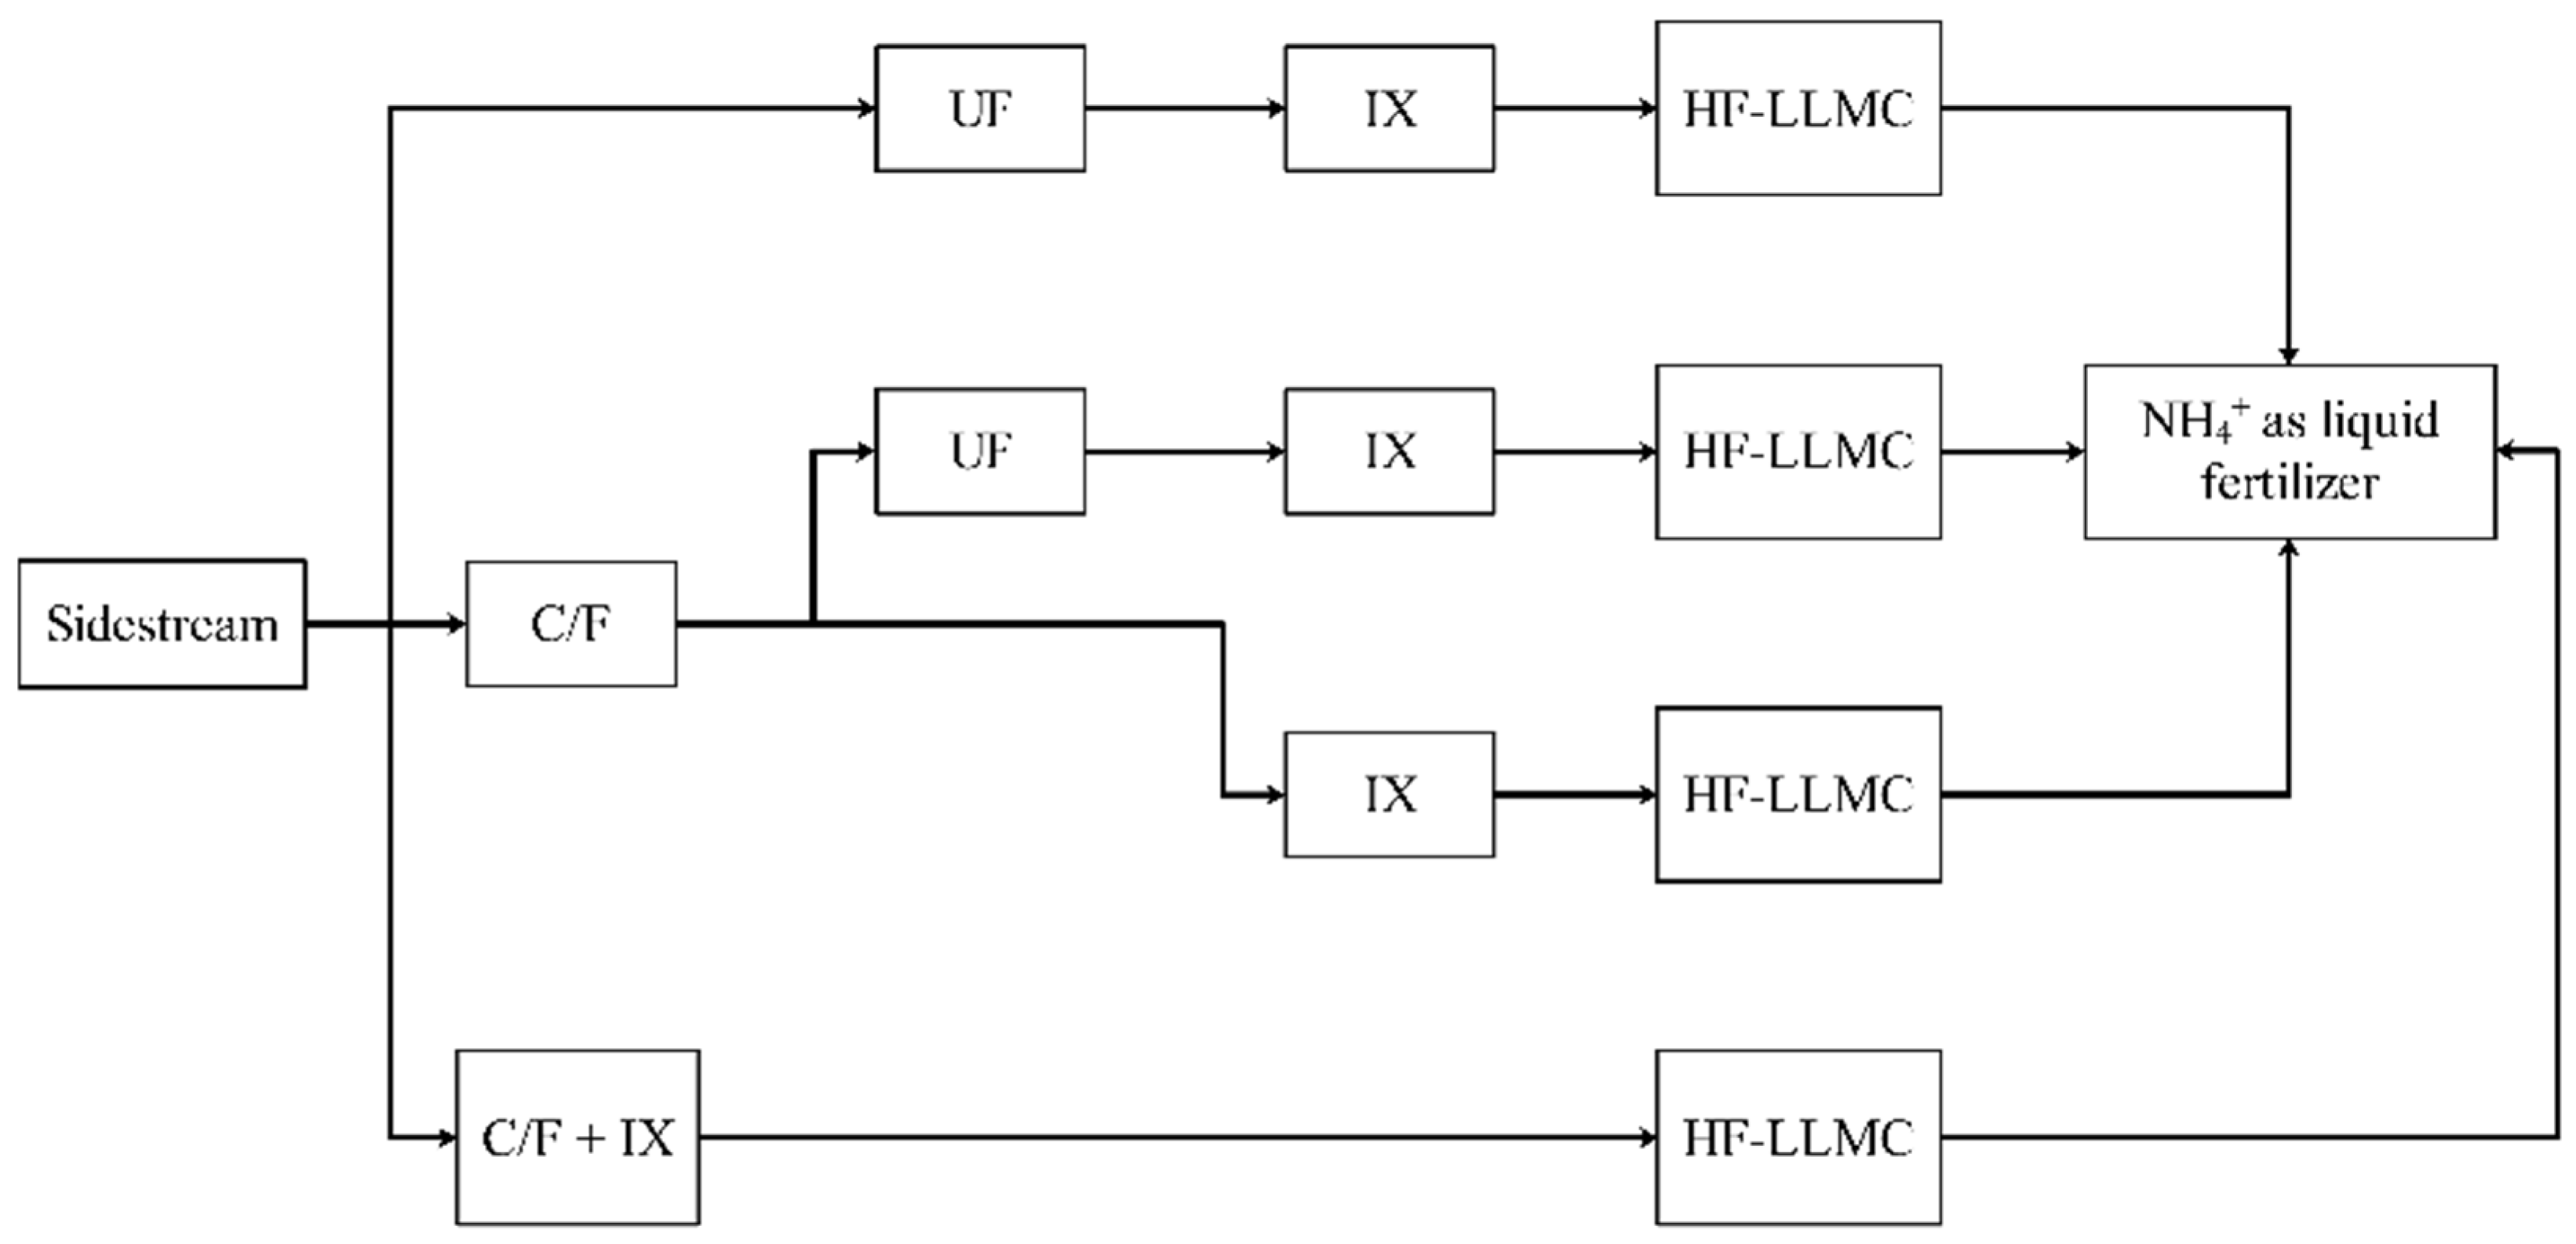
Considering the results of these studies, theoretical calculations of NH4+ recovery for its use as a liquid fertilizer were carried out. These calculations were based on the data obtained in the optimized C/F process for the efficiency of parameters removal; in conjunction with the results discussed in this section for the UF, IX, and HF-LLMC processes, considering four treatment lines detailed below:
- UF + IX process.
- C/F optimized process + UF + IX stage.
- C/F optimized process + IX stage.
- Enhanced C/F process (optimized C/F process + IX).
Following these four treatment lines, the recovery of NH4+ would be completed with a membrane contactor process (HF-LLMC).
The scheme proposed for these four lines of treatment is represented in Figure 14.
The considerations made for this theoretical mass balance and calculation are listed below:
- The removal efficiency values of the control parameters (COD, TSS, and turbidity) of the optimized C/F process were assumed from the results of this study.
- The NH4+ removal value for the UF process was also found in Sancho Lacalle et al. study [18], with a value of 8.8%.
- For the IX stage, the removal efficiency values for turbidity, COD, and NH4+ were found in the same study and commented on previously in this work.
- Finally, the NH4+ recovery value for the HF-LLMC process (76.1%) corresponded to that found in the study by Vecino et al. [21].
All these values are tabulated in Table 14 below.
Once the treatment lines and the theoretical considerations of the calculation were established, the final removal values of the control parameters and the final NH4+ recovery were calculated. The detail of this mass balance is plotted in Figure 15.
Figure 15 shows the theoretical recovery values of NH4+ from the four treatment lines, which oscillate between 460.5–570.6 mgNH4+/L. The highest recovery value (570.6 mgNH4+/L) was found in the line corresponding to the optimized C/F process (this work), followed by an IX process for final ammonia recovery employing the HF-LLMC process. Therefore, the optimized C/F process is theoretically compatible with replacing the SF + UF processes proposed for the wastewater stream analyzed by Sancho Lacalle et al. [18].
4. Conclusions
This work developed the optimization of the C/F process for urban WW’s sidestream to improve the quality of this stream and to make it possible to integrate a recovery stage with ion exchange.
Once the optimization of the C/F process for this study was completed, high final removal efficiencies were obtained: 91.5 ± 0.4%, 59.1 ± 1.7%, and 95.2 ± 0.1% for the removal of turbidity, COD, and TSS, respectively. These efficiencies were achieved using a dosage of 25 mg/L of FeCl3 and 25 mg/L of Flocculant 1 (with a concentration of SiO2 (3%) + Al2(SO4)3 (64.5%) + Fe2O3 (32.5%)), via a rapid mixing process of 1 min at 200 rpm and a slow mixing process of 30 min at 30 rpm, followed by a final settling of 30 min.
On the other hand, it was found that an initial TSS concentration in the sidestream less than 400 mg/L, resulting from the previous 18 h’ settling process, produces a reduction in these efficiencies. Therefore, it was concluded that it was possible to apply a settling process for the sidestream whose concentration of control parameters is remarkably high if this process is controlled to avoid initial TSS concentration values lower than 400 mg/L.
Finally, it was concluded that these efficiencies are theoretically compatible with increasing the NH4+ recovery efficiency up to 71.4% in the ion-exchange process with zeolites IX and HF-LLMC processes. In addition, the high efficiency value in the elimination of TSS supposes a reduction in the dimensioning of the UF process, which is needed to recover NH4+ using membrane contactors.
Author Contributions
Conceptualization, X.V., M.R.; methodology, A.B., X.V., M.R.; validation, X.V., M.R.; formal analysis, A.B.; investigation, A.B.; resources, J.L.C.; data curation, A.B., X.V., M.R.; writing—original draft preparation, A.B.; writing—review and editing, X.V., M.R.; visualization, A.B., X.V., M.R.; supervision, X.V., M.R., J.L.C.; project administration, J.L.C.; funding acquisition, J.L.C. All authors have read and agreed to the published version of the manuscript.
Funding
This research was funded by the Spanish Ministry of Science and Innovation (No.PID2020-114401RB-C21 and No.PID2019-103873RJ-I00); Catalan Government (No.2017-SGR-312 and No.COMR DI16-1-0061-02) and European Commission (H2020) (No.823971, H2020-MSCA-RISE-2018-823971).
Data Availability Statement
Not applicable.
Acknowledgments
Xanel Vecino acknowledges the Spanish Ministry of Science and Innovation for her financial support under the project PID2019-103873RJ-I00. Authors would like to thank the project “RIS3CAT Digestake” (ref. COMRDI16-1-0061-02) supported by the Acció-Generalitat de Catalunya. Additionally, the authors acknowledge the Open Innovation–Research Translation and Applied Knowledge Exchange in Practice through University–Industry Cooperation (OpenInnoTrain), Grant agreement number (GAN): 823971, H2020-MSCA-RISE-2018-823971. The authors would also like to acknowledge Miguel Aguilar for his contribution to the project.
Conflicts of Interest
The authors declare no conflict of interest. The funders had no role in the design of the study; in the collection, analyses, or interpretation of data; in the writing of the manuscript; or in the decision to publish the results.
References
- Metcalf, L.; Eddy, H.P.; Abu-Orf, M.; Bowden, G.; Burton, F.L.; Pfrang, W.; Stensel, H.D.; Tchobanoglous, G.; Tsuchihashi, R.; Aecom. Wastewater Engineering Treatment and Resource Recovery, 5th ed.; McGraw-Hiil Education: New York, NY, USA, 2014; p. 2044. [Google Scholar]
- Phillips, H.M.; Kobylinski, E.; Barnard, J.; Eng, P.; Wallis-lage, C. Nitrogen and Phosphorus-Rich Sidestreams: Managing the Nutrient Merry-Go-Round. Proc. Water Environ. Fed. 2006, 2006, 5282–5304. [Google Scholar] [CrossRef]
- Zou, S.; Qin, M.; Moreau, Y.; He, Z. Nutrient-energy-water recovery from synthetic sidestream centrate using a microbial electrolysis cell—Forward osmosis hybrid system. J. Clean. Prod. 2017, 154, 16–25. [Google Scholar] [CrossRef] [Green Version]
- Kim, Y.M.; Chon, D.-H.; Kim, H.-S.; Park, C. Investigation of bacterial community in activated sludge with an anaerobic side-stream reactor (ASSR) to decrease the generation of excess sludge. Water Res. 2012, 46, 4292–4300. [Google Scholar] [CrossRef]
- Kassouf, H.; García Parra, A.; Mulford, L.; Iranipour, G.; Ergas, S.J.; Cunningham, J.A. Mass fluxes of nitrogen and phosphorus through water reclamation facilities: Case study of biological nutrient removal, aerobic sludge digestion, and sidestream recycle. Water Environ. Res. 2020, 92, 478–489. [Google Scholar] [CrossRef] [PubMed]
- Lackner, S.; Terada, A.; Smets, B.F. Heterotrophic activity compromises autotrophic nitrogen removal in membrane-aerated biofilms: Results of a modeling study. Water Res. 2008, 42, 1102–1112. [Google Scholar] [CrossRef] [PubMed]
- Hauck, M.; Maalcke-Luesken, F.A.; Jetten, M.S.M.; Huijbregts, M.A.J. Removing nitrogen from wastewater with side stream anammox: What are the trade-offs between environmental impacts? Resour. Conserv. Recycl. 2016, 107, 212–219. [Google Scholar] [CrossRef] [Green Version]
- Münch, E.V.; Barr, K. Controlled struvite crystallisation for removing phosphorus from anaerobic digester sidestreams. Water Res. 2001, 35, 151–159. [Google Scholar] [CrossRef]
- Water Environment Federation; American Society of Civil Engineers; Environmental and Water Resources Institute. Biological Nutrient Removal (BNR) Operation in Wastewater Treatment Plants; McGraw-Hill: New York, NY, USA, 2005. [Google Scholar]
- Rodriguez-Garcia, G.; Frison, N.; Vázquez-Padín, J.R.; Hospido, A.; Garrido, J.M.; Fatone, F.; Bolzonella, D.; Moreira, M.T.; Feijoo, G. Life cycle assessment of nutrient removal technologies for the treatment of anaerobic digestion supernatant and its integration in a wastewater treatment plant. Sci. Total Environ. 2014, 490, 871–879. [Google Scholar] [CrossRef] [PubMed]
- Hermassi, M.; Dosta, J.; Valderrama, C.; Licon, E.; Moreno, N.; Querol, X.; Batis, N.H.; Cortina, J.L. Simultaneous ammonium and phosphate recovery and stabilization from urban sewage sludge anaerobic digestates using reactive sorbents. Sci. Total Environ. 2018, 630, 781–789. [Google Scholar] [CrossRef] [PubMed]
- Zelm, R.; Seroa da Motta, R.d.P.; Lam, W.Y.; Menkveld, W.; Broeders, E. Life cycle assessment of side stream removal and recovery of nitrogen from wastewater treatment plants. J. Ind. Ecol. 2020, 24, 913–922. [Google Scholar] [CrossRef]
- Hall, M.R.; Priestley, A.; Muster, T.H. Environmental Life Cycle Costing and Sustainability: Insights from Pollution Abatement and Resource Recovery in Wastewater Treatment. J. Ind. Ecol. 2018, 22, 1127–1138. [Google Scholar] [CrossRef]
- Ye, Y.; Ngo, H.H.; Guo, W.; Liu, Y.; Chang, S.W.; Nguyen, D.D.; Liang, H.; Wang, J. A critical review on ammonium recovery from wastewater for sustainable wastewater management. Bioresour. Technol. 2018, 268, 749–758. [Google Scholar] [CrossRef] [PubMed]
- Wan, C.; Ding, S.; Zhang, C.; Tan, X.; Zou, W.; Liu, X.; Yang, X. Simultaneous recovery of nitrogen and phosphorus from sludge fermentation liquid by zeolite adsorption: Mechanism and application. Sep. Purif. Technol. 2017, 180, 1–12. [Google Scholar] [CrossRef]
- Manto, M.J.; Xie, P.; Keller, M.A.; Liano, W.E.; Pu, T.; Wang, C. Recovery of ammonium from aqueous solutions using ZSM-5. Chemosphere 2018, 198, 501–509. [Google Scholar] [CrossRef] [PubMed]
- Bashir, M.J.K.; Aziz, H.A.; Yusoff, M.S.; Adlan, M.N. Application of response surface methodology (RSM) for optimization of ammoniacal nitrogen removal from semi-aerobic landfill leachate using ion exchange resin. Desalination 2010, 254, 154–161. [Google Scholar] [CrossRef]
- Sancho Lacalle, I. Towards the Wastewater Treatment Plant of the Future: Integration of Carbon Redirection and Nitrogen Recovery Technologies. Ph.D. Thesis, Universitat Politècnica de Catalunya, Barcelona, Spain, 2018. [Google Scholar]
- Sancho, I.; Licon, E.; Valderrama, C.; de Arespacochaga, N.; Lopez-Palau, S.; Cortina, J.L. Recovery of ammonia from domestic wastewater effluents as liquid fertilizers by integration of natural zeolites and hollow fibre membrane contactors. Sci. Total Environ. 2017, 584–585, 244–251. [Google Scholar] [CrossRef]
- Vecino, X.; Reig, M.; Bhushan, B.; Gibert, O.; Valderrama, C.; Cortina, J.L. Liquid fertilizer production by ammonia recovery from treated ammonia-rich regenerated streams using liquid-liquid membrane contactors. Chem. Eng. J. 2019, 360, 890–899. [Google Scholar] [CrossRef]
- Vecino, X.; Reig, M.; Gibert, O.; Valderrama, C.; Cortina, J.L. Integration of liquid-liquid membrane contactors and electrodialysis for ammonium recovery and concentration as a liquid fertilizer. Chemosphere 2020, 245, 125606. [Google Scholar] [CrossRef]
- Meyn, T.; Leiknes, T. Comparison of optional process configurations and operating conditions for ceramic membrane MF coupled with coagulation/flocculation pre-treatment for the removal of NOM in drinking water production. J. Water Supply Res. Technol.-AQUA 2010, 59, 81–91. [Google Scholar] [CrossRef]
- Leiknes, T. The effect of coupling coagulation and flocculation with membrane filtration in water treatment: A review. J. Environ. Sci. 2009, 21, 8–12. [Google Scholar] [CrossRef]
- Yu, W.; Xu, L.; Qu, J.; Graham, N. Investigation of pre-coagulation and powder activate carbon adsorption on ultrafiltration membrane fouling. J. Membr. Sci. 2014, 459, 157–168. [Google Scholar] [CrossRef]
- Muiños Lázaro, L.; Cortina, J.L. Separación y Recuperación de Fosfato y Amonio de Purines Mediante Sorción con Zeolites Sintéticas. Master’s Thesis, Universitat Politècnica de Catalunya, Barcelona, Spain, 2016. [Google Scholar]
- Fragoso, R.A.; Duarte, E.A.; Paiva, J. Contribution of Coagulation—Flocculation Process for a More Sustainable Pig Slurry Management. Water Air Soil Pollut. 2015, 226, 131. [Google Scholar] [CrossRef]
- Teh, C.Y.; Wu, T.Y.; Juan, J.C. Potential use of rice starch in coagulation–flocculation process of agro-industrial wastewater: Treatment performance and flocs characterization. Ecol. Eng. 2014, 71, 509–519. [Google Scholar] [CrossRef]
- Verma, S.; Prasad, B.; Mishra, I.M. Pretreatment of petrochemical wastewater by coagulation and flocculation and the sludge characteristics. J. Hazard. Mater. 2010, 178, 1055–1064. [Google Scholar] [CrossRef]
- Aygun, A.; Yilmaz, T. Improvement of Coagulation-Flocculation Process for Treatment of Detergent Wastewaters Using Coagulant Aids. Int. J. Chem. Environ. Eng. Syst. 2010, 1, 97–101. [Google Scholar]
- Devesa-Rey, R.; Bustos, G.; Cruz, J.M.; Moldes, A.B. Evaluation of Non-Conventional Coagulants to Remove Turbidity from Water. Water Air Soil Pollut. 2012, 223, 591–598. [Google Scholar] [CrossRef]
- Lee, S.; Lee, D.K. What is the proper way to apply the multiple comparison test? Korean J. Anesthesiol. 2018, 71, 353–360. [Google Scholar] [CrossRef] [Green Version]
- Andía Cardenas, Y. Tratamiento de Agua: Coagulación y Floculación; SEDAPAL: Lima, Peru, 2000; p. 44. [Google Scholar]
- Wei, N.; Zhang, Z.; Liu, D.; Wu, Y.; Wang, J.; Wang, Q. Coagulation behavior of polyaluminum chloride: Effects of pH and coagulant dosage. Chin. J. Chem. Eng. 2015, 23, 1041–1046. [Google Scholar] [CrossRef]
- Díaz, M. Ecuaciones y Cálculos Para el Tratamiento de Aguas; Ediciones Paraninfo S.A.: Madrid, Spain, 2018; p. 617. [Google Scholar]
- Chellam, S.; Sari, M.A. Aluminum electrocoagulation as pretreatment during microfiltration of surface water containing NOM: A review of fouling, NOM, DBP, and virus control. J. Hazard. Mater. 2016, 304, 490–501. [Google Scholar] [CrossRef] [PubMed] [Green Version]
- Sun, Y.; Zhou, S.; Chiang, P.-C.; Shah, K.J. Evaluation and optimization of enhanced coagulation process: Water and energy nexus. Water-Energy Nexus 2019, 2, 25–36. [Google Scholar] [CrossRef]
- Abdessemed, D.; Nezzal, G.; Ben Aim, R. Coagulation-adsorption-ultrafiltration for wastewater treatment and reuse. Water Supply 2003, 3, 361–365. [Google Scholar] [CrossRef]
- Wongcharee, S.; Aravinthan, V.; Erdei, L. Removal of natural organic matter and ammonia from dam water by enhanced coagulation combined with adsorption on powdered composite nano-adsorbent. Environ. Technol. Innov. 2020, 17, 100557. [Google Scholar] [CrossRef]
Figure 1.
Comparison of the removal efficiency (%) of turbidity, COD, and TSS depending on each coagulant and its application dose (mg/L) for the bibliography studies: (1) Derypol® HT20 + Derypol® DR4000 [25], (2) Al2(SO4)3 [26], (3) Al2(SO4)3·18H2O [27], (4) FeCl3 [28], (5) FeCl3 + clay materials [29], (6) Lactic acid and (7) AlCl3 [30].

Figure 2.
General scheme of the study methodology developed in this work.

Figure 3.
Statistical analysis process scheme.

Figure 4.
C/F process removal efficiency from coagulant and flocculant reagents variation. Different Latin letters indicate significant differences among coagulant and flocculant reagents (t-test; p = 0.05).
Figure 4.
C/F process removal efficiency from coagulant and flocculant reagents variation. Different Latin letters indicate significant differences among coagulant and flocculant reagents (t-test; p = 0.05).

Figure 5.
C/F process removal efficiency from coagulant dosage variation. Different Latin letters indicate significant differences among coagulant dosage (t-test; p = 0.05).
Figure 5.
C/F process removal efficiency from coagulant dosage variation. Different Latin letters indicate significant differences among coagulant dosage (t-test; p = 0.05).

Figure 6.
C/F process removal efficiency from flocculant dosage variation. Different Latin letters indicate significant differences among flocculant dosage (t-test; p = 0.05).
Figure 6.
C/F process removal efficiency from flocculant dosage variation. Different Latin letters indicate significant differences among flocculant dosage (t-test; p = 0.05).

Figure 7.
C/F process removal efficiency from rapid mixing time (RMT) variation. Different Latin letters indicate significant differences among rapid mixing time (t-test; p = 0.05).
Figure 7.
C/F process removal efficiency from rapid mixing time (RMT) variation. Different Latin letters indicate significant differences among rapid mixing time (t-test; p = 0.05).

Figure 8.
C/F process removal efficiency from rapid mixing speed variation. Different Latin letters indicate significant differences among rapid mixing speed (t-test; p = 0.05).
Figure 8.
C/F process removal efficiency from rapid mixing speed variation. Different Latin letters indicate significant differences among rapid mixing speed (t-test; p = 0.05).

Figure 9.
Efficiency of elimination of parameters obtained in each of the series of the experimental process.
Figure 9.
Efficiency of elimination of parameters obtained in each of the series of the experimental process.

Figure 10.
Efficiency of the C/F process for each of the series of the experimental procedure, compared to the initial turbidity value.
Figure 10.
Efficiency of the C/F process for each of the series of the experimental procedure, compared to the initial turbidity value.

Figure 11.
Efficiency of the C/F process for each of the series of the experimental process, compared to the initial value of COD.
Figure 11.
Efficiency of the C/F process for each of the series of the experimental process, compared to the initial value of COD.

Figure 12.
Efficiency of the C/F process for each of the series of the experimental process, compared to the initial value of TSS.
Figure 12.
Efficiency of the C/F process for each of the series of the experimental process, compared to the initial value of TSS.

Figure 13.
Comparison of the final efficiency of the C/F process with the studies of the bibliographic review (Derypol HT20 + Derypol DR4000 [25]; Al2(SO4)3 [26]; FeCl3 + Clay minerals [29]).

Figure 14.
Proposed mass balance scheme for theoretical NH4+ recovery.

Figure 15.
Mass balance of the control parameters (turbidity, COD, and TSS) and recovery values of NH4+ as liquid fertilizer from different recovery processes.
Figure 15.
Mass balance of the control parameters (turbidity, COD, and TSS) and recovery values of NH4+ as liquid fertilizer from different recovery processes.


Table 1.
Coagulants and flocculants used in the literature for organic matter, total suspended solids (TSS) and turbidity removal in a WW.
Table 1.
Coagulants and flocculants used in the literature for organic matter, total suspended solids (TSS) and turbidity removal in a WW.
| ID | Coagulant and Flocculant Reagent | Reference |
|---|---|---|
| 1 | Derypol® HT-20 + Derypol® DR4000 | [25] |
| 2 | Aluminum sulfate (Al2(SO4)3) | [26] |
| 3 | Aluminum sulfate-18-hydrate (Al2(SO4)3·18H2O) | [27] |
| 4 | Iron (III) chloride (FeCl3) | [28] |
| 5 | FeCl3 + clay materials | [29] |
| 6 | Lactic acid | [30] |
| 7 | Aluminum chloride (AlCl3) |
Table 2.
Process set-up (operational parameters) for each study.
| ID | RMT (min) | RMS (rpm) | SMT (min) | SMS (rpm) | ST (min) | pH |
|---|---|---|---|---|---|---|
| 1 | 1 | 200 * | 5 | 400 ** | 5 | 7.90 |
| 2 | 15 | 200 | - | - | 30 | 7.40 |
| 3 | 5 | 150 | 20 | 10 | 5 | 4.50 |
| 4 | 1 | 120 | 30 | 40 | 90 | 5.60 |
| 5 | 5 | 150 | 30 | 30 | 60 | 12.31 |
| 6 | 5 | 200 | 10 | 75 | 90 | 6.00 |
| 7 | 5 | 200 | 10 | 75 | 90 | 6.00 |
Notes: * Value representing the coagulant mixing speed instead of the rapid mixing speed. ** Value representing the flocculant mixing speed instead of the slow mixing speed.
Table 3.
List of parameters and weight values for selecting the coagulant and flocculating reagents.
Table 3.
List of parameters and weight values for selecting the coagulant and flocculating reagents.
| Parameter | Material 1–n |
|---|---|
| Turbidity | 0–1 |
| COD | 0–1 |
| TSS | 0–1 |
| pH | 0–0.5 |
| Mixing time and speed | 0–1 |
| Total | 0–4.5 |
Table 4.
Evaluation of weights related to the efficiency of the materials of the bibliographic C/F process: (1) Derypol® HT20 + Derypol® DR4000 [25], (2) Al2(SO4)3 [26], (3) Al2(SO4)3·18H2O [27], (4) FeCl3 [28], (5) FeCl3 + clay materials [29], (6) Lactic acid and (7) AlCl3 [30].
| Parameter | Studies | ||||||
|---|---|---|---|---|---|---|---|
| 1 | 2 | 3 | 4 | 5 | 6 | 7 | |
| Turbidity | 1.00 | - | - | - | - | - | - |
| COD | - | 1.00 | - | - | 1.50 | - | - |
| TSS | - | 1.00 | - | - | - | - | - |
| pH | 0.50 | 0.50 | - | - | - | - | - |
| Mixing time and speed | - | - | 1.00 | - | - | - | - |
| Total | 1.50 | 2.50 | 1.00 | 0.00 | 1.50 | 0.00 | 0.00 |
Note: ![Water 14 04024 i001]() Optimal comparative experiments.
Optimal comparative experiments.
 Optimal comparative experiments.
Table 5.
Initial operation parameters defined for the experimental process.
| Operational Parameter | Unit | Constant Value | Variable Range |
|---|---|---|---|
| Coagulant Dose | mg/L | - | 100–2000 |
| Flocculant Dose | mg/L | - | 200–1200 |
| RMT | min | - | 1–25 |
| RMS | rpm | - | 125–250 |
| SMT | min | 30 | - |
| SMS | rpm | 30 | - |
| ST | min | 30 | - |
Table 6.
Experimental matrix used in this study.
| Series # | Coagulant | Dose (mg/L) | Flocculant | Dose (mg/L) | RMT (min) | RMS (rpm) |
|---|---|---|---|---|---|---|
| 1 | Derypol HT20 | 500 | Derypol DR4000 | 800 | 15 | 200 |
| Al2(SO4)3 | --- | |||||
| FeCl3 | Flocculant 1 | |||||
| 2 | Series # 1 optimum | 100–2000 | Series # 1 optimum | 800 | 15 | 200 |
| 3 | Series # 1 optimum | Series # 2 optimum | Series # 1 optimum | 200–1200 | 15 | 200 |
| 4 | Series # 1 optimum | Series # 2 optimum | Series # 1 optimum | Series # 3 optimum | 1–25 | 200 |
| 5 | Series # 1 optimum | Series # 2 optimum | Series # 1 optimum | Series # 3 optimum | Series # 4 optimum | 125–250 |
| Optimum | Series # 1 optimum | Series # 2 optimum | Series # 1 optimum | Series # 3 optimum | Series # 4 optimum | Series # 5 optimum |
Table 7.
Initial characterization of the wastewater from the Vilanova i la Geltrú WWTP used in this study.
Table 7.
Initial characterization of the wastewater from the Vilanova i la Geltrú WWTP used in this study.
| Parameters | Value | Units |
|---|---|---|
| Cations | ||
| Na+ | 473.2 ± 22.9 | mg/L |
| NH4+ | 799.4 ± 71.9 | mg/L |
| K+ | 148.6 ± 15.4 | mg/L |
| Mg2+ | 12.5 ± 17.3 | mg/L |
| Ca2+ | 52.1 ± 41.6 | mg/L |
| Anions | ||
| Cl− | 354.0 ± 16.7 | mg/L |
| NO3− | 35.9 ± 6.6 | mg/L |
| PO43− | 150.8 ± 94.1 | mg/L |
| SO42− | 49.9 ± 6.3 | mg/L |
| HCO3− | 3714.2 ± 892.6 | mg/L |
| Physical–Chemical | ||
| pH | 8.2 ± 0.1 | - |
| TOC | 54.4 ± 2.6 | mg/L |
| Conductivity | 8.5 ± 0.2 | mS/cm |
| Control parameters | ||
| Turbidity | 321.4 ± 139.6 | NTU |
| COD | 684.6 ± 288.9 | mgO2/L |
| TSS | 499.6 ± 241.8 | mg/L |
Note: NTU = Nephelometric Turbidity Unit.
Table 8.
Control parameters initial characterization for each series of the experimental process.
| Series # | Turbidity (NTU) | COD (mgO2/L) | TSS (mg/L) |
|---|---|---|---|
| 1 | 150.8 | 191.4 | 418.0 |
| 2 | 223.5 | 904.5 | 345.0 |
| 3 | 442.8 | 881.3 | 650.0 |
| 4 | 477.8 | 738.8 | 840.0 |
| 5 | 312.1 | 707.0 | 245.0 |
| Average | 321.3 ± 139.6 | 684.6 ± 288.9 | 499.6 ± 241.8 |
Table 9.
Control parameters removal efficiency by using different coagulant and flocculant reagents.
Table 9.
Control parameters removal efficiency by using different coagulant and flocculant reagents.
| Series # | C/F Reagent | Turbidity Removal (%) | COD Removal (%) | TSS Removal (%) |
|---|---|---|---|---|
| 1 | HT20 (C) + DR4000 (F) | 97.1 ± 0.4 | 22.1 ± 0.1 | 82.1 ± 1.2 |
| HT20 (C) | 99.3 ± 0.3 | 51.4 ± 0.8 | 96.4 ± 1.2 | |
| Al2(SO4)3 (C) | 95.1 ± 0.1 | 36.1 ± 0.5 | 95.2 ± 0.1 | |
| FeCl3 (C) + Flocculant 1 (F) | 97.8 ± 0.2 | 64.7 ± 0.1 | 96.4 ± 1.2 | |
| FeCl3 (C) | 97.4 ± 0.1 | 39.7 ± 0.1 | 94.0 ± 1.2 |
Notes: (C) stands for coagulant reagent, and (F) stands for flocculant reagent.
Table 10.
Final optimal C/F parameters.
| Parameter | Units | Optimal Value |
|---|---|---|
| Coagulant material | - | FeCl3 |
| Coagulant material dosage (CD) | mg/L | 25 |
| Flocculant material | - | Flocculant 1 |
| Flocculant material dosage (FD) | mg/L | 25 |
| Rapid mixing time (RMT) | min | 1 |
| Rapid mixing speed (RMS) | rpm | 200 |
| Slow mixing time (SMT) | min | 30 * |
| Slow mixing speed (SMS) | rpm | 30 * |
| Settling time (ST) | min | 30 * |
Note: * From bibliographic analysis.
Table 11.
Final parameter removal of the C/F process.
| Parameter | Turbidity | COD | TSS |
|---|---|---|---|
| Removal (%) | 91.5 ± 0.4 | 59.1 ± 1.7 | 95.2 ± 0.1 |
Table 12.
Removal efficiency of control parameters and NH4+ of the enhanced coagulation process (Wongcharee et al. [38]) and the present study.
Table 12.
Removal efficiency of control parameters and NH4+ of the enhanced coagulation process (Wongcharee et al. [38]) and the present study.
| Parameter | Removal Efficiency (%) | |||
|---|---|---|---|---|
| Wongcharee et al. [38] | This Study | |||
| ACZ | Alumina | ACZ + Alumina | FeCl3 + Flocculant 1 | |
| Turbidity | 24.2 | 86.6 | 88.9 | 91.5 |
| COD | 42.1 | 68.3 | 89.9 | 59.1 |
| NH4+ | 57.5 | 4.4 | 75.7 | --- |
Table 13.
Efficiency of elimination of parameters of the slow filtration and ultrafiltration process (Sancho Lacalle [18]) and the present study.
Table 13.
Efficiency of elimination of parameters of the slow filtration and ultrafiltration process (Sancho Lacalle [18]) and the present study.
| Parameter | Removal Efficiency (%) | |
|---|---|---|
| Sancho Lacalle et al. [18] | This Study | |
| SF + UF | C/F (FeCl3 + Flocculant 1) | |
| Turbidity | 93.0 | 91.5 |
| COD | 60.0 | 59.1 |
Table 14.
Removal efficiency of the control parameters and NH4+ of the different processes considered for the theoretical comparison.
Table 14.
Removal efficiency of the control parameters and NH4+ of the different processes considered for the theoretical comparison.
| Process | Removal Efficiency (%) | |||
|---|---|---|---|---|
| Turbidity | COD | TSS | NH4+ | |
| C/F | 91.5 | 59.1 | 95.2 | 4.4 |
| UF | 93.0 | 60.0 | 93.0 | 8.8 |
| IX | 50.0 | 24.1 | 50.0 | 98.1 |
| C/F + IX | 88.9 | 89.9 | 88.9 | 75.7 |
Publisher’s Note: MDPI stays neutral with regard to jurisdictional claims in published maps and institutional affiliations. |
© 2022 by the authors. Licensee MDPI, Basel, Switzerland. This article is an open access article distributed under the terms and conditions of the Creative Commons Attribution (CC BY) license (https://creativecommons.org/licenses/by/4.0/).
Share and Cite
MDPI and ACS Style
Barros, A.; Vecino, X.; Reig, M.; Cortina, J.L. Coagulation and Flocculation Optimization Process Applied to the Sidestream of an Urban Wastewater Treatment Plant. Water 2022, 14, 4024. https://doi.org/10.3390/w14244024
AMA Style
Barros A, Vecino X, Reig M, Cortina JL. Coagulation and Flocculation Optimization Process Applied to the Sidestream of an Urban Wastewater Treatment Plant. Water. 2022; 14(24):4024. https://doi.org/10.3390/w14244024
Chicago/Turabian StyleBarros, Arturo, Xanel Vecino, Mònica Reig, and José Luis Cortina. 2022. "Coagulation and Flocculation Optimization Process Applied to the Sidestream of an Urban Wastewater Treatment Plant" Water 14, no. 24: 4024. https://doi.org/10.3390/w14244024
Note that from the first issue of 2016, this journal uses article numbers instead of page numbers. See further details here.