
Role of Multifunctional Water Reservoirs in the Upper Vistula Basin in Reducing Flood Risk
by
 , and
, and
Krzysztof Woś
1,2,
Radosław Radoń
3,4,
Tomasz Tekielak
3,
Krzysztof Wrzosek
1,5 ,
,
Łukasz Pieron
1,6,* and
and
Michał Piórecki
3,4 1
State Water Holding Polish Waters, National Water Management Authority, Żelazna 59A, 00-848 Warsaw, Poland
2
Faculty of Transport Engineering and Economics, Maritime University of Szczecin, H. Pobożnego 11, 70-500 Szczecin, Poland
3
State Water Holding Polish Waters, Regional Water Management Authority in Krakow, Piłsudskiego 22, 31-109 Krakow, Poland
4
Faculty of Environmental Engineering and Geodesy, The University of Agriculture in Krakow, Mickiewicza Avenue 24/28, 30-059 Krakow, Poland
5
Faculty of Building Installations, Hydrotechnics, and Environmental Engineering, Warsaw University of Technology, Nowowiejska 20, 00-653 Warsaw, Poland
6
Doctoral School, University of Silesia in Katowice, Bankowa 12, 40-007 Katowice, Poland
*
Author to whom correspondence should be addressed.
Water 2022, 14(24), 4025; https://doi.org/10.3390/w14244025
Submission received: 21 November 2022
/
Revised: 3 December 2022
/
Accepted: 7 December 2022
/
Published: 9 December 2022
(This article belongs to the Special Issue New Challenges in the Planning, Design, Construction and Operation of Reservoirs in the Context of Climate Change)
Abstract
:Multifunctional flood protection reservoirs of regional importance have been controversial for many years due to their significant environmental impact. The impact is especially observed at the implementation stage. Undeniably, properly managed large water reservoirs are the most effective element of active flood protection and significantly reduce the flood wave, thus limiting losses in housing, infrastructure, industry, or agriculture. At the same time, multifunctional reservoirs pursue other goals that are related to reducing shortages and counteracting the effects of drought, water supply, hydropower, or recreation. In the era of rapidly advancing climate and geopolitical changes, their role seems indispensable when it comes to responsible and coordinated water management in Poland. An open question is how to fully use the potential and to what extent it is possible for the system of reservoirs located on different watercourses to work together in the era of the progressive development of the country resulting in significant changes in land use (sealing large catchment areas) in relation to design assumptions. The article presents an analysis of the work of selected water reservoirs located in the basin of the upper Vistula during the floods that took place in the last decade. On the basis of the obtained conclusions, the authors present recommendations on how to effectively manage the network of reservoirs during a flood while minimizing losses of the water retained in them, which should be used to meet other goals of water management.
1. Introduction
Floods are among the most common natural hazards worldwide, with a large impact on human life, the economy, and a sustainable environment [1], as well as being able to develop in a very short time (often even within several hours). They cover countries in different regions and climatic zones and are characterized by varying levels of development [2]. Some studies show that the most critical factors for determining flood risk are: flow accumulation, distance from rivers, and density of the river system [3]. This is why it is so important to develop a flood risk index to understand the role of different factors (hazard, exposure, and vulnerability) at the local level [4].
At the same time, they are among the most destructive phenomena causing extensive losses in many areas [5]. Over the past three decades, several large rivers in Europe have been hit by extreme flooding, causing damage estimated at billions of euros [6]. On the other hand, in the years 1997–2010, the total cost of floods in Poland amounted to approximately EUR 9 billion [7]. It should also be remembered that the number of losses in the last hundred years in Poland was more significant, resulting from several large floods in the years: 1924, 1934, 1947, 1960, 1982, 1997, and 2001 [8]. The 1997 flood was Poland’s most significant recorded flood, both in hydrological and economic terms [9]. The effects of climate change and the growth of population concentrations in cities will probably increase future flood risk in these already vulnerable areas, which may be relevant to changing these values [10].
Therefore, information on the extent and frequency of floods is necessary to assess the risk of, inter alia, society, and infrastructure for possible damages and related economic losses [11]. Flood risk maps and flood hazard maps developed in the European Union countries under the so-called Floods Directive [12] are helpful for this purpose. They present, inter alia, potential damage related to the occurrence of floods in various scenarios and also constitute a tool facilitating decision-making (technical, financial, and political) regarding flood risk management. The documents updated in 6-year planning cycles are improved as a result of the use of more accurate and advanced terrain models and information on hydrological data, changing over time [13]. In many countries, basic flood information is limited [4]. This is why there is also a need to prepare diverse strategies to face floods, which should contain the following: improved structural flood control measures, improved opportunities for relocation, improved tax revenue schedules, and compensation, improved compulsory flood insurance, enhanced civil society participation, citizen involvement in decision-making, improved flood warning systems, smart land-use planning, cross-institutional collaboration, improved data collection and improved flood modeling vulnerability assessment [14].
Hence, it should be emphasized that having the appropriate tools to test the feasibility of various flood risk reduction measures enables fully informed decision-making [15].
Retention reservoirs are among the technical tools that play a key role in flood protection. They are one of the most effective tools for the integrated development and management of water resources, and the dynamic control of the flood water level in the reservoir is a valuable and effective method of flood protection and protection of the reservoir’s operation during significant floods [16]. Their functioning allows, among others, to reduce the flood wave and control its size below the dam cross-section (the so-called flattening) [17]. This is made possible by the flood capacity used for this purpose, i.e., the capacity maintained between the normal and the maximum damming level. The largest reservoirs in Poland perform many functions, but flood protection is the primary task for most of them. However, it should be remembered that retained water in many facilities is also of great importance in the context of counteracting the effects of drought. Reservoirs are resources used during low flows. Water management on a reservoir very often allows, on the one hand, to use the accumulated water and on the other hand, to discharge of more water from the reported tributaries, which makes it possible to satisfy the needs of users below the cross-section of the dam (further down the river). For this reason, it is necessary to optimally manage the operation of the reservoir in various hydrological conditions for sustainable water management. For this purpose, in accordance with the regulations in force in Poland, water management instructions have been developed for individual damming structures [18]. The documents define the rules of water resources management with the use of the damming devices of a given reservoir or reservoir system by the administrator, as well as the rules of interdependent use by other interested entities—according to the water permits held. The prepared studies are, therefore, an indicator of the operation of hydro-technical structures in the country, taking into account the need for rational water management. This means, on the one hand, effective management of reservoir networks during a rise or even flood, and on the other hand, remembering to minimize the loss of retained water, which should be used to fulfill other functions, along with ensuring an uninterrupted or guaranteed flow. It should also be remembered that the experiences of operators are valuable and should be implemented in water management manuals.
Bearing in mind the above, this article examines the functioning of water reservoirs located in the basin of the upper Vistula: Dobczyce, Świnna Poręba, Tresna, Porąbka, and Czaniec during the floods recorded in 2014 and 2021. The starting point was a detailed analysis of the amount of rainfall and its distribution and the selected floods related to them, enabling the subsequent characterization of the operation of the indicated facilities in this period. The exact course of the above-mentioned floods and key parameters for the operation of the reservoir (water supply, outflow, allowed flow, recorded flood capacity, and required flood capacity) were taken into account. The prepared characteristics of the floods in question are unique due to the high level of detail in describing the work of reservoirs and managing their operation, with the simultaneous indication of the role of a responsible decision-making process. The conducted research also enables determining the efficiency of work of the considered reservoirs, i.e., the percentage reduction in culmination flows and the volume of retained water, which directly determine the protection of valley areas located below the dam’s cross-section.
As a result of the activities carried out, recommendations for effective management of reservoirs during a flood were also presented, taking into account the need for minimizing losses in water retention (optimization of use), necessary for the proper functioning of various entities using water resources and possible counteracting effects of drought.
2. Materials and Methods
2.1. Study Area
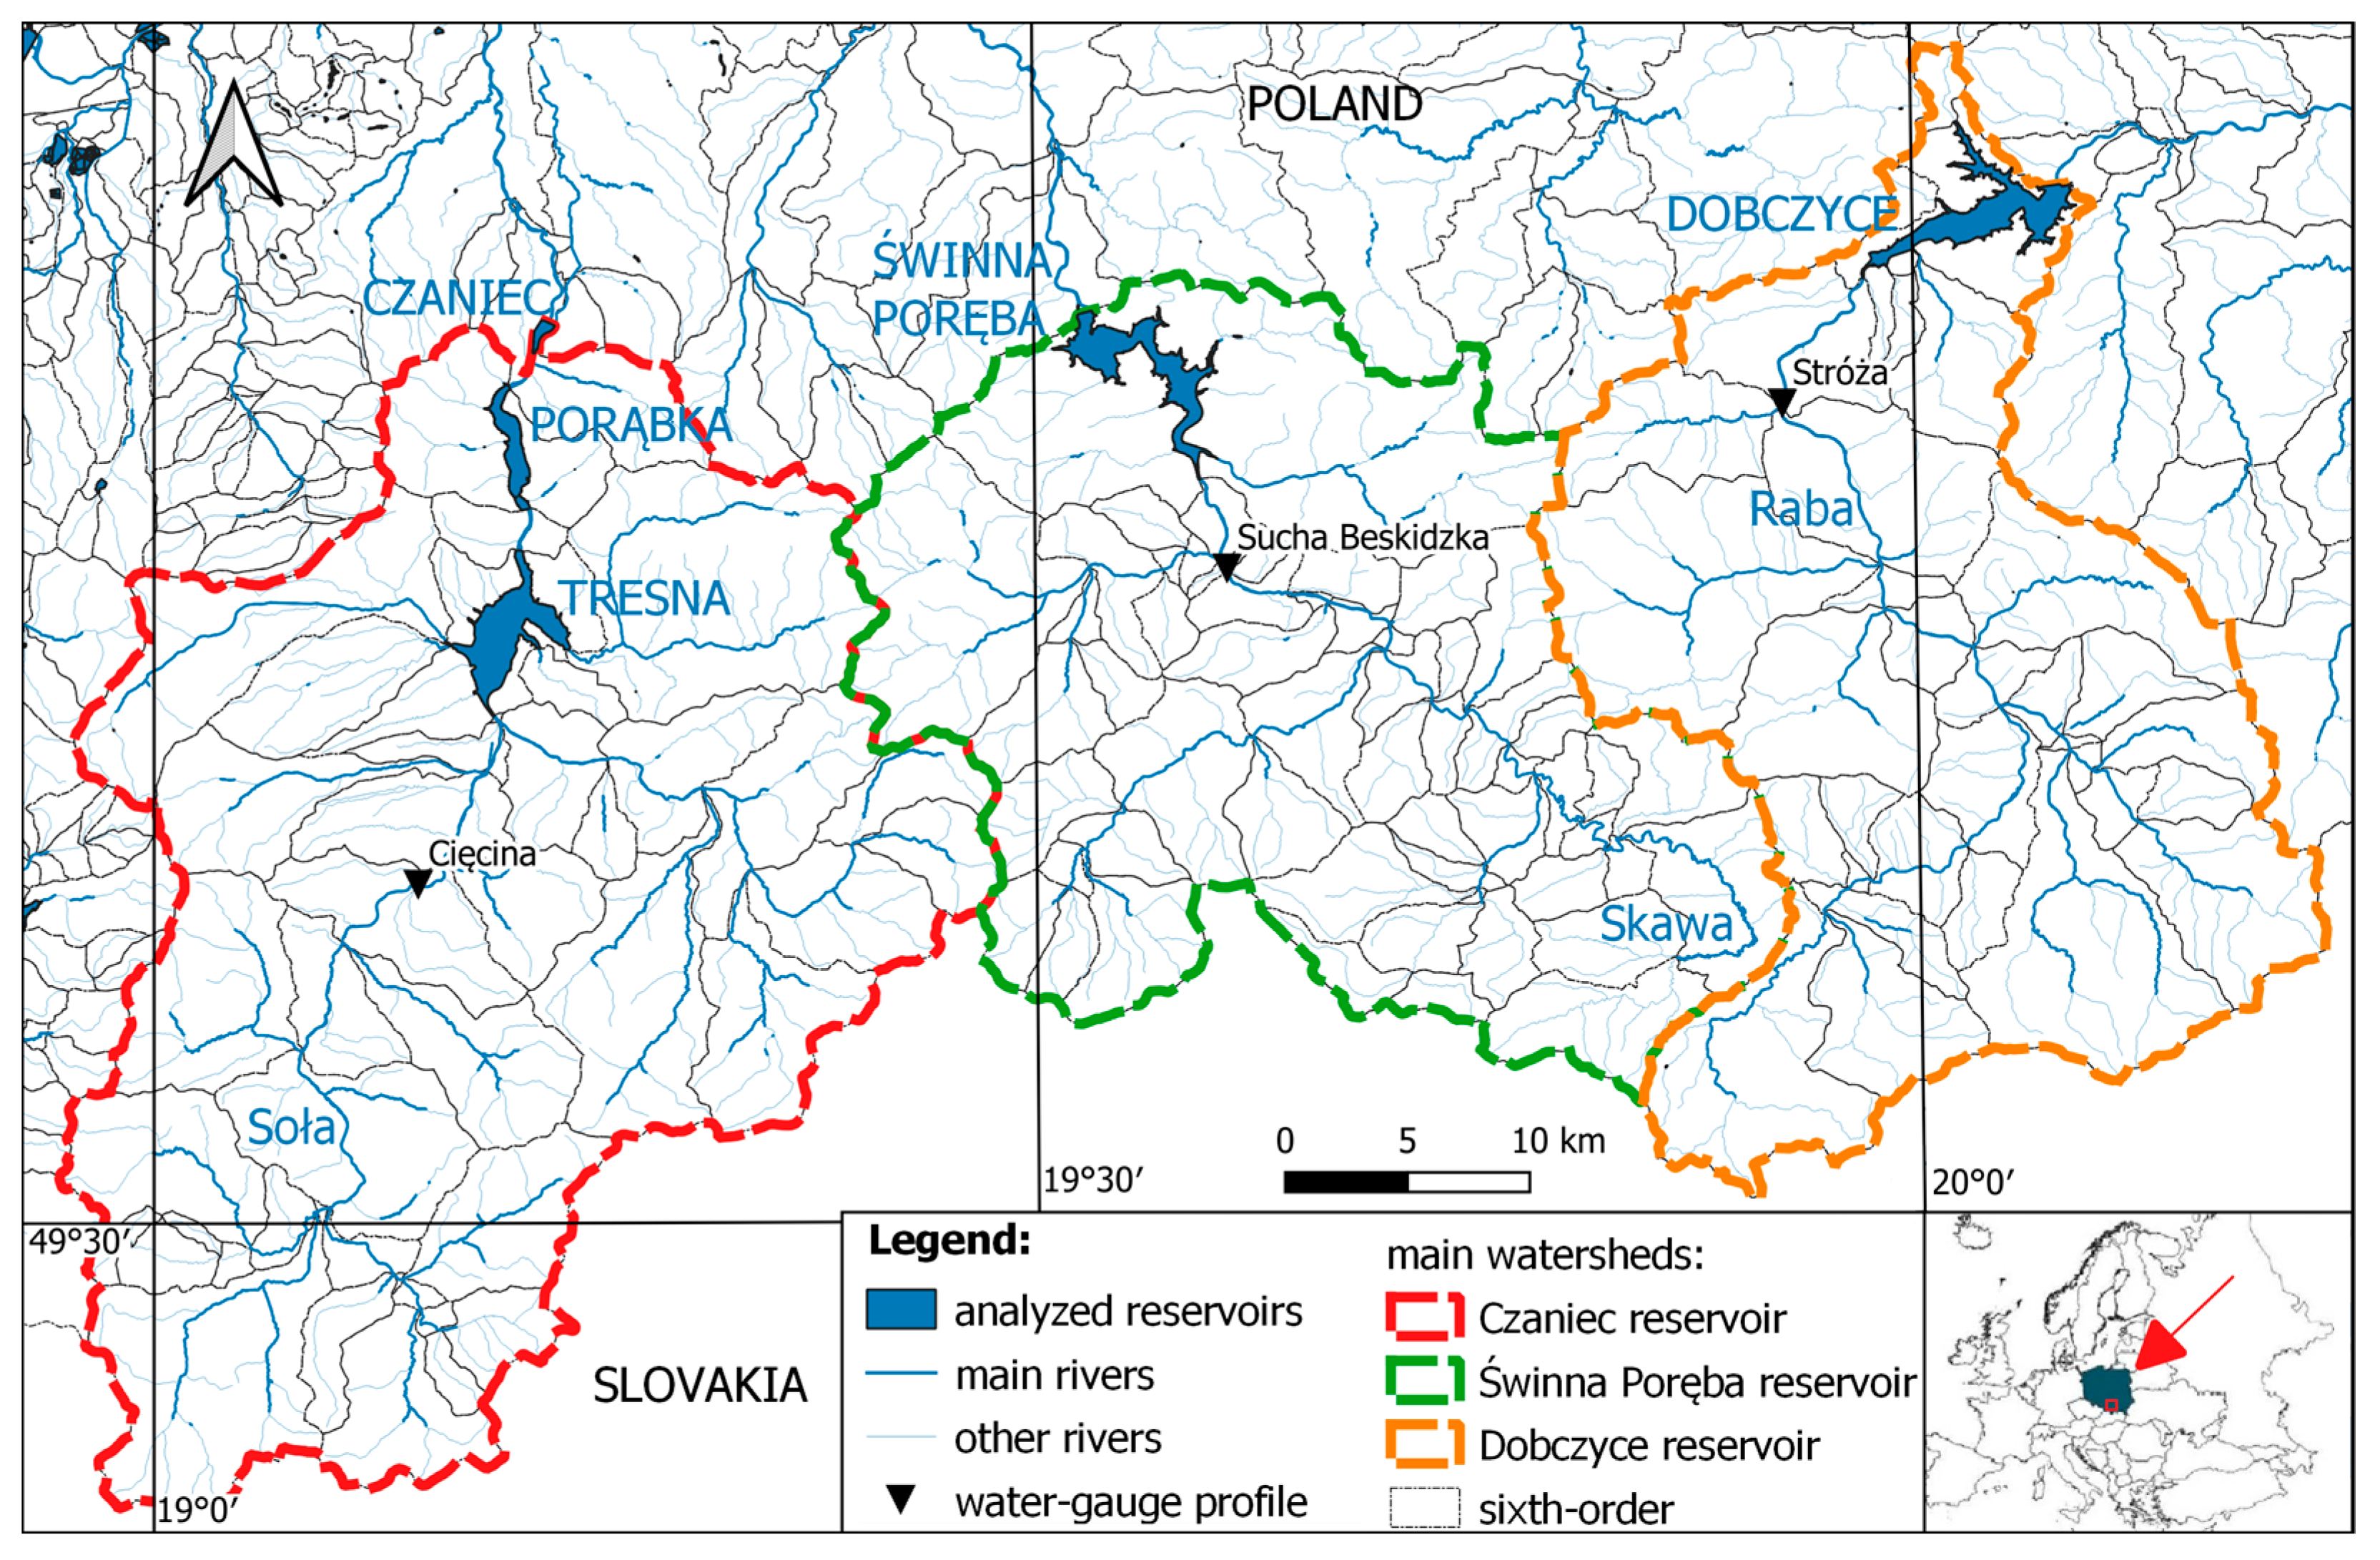
As mentioned in the introduction, the analyses on the role of multifunctional water reservoirs in reducing the risk of flooding were carried out on selected objects located in the southern part of Poland: Dobczyce on the Raba, Świnna Poręba on the Skawa and Tresna, Porąbka and Czaniec in the Soła cascade (Figure 1). The analyzed dams are located in the upper Vistula basin and are administered by the Regional Water Management Authority in Krakow of the State Water Holding Polish Waters.
The total capacity of the analyzed reservoirs at the maximum damming level is 419 million m3. The largest facility is the Świnna Poręba reservoir, with a storage capacity of 160.8 million m3 (38% of the total value). In the Dobczyce reservoir, it is possible to retain 137.7 million m3 of water (nearly 1/3), and 120.5 million m3 in the Soła cascade, of which the most in the Tresna reservoir—92.7 million m3, 26.5 million m3 in the Porąbka reservoir and the least in the Czaniec reservoir—1.3 million m3 (Table 1). On the other hand, under normal damming levels, the volume of water stored in the studied facilities amounts to almost 271 million m3 (Table 1). Taking into account that currently, the total capacity of retention reservoirs in Poland is at the level of 4.4 billion m3 [20], this value constitutes more than 6% of the indicated water resources. Thus, the flood reserve, necessary for flattening the flood wave and flood protection of the areas below the dam, amounts to way more than 148 million m3 in total: Świnna Poręba—60.1 million m3, Dobczyce—45.0 million m3, Tresna—38.8 million m3 and Porąbka—4.5 million m3 (Table 1). However, in terms of the maximum area, the largest facility is the Dobczyce reservoir, with 1090 ha, and the smallest is the Czaniec reservoir—with 50 ha (Table 1).
- For the purposes of water management in reservoirs, characteristic outflows are designated, which include, among others:
- minimum acceptable flow (Qe)—the so-called biological water,
- guaranteed flow (Qg)—the flow of water below the damming structure, being the sum of the intact flow and the flow necessary to cover the water needs, in particular the water needs of plants with water permits, located within the impact range of a given structure,
- flood flow (Qf)—water flow below the damming structure, determined depending on forecasts, adjusted to the capacity of the relief devices, which may cause negative flood effects.
In the case of the Dobczyce reservoir, the above parameters are as follows: Qe—1.46 m3∙s−1, Qg—2.41 m3∙s−1 and Qf—between 300 m3∙s−1 and 2700 m3∙s−1 [21]. The role of the Świnna Poręba reservoir is to guarantee in Skawa below the water barrage: Qe—1.42 m3∙s−1 and Qg—5.4 m3∙s−1, and Qf does not need to be determined due to the method of water management in the facility [22]. However, in the scope of the Soła cascade, only Qe and Qg are valid for the Czaniec reservoir, which is at the same level of 2.0 m3∙s−1. There is no need to designate them for the section between the dam in Tresna and the Czaniec reservoir, which in the aspect of Qg, results from the lack of water consumption in this section. On the other hand, for the entire cascade, due to the method of flood management, there is no need to define Qf [23].
In addition, the reservoirs in question are multifunctional, allowing for the implementation of a number of tasks related to water management. The Czaniec reservoir has mainly a compensating and water supply role. On the other hand, the remaining facilities are for water resource retention, flood protection, electricity production, and recreation. The function of the Dobczyce reservoir is also to supply water. The possibility of storing water resources is also valuable in the context of enabling it to counteract the effects of drought below individual dams because, usually, one of the tasks of multi-functional reservoirs is also to influence the current flow in the river and the associated flow control during low flows.
Taking into account individual catchments, the catchment area of the Czaniec reservoir, the last object of the Soła cascade, is the largest in area, occupying 1118.8 km2 (Table 2). The catchment area of the preceding Porąbka reservoir is slightly smaller—1091.5 km2, and the Tresna reservoir is 1036.6 km2 [13]. They cover a much larger area than the catchment area of the Dobczyce reservoir—769 km2 and Świnna Poręba reservoir—802.0 km2 (Table 2).
Performed calculations show that the density of the river network in all catchments ranges from 0.83 km∙km−2 to 0.78 km∙km−2 (Table 2). The catchment of the Czaniec reservoir, with a total length of 930 km, is characterized by the most developed river network (Table 2). On the other hand, the length of the river network and its density are at a similar level in the other analyzed catchments—respectively 615 km and 0.80 km∙km−2 for the Dobczyce reservoir and 623 km and 0.78 km∙km−2 for the Świnna Poręba reservoir (Table 2). At the same time, in terms of land use, the catchments of the considered reservoirs are largely covered by forests (in the case of the Czaniec and Dobczyce reservoirs, about 50%), the share of agricultural areas is also noticeable, and less than 10% are urban areas [24].
2.2. Data
The starting point in the study of the role of multifunctional water reservoirs in the upper Vistula basin in reducing the risk of flooding was the provisions of the water management instructions for the reservoirs: Dobczyce [21], Świnna Poręba [22], Tresna, Porąbka and Czaniec [23] and data from the hydrographic division map of Poland [3], thanks to which basic information about the functioning of the facilities was obtained, and the parameters of the catchment were calculated.
Then, the analysis of the hydrological and meteorological situation in the area in question in the last decade allowed for the selection of the years 2014 and 2021 as representatives for further detailed studies. Therefore, the analysis of the work of the reservoirs was based on flood events recorded in the upper Vistula basin caused by heavy rainfall lasting several days. For the indicated periods, the recorded floods are characterized, and the related operation of the reservoirs (water supply, outflow, allowed flow, recorded flood capacity, and required flood capacity) are described. For this purpose, the unpublished data of the Regional Water Management Authority in Krakow of the State Water Holding Polish Waters was used:
- the presented values of precipitation and flows recorded in water gauge profiles are presented on the basis of operational data of the Flood Protection Operational Center, obtained from the Institute of Meteorology and Water Management—National Research Institute (IMWM-NRI) telemetry system, provided by the IMWM-NRI [25],
- the operation of retention reservoirs during floods in 2014 and 2021 was prepared on the basis of operational data (regularly conducted monitoring of the hydrological and meteorological situation) of the Flood Protection Operational Center [26].
The above data also allowed us to determine the effectiveness of the considered reservoirs, i.e., the percentage reduction in culmination flows and the volume of retained water, which directly determines the protection of the valley areas located below the dam’s cross-section.
To sum up, the main research methods used include a query of operational documents for the tested reservoirs (water management instructions), descriptive spatial analyzes of the hydrological and meteorological situation, and statistical analysis in the field of hydrological parameters regarding the operation of reservoirs (including water supplies, outflows and recorded capacities). On this basis, the effectiveness of their process was calculated by indicating the degree of reduction in peak flows and the volume of retained water. For this purpose, the works of Punzet [27,28] were used, and the experience gained by some authors during the management of the results of the indicated objects during the flood was also significant throughout the article.
What is more, the conducted research was used to prepare recommendations for effective management of reservoirs during a flood—the aspect of reducing water retention losses, necessary to meet the needs of many user groups and possible counteracting effects of drought, was included.
3. Results
3.1. Water Highs Analysis
The values of precipitation and flows recorded in water gauge profiles presented in the content are based on the operational data of the Flood Protection Operational Center, Regional Water Management Authority in Krakow, obtained from the IMWM-NRI telemetry system, provided by the IMWM-NRI [25].
Due to the extensive analysis of the largest in the 21st century high in the upper Vistula basin from 2010, presented, inter alia, in the monograph on floods [29], the subject of research concerned the highs of May 2014 and the turn of August and September 2021 caused by rainfall.
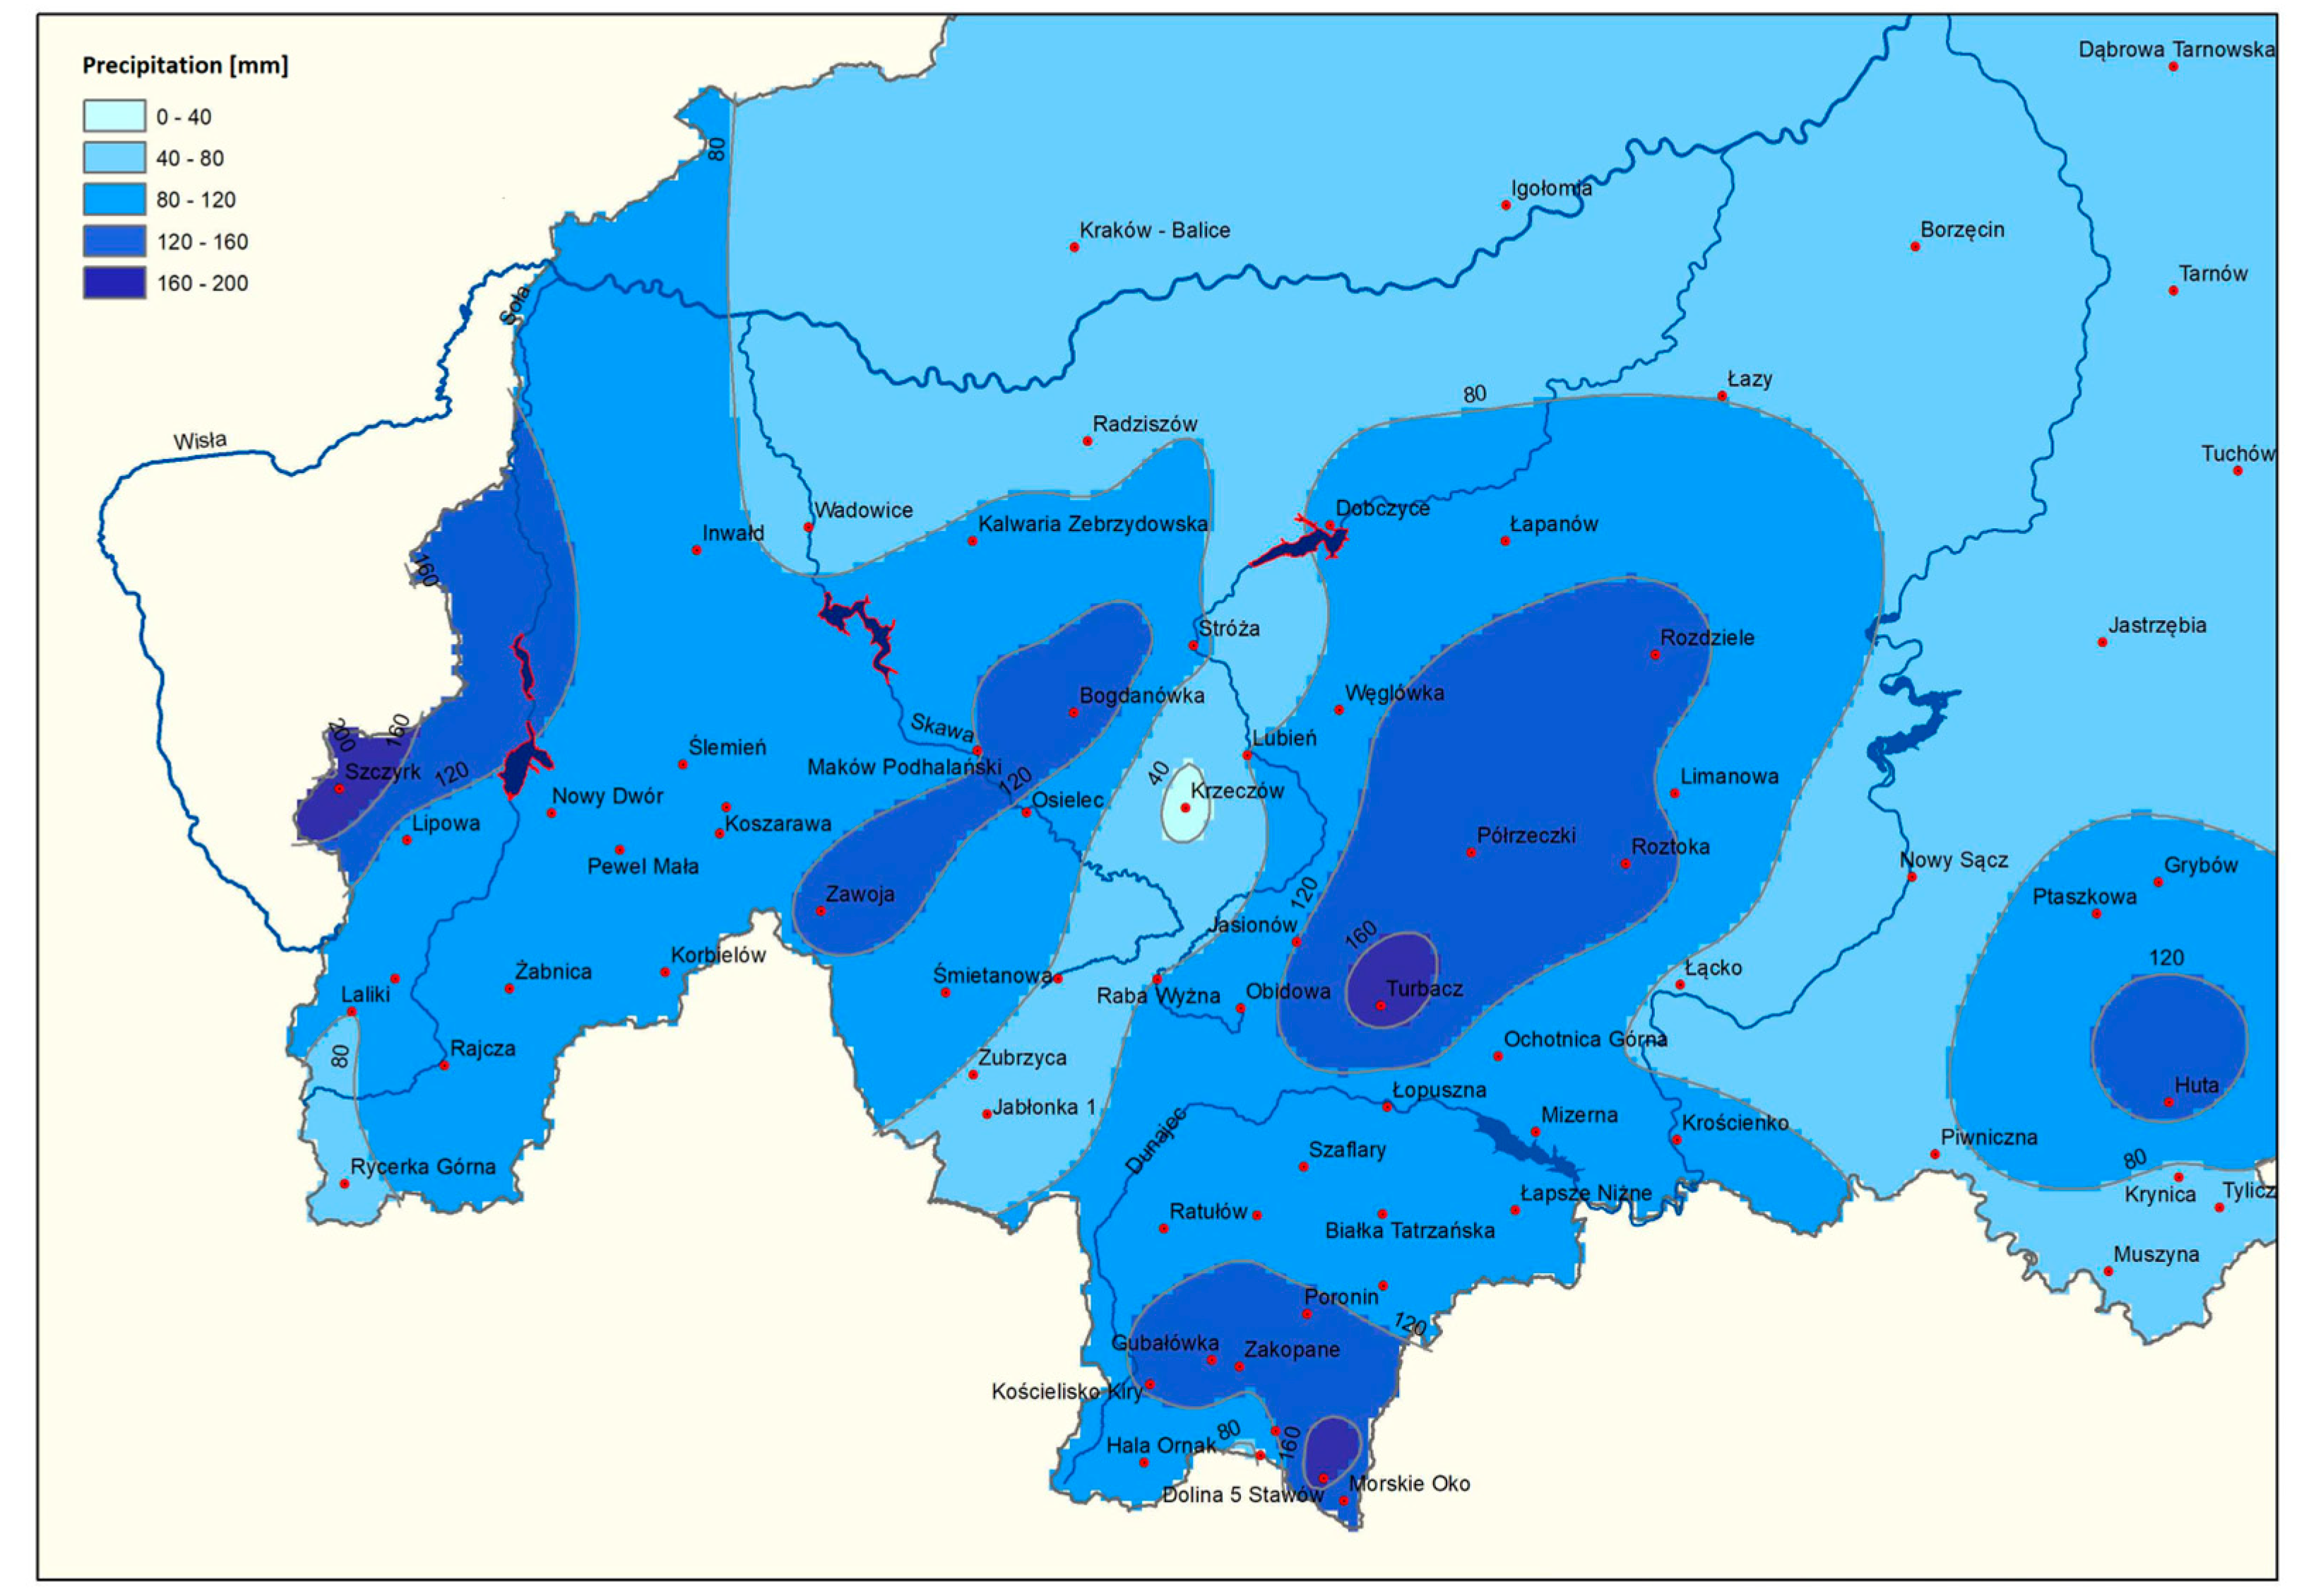
The high in 2014 was caused by the rainfall occurring in the upper Vistula basin between 13 and 17 May. Intensive rainfall occurred between 14 and 16 May, and the total recorded in parts of the Skawa and Raba catchments exceeded 200 mm: Zawoja 241.5 mm, Żabnica 240.8 mm, Bogdanówka 226.4 mm, Jasionów 210.6 mm, Lubień 209.8 mm) (Figure 2). The highest daily amounts of precipitation were recorded on May 15, and the maximum rainfall at that time was recorded in the Skawa catchment area at the Zawoja station (138 mm). Rainfall with a daily total exceeding 100 mm was also recorded in the Raba catchment area, including at the Bogdanówka (125 mm), Lubień (117.5 mm), Jasionów (106 mm), and Obidowa (100.7 mm) stations. In the part of the Soła catchment upstream of the cascade objects, the daily rainfall on May 15 in Rajcza and Koszarawa exceeded 90 mm (91.8 mm and 90.6 mm, respectively). The total distribution of precipitation in the area of the analyzed catchments between 13 and 17 May is shown in Figure 2.
The natural consequence of such large sums of precipitation in the upper parts of the analyzed catchments was an increase in water levels, observed from 14 May. The high-level zone on Raba was crossed in the evening hours of 14 May, while on Soła and Skawa, it took place in the morning. At that time, exceedances of warning levels were already recorded in Soła and Skawa catchments. The rise in water levels, which was decisive for the course of the phenomenon, took place in the afternoon hours of 15 May. The culmination in the cover profiles of the reservoirs, which took shape when the alarm states were exceeded, occurred at night on 16 May.
The high in 2021 was preceded by rainfalls that occurred in the upper Vistula basin from 29 August. On the first day of rainfall, the highest amount of rainfall in the analyzed area was recorded in the Raba catchment area at the Rozdziele station (67.8 mm), while on the last day of the month, there was the highest intensity, reaching 143.2 mm in the Soła catchment (Szczyrk) (Figure 3). In the remaining area of the Soła catchment, rainfall with daily sums up to 80 mm was recorded. Precipitation totals up to 70 mm were also recorded in Skawa and Raba catchments. The disappearance of precipitation took place on September 1. The highest amount of rainfall between 29 August and 1 September was recorded in the Soła catchment in the area of Beskid Śląski (198.4 mm Szczyrk). In the Raba catchment area, the highest total rainfall was recorded in Gorce (175.9 mm), and in the Skawa catchment in Zawoja, it was 126.8 mm. The total distribution of precipitation in the area of the analyzed catchments between 29 August and 1 September is shown in Figure 3.
Significant increases in water levels in the analyzed catchments, caused by rainfall and outflow, have been observed since 30 August. In the morning, the first exceedances of warning levels were noted in the Raba catchment area, as well as on the Raba in its upper section. In the afternoon, point exceedances of warning levels were also recorded in the remaining analyzed catchments. At that time, the first culmination of the flow on the Soła, Skawa, and Raba rivers took place, observed in the cross-sections above the dam reservoirs. The earliest maximum flows of the first wave were recorded on Raba (from 6.00 UTC), while in the afternoon, they were recorded on Soła and Skawa. Water levels increased again in the afternoon of 31 August. In the evening hours, in the analyzed catchments above the cross-sections of reservoirs, the first exceedances of alarm levels occurred, as well as numerous exceedances of warning levels. In the night hours from 31 August to 1 September, the maximum flows of the second wave were recorded in protective profiles, occurring when the alarm level on the Skawa River and warning levels on the Soła and Raba were exceeded. On 6 September, the flow on the Soła, Skawa, and Raba was equalized with the values recorded before the high.
The genesis of both analyzed floods in the upper Vistula basin was rainfall. The totals of which recorded in the area of the analyzed catchments in 2014 were higher than the values recorded in 2021. In 2014, a significant part of the Soła, Skawa, and Raba catchments fell during this event between 150 mm and 200 mm, while in 2021, values of up to 120 mm prevailed (Figure 2 and Figure 3). Precipitation with a total of more than 200 mm was recorded in 2014 in all analyzed catchments. In the case of the Raba catchment, they covered about 46% of the area, closed by the dam’s cross-section. In 2021, maximum precipitation amounts of up to 180 mm were recorded only in the Soła catchment in the area of the Silesian Beskids and the Raba in the Gorce (Figure 2 and Figure 3).
Precipitation totals during flooding in 2014 and 2021 in the analyzed catchments were higher than the average monthly precipitation totals for many years. In 2014, in the Soła catchment (Żabnica), total precipitation during the flood was nearly two times (1.8) higher than the long-term average for May. For Skawa (Zawoja) and Raba (Bogdanówka), this ratio was slightly lower (1.7). In 2021, in the Soła catchment in Szczyrk the ratio was 1.7, and in the Skawa (Zawoja) and Raba (Bogdanówka) catchments, respectively 1.2 and 1.1.
The distribution of precipitation, different in individual years, determined the course and size of floods in the area of the analyzed catchments. The high in 2014 was characterized by a rapid increase in water levels on watercourses to the maximum value. During this event on Soła, Skawa, and Raba, there was one dominant culmination, after which, in the phase of water table decline, a slight increase was again observed in the profiles. The time after which culmination flows were recorded in 2014 was about 36 h for Skawa and Raba and about 45 h for Soła. The main culmination in 2021 was preceded by significant increases in water levels, especially visible in the Raba and Skawa hydrographs. On the Raba river in Stróża, the size of the main culmination was only 32% greater than the flow recorded during the first wave culmination. Values of culmination flow during the floods in 2014 and 2021 in Soła, Skawa and Raba are summarized in Table 3.
In the case of composite waves during the flood in 2021, the short culmination time of the first and second waves is noteworthy. On the Raba river in Stróża, the first culmination of water levels was recorded after about 6 h of the flood. For Soła and Skawa, this time was about 12–14 h. The shortest time to the second culmination was recorded in Soła and Raba (about 10 h). For Skawa, it was twice as long. When comparing both floods, it should be stated that the volumes of culmination flows recorded in 2014, as well as the volumes of flood waves occurring in the analyzed catchments, prevailed over the values from 2021. The volume of the flood wave on Skawa in Osielec was about 19.5 million m3, while in 2021, it was about 8.0 million m3. The outflow on the Raba river in Stróża during the May flood in 2014 was approximately 74.3 million m3, while in 2021, it was 45.9 million m3. The 2014 flood waves also have longer bases. In the Soła and Raba catchment areas, flooding in 2014 lasted, respectively, one day for the Soła and one and a half days for the Raba, longer than the time of the flood in the catchments in 2021. The flooding time in 2014 and 2021 was only comparable in the case of the Skawa catchment and was about four and a half days.
3.2. Description of the Reservoirs Operation in 2014
The operation of the retention reservoirs during the flood in 2014 was based on the operational data of the Flood Protection Operational Center, Regional Water Management Authority in Krakow [26].
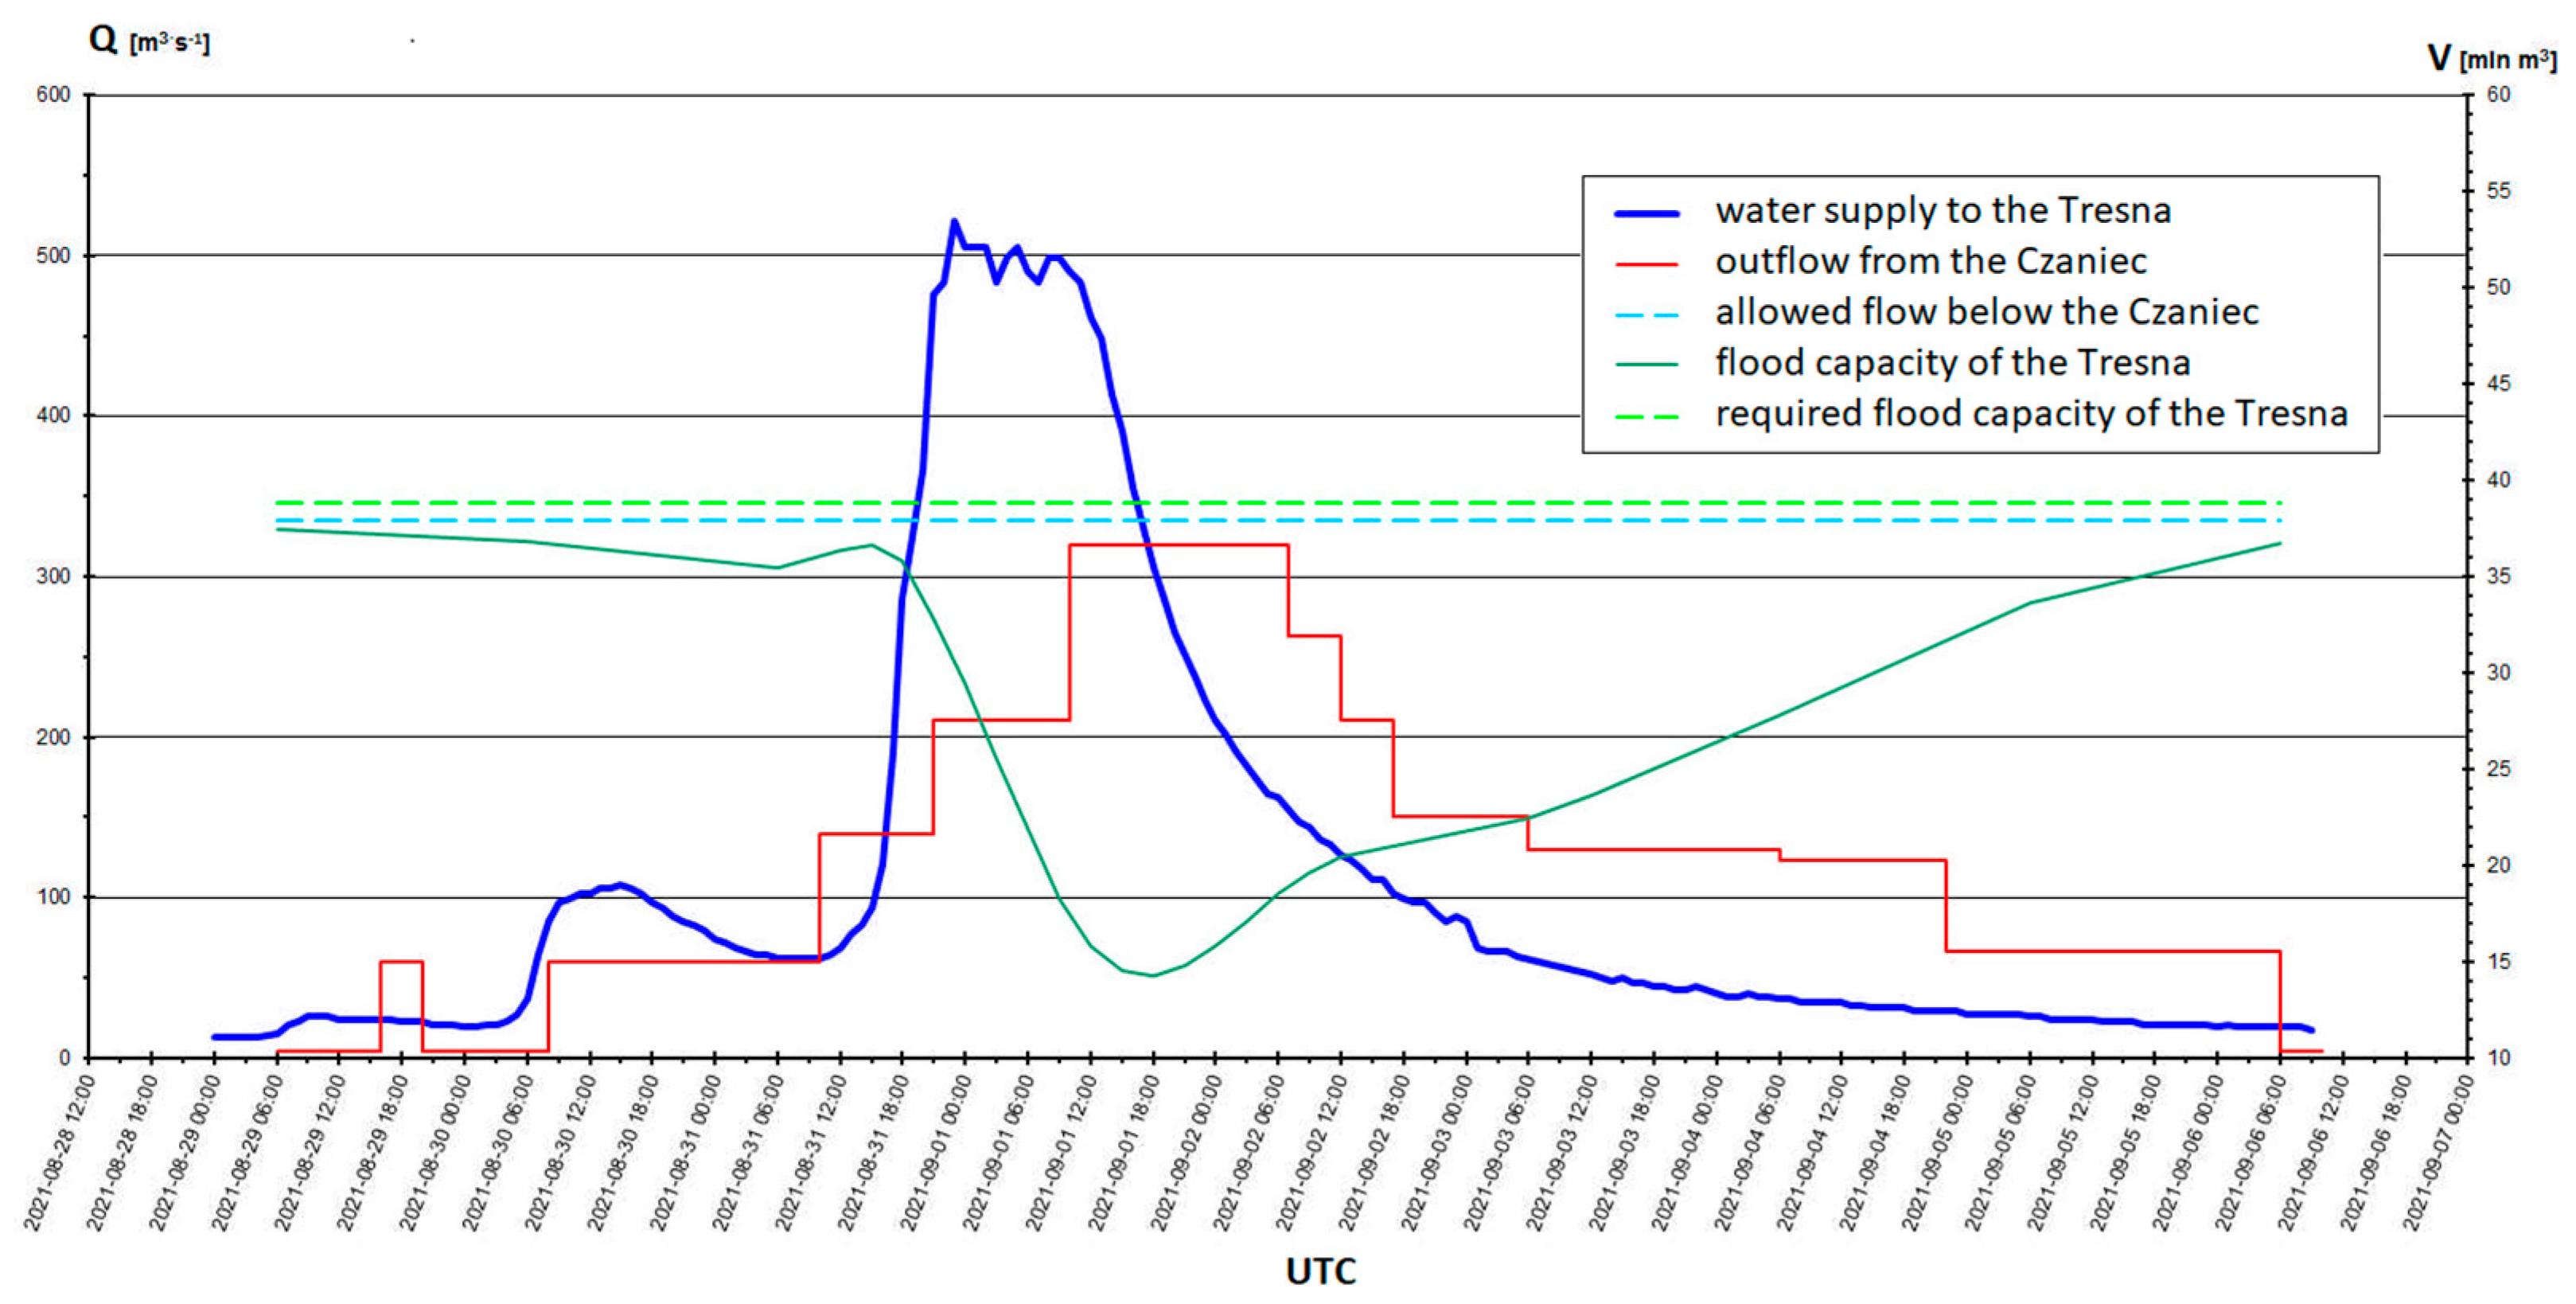
In the case of the hydro-technical structures of the Soła cascade, the Tresna and Porąbka reservoirs play the role of flood protection. During the time preceding the flood, the water table ordinates in both reservoirs were below the normal damming level (NDL). On 10 May 2014 at 6 UTC, the ordinate of the water table of the Tresna reservoir was 1.5 m below NDLNDL, while at the Porąbka reservoir—1.01 m below NDLNDL. Thus, an additional amount of about 15.5 million m3 of the accidental capacity of both reservoirs was available. Due to unfavorable meteorological and hydrological forecasts issued by the IMWM-NRI on May 14, indicating a water supply of 25 million m3 to cascade facilities within 48 h [25], the Director of the Regional Water Management Authority in Kraków ordered to reduce of damming on the Tresna reservoir by means of a pre-emptive discharge of 120 m3∙s−1. The decision agreed with the Silesian Voivode became final at 13 UTC. Until then, the outflow from the cascade facilities was about 60 m3∙s−1. Despite the constant increase in the water supply to the Tresna river, the size of which on the night of 15 May exceeded the outflow already available. It was kept unchanged. On 15 May at 6 UTC, the water supply to the reservoir was 181 m3∙s−1, and the filling reached the value of 46.7 million m3, which corresponded to the flood capacity and the accidental volume of 49.4 million m3. On 15 May at 6 pm UTC, the water supply to Tresna reached 300 m3∙s−1 and a moment later exceeded the amount of the allowed outflow (335 m3∙s−1), as determined for the facilities of the Soła cascade [23]. The damming on the Tresna river was still lower than NDLNDL, and 43.6 million m3 of reservoir capacity was available, which consisted of the size of the flood reserve and the accidental reserve, additionally increased by about 1.0 million m3 of pre-outflow. From 9 pm UTC, the outflow from the cascade was increased to 260 m3∙s−1, and the water supply value determined at that time was up to 780 m3∙s−1. The current flood capacity of Tresna was 38.1 million m3. Continuing rapid increases in the water supply determined the rapid filling of the Tresna flood reserve. From 00 UTC on 16 May, the flood capacity of Tresna began to be filled. The water supply exceeded 900 m3∙s−1, and its further increase was observed in the following hours. By that time, the flood capacity of Tresna had been filled with the volume of the water supply of 0.5 million m3. On the morning of 16 May, a decision was made to increase the outflow. The culmination of the water supply of 1027 m3∙s−1 recorded on 16 May at 3 UTC was reduced by the permitted outflow, with the flood capacity of Tresna filled with 7.0 million m3 of retained water supply. From 9 UTC on 16 May, with a sustained water supply of 725 m3∙s−1 and the remaining 13.3 million m3 of flood capacity of the Tresna reservoir, the outflow from the cascade facilities was increased to 420 m3∙s−1. Thus, the permitted outflow was exceeded by 85 m3∙s−1. The flood capacity of Tresna was filled with 21.5 million m3, and its available capacity was on 16 May at 18 UTC, less than 32% of the required value. The flood capacity was restored on 16 May after 18 UTC. At that time, an outflow of 420 m3∙s−1 was maintained from the cascade, exceeding the value of the allowable outflow. In view of the decreasing water supply, on 17 May, from 9 UTC, the outflow was limited to the amount of the allowed water supply, and at 18 UTC to 260 m3∙s−1. Subsequent reductions in the outflow occurred from 18 May first to 210 m3∙s−1, successively to 160 m3∙s−1 (from 21 UTC), so that on 20 May at 6 UTC, its value was at 60 m3∙s−1. Full restoration of the flood capacity was achieved in the evening hours of 19 May. The water management of Soła cascade reservoirs during the flood is shown in Figure 4.
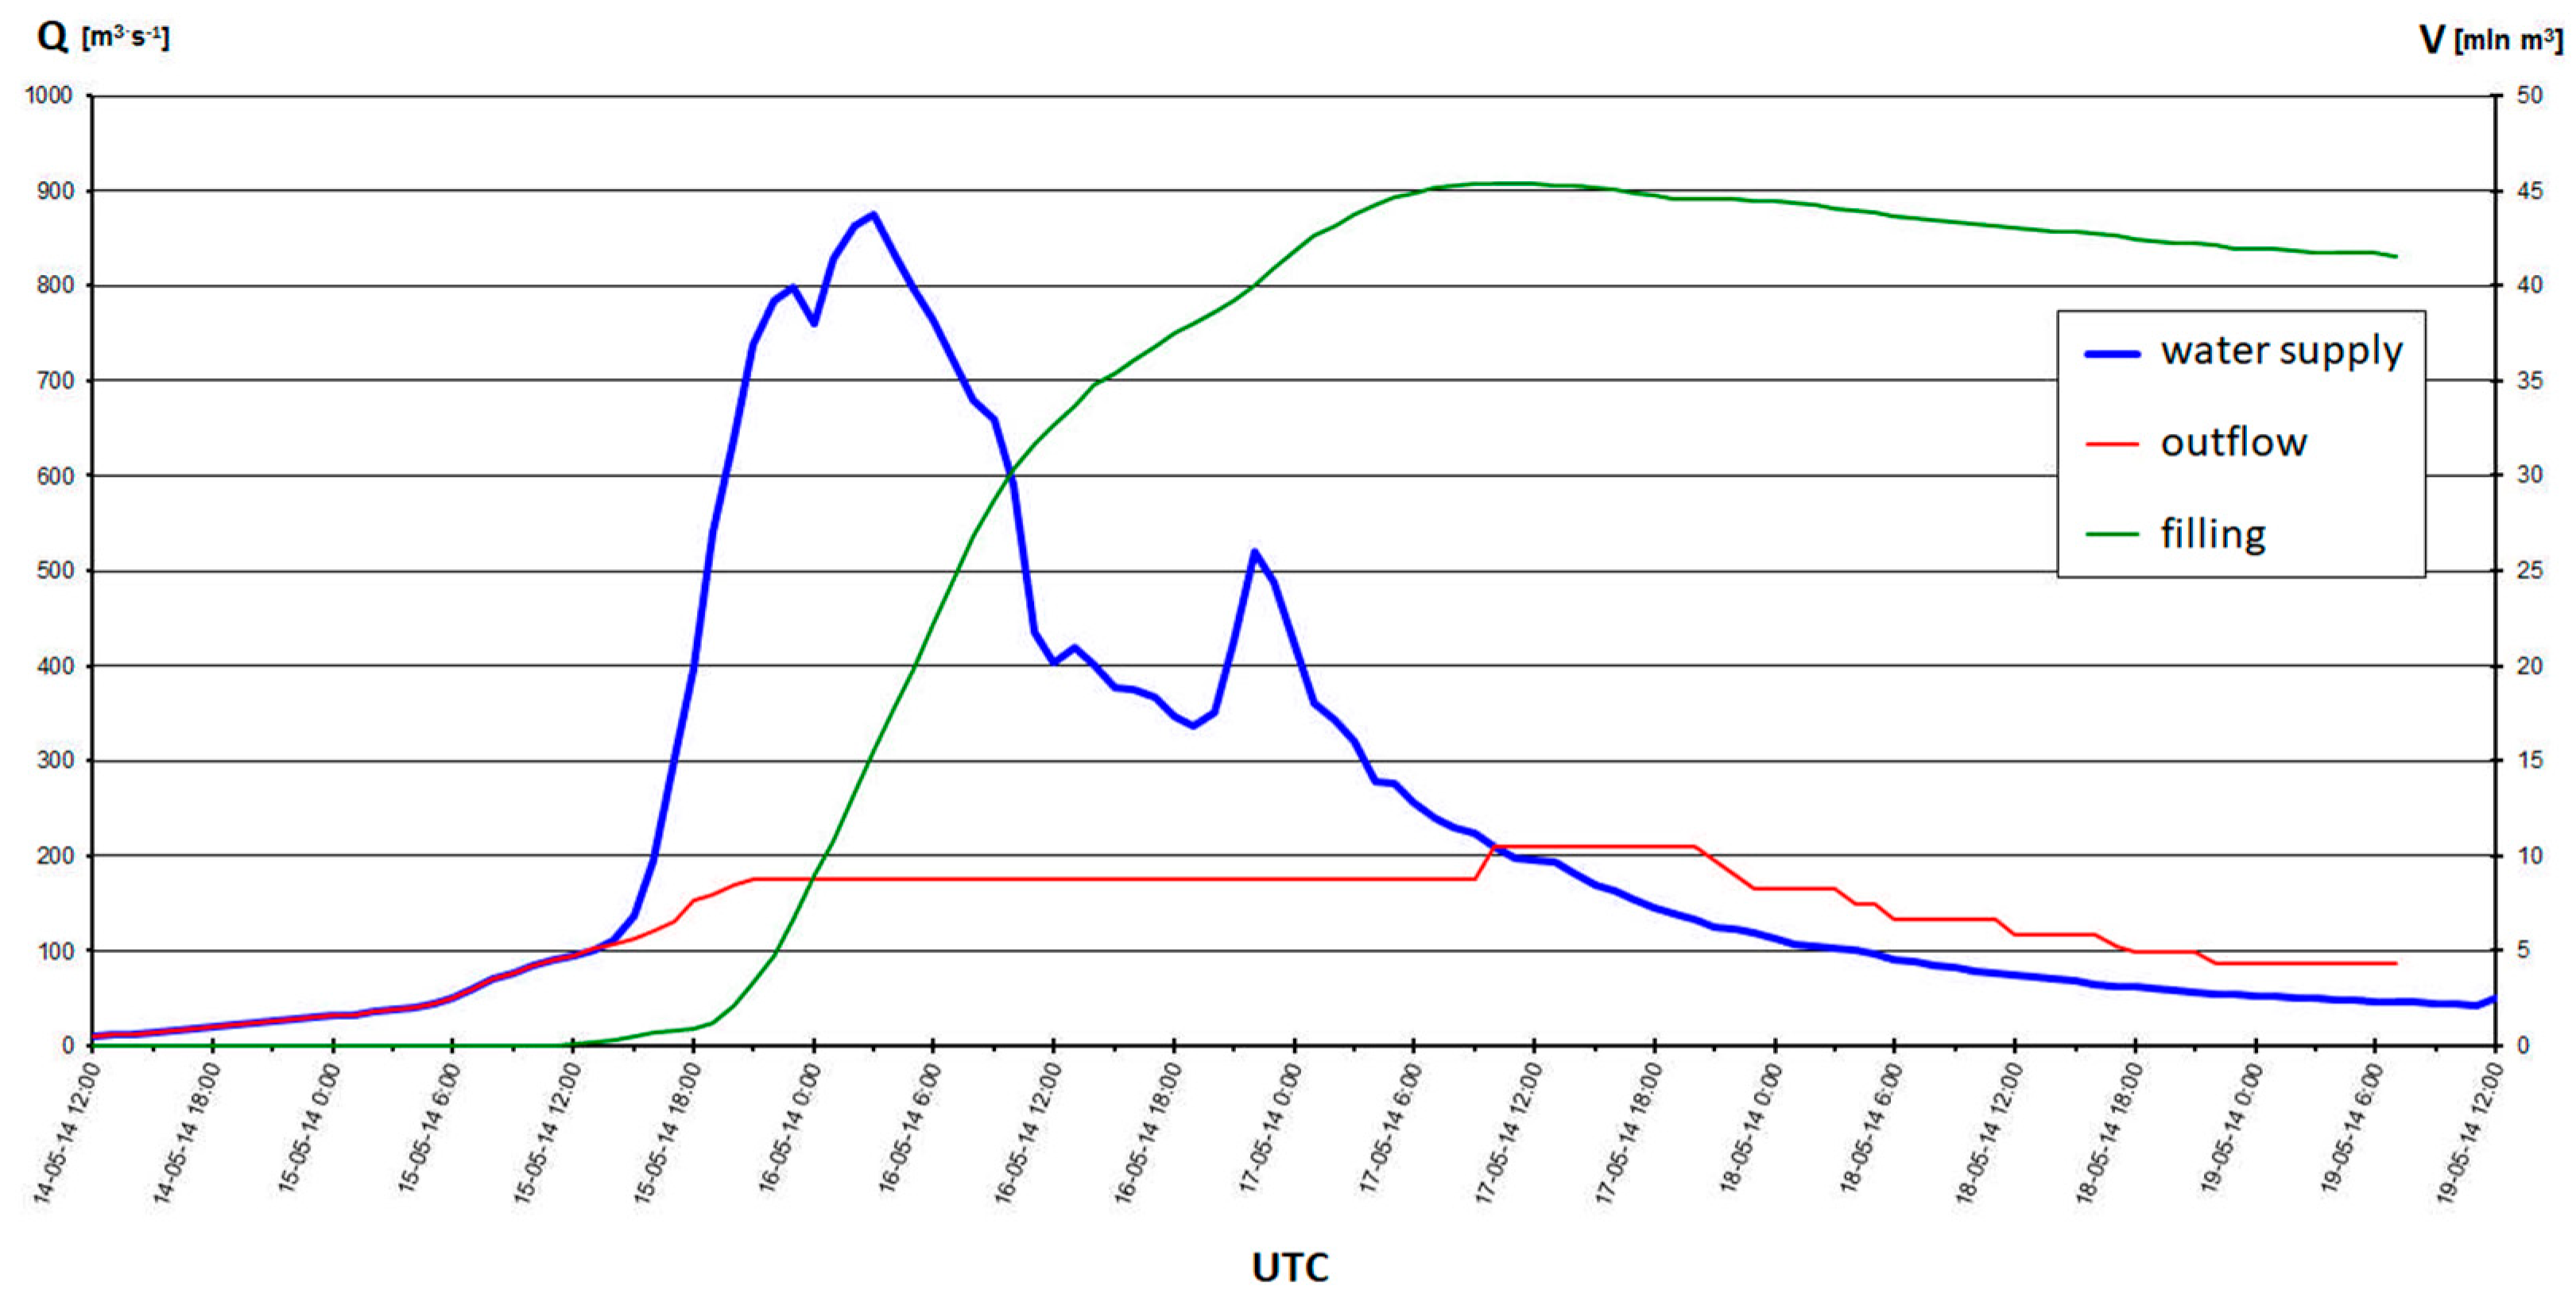
In May 2014, the Świnna Poręba reservoir was under construction. Therefore, it was necessary to secure the construction site for the time of the flood. The operation of the reservoir in flood conditions was regulated by the flood protection manual for the 3rd stage of reservoir construction, updated after the flood in 2010. In the period preceding the May flood, the reservoir was unfilled, and the outflow from the reservoir corresponded to the size of the water supply. On 14 May, at 6 UTC, the values were 6 m3∙s−1. In the following hours, an increase in flows in the Skawa River in the riverbed was observed. The reservoir filling did not occur, and the drain was equal to the current water supply. The filling of the reservoir was observed from the afternoon of 15 May. The decision to limit the outflow by closing the valves to a height of 6.0 m was made on that day at 21 UTC. At that time, an outflow of 176 m3∙s−1 was determined. At that time, the water supply to the reservoir exceeded 700 m3∙s−1. The culmination of the water supply of 876 m3∙s−1, recorded on 16 May at 3 UTC, was reduced with an outflow of 176 m3∙s−1. This outflow was also maintained during the second culmination (520 m3∙s−1), recorded on 16 May at 22 UTC. The highest filling of the reservoir (45.4 million m3) was achieved on 17 May in the afternoon. At that time, it was also decided to increase the outflow to 210 m3∙s−1, which was maintained until the evening hours of 17 May. In the following days, due to the decreasing water supply, the amount of outflow was gradually reduced. The water management of the Świnna Poręba reservoir during the flood is shown in Figure 5.
Before the analyzed flood, the damming level on the Dobczyce reservoir was 1.21 m below NDL, and on 10 May at 6 UTC, 268.69 m above sea level. With the damming up in this period, the flood reserve amounted to 39.62 million m3, i.e., approx. 11.60 million m3 above the required value.
Due to the forecasted intense rainfall in the catchment area of the Raba river, by the decision of the Director of the Regional Water Management Authority in Krakow on 13 May, it was ordered to lower the damming to the ordinate of 268.10 m above sea level, to increase the flood reserve to 45 million m3. The amount of the provision determined by the decision of the Director was achieved on 14 May.
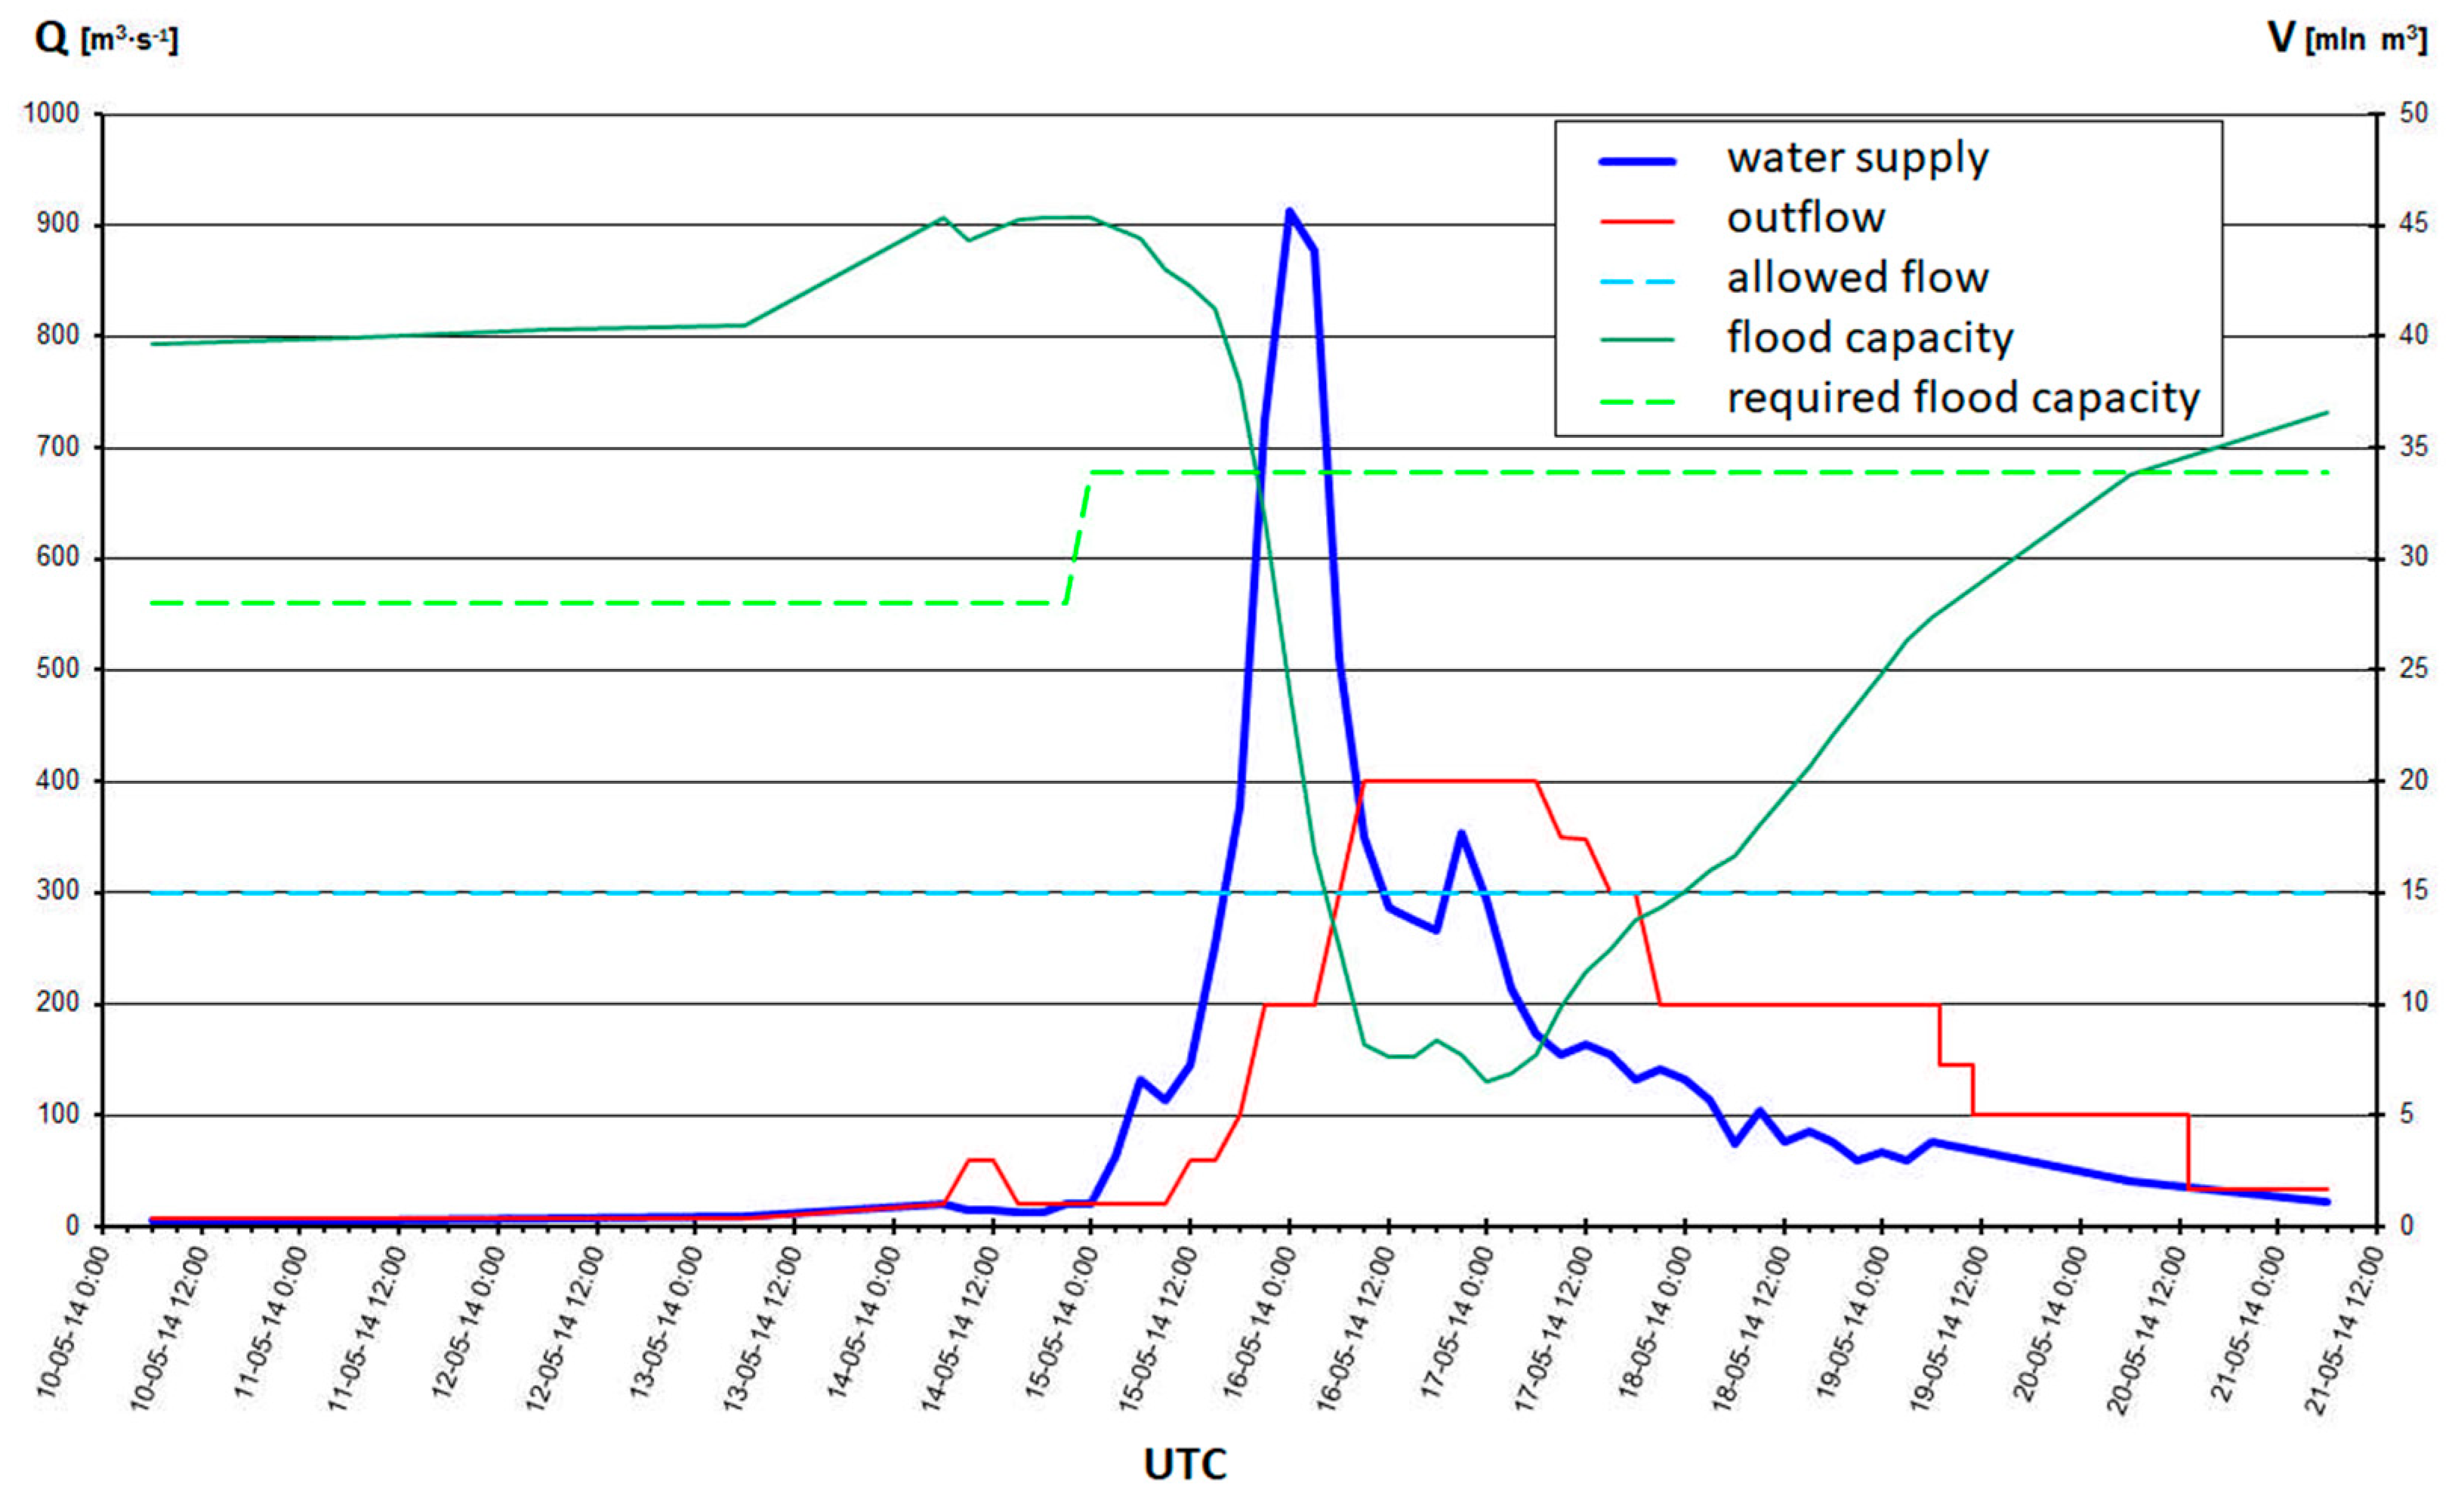
The formation of the flood wave, related to the rapid increase in the value of flows, took place on May 15, from 00 UTC. During three hours, the water supply increased to 63.50 m3∙s−1 (3 UTC), while at 6 UTC, the size of the water supply was already 133 m3∙s−1. After obtaining the flood capacity required by the decision of the Director of the Regional Water Management Authority in Krakow, an increase in the amount of outflow to 60 m3∙s−1 was ordered on 15 May at 12 UTC. After 16 UTC, the value of the water supply to the reservoir exceeded 300 m3∙s−1, reaching 18 UTC 378 m3∙s−1. In view of the recorded increase in the water supply to the reservoir and unfavorable meteorological forecasts (informing about rainfall in the Raba river basin with a height of 60 mm), on 15 May at 18 UTC, the outflow was increased to 100 m3∙s−1, and then (from 15 May from 21 UTC to May 16 until 6 UTC) to 200–300 m3∙s−1. The culmination of the water supply to the reservoir with the value of 913 m3∙s−1 was recorded on 16 May at 00 UTC. The culmination of the flood wave was taken over at the outflow amounting to 200 m3∙s−1, the reservoir’s filling exceeding NDL, and the flood capacity remaining to be used equally to 24.2 million m3. Within 6 h of the high, from 18 UTC on 15 May to the culmination, 13.7 million m3 was retained. Due to the decreasing flood capacity and the persistently high values of the water supply to the reservoir, on 16 May from 07:30 UTC, an outflow of 400 m3∙s−1 was ordered. This outflow exceeded the allowed value by 100 m3∙s−1. The flood capacity of the reservoir at 9 UTC was 8.19 million m3. The outflow of 400 m3∙s−1 was maintained until 17 May at 6 UTC. The total time of disposing of the outflow reservoir above the permitted value lasted over a day (approximately 30 h). The outflow was reduced gradually to the amount of 33.80 m3∙s−1, determined on 21 May. During this period, the damming below NDL was lowered, and the required flood reserve of the reservoir was rebuilt. The water management of the Dobczyce reservoir during the flood is shown in Figure 6.
3.3. Description of the Operation of Reservoirs in 2021
The work of the retention reservoirs during the flood in 2021 was based on the operational data of the Flood Protection Operational Center, Regional Water Management Authority in Krakow [26].
The operation of the Tresna reservoir before the flood in late August 2021 took place at a slight filling of its flood capacity. On 29 August at 6 UTC, the damming ordinate was 17 cm above NDL (340.67 m above sea level), and the available flood capacity was 97% of the required value. Flood capacity was restored due to the retention of increased flows in the Soła catchment during the flood caused by rainfall in the first decade of the month.
Increased water supply was observed around 4 UTC on 30 August from the value of 22.4 m3∙s−1 to the first culmination of 108 m3∙s−1, which occurred around 15 UTC. It was followed by a decrease in the water supply to the value of 61.6 m3∙s−1, recorded on August 31 at 6.00 UTC. Until 8.00 UTC on 30 August, the Soła cascade worked according to the established energy schedule, limiting the outflow to Soła outside of the power plant’s operating time to a value ensuring biological flow. Total outflow at that time was approximately 4 m3∙s−1. As a result of sudden rains in the catchment area and forecasts indicating the possibility of a further increase in the water supply, at 8 UTC, the outflow was increased to 60 m3∙s−1, which was maintained during the first culmination. At the time of the culmination, the flood capacity of the reservoir of 36 million m3 was still to be used. The formation of the second high wave took place on 31 August after 10 UTC. At that time, the outflow of 60 m3∙s−1 was maintained. Due to the significant increase in the size of the water supply, the hourly increase in which even reached 100 m3∙s−1, the outflow was gradually increased, first to 140 m3∙s−1, and during the second culmination (31 August at 23 UTC, 521 m3∙s−1) to 210 m3∙s−1. For the next 11 h, the water supply was close to the culmination flow (485–505 m3∙s−1). A decrease in the volume of the water supply was not recorded until September 1, after 11.00 UTC. The conducted water management determined the retention of water in the reservoir, gradually filling its flood capacity. At the time of the culmination, the flood capacity of 30.5 million m3 was still available. In view of the continuing water supply in the following hours close to the registered maximum value and further filling of the flood capacity, on 1 September at 10 UTC, the outflow was increased to 320 m3∙s−1. The greatest filling of the reservoir occurred on 1 September at 18 UTC, and the remaining flood capacity was 14.3 million m3. During the high, 63% of the value of the reservoir’s flood capacity was used. From 2 September at 7 UTC, due to the decreasing water supply to the reservoir, the amount of outflow was reduced. Water management of the Soła cascade reservoirs during the flood is shown in Figure 7.
During the time preceding the highs, the elevation of the water table in the Świnna Poręba reservoir was above NDL. On 29 August at 6 UTC, it exceeded 12 cm of NDL, and the available flood capacity of the reservoir constituted 98% of its required size. Filling a part of the flood capacity was related to the retention of increased flows in the catchment area during the flood caused by rainfall in the first ten days of the month. Currently, the flood capacity of the reservoir is being restored through the flow through the power plant, close to the maximum expenditure of its turbine sets.
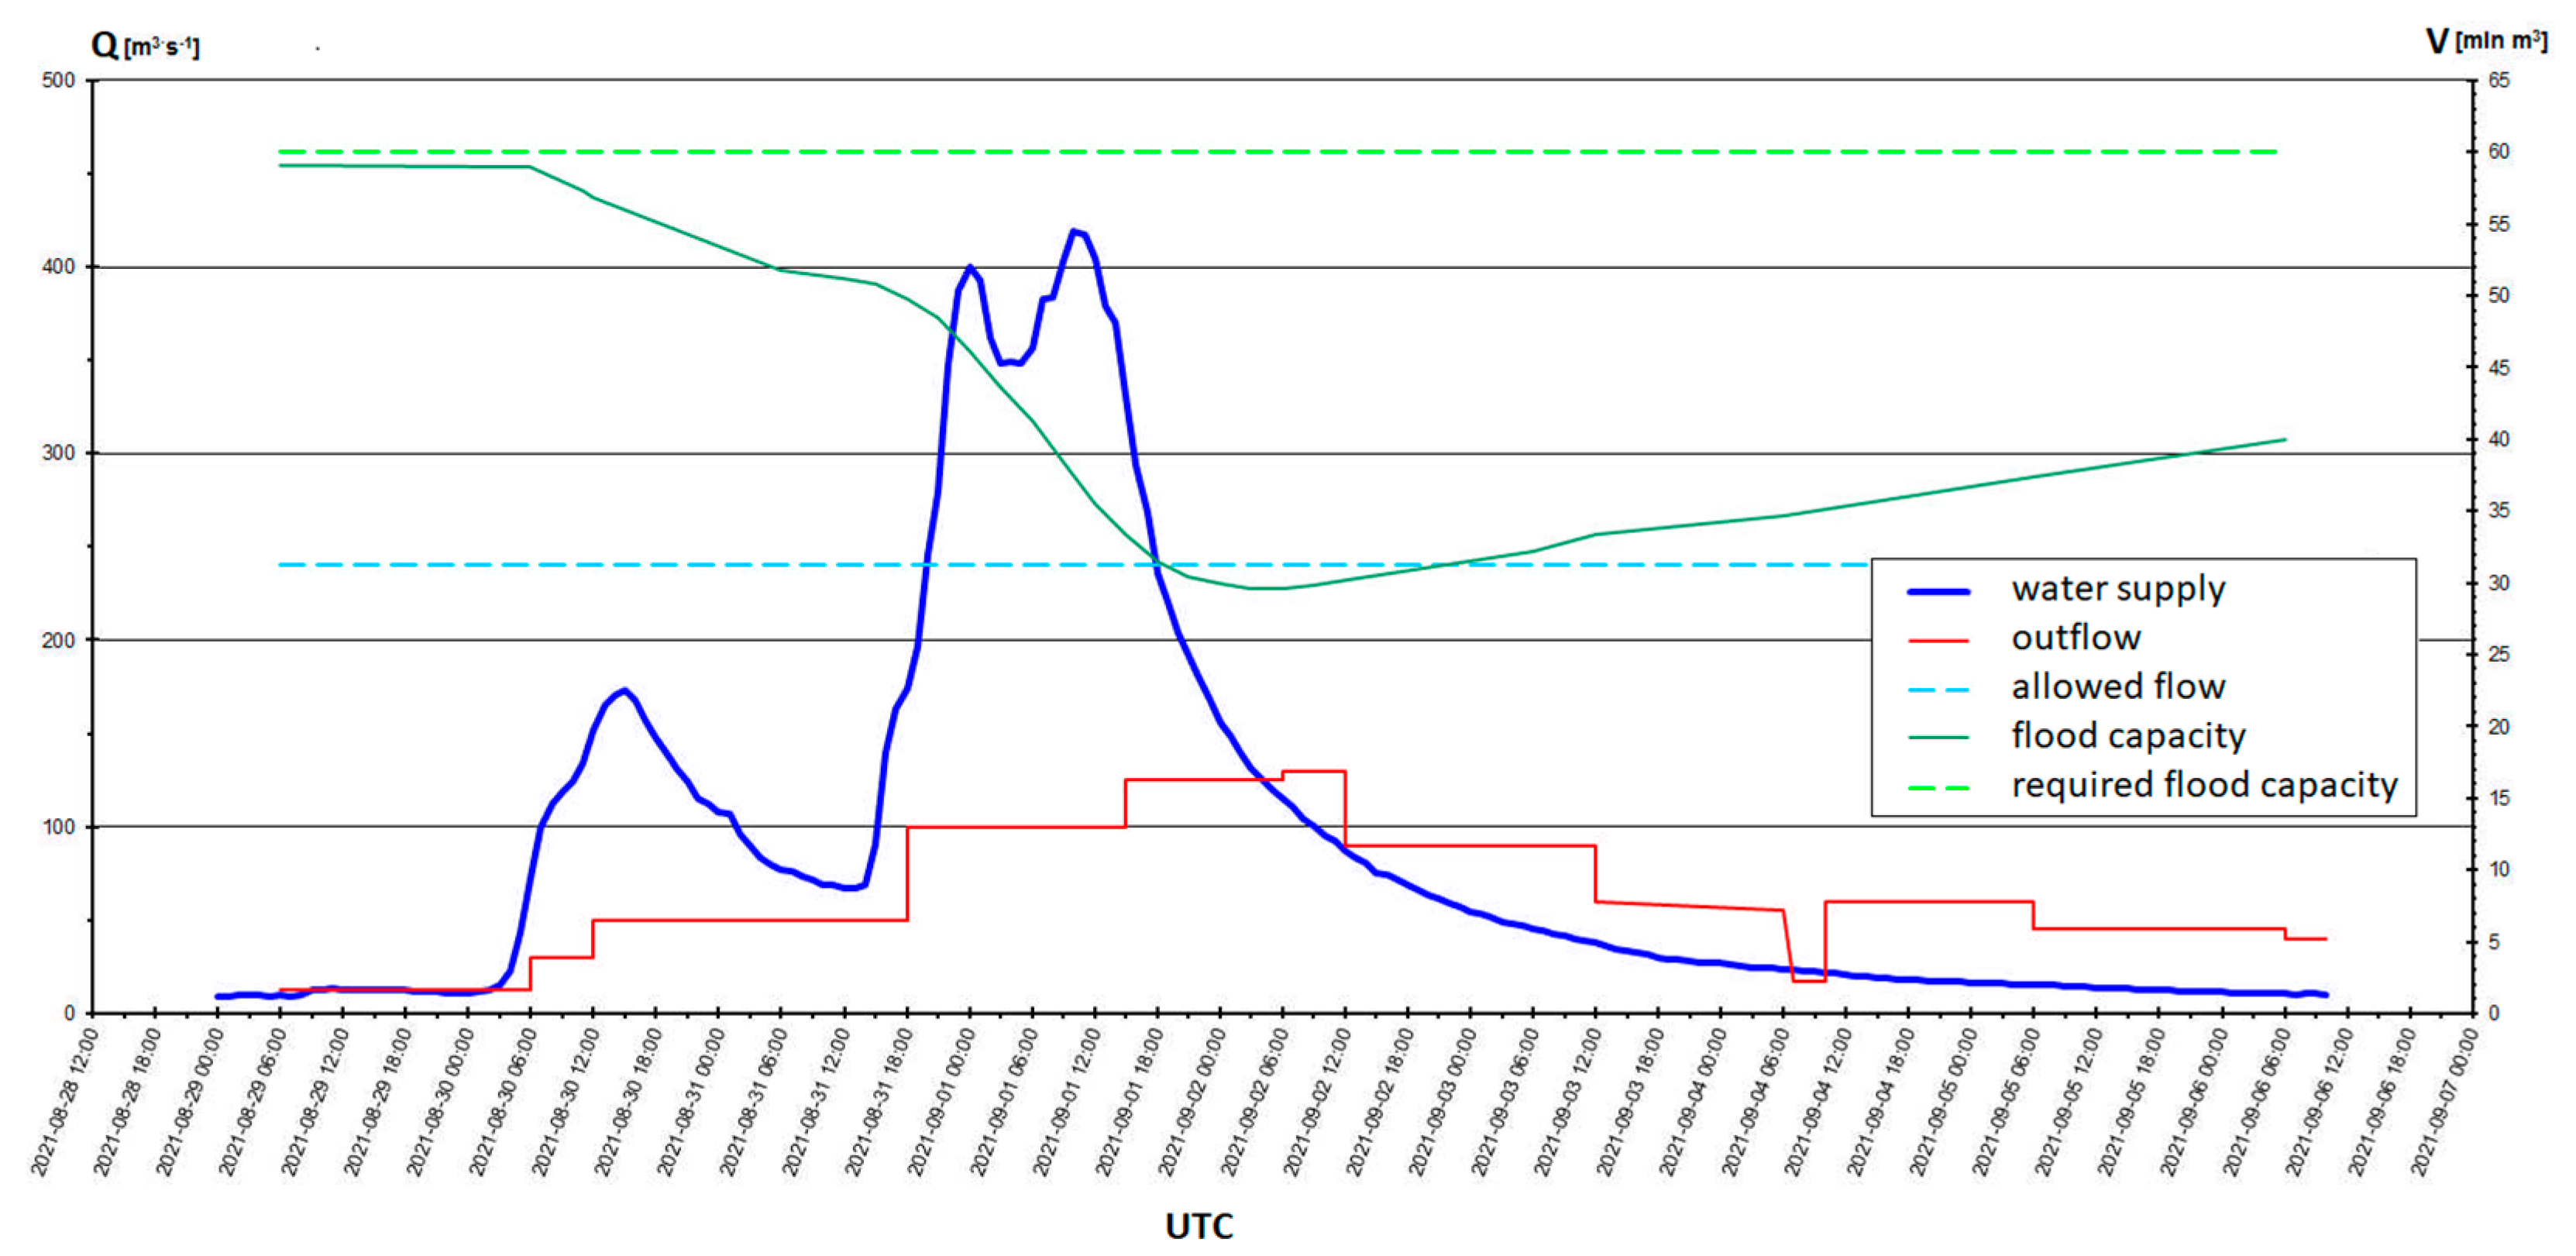
A rapid increase in the water supply to the reservoir took place on 30 August from the morning hours. The increase in the water supply was observed around 5 UTC from the value of 12 m3∙s−1 to the first culmination of 173 m3∙s−1, observed around 15 UTC, followed by a decrease in the water supply to 66.85 m3∙s−1, recorded on 31 August at 13 UTC. In the initial phase of the flood, the outflow from the reservoir of 12.5 m3∙s−1 was maintained. The first instruction to increase the outflow to 30 m3∙s−1 was made at 6 UTC on 30 August, with the current water supply to the reservoir amounting to 72.4 m3∙s−1. The first culmination of 173 m3∙s−1 (August 30 at 15 UTC) was reduced by the outflow of 50 m3∙s−1. The remaining flood capacity of the reservoir at that time was 55.4 million m3. Another increase in the water supply was recorded from 14 UTC on 31 August. The outflow increased to 100 m3∙s−1 took place on 31 August at 18 UTC. At that time, the formation of the second wave was observed, and the current water supply was 174 m3∙s−1. The outflow of 100 m3∙s−1 was also maintained during subsequent culminations of 400 m3∙s−1 (on 1 September at 00 UTC) and 419 m3∙s−1 (maximum water supply to the reservoir recorded on 1 September at 10 UTC), filling the flood capacity to 37.4 million m3. In view of the persistently high values of the water supply to the reservoir and the decreasing size of the flood capacity, on 1 September at 15 UTC, the outflow was increased to 125 m3∙s−1. This outflow (with slight fluctuations to the value of 130 m3∙s−1) was maintained until 2 September, at 12 UTC. In the following days, due to the decreasing water supply, its size was limited, first to 90 m3∙s−1, then to 60 m3∙s−1. In the final phase of the flood, 40 m3∙s−1 were discharged from the reservoir (from 9 September, 06 UTC). The greatest filling of the reservoir occurred on 2 September at 1 UTC, and the remaining flood capacity was 29.6 million m3. During the flood, 51% of the value of the reservoir’s flood capacity was used. Water management of the Świnna Poręba reservoir during the flood is shown in Figure 8.
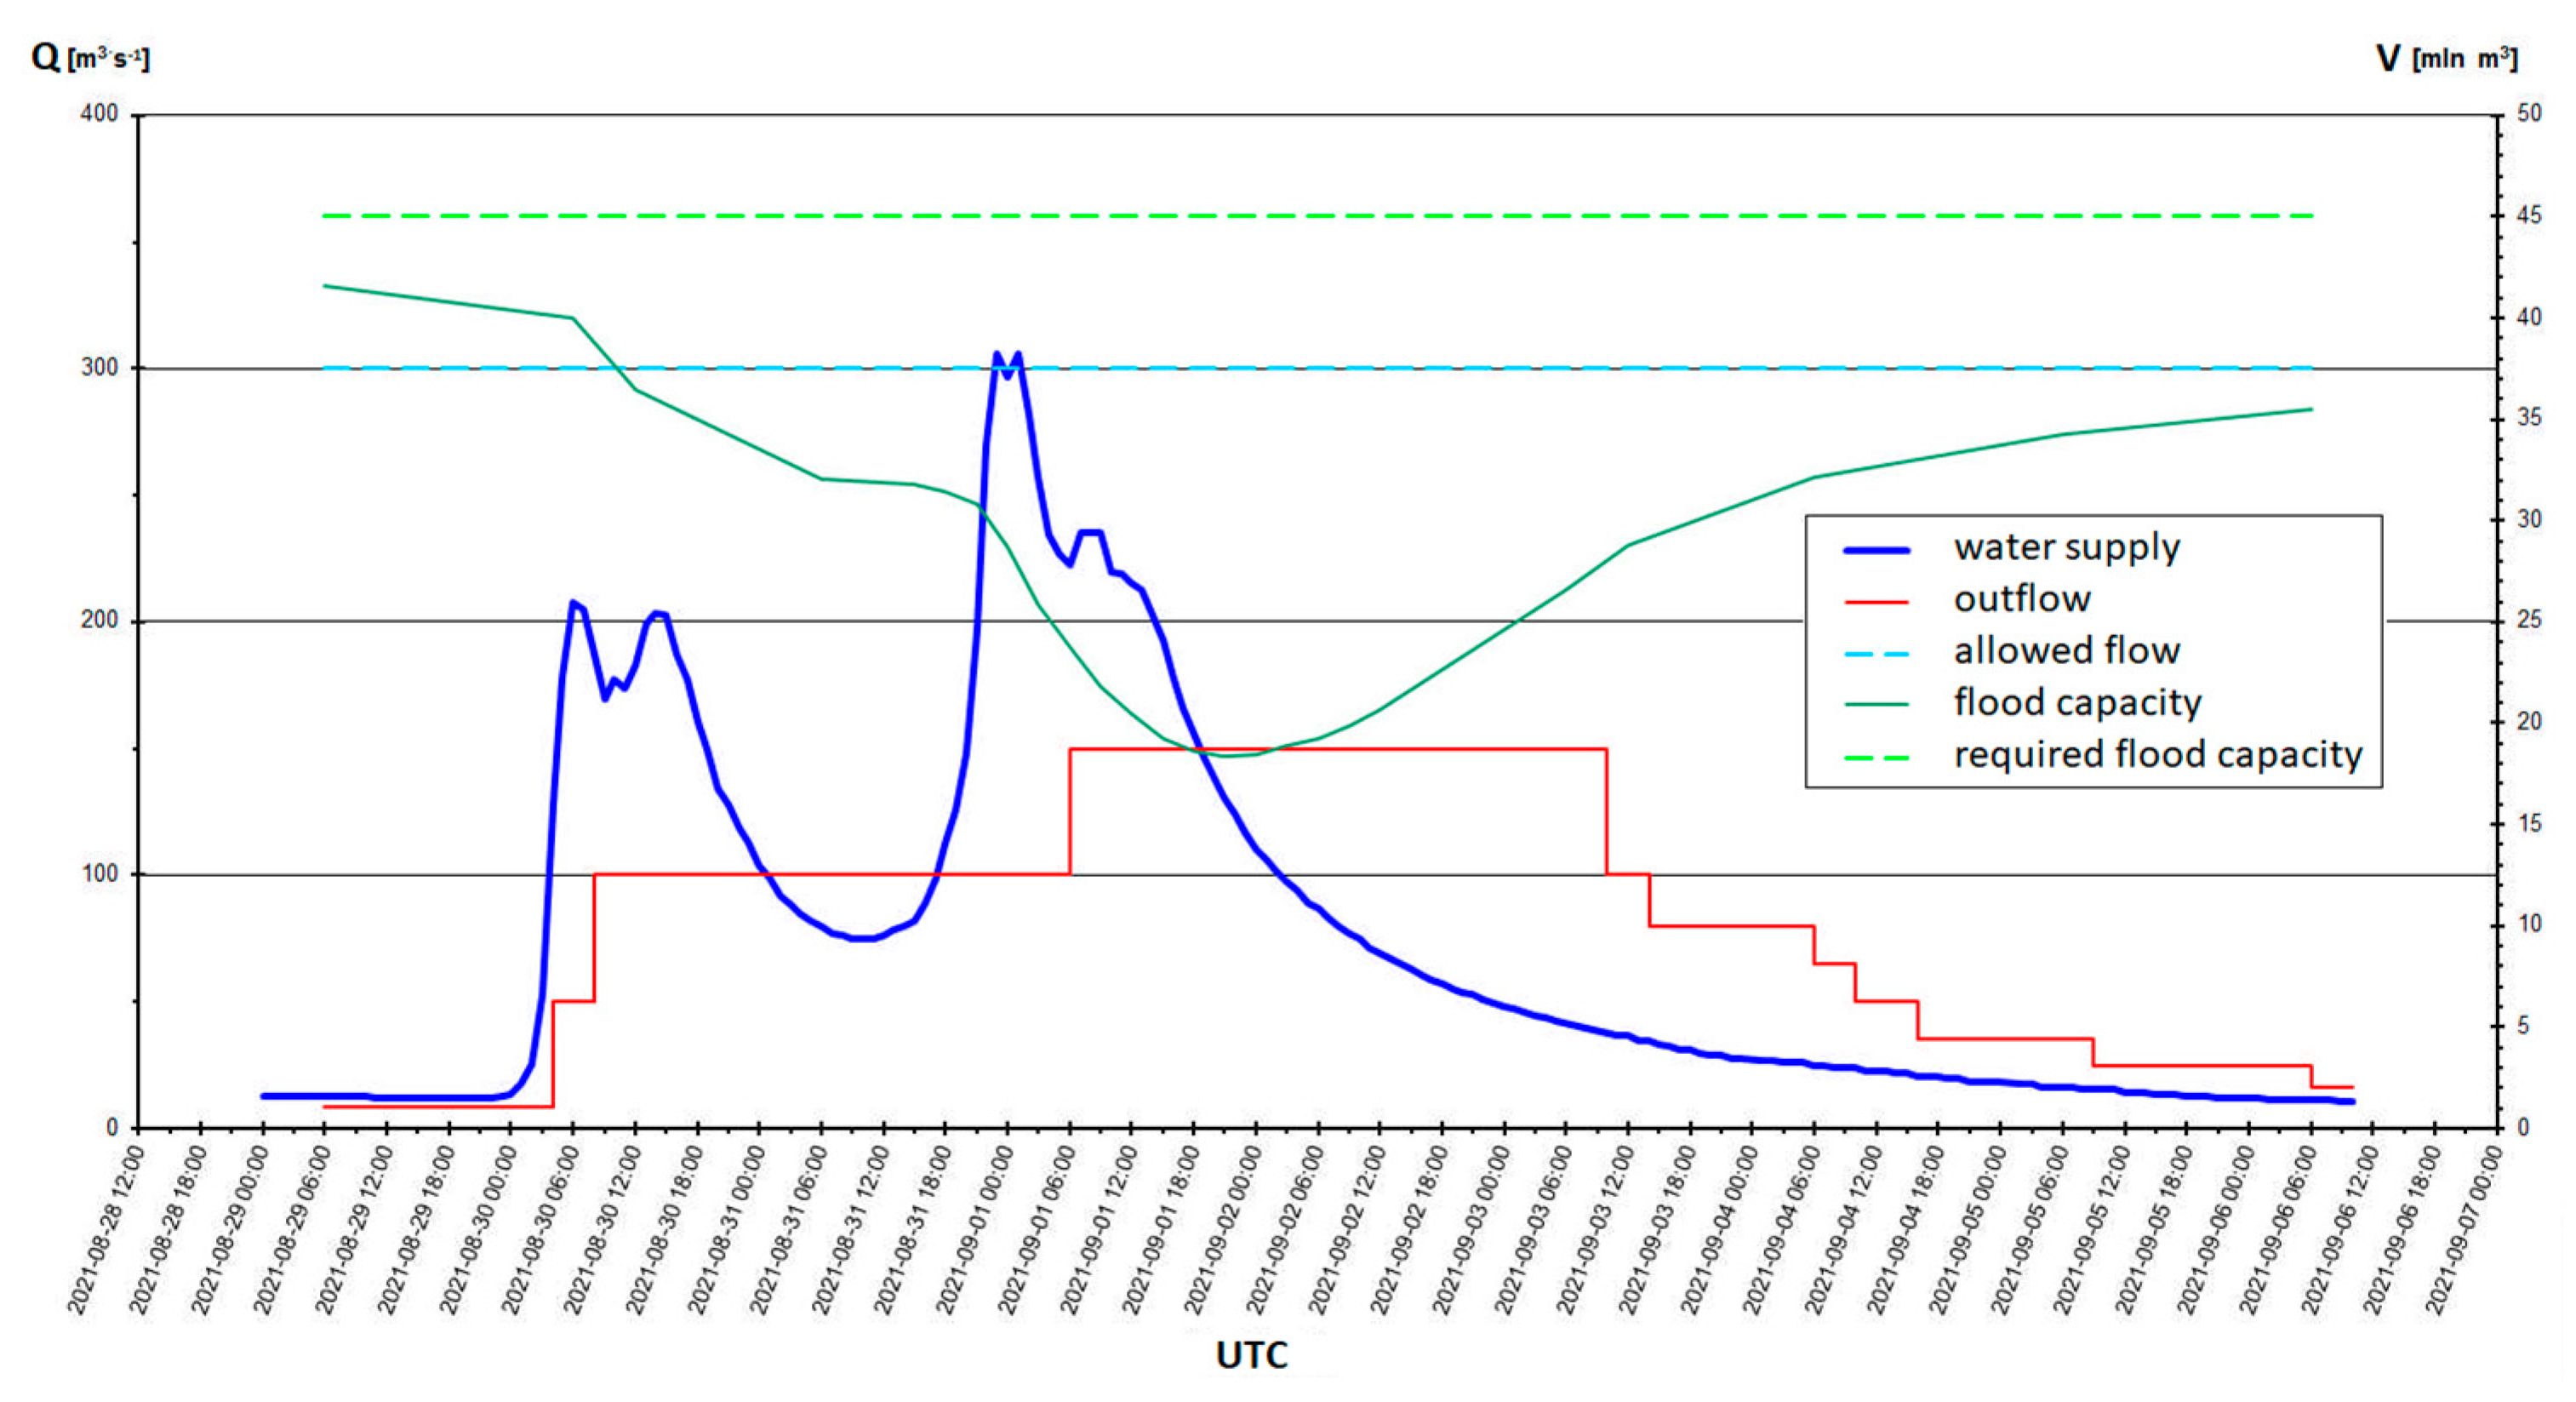
On the day preceding the flood, the Dobczyce reservoir also had a partially filled flood capacity. On 29 August at 6 UTC, damming in the reservoir was 39 cm higher than NDL. With the damming up in that period, the flood capacity was 41.6 million m3, i.e., 3.5 million m3 below the required value. A rapid increase in the water supply to the Dobczyce reservoir, shaping the flood wave, occurred on 30 August at 2 UTC. Within an hour, the water supply volume increased from 25.5 m3∙s−1 to 52.8 m3∙s−1 to reach the value of 128 m3∙s−1 in the next hour (30 August at 4 UTC). The first culmination of 208 m3∙s−1 occurred on 30 August at 6 UTC. After a short-term (about 4 h) decrease in the water supply volume (to the value of about 170 m3∙s−1), another increase in the flow was observed, and the second culmination of a similar size (203 m3∙s−1) was observed at 14 UTC. On 30, the outflow from the reservoir was set at 50 m3∙s−1 and was a response to the increased volume of the water supply. An outflow of this size was available until 8 UTC on 30 August. Then it increased to 100 m3∙s−1. In the following hours (until 31 August 12 UTC), a decrease in the water supply volume was noted, and the lowest value recorded at that time was 75 m3∙s−1. The second high wave was also characterized by rapid flow increases, and the largest one recorded within an hour exceeded 70 m3∙s−1. The formation time of the second wave was 12 h, and its culmination of 306 m3∙s−1 was observed on 31 August at 23 UTC. Due to the water supplies exceeding 200 m3∙s−1 maintained in the following hours and the further filling of the reservoir’s flood capacity, the outflow was increased to 150 m3∙s−1. The flood capacity of the reservoir was reconstructed by an outflow of this size (held until 3 September at 10 UTC). In the following days, the amount of the outflow was gradually reduced. The greatest filling of the reservoir occurred on 1 September at 21 UTC, and the remaining flood capacity was 18.3 million m3. Water management of the Dobczyce reservoir during the flood is shown in Figure 9.
3.4. Reservoir Operation Efficiency Analysis
The measure of the effective operation of the reservoirs is the percentage of reducing culmination flows and the volume of retained water, which directly determine the protection of the valley areas below the dam’s cross-section. It is also important to set the amount of outflow from reservoirs below the value defined as allowed. Even though this flow does not pose a direct flood risk, it can nevertheless induce significant changes in the river bed. Apart from the increased intensity of bottom sediment transport and changes in the morphology of the bottom and banks due to progressive bottom and side erosion processes, the elements of technical regulation (development) of the channel (barrages, thresholds, bank protection elements) remain vulnerable to damage.
The general characteristics of the course of the analyzed floods from 2014 and 2021 in selected catchments of the main Carpathian tributaries of the Vistula (Soła, Skawa, Raba) clearly indicate the decisive role of retention reservoirs in flood protection. Controlling a flood wave through water retention and determining the size of outflows from reservoirs significantly affect the formation of floods and the duration of culmination. Among the analyzed floods, the 2014 event was dominant in terms of the size of culmination flows and the volume of flood waves in individual catchments. According to the classification adopted by Punzet [27], the 2014 flood should be classified as catastrophically large in the Skawa and Raba catchments (Q5% < Qmax) and large in the Soła catchment (Q10% < Qmax ≤ Q5%).
The flooding capacities of the reservoirs, as well as the accidental capacity available to them and the actions taken before the flood, determined the amount of retention and the effectiveness of the wave reduction. The obtained reduction in the culmination in the Soła cascade was 67%, and in the Dobczyce reservoir—78%. The facilities of the Soła cascade retained 40 million m3 of the water supply volume during the flood. The retention in the Dobczyce reservoir was also close to this value (39 million m3).
During the high, in view of the decreasing size of the available flood capacity of the reservoirs on the Soła and Raba rivers, it was decided to increase the outflow above the amount of outflow allowed. On the Soła river, the permitted outflow was exceeded by 85 m3∙s−1, and on the Raba river downstream from Dobczyce by 100 m3∙s−1 [21]. It is worth noting, however, that the decisions were made after the culmination passed, and the time of maintained outflow of this size was about one day (in the case of the Dobczyce reservoir—about 30 h). Additionally, in the Raba catchment area, the second important factor of this decision, taking into account the hydrological situation in the Raba catchment area downstream from the reservoir, was the time when it was decided to increase the outflow. It should be noted that the maximum outflow from the reservoir was set around 7 h after the first culmination on the Stradomka river (the Raba tributary downstream from the reservoir).
Particularly noteworthy is the operation of the Świnna Poręba reservoir, which was still under construction in 2014. Thanks to the reservoir, the flood was reduced to a value lower than the outflow allowed, and the wave culmination was reduced by as much as 80%. The high efficiency of culmination reduction resulted from the fact that the reservoir was not filled before it was flooded. Water management of the reservoir allowed for the retention of over 45 million m3 of the water supply volume.
The experiences of the past flood decided to change the water management instructions for the facilities of the Soła cascade and the Dobczyce reservoir. The changes in flood capacity introduced in 2016 for the Soła cascade and in 2017 for Dobczyce increased their value to 38.8 million m3 for Tresna and 45.05 million m3 for Dobczyce (Table 1), i.e., by 25% and 33% in relation to the volumes applicable at the time of the floods in 2014.
Despite the damming levels in the reservoirs in the time preceding the flood in 2021 exceeding NDL, from 92% (for Dobczyce) to 98% (for Świnna Poręba) of the available flood capacity of the reservoirs was still available. On the Tresna reservoir, this value was 97% of the value required by the water management instruction.
The average flood in the Soła, Skawa, and Raba catchment areas at the turn of August and September 2021, which is the average high in the Punzet classification [27], was successfully reduced in retention reservoirs. The water management carried out in the facilities of the Soła cascade enabled reducing the culmination of the flood wave by the Tresna reservoir by 45% (the first culmination) and 60% (the amount of flow reduction 521 m3∙s−1). It should be noted that during the flood, no outflows larger than the assumed value of allowed flow were available from the cascade facilities.
The operation of the Świnna Poręba reservoir allowed forreduction of the culmination of the flood wave by 71% (the first culmination) and 76% (the amount of flow reduction 419 m3∙s−1). The value of the outflow was not exceeded on Skawa as well.
The obtained reduction in the flood wave culmination by the Dobczyce reservoir was 51% (the first culmination) and 67% (the amount of flow reduction 306 m3∙s−1). As on Soła and Skawa, also on the Raba river, the outflow from the reservoir did not exceed the permitted flow.
The volume of the accumulated water supply in the case of Tresna and Dobczyce amounted to 23 million m3, while the highest retention (29 million m3) was obtained in Świnna Poręba. During the flood, the value of the outflow is significant, as for all objects, it was set below the allowed value, and for Świnna Poręba and Dobczyce, the differences between the maximum amount of the outflow and the value of the allowable outflow were special. For Dobczyce, the established maximum outflow was half the value of the permitted outflow, and for Świnna Poręba, it was 110 m3∙s−1 lower than that.
Despite relatively low culmination flows (in relation to historical events), the characteristic feature of the flood at the turn of August and September 2021 was the multiple waves and the long culmination time of the flood in the Soła catchment (11 h), which determined the undertaken water management in reservoirs in relation to the uncertainty of forecasts.
4. Discussion
The operation of retention reservoirs reducing the flood wave on watercourses in individual catchments of the basin should contribute to obtaining this result also in the receiver bed. The risk of the culmination of the water supply overlapping with the culmination of the receiver is an extremely unfavorable phenomenon. In the basin of the upper Vistula, as Punzet notes [27], analyzing the historical floods before the construction of the Świnna Poręba reservoir, the Skawa wave has a significant impact on the course, shape, and culmination of the Vistula, usually preceding it. The analysis of the flood in July 1903, during which the outflow of the Soła river exceeded that of the Vistula, leads to similar conclusions. The culmination of the Soła river resulted in an earlier (by a dozen or so hours) culmination of the Vistula than that flowing from the upper part of the Vistula basin [27]. The Raba highs also have a significant impact on the wave formation on the Vistula. Punzet’s studies [27] show that they are ahead of the Vistula wave. The Dunajec river, such as the previous tributaries of the Vistula, generally has an earlier culmination of highs. On the other hand, highs on the San river are characterized by a slower course and longer duration than the higher tributaries flowing into the Vistula. As a rule, the San high wave extends the duration of flows close to the culmination [27]. Among the Carpathian tributaries of the Vistula River, the Soła and Dunajec rivers have the greatest share in the great summer rises, which determine the course of the upper Vistula river, the shape of the wave, and the size of the culmination. In terms of water management of retention reservoirs, the results of Punzet’s studies recommend delaying the outflow in the upper part of the basin, including the Raba basin, and accelerating the outflow of the Dunajec [28]. Due to the insufficient flood capacity of Rożnów, required in the case of large floods, it is indicated that the largest possible volumes should be passed through Rożnów-Czchów facilities in the initial stage of a high, while the limitation of the outflow and main retention should occur when the Vistula culmination is downstream from Krakow.
On the main right-bank tributaries of the Vistula (with the exception of the Wisłoka), there are retention reservoirs that enable controlled water management. Therefore, a rational operation of the reservoirs in the river system of the upper Vistula basin is decisive in the course of highs. Proper water management of reservoirs should ensure a delay or acceleration of waves in the basin catchments so that their culminations do not overlap. Their flood capacity should be filled in a planned manner.
The obtained results showed that despite the occurrence of a large flood in the Soła catchment in 2014 and a catastrophically high flood in the Skawa and Raba catchments, the operation of retention reservoirs allowed for an effective reduction in the wave culmination: the Soła cascade by 67%, the Dobczyce reservoir by 78% and the remaining in during the construction of the Świnna Poręba reservoir by 80%. On the other hand, in 2021, an average high flood was recorded, and the activity of the facilities was 45%, 51%, and 71%, respectively. For comparison, with much lower flows recorded in 2020, the reduction in the flood wave through the Tresna reservoirs, 86% of Dobczyce and Świnna Poręba reservoirs, was as much as 97% [30]. On the other hand, the available data on the operation of additional reservoirs and polders in Poland shows different results, which may be influenced primarily by their different parameters and sizes of floods. The reduction in the culmination of the flood wave on the Oder by the Racibórz reservoir in 2020 was about 30% [31], and for the discharge of 800 m3/s−1 and 1070 m3/s−1, the reduction in the climax would be 1.64 m (18% reduction) and 1.07 m (12%), respectively [32]. The Golina Polder could reduce the discharge on the associated section of the Warta by almost 24% [33] or about 18% [34]. On the other hand, the results of the operation of the Wisła Czarne reservoir on the Vistula River are the most similar to the analyzed reservoirs. The reduction in the maximum flow is possible by 81% [35].
Other examples from the world show that the efficiency of retention reservoirs during floods varies. Research conducted in the field of Chipembe Dam in Mozambique indicates that it is possible to reduce peak flow [36]. After the Dez Dam of the Dez River in Iran heightens, the flood retention volume will be increased to 50% (total capacity from 2650 to 3200 million m3), reducing flood damage by up to 80% [37].On the other hand, in 2018, reservoir operations in the Periyar river basin in India could not have helped avoid the flood situation, as only 16–21% peak attenuation was possible by emptying the reservoir in advance [38]. However, keep in mind that ignoring flow regulation by dams, the average number of people exposed to flooding below dams amounts to 9.1 and 15.3 million per year by the end of the 21st century (holding population constant). Accounting for dams reduces the number of people exposed to floods by 20.6% and 12.9%, respectively [39].
The acquired experience results in the implementation of solutions aimed at improving the management of the functioning of reservoirs during subsequent highs. For example, conclusions resulting from the floods on the Danube in 2002 and 2013 let stating that the flood protection measures applied significantly reduced the damage, as compared to the unprotected scenario. However, it was also determined that many of them are still needed: dikes and polders for flood retention and non-structural measures, including spatial planning and increasing the readiness of residents [40]. It was similar in the case of the analyzed highs in the upper Vistula basin, where the acquired knowledge led to a change in water management instructions for individual reservoirs, i.e., documents defining the principles of management under various hydrological and meteorological scenarios [18]. They describe the functioning of a given water device while maintaining rational water management, i.e., effective management of reservoir networks both for the purposes of flood protection and minimizing losses in the volume of stored water, which should be used to meet other functions along with ensuring an uninterrupted flow or flow guaranteed. Increased hydrological variability, resulting in more extreme droughts and floods, requires larger storage capacities to maintain the required level of water supply or flood protection [41].
In connection with the above, optimization of the operation of reservoirs requires taking into account the possibility of functioning in a period of drought when managing water. In such a situation, there is a risk of quickly depleting usable capacity, making it impossible to ensure an uninterrupted flow and cover the water needs of enterprises. Therefore, the water management instructions for the analyzed reservoirs: Dobczyce on the Raba river [21] and those included in the Soła cascade: Tresna, Porąbka, and Czaniec [23] define the procedure to be followed during drought, including cooperation with other plants and water devices located upstream and downstream from the water device. In this regard, the most detailed action plan has been proposed for the Dobczyce reservoir, where, in conditions of low flows (water supply to the reservoir below 3.5 m3∙s−1) and natural exhaustion of the equalizing layer to a level below 264.00 m above sea level, the guaranteed flow from the reservoir is limited to 1.46 m3∙s−1. Satisfying the needs of users is carried out in the following order: the key is to ensure an uninterrupted flow at the indicated level of 1.46 m3∙s−1 and then to enable the consumption of the water supply for municipal needs—up to 2.5 m3∙s−1 [21]. On the other hand, in the case of water reservoirs located on the Sola river, such detailed rules of water distribution during droughts were not specified, indicating only the need to limit consumption in the amount depending on the reported hydrological situation and analyzed forecasts. Then, in the first place, water consumption by industry and fish ponds should be limited, and when limiting municipal flows, it is appropriate to take into account the possibility of using other sources of supply by water supply systems [23]. The rules have not been introduced for the Świnna Poręba reservoir on the Skawa River [22].
To maintain the intact flow in the river bed below the reservoir and to ensure the flow is guaranteed to all users, an appropriate available volume of retained water resources is required, i.e., its volume between NDL and MinDL. During periods of low flow, the operation of the reservoirs takes place in conditions of water shortage, and the determined outflow exceeds the current water supply. The daily balance of the reservoir is negative, and its filling decreases. This phenomenon is exacerbated by the evaporation of retained water in the summer. The described situation, recorded in the past decade in the catchments of the upper Vistula basin, directly affects the working conditions of reservoirs. The analysis of average flows in the summer months in the Skawa catchment area shows that in the years 2010–2020, in June and August, the values were lower than the required outflow from the Świnna Poręba reservoir, the main part of which is the flow necessary to cover the needs of users. In the last decade, the flow balance, being the ratio of the water supply to the reservoir and the established outflow, is also unfavorable in the remaining summer months. In view of persistent water shortages, also during autumn, when the supply of surface and groundwater is the lowest, it is necessary to manage water in reservoirs in a way that allows the use of retained resources with low flows, as long as possible. Limiting the number of flows guaranteed to users at the stage of issuing permits also remains to be considered.
Nevertheless, the aforementioned rational water management and the practical knowledge of the personnel responsible for the operation of individual water facilities used for this very often enable counteracting the occurrence of the phenomenon of drought and eliminating possible limitations in the use of water resources. This type of action should be taken as recommendations for the use of other reservoirs in the work of key importance for retention and the related prevention of the effects of drought. At the same time, it should be noted that data availability may play a key role and, simultaneously, a limitation in the case of many reservoirs. In the event of a flood, ongoing monitoring of the hydrological and meteorological situation and frequent preparation of reports play a vital role. Such actions pay off in the effective fight against flooding and, as in this case, are the basis for subsequent analyzes within the operation of retention reservoirs. On the other hand, it is also a factor that not everyone can conduct analyzes with such a high degree of detail. The limitation is that unique parameters characterize each reservoir (mostly size and flood capacity), each catchment area (for example, land slopes and use), and each flood (including the size of water supplies and outflows with distribution over time). Hence, it isn’t easy to compare the work of different objects and draw clear conclusions, and sometimes the results are so different that the comparison is almost impossible.
It is also worth noting that in the management of highs in the upper Vistula basin, and in particular in making the right decisions when determining the operation of retention reservoirs, the State Water Holding Polish Waters will use IT tools developed as part of the task carried out under the Project of Flood Protection in the Odra and Vistula Basin 4B.1—Construction of Operating Centers in the Regional Water Management Authority in Wroclaw and the Regional Water Management Authority in Krakow, financed by the World Bank. As part of the project, a hydraulic model of the river basin will be developed. It will enable, on the basis of IMWM-NRI forecasts, to control the water management of reservoirs in the most appropriate way. The river network introduced into the model and the retention reservoirs described by the control rules will make it possible to transform the flood wave and the most optimal amounts of outflows from the reservoirs for the entire river basin, thus ensuring an increase in flood protection.
5. Conclusions
Large volumes of flooding reservoirs on Skawa (60.1 million m3), Raba (45.1 million m3), and Soła (38.8 million m3) contribute to the effective reduction in flood waves resulting from short-term torrential rainfalls, often of a local nature. In such conditions, reduced culmination flows reach 95%, and the reservoirs clearly retain the water supplying. In cases where the forecasts indicate a short duration of the phenomenon, it is common practice to maximize the retention effect, enabling partial filling of the flood capacity without a significant increase in the amount of outflow from the reservoir for the purpose of later use in the period of possible water shortages (preparatory measures for the occurrence of hydrological drought). The reduced high on the Skawa River in July 2021 is an example of such a method of operation. Then 9.5 million m3 were retained in the Świnna Poręba reservoir, increasing the outflow to only 14 m3∙s−1. The water supply to the reservoir during the culmination was about 120 m3∙s−1, and the outflow increased only after the culmination had passed when the damming on the reservoir exceeded the NDL ordinate and continued water supplies higher than the available outflow. Determining the operation of retention reservoirs is different in the case of long (several days) flooding rainfall, covering a significant part of the basin. Operating in a situation of uncertainty as to the size of the high (its culmination value, wave volume) forces to act pursuant to the water management instructions developed for the facilities. In practice, for effective retention, under conditions of favorable hydrological forecasts, actions are also taken that go beyond the workflow specified in the instructions.
The conducted research shows that in the case of both analyzed highs, decisions on the operation of the facilities, resulting from experience and analysis of forecasts, enabled effective reduction in flows in the catchment areas of the upper Vistula river basin. The acquired knowledge also enabled planning solutions for optimizing the operation of reservoirs in a different hydrological situation, i.e., not only the emerging highs but also low flows that may result in hydrological drought.
On the basis of the conducted research, it can also be concluded that reservoir retention has a decisive influence on the shaping of the flows in the river in relation to the observed climatic changes, making it possible to reduce the flows during periods of intense rainfall (highs) and to increase them in periods of drought. Reducing the amplitude of volumetric flow rate fluctuations and, thus, water levels has a positive effect on hydrodynamic processes, reducing, e.g., depth erosion, which in turn translates into a reduction in the rate of lowering the first aquifer in the area adjacent to the river. Therefore, the construction of large, small, and medium-sized reservoirs increases the broadly understood level of safety of residents both in periods of excess and shortage of water in a given watercourse and the catchment area upstream and downstream from the facility.
Author Contributions
Conceptualization: K.W. (Krzysztof Woś), R.R., T.T., K.W. (Krzysztof Wrzosek), and Ł.P.; methodology: T.T. and Ł.P.; validation: K.W. (Krzysztof Woś), R.R. and K.W. (Krzysztof Wrzosek); formal analysis: T.T. and Ł.P.; investigation: T.T. and Ł.P.; resources: T.T. and Ł.P.; writing—original draft preparation: T.T. and Ł.P.; writing—review and editing: R.R. and K.W. (Krzysztof Wrzosek), M.P.; visualization: T.T. and Ł.P.; supervision: K.W. (Krzysztof Woś). All authors have read and agreed to the published version of the manuscript.
Funding
The APC was funded by State Water Holding Polish Waters KZGW/KPŚ/397/2022.
Data Availability Statement
Publicly available data sets were analyzed in this study. These data can be found here: https://isap.sejm.gov.pl/isap.nsf/DocDetails.xsp?id=WMP20160000711 (accessed on 19 October 2022), https://eur-lex.europa.eu/legal-content/PL/TXT/?uri=CELEX%3A32007L0060 (accessed on 19 October 2022), https://stoppowodzi.pl (accessed on 19 October 2022), https://isap.sejm.gov.pl/isap.nsf/DocDetails.xsp?id=WDU20190001725 (accessed on 30 August 2022), https://dane.gov.pl/pl/dataset/2167,mapa-podzialu-hydrograficznego-polski-w-skali-110 (accessed on 30 August 2022), https://krakow.wody.gov.pl/aktualnosci/1171-skutecznosc-retention-reservoirs-in-the-flood-wave-reduction-in-the-water-region-of-the-upper-western-Vistula (accessed on 20 November 2022), https://stoppowodzi.pl/dlatego-nie-doszlo-do-powodzi/ (accessed on 20 November 2022).
Conflicts of Interest
The authors declare no conflict of interest.
References
- Yin, Q.; Ntim-Amo, G.; Ran, R.; Xu, D.; Ansah, S.; Hu, J.; Tang, H. Flood Disaster Risk Perception and Urban Households’ Flood Disaster Preparedness: The Case of Accra Metropolis in Ghana. Water 2021, 13, 2328. [Google Scholar] [CrossRef]
- Pinos, J.; Quesada-Román, A. Flood Risk-Related Research Trends in Latin America and the Caribbean. Water 2022, 14, 10. [Google Scholar] [CrossRef]
- Ikirri, M.; Faik, F.; Echogdali, F.Z.; Antunes, I.M.H.R.; Abioui, M.; Abdelrahman, K.; Fnais, M.S.; Wanaim, A.; Id-Belqas, M.; Boutaleb, S.; et al. Flood Hazard Index Application in Arid Catchments: Case of the Taguenit Wadi Watershed, Lakhssas, Morocco. Land 2022, 11, 1178. [Google Scholar] [CrossRef]
- Quesada-Román, A. Flood risk index development at the municipal level in Costa Rica: A methodological framework. Environ. Sci. Policy 2022, 133, 98–106. [Google Scholar] [CrossRef]
- Namara, W.G.; Damisse, T.A.; Tufa, F.G. Application of HEC-RAS and HEC-GeoRAS model for Flood Inundation Mapping, the case of Awash Bello Flood Plain, Upper Awash River Basin, Oromiya Regional State, Ethiopia. Model. Earth Syst. Environ. 2022, 8, 1449–1460. [Google Scholar] [CrossRef]
- Fischer, S.; Schumann, A.H. Multivariate flood frequency analysis in large river basins considering tributary impacts and flood types. Water Resour. Res. 2021, 57, e2020WR029029. [Google Scholar] [CrossRef]
- Resolution No. 79 of the Council of Ministers of June 14, 2016 on the Adoption of “Assumptions for the Development Plans of Inland Waterways in Poland for 2016–2020 with a Perspective Until 2030”. Available online: https://isap.sejm.gov.pl/isap.nsf/DocDetails.xsp?id=WMP20160000711 (accessed on 19 October 2022).
- Cyberski, J.; Grześ, M.; Gutry-Korycka, M.; Nachlik, E.; Kundzewicz, Z.W. History of floods on the River Vistula. Hydrol. Sci. J. 2006, 51, 799–817. [Google Scholar] [CrossRef]
- Kundzewicz, Z.W.; Szamalek, K.; Kowalczak, P. The Great Flood of 1997 in Poland. Hydrol. Sci. J. 1999, 44, 855–870. [Google Scholar] [CrossRef]
- Cea, L.; Costabile, P. Flood Risk in Urban Areas: Modelling, Management and Adaptation to Climate Change. Hydrology 2022, 9, 50. [Google Scholar] [CrossRef]
- Sahoo, S.N.; Pekkat, S. Development of Flood Inundation Maps and Quantification of Flood Risk in an Urban Catchment of Brahmaputra River.ASCE-ASME. J. Risk Uncertain. Eng. Syst. Part A Civ. Eng. 2015, 3, A4015001. [Google Scholar] [CrossRef]
- Directive 2007/60/EC of the European Parliament and of the Council of 23 October 2007 on the Assessment and Management of Flood Risks. Available online: https://eur-lex.europa.eu/legal-content/PL/TXT/?uri=CELEX%3A32007L0060 (accessed on 19 October 2022).
- Information about Flood Risk Map. Available online: https://stoppowodzi.pl (accessed on 19 October 2022).
- Pinos, J.; Timbe, L. Mountain Riverine Floods in Ecuador: Issues, Challenges, and Opportunities. Front. Water 2020, 2, 545880. [Google Scholar] [CrossRef]
- Nofal, O.M.; van de Lindt, J.W. High-resolution flood risk approach to quantify the impact of policy change on flood losses at community-level. Int. J. Disaster Risk Reduct. 2021, 62, 102429. [Google Scholar] [CrossRef]
- Chen, J.; Guo, S.; Li, Y.; Liu, P.; Zhou, Y. Joint Operation and Dynamic Control of Flood Limiting Water Levels for Cascade Reservoirs. Water Resour. Manag. 2013, 27, 749–763. [Google Scholar] [CrossRef]
- Pieron, Ł.; Absalon, D.; Habel, M.; Matysik, M. Inventory of Reservoirs of Key Significance for Water Management in Poland—Evaluation of Changes in Their Capacity. Energies 2021, 14, 7951. [Google Scholar] [CrossRef]
- Regulation of the Minister of Maritime Economy and Inland Navigation of 21 August 2019 on the Scope of Water Management Instructions. Available online: https://isap.sejm.gov.pl/isap.nsf/DocDetails.xsp?id=WDU20190001725 (accessed on 30 August 2022).
- Map of the Hydrographic Division of Poland in Scale 1: 10000. Available online: https://dane.gov.pl/pl/dataset/2167,mapa-podzialu-hydrograficznego-polski-w-skali-110 (accessed on 30 August 2022).
- Pieron, Ł.; Wujek, A. Rozwój małej retencji w Polsce—Wdrażanie założeń do Programu Kształtowania Zasobów Wodnych [Development of small retention in Poland—Implementation of assumptions to the Water Resource Development Program]. Gospod. Wodna 2022, 5, 29–32. [Google Scholar]
- MGGP SA. Zbiornik Wodny Dobczyce—Instrukcja Gospodarowania Wodą [Dobczyce Water Reservoir—Water Management Manual]; MGGP SA: Tarnów, Poland, 2017. [Google Scholar]
- DHV Hydroprojekt Sp. z o.o. Zbiornik Wodny Świnna Poręba—Instrukcja Gospodarowania Wodą [Świnna Poręba Water Reservoir—Water Management Manual]; DHV Hydroprojekt Sp. z o.o.: Warszawa, Poland, 2015. [Google Scholar]
- DHV Hydroprojekt Sp. z o.o. Zbiorniki Kaskady Soły: Tresna, Porąbka, Czaniec—Instrukcja Gospodarowania Wodą [Soła Cascades Reservoirs: Tresna, Porąbka, Czaniec—Water Management Instructions]; DHV Hydroprojekt Sp. z o.o.: Warszawa, Poland, 2016. [Google Scholar]
- Matysik, M.; Absalon, D.; Habel, M.; Maerker, M. Surface Water Quality Analysis Using CORINE Data: An Application to Assess Reservoirs in Poland. Remote Sens. 2020, 12, 979. [Google Scholar] [CrossRef] [Green Version]
- Regional Water Management Authority of the State Water Holding Polish Waters—Unpublished Data of the Operational Center for Flood Protection, from the IMWM-NRI Telemetry System, Provided by the IMWM-NRI.
- Regional Water Management Authority of the State Water Holding Polish Water—Unpublished Data of the Operational Center for Flood Protection Based on Operational Data (Regular Monitoring of the Hydrological and Meteorological Situation).
- Punzet, J. Występowanie katastrofalnych wezbrań w karpackiej części dorzecza Wisły [Occurrence of catastrophic floods in the Carpathian part of the Vistula basin]. Folia Geogr. 1999, 29–30, 83–111. [Google Scholar]
- Punzet, J. Przebieg wezbrania w dorzeczu górnej Wisły. W Powódź w Roku 1960, Materiały Monograficzne IGW PIHM [The course of the flood in the basin of the upper Vistula. In Flood in 1960, IGW PIHM Monographic Materials]; Wydawnictwa Komunikacji i Łączności WKŁ: Warszawa, Poland, 1967; pp. 33–94. [Google Scholar]
- IMGW-PIB. Dorzecze Wisły—Monografia Powodzi Maj-Czerwiec 2010 [Vistula River Basin—Flood Monograph May–June 2010]; Maciejewski, M., Ostojski, S., Walczykiewicz, T., Eds.; IMGW-PIB: Warszawa, Poland, 2011; p. 236. [Google Scholar]
- Regional Water Management Authority in Krakow State Water Holding Polish Waters Data. Available online: https://krakow.wody.gov.pl/aktualnosci/1171-skutecznosc-retention-reservoirs-in-the-flood-wave-reduction-in-the-water-region-of-the-upper-western-Vistula (accessed on 20 November 2022).
- State Water Holding Polish Waters Data. Available online: https://stoppowodzi.pl/dlatego-nie-doszlo-do-powodzi/ (accessed on 20 November 2022).
- Stodolak, R. Studium redukcji fali powodziowej w 2010 roku przez zbiornik Racibórz i polder Buków. Infrastrukt. I Ekol. Teren. Wiej. 2012, 3, 235–244. [Google Scholar]
- Malinger, A.; Przedwojski, B. Wykorzystanie modelu matematycznego do charakterystyki hydraulicznej Doliny Konińsko-Pyzderskiej Warty. Nauka Przyr. Technol. 2007, 1, 2. [Google Scholar]
- Malinger, A.; Wawrzyniak, M.; Rybacki, M.; Dysarz, T.; Szałkiewicz, E. Reducing flood hazard by effective polder operation: A case study of the Golina polder. Meteorol. Hydrol. Water Manag. 2022. [Google Scholar] [CrossRef]
- Madzia, M. Funkcje zbiornika retencyjnego Wisła-Czarne w redukcji fali powodziowej. Inżynieria Ekol. 2017, 41, 173–180. [Google Scholar] [CrossRef] [Green Version]
- Álvarez, M.; Puertas, J.; Peña, E.; Bermúdez, M. Two-Dimensional Dam-Break Flood Analysis in Data-Scarce Regions: The Case Study of Chipembe Dam, Mozambique. Water 2017, 9, 432. [Google Scholar] [CrossRef] [Green Version]
- Amini, R. Dez Dam Rehabilitation Project Role in FloodDamage Reduction. E3S Web Conf. 2022, 346, 02007. [Google Scholar] [CrossRef]
- Sudheer, K.P.; Bhallamudi, S.M.; Narasimhan, B.; Thomas, J.; Bindhu, V.M.; Vema, V.; Kurian, C. Role of dams on the floods of August 2018 in Periyar River Basin, Kerala. Curr. Sci. 2019, 116, 780–794. [Google Scholar]
- Boulange, J.; Hanasaki, N.; Yamazaki, D.; Pokhrel, Y. Role of dams in reducing global flood exposure under climate change. Nat. Commun. 2021, 12, 417. [Google Scholar] [CrossRef]
- Blöschl, G.; Nester, T.; Komma, J.; Parajka, J.; Perdigão, R.A.P. The June 2013 flood in the Upper Danube Basin, and comparisons with the 2002, 1954 and 1899 floods. Hydrol. Earth Syst. Sci. 2013, 17, 5197–5212. [Google Scholar] [CrossRef] [Green Version]
- Randle, T.J.; Morris, G.L.; Tullos, D.D.; Weirich, F.H.; Mathias Kondolf, G.; Moriasi, D.N.; Annandale, G.W.; Fripp, J.; Toby Minear, J.; Wegner, D.L. Sustaining United States Reservoir Storage Capacity: Need for a New Paradigm. J. Hydrol. 2021, 602, 126686. [Google Scholar] [CrossRef]
Figure 1.
Location of the analyzed reservoirs against the map of the hydrographic network and main catchments. Source: own study based on [19].
Figure 1.
Location of the analyzed reservoirs against the map of the hydrographic network and main catchments. Source: own study based on [19].

Figure 2.
Total rainfall distribution during the flood in May 2014. Source: own study based on [25].
Figure 2.
Total rainfall distribution during the flood in May 2014. Source: own study based on [25].

Figure 3.
Total rainfall distribution during the flood at the turn of August and September 2021. Source: own study based on [25].
Figure 3.
Total rainfall distribution during the flood at the turn of August and September 2021. Source: own study based on [25].

Figure 4.
Water management of Soła cascade reservoirs during the flood in May 2014. Source: own study based on [23,26].

Figure 5.
Water management of the Świnna Poręba reservoir during the flood in May 2014. Source: own study based on [26].
Figure 5.
Water management of the Świnna Poręba reservoir during the flood in May 2014. Source: own study based on [26].

Figure 6.
Water management of the Dobczyce reservoir during the flood in May 2014. Source: own study based on [26].
Figure 6.
Water management of the Dobczyce reservoir during the flood in May 2014. Source: own study based on [26].

Figure 7.
Water management of the Soła cascade reservoirs during the flood at the turn of August and September 2021. Source: own study based on [26].
Figure 7.
Water management of the Soła cascade reservoirs during the flood at the turn of August and September 2021. Source: own study based on [26].

Figure 8.
Water management of the Świnna Poręba reservoir during the flood at the turn of August and September 2021. Source: own study based on [26].
Figure 8.
Water management of the Świnna Poręba reservoir during the flood at the turn of August and September 2021. Source: own study based on [26].

Figure 9.
Water management of the Dobczyce reservoir during the flood at the turn of August and September 2021. Source: own study based on [26].
Figure 9.
Water management of the Dobczyce reservoir during the flood at the turn of August and September 2021. Source: own study based on [26].


Table 1.
Basic parameters of the analyzed reservoirs.
| No. | Name | River | Year of Construction | Area at MaxDL [ha] | Capacity | Flood Capacity [Million m3] | |
|---|---|---|---|---|---|---|---|
| At NDL [Million m3] | At MaxDL [Million m3] | ||||||
| 1 | Czaniec | Soła | 1967 | 50 | 1.3 | 1.3 | - |
| 2 | Dobczyce | Raba | 1986 | 1090 | 92.7 | 137.7 | 45.1 |
| 3 | Porąbka | Soła | 1936 | 327 | 22.0 | 26.5 | 4.5 |
| 4 | Świnna Poręba | Skawa | 2016 | 1050 | 100.7 | 160.8 | 60.1 |
| 5 | Tresna | Soła | 1967 | 965 | 53.9 | 92.7 | 38.8 |
Table 2.
Parameters of the catchment area of the analyzed reservoirs.
| No. | Catchment Area | River | Catchment Area [km2] | River Network Length [km] | River Network Density [km∙km−2] |
|---|---|---|---|---|---|
| 1 | Czaniec (Soła cascades) | Soła | 1118.8 | 930 | 0.83 |
| 2 | Dobczyce | Raba | 768.0 | 615 | 0.80 |
| 3 | Świnna Poręba | Skawa | 802.0 | 623 | 0.78 |
Notes: Source: own study based on [19].
Table 3.
Culmination values during floods in 2014 and 2021 in selected cross sections of the Soła, Skawa, and Raba rivers.
Table 3.
Culmination values during floods in 2014 and 2021 in selected cross sections of the Soła, Skawa, and Raba rivers.
| No. | River | Profile | Maximum Flow Rate [m3∙s−1] | |
|---|---|---|---|---|
| 2014 | 2021 | |||
| 1 | Soła | Cięcina | 389 | 249 |
| 2 | Skawa | Sucha Beskidzka | 535 | 279 |
| 3 | Raba | Stróża | 658 | 278 |
Publisher’s Note: MDPI stays neutral with regard to jurisdictional claims in published maps and institutional affiliations. |
© 2022 by the authors. Licensee MDPI, Basel, Switzerland. This article is an open access article distributed under the terms and conditions of the Creative Commons Attribution (CC BY) license (https://creativecommons.org/licenses/by/4.0/).
Share and Cite
MDPI and ACS Style
Woś, K.; Radoń, R.; Tekielak, T.; Wrzosek, K.; Pieron, Ł.; Piórecki, M. Role of Multifunctional Water Reservoirs in the Upper Vistula Basin in Reducing Flood Risk. Water 2022, 14, 4025. https://doi.org/10.3390/w14244025
AMA Style
Woś K, Radoń R, Tekielak T, Wrzosek K, Pieron Ł, Piórecki M. Role of Multifunctional Water Reservoirs in the Upper Vistula Basin in Reducing Flood Risk. Water. 2022; 14(24):4025. https://doi.org/10.3390/w14244025
Chicago/Turabian StyleWoś, Krzysztof, Radosław Radoń, Tomasz Tekielak, Krzysztof Wrzosek, Łukasz Pieron, and Michał Piórecki. 2022. "Role of Multifunctional Water Reservoirs in the Upper Vistula Basin in Reducing Flood Risk" Water 14, no. 24: 4025. https://doi.org/10.3390/w14244025
Note that from the first issue of 2016, this journal uses article numbers instead of page numbers. See further details here.