
Simulation Feedback of Temperature Field of Super-High Arch Dam during Operation and Its Difference with Design Temperature

1
Yongshan Xiluodu Hydroelectric Power Plant of Three Gorges Jinsha River Chuanyun Hydropower Development Co., Ltd., Zhaotong 657000, China
2
China Institute of Water Resources and Hydropower Research, Beijing 100038, China
*
Author to whom correspondence should be addressed.
Water 2022, 14(24), 4028; https://doi.org/10.3390/w14244028
Submission received: 11 October 2022
/
Revised: 18 November 2022
/
Accepted: 6 December 2022
/
Published: 9 December 2022
(This article belongs to the Special Issue Safety Monitoring and Management of Reservoir and Dams)
Abstract
:Temperature is one of the main loads of super-high arch dams. (1) Background: a super-high arch dam in southwest China was taken as an example in this paper and the temporal-spatial evolution law of dam temperature was analyzed based on the monitoring data. (2) Methods: the finite element simulation analysis method was adopted to invert the boundary conditions of temperature on the upstream surface and the thermal parameters of the concrete, and the temperature evolution process of the arch dam in long-term operation was simulated and analyzed. After the distribution characteristics of the designed reservoir water temperature and the actual reservoir water temperature were compared, the difference in the temperature field of the arch dam during the impoundment and operation under the designed and actual conditions was studied. (3) Results: the temporal-spatial evolution law of the temperature in the dam operation period accords with the conventional knowledge, and the calculated value through simulation feedback is in good agreement with the monitoring value, which can reflect the actual temperature field distribution of the dam. (4) Conclusions: under the design condition, the dam temperature rose slowly after closure grouting and then tended to be stable. Under the actual condition, the temperature rose by 7.1~9.2 °C after closure grouting, reached the highest temperature in about 8~12 years, and fell back to a stable temperature in 40~80 years.
1. Introduction
In China, a number of super-high arch dams have been built, such as the Ertan Arch Dam, Xiaowan Hydropower Project with Ultra-high Arch Dam and Jinping Level I Super High Concrete Arch Dam. All of them have been in service for many years with detailed and reliable monitoring data obtained. From the research and analysis, the working performance of super-high arch dams at the initial stage of impoundment and operation is quite different from that under the design condition [1,2]. The reason is that in the current code [3,4], the influence of nonlinear temperature differences in the dam section is not considered in the temperature load during operation, and the predicted reservoir water temperature is quite different from the measured value. Under such circumstances, Zhu [5] put forward a method to calculate the temperature load according to the actual upstream water level; Li et al. [6] used the analytical method and finite element method to calculate the temperature load of an arch dam, respectively, and considered that the results obtained by finite element method are consistent with the reality; Fu et al. [7] based on the simulation results of the whole process temperature field of the Xiaowan Arch Dam, established a simplified formula for temperature load by using the arch-beam load-distributed method.
Temperature is one of the main loads of super-high arch dams, so the simulation feedback of the arch dam temperature field has become an important step for many scholars to analyze the working performance of super-high arch dams. In order to master the temperature change process at the initial stage of operation and reduce the risk of concrete cracking, timely and accurate temperature monitoring is of great significance [8,9]. During the construction process, monitoring instruments such as thermometers [10,11,12,13], joint meters, and distributed optical fibers [14,15,16,17] are usually buried for monitoring. For example, a sophisticated automated system was installed on the large arch–gravity concrete Moste Dam [18]. This system is used for the measurement of concrete temperatures, as well as to monitor the water temperatures, the air temperature and the solar insolation. Ghafoori et al. [19] review the different techniques for calibration of distributed temperature sensor measurements as well as the methods of interpretation of the temperature data.
However, limited by the measuring points, it is impossible to obtain the full changing state of the temperature field of the whole dam body. Therefore, it is necessary to conduct an inverse analysis of the thermal parameters of the arch dam based on the temperature monitoring data, and further obtain the temperature field of the arch dam through simulating calculation. Up to now, the least square method [20], genetic algorithm [21], particle swarm optimization [22,23,24], neural network [25,26] and other methods have been used to invert the thermal parameters of dams. Additionally, many studies on the feedback analysis of the overall temperature field of the arch dam are conducted. For instance, Wang et al. [27] found that the actual temperature load of Ertan Arch Dam is quite different from the standard design temperature load by feeding back the temperature field of the dam during operation. Sheibany et al. [28] used the finite element method to determine the annual variation in temperature and thermal stresses of the Karaj arch dam in Iran and found that solar radiation is the main reason for the increasing temperature downstream. Mirković et al. [29] proposed a method for optimizing the monolith length by monitoring thermal tensile stresses, which is demonstrated through the numerical analysis of the temperature field and stress field of the concrete gravity dam Platanovryssi (Greece). Zhang et al. [30] revealed the reason for the temperature recovery after closure grouting by simulation feedback. Ding et al. [31] put forward a simulation feedback method of temperature field dynamic tracking based on the three-dimensional composite element method and applied this method to the simulation feedback of the Xiaowan Arch Dam temperature field. Liu et al. [32] simulated and fed back the quasi-stable temperature field of the super-high arch dam of Jinping I Hydropower Station by inversion of thermodynamic parameters based on monitoring data. Qiang et al. [33] used the improved P-version adaptive algorithm of the embedded model to simulate the temperature field of early concrete, which greatly improved the efficiency at the same accuracy. Zhang et al. [34] realized the remote real-time simulation of temperature stress by using high-performance computing technology and strengthened the monitoring and scientific management of concrete temperature control. Temperature is also the main contributor to the displacement of arch dams, so it is essential to accurately estimate its influence [35]. Some statistical models explicitly consider the data of thermometers embedded in dam concrete and improve the temperature influence by considering the actual temperature evolution and expressing the temperature field with linear effective temperature [36].
As the influence of concrete pouring, closure grouting, and impoundment during construction are not considered in the traditional finite element method, there is still a certain error between the working performance and the real state of the arch dam [37,38,39]. To solve this problem, Zhang et al. developed SPATIS software [40,41,42,43] and put forward the whole process simulation analysis method of the whole dam. In this method, one should consider the temperature load in the whole process and simulate the dam pouring from the first concrete block, the influence of concrete hydration reaction and temperature control measures, closure grouting, and impoundment and operation until the quasi-stable field is reached when simulating and calculating the temperature field of the dam. This method not only correctly considers the real temperature boundary conditions, but also takes the thermal stress in the construction period, the change of reservoir water level in the operation period and the nonlinear temperature difference under the condition of annual temperature change into consideration, which are not considered in the current code.
In this paper, a super-high arch dam in southwest China was analyzed. With the actual temperature monitoring data as a basis, the temporal-spatial evolution law of the temperature of the arch dam during its operation was analyzed. Besides, the finite element simulation analysis method was adopted to carry out simulation feedback analysis on the temperature field of the arch dam at the initial stage of impoundment and operation in consideration of the real temperature load. Based on the feedback analysis, the temperature field of the arch dam under the design and the actual conditions was simulated and calculated, and the difference in temperature field changes under the two conditions was studied, which provides technical support for the long-term safe operation management of the arch dam, and also provides a reference for the design of other super-high arch dams.
2. Calculation Principles and Methods
2.1. Calculation Principle of Unsteady Temperature Field
The temperature change of a homogeneous isotropic body as a function of time is described by the heat conduction equation [44]:
where is the concrete temperature [K], a is the thermal diffusivity [W·m/J], is the age [s], is the adiabatic temperature rise [K].
The first boundary condition:
where the concrete temperature is the known equation of time.
The second boundary condition:
where is the thermal coefficient [W/(m·K], n is the surface normal direction, is the boundary heat flux [W/m2].
The third boundary condition:
where is the convective heat transfer coefficient [W/(m2·K], is the ambient temperature.
2.2. Back Analysis of the Adiabatic Temperature Rise of Concrete
The adiabatic temperature rise of concrete varies with age, which is generally represented by one of the following three combination equations [44]:
where is the adiabatic temperature rise at the age of [K], is the final adiabatic temperature rise [K], m, n, a and b are parameters.
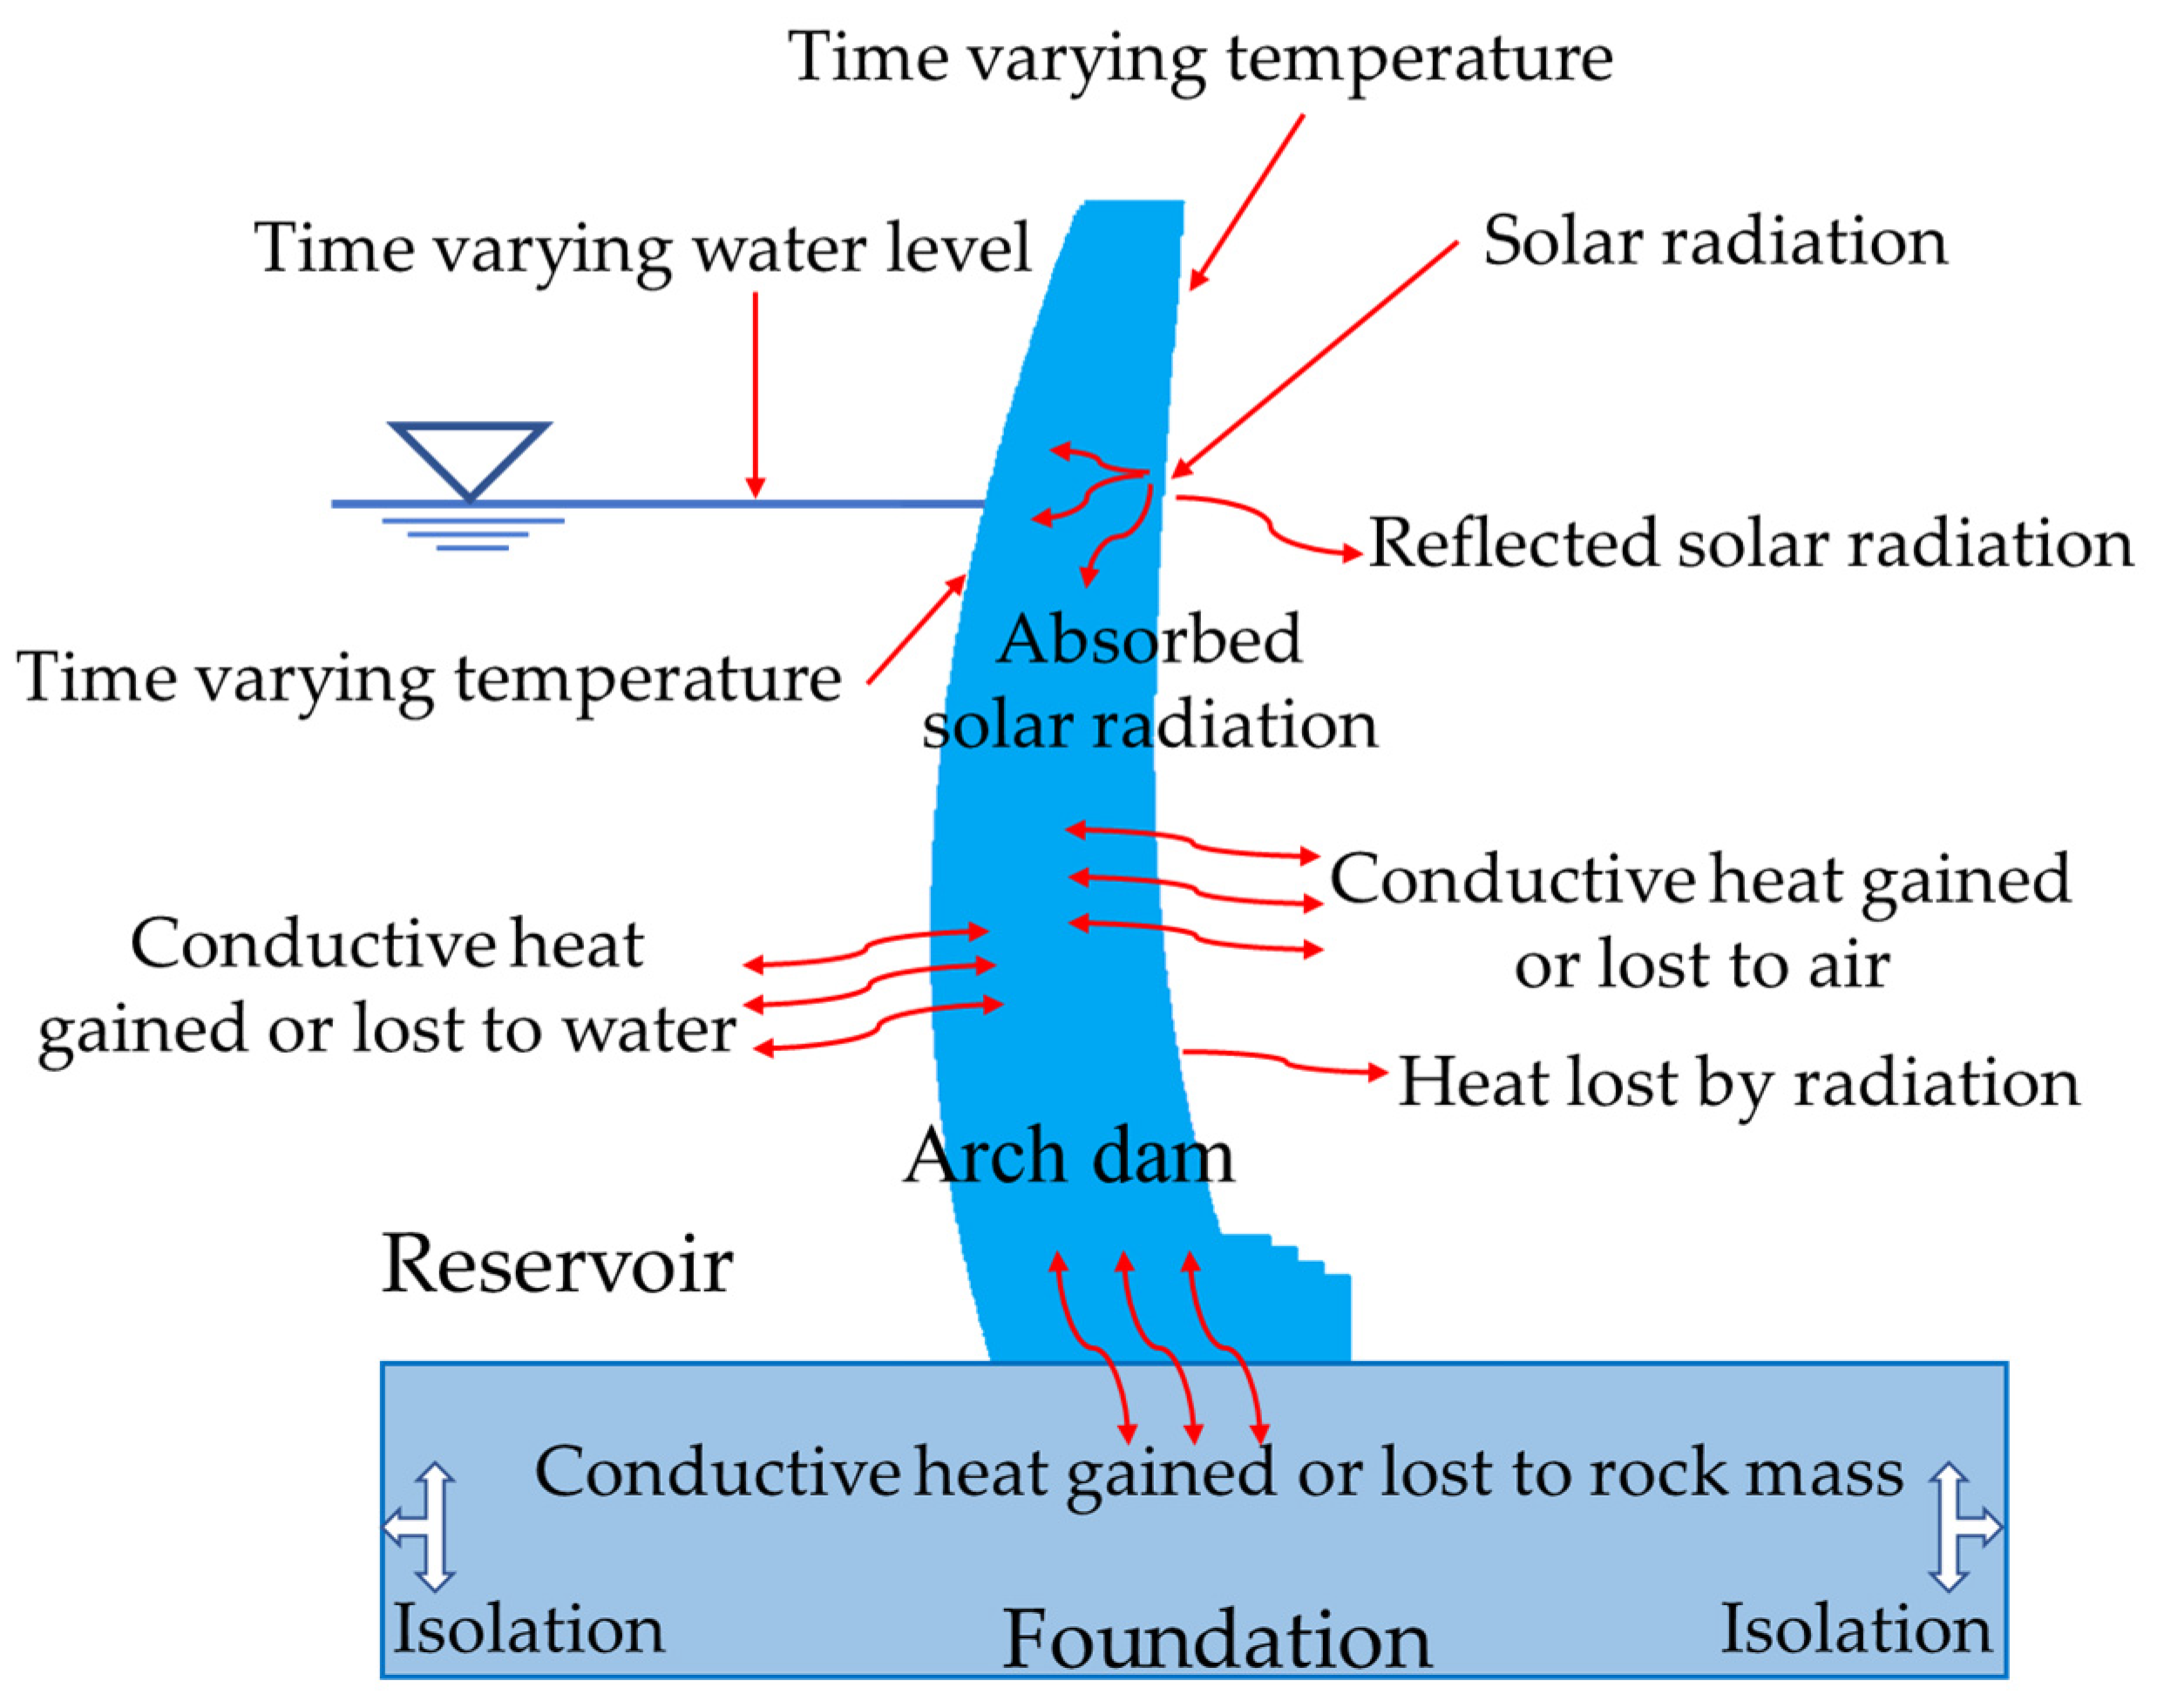
Figure 1 shows the examined heat transfer processes in the concrete arch dam (XLD) represented in this paper.
3. Analysis of the Temporal-Spatial Evolution Law of Measured Temperature of Arch Dam during the Operation Period
3.1. Outline of the XLD Super-High Arch Dam in China
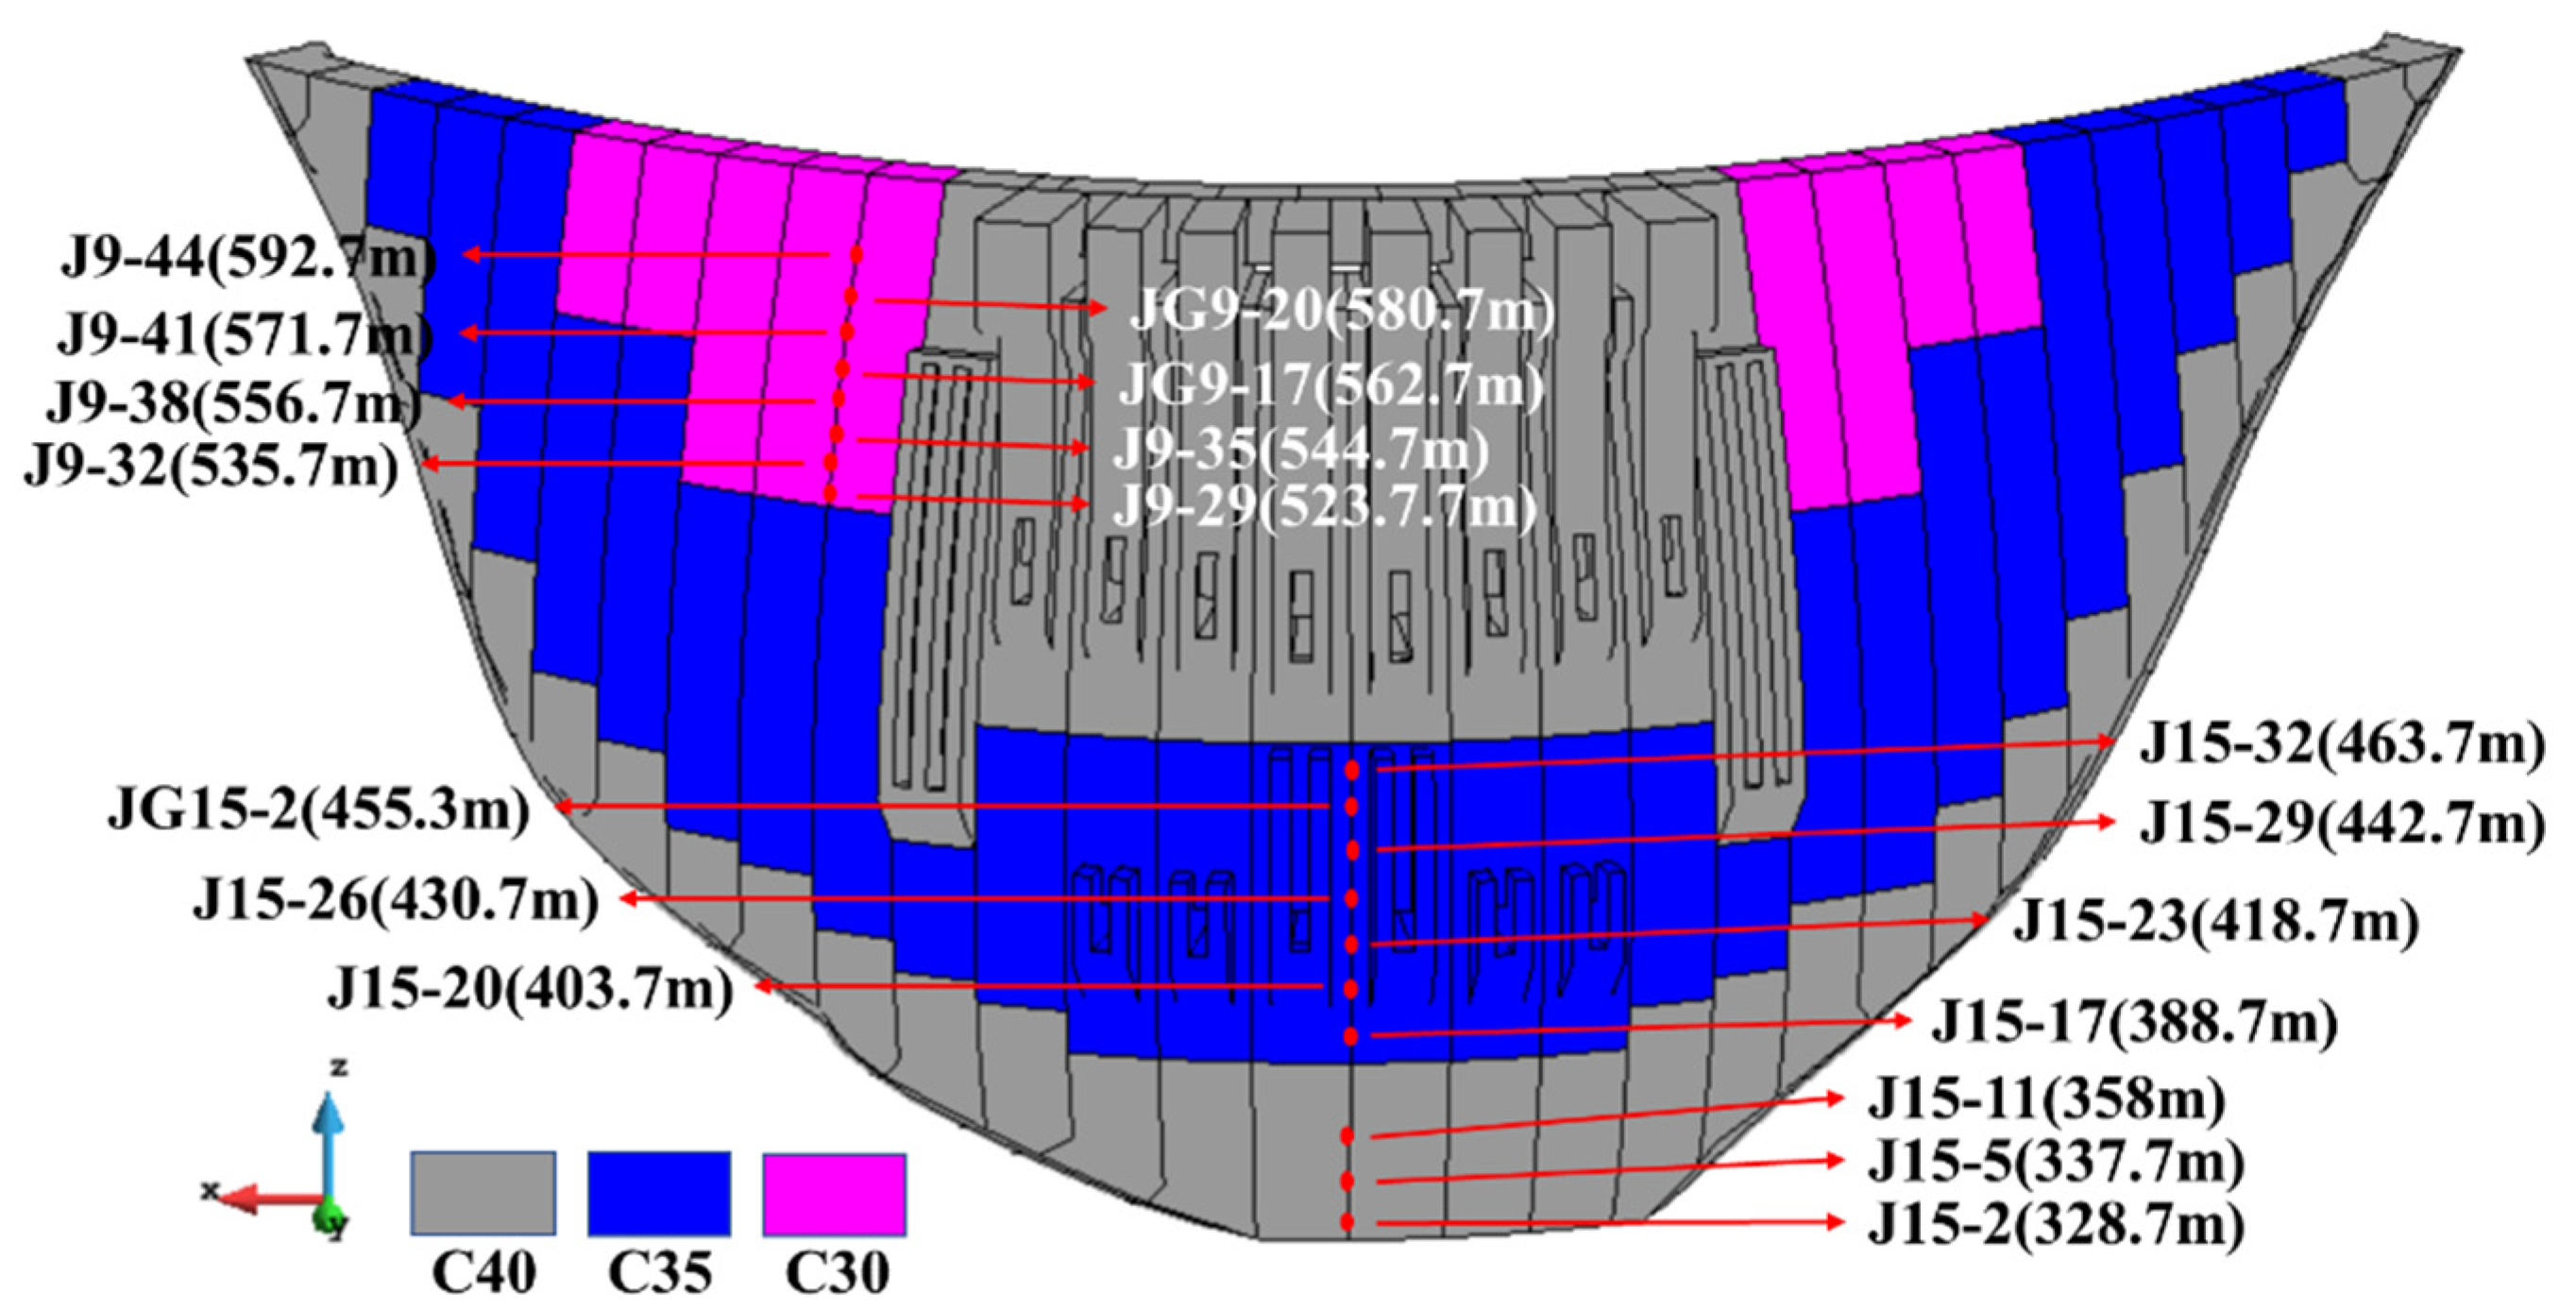
Taking the XLD super-high arch dam in China as an example, the typical dam section was selected to analyze the temperature monitoring data, and the temporal-spatial evolution law of the surface and internal temperature of the dam was obtained. The arch dam is a concrete double-curvature arch dam, with a height of 285.5 m, a crest elevation of 610 m, and an arc length of the crest centerline of 681.51 m. There are 31 dam sections. The arch dam is divided into three areas, namely areas A, B and C, and the concrete strength grades are C40, C35 and C30, respectively. The general characteristics of the arch dam are shown in Table 1.
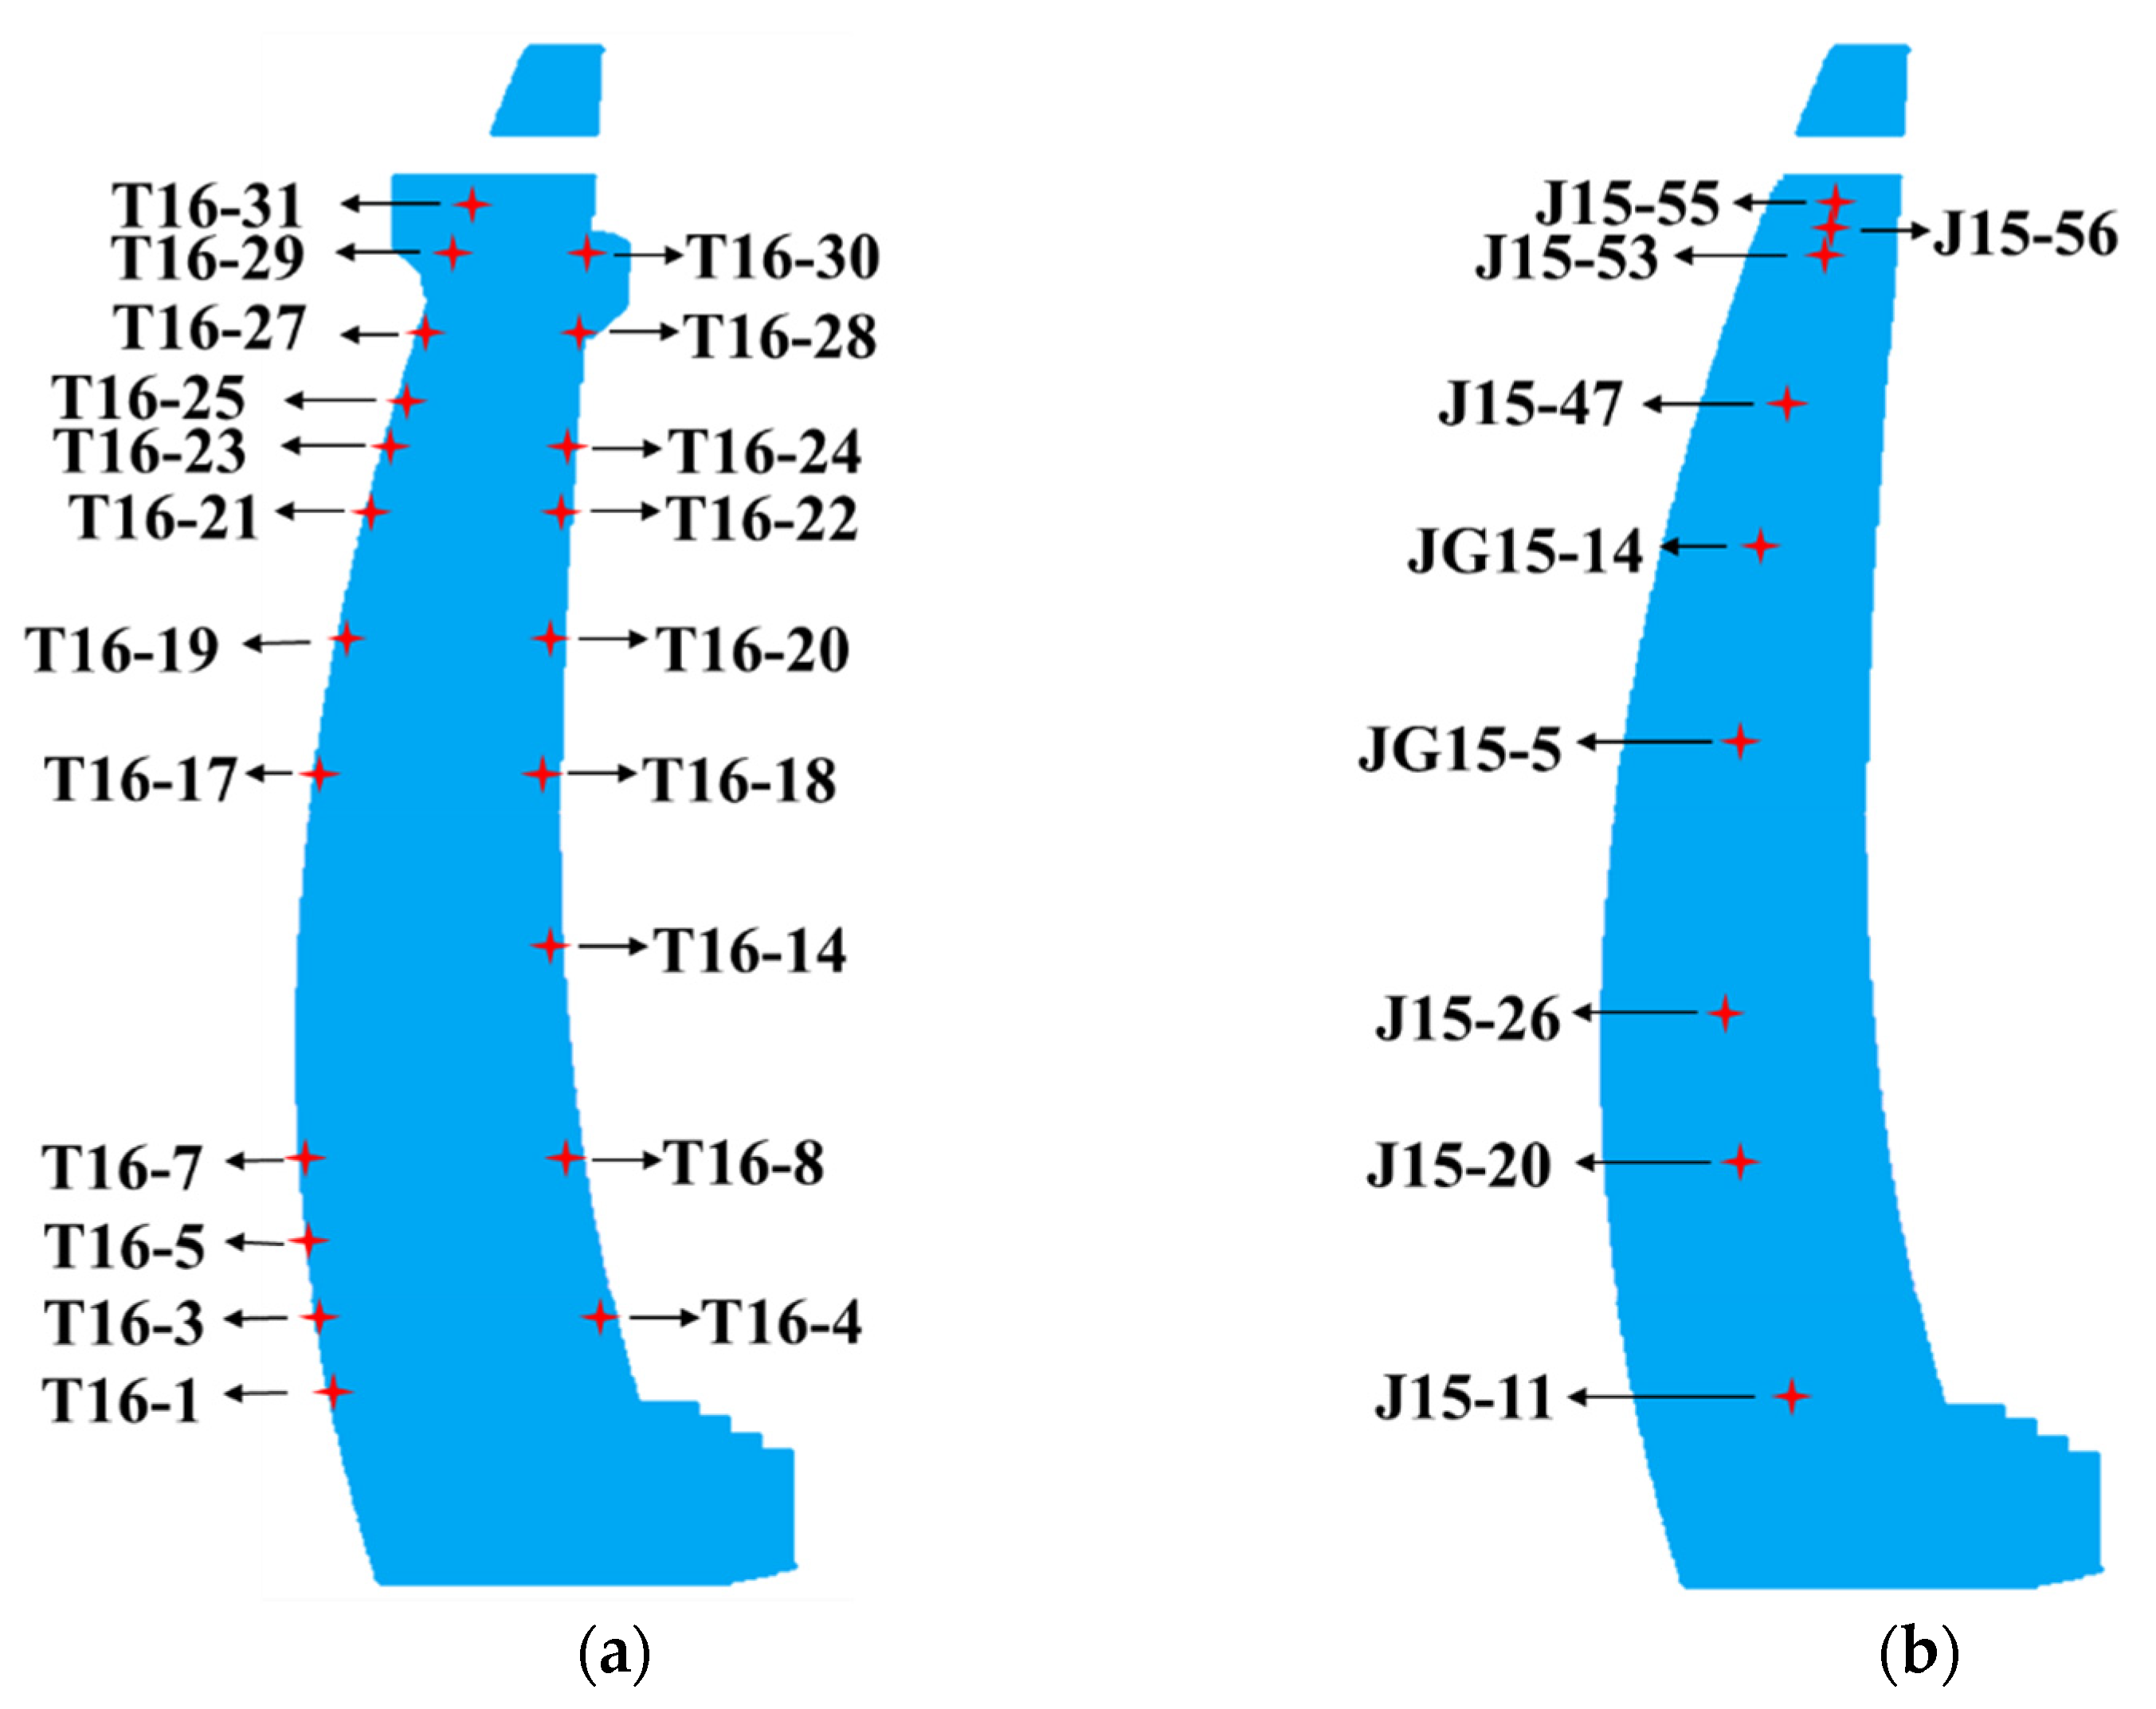
In order to monitor the temperature of the arch dam, 4723 temperature thermometers, 681 joint meters and the distributed optical fibers of 24,000 m were buried in the dam. The location of the thermometers and joint meter points selected in this section is shown in Figure 2. The elevation of the temperature monitoring points is shown in Table 2.
3.2. Analysis of Surface Temperature
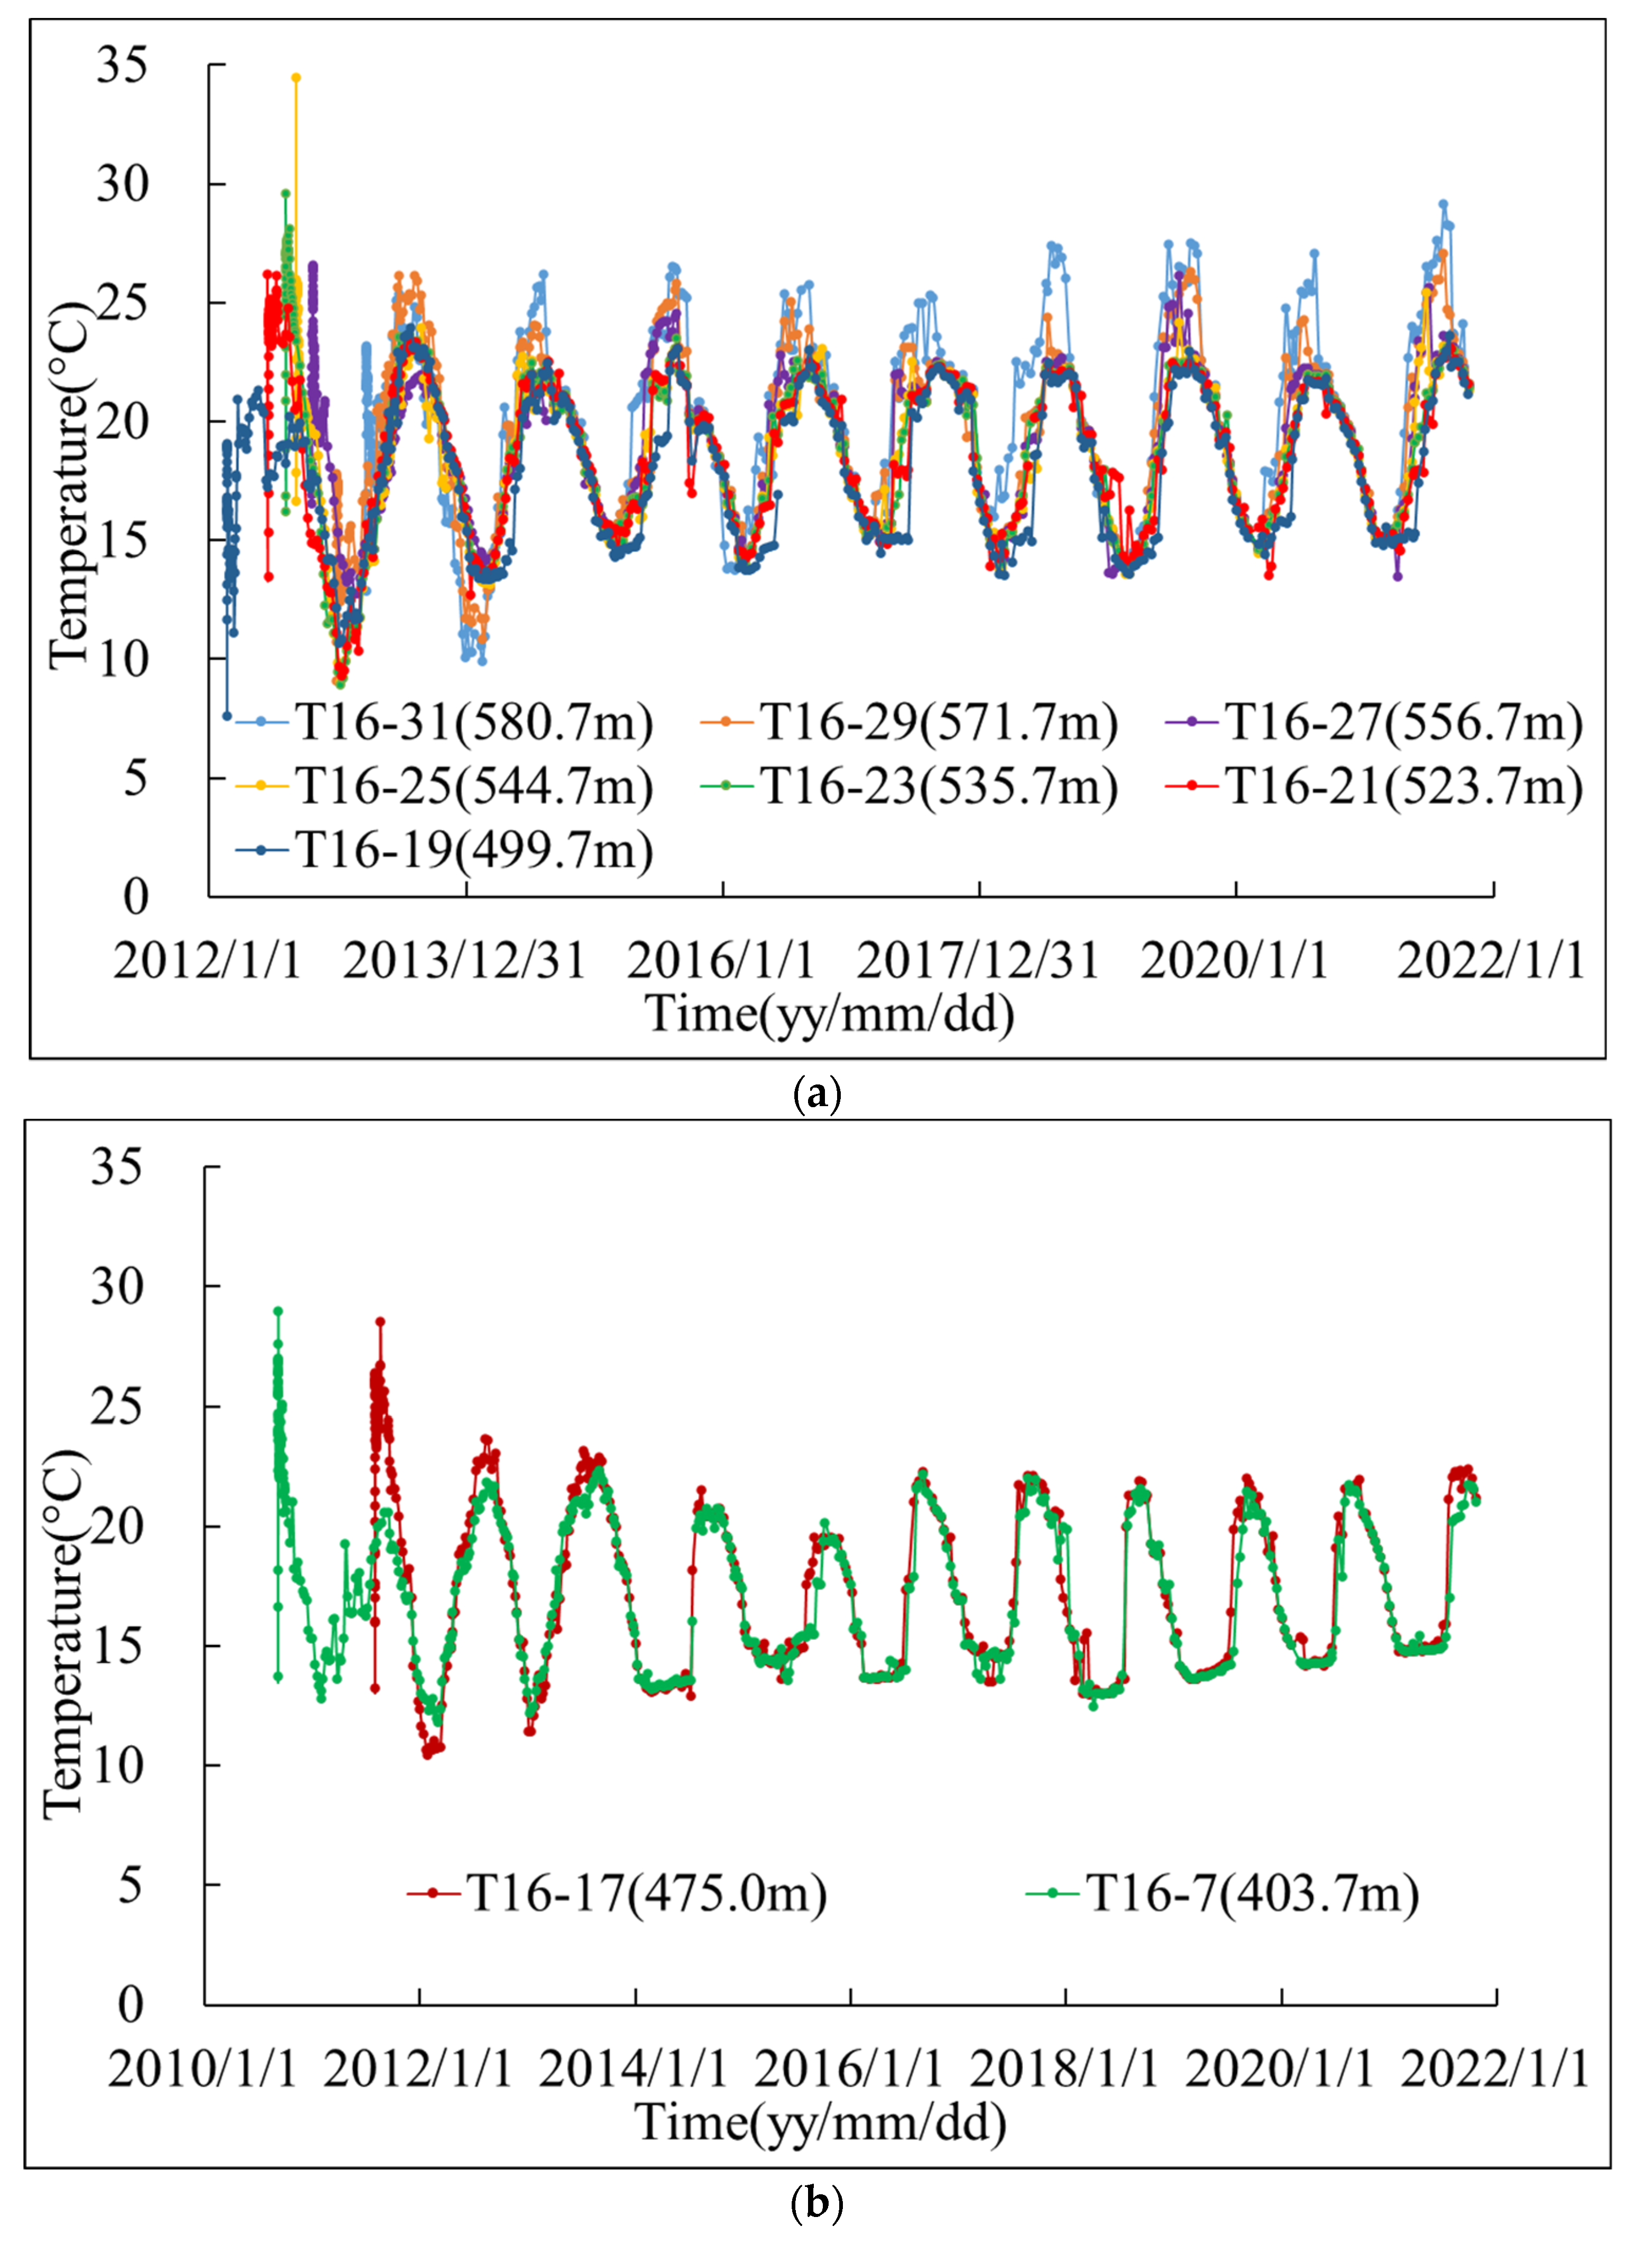
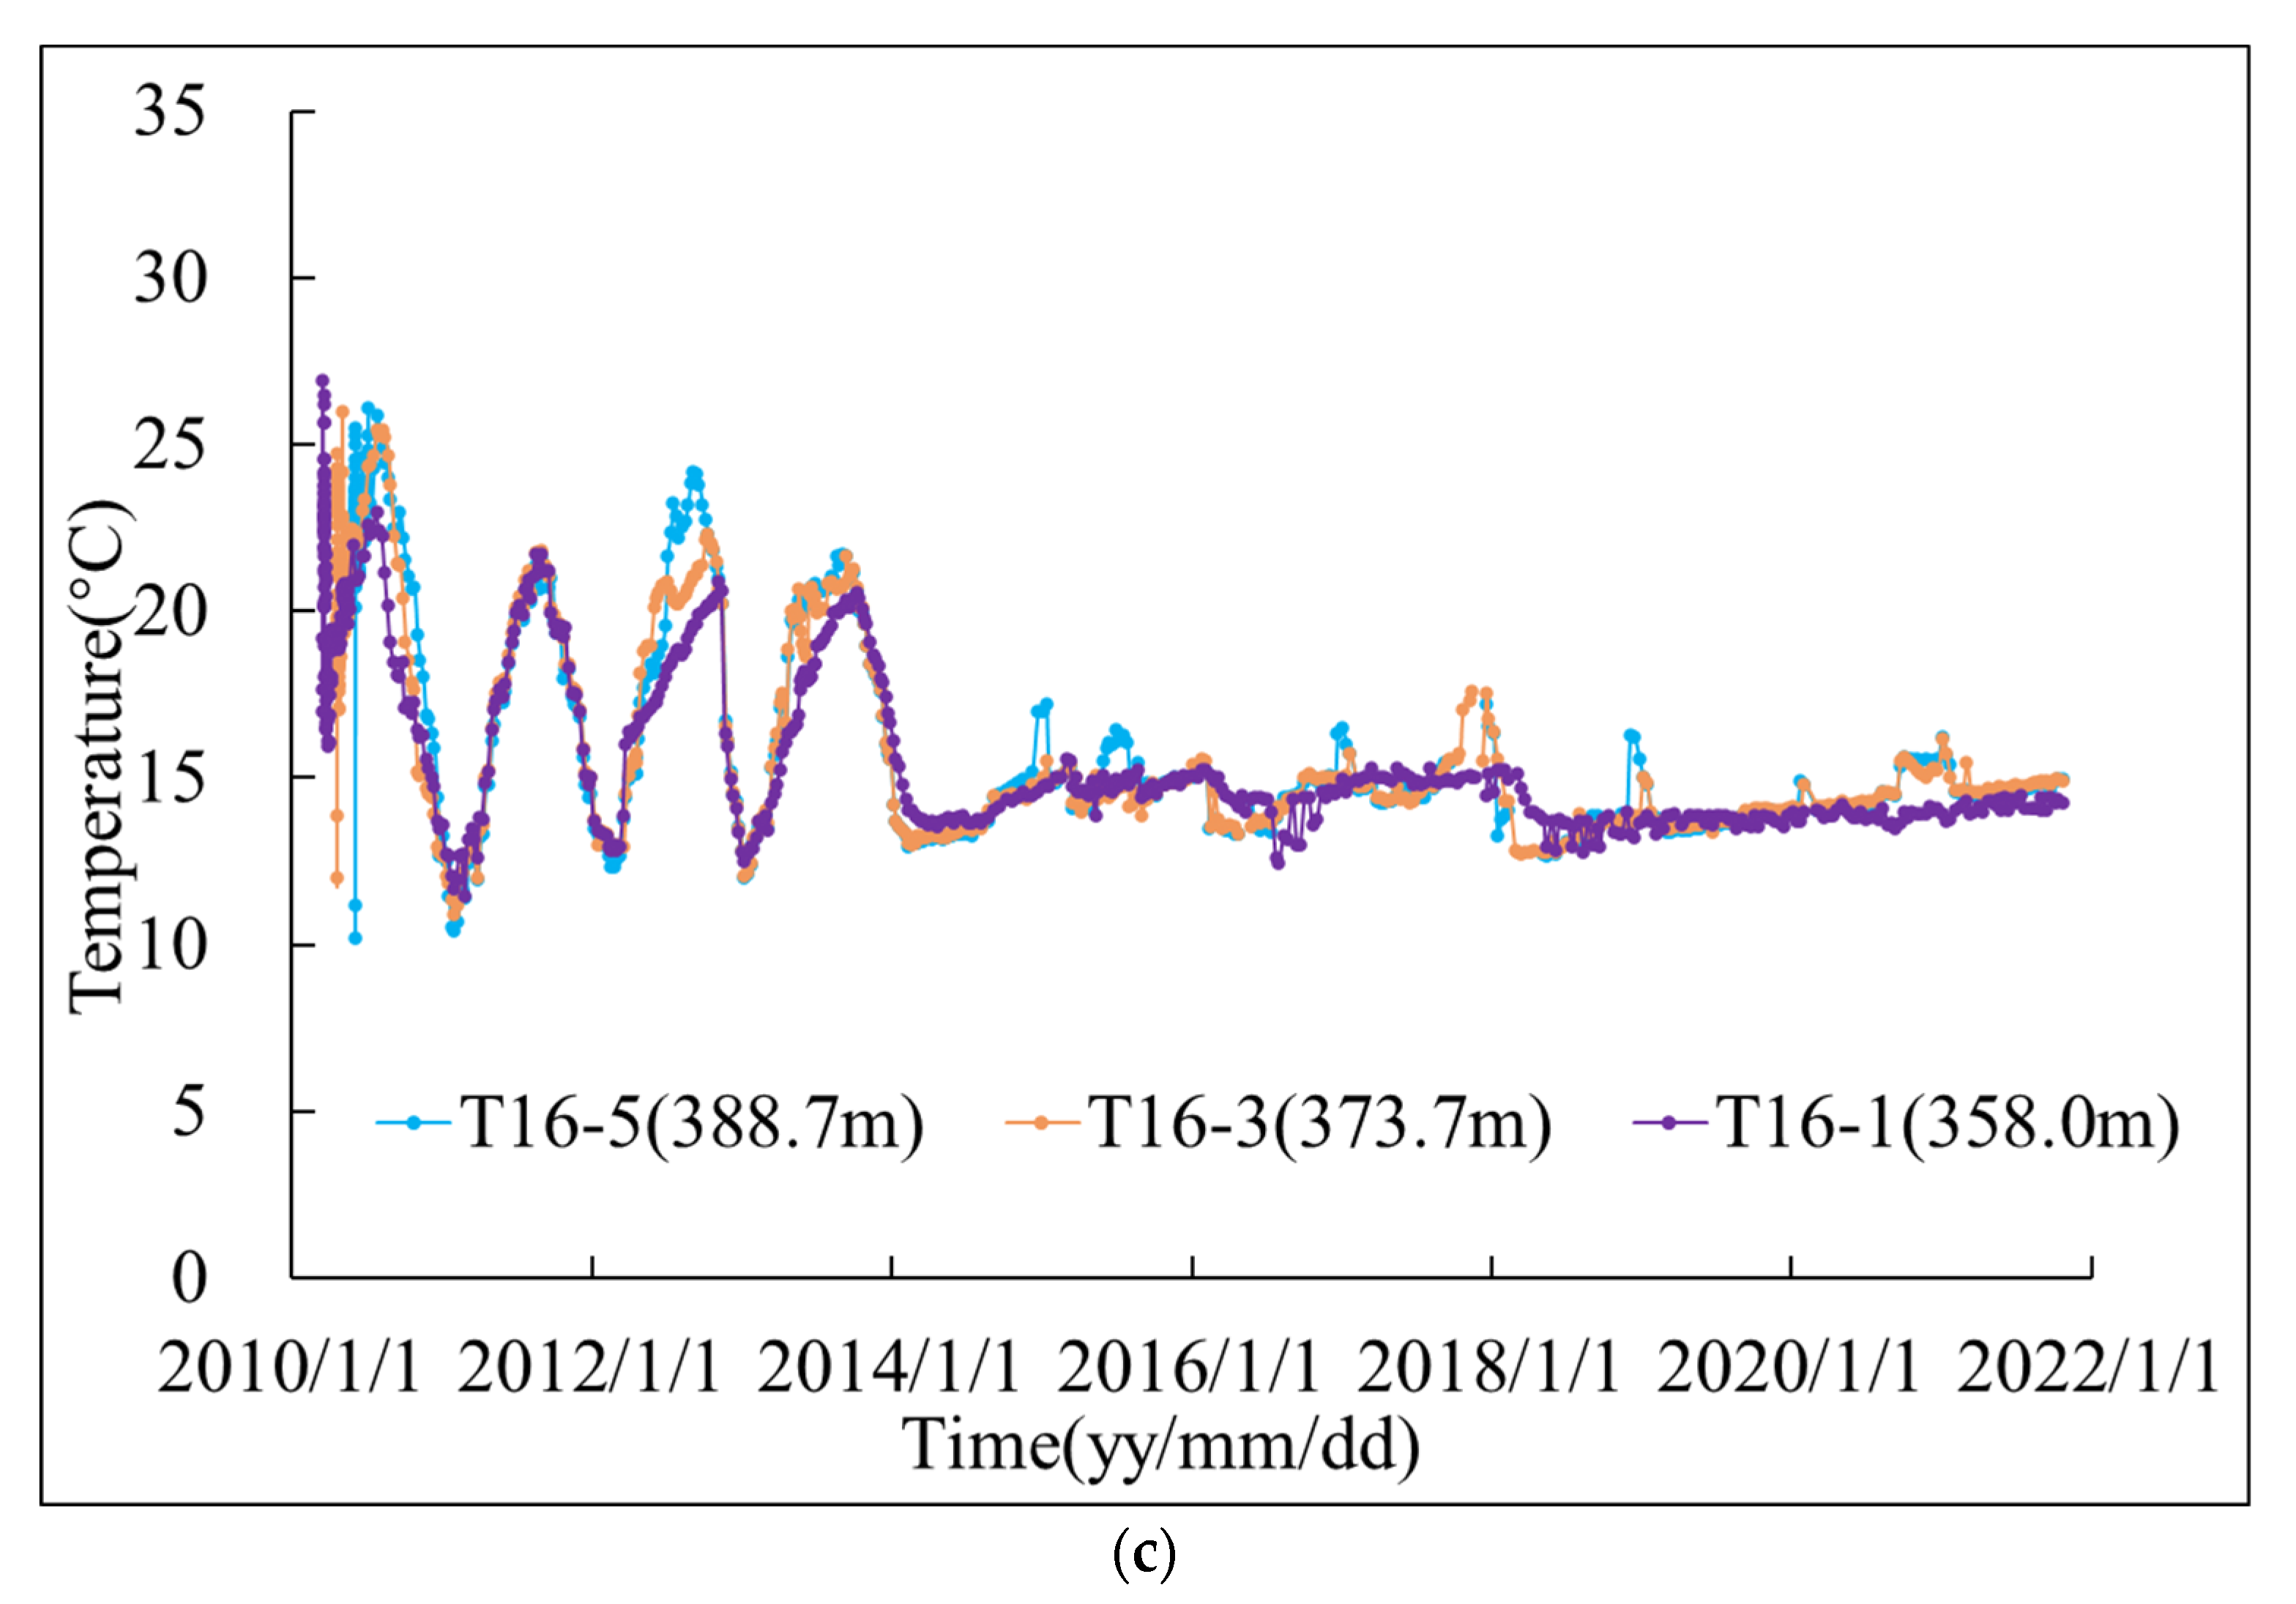
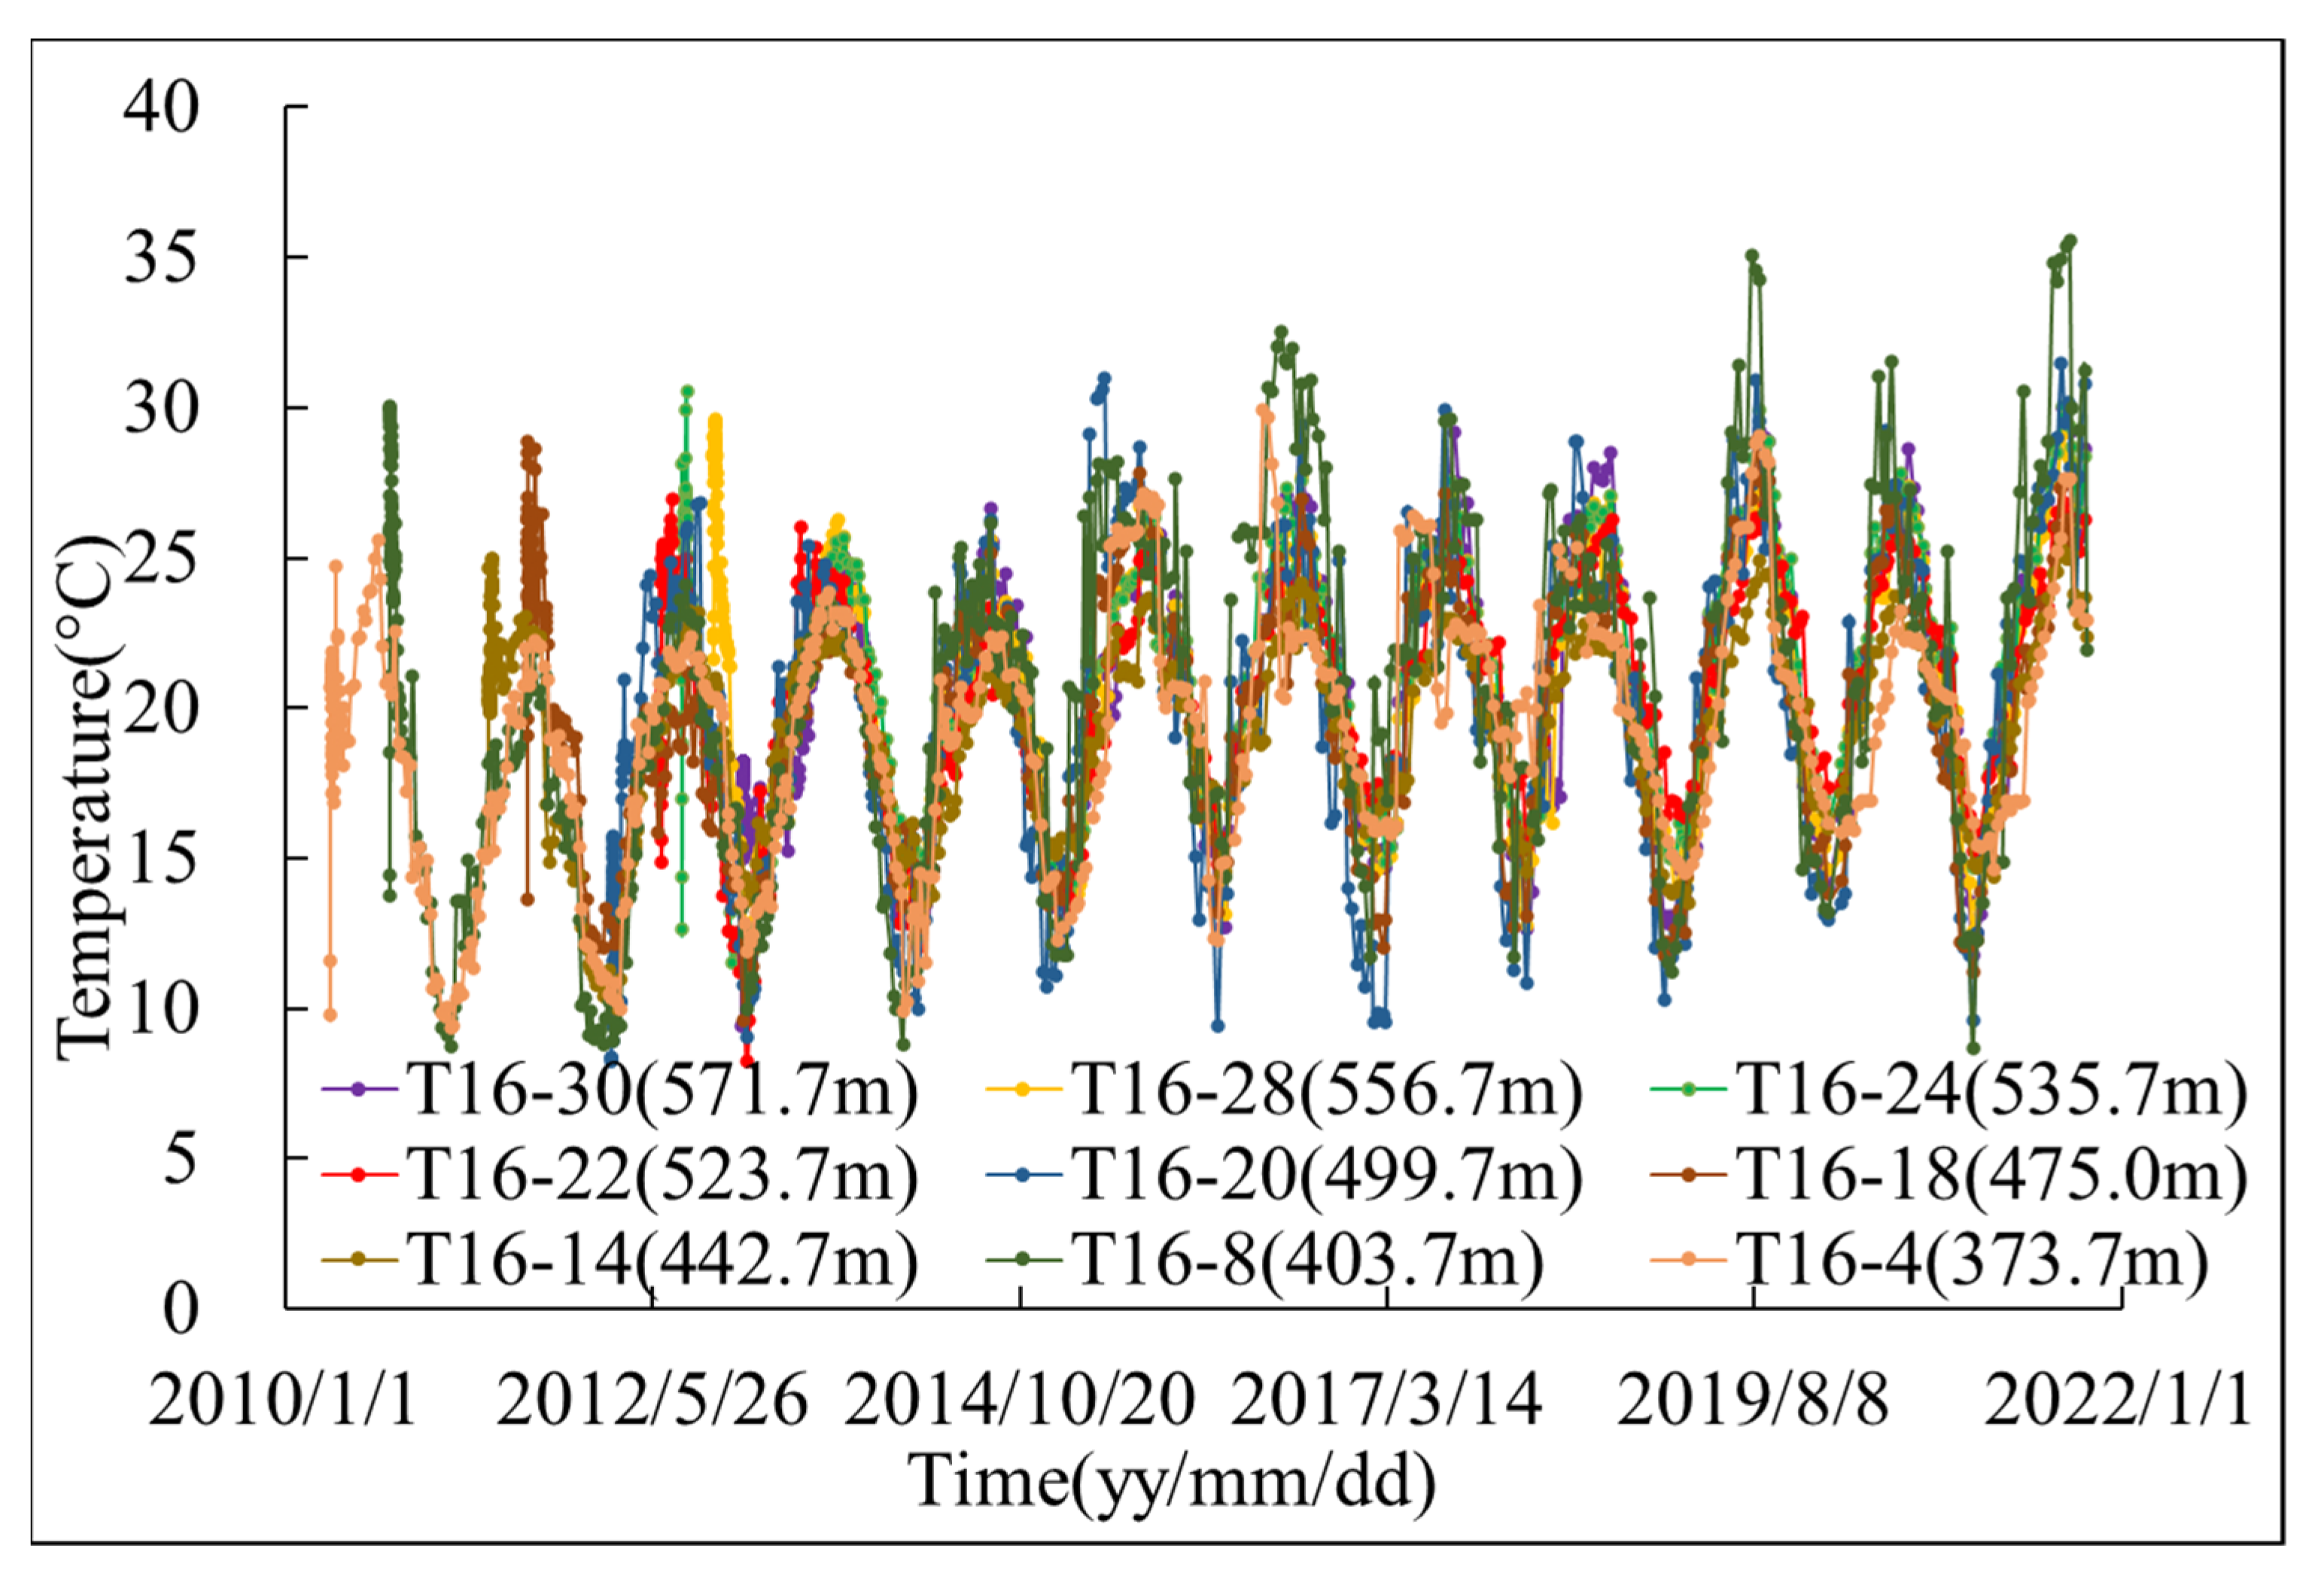
As shown in Figure 3a–c, the monitoring values of the thermometers near the upstream surface of the cantilever No. 16 dam section were selected to analyze the temperature of the upstream surface. It indicated that the surface temperature of the dam above the elevation of 400 m changes periodically with time. The measuring points at the elevation of 400–500 m are affected by the water temperature. From March to July, the temperature is the lowest and most stable at about 14 °C. In September, the temperature is the highest, with a temperature of 22 °C and an amplitude of 8 °C. Above 500 m elevations, the temperature of the measuring points is the lowest in March, with a temperature of 13.5 °C, and the highest in August, with a temperature of 25 °C and a temperature range of 11.5 °C. Below the elevation of 400 m, the surface temperature of the dam begins to stabilize in February 2014, and the stable temperature was about 14 °C.
As shown in Figure 4, the monitoring values of the thermometers near the downstream surface of the cantilever No. 16 dam section were selected to analyze the temperature of the downstream surface. It indicated that the downstream surface temperature of the dam is mainly affected by the air temperature, which changed periodically with time, with the lowest temperature of 10 °C in January and the highest temperature of 30 °C in August. The variation law of the downstream surface temperature along the elevation direction is consistent.
3.3. Analysis of Internal Temperature
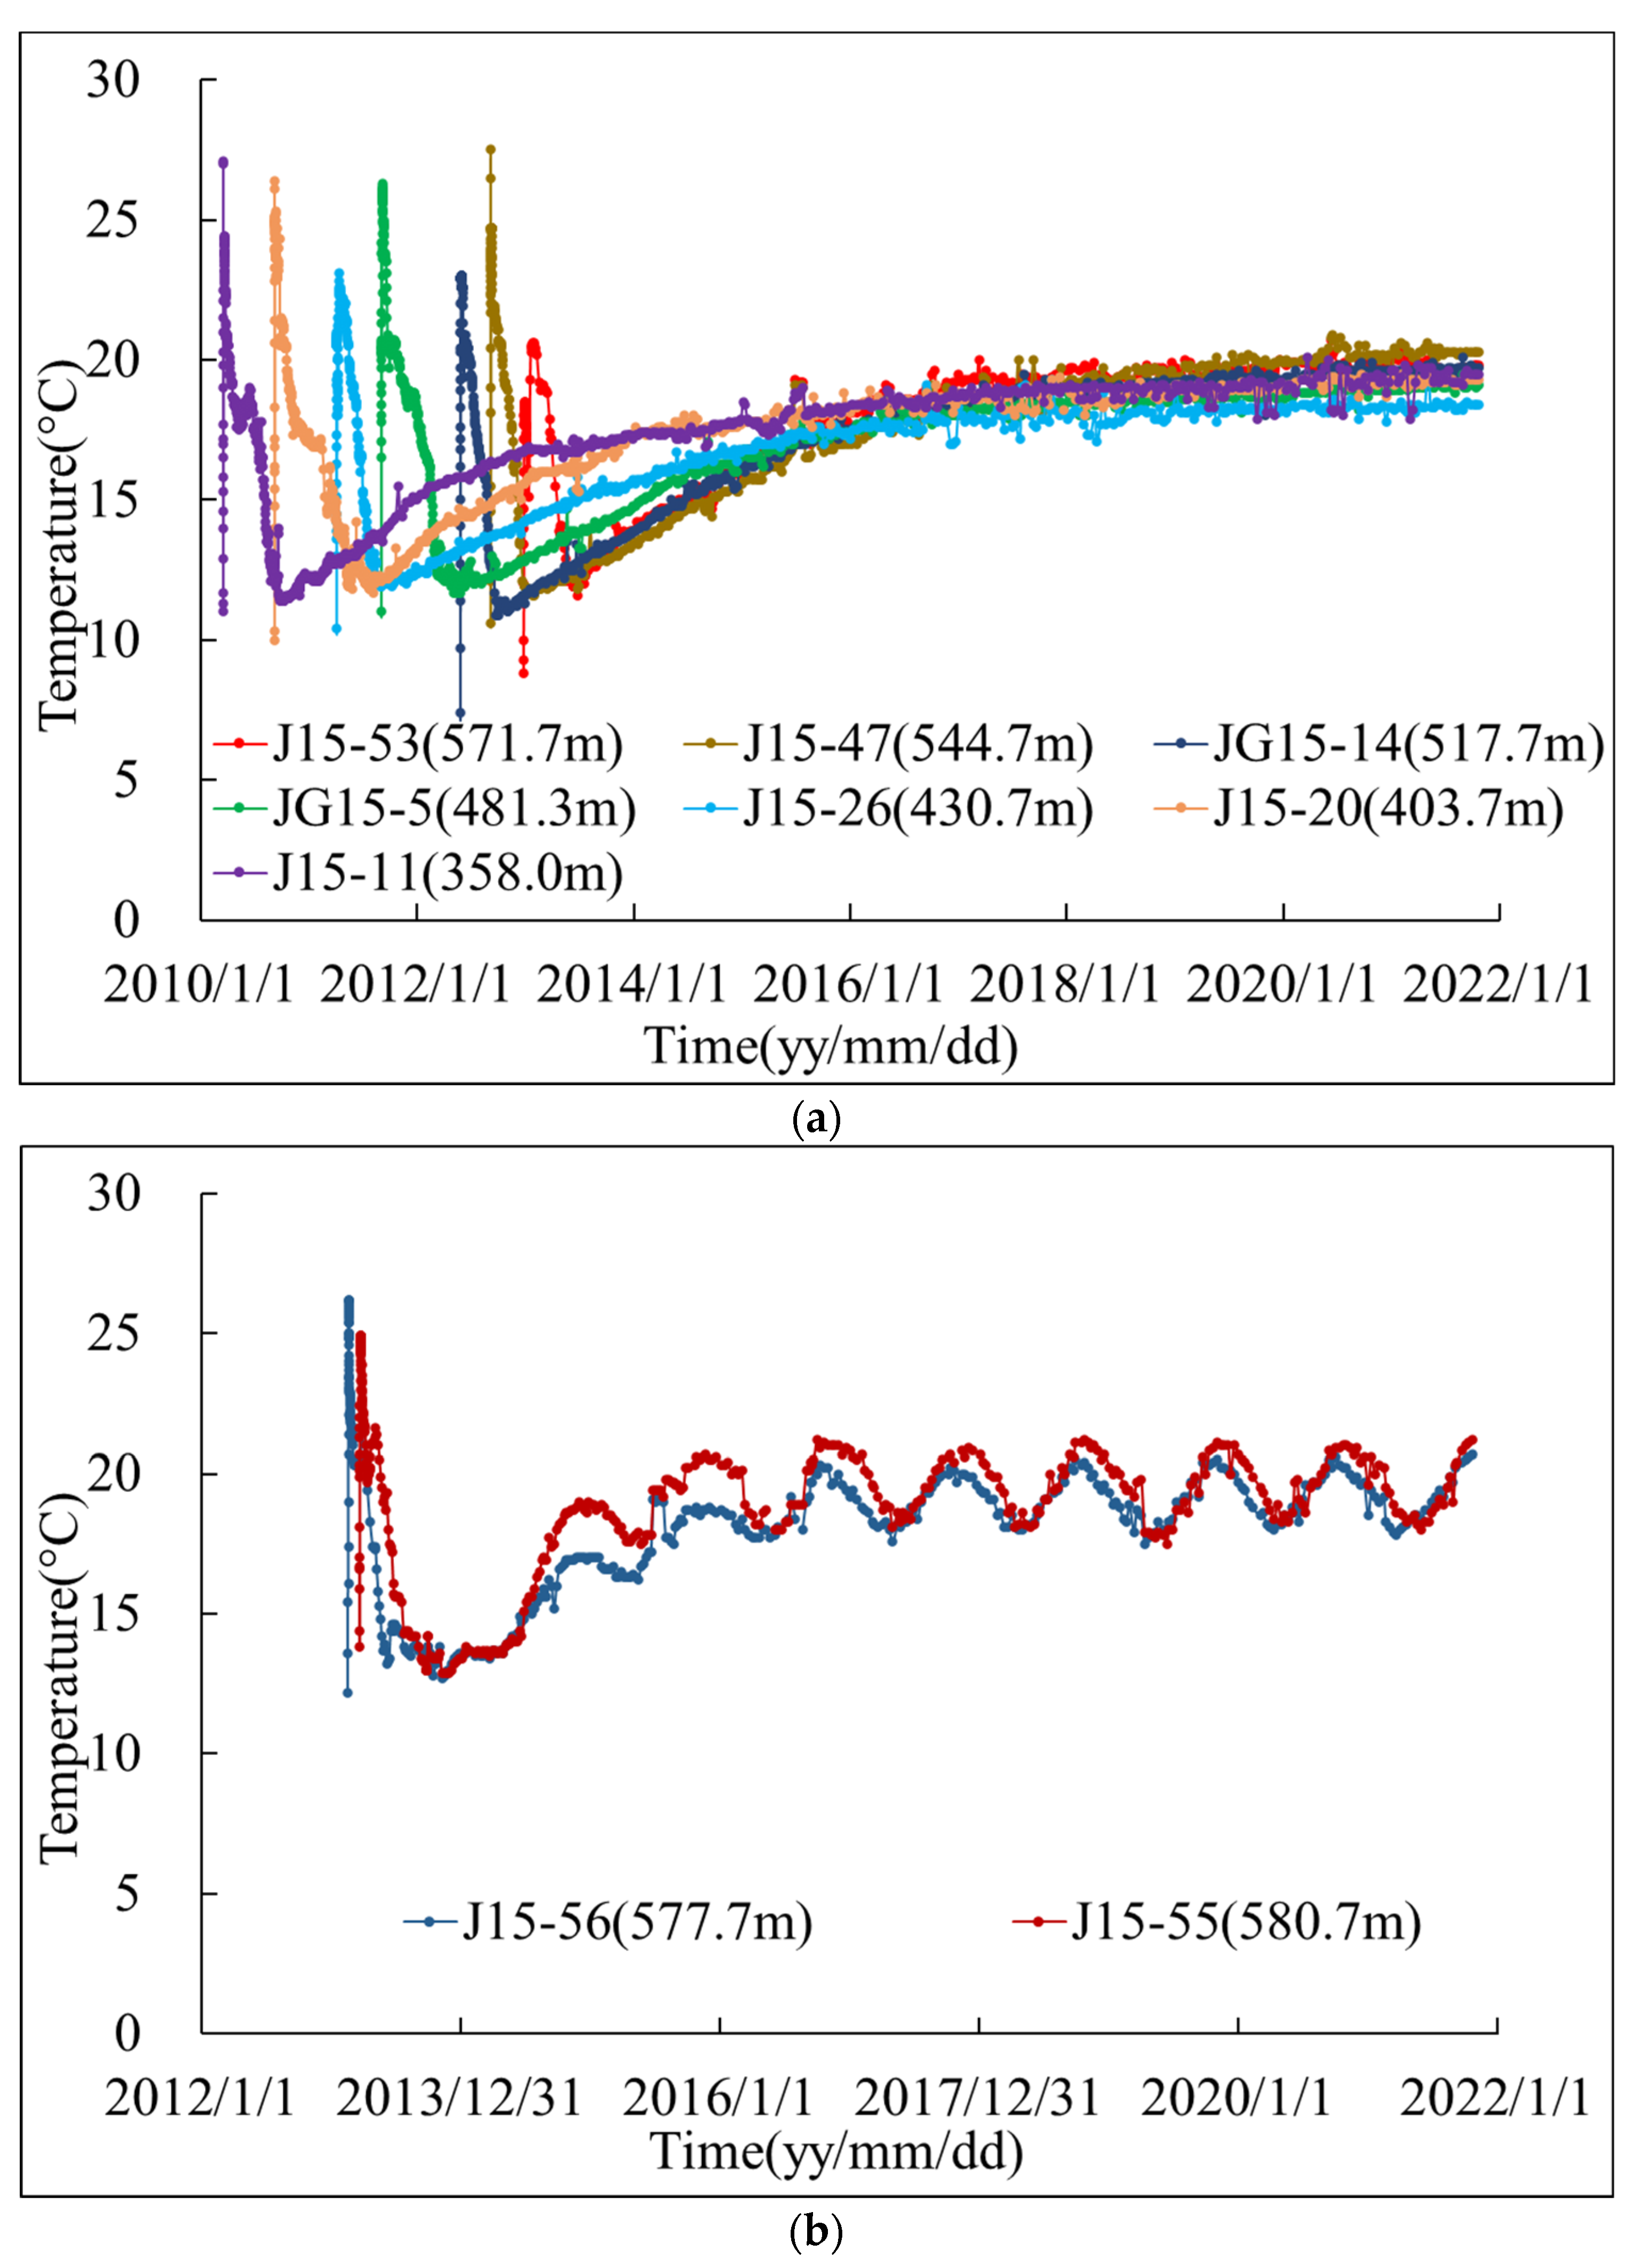
As shown in Figure 5, the monitoring values of the measuring points at transverse joints in the No. 15 dam section were selected to analyze the internal temperature of the dam. From the time distribution characteristics, the internal temperature of the arch dam rose after the closure grouting by 7.1~9.2 °C. The specific variation value can be seen in Table 3. From the spatial distribution characteristics, the temperature inside the dam during operation gradually tended to be stable below the elevation of 571.7 m, and it changed periodically with time above the elevation of 571.7 m, ranging from 17.5 °C to 21 °C.
4. Inversion Analysis on Temperature Field of Dam during Operation
4.1. Computational Model
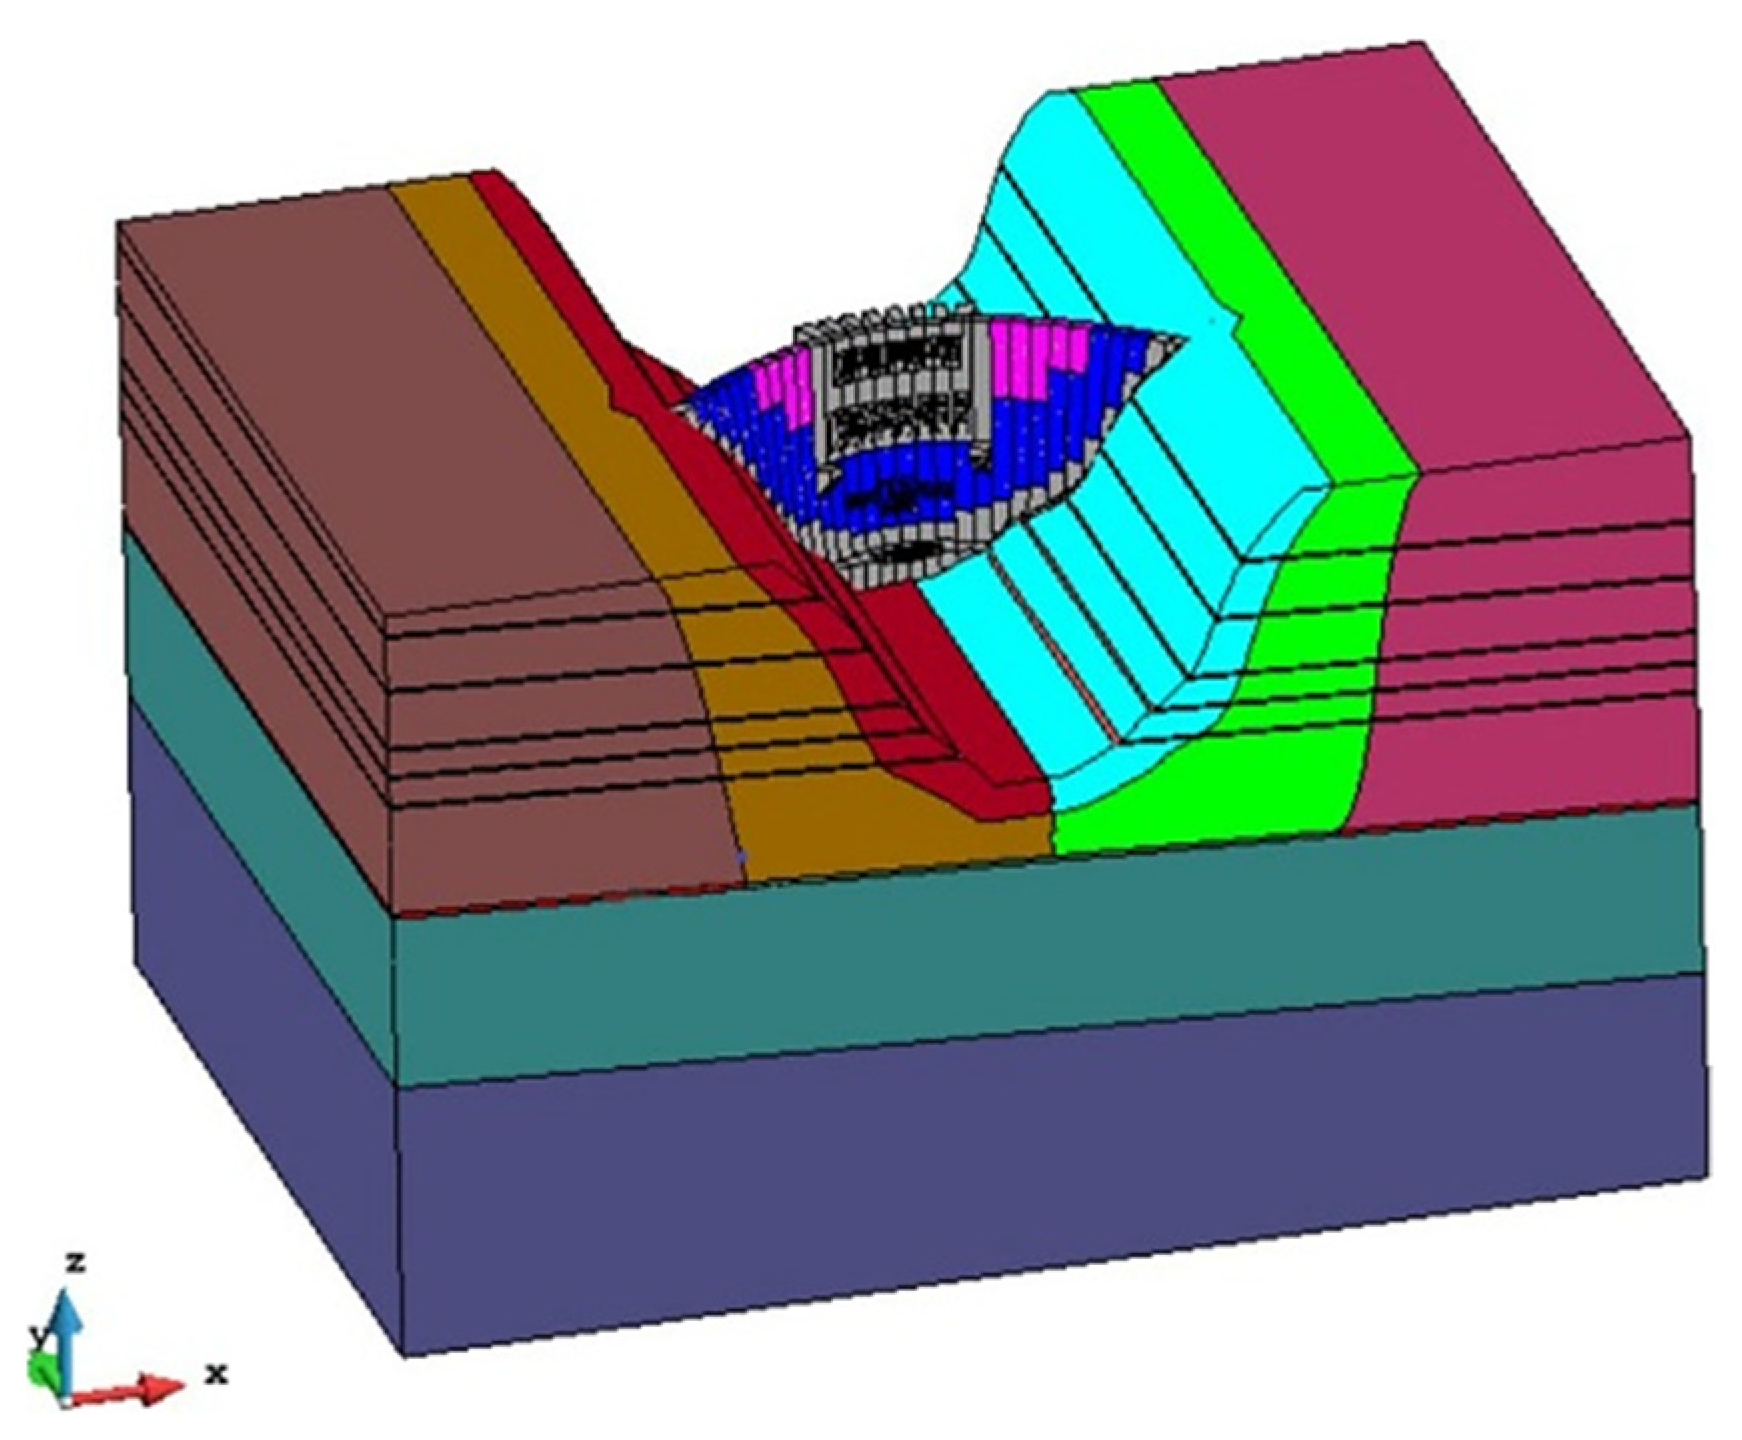
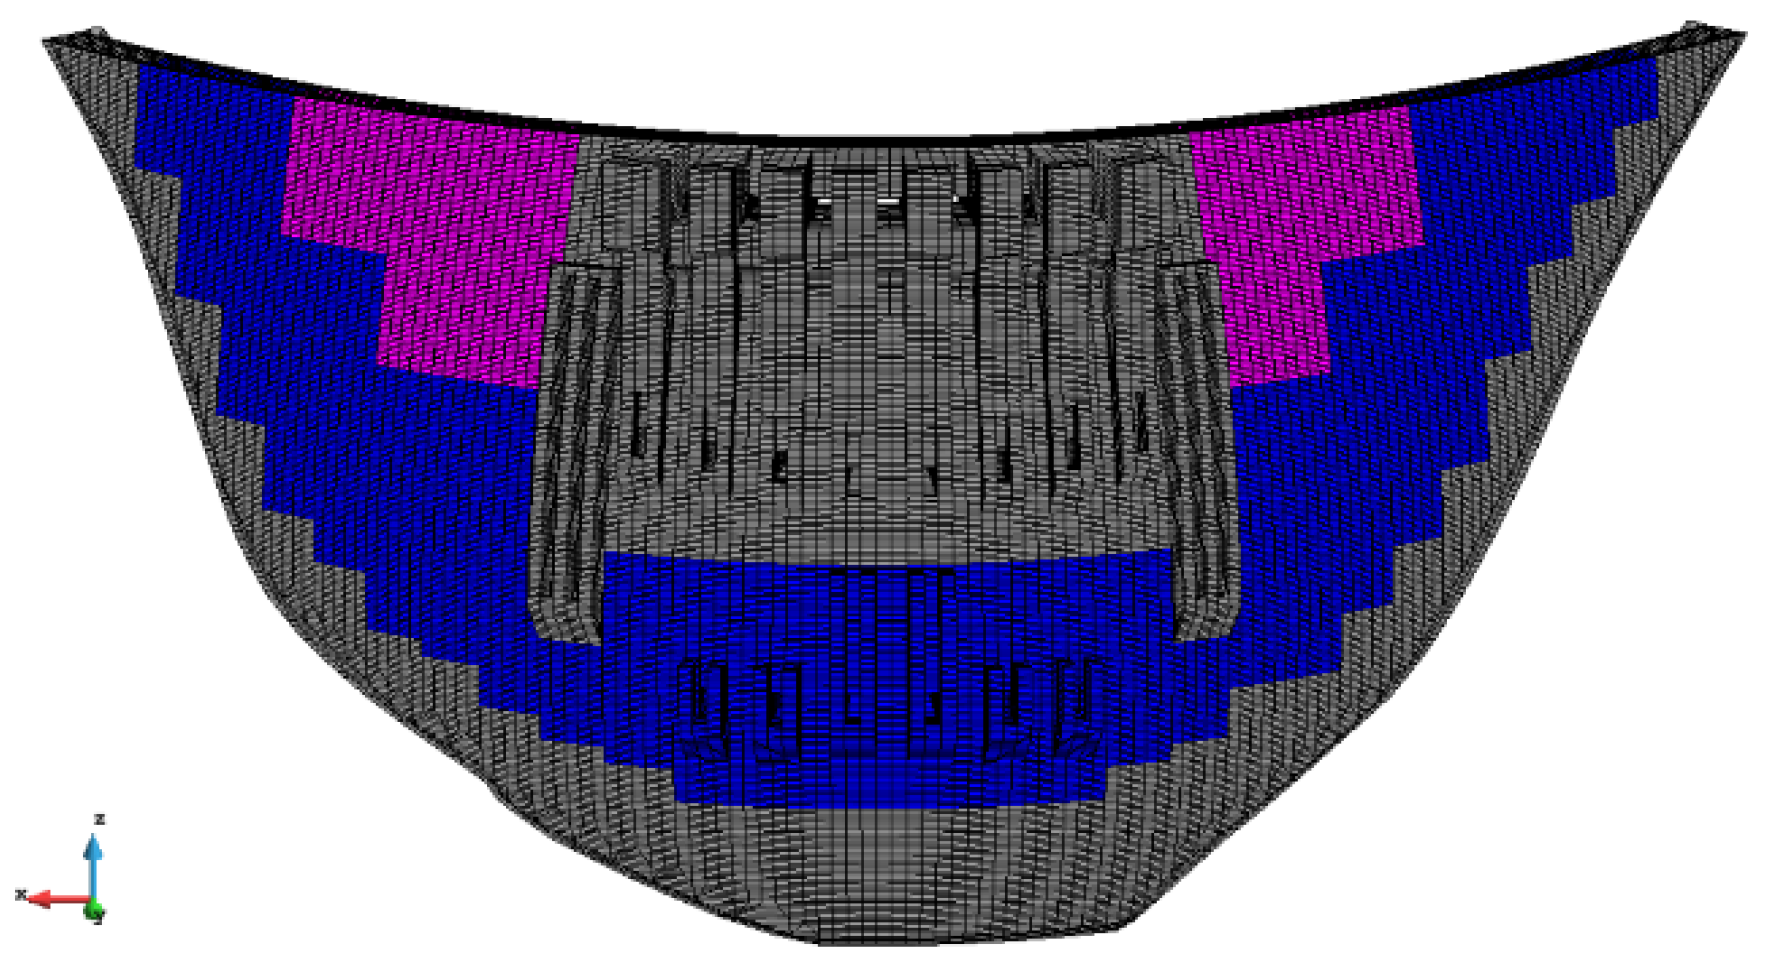
Considering the real structure and material zoning of the dam, the finite element mesh model of the arch dam foundation during the impoundment period was constructed. The model has a total of 245,614 units and 320,508 nodes, including the foundation, dam body (orifice, gate pier, hinged bearing beam, bracket, block angle, etc.), transverse joints and construction wide joints. In terms of the coordinate system, the X direction is set as the direction perpendicular to the river direction, pointing to the left bank; the Y direction is the direction along the river direction, pointing upstream; the Z direction is the vertical direction, pointing upwards. The overall finite element model of the dam body foundation is shown in Figure 6, and the finite element grid of the dam body is shown in Figure 7.
4.2. Ambient Temperature
Since the part above the water level of the upstream surface of the dam is affected by temperature, and the downstream water level of the dam is low all year round, the boundary condition of air temperature is adopted. The boundary conditions of air temperature are shown in Table 4.
4.3. Inversion of Reservoir Water Temperature
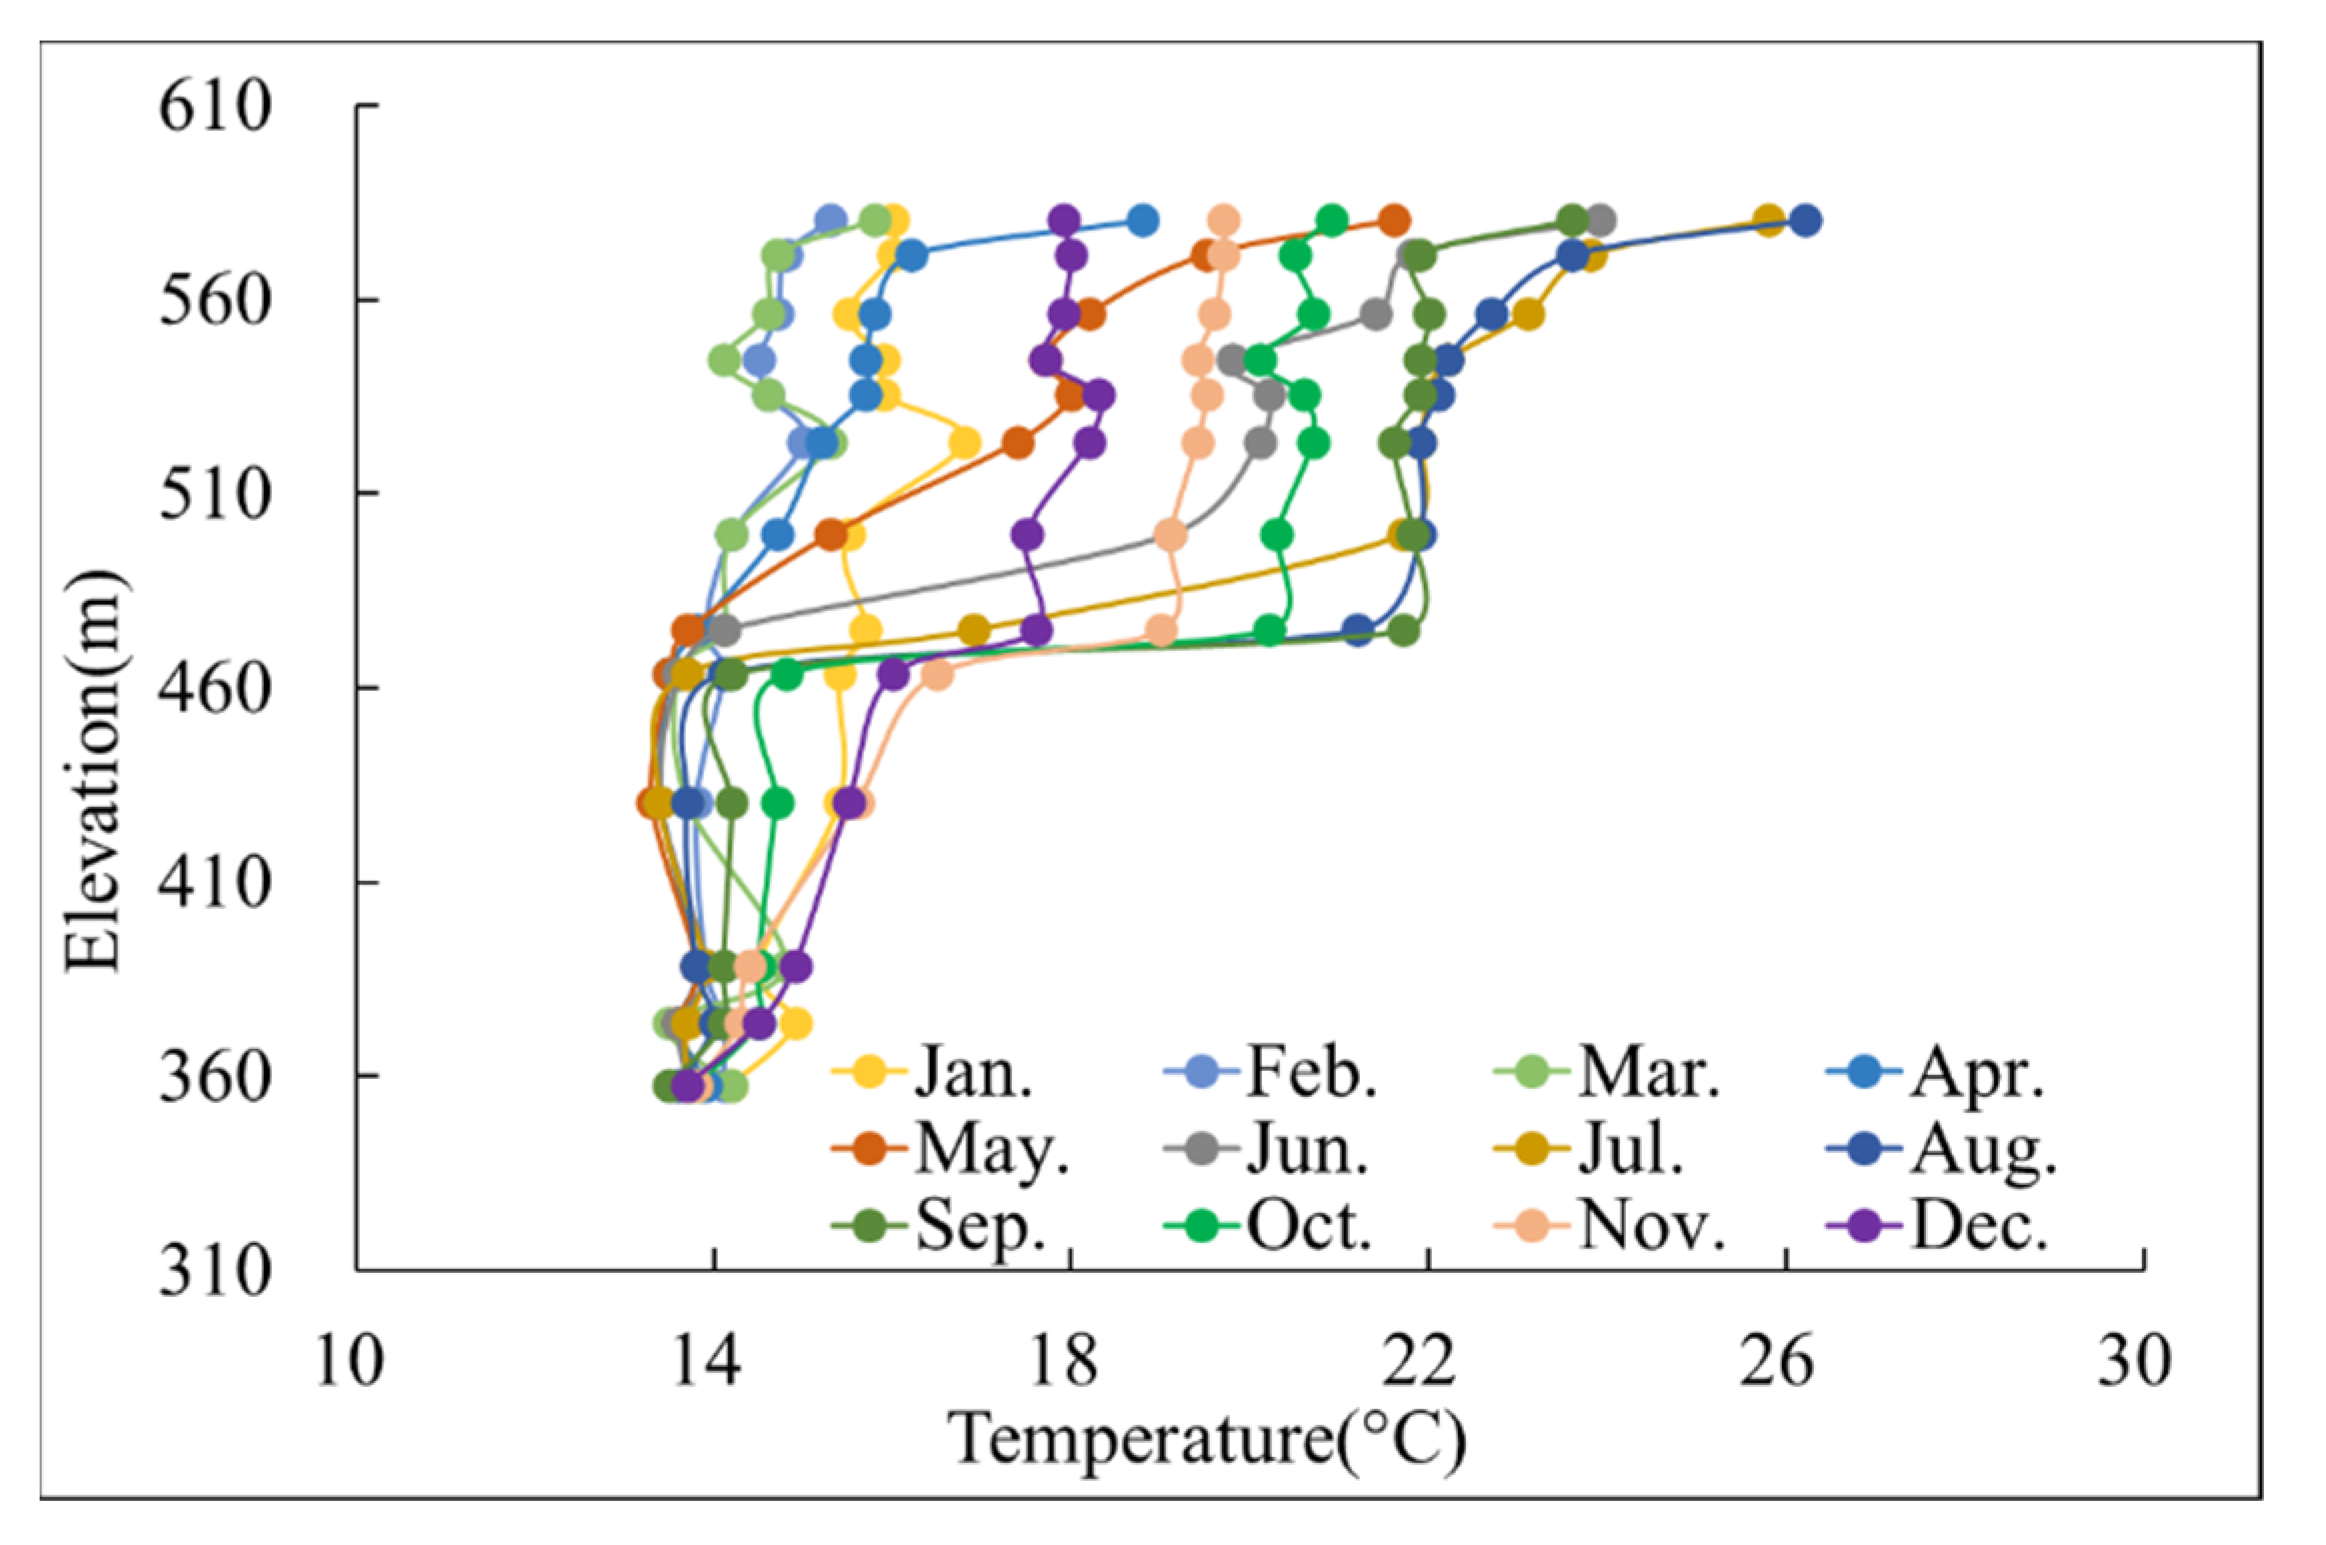
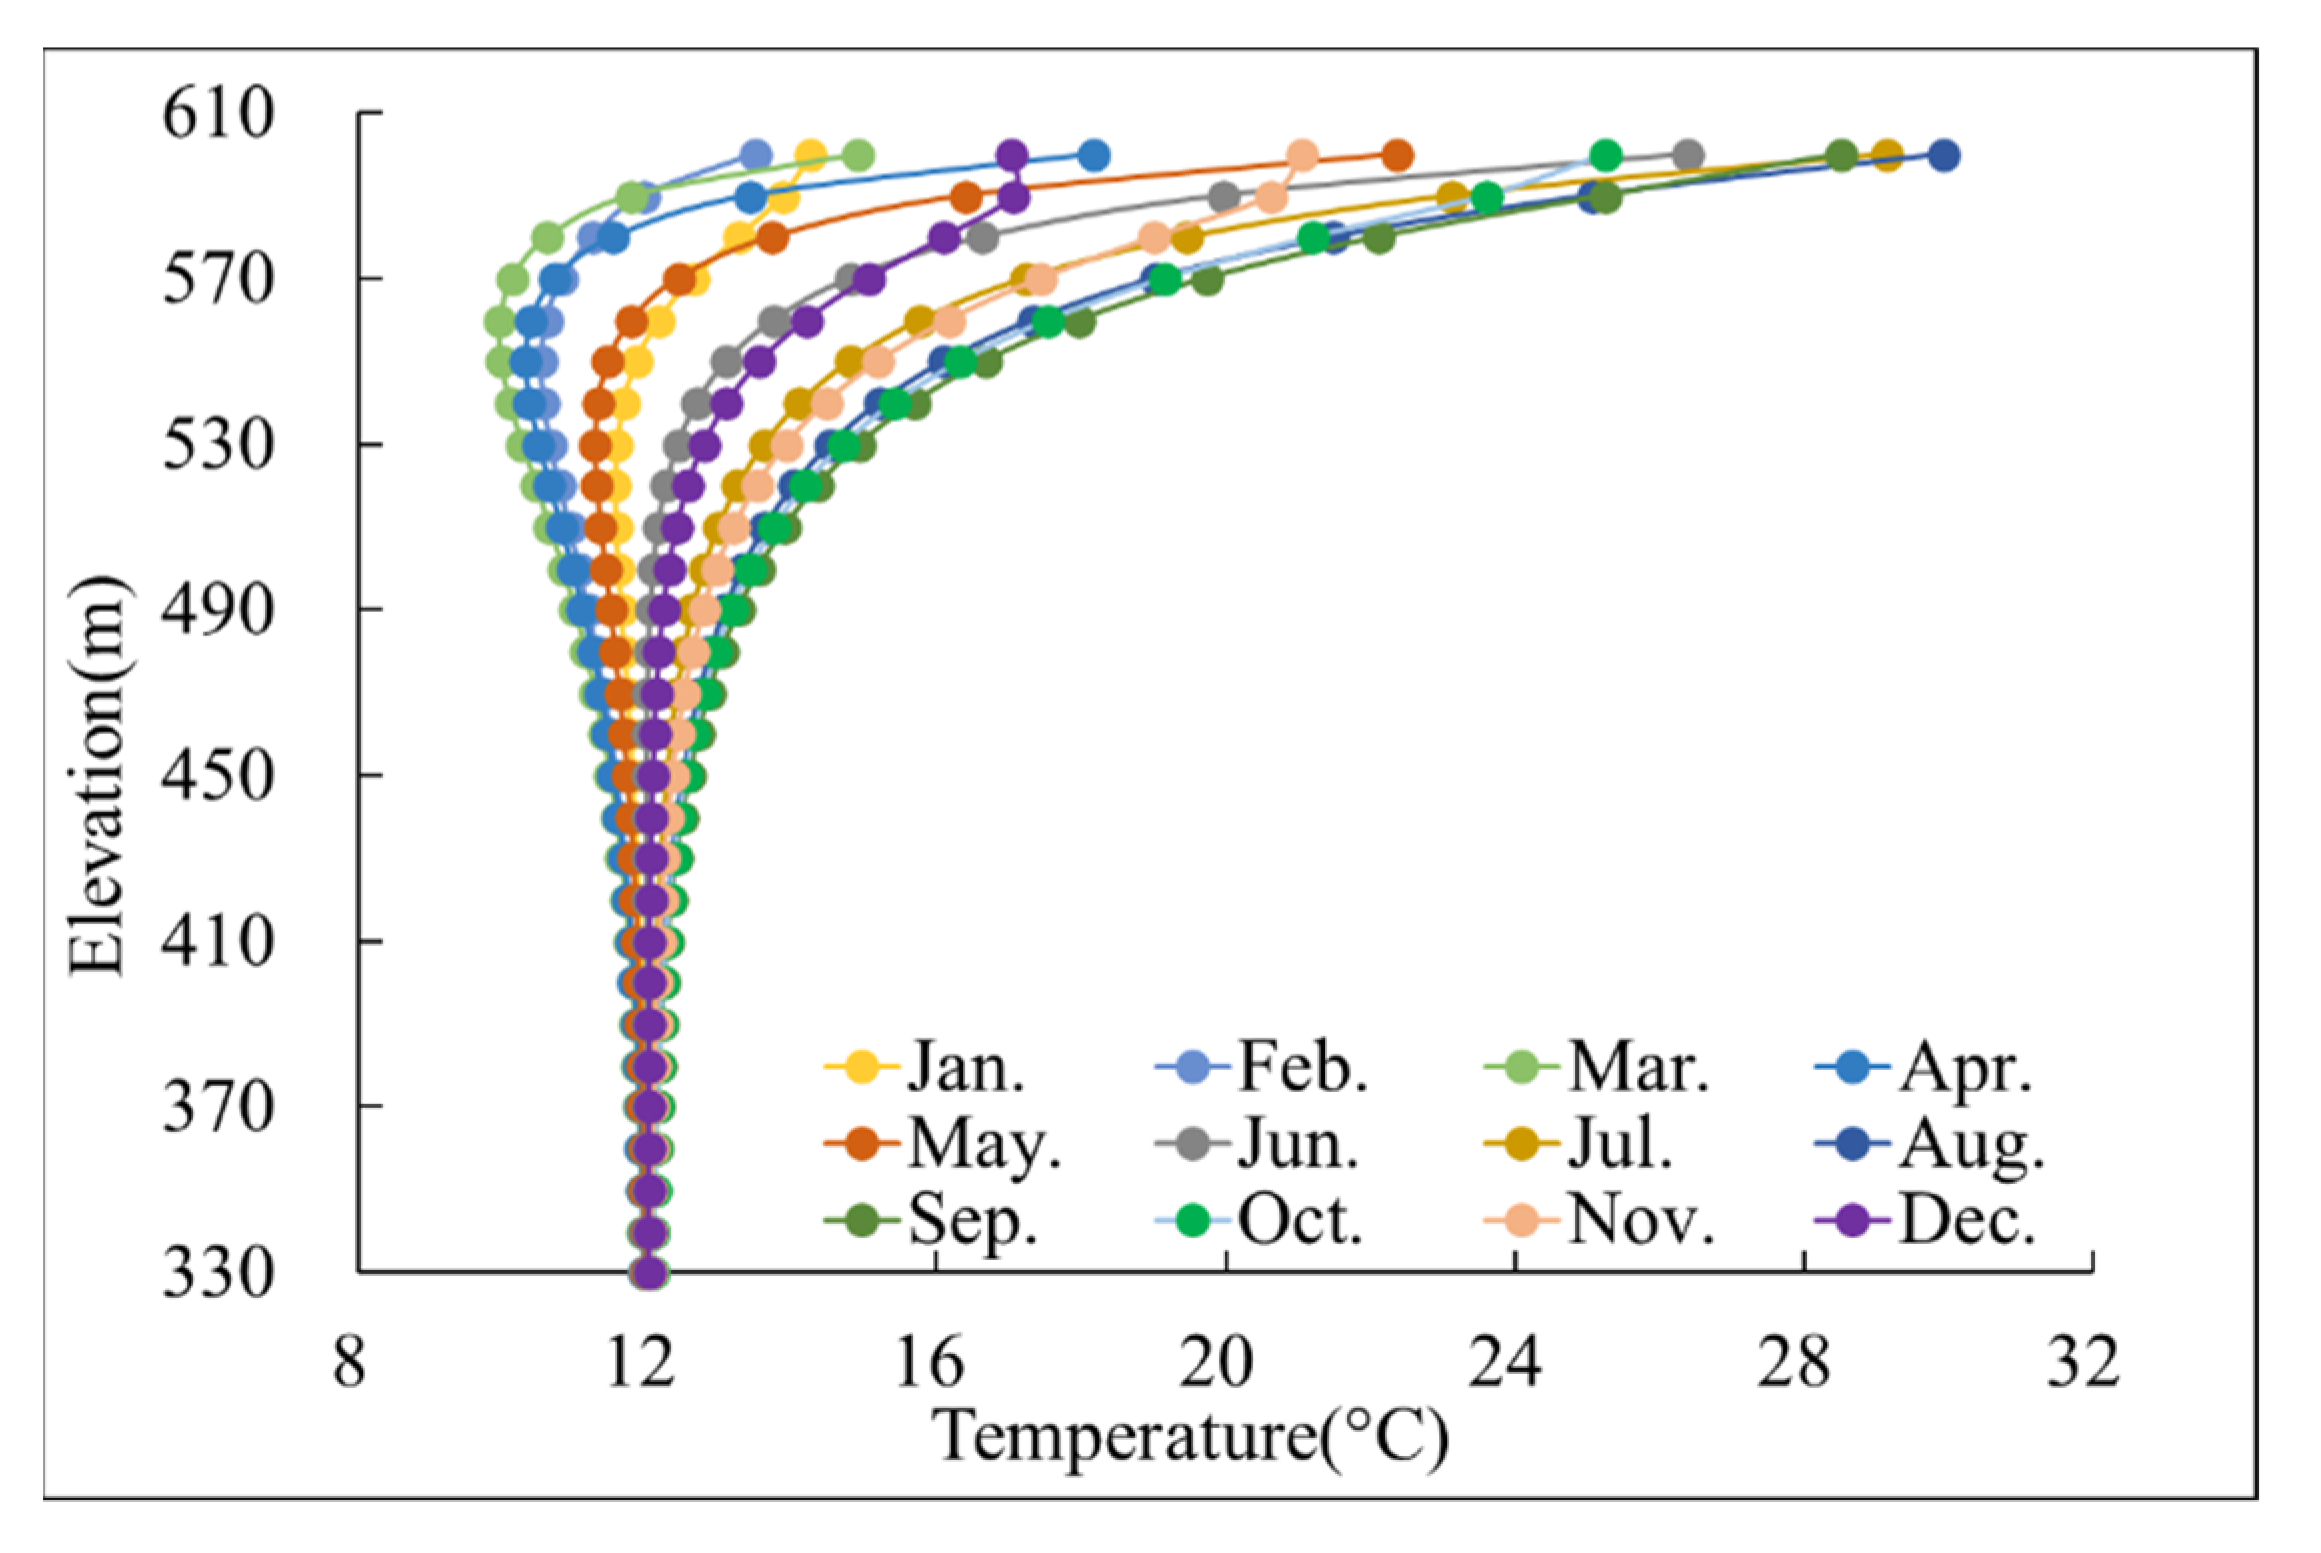
Both the part below the water level of the upstream surface of the dam and the surface of the foundation is affected by the water temperature, so the boundary condition of water temperature is taken. According to the monitoring results of the thermometer measuring points at the upstream surface of the No. 16 dam section from 2018 to 2020, it is calculated that the monthly average temperature distributes along the elevation, and the measured water temperature boundary conditions are obtained, as shown in Figure 8.
4.4. Inversion of Internal Temperature
On the basis of the test results of arch dam concrete, the thermal parameters of the dam body and foundation were selected according to Table 5.
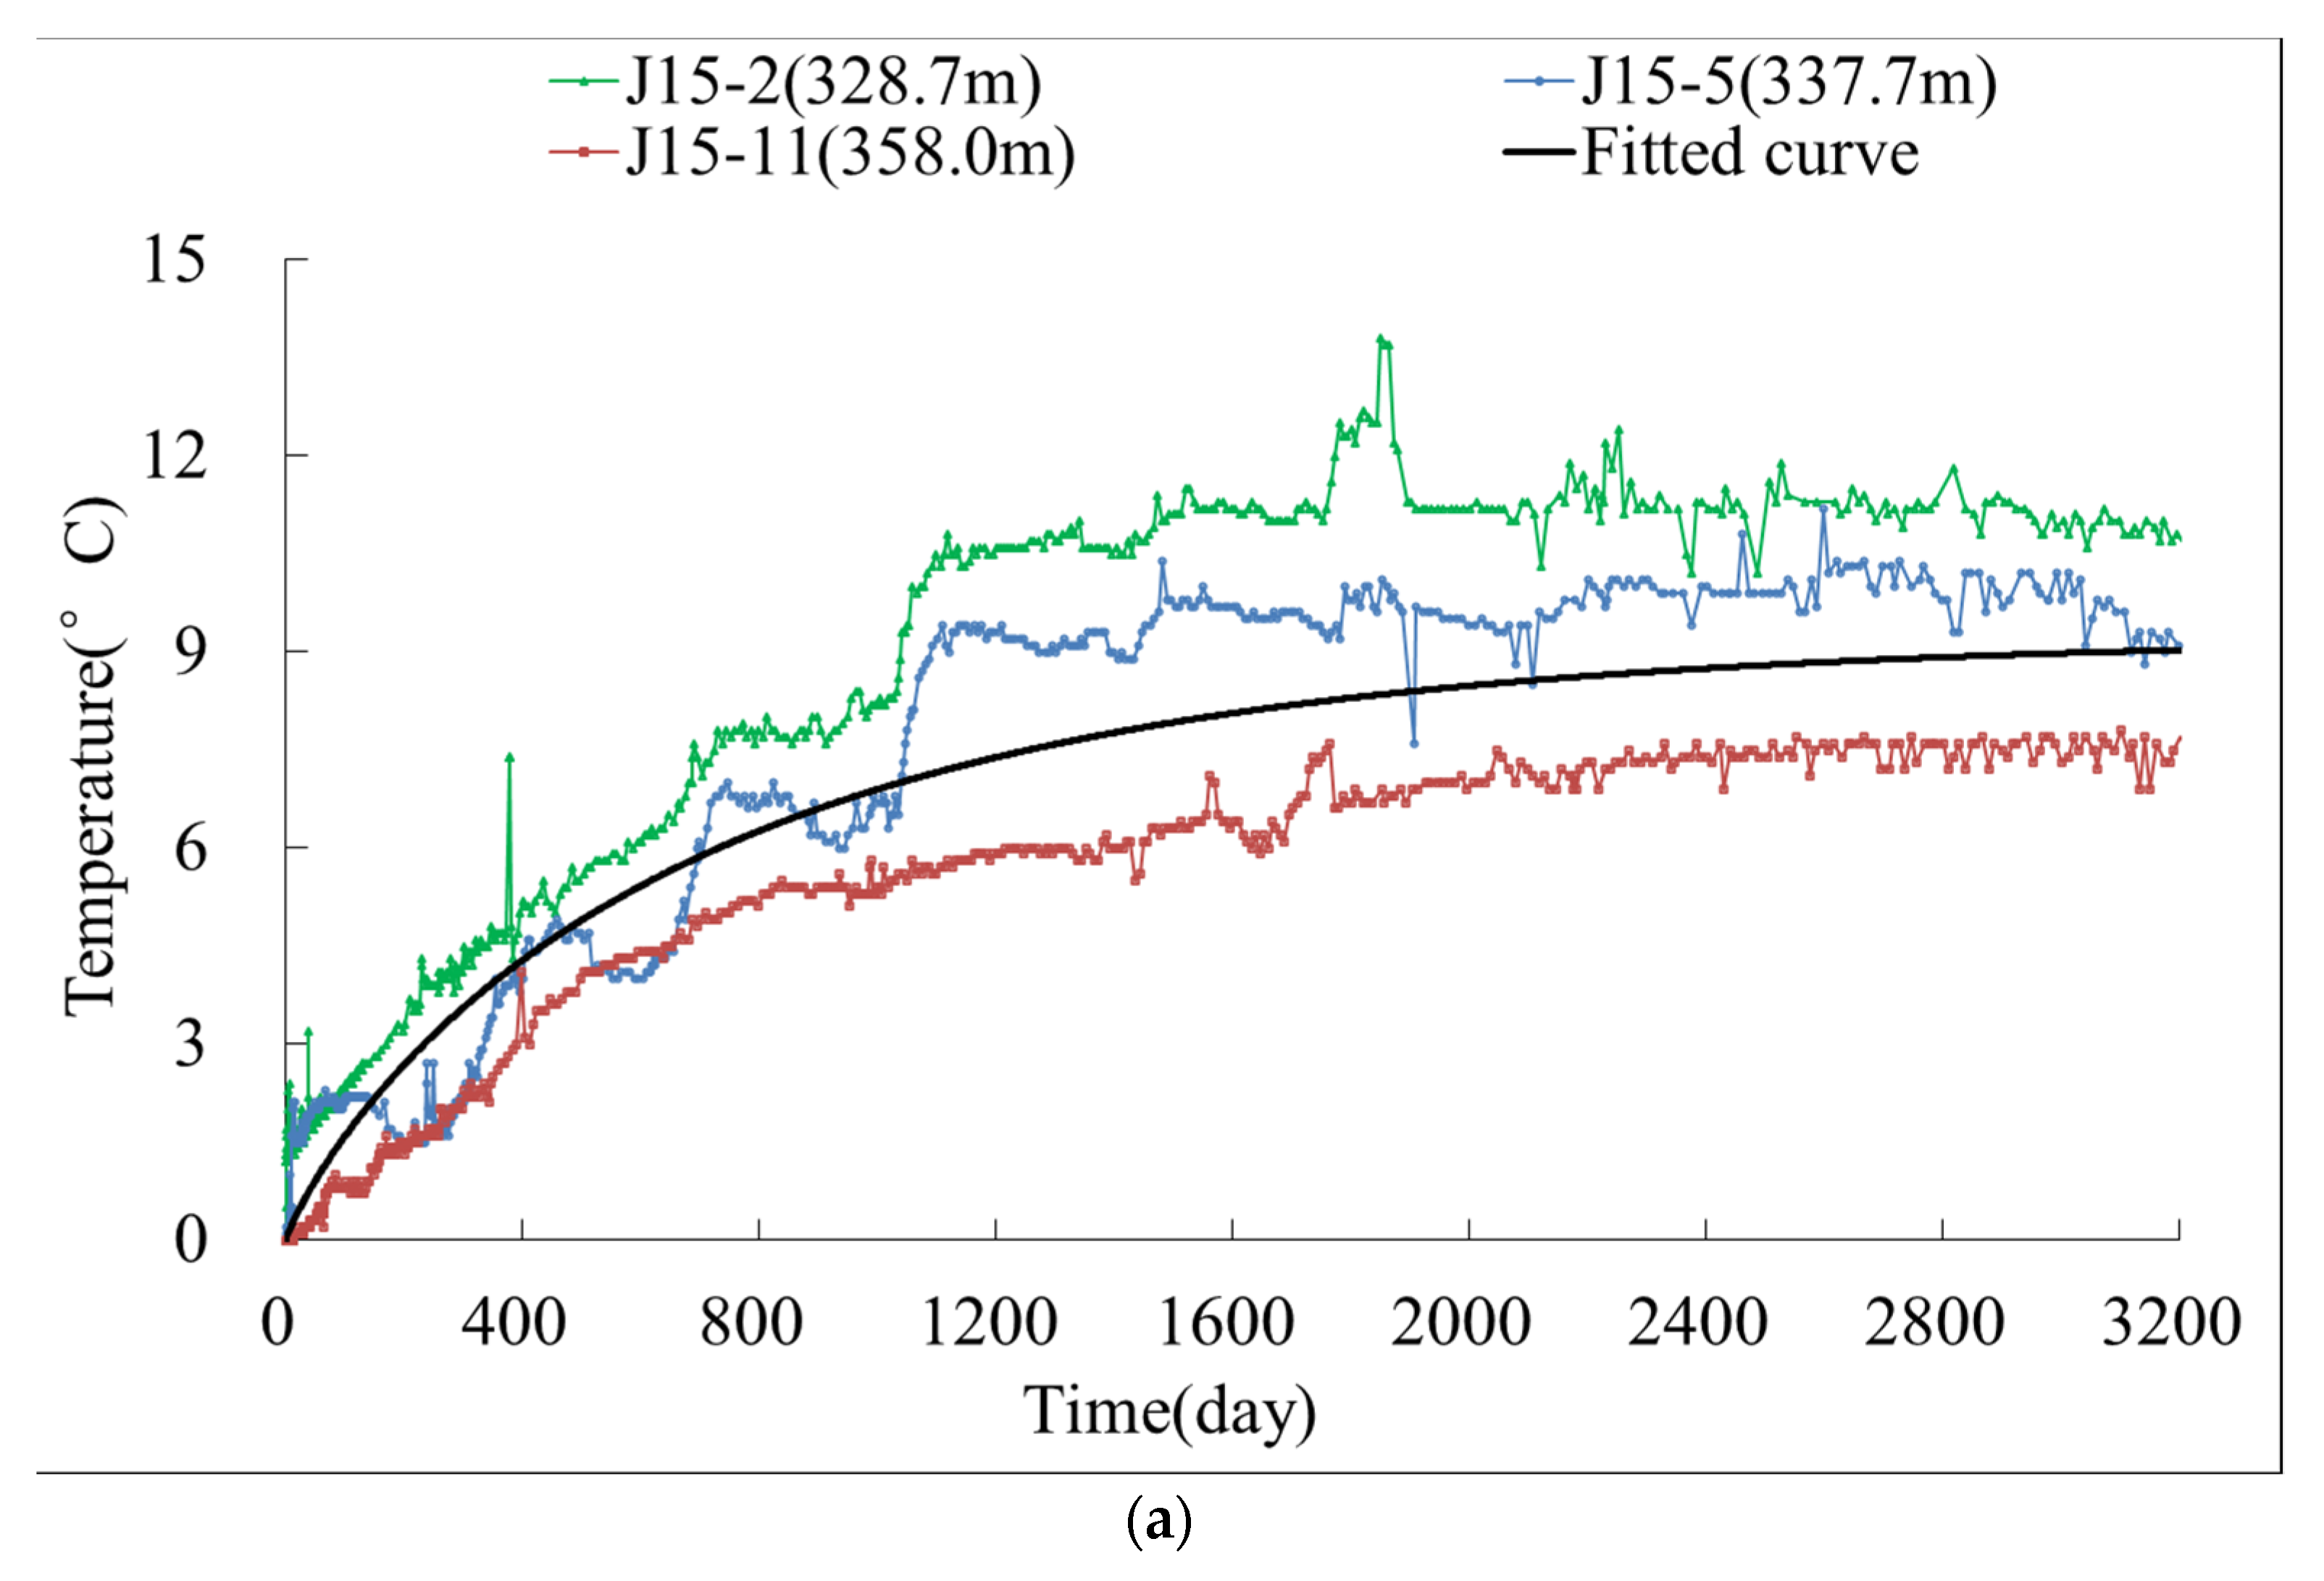
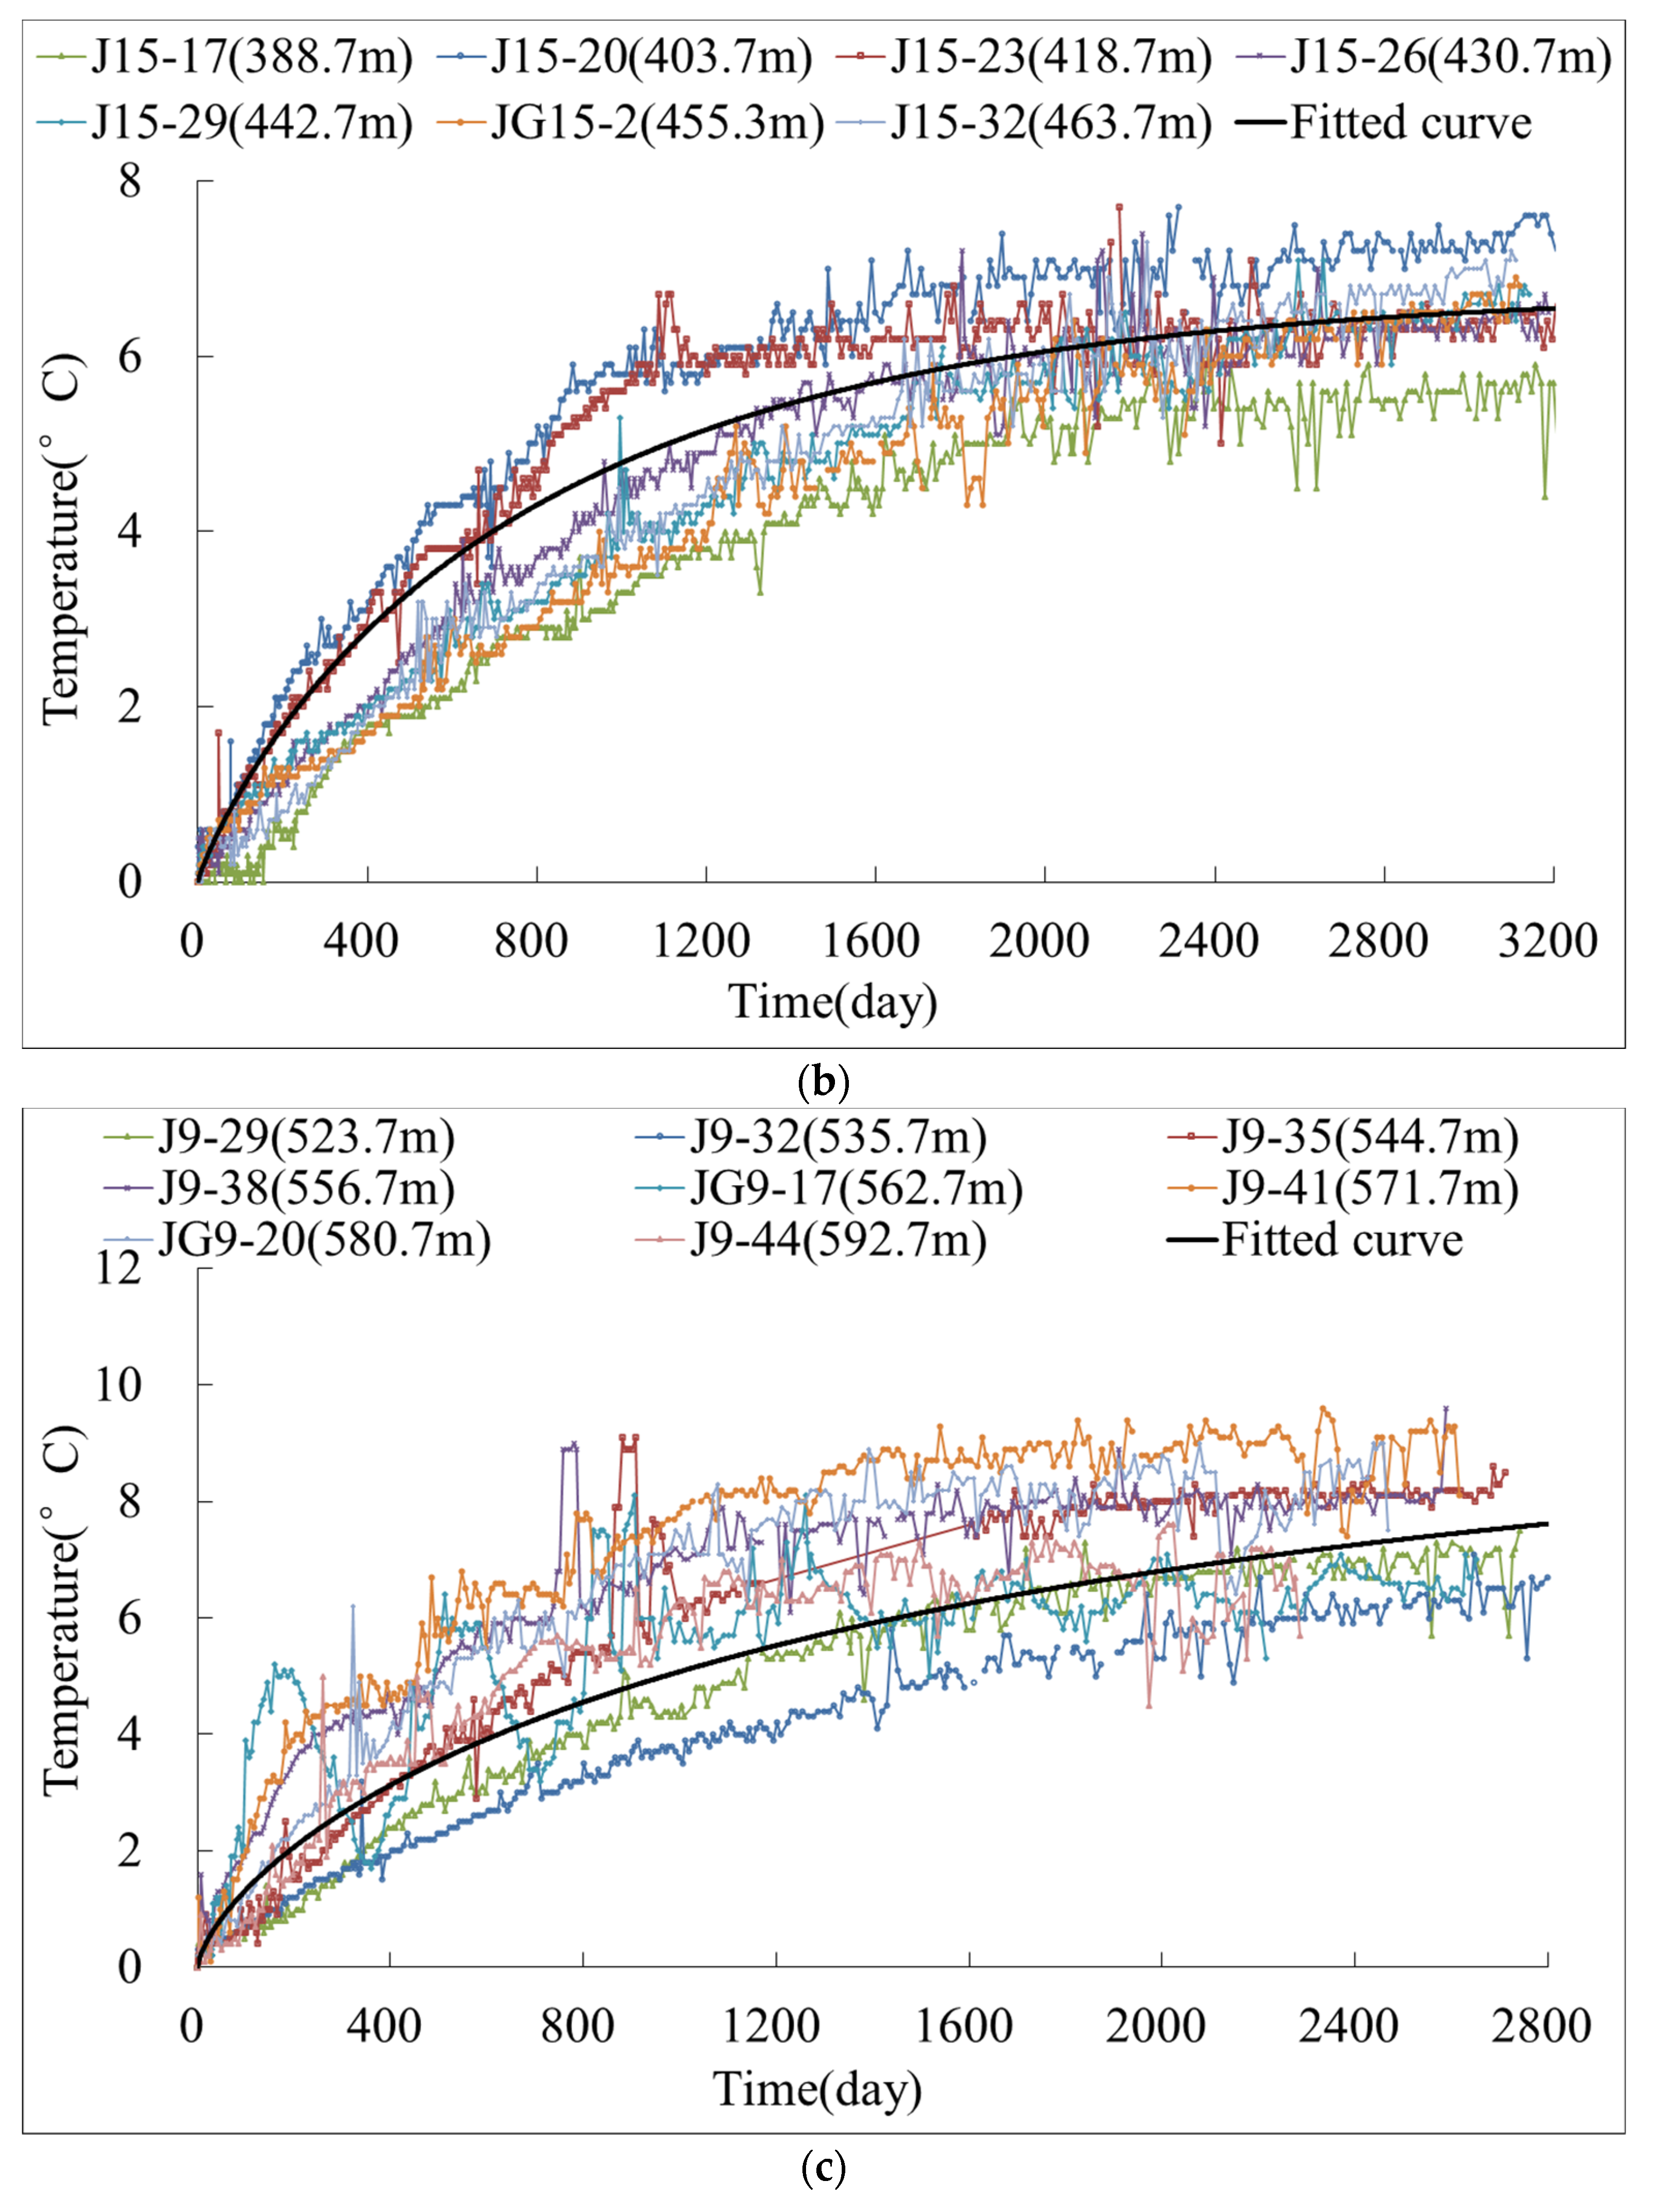
In order to fully consider the change in concrete temperature recovery in the later stage after the transverse joint grouting and water pipe cooling, the joint meter temperature monitoring results of the No. 9 and No. 15 transverse joints were collated and counted according to the dam concrete zoning, and the monitoring values of concrete temperature rise at the end of second-stage cooling monitored were obtained. After that, the later temperature recovery models of C40, C35 and C30 concrete were analyzed and fed back. Figure 9 shows the location of the joint meters, Figure 10 shows the concrete temperature rise process line. The combinatorial double exponential equation is used to represent the temperature rise in concrete in this paper. The temperature rise models of three kinds of concrete at the later hydration stage were obtained by inversion as follows:
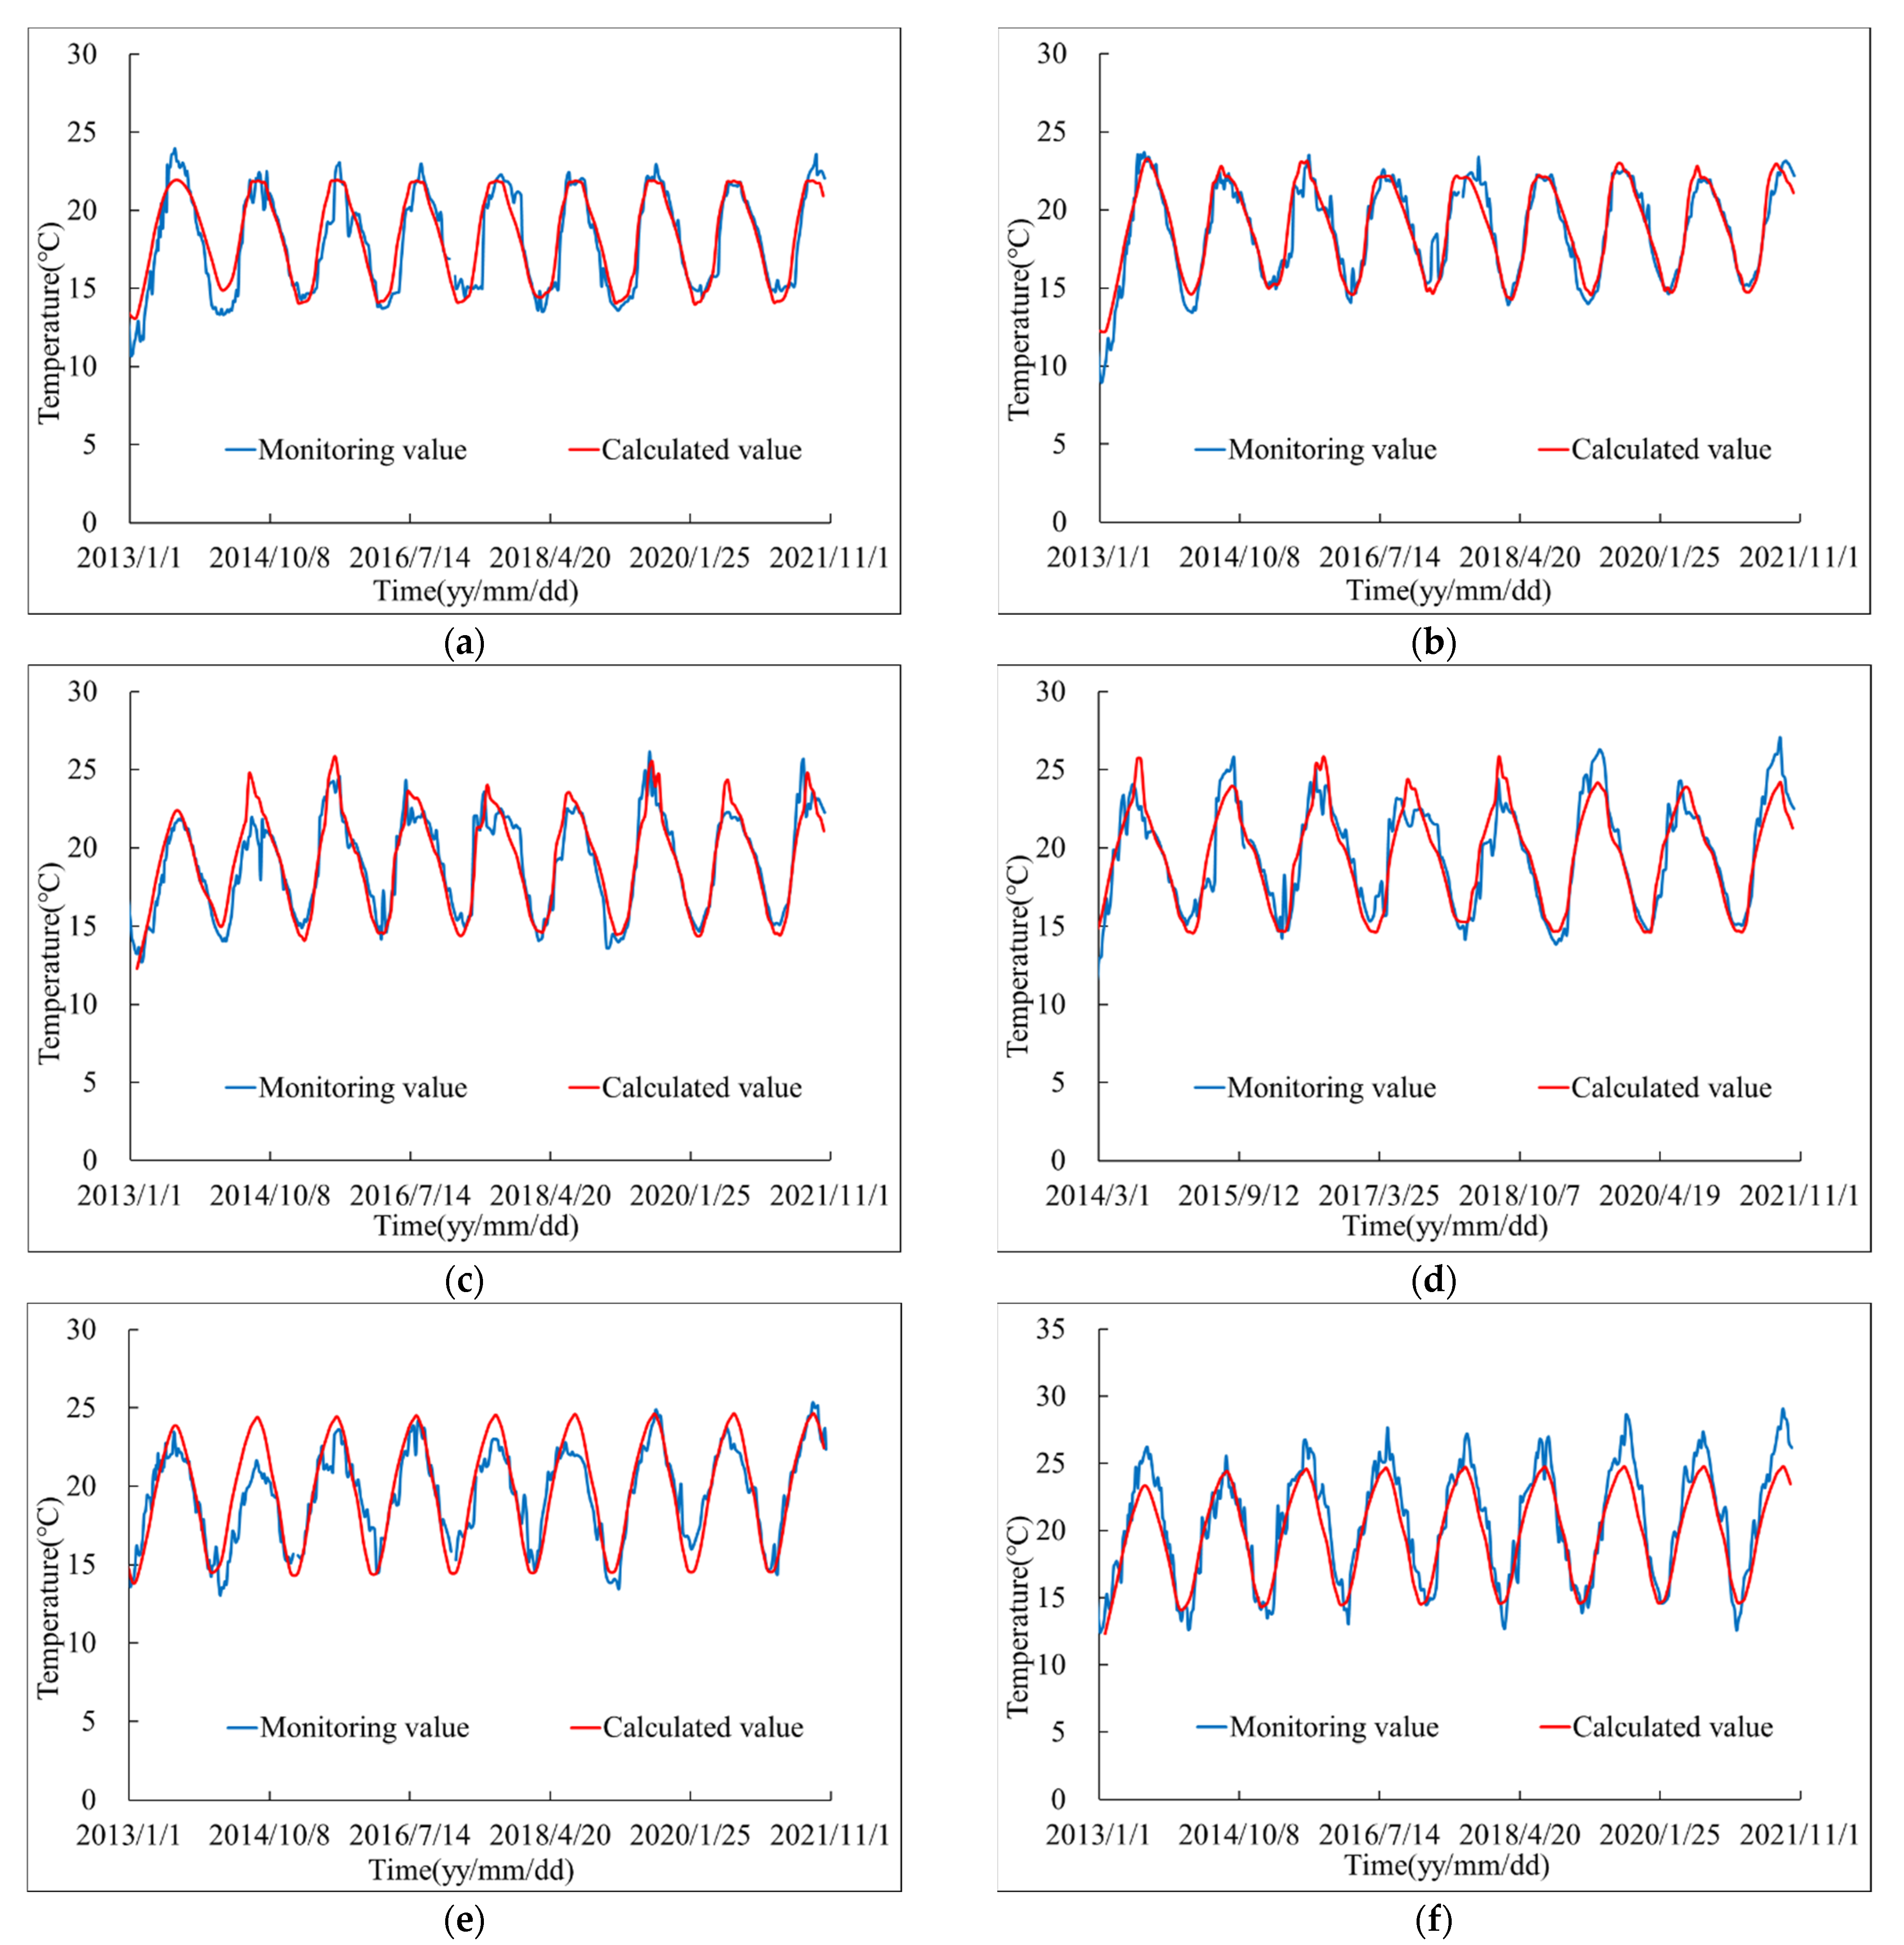
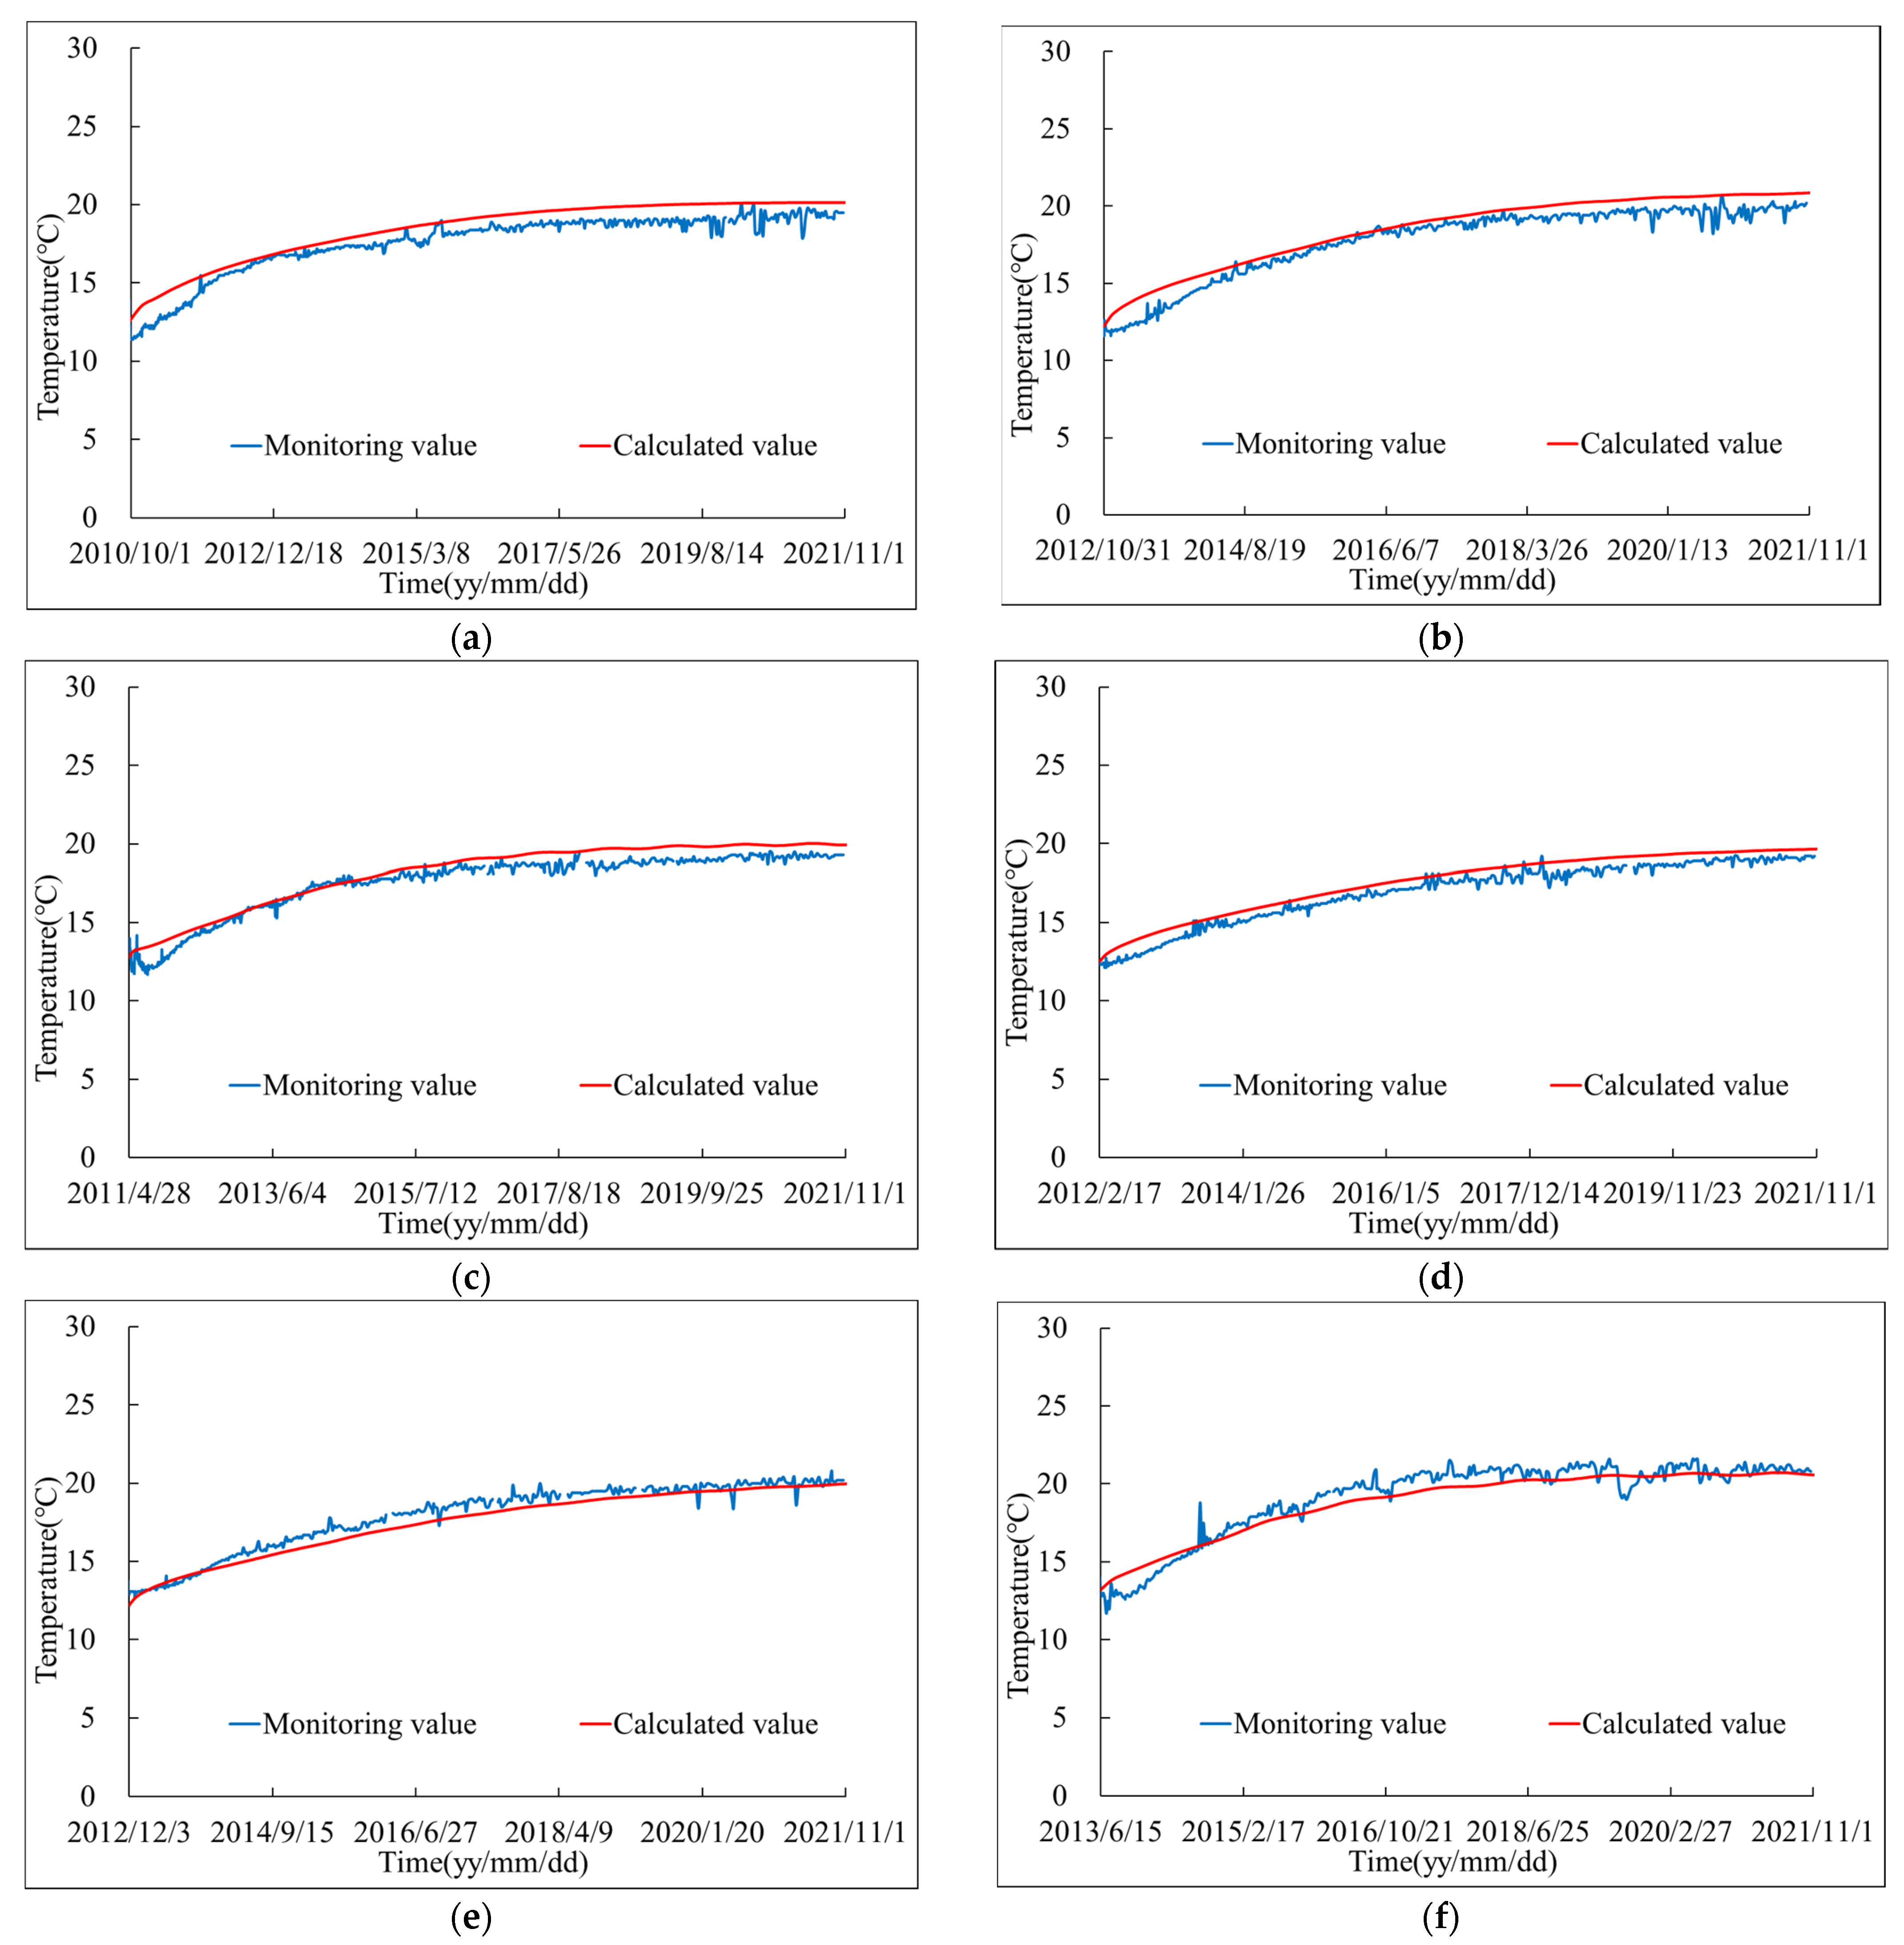
Based on the above calculation model, temperature boundary conditions, thermal parameters and the temperature recovery model of concrete in the later stage obtained by inversion, the temperature field of the arch dam at the initial stage of impoundment was obtained by finite element simulation analysis. Figure 11 shows the comparison between the monitored and calculated values of temperature at the dam surface measuring points, in which (a–d) are the measuring points at the upstream surface, and (e,f) are those at the downstream surface; Figure 12 shows the comparison between the monitored and calculated values of temperature at the measuring points inside the dam. It can be seen that the variation law of simulation temperature at the measuring point is consistent with that of the measured temperature, and two values are in good agreement, which indicates that the finite element simulation analysis method and thermal parameters adopted are reasonable.
5. Analysis on Temperature Field Difference of Arch Dam under Design Condition and Actual Condition
5.1. Calculation Condition Difference
The same finite element model of the arch dam foundation was adopted in the simulation calculation under the design and actual conditions, and the temperature was the annual average temperature. Besides, the same thermal parameters of the dam body and foundation were adopted. The difference is that the design reservoir water temperature differs from the actual reservoir water temperature, and the later temperature rise of the dam concrete is not considered under the design condition.
The boundary conditions of design water temperature were calculated by the method of the specification [3], as shown in Figure 13. Compared with the measured reservoir water temperature, it can be found that the reservoir water temperature is basically stable below the elevation of 475 m. According to the specification, the designed reservoir bottom water temperature is 12 °C, while the measured reservoir bottom water temperature is 14 °C. The former is lower than the latter. The deep-hole flood discharging was not taken into consideration in calculating the design reservoir water temperature, so the design water temperature is quite different from the measured one above the elevation of 475 m. It can be seen that the boundary of the designed reservoir water temperature is different from that of the actual reservoir water temperature.
5.2. Results and Discussions
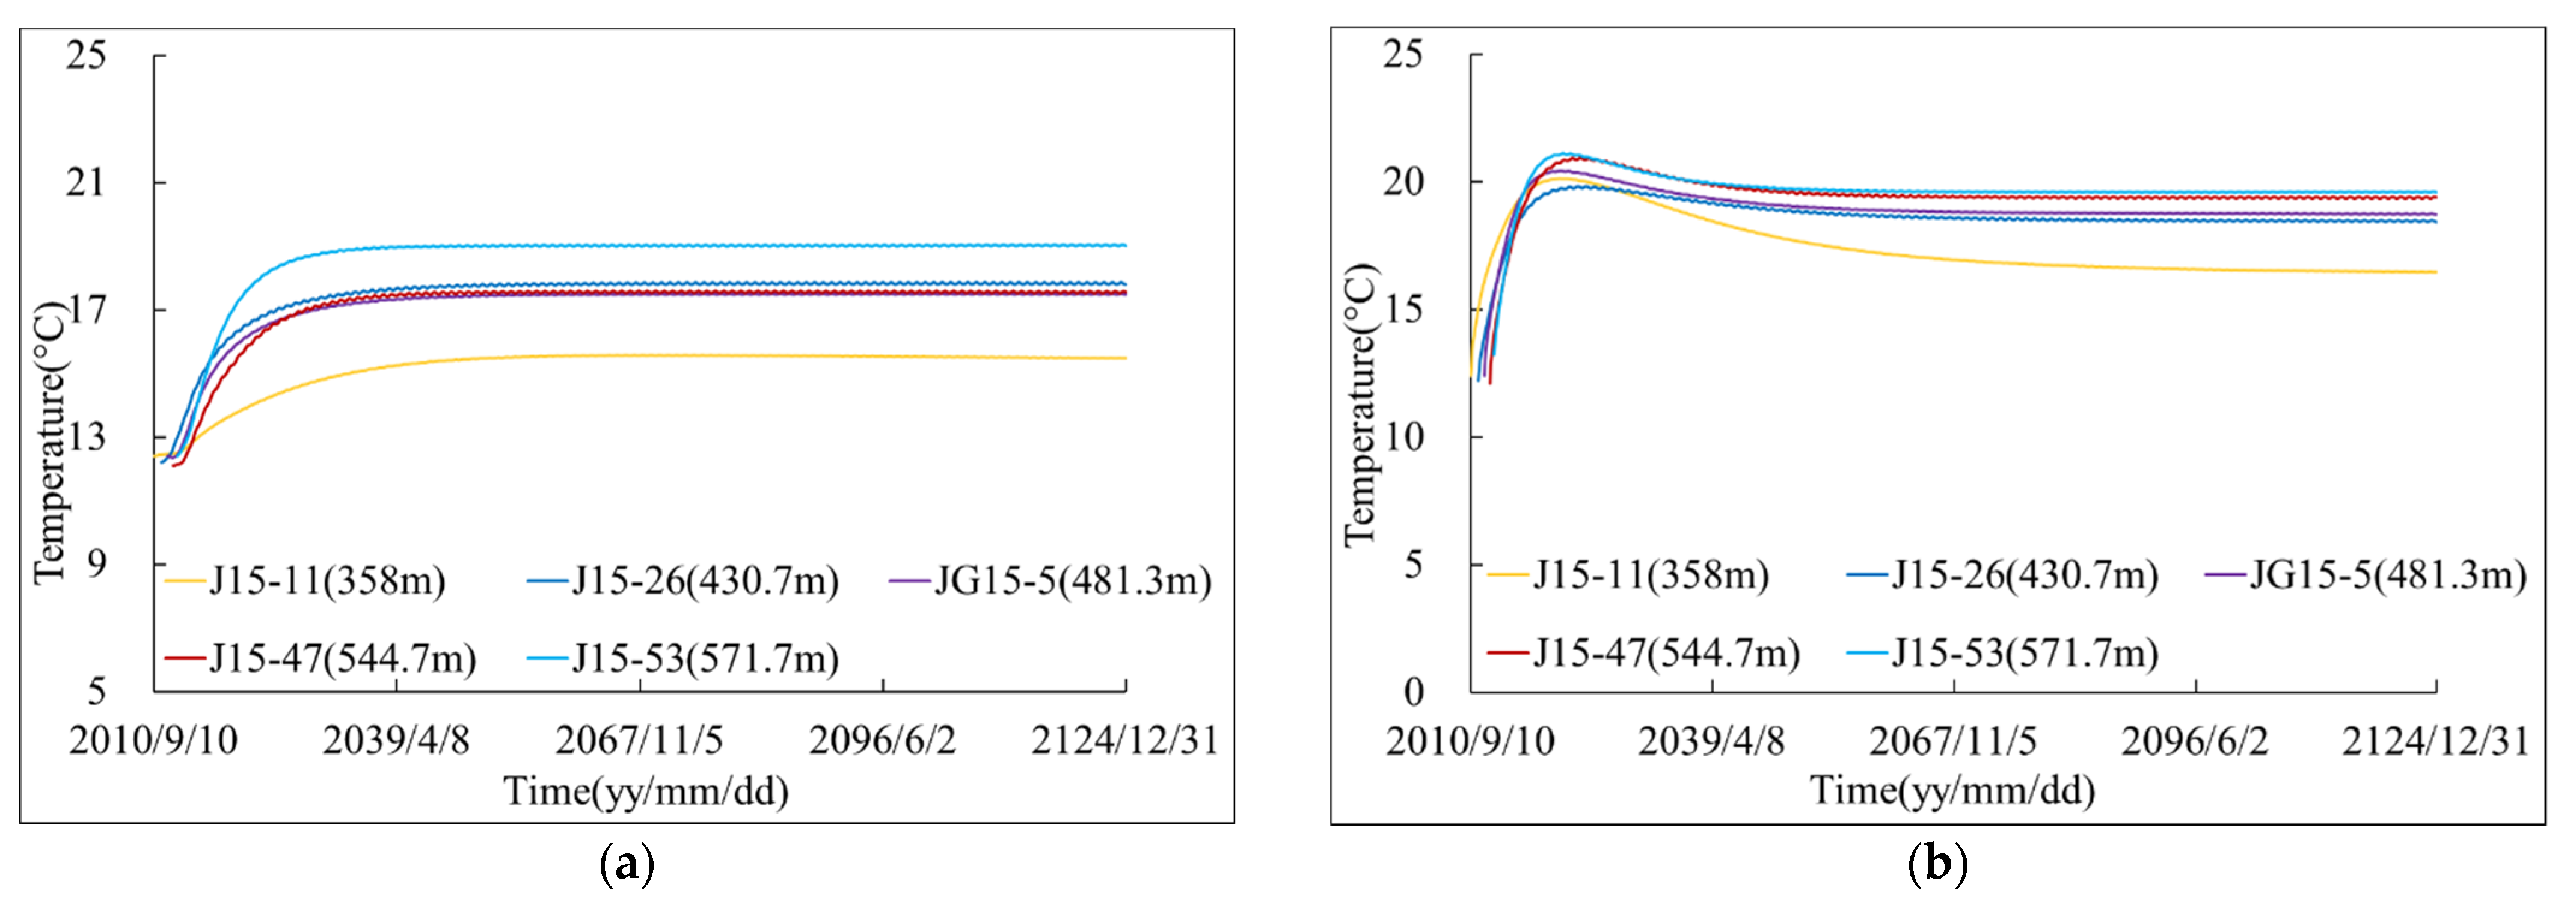
The temperature field of the arch dam under the design and actual conditions was obtained by simulation. Figure 14 shows the temperature change process of the measuring points inside the arch dam under the design and actual conditions.
Under the design condition, the temperature rise inside the dam body is not considered. Due to the influence of low-temperature closure grouting and temperature boundary conditions, the temperature of the dam body rises slowly after closure grouting and tends to be stable. In this process, the internal temperature of the dam body is always lower than the stable temperature. Under the actual condition, the temperature of the dam body rises rapidly after closure grouting, up 7.1~9.2 °C, which is equivalent to the measured temperature recovery. After the arch is sealed, it reaches the highest temperature in about 8~12 years, and then gradually falls back to the final stable temperature, which takes 40~80 years. The thickness of the bottom of the cantilever No.15 and No.16 dam sections is 60 m, and the thickness of the top of the cantilever No.15 and No.16 dam sections is 14 m. The internal temperature of the lower dam with larger thickness changes slowly, and it takes a long time to achieve quasi-stability, while the temperature of the upper dam with smaller thickness rises and falls faster, so a short time is required to achieve quasi-stability. Under the design condition, the reservoir water temperature is lower than the measured temperature below the elevation of 580 m, so the internal stable temperature of the dam body under this condition is lower than that under the actual condition.
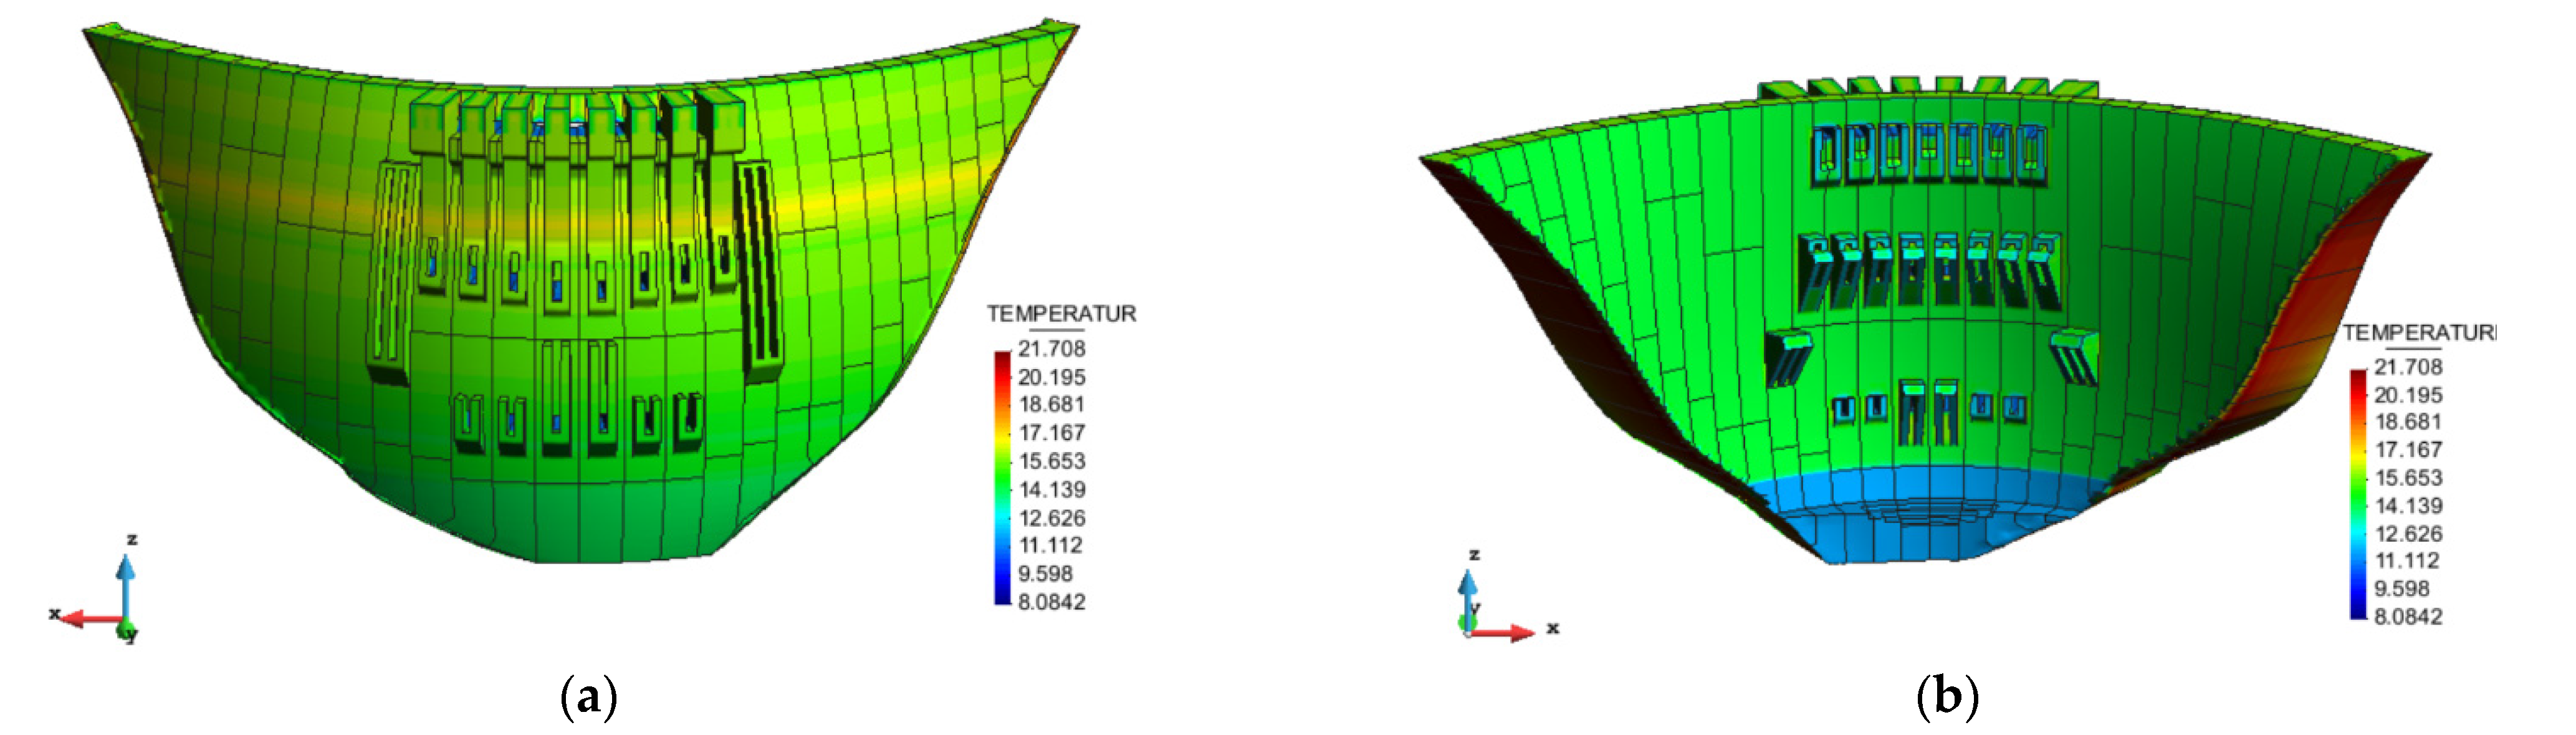
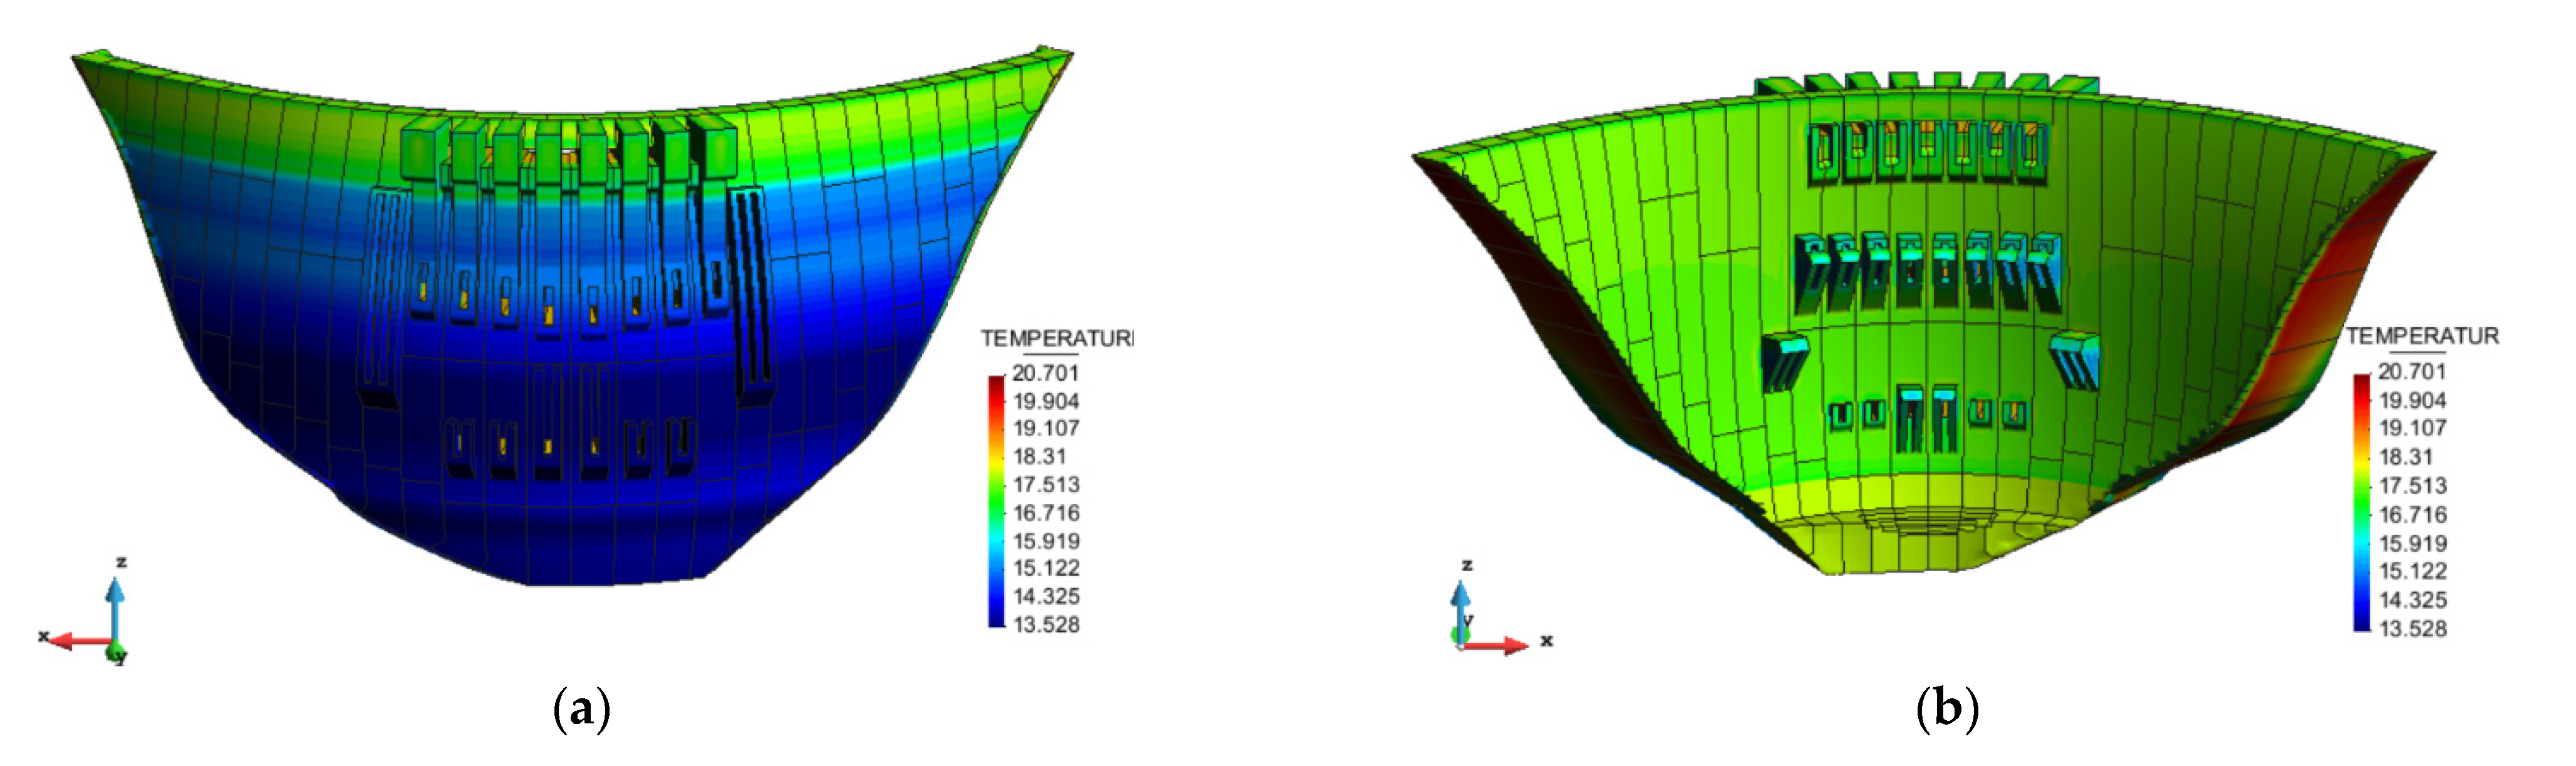
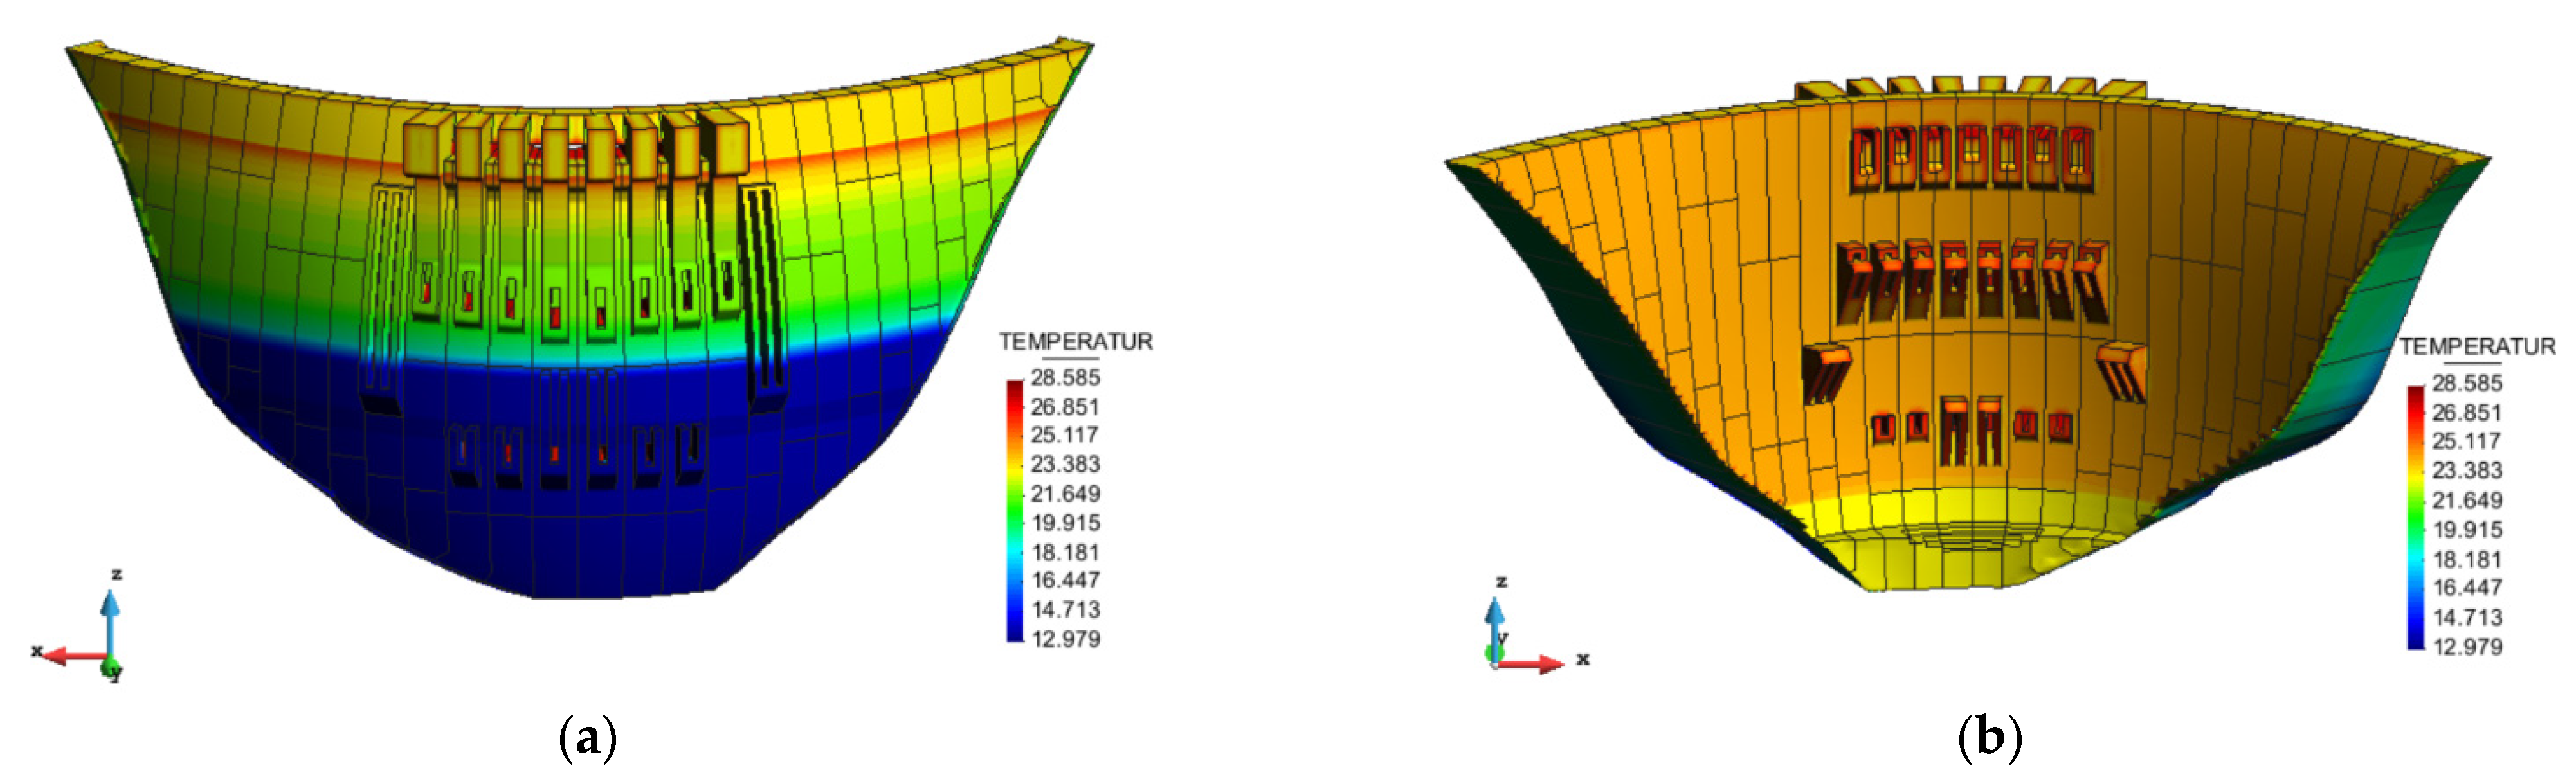
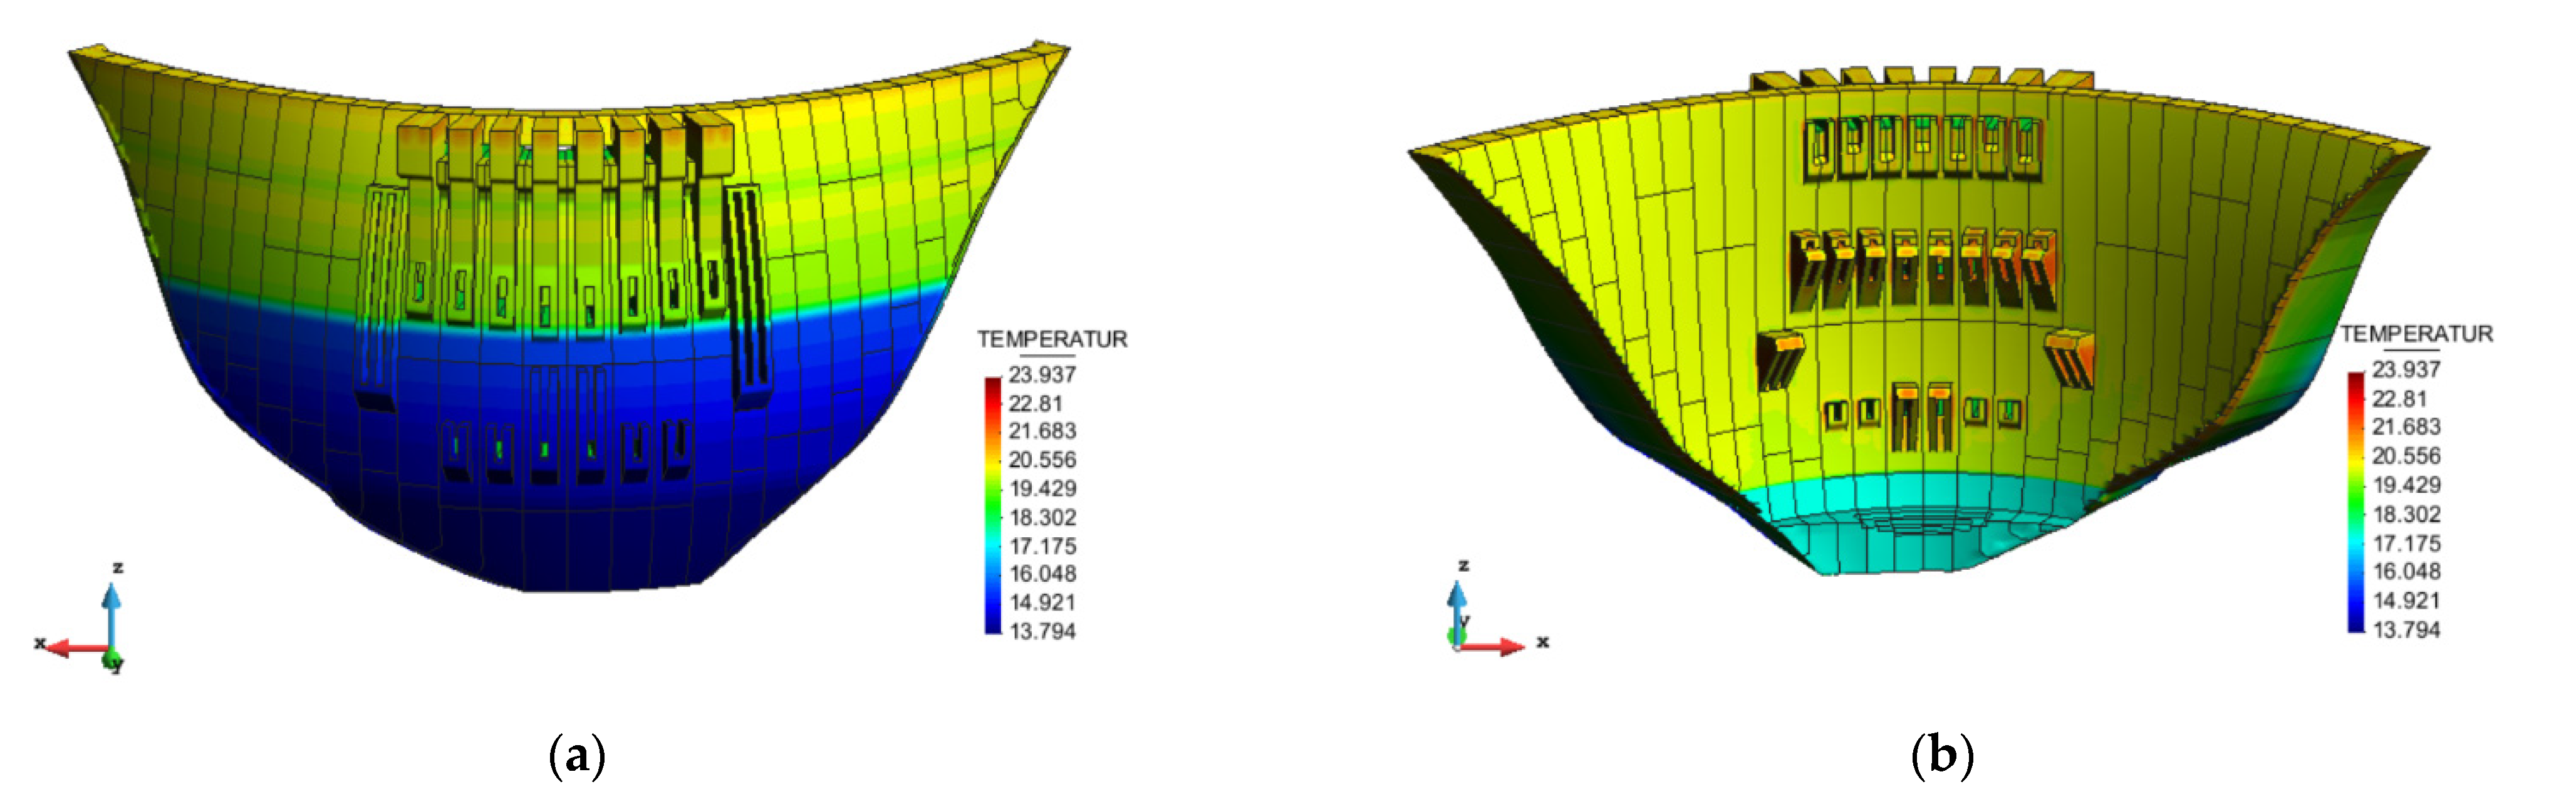
The surface temperature of the dam is mainly affected by the temperature boundary conditions. In this paper, only the cloud maps of the surface temperature of the arch dam under the actual condition are given. Figure 15, Figure 16, Figure 17 and Figure 18 are the cloud maps of the quasi-stable temperature field distribution of the dam in January, April, August and November under the actual condition. It can be seen that the dam surface temperature above the upstream water level of the arch dam is about 15~16 °C in January, 17 °C in April, 23~24 °C in August and 20 °C in November. The temperature below the water level decreases with the elevation decreasing, and it is about 13~14 °C near the dam bottom in January, April, August and November. The temperature distribution on the dam surface above the downstream water level is uniform, and it is about 14.5 °C in January, 17.5 °C in April, 24 °C in August and 20 °C in November.
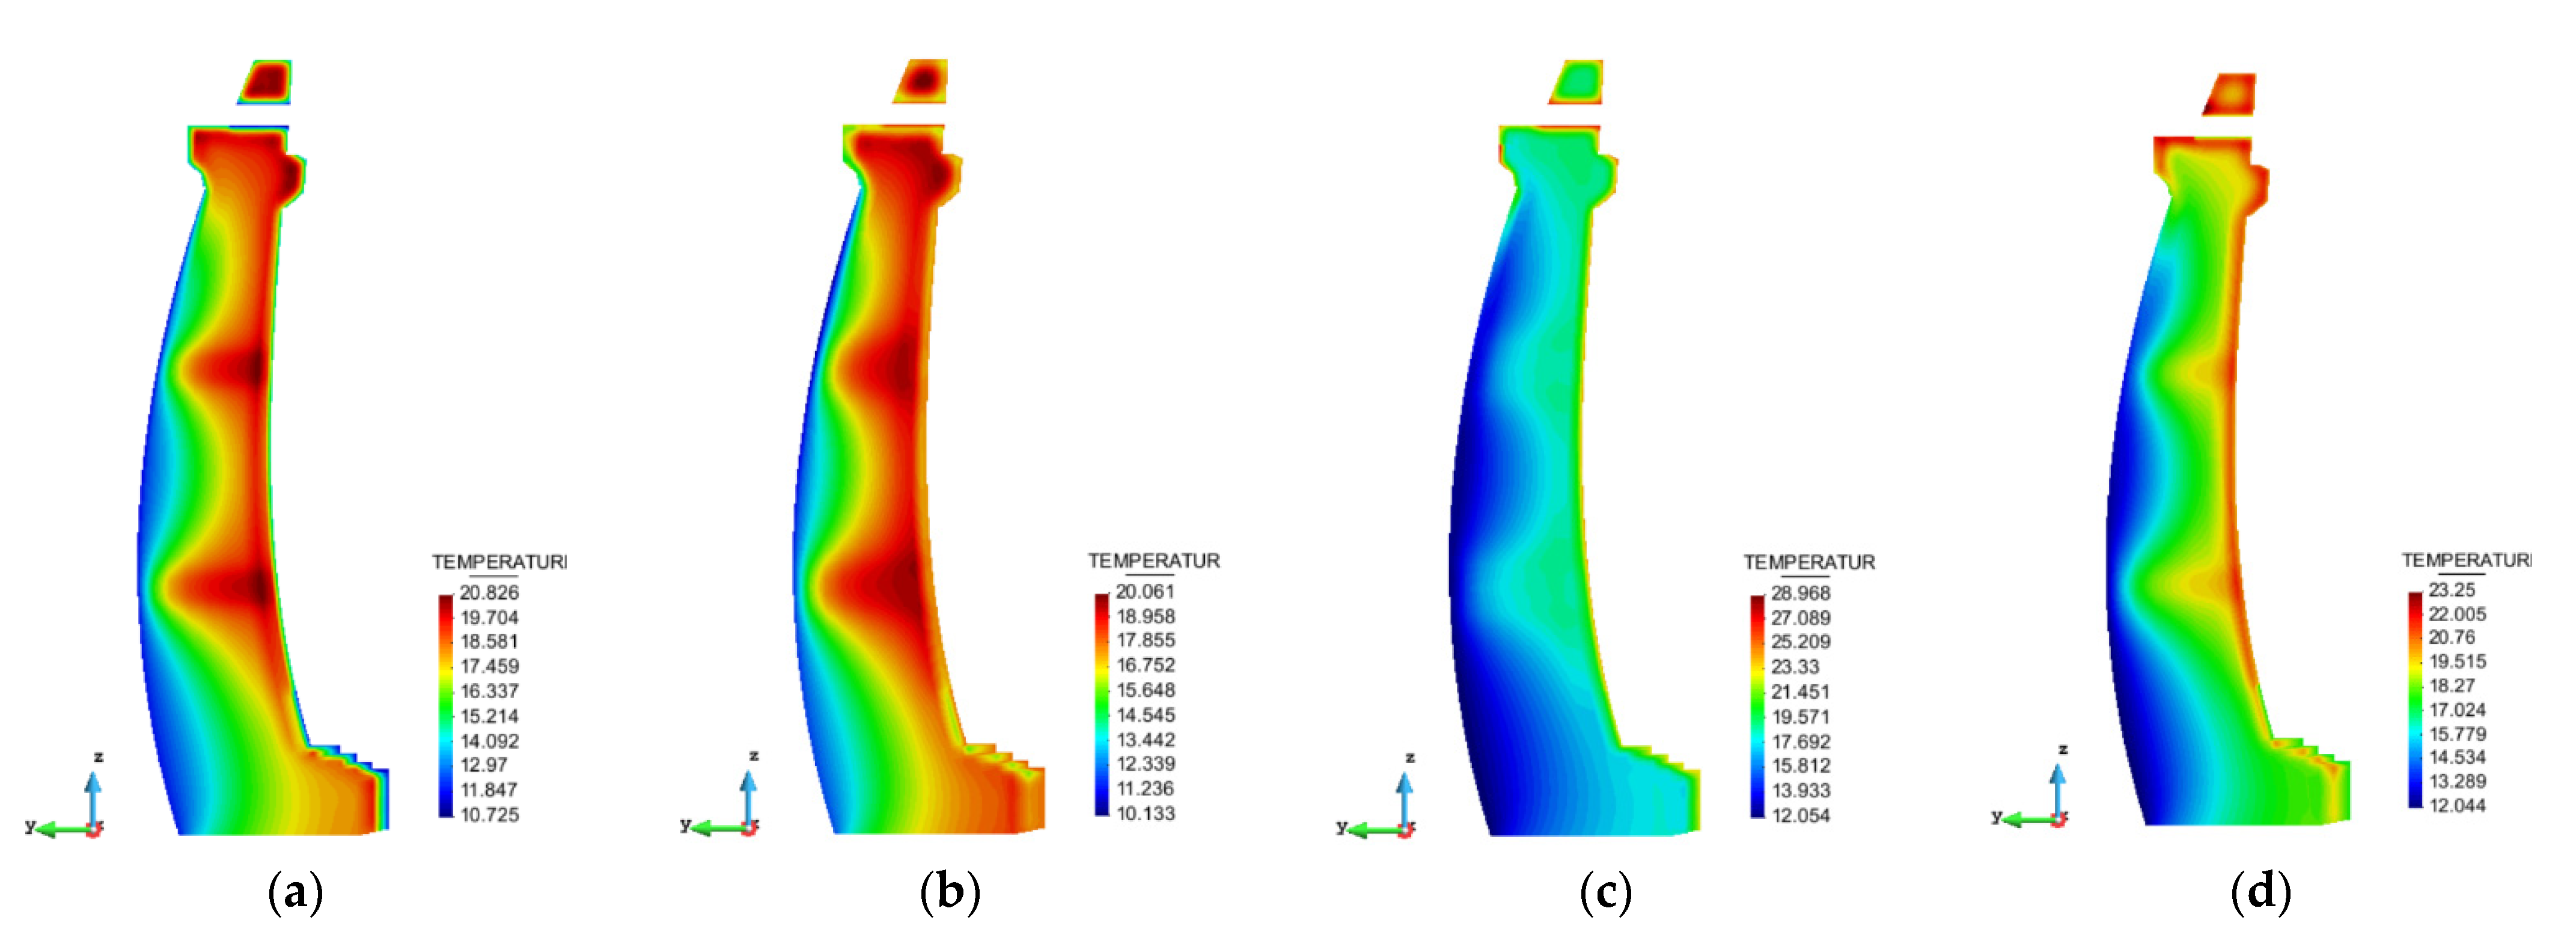
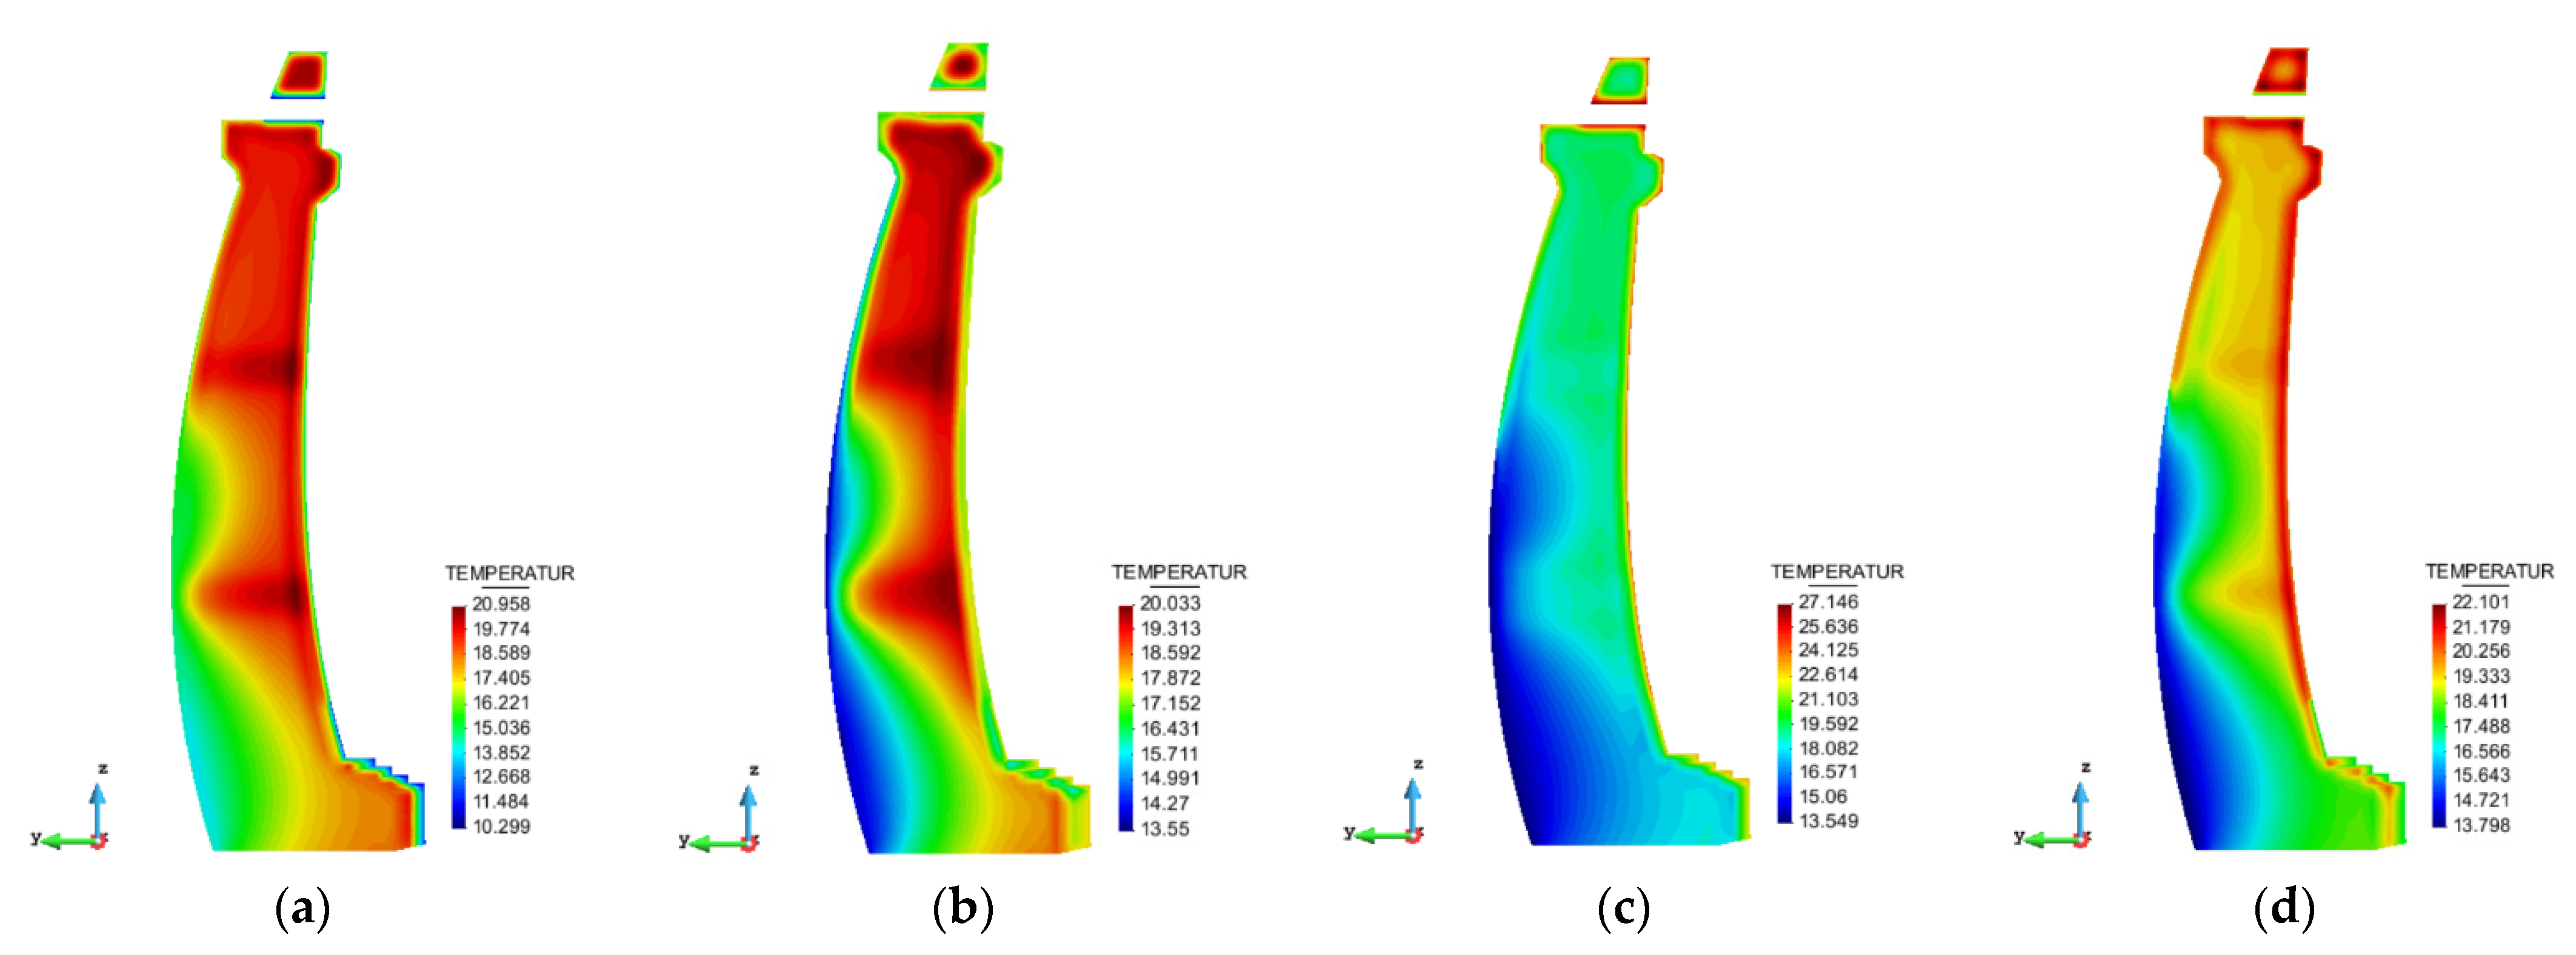
Figure 19 is the cloud map of quasi-stable temperature field distribution in the cross-section of cantilever No. 16 dam section under the design condition, and Figure 20 is that under the actual condition. It can be seen that the dam surface temperature is greatly influenced by the air temperature and the reservoir water temperature, but the influence depth is shallow. The internal temperature of the dam body is mainly affected by the temperature recovery in the later period, which changes slightly in January, April, August and November. Under the design condition, the temperature at the dam bottom is about 15.5~18 °C, 16.5~18.5 °C at half of the dam height, and 17~19 °C at the dam crest. Under the actual condition, they are about 16.5~18 °C, 18~19.5 °C, and 19.5 °C, respectively. It follows that the internal stable temperature of the dam under the design condition is lower than that under the actual condition. The temperature field inside the dam body has little difference below the 490 m elevation of the deep hole orifice, but a great difference above the 490 m elevation under two conditions. The main reason is that the reservoir water temperature is different in this elevation range.
6. Conclusions
In this paper, a super-high arch dam in southwest China was taken as the research object, and the temperature field of the dam during the operation was analyzed by using the finite element simulation method. Based on this, the difference in the temperature field between the design condition and the actual condition was studied, and the conclusions are as follows:
- Through the analysis of the monitoring data of temperature at the dam surface measuring points and internal measuring points, it is found that the temporal-spatial evolution law of the overall temperature of the dam accords with conventional knowledge;
- The change process of temperature at the monitoring points calculated by the simulation is in good agreement with that of the monitoring value, which indicates that the adopted simulation analysis method and the thermal parameters obtained by inversion are reasonable and reliable;
- Through simulation calculation, the temperature field of the arch dam under the design and actual conditions were obtained. Under the design condition, the temperature rise inside the dam body is not considered. Due to the influence of low-temperature closure grouting and boundary heat transfer, the temperature of the dam body rises slowly after closure grouting and tends to be stable. In this process, the internal temperature of the dam body is always lower than the stable temperature. Under the actual condition, the temperature of the dam body rises rapidly after closure grouting, by 7.5~9.2 °C. After the arch is sealed, it reaches the highest temperature in about 8~12 years, and then gradually falls back to the final stable temperature in 40~80 years;
- The dam surface temperature is greatly influenced by the air temperature and the reservoir water temperature, but the influence depth is shallow. The internal temperature of the dam body is mainly affected by the temperature recovery in the later period, which changes slightly in January, April, August and November. The internal stable temperature of the dam under the design condition is lower than that under the actual condition. The temperature field inside the dam body has little difference below the 490 m elevation of the deep hole orifice, but a great difference above the 490 m elevation under two conditions.
Author Contributions
Conceptualization, C.H., H.C. and B.Y.; methodology, H.C. and B.Y.; software, D.C.; validation, C.H., D.C. and S.N.; formal analysis, D.C.; investigation, Y.Z.; resources, C.H.; data curation, Y.Z.; writing—original draft preparation, D.C.; writing—review and editing, C.H., H.C., S.N., B.Y. and Y.Z.; visualization, Y.Z. and S.N.; supervision, C.H.; project administration, D.C.; funding acquisition, H.C. All authors have read and agreed to the published version of the manuscript.
Funding
This work was supported by the National Key Technologies Research and Development Program (2021YFC3090102), and the China Three Gorges Corporation Research Project (No. 412002002, XLD/2114).
Data Availability Statement
Not applicable.
Conflicts of Interest
The authors declare that they have no conflict of interest.
References
- Zhang, G.; Chen, P.; Zhou, Q. Real temperature load and the influence on the working performance of super-high arch dam. J. Hydraul. Eng. 2014, 45, 127–134. [Google Scholar]
- Zhang, G.; Liu, Y.; Zhou, Q. Study on real working performance and overload safety factor of high arch dam. Sci. China Ser. E Technol. Sci. 2008, 51, 48–59. [Google Scholar] [CrossRef]
- SL 282–2018; Design Specification for Concrete Arch Dams; Shanghai Investigation, Design & Research Institute Co., Ltd.: Shangai, China; Changjiang (Yangtze River) Institute of Survey, Planning, Design and Research Co., Ltd.: Wuhan, China; Ministry of Water Resources of the People’s Republic of China: Beijing, China, 2018.
- DL/T 5346–2006; Design Specification for Concrete Arch Dams; National Development and Reform Commission (NDRC) People’s Republic of China: Beijing, China, 2006.
- Zhu, B. Improvement of method for computing temperature loads on arch dams. Water Resour. Hydropower Eng. 2006, 37, 19–22. [Google Scholar]
- Li, T.; Wang, Z.; Zhao, L. Discussion on the computation method of temperature load on high arch dams. J. Hydroelectr. Eng. 2010, 29, 35–38. [Google Scholar]
- Fu, S.; Yuan, W. Simplified formula for temperature loads on arch dams based on FEM. Eng. J. Wuhan Univ. 2016, 49, 372–377. [Google Scholar]
- Lin, P.; Li, Q.; Hu, H. A flexible network structure for temperature monitoring of a super high arch dam. Int. J. Distrib. Sens. Netw. 2012, 4, 1238–1241. [Google Scholar] [CrossRef]
- Peng, H.; Lin, P.; Yang, N.; Li, M.; Qiao, Y. Real time thermal field analysis on Wudongde super high arch dam during construction. Glob. Energy Interconnect 2019, 2, 264–269. [Google Scholar] [CrossRef]
- Santillán, D.; Salete, E.; Vicente, D.J.; Toledo, M.Á. Treatment of solar radiation by spatial and temporal discretization for modeling the thermal response of arch dams. J. Eng. Mech. 2014, 140, 05014001. [Google Scholar] [CrossRef]
- Santillán, D.; Saleteb, E.; Toledob, M.A.; Granados, A. An improved 1D-model for computing the thermal behaviour of concrete dams during operation. Comparison with other approaches. Comput. Concr. 2015, 15, 103–126. [Google Scholar] [CrossRef]
- Belmokre, A.; Mihoubi, M.K.; Santillán, D. Analysis of dam behavior by statistical models: Application of the random forest approach. KSCE J. Civ. Eng. 2019, 23, 4800–4811. [Google Scholar] [CrossRef]
- Mirzabozorg, H.; Ghaemian, M.; Roohezamin, A. The reason of cracking in bottom gallery of SefidRud Buttress Dam and earthquake and post earthquake performance. Struct. Monit. Maint. 2019, 6, 103–124. [Google Scholar]
- Shi, N.; Chen, Y.; Li, Z. Crack Risk Evaluation of Early Age Concrete Based on the Distributed Optical Fiber Temperature Sensing. Adv. Mater. Sci. Eng. 2016, 2016, 4082926. [Google Scholar] [CrossRef] [Green Version]
- Peng, H.; Lin, P.; Xiang, Y.; Chen, W.; Zhou, S.; Yang, N.; Qiao, Y. A Positioning Method of Temperature Sensors for Monitoring Dam Global Thermal Field. Front. Mater. 2020, 7, 587738. [Google Scholar] [CrossRef]
- Jin, F.; Zhou, Y. Application of distributed optical-fiber temperature measurement system to monitoring true temperature field of super-high arch dam. Eng. J. Wuhan Univ. 2015, 48, 451–458. [Google Scholar]
- Ouyang, J.; Chen, X.; Huangfu, Z.; Lu, C.; Huang, D.; Li, Y. Application of distributed temperature sensing for cracking control of mass concrete. Constr. Build. Mater. 2019, 197, 778–791. [Google Scholar] [CrossRef]
- Žvanut, P.; Turk, G.; Kryžanowski, A. Thermal Analysis of a Concrete Dam Taking into Account Insolation, Shading, Water Level and Spillover. Appl. Sci. 2021, 11, 705. [Google Scholar] [CrossRef]
- Ghafoori, Y.; Vidmar, A.; Říha, J.; Kryžanowski, A. A Review of Measurement Calibration and Interpretation for Seepage Monitoring by Optical Fiber Distributed Temperature Sensors. Sensors 2020, 20, 5696. [Google Scholar] [CrossRef] [PubMed]
- Zhu, Y.; Liu, Y.; Xie, X. Determination of thermal parameters of concrete by reverse analysis of test results. Chin. J. Geotech. Eng. 2002, 24, 175–177. [Google Scholar]
- Chen, F.; Zhu, Y. Application of Genetic Algorithms to the Back Analysis of Thermal Parameters in Arch Dam. J. North China Inst. Water Conserv. Hydroelectr. Power 2007, 28, 33–35. [Google Scholar]
- Liu, X.; Zhang, C.; Chang, X.; Zhou, W.; Cheng, Y.; Duan, Y. Precise simulation analysis of the thermal field in mass concrete with a pipe water cooling system. Appl. Therm. Eng. 2015, 78, 449–459. [Google Scholar] [CrossRef]
- Wang, F.; Zhou, Y.; Zhao, C.; Wang, F. Inverse analysis of concrete dam thermal parameters based on an improved particle swarm optimization method. J. Vib. Shock 2019, 38, 168–174. [Google Scholar]
- Wang, F.; Zhou, Y.; Zhao, C.; Zhou, H.; Chen, W.; Tan, Y.; Liang, Z.; Pan, Z.; Wang, F. Thermal parameter inversion for various materials of super high arch dams based on the hybrid particle swarm optimization method. J. Tsinghua Univ. 2021, 61, 747–755. [Google Scholar]
- Zhou, H.; Zhou, Y.; Zhao, C.; Wang, F.; Liang, Z. Feedback design of temperature control measures for concrete dams based on real-time temperature monitoring and construction process simulation. KSCE J. Civ. Eng. 2018, 22, 1584–1592. [Google Scholar] [CrossRef]
- Lian, J.; Wang, C.; Zhao, S. The convolute analysis of Lijiaxia arch dam material parameter based on BP neural network. J. Hydroelectr. Eng. 2004, 23, 44–48. [Google Scholar]
- Wang, J.; Wang, J.; Liu, Y.; Jin, F.; Wang, R.; Yang, J. Feedback analysis on temperature field of Ertan arch dam in operation period. J. Hydroelectr. Eng. 2008, 27, 65–70. [Google Scholar]
- Sheibani, F.; Ghaemian, M. Thermal Stress Analysis of Concrete Arch Dams Due to Environmental Action. In Proceedings of the ASME 2004 International Mechanical Engineering Congress and Exposition, Analheim, CA, USA, 13–20 November 2004; p. 375. [Google Scholar]
- Mirković, U.; Kuzmanović, V.; Todorović, G. Long-Term Thermal Stress Analysis and Optimization of Contraction Joint Distance of Concrete Gravity Dams. Appl. Sci. 2022, 12, 8163. [Google Scholar] [CrossRef]
- Zhang, G.; Zhou, Q. Study on temperature recovery after arch sealing of super high arch dams and its influence. J. Hydraul. Eng. 2015, 46, 1009–1018. [Google Scholar]
- Ding, J.; Zhang, S.; Chen, S. Simulation and feedback analysis of the temperature field based on composite element method. J. Hydroelectr. Eng. 2013, 32, 190–197. [Google Scholar]
- Liu, Y.; Gaoyang, Q.; Zhang, G.; Zhang, L.; Duan, S.; Zhang, J. Simulation and inversion analysis on working behavior of super-high arch dam of Jinping I Hydropower Station. Water Resour. Hydropower Eng. 2017, 48, 46–51. [Google Scholar]
- Qiang, S.; Xie, Z.; Zhong, R. A p-version embedded model for simulation of concrete temperature fields with cooling pipes. Water Sci. Eng. 2015, 8, 248–256. [Google Scholar] [CrossRef]
- Zhang, L.; Yi, L.; Li, B.; Zhang, G.; Zhang, S. Study on real-time simulation analysis and inverse analysis system for temperature and stress of concrete dam. Math. Probl. Eng. 2015, 2015, 306165. [Google Scholar] [CrossRef] [Green Version]
- Mata, J.; de Castro, A.T.; da Costa, J.S. Time-frequency analysis for concrete dam safety control: Correlation between the daily variation of structural response and air temperature. Eng. Struct. 2013, 48, 658–665. [Google Scholar] [CrossRef] [Green Version]
- Mata, J.; de Castro, A.T.; da Costa, J.S. Constructing statistical models for arch dam deformation. Struct. Control Health Monit. 2014, 21, 423–437. [Google Scholar] [CrossRef] [Green Version]
- Zhang, G.; Liu, Y.; Zheng, C.; Feng, F. Simulation of influence of multi-defects on long-term working performance of high arch dam. Sci. China Ser. E Technol. Sci. 2011, 54, 1–8. [Google Scholar] [CrossRef]
- Zhang, G.; Liu, Y.; Zhu, B.; Wang, R. Theory and method on simulation of actual working performance of high arch dams. J. Hydroelectr. Eng. 2012, 31, 167–174. [Google Scholar]
- Liu, Y.; Zhang, G.; Zhu, B.; Shang, F. Actual working performance assessment of super-high arch dams. J. Perform. Constr. Facil. 2016, 30, 04015011. [Google Scholar] [CrossRef]
- Zhang, G. Development and application of SAPTIS—A software of multi-field simulation and nonlinear analysis of complex structures (Part I). Water Resour. Hydropower Eng. 2013, 44, 31–35. [Google Scholar]
- Zhou, Q.; Zhang, G. Development and application of SAPTIS—Software of multi-field simulation and nonlinear analysis of complex structures (Part II). Water Resour. Hydropower Eng. 2013, 44, 39–43. [Google Scholar]
- Zhang, L.; Zhang, G. Development and application of SAPTIS—Software of multi-field simulation and nonlinear analysis of complex structures (Part III). Water Resour. Hydropower Eng. 2014, 45, 52–55. [Google Scholar]
- Liu, Y.; Zhang, G.; Yang, P. Development and application of SAPTIS—A software of multi-field simulation and nonlinear analysis of complex structures (Part IV). Water Resour. Hydropower Eng. 2014, 45, 33–39. [Google Scholar]
- Zhu, B. Thermal Stresses and Temperature Control of Mass Concrete; Butterworth-Heinemann: Oxford, UK, 2013. [Google Scholar]
Figure 1.
The heat transfer process in the arch dam.

Figure 2.
Schematic diagram of the location of temperature monitoring points. (a) Thermometers of No.16 dam section; (b) joint meters of No.15 dam section.
Figure 2.
Schematic diagram of the location of temperature monitoring points. (a) Thermometers of No.16 dam section; (b) joint meters of No.15 dam section.

Figure 3.
Temperature change process line of thermometer measuring points on the upstream surface of cantilever No. 16 dam section. (a) Measuring points above 500 m elevation; (b) Measuring points at 400~500 m elevation; (c) Measuring points below 400 m elevation.
Figure 3.
Temperature change process line of thermometer measuring points on the upstream surface of cantilever No. 16 dam section. (a) Measuring points above 500 m elevation; (b) Measuring points at 400~500 m elevation; (c) Measuring points below 400 m elevation.


Figure 4.
Temperature change process line of thermometer measuring points on the downstream surface of cantilever No. 16 dam section.
Figure 4.
Temperature change process line of thermometer measuring points on the downstream surface of cantilever No. 16 dam section.

Figure 5.
Temperature change process line of measuring points at transverse joints in No.15 dam section. (a) Measuring points below 571.7 m elevation; (b) Measuring points above 571.7 m elevation.
Figure 5.
Temperature change process line of measuring points at transverse joints in No.15 dam section. (a) Measuring points below 571.7 m elevation; (b) Measuring points above 571.7 m elevation.

Figure 6.
Overall finite element model of dam body-foundation.

Figure 7.
Finite element grid of dam body.

Figure 8.
Measured reservoir water temperature.

Figure 9.
The location of the joint meters inside the dam.

Figure 10.
The concrete temperature rise process line. (a) C40 concrete; (b) C35 concrete; (c) C30 concrete.
Figure 10.
The concrete temperature rise process line. (a) C40 concrete; (b) C35 concrete; (c) C30 concrete.


Figure 11.
Comparison between measured value and calculated value of temperature at dam surface. (a) T16-19; (b) T16-23; (c) T16-27; (d) T16-29; (e) T16-14; (f) T16-28.
Figure 11.
Comparison between measured value and calculated value of temperature at dam surface. (a) T16-19; (b) T16-23; (c) T16-27; (d) T16-29; (e) T16-14; (f) T16-28.

Figure 12.
Comparison between measured value and calculated value of temperature at measuring points inside the dam. (a) J15-11 (358 m, Area A); (b) J15-41 (523.7 m, Area A); (c) J15-20 (403 m, Area B); (d) J15-32 (463 m, Area B); (e) J9-29 (523.7 m, Area C); (f) J15-32 (580.7 m, Area C).
Figure 12.
Comparison between measured value and calculated value of temperature at measuring points inside the dam. (a) J15-11 (358 m, Area A); (b) J15-41 (523.7 m, Area A); (c) J15-20 (403 m, Area B); (d) J15-32 (463 m, Area B); (e) J9-29 (523.7 m, Area C); (f) J15-32 (580.7 m, Area C).

Figure 13.
Measured reservoir water temperature.

Figure 14.
Change process line of temperature inside arch dam. (a) Design condition; (b) Actual condition.
Figure 14.
Change process line of temperature inside arch dam. (a) Design condition; (b) Actual condition.

Figure 15.
Cloud map of quasi-stable temperature field distribution of the dam in January (unit: °C). (a) Upstream face; (b) Downstream surface.
Figure 15.
Cloud map of quasi-stable temperature field distribution of the dam in January (unit: °C). (a) Upstream face; (b) Downstream surface.

Figure 16.
Cloud map of quasi-stable temperature field distribution of the dam in April (unit: °C). (a) Upstream face; (b) Downstream surface.
Figure 16.
Cloud map of quasi-stable temperature field distribution of the dam in April (unit: °C). (a) Upstream face; (b) Downstream surface.

Figure 17.
Cloud map of quasi-stable temperature field distribution of the dam in August (Unit: °C). (a) Upstream face; (b) Downstream surface.
Figure 17.
Cloud map of quasi-stable temperature field distribution of the dam in August (Unit: °C). (a) Upstream face; (b) Downstream surface.

Figure 18.
Cloud map of quasi-stable temperature field distribution of the dam in November (unit: °C). (a) Upstream face; (b) Downstream surface.
Figure 18.
Cloud map of quasi-stable temperature field distribution of the dam in November (unit: °C). (a) Upstream face; (b) Downstream surface.

Figure 19.
Cloud map of quasi-stable temperature field distribution in cross-section of cantilever No. 16 dam section under design reservoir water temperature. (unit: °C). (a) January; (b) April; (c) August; (d) November.
Figure 19.
Cloud map of quasi-stable temperature field distribution in cross-section of cantilever No. 16 dam section under design reservoir water temperature. (unit: °C). (a) January; (b) April; (c) August; (d) November.

Figure 20.
Cloud map of quasi-stable temperature field distribution in cross-section of cantilever No. 16 dam section under measured reservoir water temperature. (unit: °C). (a) January; (b) April; (c) August; (d) November.
Figure 20.
Cloud map of quasi-stable temperature field distribution in cross-section of cantilever No. 16 dam section under measured reservoir water temperature. (unit: °C). (a) January; (b) April; (c) August; (d) November.


Table 1.
General characteristics of XLD concrete arch dam.
| XLD Arch Dam in China | |
|---|---|
| Dam type | concrete double-curvature arch dam |
| Dam height | 285.5 m |
| Crest elevation | 610.0 m |
| Normal water elevation | 600.0 m |
| Installed capacity | 13,860 MW |
| Total reservoir capacity | 124.7 × 10⁸ m3 |
| Crest thickness | 14 m |
| Dam bottom thickness | 60 m |
Table 2.
The elevation of the temperature monitoring points.
| Thermometers Near the Upstream Surface | Elevation of the Points(m) | Thermometers Near the Downstream Surface | Elevation of the Points(m) | Joint Meters | Elevation of the Points(m) |
|---|---|---|---|---|---|
| T16-1 | 358.0 | T16-4 | 373.7 | J15-11 | 358.0 |
| T16-3 | 373.7 | T16-8 | 403.7 | J15-20 | 403.7 |
| T16-5 | 388.7 | T16-14 | 442.7 | J15-26 | 430.7 |
| T16-7 | 403.7 | T16-18 | 475.0 | JG15-5 | 481.3 |
| T16-17 | 475.0 | T16-20 | 499.7 | JG15-14 | 517.7 |
| T16-19 | 499.7 | T16-22 | 523.7 | J15-47 | 544.7 |
| T16-21 | 523.7 | T16-24 | 535.7 | J15-53 | 571.7 |
| T16-23 | 535.7 | T16-28 | 556.7 | J15-55 | 580.7 |
| T16-25 | 544.7 | T16-30 | 571.7 | J15-56 | 577.7 |
| T16-27 | 556.7 | ||||
| T16-29 | 571.7 | ||||
| T16-31 | 580.7 |
Table 3.
Statistics of temperature recovery at measuring points of arch dam internal joint meters.
| Measuring Points | Temperature at the End of Second-Stage Cooling (°C) | Maximum Temperature Recovery (°C) | Temperature Recovery (°C) | Time at the End of Second-Stage Cooling | Time of Maximum Temperature Recovery |
|---|---|---|---|---|---|
| J15-11 | 11.4 | 19.8 | 8.4 | 2010/9/27 | 2021/4/1 |
| J15-20 | 12.4 | 19.5 | 7.1 | 2011/6/20 | 2021/5/2 |
| J15-26 | 12.3 | 19.6 | 7.3 | 2011/8/10 | 2021/5/2 |
| JG15-5 | 12.1 | 19.5 | 7.4 | 2012/4/4 | 2021/8/29 |
| JG15-14 | 10.9 | 20.1 | 9.2 | 2012/9/21 | 2021/8/29 |
| J15-47 | 12.1 | 20.9 | 8.8 | 2012/12/20 | 2020/6/16 |
| J15-53 | 11.9 | 20.3 | 8.4 | 2013/6/14 | 2021/2/1 |
| J15-55 | 13.1 | / | / | 2013/9/27 | / |
| J15-56 | 12.8 | / | / | 2013/10/15 | / |
Table 4.
Monthly average air temperature table.
| Month | Jan. | Feb. | Mar. | Apr. | May | Jun. | Jul. | Aug. | Sep. | Oct. | Nov. | Dec. | Year |
|---|---|---|---|---|---|---|---|---|---|---|---|---|---|
| Average temperature [°C] | 10.6 | 12.4 | 16.2 | 21.1 | 23.9 | 25.8 | 27.1 | 27.1 | 23.9 | 19.6 | 17.0 | 12.2 | 19.7 |
Table 5.
Thermal parameters of dam body and foundation.
| Material | Density (kg/m3) | Thermal Conductivity (W/(m·K)) | Specific Heat (kJ/(kg·K)) |
|---|---|---|---|
| Foundation | 2750 | 2.302 | 0.990 |
| Dam body concrete | 2400 | 1.621 | 0.985 |
Publisher’s Note: MDPI stays neutral with regard to jurisdictional claims in published maps and institutional affiliations. |
© 2022 by the authors. Licensee MDPI, Basel, Switzerland. This article is an open access article distributed under the terms and conditions of the Creative Commons Attribution (CC BY) license (https://creativecommons.org/licenses/by/4.0/).
Share and Cite
MDPI and ACS Style
Hou, C.; Chai, D.; Cheng, H.; Ning, S.; Yang, B.; Zhou, Y. Simulation Feedback of Temperature Field of Super-High Arch Dam during Operation and Its Difference with Design Temperature. Water 2022, 14, 4028. https://doi.org/10.3390/w14244028
AMA Style
Hou C, Chai D, Cheng H, Ning S, Yang B, Zhou Y. Simulation Feedback of Temperature Field of Super-High Arch Dam during Operation and Its Difference with Design Temperature. Water. 2022; 14(24):4028. https://doi.org/10.3390/w14244028
Chicago/Turabian StyleHou, Chunyao, Dong Chai, Heng Cheng, Shaoqing Ning, Bo Yang, and Yi Zhou. 2022. "Simulation Feedback of Temperature Field of Super-High Arch Dam during Operation and Its Difference with Design Temperature" Water 14, no. 24: 4028. https://doi.org/10.3390/w14244028
Note that from the first issue of 2016, this journal uses article numbers instead of page numbers. See further details here.