Article

Start-Up Evaluation of a Full-Scale Wastewater Treatment Plant Consisting of a UASB Reactor Followed by Activated Sludge

by
Jaime Díaz-Gómez
1,*,
Andrea Pérez-Vidal
2,
David Vargas-Nuncira
3,
Olga Usaquén-Perilla
4,
Ximena Jiménez-Daza
5 and
Claudia Rodríguez
6
1
Research Group of Water Resources Management, Department of Sanitary Engineering, Universidad de Boyacá, Tunja 15003, Colombia
2
Research Group of Microbiology, Industry and Environment, Faculty of Engineering, Universidad Santiago de Cali, Cali 760035, Colombia
3
Research Group Nucleo, Universidad de Boyacá, Tunja 15003, Colombia
4
Research Group of Environmental Management, Universidad de Boyacá, Tunja 15003, Colombia
5
Department of Sanitary Engineering, Universidad de Boyacá, Tunja 15003, Colombia
6
Veolia-Tunja ESP, Tunja 15003, Colombia
*
Author to whom correspondence should be addressed.
Water 2022, 14(24), 4034; https://doi.org/10.3390/w14244034
Submission received: 29 October 2022 / Revised: 5 December 2022 / Accepted: 7 December 2022 / Published: 10 December 2022
(This article belongs to the Special Issue Water Quality Engineering and Wastewater Treatment Ⅱ)

Abstract

:
UASB (upflow anaerobic sludge blanket) reactors have been recognized as a viable option for sewage treatment. However, in order to improve the UASB effluent quality, some type of post-treatment must be implemented. The aims of this study were (i) to establish a start-up methodology of a full-scale anaerobic–aerobic system treating sewage, (ii) to evaluate the concentrations of different constituents in the influent and effluent of the anaerobic and aerobic reactors as well as the removal efficiencies in every step of the system, and (iii) to define relevant operative aspects of the anaerobic and aerobic reactors. The Tunja (Colombia) wastewater treatment plant consists of three modules with preliminary treatment followed by UASB reactors with post-treatment of activated sludge. The results of this investigation showed that the effluent system meets the Colombian environmental legislation with average removal efficiency values of BOD (88 +/− 5%), COD (87 +/− 4%), and TSS (94 +/− 5%). The UASB reactor start-up was conducted without an inoculum, requiring a period of 120 days. The evaluation of the combined systems was conducted over 300 days. Moreover, a methodology to operate the system during and after the start-up of the anaerobic reactor was defined. It was demonstrated that the anaerobic effluent can deteriorate the sludge in the aerobic tank. In order to avoid this, important operational aspects must be considered during the operation of the system, such as the implementation of a raw wastewater bypass higher than 15% and monitoring of the anaerobic effluent settleable solid concentration (<0.3 mL/L).

1. Introduction

It is recognized that anaerobic systems are suitable for the treatment of high-strength wastewaters (COD < 4000 mg/L), and that aerobic systems are applicable for the treatment of low-strength wastewaters (COD < 1000 mg/L), bringing out an effluent quality generally higher than the anaerobic system [1]. Therefore, a combination of both systems (anaerobic + aerobic) is a viable option for sewage treatment. When compared with conventional aerobic technologies, based on activated sludge processes, this combination offers lower energy consumption and lower excess sludge production [2].
Activated sludge and upflow anaerobic sludge blanket (UASB) reactors are among the most used technologies for sewage treatment. The latter has been used mainly in Latin America and middle-income countries [3,4] such as Brazil, Colombia, and India [5,6,7].
According to [6], UASB reactors are compact and economical units with low operation costs and low excess sludge production. At present, UASB reactors are recognized as secondary treatment methods because they involve biological mechanisms, which are a common feature of other treatment processes at the secondary level, regardless of their treatment efficiency [7]. However, poorly designed and operated UASB systems can hinder the advantages of choosing these types of technologies, besides the fact that UASB reactors produce low-quality effluents [8] in terms of organic matter, nutrients, and the removal efficiency of pathogenic microorganisms, except for helminth eggs that are effectively trapped in the sludge blanket [9].
In general, UASB reactor effluents treating sewage have a biochemical oxygen demand (BOD) that exceeds 60 g/m3, total suspended solids (TSS) between 50 and 150 g/m3, and an increment in the ammonia nitrogen concentration [10]. Therefore, their use poses challenges related to effluent quality improvement in terms of organic matter, nitrogen, phosphorous, and pathogenic organism contents [11]. Consequently, it is necessary to implement some type of post-treatment to adapt the effluent quality to the standards required by most environmental legislations in order to reduce the impact on the receiving water resources [12].
To do so, the activated sludge technology has been implemented in anaerobic effluent post-treatment [13]. The main advantages of an aerobic system in improving the anaerobic effluent quality are the removal efficiency enhancement of the anaerobic reactor, the reduction in the energy requirements, and the reduction in excess sludge production, when compared to the conventional activated sludge technology [3].
According to [14], the combined UASB + activated sludge system (UASB-AS) produces less sludge and has lower energy consumption than the conventional activated sludge technology. At the same time, [15] showed that this system has a more stable effluent quality than other systems for the chemical oxygen demand (COD), biochemical oxygen demand (BOD), and total suspended solid (TSS) removal. Taking this into account, this combination is appropriate for the sewage treatment of particulates, soluble organic matter removal, and, in some cases, a satisfactory nitrification level.
A typical UASB reactor effluent treating sewage has the following characteristics: BOD = 70–100 mg/L (60–75% removal efficiency); COD = 180–270 mg/L (55–70% removal efficiency); TSS = 60–100 mg/L (65–80% removal efficiency); ammonia nitrogen > 15 mg/L (<50% removal efficiency). In contrast, the combined UASB-AS system improves the effluent quality, thereby producing treated water with the following average characteristics: DBO = 20–50 mg/L (83–93% removal efficiency); DQO = 60–150 mg/L (75–88% removal efficiency); SST = 20–40 mg/L (87–93% removal efficiency); ammonia nitrogen = 5–15 mg/L (50–85% removal efficiency) [16].
The UASB-AS system is a viable technological option for sewage treatment in warm-climate countries [17]. In terms of operation, previous pilot-scale studies ([14,18]) showed that AS systems treating UASB effluents achieved 43–76% COD removal at an HRT between 3 and 6 h. Under an average temperature of 20 °C, the combined anaerobic–aerobic system performance was lower; however, it was demonstrated that it can meet the secondary effluent quality standards at an HRT of at least 5 h [19].
Additionally, [20] worked with a UASB reactor following sequencing batch reactors (SBR) fed with synthetic wastewater. The average removal efficiencies were 95% for COD and 85% for TKN. Moreover, an experimental study conducted by [21], under three different operating conditions, evaluated a combined UASB-SBR system. The retention time in the UASB was changed from 4 h to 3 h, and the aeration time in the SBR cycle varied from 2 to 5 h, and then to 9 h. The average removal efficiency for the three runs for COD, BOD, and TSS was 94%, 97%, and 98%, respectively.
Most research conducted using UASB-AS technology treating sewage has been limited to the pilot scale, with only a few at the full scale ([10,22,23]). The authors of [23] presented the results of the evaluation of one-year operational data from a full-scale UASB-AS system treating sewage for a population of 100,000 inhabitants in Piracicamirim (Brazil). Additionally, in one study carried out in two full-scale UASB-AS systems in India by [24], the average removal efficiencies of the systems were as follows: COD, 86 and 83%; BOD, 94%; and TSS, 61 and 64%.
The recommendations and procedures for the start-up and operation of UASB reactors treating sewage have been well-documented previously [25]. However, there is scarce information about the steps and methods that can improve the start-up of full-scale systems that include UASB reactors followed by aerobic treatment for sewage treatment. The authors of [14] evaluated the operation of a pilot UASB-AS system, recommending a global hydraulic retention time of 7.9 h distributed as follows: 4.0 h UASB; 2.8 h aerobic reactor; and 1.1 h final clarifier. The authors of [26] presented an operational strategy for a combined pilot-scale UASB-AS system treating an influent with the typical sewage composition from the city of Belo Horizonte (Brazil). The selected control variables were the solid concentration in the effluent and the sludge wastage rate. The best control strategy was based on two cascaded PI controllers for the solid concentration in the effluent and a look-up table for the excess sludge rate.
In particular, regarding the combination of UASB and AS, even though it is considered a viable post-treatment option [6,11] offering high removal efficiencies for BOD, COD, and TS [27], there are few studies evaluating full-scale systems [28]. Moreover, these studies are oriented to the evaluation of the systems but not the start-up methodology. Therefore, this investigation aimed to define a start-up methodology for full-scale UASB-AS systems treating sewage, including guidelines to improve the performance and relevant operative aspects. The novelty of this research is focused on the identification of the relevant operative aspects that affect the start-up and operation of the combined system. This is particularly important due to the influence of the anaerobic effluent on the aerobic system.
This research was conducted in a real-scale sewage treatment plant (STP) in Tunja (Colombia). The treatment system is a combined anaerobic (UASB)-activated sludge system. The results of this study will allow for establishing a start-up methodology that can be adopted worldwide for similar wastewater treatment systems, with the proposed combination being a valuable contribution because it has been recognized as a viable option for sewage treatment.

2. Materials and Methods

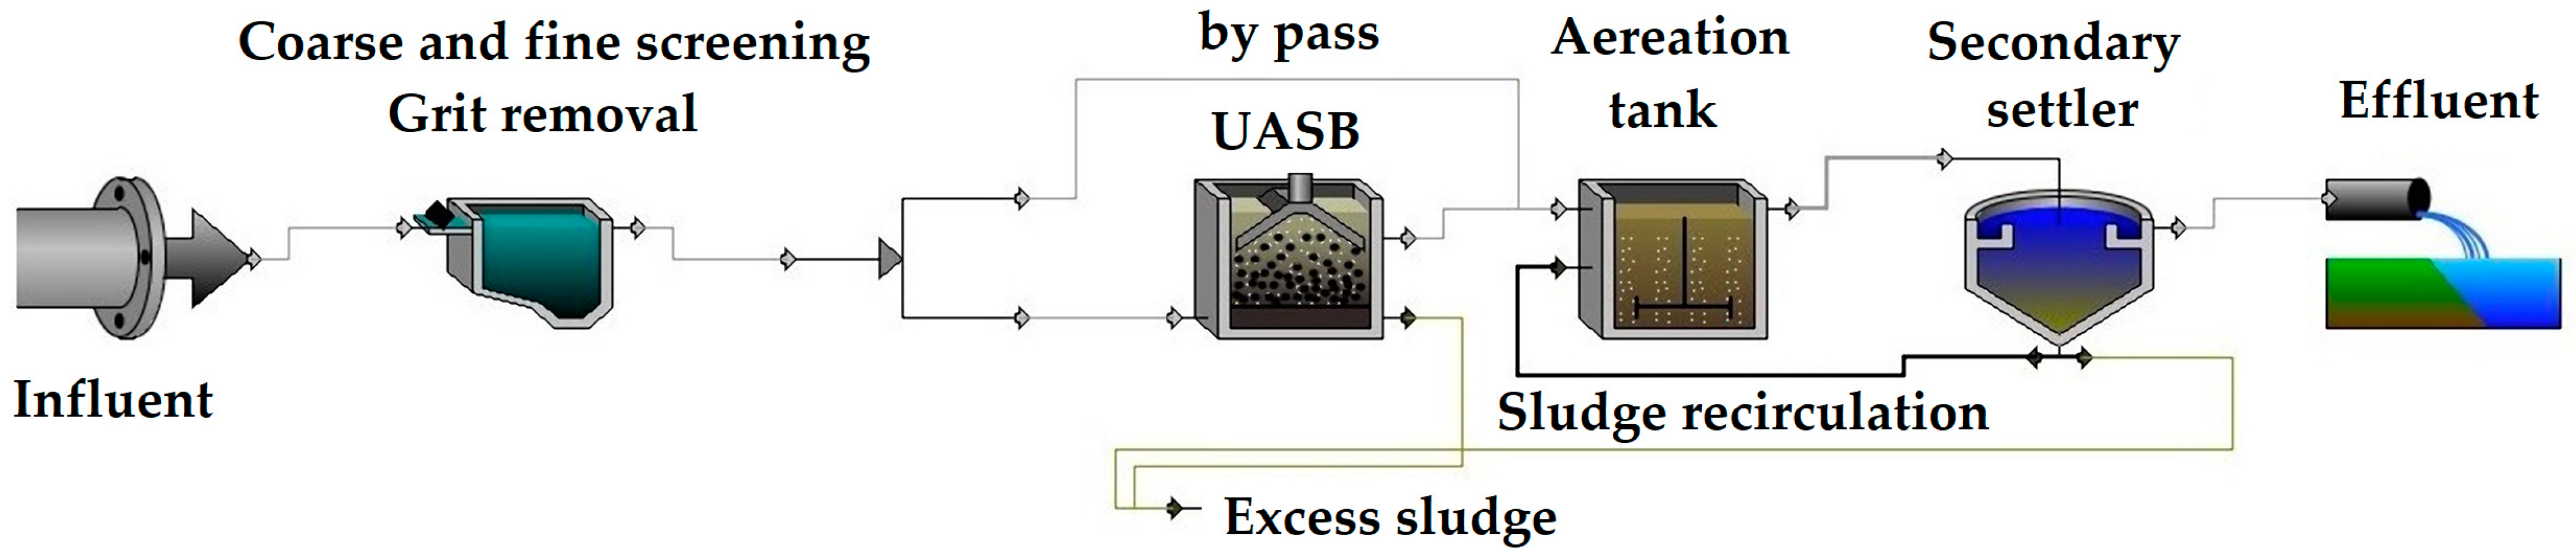
2.1. Description of the Study Area

Tunja is the capital of the county of Boyaca in Colombia. It is located in the eastern chain of the Andes. The average annual temperature in Tunja is 16 °C. The sewage treatment plant (STP) is located at an altitude of 2750 m above sea level. The raw wastewater is transported to the STP by a gravity-combined sewer. The treatment processes at the Tunja STP have three modules operating in parallel. Each module consists of a train operating in parallel that includes coarse and fine screening, grit removal, a UASB reactor, an activated sludge aerobic aeration tank, and secondary sedimentation. Actually, it is the largest Colombian wastewater plant using this type of treatment sequence. The designed STP flow is 120 L/s per module. The produced anaerobic and aerobic excess sludge is taken, after it is thickened and dewatered, to the final disposal. Figure 1 (produced with a Capdeworks 4.0 academic license) shows the flowsheet of a module of the Tunja STP.
This research was conducted in one of the modules of the STP. Each UASB reactor had a working volume of 2895 m3 (area: 579 m2). The tank water depth was 5.0 m. Each aeration tank had a volume of 2469 m3 (area: 588 m2). The total liquid depth was 4.2 m. The effluent of the aeration tank was received by two circular secondary settlers (diameter: 23.5 m) with a liquid depth of 4.5 m. Table 1 shows the main design parameters of the STP units.
The influent flow was measured continuously with a Pulsar flowmeter (FlowCert Model) that uses an Ultra Data Logger unit. The maximum average flow during this evaluation was 90 L/s. The average temperature of the raw wastewater was 19 +/− 0.7 °C. The dissolved oxygen in the aeration tanks was measured online with a HACH sc200 universal controller equipped with a HACH 9020000 probe. The aeration tank was operated with intermittent aeration (on: 45 min; off: 15 min), maintaining the dissolved oxygen concentration between 1.5 mg/L and 2.5 mg/L. However, the aeration time was changed when the dissolved oxygen concentrations were lower than the minimum value.

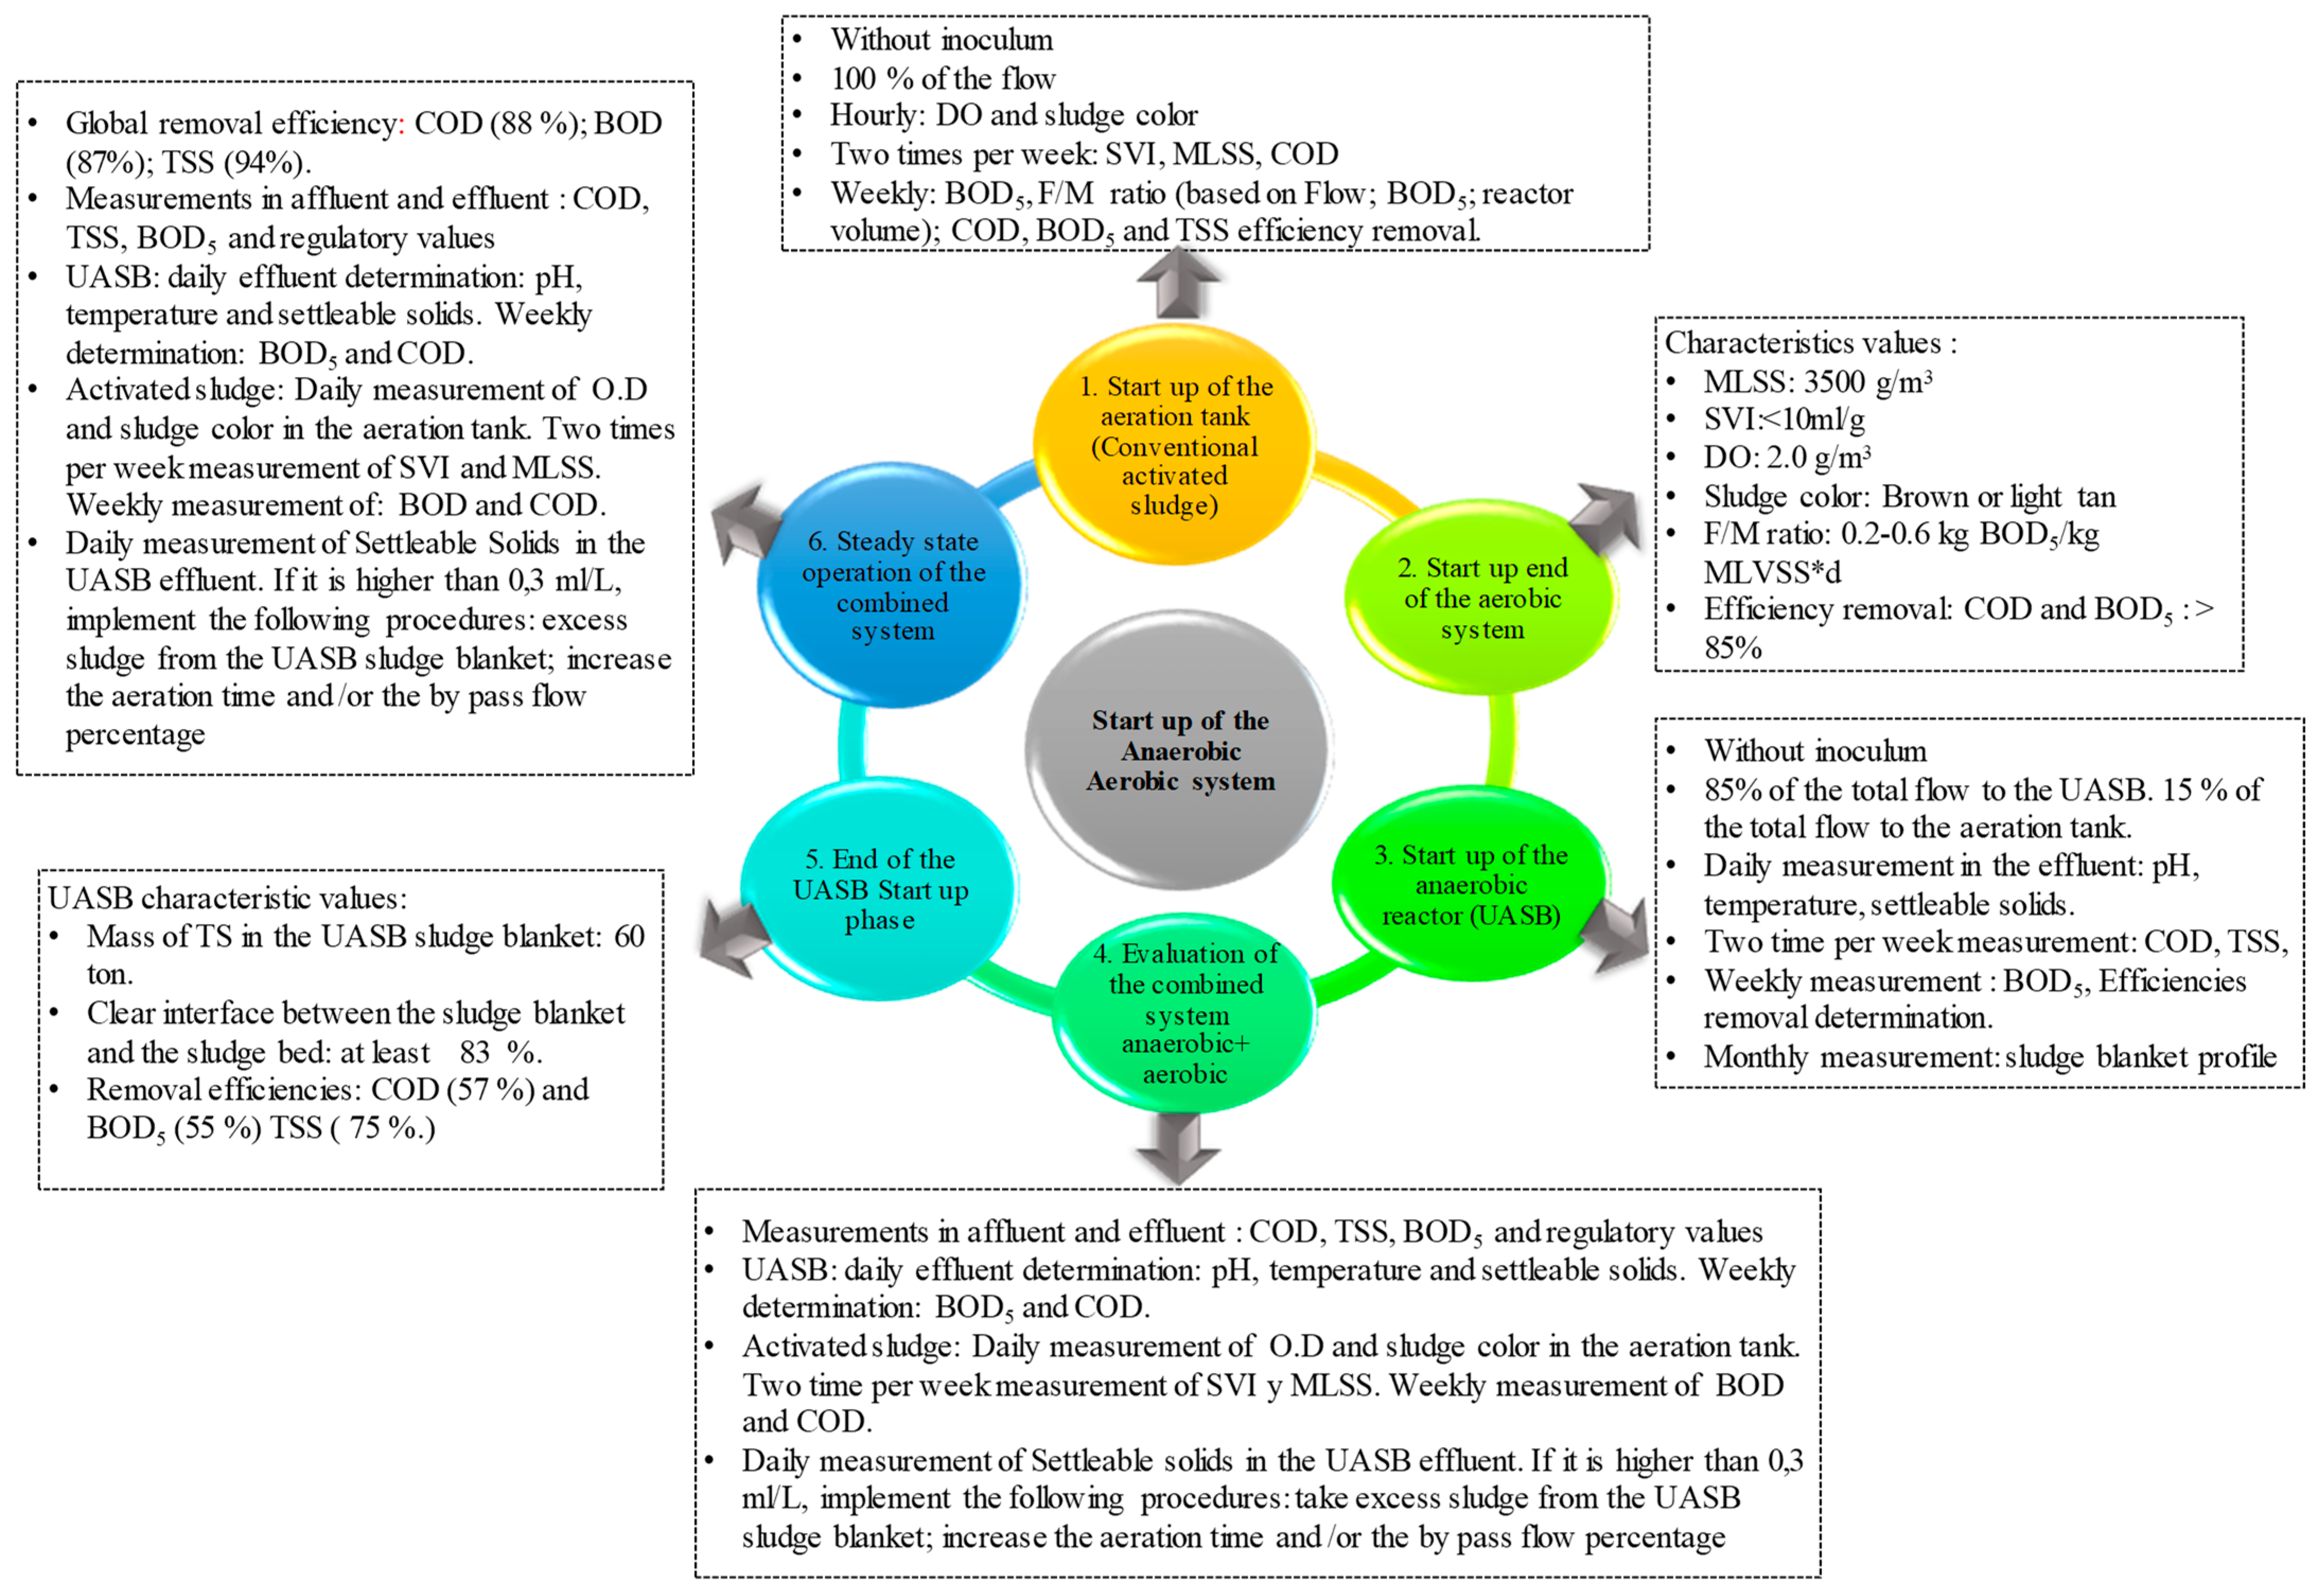
2.2. The Start-Up of the Anaerobic–Aerobic System

The water quality parameters measured in the liquid phase (raw wastewater; UASB effluent; final effluent) were temperature, pH, biochemical oxygen demand (BOD), and chemical oxygen demand (COD) as well as total suspended solids (TSS), settleable solids, organic nitrogen, and ammonia nitrogen. Flows of proportional composite samples were collected at the points presented above. The procedures for collecting and preserving as well as the analytical methods that were implemented were based on the recommendations of [29].

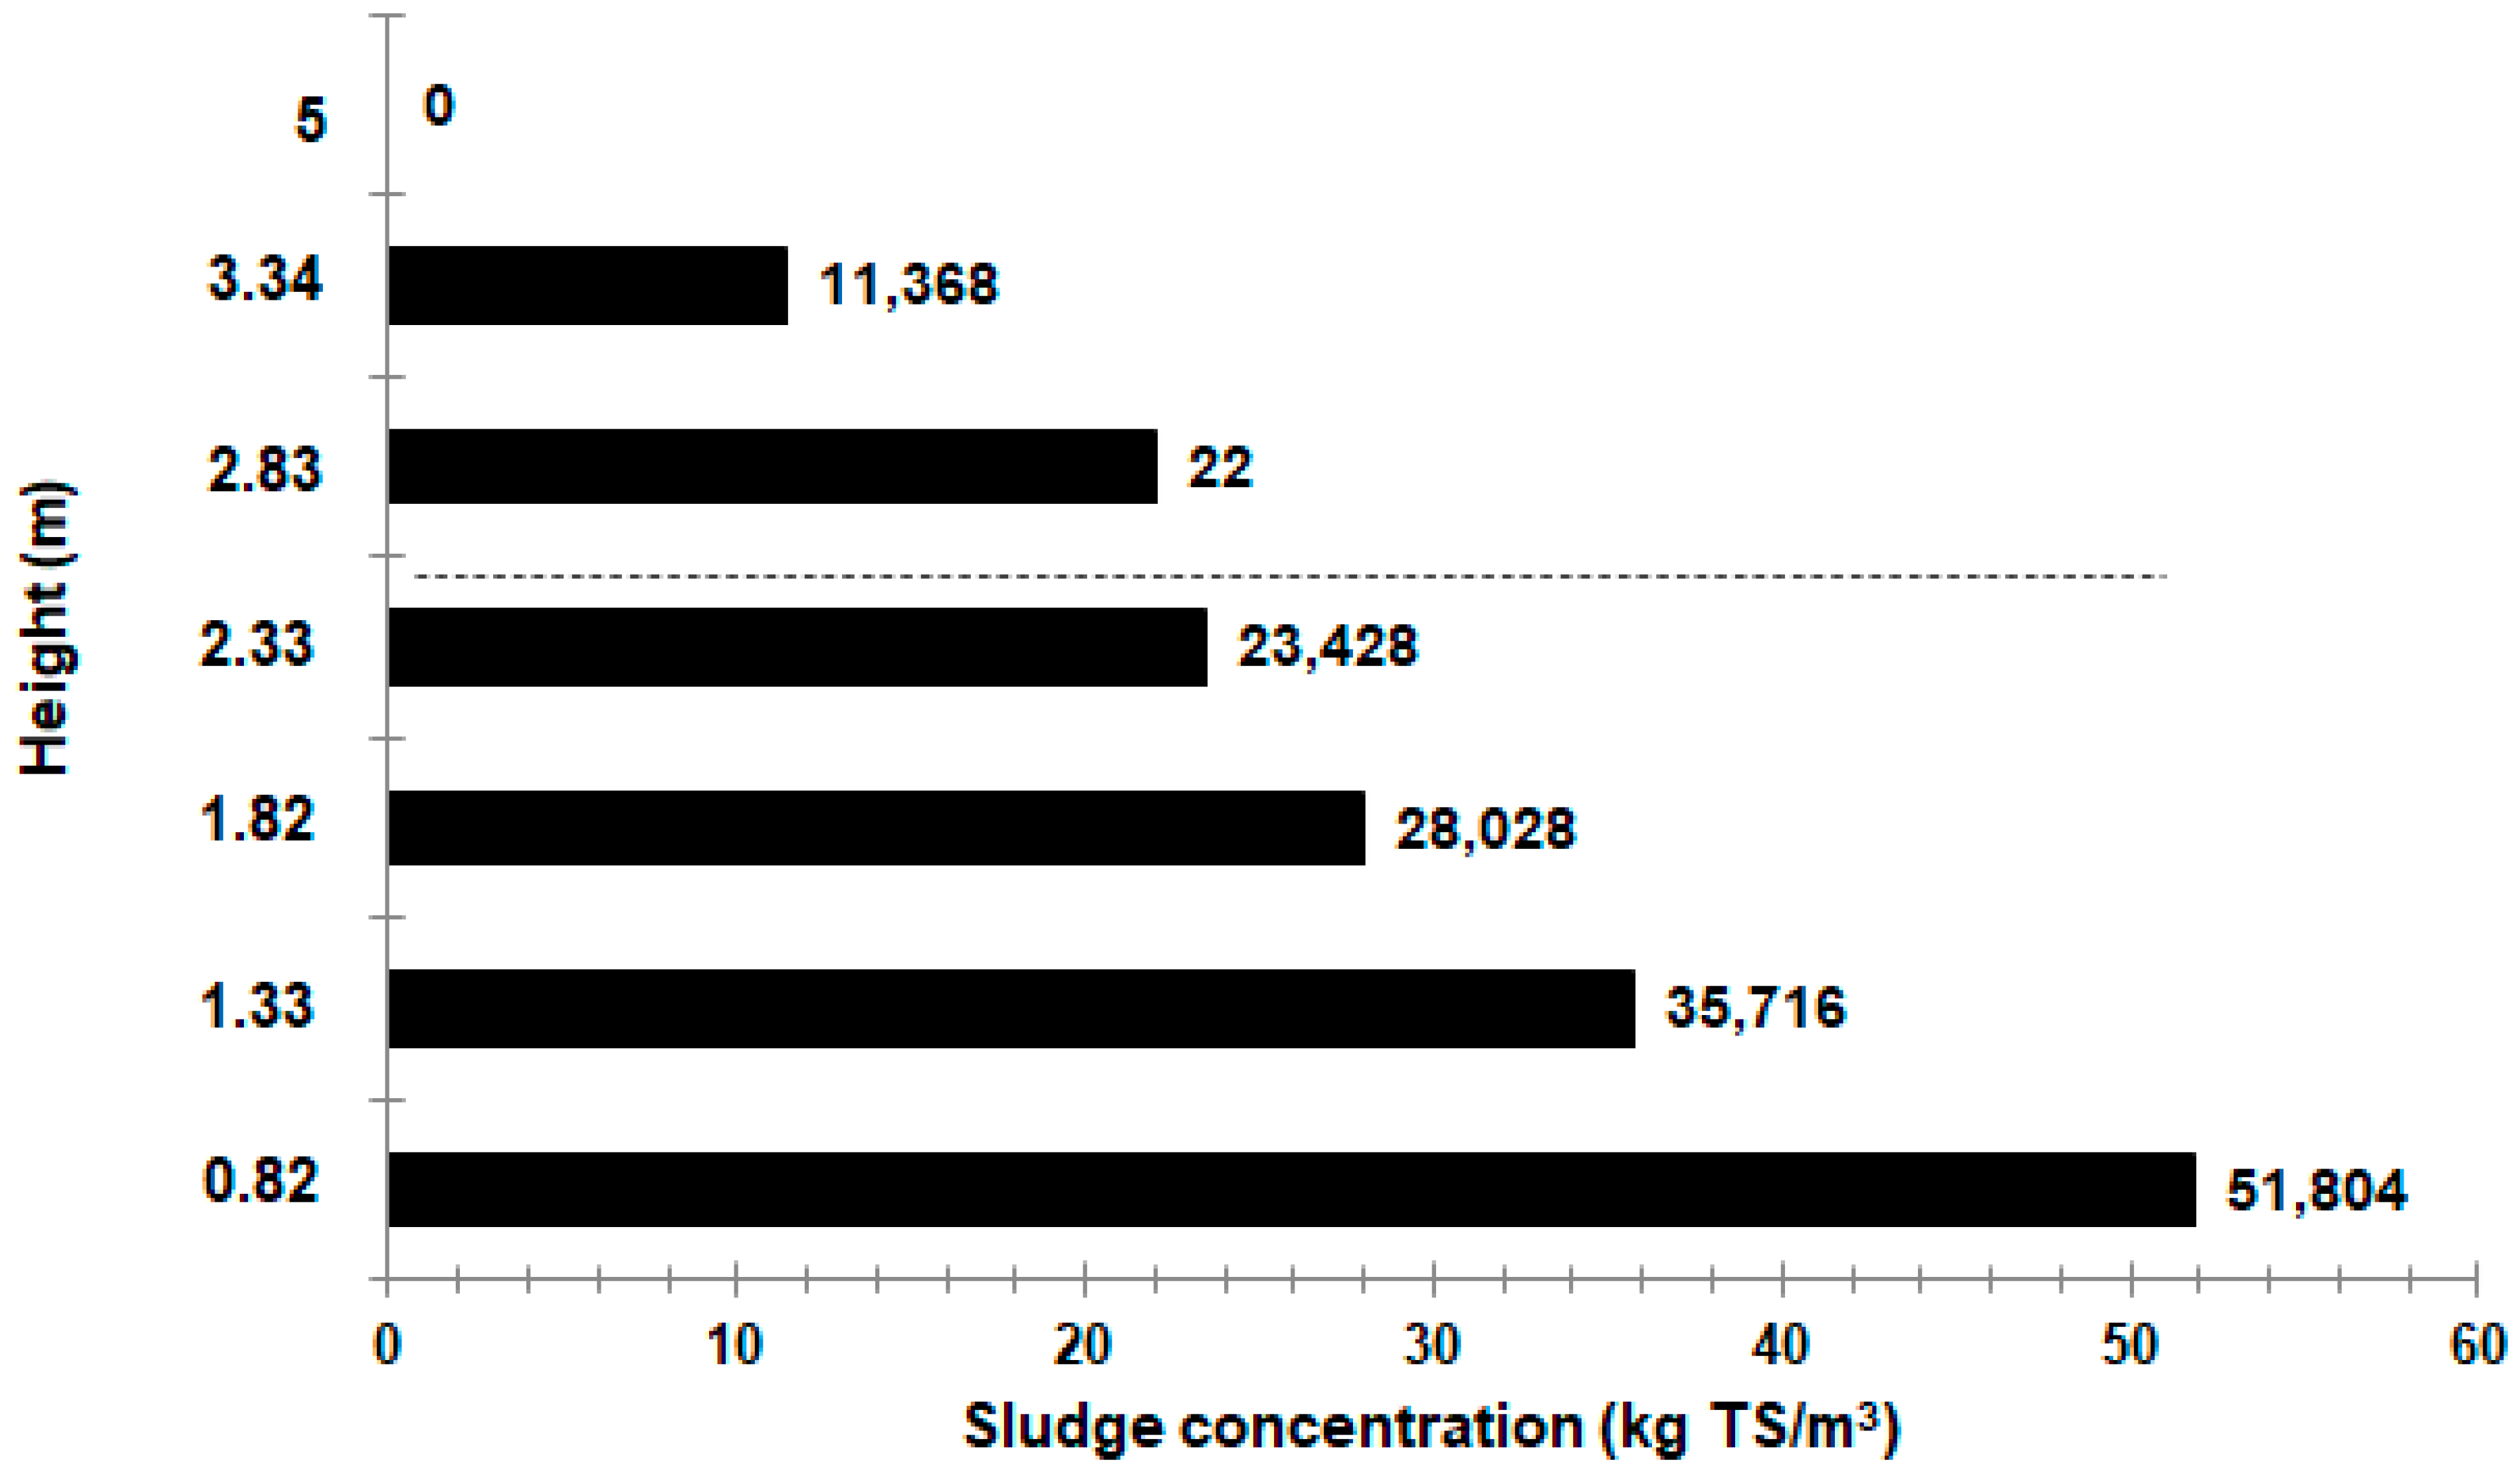
2.2.1. UASB Start-Up

The start-up of the combined system was conducted starting with the aerobic reactor, a process that took twenty days. Subsequently, the UASB reactor required a period of 120 days to finish the start-up despite the psychrophilic operation condition. The combined system evaluation was conducted over 300 days. The procedure is described in the following sections.
In this project, the start-up of the UASB reactor was followed, after taking into consideration the impacts of the anaerobic effluent on the operation of the aeration tank. In UASB reactors treating sewage, certain studies found that the start-up process can be conducted without the addition of seed sludge [5,30]. Taking this into consideration, the UASB start-up was carried out without an inoculum.
The UASB start-up was evaluated by considering: (1) the growth of the sludge mass while monitoring the sludge bed and measuring the sludge total solids (TS) and (2) the change in the removal efficiency of organic matter (COD and BOD5 removal), TSS, and settleable solids in the UASB effluent. Table 2 shows the parameters and operation variables that were measured with their frequencies in the raw wastewater and the UASB effluent. The procedures for collecting the samples and the analytical methods were carried out following the recommendations of [29]. Biogas production was not quantified as the evacuation systems were being installed during the evaluation period.
The statistical analysis tool used in this work was Minitab® 21 software from Minitab Inc. The normal probability distribution using the Kolmogorov–Smirnov test for the TSS, BOD5, and COD concentrations in the raw sewage, UASB effluent, and effluent did not reject the null hypothesis at p > 0.05.
The sludge bed profile was measured weekly at 6 sampling points located at different depths of the UASB digestion compartment (0.82; 1.33; 1.82; 2.33; 2.83; 3.34 m). The specific methanogenic activity (SMA) of the anaerobic sludge was measured weekly, by taking samples from the middle of the digestion compartment. The assay was implemented with agitation (120 rpm) using an IKA KS4000 incubator shaker at 20 °C. Both parameters were determined using the methods described by [31,32,33].

2.2.2. Activated Sludge Start-Up

The start-up of the aeration tank was conducted previously with a flow of 6653 m3/d. It took around 21 days, reaching a BOD removal of around 80% and the established criteria in the aeration tank for MLSS of 3500 mg/L [34] and SVI of 80 mL/g [35]. The evaluation of the combined system was then started.
During the first 22 days, the UASB influent flow was 6653 m3/d (85% of the total flow). In this flow, deterioration of the sludge in the aeration tank was observed. For this reason, the strategy for the UASB start-up was to reduce the UASB influent flow to 5443 m3/s, and to monitor the UASB sludge blanket growth, the UASB effluent settleable solids, and the MLSS in the aeration tank. This operation mode allowed the adaptation of the aerobic reactor to the anaerobic influent in terms of the SVI and a dissolved oxygen concentration between 1.5 and 2.0 mg/L [31].
It is expected that a low organic removal efficiency at the beginning of the operation of the UASB reactor is the best option in order to avoid a low F/M ratio in the aerobic reactor. In the steady-state condition, 85% of the raw wastewater flow goes to the UASB reactor (following the recommendation of [22]), and 15% is transported by the bypass to the aeration tank. Table 3 shows the flow treated during the evaluation.
The maximum flow treated during the steady-state condition was 7776 m3/d, where 6653 m3/d was treated in the UASB and 1123 m3/d was transported via the bypass to the aeration tank. In this operation condition, the aeration was implemented in a sequence of 45 min on and 15 min off. The sludge recycling had a flow of 3024 m3/d for 1 h every 2 h.
Table 4 shows the parameters, methods, and the frequency measured in the aeration tank. The SVI was evaluated following the procedure suggested by [36]. The F/M and VOL were calculated using the BOD mass balance between the UASB effluent and the bypass.

2.3. Final Water Quality Verification

The water quality of the influent and effluent was evaluated at the end of the evaluation period with a 24 h composite sampling. This was carried out to evaluate the STP efficiency, taking into consideration the Colombian regulatory limits. The following parameters, with their analytical methods, were measured:
Acidity (SM 2310 B); total alkalinity (SM 2320 B); COD (SM 5220 D); BOD5 (SM 5210 B); TSS (SM 2540 D); settleable solids (SM 2540 F); ammonia nitrogen (SM 4500); Kjeldahl nitrogen (SM 4500); Norg (SM 4500 NH3); nitrate (SM 4500); nitrite (Rodier, 2011); absorbable organic halides (AOX; ISO 9562:2004); aluminum (SM 3030 E, SM 3111 D); BETEX (ASTM D6520); cyanide (SM 4500 CN); total cadmium (SM 3030 E, SM 3111 B); total copper (SM 3030 E, SM 3111 B); real color 436, 525, 620 nm (ISO 7887:2011, Method B); volatile phenolic compounds (EPA 8041); chlorides (SM 4500-Cl_B); calcic hardness (SM 3500-Ca B); total hardness (SM 2340 C); total chromium (SM 3030 E, SM 3111 B); phenol (SM 5530 B); total phosphorous (SM 4500-P B E); orthophosphates (SM4500-P E); hydrocarbons; aromatic hydrocarbons (EPA 3510, EPA 3630, EPA 8100); total iron (SM 3030 E, SM 3111 B); total silver (SM 3030 E, SM 3111 B); lead (SM 3111 B); anionic surfactants (SM 5540 C); sulfate (SM 4500 E SO4); sulfur (SM 4500 S-2 F); zinc (SM 3030 E, SM 3111 B).

3. Results and Discussion

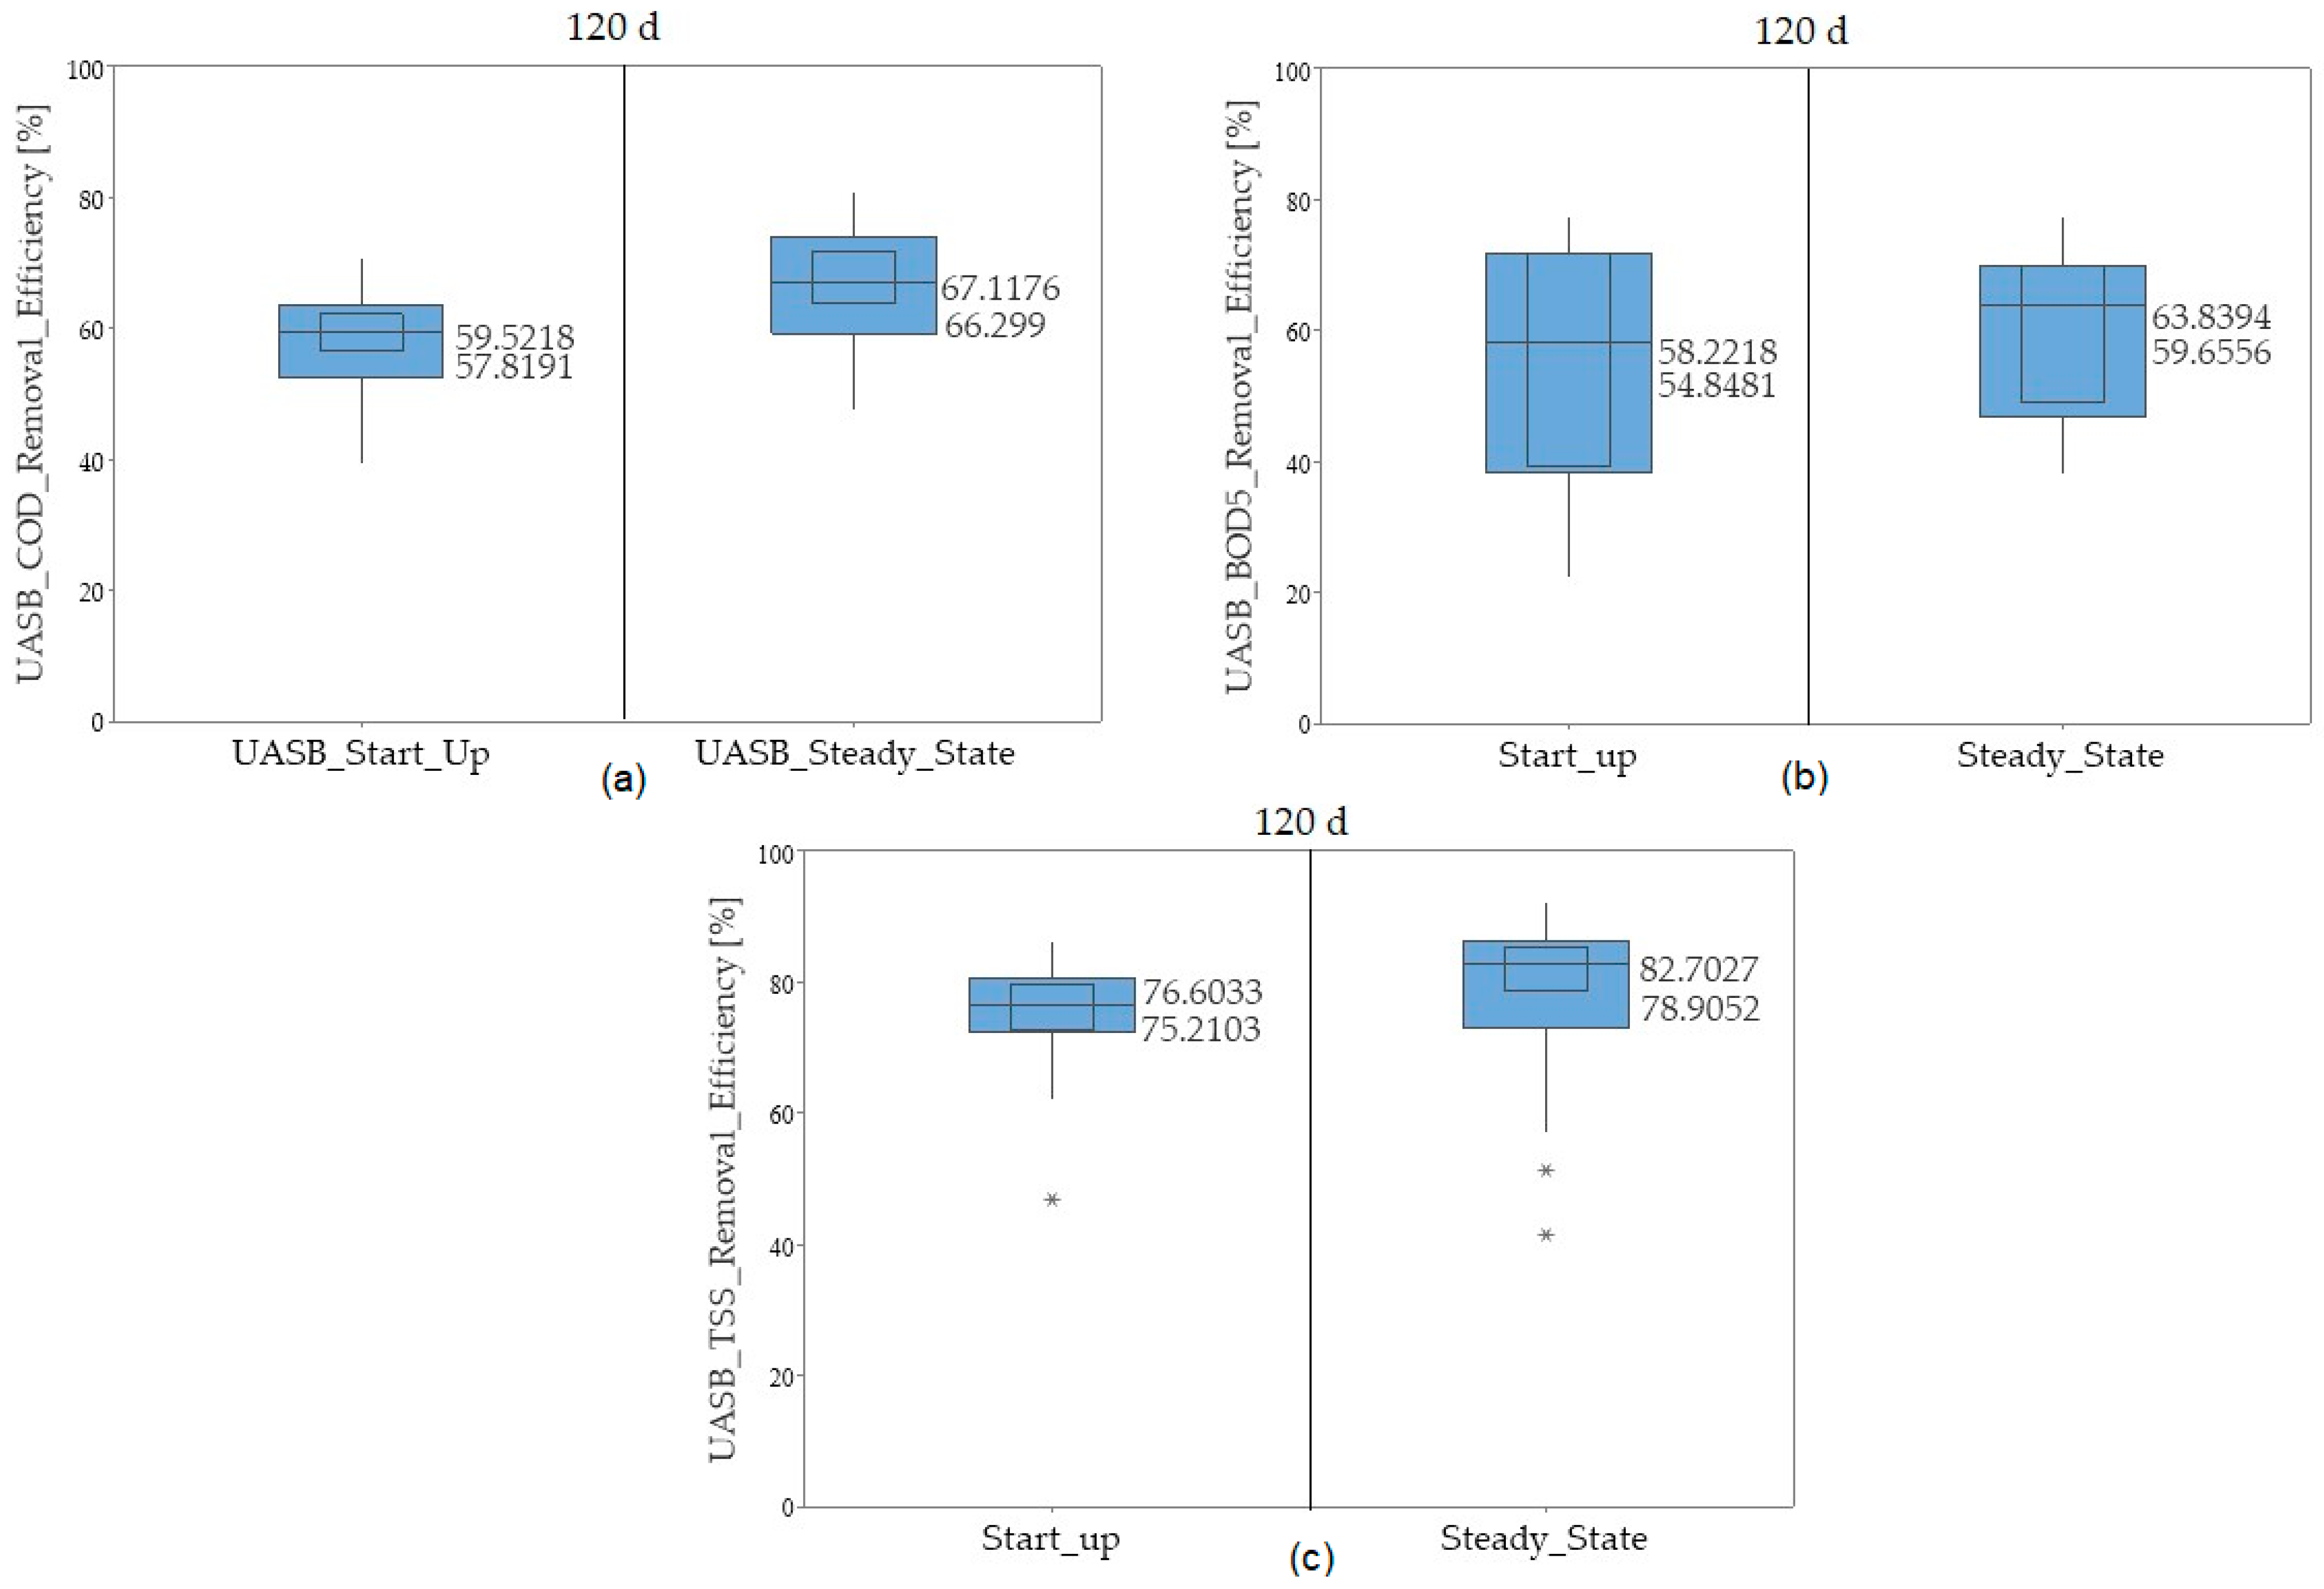
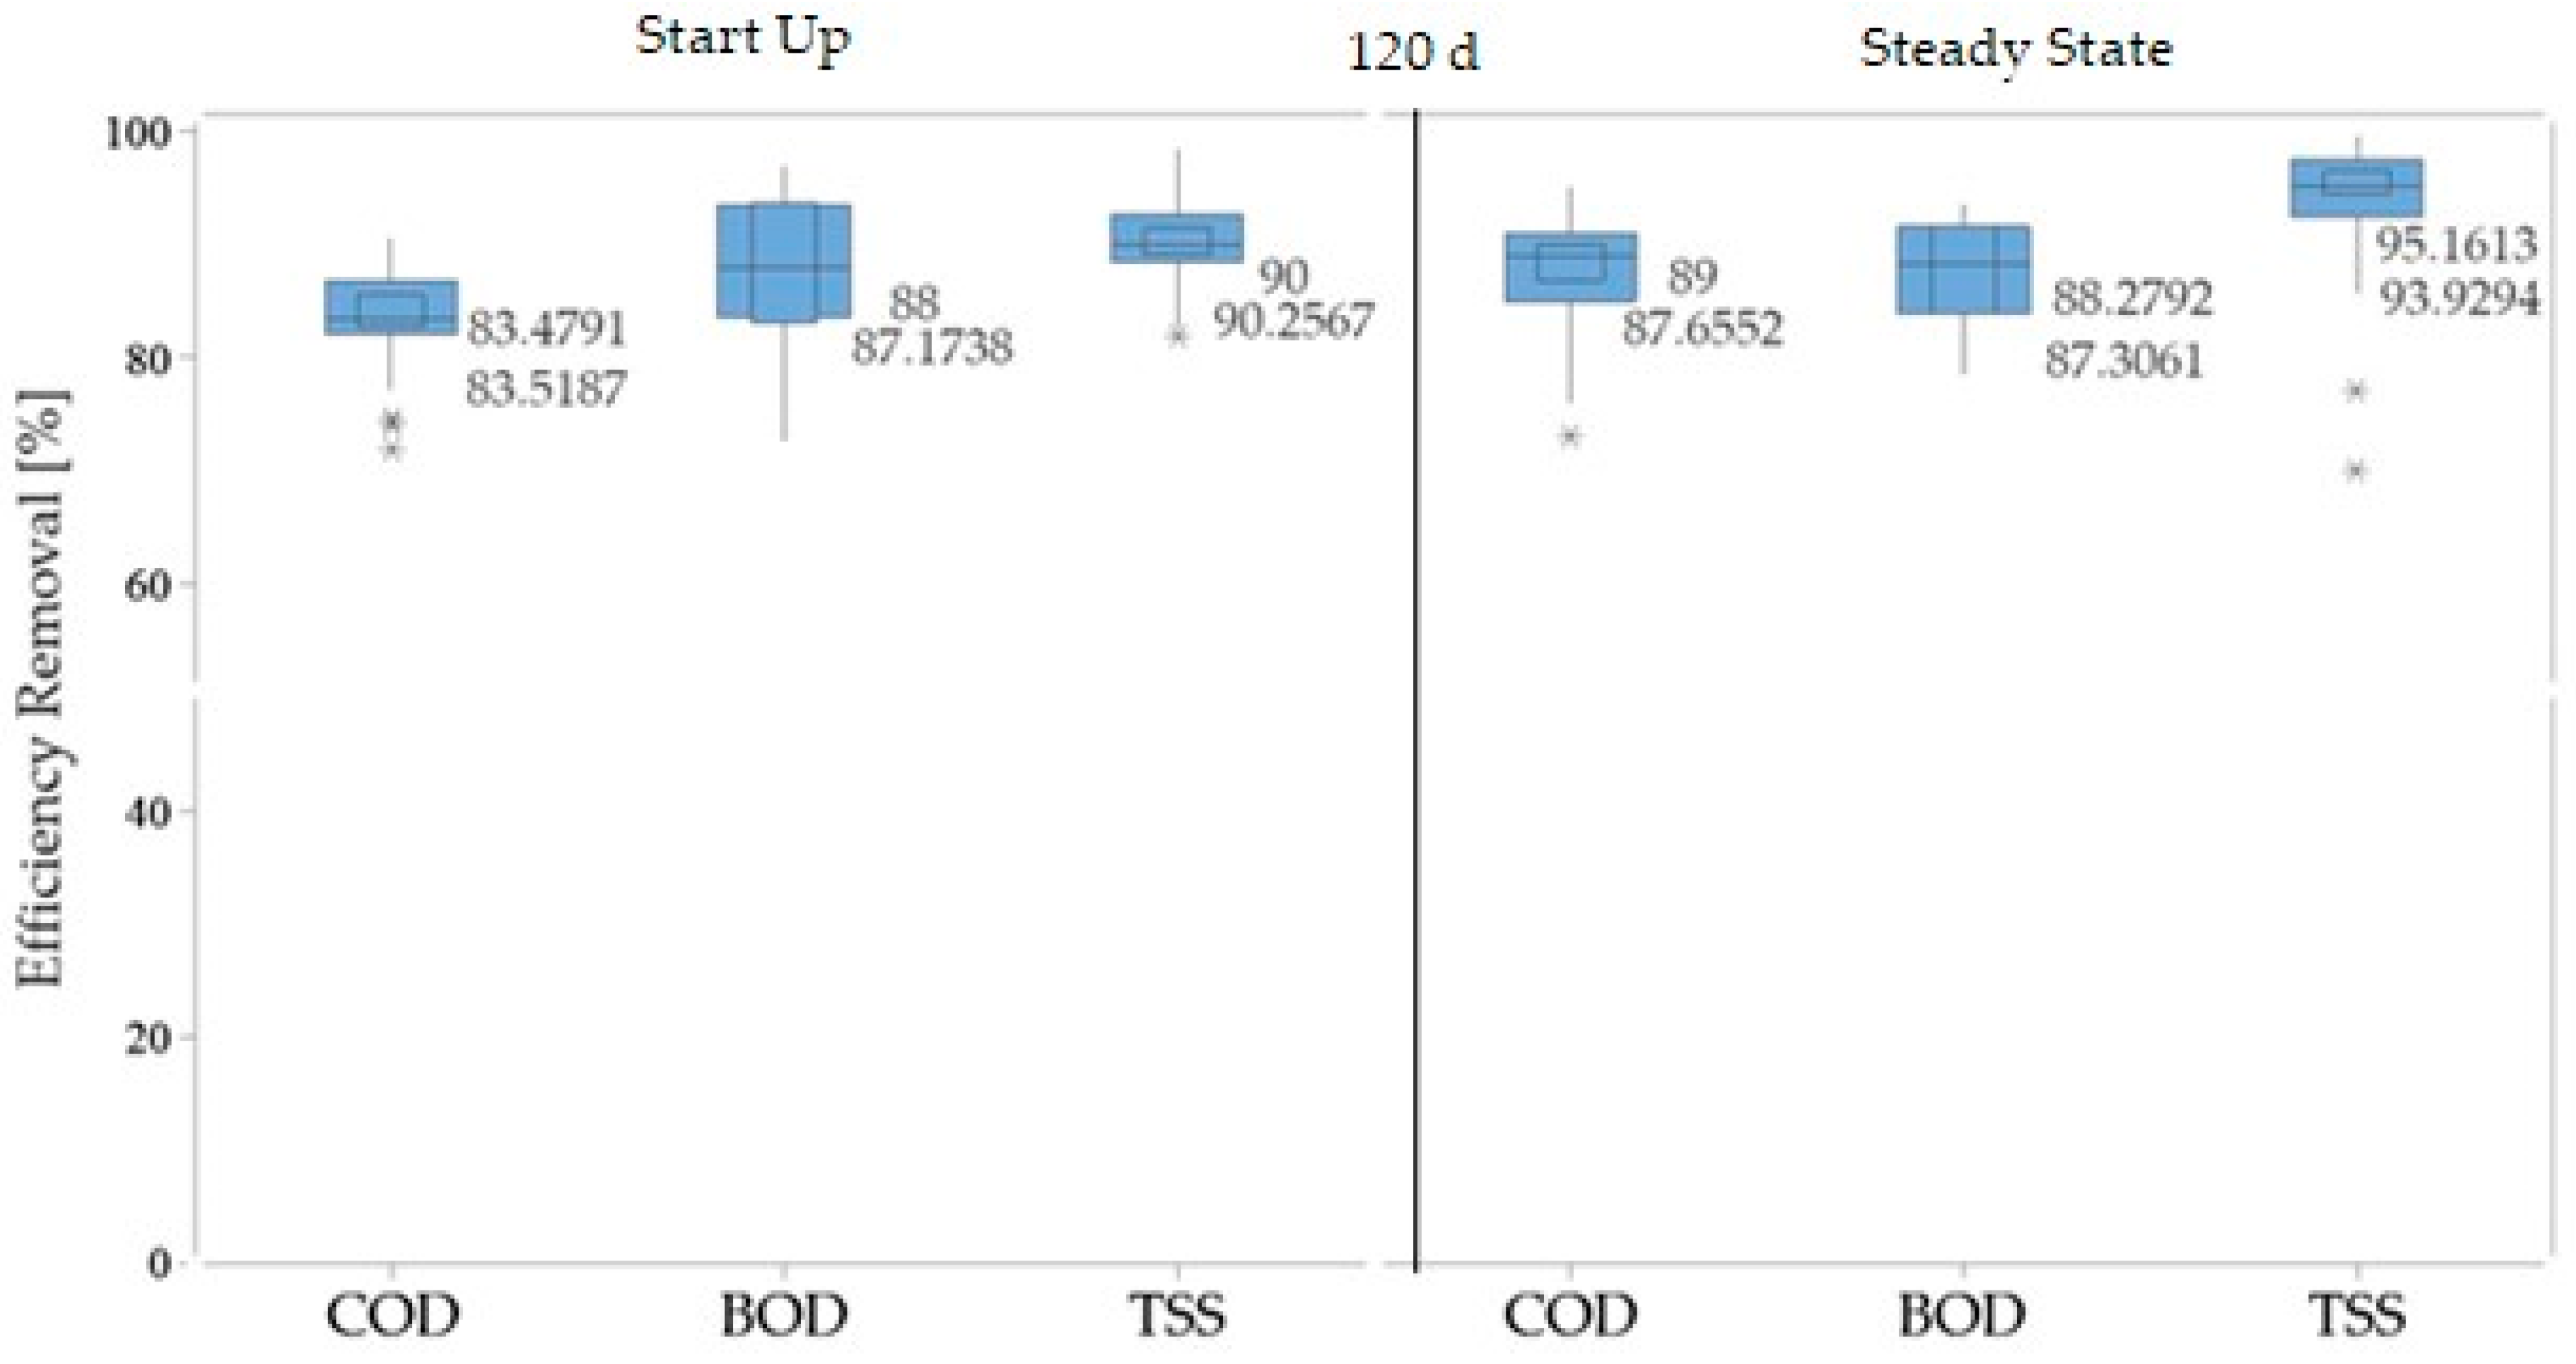
3.1. Start-Up of the Anaerobic–Aerobic System

The start-up of the STP was initiated with the aerobic system without an inoculum. This procedure took 21 days and showed fast aerobic biomass growth. The authors of [37] mentioned that the typical duration for the start-up time of activated sludge systems without an inoculum is 30 days.
In the steady-state condition, the aerobic reactor operated with typical conventional activated sludge ranges [34]: F/M (0.2–0.6 kg BOD5/kg MLVSS ∗ d); VOL (0.3–1.6 kg BOD5/m3 ∗ d); sludge age (3–15 d). The excess sludge production was 1.7 TS ton/d, and the sludge age was 7.0 +/− 0.5 days. The average fraction of MLSS/MLVSS was 0.8. Moreover, the SVI was in the range between average and good [30]: 50–100 mL/g (good); 100–20 mL/g (average).
After the aeration tank start-up, the UASB start-up was initiated, taking 85% of the total raw wastewater flow as the UASB influent and the rest as a bypass to the aeration tank. This period of the combined anaerobic–aerobic system took 121 days. The final period was between 122 and 300 days and corresponded to the system operation in a steady state. Deterioration of the sludge quality was observed in the first 30 days of the start-up and was attributed to the impact of the anaerobic effluent on the aeration tank sludge.
Figure 2 shows details of the F/M, VOL, SVI, and sludge color variation in the aeration tank during the start-up and steady-state phases. The sludge color is a good indicator of the process stability; this qualitative evaluation parameter is very useful as a fast method for making decisions during the aeration tank operation [38,39]. The STP operators were instructed to tune the operation parameters according to their visual observation as described below:
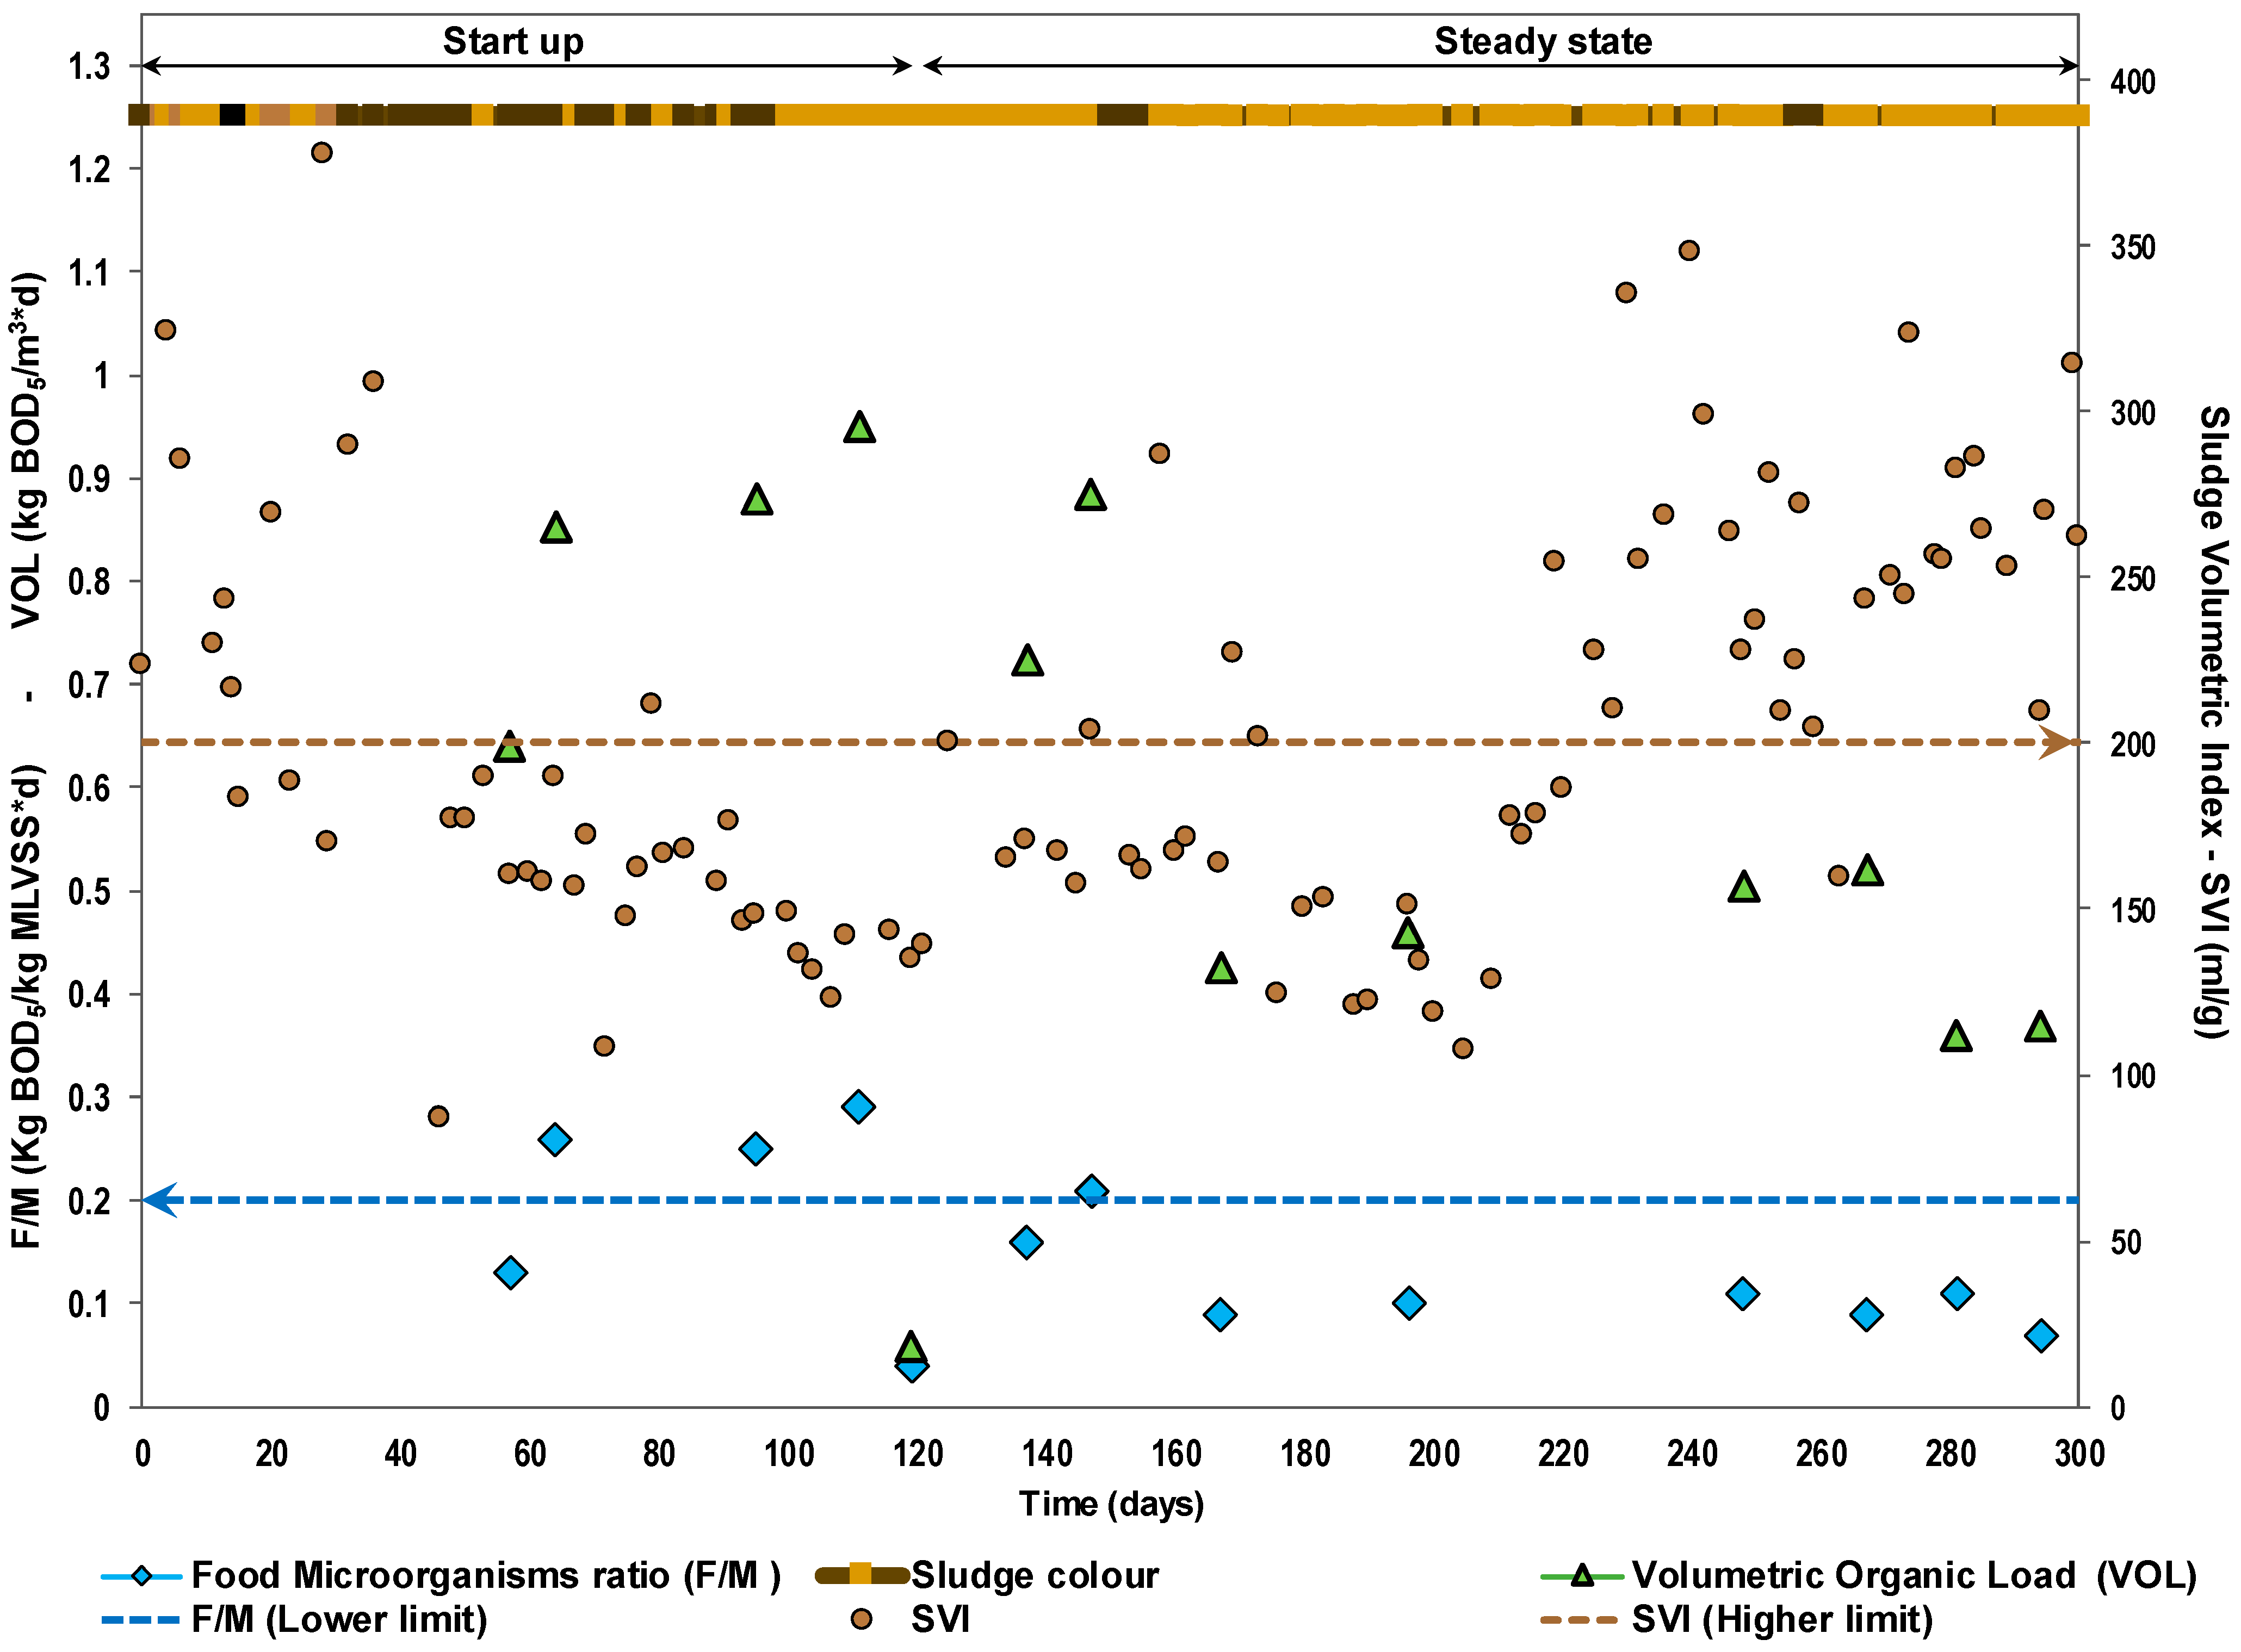
  • Brown: earthy odor indicates normal operation; no adjustment required.
  • Light tan: odor indicates extremely young sludge; decreased sludge wasting.
  • Dark brown: earthy odor indicates old sludge with high solid concentration; increased sludge wasting.
  • Black: rotten-egg odor indicates septic conditions with a low dissolved oxygen concentration; increased aeration.
During the start-up phase in the aeration tank, the predominant sludge colors were black and dark brown, indicating unstable operational conditions. This was related to the influence of the anaerobic effluent on the aeration tank sludge. This deficiency was managed by controlling the UASB effluent settleable solid concentration by increasing the bypass or by increasing the aeration time.
After the start-up ended (100–120 days), the sludge color improved (light tan), evidencing the stability of the process in concordance with the reference literature values for F/M (0.2–0.6 kg BOD5/MLVSS ∗ d) and SVI (100–200 mL/g) for conventional activated sludge systems [34].
During the steady-state phase (120–300 days), the predominant sludge color was light tan, an indication of young sludge in the stable activated sludge process. Between days 263 and 289, a color change (light tan to dark brown), characterized by F/M ratios below 0.2 kg BOD5/kg MLVSS ∗ d and a considerable increase in the SVI (>200 mL/g), was observed. This was an indication of adverse conditions that would lead to deterioration of the aerobic sludge.
The low values of F/M and VOL between days 263 and 289 were associated with the UASB efficiency increase for organic matter removal (BOD5, 68%). This caused COD and BOD5 effluent average concentrations of 230 mg/L and 102 mg/L, respectively. This is evidence of the high sensitivity of the aerobic system to the anaerobic effluent. Despite this, the robustness of the combined system was demonstrated by the stability of the global removal efficiencies.
Taking into account the efficiency of the UASB organic matter removal, treating sewage is important to avoid low values of VOL (<0.4 kg BOD/m3 ∗ d) in the influent of the aeration tank that cause low F/M ratio values. This can be avoided by increasing the raw wastewater bypass to the aeration tank. In the aeration tank, the control of the F/M ratio and the volumetric organic loading can be conducted by implementing a raw wastewater bypass higher than 15% of the influent flow to the aeration tank. Other corrective measures are the extraction of excess sludge from the UASB reactor and an increase in the aeration time and the raw wastewater bypass.
The aeration tank showed high-efficiency removal during the start-up and steady-state phases, as shown in Figure 3.
During the start-up phase, the aeration tank removal efficiencies were as follows: COD (74 +/− 5.9); BOD (68 +/− 14); TSS (69 +/− 15). The size of the box indicates a low data dispersion, and the similar mean and median values are an indication of the data’s normal probability distribution. The atypical values are related to the deterioration of the effluent caused by the high settleable solid concentration in the anaerobic effluent.
In the steady-state phase, the average removal efficiencies were as follows: COD (77 +/− 12); BOD (76+/− 17); TSS (81 +/− 18). In both phases, the low efficiencies were related to the UASB effluent settleable solid concentration, which was higher than 0.3 mL/L. Figure 4 shows the variation in the UASB effluent settleable solid concentration, the total solid mass in the UASB sludge blanket, and the dissolved oxygen concentration in the aeration tank during the start-up and steady-state operation of the combined system.
During the UASB sludge blanket formation, corresponding to the first 90 days, the anaerobic effluent settleable solid concentration was below the analytical DL (<0.1 mL/L). As expected, with the sludge blanket growth, the UASB effluent settleable solid concentration increased.
Between days 95 and 200, there were events with a low dissolved oxygen concentration in the aeration tank that were associated with a settleable solid concentration higher than 0.3 mL/L in the anaerobic effluent. This is evidence of the high sensitivity of the aerobic tank to the anaerobic effluent in terms of the anaerobic effluent settleable solid concentration. To solve this problem, starting from day 200, measurements of the settleable solid concentration in the anaerobic effluent and the steady UASB sludge bed profile were used as control variables to maintain a dissolved oxygen concentration in the aeration tank of 2 mg/L.
According to [7,40], the maximum sludge storage capacity of UASB reactors can be identified using the sludge profile and the settleable solid measurements. For the latter criterion, these authors recommended a maximum value of 1 mL/L. In this case, it was found that the UASB effluent with settleable solids higher than 0.3 mL/L caused anaerobic conditions in the aeration tank.
The UASB start-up without an inoculum was completed in 4 months (120 days), despite the wastewater temperature corresponding to psychrophilic conditions (minimum 17.6 °C, maximum 19.6 °C). The average effluent pH was 7.0 +/− 0.3. At this time, the sludge profile showed that the UASB maximum sludge storage capacity in the digestion zone was 60-ton TS (average concentration: 38 kg TS/m3). Figure 5 shows the UASB sludge bed profile after 300 days of the operation period. A clear distinction can be seen between the sludge bed and the sludge blanket, which is an indication of the good sludge quality [32]. In this case, 83% of the sludge mass was in the sludge bed.
The average operational criteria of the UASB during the evaluation were an upflow velocity of 0.5 +/− 0.04 m/h and an organic volumetric load of 1.3 +/− 0.2 kg COD/m3 ∗ d. The anaerobic sludge SMA changed during the evaluation from 0.02 g COD-CH4/g VSS ∗ d (start-up) to 0.2 g COD-CH4/g VSS ∗ d (steady state), a typical value for UASB flocculent sludge [41].
The amount of UASB sludge to waste was defined based on the measured sludge blanket, taking the volume corresponding to the sludge present in the upper sampling point (3.34 m) of the UASB digestion compartment. The sludge extraction point was selected as it allows the withdrawal of the less concentrated sludge with the worst settling conditions and the preservation of the more concentrated, best-quality sludge.
The UASB reactor excess sludge production at the end of the evaluation period (290 d) was 0.8 ton TS/d. As is already known, the temperature has an impact on the required UASB sludge age. In this evaluation, the wastewater average temperature was 19 °C, the calculated UASB sludge considered the excess sludge, and the UASB effluent TSS load was 100 days, a value that is coherent with calculations performed in previous studies [41].
Although the UASB reactor is considered a secondary treatment, it can provide a removal efficiency of BOD 60% and COD 70% [42]. In this STP, the expected organic removal efficiency of the UASB reactor is less in order to maintain an appropriate F/M ratio in the aeration tank. Figure 6 shows the COD, BOD, and TSS removal efficiencies in the UASB reactor during the two evaluation phases.
The average removal efficiencies of COD in the UASB reactor during the start-up and steady state were 59 +/− 7 and 66 +/− 8%, respectively. The confidence intervals based on the median allow us to conclude that, with a 95% confidence interval, the UASB COD removal efficiencies were 56–62% at the start-up and 63–71% in the steady state. A statistical two-sample t-test showed (p-value < 0.05) significant statistical differences between the two phases for COD removal. In the start-up and steady-state phases, the UASB COD effluent values had median values of 401 mg/L and 226 mg/L, with 95% confidence intervals based on the medians of 275–348 mg/L and 208–271 mg/L, respectively.
The UASB DBO5 removal efficiencies evaluated during the start-up and steady state were 55 +/− 18 and 60 +/− 12%, respectively. The confidence intervals based on the median allow us to conclude that, with a 95% confidence interval, the UASB BOD5 removal efficiencies were 39–72% at the start-up and 49–70% in the steady state. There was no significant statistical difference (p-value > 0.05) in the BOD between the start-up and steady-state phases. In the start-up and steady-state phases, the UASB BOD effluent concentrations had median values of 160 mg/L and 165 mg/L, with 95% confidence intervals based on the medians of 135–192 mg/L and 108–182 mg/L, respectively.
The UASB TSS removal efficiencies during the start-up and steady state were 75 +/− 9 and 79 +/− 10%, respectively. The confidence intervals based on the median allow us to conclude that, with a 95% confidence interval, the UASB TSS removal efficiencies were 73–80% at the start-up and 79–85% in the steady state. A statistical two-sample t-test showed (p-value < 0.05) statistically significant differences between the two phases in UASB TSS removal. In the start-up and steady-state phases, the UASB TSS effluent concentrations had median values of 67 mg/L and 38 mg/L, with 95% confidence intervals based on the medians of 56–78 mg/L and 35–48 mg/L, respectively. The median effluent value in the UASB is an indication of the high TSS and the relative fast growth of the reactor sludge blanket. It is also connected with the 4-month UASB start-up time.
It was evident that the combination of technologies (UASB-AS) provides robustness and reliability to the global system performance in terms of the removal efficiency. Despite the failures during the start-up phase, the global removal efficiencies were not affected. Figure 7 shows the COD, BOD5, and TSS global removal efficiencies of the STP during the two phases.
The removal efficiencies of COD, BOD, and TSS of the combined system during the start-up and steady-state conditions were evaluated. A statistical two-sample t-test showed (p-value < 0.05) significant differences between the two phases in COD and TSS removal. The 95% confidence intervals based on the median were as follows: COD (start-up: 83–86%; steady state: 87–90%); TSS (start-up: 89–91%; steady state: 94–97%). In contrast, no significant statistical difference was found in the BOD5 removal efficiency (p-value > 0.05), with a 95% confidence interval (start-up: 83–94%; steady state: 84–92%).
The average COD removal efficiency (UASB-AS) was 83 +/− 4% at the start-up and 88 +/− 4 in the steady state. These values are similar to those reported in a previous study by [15] in a UASB-AS system, which ranged from 85 to 93%. Moreover, the average DBO5 removal efficiencies of the STP were 87 +/− 7% at the start-up and 87 +/− 5% in the steady state. These values are similar to the values reported by [22]. In terms of the TSS removal efficiency of the combined system, it was 90 +/− 4% and 94 +/− 5%, respectively, at the start-up and in the steady state.
Table 5 shows the COD, BOD5, and TSS concentrations in the raw sewage as well as the UASB effluent and the effluent of the STP. The COD, BOD5, and TSS effluent concentrations are below the Colombian legislation required standard (Ministerio de Vivienda y Territorio, Resolución 631 de 2015) are as follows: COD = 180 mg/L; BOD5 = 90 mg/L; TSS = 90 mg/L.
Table 6 shows a comparison of the results of this investigation with other full-scale UASB-AS systems treating sewage in terms of the HRT applied in the UASB and the aeration tank as well as the final effluent concentrations and removal efficiencies of BOD, COD, and TSS.
As shown in this evaluation, the performance of the Tunja sewage treatment plant demonstrated higher efficiencies than the experiences in India, with similar results to those reported in Brazil.
Based on the reported experiences, for the UASB+AS combination, it is evident that the UASB operates in a low HRT. In this investigation, the UASB was operated with a lower flow than the design value; therefore, the HRT was higher than the design value (6 h).

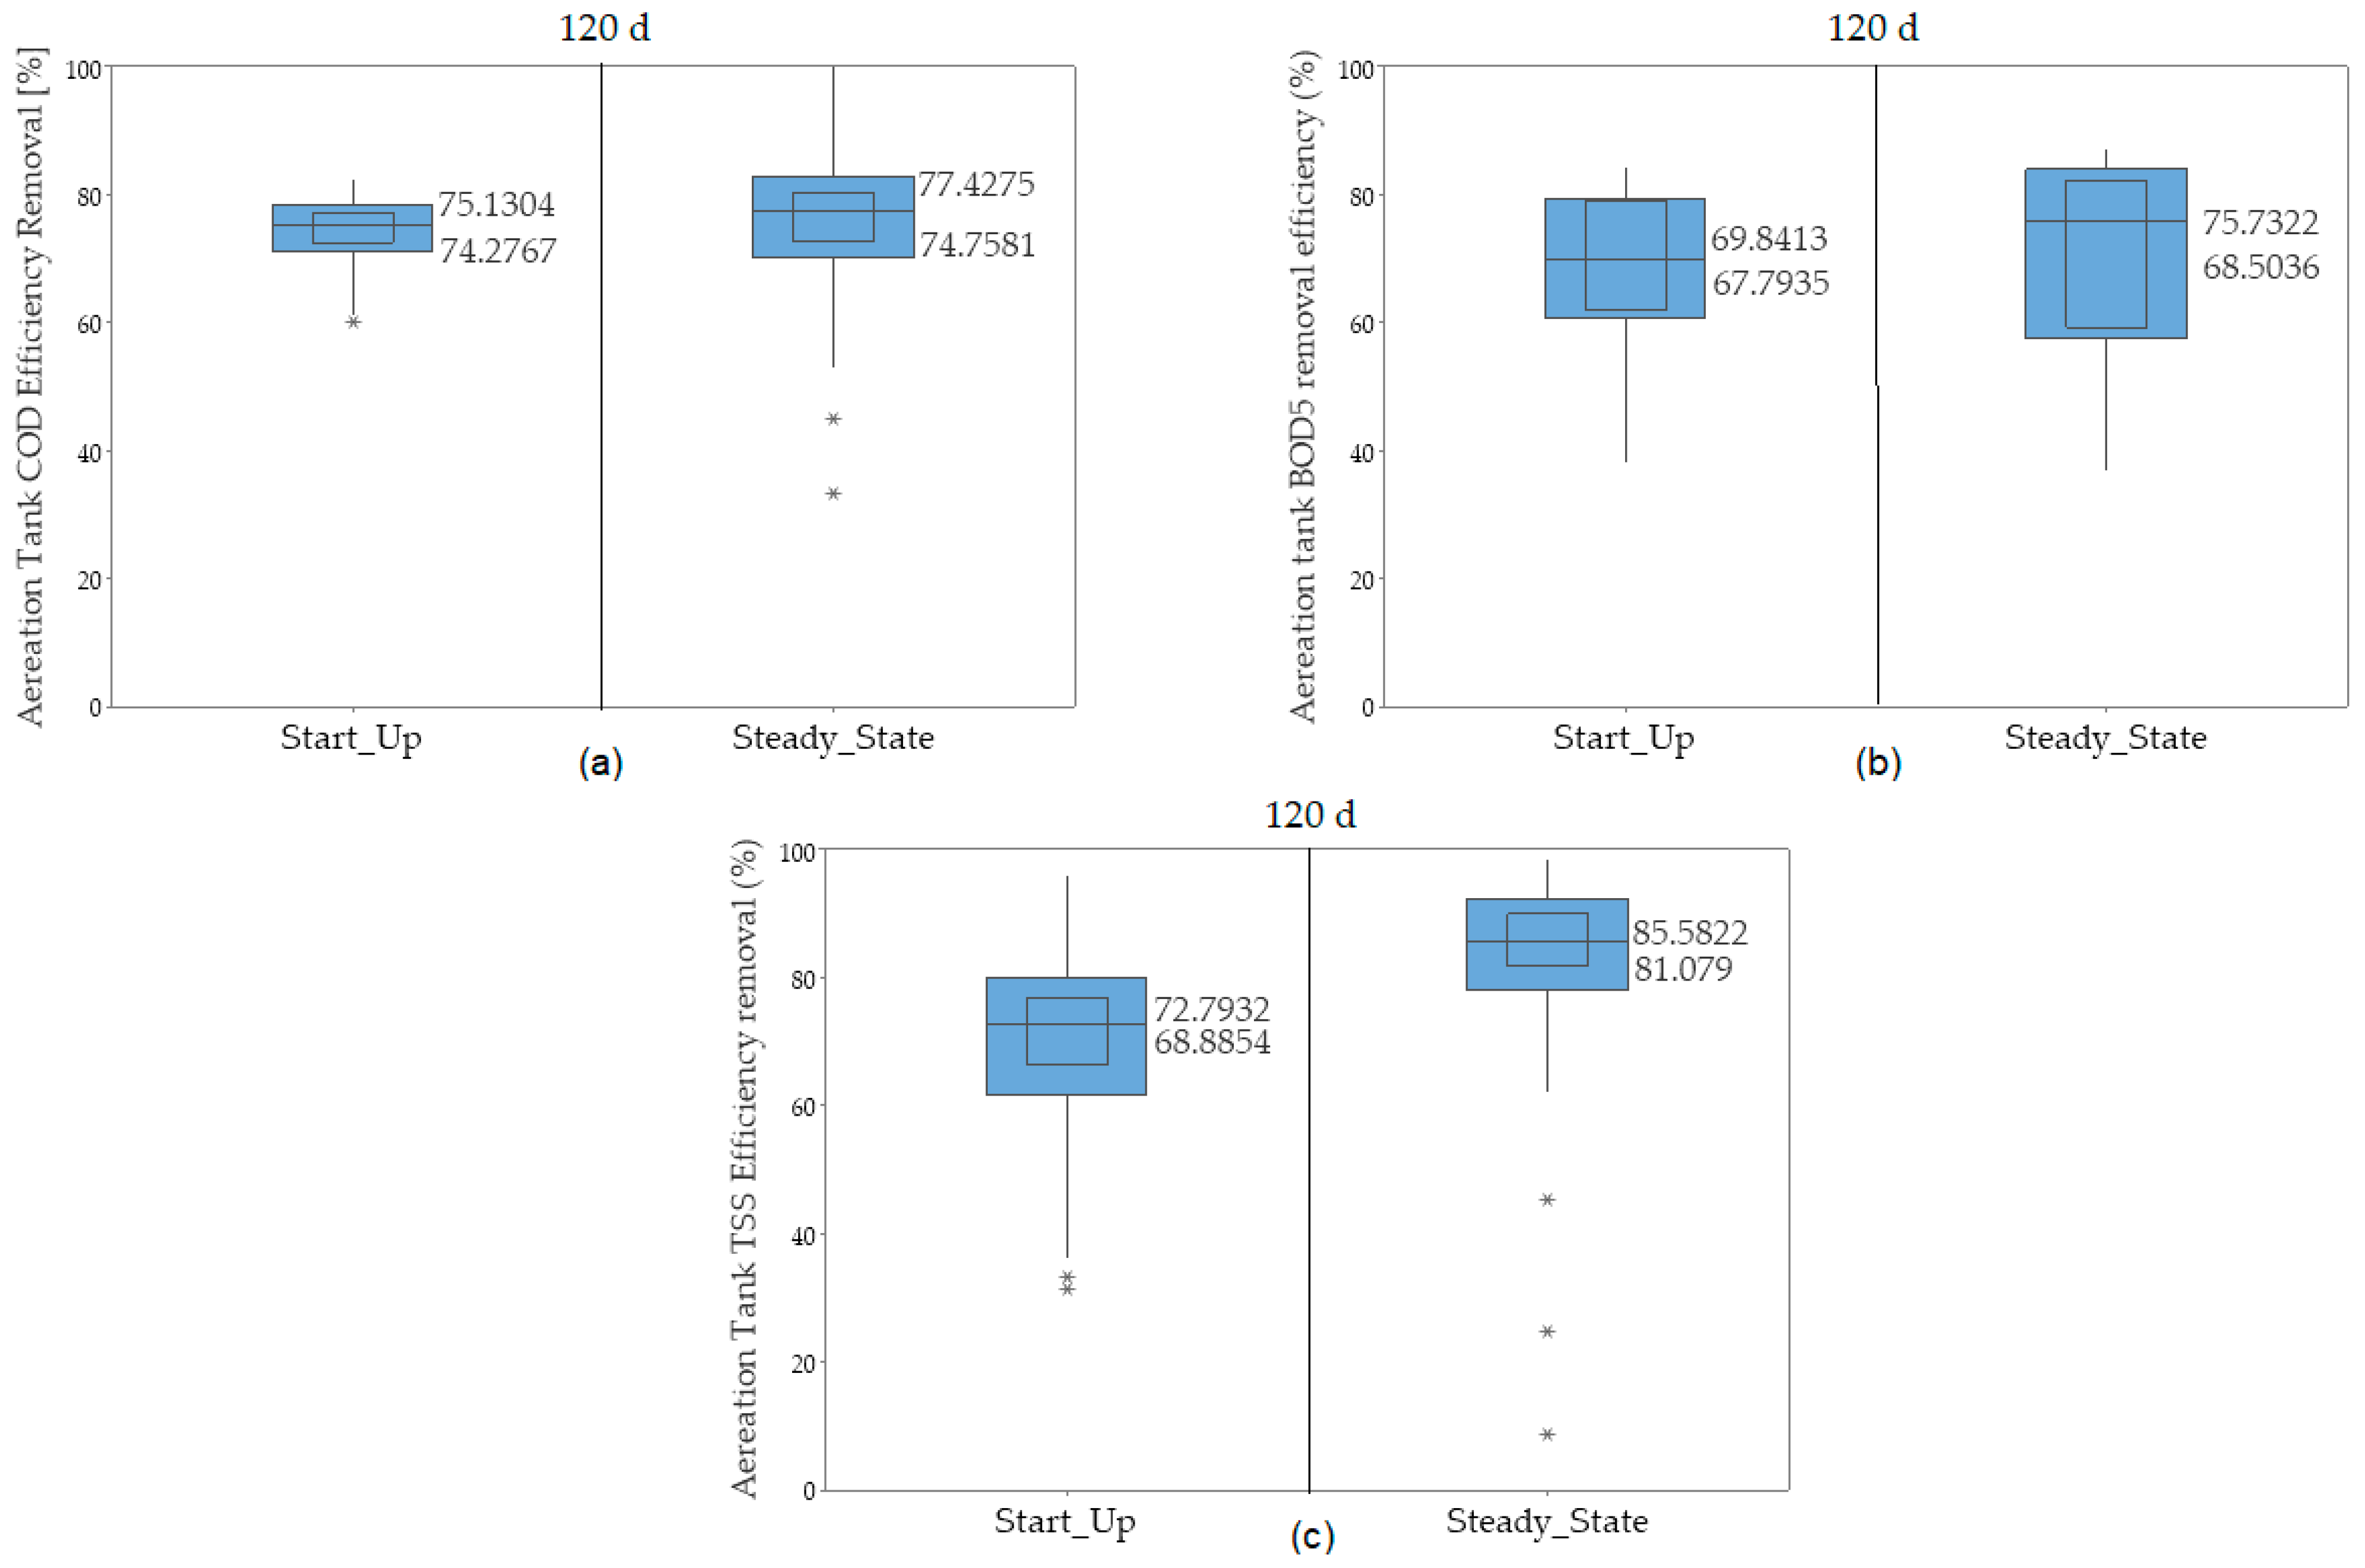
3.2. Final Water Quality Verification

The steady-state COD balance at the end of the evaluation period was built with the free STAN software [43]. This is a tool for material flow analysis of goods, substances, and energy that allows the user to calculate the unknown flows considering data uncertainties through error propagation. In this case, the unknown values were the amounts of influent COD converted to methane in the UASB reactor and to CO2 in the aerobic reactor. The other flow values with their uncertainties were measured.
Figure 8 shows that the total average amount of COD converted was 85%. The most important COD average flow removal in the STP is the production of aerobic sludge (32%), followed by the anaerobic sludge production in the UASB reactor (18%). The COD converted to CH4 in the anaerobic reactor totaled 27%. At the wastewater temperature used in this study, the amount of methane released in the effluent or entrapped within the sludge bed is non-negligible [44]. This is because the CH4 solubility at a low temperature is high (104 mg/L at 15 °C).
The influent average (+/− SD) concentration of grease and oil was 102 +/− 53 mg/L. Meanwhile, its effluent concentration was always less than the method detection limit (DL = 10 mg/L). The average raw wastewater pH and total alkalinity were 8.0 +/− 0.3 and 7.0 +/− 1.2 meq/L, respectively. The effluent had a pH of 7.0 +/− 0.2 and a total alkalinity of 5.6 +/− 0.5 meq/L.
Table 7 shows an additional influent and effluent characterization conducted at the end of the evaluation period with a 24 h composite sampling. It can be seen that, as expected, and because of the low-sludge-age operation, there was no nitrogen removal. The BOD effluent was less than 30 mg/L, a value that is widely recognized as a valid quality criterion for conventional activated sludge system effluents [10]. The influent settleable solid concentrations were between 2.8 and 7.0, but their effluent concentrations were less than the method DL (0.1 mL/L). The heavy metals that were present in the influent were aluminum, zinc, and copper, but their effluent concentrations were less than their DLs. The iron removal efficiency was 82%.

3.3. Start-Up Strategies and Operation of UASB-AS Systems Treating Sewage

This investigation showed that the start-up of sewage treatment systems using UASB reactors (anaerobic technology), followed by conventional activated sludge (aerobic technology), can be implemented taking into account the operative aspects that look for the harmonization of both processes. Despite the fact that a low-temperature wastewater regime was predominant during this study (psychrophilic conditions, 18.6 +/− 1.0 °C), the UASB start-up time was 141 days (4.7 months). The aerobic reactor was also started without an inoculum in 21 days.
The results of this investigation allow us to establish recommendations for the start-up of these combined sewage treatments. Moreover, it was possible to define the operational limits and the key monitoring parameters for the successful start-up of the system, as shown in Figure 9.
Because of its fast response, it is recommended that the start-up of the system must be conducted starting with the start-up of the aerobic tank. Once it is stable, the UASB start-up can be initiated because it will take more time to reach the steady-state condition.
The start-up end of the aeration tank can be identified by the following parameters’ values: MLSS design concentration (3500 mg/L); dissolved oxygen (2.0 mg/L); SVI (80 mL/g); and sludge color (brown).
The start-up of the UASB reactor can be initiated by maintaining a raw wastewater bypass flow of 15% to the aeration tank in order to guarantee an appropriate F/M ratio value in the aeration tank (0.2 kg BOD5/kg MLVSS∗d). This operation mode also reduces the risk of sludge and effluent deterioration caused by the presence of filamentous sludge in the aeration tank.
In the case of unfavorable sludge color changes in the aeration tank with a reduction in the F/M values and the dissolved oxygen concentration, it is recommended to increase the bypass percentage flow and the aeration time. This deterioration of the sludge can be caused by the high suspended solid concentration in the UASB effluent. Therefore, it is important to measure the UASB effluent settleable solid concentration daily. The recommended value is less than 0.3 mL/L.
It is important to monitor the UASB sludge blanket profile to evaluate the sludge blanket formation during the start-up phase. In this case, the UASB start-up end allowed for estimating the maximum mass that can be stored in the UASB digestion compartment, which was 60-ton TS. This condition can be associated with the increment in the UASB effluent settleable solid concentrations (>0.3 mL/L) and the need to take out excess sludge from the top part of the UASB digestion compartment (3.32 m). The UASB excess sludge in the steady-state condition was 12 TS ton/d every 15 days.
It was observed that a higher UASB effluent settleable solid concentration deteriorates the aeration tank sludge quality and reduces its dissolved oxygen concentration. In order to solve this, it is necessary to increase the aeration time. Therefore, the minimum control parameters were the daily UASB settleable solid concentration, the hourly dissolved oxygen concentration in the aeration tank, and the weekly determination of the removal efficiencies, as well as the F/M ratio and the observation of the sludge color.
Finally, this study demonstrated the importance of implementing efforts to strengthen local capacities to reach the appropriate start-up and operation conditions of sewage treatment systems in developing countries. This was evident during the training of the system operators, which was carried out considering the operational and technical aspects as well as the design criteria, control variables, and concepts that allowed for improving the decision-making process. The accompaniment to the operators during the evaluation promoted a technical knowledge appropriation that allowed the proper operation of the system.

4. Conclusions

Combined anaerobic and aerobic treatment is an efficient combination for sewage treatment that can reach global efficiencies of COD 87 +/− 4%, BOD 88 +/− 5%, and TSS 94 +/− 5%. The start-up of both systems was conducted without an inoculum, starting with the aerobic reactor. Despite the psychrophilic wastewater temperature, the UASB reactor start-up took 120 days.
It was demonstrated that the aerobic tank is greatly affected by the anaerobic effluent. These potential adverse effects can be overcome with the daily measurement of the anaerobic effluent settleable solid concentration (<0.3 mL/L), or, in the aeration tank, the sludge color (brown), sludge volumetric index (100–200 mL/g), and dissolved oxygen (2.0 mg/L). Moreover, it is recommended to implement a raw wastewater bypass flow of higher than 15% to the aeration tank to maintain proper values of the F/M ratio and volumetric organic loading.
The performance of the combined systems at the end of the evaluation period showed that, as expected, and because of the low-sludge-age operation, there was no nitrification. The BOD effluent was less than 30 mg/L, a value that is widely recognized as a valid quality criterion for conventional activated sludge system effluents. The influent settleable solid concentrations were between 2.8 and 7.0, but their effluent concentrations were less than the method DL (0.1 mL/L). The heavy metals that were present in the influent were aluminum, zinc, and copper, with effluent concentrations less than their DLs. The iron removal efficiency was 82%. Hydrocarbons were present in the influent, but their effluent concentrations were less than their DLs.

Author Contributions

J.D.-G.: conceptualization, methodology, validation, investigation, resources, writing—original draft, writing—review and editing, visualization, project administration; A.P.-V.: investigation, writing—review and editing; O.U.-P.: writing—review and editing; D.V.-N.: conceptualization, validation, resources, writing—review and editing, funding acquisition; X.J.-D.: validation, writing—review and editing, supervision, funding acquisition; C.R.: supervision, data acquisition, writing—original draft. All authors have read and agreed to the published version of the manuscript.

Funding

This project was founded by Veolia-Tunja and Universidad de Boyaca. Agreement 20_2020.

Informed Consent Statement

Not applicable.

Data Availability Statement

Data sharing not applicable. No new data were created or analyzed in this study. Data sharing is not applicable to this article.

Acknowledgments

We thank the operators of Tunja’s wastewater treatment plant, and Victoria Eugenia Muñoz for the comments on the manuscript.

Conflicts of Interest

The authors declare that they have no known competing financial interest or personal relationships that could have appeared to influence the work reported in this paper. There are no conflicts of interest to declare.

References

  1. Kassab, G.; Halalsheh, M.; Klapwijk, A.; Fayyad, M.; van Lier, J.B. Sequential Anaerobic-Aerobic Treatment for Domestic Wastewater—A Review. Bioresour. Technol. 2010, 101, 3299–3310. [Google Scholar] [CrossRef] [PubMed]
  2. Chan, Y.J.; Chong, M.F.; Law, C.L.; Hassell, D.G. A Review on Anaerobic-Aerobic Treatment of Industrial and Municipal Wastewater. Chem. Eng. J. 2009, 155, 1–18. [Google Scholar] [CrossRef]
  3. Chernicharo, C.A.L.; Lier, J.B.; Noyola, A.; Ribeiro, T.B. Anaerobic Sewage Treatment: State of the Art, Constraints and Challenges. Rev. Environ. Sci. Bio/Technol. 2015, 14, 649–679. [Google Scholar] [CrossRef]
  4. Cárdenas-Talero, J.L.; Silva-Leal, J.A.; Pérez-Vidal, A.; Torres-Lozada, P. The Influence of Municipal Wastewater Treatment Technologies on the Biological Stabilization of Sewage Sludge: A Systematic Review. Sustainability 2022, 14, 5910. [Google Scholar] [CrossRef]
  5. Schellinkhout, A.; Collazos, C.J. Full-Scale Application of the UASB Technology for Sewage Treatment. Water Sci. Technol. 1992, 25, 159–166. [Google Scholar] [CrossRef]
  6. Seghezzo, L.; Zeeman, G.; Van Lier, J.B.; Hamelers, H.V.M.; Lettinga, G. A Review: The Anaerobic Treatment of Sewage in UASB and EGSB Reactors. Bioresour. Technol. 1998, 65, 175–190. [Google Scholar] [CrossRef]
  7. Chernicharo, C.A.; Lobato, L.C.; Neves, P.N. Anaerobic Reactors for Sewage Treatment: Design, Construction and Operation; IWA Publishing: London, UK, 2019. [Google Scholar]
  8. Boiocchi, R.; Zhang, Q.; Gao, M.; Liu, Y. Modeling and Optimization of an Upflow Anaerobic Sludge Blanket (UASB) System Treating Blackwaters. J. Environ. Chem. Eng. 2022, 10, 107614. [Google Scholar] [CrossRef]
  9. Chong, S.; Sen, T.K.; Kayaalp, A.; Ang, H.M. The Performance Enhancements of Upflow Anaerobic Sludge Blanket (UASB) Reactors for Domestic Sludge Treatment—A State-of-the-Art Review. Water Res. 2012, 46, 3434–3470. [Google Scholar] [CrossRef]
  10. Khan, A.A.; Gaur, R.Z.; Mehrotra, I.; Diamantis, V.; Lew, B.; Kazmi, A.A. Performance Assessment of Different STPs Based on UASB Followed by Aerobic Post Treatment Systems. J. Environ. Health Sci. Eng. 2014, 12, 1–13. [Google Scholar] [CrossRef] [Green Version]
  11. Khan, A.A.; Gaur, R.Z.; Tyagi, V.K.; Khursheed, A.; Lew, B.; Mehrotra, I.; Kazmi, A.A. Sustainable Options of Post Treatment of UASB Effluent Treating Sewage: A Review. Resour. Conserv. Recycl. 2011, 55, 1232–1251. [Google Scholar] [CrossRef]
  12. Mazhar, M.A.; Khan, N.A.; Khan, A.H.; Ahmed, S.; Siddiqui, A.A.; Husain, A.; Tirth, V.; Islam, S.; Shukla, N.K.; Changani, F.; et al. Upgrading Combined Anaerobic-Aerobic UASB-FPU to UASB-DHS System: Cost Comparison and Performance Perspective for Developing Countries. J. Clean. Prod. 2021, 284, 124723. [Google Scholar] [CrossRef]
  13. Mai, D.T.; Kunacheva, C.; Stuckey, D.C. A Review of Posttreatment Technologies for Anaerobic Effluents for Discharge and Recycling of Wastewater. Crit. Rev. Environ. Sci. Technol. 2018, 48, 167–209. [Google Scholar] [CrossRef]
  14. Von Sperling, M.; Freire, V.H.; de Lemos Chernicharo, C.A. Performance evaluation of a USB—Activated sludge system treating municipal wastewater. Water Sci. Technol. 2001, 43, 323–328. [Google Scholar] [CrossRef] [PubMed]
  15. Oliveira, S.C.; Von Sperling, M. Performance Evaluation of UASB Reactor Systems with and without Post-Treatment. Water Sci. Technol. 2009, 59, 1299–1306. [Google Scholar] [CrossRef] [PubMed]
  16. Chernicharo, C.A.L. Post-Treatment Options for the Anaerobic Treatment of Domestic Wastewater. Rev. Environ. Sci. Biotechnol. 2006, 5, 73–92. [Google Scholar] [CrossRef]
  17. Polito Braga, C.M.; Von Sperling, M.; Braga, A.R.; Pena, R.T. Control strategies for a combined anaerobic (UASB)—Aerobic (activated sludge) wastewater treatment system. Environ. Technol. 2005, 26, 1393–1402. [Google Scholar] [CrossRef]
  18. Cao, Y.S.; Ang, C.M. Coupled UASB-activated sludge process for COD and nitrogen removals in municipal sewage treatment in warm climate. Water Sci. Technol. 2009, 60, 2829–2839. [Google Scholar] [CrossRef]
  19. La Motta, E.J.; Silva, E.; Bustillos, A.; Padrón, H.; Luque, J. Combined Anaerobic/Aerobic Secondary Municipal Wastewater Treatment: Pilot-Plant Demonstration of the UASB/Aerobic Solids Contact System. J. Environ. Eng. 2007, 133, 397–403. [Google Scholar] [CrossRef]
  20. De Sousa, J.T.; Foresti, E. Domestic sewage treatment in an upflow anaerobic sludge blanket- Sequencing batch reactor system. Water Sci. Technol. 1996, 33, 73–84. [Google Scholar]
  21. Moawad, A.; Mahmoud, U.F.; El-Khateeb, M.A.; El-Molla, E. Coupling of sequencing batch reactor and UASB reactor for domestic wastewater treatment. Desalination 2009, 242, 325–335. [Google Scholar] [CrossRef]
  22. Saliba, P.D.; von Sperling, M. Performance Evaluation of a Large Sewage Treatment Plant in Brazil, Consisting of an up Fl Ow Anaerobic Sludge Blanket Reactor Followed by Activated Sludge Pollyane Diniz Saliba and Marcos von Sperling. Water Sci. Technol. 2017, 76, 2003–2014. [Google Scholar] [CrossRef] [PubMed]
  23. Passing, F.H.; Vilela, L.C.H.; Ferreira, O.P. ETE—Piracicamirim—Nova concepção de sistema de tratamento de esgotos sanitários–partida, operação e monitoramento de desempenho. In Anais: 20º Congresso Brasileiro de Engenharia Sanitária e Ambiental, Rio de Janeiro, Maio/99; GESAD: Rio de Janeiro, Brazil, 1999. (In Portuguese) [Google Scholar]
  24. Mungray, A.K.; Patel, K. Coliforms removal in two UASB + ASP based systems. Int. Biodeterior. Biodegrad. 2011, 65, 23–28. [Google Scholar] [CrossRef]
  25. Pontes, P.P.; Chernicharo, C.A.D.L. Efeito Do Retorno de Lodo Aeróbio Sobre as Características Da Biomassa Presente Em Reatores UASB Tratando Esgoto Sanitário. Eng. Sanit. e Ambient. 2009, 14, 223–234. [Google Scholar] [CrossRef]
  26. Polito-Braga, C.M.; von Sperling, M.; Braga, A.R.; Pena, R.T. Real time control of a combined UASB-activated sludge wastewater treatment configuration. Water Sci. Technol. 2002, 45, 279–287. [Google Scholar] [CrossRef]
  27. Von Sperling, M.; Oliveira, S.C. Comparative Performance of Full-Scale Anaerobic and Aerobic Wastewater Treatment Process in Brazil. Water Sci. Technol. 2009, 59, 15–22. [Google Scholar] [CrossRef]
  28. Tawfik, A.; El-Gohary, F.; Ohashi, A.; Harada, H. Optimization of the Performance of an Integrated Anaerobic-Aerobic System for Domestic Wastewater Treatment. Water Sci. Technol. 2008, 58, 185–194. [Google Scholar] [CrossRef]
  29. APHA. Standard Methods for the Examination of Water and Wastewater Standard Methods for the Examination of Water and Wastewater; American Public Health Association: Washington, DC, USA, 2009. [Google Scholar]
  30. Barbosa, R.A.; Sant’Anna, G.L., Jr. Treatment of Raw Domestic Sewage in an UASB Reactor. Water Res. 1989, 23, 1483–1490. [Google Scholar] [CrossRef]
  31. Hussain, A.; Dubey, S.K. Specific Methanogenic Activity Test for Anaerobic Degradation of Influents. Appl. Water Sci. 2017, 7, 535–542. [Google Scholar] [CrossRef]
  32. Haskoning. Manual for UASB Reactors for Domestic Wastewater under Tropical Conditions; DECOM Manual; Working paper: Cali, Colombia, 1989. [Google Scholar]
  33. IHE. Anaerobic Lab Work. Lecture Notes, AWWT-08; Institute for Hydraulics and the Environment: Delft, The Netherlands, 1994. [Google Scholar]
  34. Metcalf & Eddy, Inc.; Tchobanoglous, G.; Stensel, H.; Tsuchihashi, R.; Burton, F. Wastewater Engineering:Treatment and Resource Recovery, 5th ed.; McGraw Hill: New York, NY, USA, 2014. [Google Scholar]
  35. von Sperling, M. Wastewater Characteristics, Treatment and Disposal; IWA publishing: London, UK, 2015; Volume 6. [Google Scholar]
  36. von Sperling, M. Biological Wastewater Treatment Series: Wastewater Characteristics Treatment and Disposal; IWA publishing: London, UK, 2007; Volume 1. [Google Scholar]
  37. di Bella, G.; Durante, F.; Torregrossa, M.; Viviani, G. Start-up with or without Inoculum? Analysis of an SMBR Pilot Plant. Desalination 2010, 260, 79–90. [Google Scholar] [CrossRef] [Green Version]
  38. Li, Z.H.; Han, D.; Yang, C.J.; Zhang, T.Y.; Yu, H.Q. Probing Operational Conditions of Mixing and Oxygen Deficiency Using HSV Color Space. J. Environ. Manag. 2019, 232, 985–992. [Google Scholar] [CrossRef]
  39. Sicard, C.; Glen, C.; Aubie, B.; Wallace, D.; Jahanshahi-Anbuhi, S.; Pennings, K.; Daigger, G.T.; Pelton, R.; Brennan, J.D.; Filipe, C.D.M. Tools for Water Quality Monitoring and Mapping Using Paper-Based Sensors and Cell Phones. Water Res. 2015, 70, 360–369. [Google Scholar] [CrossRef] [PubMed]
  40. Adrianus van Haandel, J. van der L. Anaerobic Sewage Treatment:Optimization of Processes and Physical Design of Anaerobic and Complementary Processes; IWA publishing: London, UK, 2019. [Google Scholar]
  41. Van Lier, J.B.; Vashi, A.; Van Der Lubbe, J.; Heffernan, B. Anaerobic Sewage Treatment Using UASB Reactors: Engineering and Operational Aspects. Environ. Anaerob. Technol. Appl. New Dev. 2010, 59–89. [Google Scholar] [CrossRef] [Green Version]
  42. Augusto, C.; Chernicharo, D.L. Biological Wastewater Treatment Systems: Anaerobic Reactors; IWA publishing: London, UK, 2007; Volume 4. [Google Scholar]
  43. Cencic, O.; Rechberger, H. Material Flow Analysis with Software STAN. In Proceedings of the EnviroInfo 2008: Environmental Informatics and Industrial Ecology, Lüneburg, Germany, 10–12 September 2008; pp. 440–447. [Google Scholar]
  44. Cecconet, D.; Mainardis, M.; Callegari, A.; Capodaglio, A.G. Chemosphere Psychrophilic Treatment of Municipal Wastewater with a Combined UASB / ASD System, and Perspectives for Improving Urban WWTP Sustainability. Chemosphere 2022, 297, 134228. [Google Scholar] [CrossRef] [PubMed]
Figure 1. Flowsheet of the Tunja sewage treatment plant including a UASB reactor with activated sludge post-treatment.
Water 14 04034 g001
Figure 2. Variation in F/M, VOL, and sludge color in the aeration tank.
Water 14 04034 g002
Figure 3. Aeration tank removal efficiency during start-up and steady-state operation: (a) COD, (b) BOD, and (c) TSS. ∗: boxplot outliers.
Water 14 04034 g003
Figure 4. Variation in settleable solids in the UASB effluent and the dissolved oxygen concentration in the aeration tank.
Water 14 04034 g004
Figure 5. UASB sludge bed profile after 300 days of operation. Sludge mass: 60 TS.
Water 14 04034 g005
Figure 6. Removal efficiencies in the UASB reactor during the start-up and steady state: (a) COD, (b) BOD, and (c) TSS. ∗: boxplot outlier.
Water 14 04034 g006
Figure 7. COD, BOD, and TSS STP removal efficiencies during the start-up and steady state. *: boxplot outliers.
Water 14 04034 g007
Figure 8. Steady-state COD balance in the Tunja STP.
Water 14 04034 g008
Figure 9. Important aspects during the start-up and operation of combined sewage treatment systems (anaerobic–aerobic).
Water 14 04034 g009
Table 1. Design values adopted for the Tunja STP.
UnitParameterSTP Design
UASBHRT (h)6 h
Vup (m/h)0.7 m/h
Aeration tankHRT (h)6 h
MLSS (g/m3)3500 g/m3
F/M (kg DBO5/kg MLVSS ∗ d)0.4
Sludge age (d)6 d
SVI(50–100) mL/g
Secondary settlerHLR17.6 m3/m2-d
SLR6 kg/m2 ∗ h
HRT: hydraulic retention time; Vup: upflow velocity; HLR: surface hydraulic loading rate; SVI: sludge volumetric index; SLR: surface solid loading rate; MLSS: mixed liquor suspended solids; MLVSS: mixed liquor volatile suspended solids; F/M: food/microorganism ratio.
Table 2. Parameters and operation variables measured in the raw wastewater and UASB effluent.
ParametersFrequencyMethodRaw WastewaterUASB Effluent
Flow ContinuouslyFlowmeterx
Chemical oxygen demand (COD)DailySM 5220 Dxx
Biochemical oxygen demand (BOD5)2 x weeklySM 5210xx
Total suspended solids (TSS)DailySM 2540 Dxx
Oil and greaseMonthlySM 5520 Dxx
Settleable solidsDailySM 2540xx
TemperatureDailySM 2550 Bxx
pHDailySM 4500xx
Organic loading rate (based on flow, COD, and reactor volume)2 x weeklyCalculated x
Table 3. Influent flow to the UASB and the bypass during the evaluation period.
Time (Days)UASB Flow (m3/d)Bypass Flow (m3/d)
Phase 1: Start-Up0–2266531123 (15%)
22–8954432332 (30%)
89–12062201555 (20%)
Phase 2: Steady State120–30966531123 (15%)
%: percentage of the total flow.
Table 4. Measured and calculated variables in the aeration tank and the effluent.
Aeration Tank VariablesFrequencyMethod
Mixed liquor suspended solids (MLSS)2 x weeklySM 2540 D
Mixed liquor volatile suspended solids (MLVSS)2 x weeklySM 2540 E
Food/microorganism ratio (F/M) (based on flow, BOD5, and reactor volume)2 x weeklyCalculated
CODDailySM 5220 D
BOD52 x weeklySM 5210
TSS2 x weeklySM 2540 D
Oil and greaseMonthlySM 5520 D
Volumetric organic loading (VOL) (based on flow, BOD5, and reactor volume)2 x weeklyCalculated
Dissolved oxygen Every hourHach, 9,020,000
Sludge volumetric index (SVI)2 x weeklySperling (2007)
Sludge colorContinuouslyVisual observation
Sludge age2 x weeklyCalculated
Table 5. STP effluent COD, BOD, and TSS concentrations at the start-up and in the steady state.
ParameternRaw WastewaterUASBAeration Tank
Mean +/− SDCIMean +/− SD
Start-Up
Mean +/− SD
Steady State
Mean +/− SD
Start-Up
Mean +/− SD
Steady State
COD [mg/L]46694 +/− 143661–734405 +/− 84245 +/− 63127 +/− 3176+7-22
BOD5 [mg/L]28400 +/− 99361–464174 +/− 63154 +/− 5556 +/− 1845 +/− 17
TSS [mg/L]48303 +/− 69252–34869 +/− 1845+/1934 +/− 1613 +/− 9
CI: 95% confidence interval based on the mean; SD: standard deviation.
Table 6. Full-scale experiences with UASB-AS systems treating sewage.
CountryScaleFlow
(m3/d)
HRT (h)Concentration Mean (mg/L),
Removal Efficiency % in Parentheses
Reference
UASBATBODCODTSS
India (Vadodara)full43,0007.2613 (78)35 (75)21 (82)[24]
India (Surat)full100,0008.5318 (86)77 (81)45 (65)[24]
Brazil (Piracicaba)full10,8004.64.847 (80)174 (65)-[23]
Brazil (Betin)full44,4108.16.112 (94)37 (91)19 (92)[22]
Colombia (Tunja) *full7776107.622 (95)98 (86)20 (90)This study
* 24 h sampling final evaluation. AT: aeration tank.
Table 7. Additional influent and effluent characterization.
ParameterUnitInfluentEffluent
Aciditymg CaCO3/L<10<10
CODmg/L68398.3
BOD5mg/L41022
TSSmg/L19820
Settleable solidsml/L2.8–7.0<0.1
Ammonia nitrogenmg N/L4743.6
Nitratemg N/L<0.05<0.05
Nitritemg N/L0.1690.123
Kjeldahl nitrogenmg N/L62.351
Aluminummg AL/L1.19< 0.5
BTEXμg/L<40< 40
Cadmiummg Cd/L<0.01< 0.01
Cyanidemg CN/L<0.01< 0.1
Coppermg Cu/L0.038< 0.02
Real color426 nm
525 nm
620 nm
7.8
3.9
3.4
3.1
2.1
1.1
Volatile phenolic compoundsμg/L<10<10
Chloridesmg Cl/L2055
Total hardnessmg CaCO3/L14859.4
Calcic hardnessmg CaCO3/L5421.8
Total chromiummg Cr/L<0.02<0.02
Total phosphorousmg P/L7.975.27
Orthophosphatesmg P/L5.333.09
Hydrocarbonsmg Hydrocarbons/L3.92<1.0
Aromatic hydrocarbonsμg/L< 5.0<5.0
Mercurymg Hg/L< 0.001<0.001
Nickelmg Ni/L< 0.05<0.05
Total ironmg Fe/L1.980.349
Total silvermg Ag/L< 0.02<0.02
Leadmg Pb/L< 0.1<0.1
Anionic surfactantsmg SAAM/L2.063.66
Sulfatemg SO4−2/L67.987.3
Sulfurmg S−2/L3.15<1.0
Zincmg Zn/L0.23<0.05
Publisher’s Note: MDPI stays neutral with regard to jurisdictional claims in published maps and institutional affiliations.

