

Ethohydraulic Experiments Investigating Retention Rates of an Electrified Bar Rack


1
Unit of Hydraulic Engineering, Department of Infrastructure, University of Innsbruck, 6020 Innsbruck, Austria
2
HyFish GmbH, 6020 Innsbruck, Austria
*
Author to whom correspondence should be addressed.
Water 2022, 14(24), 4036; https://doi.org/10.3390/w14244036
Submission received: 20 October 2022
/
Revised: 30 November 2022
/
Accepted: 5 December 2022
/
Published: 10 December 2022
(This article belongs to the Special Issue Fish Passage at Hydropower Dams 2.0)
Abstract
:Bar racks at water intakes of hydropower plants serve mainly to protect the turbines from floating debris. Additionally, they can be utilized to protect downstream migrating fish in order to prevent a potentially harmful turbine passage. The Bar Rack FishProtector consists of a common bar rack equipped with electrodes mounted on the upstream side of the bars. The application of a low voltage current at the electrodes creates an electric field in the water which is actively avoided by fish. Thus, a hybrid barrier consisting of a mechanical barrier and a behavioral barrier is formed. An unscaled model of a Bar Rack FishProtector (bar spacing sb = 50 mm, bar thickness tb = 20 mm) was used in field experiments to investigate the retention rate in an experimental setup with only one possible migration route (downstream, rack passage) and an average flow velocity of 0.43 m/s. Ethohydraulic experiments were performed with three indicator species barbel (Barbus barbus), bream (Abramis brama) and roach (Rutilus rutilus) and additionally perch (Perca fluviatilis) in selected trials. The twelve trials included four reference trials without electric field present (Nday = 2, Nnight = 2) and eight trials with electric field (Nday = 6, Nnight = 2). The results show that the experimental retention rate could be increased significantly by the application of an electrical field during the night and during the day with an even more pronounced effect during the night. The differences between the functionality of the system during the day and at night as well as other influencing parameters are discussed. No significant influence of the applied voltage on the electrodes or significant influence of fish size could be identified.
1. Introduction
Rivers have been used as a primary source for human life ever since as they provide water and food as well as facilitate transportation and energy production [1,2]. In order to fulfil these tasks but also to stabilize the rivers and ensure flood protection a multitude of transverse structures like weirs, dams have been constructed, which negatively impact the riverine networks [3]. Ecological impacts include flow alteration, water shortage in the residual water stretches, sediment discontinuity and longitudinal fragmentation [4,5]. Especially the fragmentation impacts the life cycle of riverine fauna depending on migration [6,7]. As habitat conditions change, the migration of fish is triggered [8]. But this migration is often delayed if not entirely hindered by hydropower facilities [9].
Technical and nature-like solutions aiding the upstream migration of fish past the mentioned obstructions have been studied and successfully implemented in recent decades but research on the most effective means for mitigating negative impacts during downstream migration is still ongoing [3].
During the downstream migration, fish will most likely follow the main current which is usually directed through the turbines [10,11]. Turbine passage can result in high mortality rates [12], also depending on the type of turbine and mode of operation [13]. To effectively prevent harmful turbine passage and to swiftly guide fish to a safe bypass route to minimize migratory delay and predation risk, fish guidance structures are needed [14].
Classical fish guidance structures can be attributed to either the physical barriers, preventing fish passing through by utilizing minimal bar spacings (sb) smaller than the dimensions of the fish [15], or to the behavioral barriers intending to change their behavior in a certain way [16,17]. Behavioral barriers can be classified as mechanical barriers, utilizing pressure or velocity gradients and highly turbulent flow zones to induce avoidance behavior [18,19,20] or sensory-behavioral barriers utilizing other sensory cues which include bubble curtains, sound, light or electric fields [17]. The current study concentrates on the latter, particularly a hybrid barrier with application of an electric field in the water called the Bar Rack FishProtector. This hybrid barrier consists of a classical bar rack additionally equipped with electrodes mounted on the upstream face of the bars [21,22]. The bar rack itself functions as a mechanical barrier and is visually perceived by approaching fish at a certain distance upstream since vision is a supreme sense in many fish [23]. This visual perception then results in positive rheotaxis (fish is facing upstream), which is a key component in the operating principle of hybrid barriers [22,24] and allows fish to effectively escape by a quick burst movement upstream [25].
The electrodes are supplied with a pulsed current and therefore create an electric field in the vicinity of the barrier in the water. Fish feel the voltage gradients of electric fields [26,27], which then trigger an avoidance reaction when they are still in a zone of lower voltage gradients [28]. Pulsed direct current is used in order to minimize the risk of injury as well as the power demand of the pulse generator unit [27,29]. Extreme reactions to the electric field and a flight reaction too far in the upstream direction may further delay the migration in downstream direction [30] and desirably have to be avoided. Therefore, the system utilizes hazard-free low voltages with a maximum of 80 V [31] and certain polarization pattern of the electrodes along the width of the bar rack [32]. The reaction to the electric field is known to be affected by several factors including the ratio of electric conductivities of the water and the fish, fish species, size and fitness [33,34,35,36]. The severity of reactions is suspected to be more pronounced for larger specimen.
A variety of ethohydraulic studies has already investigated the fish protection efficiency of the FishProtector technology in its different variants [21,22,24,37]. Small scale artificial flume testing has been conducted in recent years during day-time with a trial duration of one hour [22,24]. As the leap from a purely scientific project to an in-situ application at hydropower plants is currently undertaken, experimental parameters have to be adapted. Therefore, trial durations were increased to account for individuals lingering at the intake structures. Also, performing experiments primarily during the day so far has led to an incomplete understanding of aquatic organisms, especially since many fish show nocturnal behavior [38]. Therefore, the functionality of fish protection systems stayed unstudied for a remarkable proportion of the day. The hypothesis that the presence or absence of lighting has a significant influence on the fish protection performance of hybrid barriers is part of the investigations in the present study. It is suspected that the visual perception of these barriers increases the fish protection capabilities.
The ethohydraulic experiments conducted in the current study were performed testing reference conditions without the application of an electric field at a bar rack (sb = 50 mm, bar thickness tb = 20 mm) equipped with electrodes as well as treatment conditions with three different applied voltages (U = 80 V, ±40 V and 34 V) during the day and at night and with a trial duration between four and eight hours. Experimental retention rates representing the percentage of fish prevented from a rack passage were determined for the different conditions. Tested fish species included barbel (Barbus barbus, Linnaeus, 1758), bream (Abramis brama, Cuvier, 1817), roach (Rutilus rutilus, Linnaeus, 1758) and additionally European perch (Perca fluviatilis, Linnaeus, 1758) for certain trials.
The study aimed to investigate the functionality of the Bar Rack FishProtector in terms of (i) its experimental retention rate and the increase when an electric field is present, (ii) the temporal course of its retention rate, (iii) the impact of influencing parameters like applied voltage, fish species and size and finally (iv) differences in functionality during day and night.
2. Materials and Methods
2.1. Experimental Set-Up
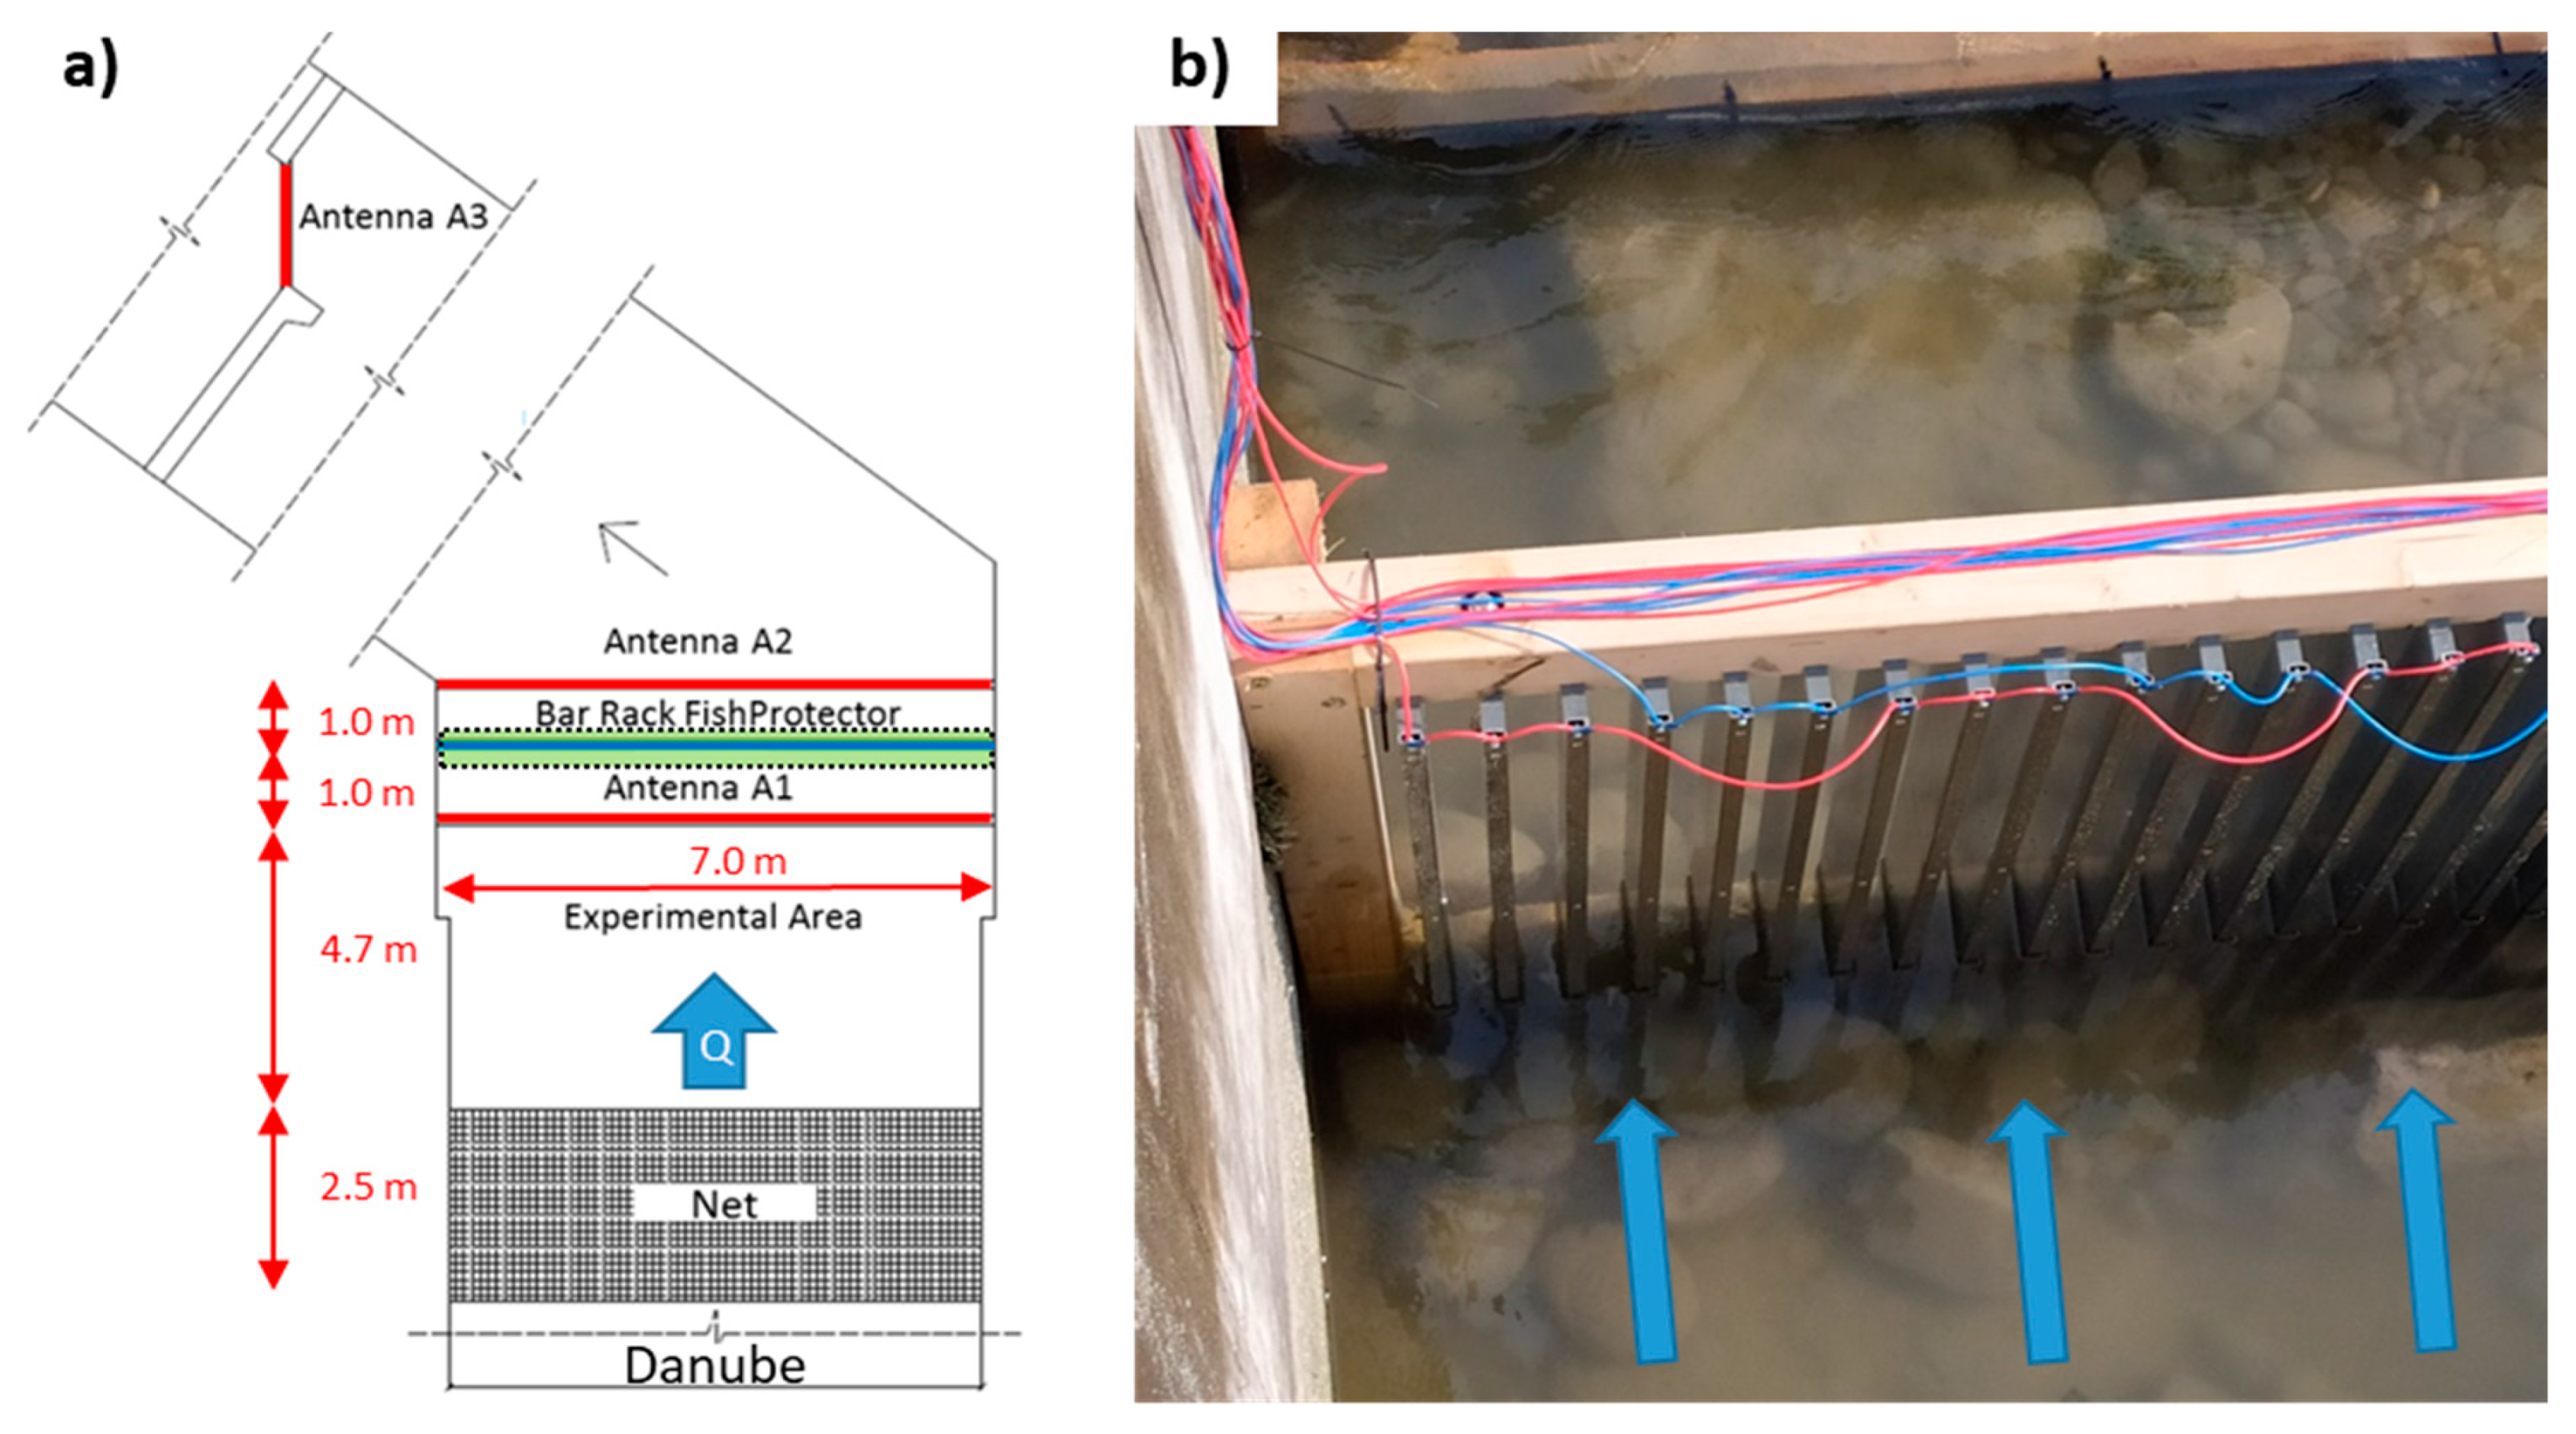
The ethohydraulic experiments were conducted in a concrete channel which diverts water from the Danube near the village of Au in Upper Austria. The experimental setup itself was located in the most upstream part of this channel, which acts as a vertical slot fishway for upstream migration at the run-of-river hydropower plant Wallsee-Mitterkirchen. The relevant part of the channel is 7 m wide and extends over a total length of more than 15 m (Figure 1a). The water depth in the test area during experiments was 0.8 m with a discharge of approximately 2.5 m3/s (representing regular operation conditions of the fishway). The channel bed consisted of artificially added large cobble stones and naturally transported gravel, sand and silt of all grain fractions.
The Bar Rack FishProtector was installed across the entire width 1 m upstream of the first corner of the channel (Figure 1a). The Bar Rack consisted of a 1 m high wooden frame housing the vertical bars (sb = 50 mm, tb = 20 mm, bar depth db = 100 mm, material PVC) and rectangular stainless-steel electrodes (cross section of 20 mm × 10 mm, Figure 1b) mounted on the upstream face of the bars using stainless steel screws. Previous numerical simulations indicated that the range, where the effective field strength in upstream direction is suspected, does not change significantly whether the material of the bar rack itself was modelled as steel or PVC. The material did seem to have an effect on the field attenuation in very close proximity to the rack and downstream the rack. Since this study focuses on the experimental retention rates, which are based on the upstream attenuation of the electric field and the fish response to that threshold, field intensity in the water upstream of the bar rack, the use of PVC and wood in this case seemed appropriate.
The electrodes were alternately connected as three anodes followed by three cathodes. The 2.5 mm2 wires were routed to the control cabinet which produced the gated burst pulse current. The gated burst pulse current consisted of sets of five pulses 0.3 ms each, with pauses of 7 ms. Sets were interrupted by pauses of 200 ms. The applied square wave pulses used voltages (U) of (i) U = 80 V, (ii) U = ± 40 V (positive pulse was instantly followed by a negative pulse) and (iii) U = 34 V. The pulses with U = ±40 V were investigated since they are suspected to minimize corrosion processes at the electrodes due to electrolysis while causing the same avoidance behavior of the fish. Prior studies showed that the different voltages (U = 80 V, U = ±40 V and U = 34 V), did not show significant differences in the fish protection capabilities and were therefore pooled as the category “electrified” here. The effective range of the electric field was measured in these prior studies in a similar setup and extended approximately 0.30 m upstream and 0.20 m downstream with U = 80 V and therefore was suspected to not affect the antennas.
The experimental area was confined impermeably for fish of all used size classes by a barrier net (10 mm, knotless, 30° angle to the horizontal) 5.7 m upstream the bar rack. No net was installed downstream of the test section so the fish passing the bar rack could freely migrate downstream.
Passive integrated transponders (PIT) were used to locate the fish. To register movements of the PIT-tagged fish, three cord antennas (Biomark Inc., Boise, Idaho, USA) were placed along the channel and mounted in wooden frames. Antenna A1 was located 1 m upstream, antenna A2 1 m downstream of the bar rack. Antenna A3 was located approximately 12 m downstream of the bar rack at the first slot of the subsequent vertical slot fishway. An IS 1001 Master Controller (Biomark Inc.) was used to log all detections. Antennas were tested in dry and submerged state.
There were five circular holding tanks (2.00 m × 0.80 m, 2500 L) on site enabling species wise keeping. These were supplied with fresh water from the bypass and were additionally oxygenated.
2.2. Tested Fish
The fish used in the experiments were chosen to represent the local fish fauna for a possible prototype facility. Therefore, barbel (Barbus barbus) was selected as an endangered model species together with the cosmopolitan species bream (Abramis brama), roach (Rutilus rutilus) and additionally European perch (Perca fluviatilis) for selected trials (due to a very limited number of available individuals). Barbels and perches were caught in the Danube, Traun and Ager close to the experimental facility. Breams and roaches were hatchery raised. The fish were implanted with 12 mm PIT-tags (Biomark Inc.) via injection below the dorsal fin for data collection, and total length (mm) and width (mm) were measured for each specimen (Table 1). PIT-tagging was chosen since it allows for a time dependent localization in the test section with relatively low impact on fish vitality [39]. No mortalities were recorded after tagging. A rest period of several days between tagging and participation in trials was ensured.
2.3. Hydraulics and Water Parameters
The approach velocities at the Bar Rack FishProtector were measured using a hydrometric wing (C31, OTT HydroMet, Kempten, Germany). The measuring profile was situated 0.15 m upstream of the barrier and consisted of 24 points. Vertically, the profiles included three points 0.10, 0.40 and 0.70 cm above the bottom of the diversion channel. The eight measuring profiles were horizontally distributed one meter apart with the outmost profiles being 0.50 m off the side boundaries.
The flow velocity in the experimental channel varied significantly across the width due to the bended geometry of the test channel with higher velocities on the left-hand boundary of the channel (Figure 2). The determined mean flow velocity was 0.43 m/s and the rheoactive velocity of the fish species in the experiments of 0.20 m/s [42] was exceeded in the entire upstream area of the rack. The critical swimming speed of the average size perch (smallest mean size included, 151 mm) lies in the range of 0.60 m/s [41] and therefore well above the average approach flow velocity and no passive drift due to exhaustion during the experiments was expected. Also, there were large cobble stones at the channel bottom and the fish could utilize those to save energy and rest.
The electrical conductivity and the temperature of the water in the diversion channel was monitored using a suitable sensor (WTW Multi 3320, Xylem, Weilheim, Germany) and recorded prior and subsequently to each test replicate. The water in the holding tanks was monitored for temperature and relative oxygen saturation. The electrical conductivity of the water during the experiments ranged from 435 μS/cm to 455 μS/cm and averaged 450 (±5) μS/cm. During the performed ethohydraulic experiments water temperature ranged from 10.4 °C to 11.2 °C and averaged of 10.8 (±0.2) °C.
2.4. Test Procedure
The experiments were performed between 14–26 October 2021, comprising 12 replicates (N = 12, Table A1). Reference conditions included two trials during the day (Nday = 2) and two during the night (Nnight = 2). The eight treatment trials with electric field activated (Nday = 6, Nnight = 2) included four with an applied voltage of U = 80 V (Nday = 3, Nnight = 1), three with U = ± 40 V (Nday = 2, Nnight = 1), and one with U = 34 V (Nday = 1, Nnight = 0). The trials were pooled according to reference or treatment (“electrified”) conditions and day or night (Table 2).
The first seven tests could be carried out over a test period of eight hours each. Due to weather and run-off conditions, there was an increased amount of leaves and flotsam transported in the water starting on October 21, 2021. This led to a strong clogging and following deformation of the barrier net. Due to the resulting difference in water level of up to 0.20 m, the duration of the remaining tests had to be limited to four hours. This decision was also made on the basis of a preliminary evaluation of the previous trials, which showed that the activity of the fish and the number of rack passages was comparatively low after a period of four hours after the start of the trials. Sunrise during the study period at the experimental facility was at around 7:30 am and sunset at around 6:00 pm.
The preparation of the tests started by closing a weir gate on the Danube side ensuring a minimum discharge in the bypass channel. Subsequently, the barrier net was positioned and the entire test facility was checked for proper functionality. In the case of tests with electrified FishProtector, it was activated before opening the weir gate and re-establishing the target discharge of 2.5 m3/s. Just prior to the start of each test run, the required fish were taken out of the holding tanks, PIT-tags were read-out and the general condition was recorded. Water temperature and electrical conductivity were documented. The fish were carefully stocked in the middle of the channel at the greatest possible distance from the (electrified) rack and the trial began. During the experiments passages through the cross-sectional areas covered by the antennas were automatically registered. After the end of the trial, the pulse generator was switched off and the net was opened to allow for all stocked fish to leave the test section. Artificial lighting was only turned on during the stocking process in night-time trials for several minutes. Light pollution in the testing area was kept to a minimum.
2.5. Data Analysis
2.5.1. PIT-Tag Data and Data Correction
The PIT-data set consisted of a continuous list including the individual ID, scan location (antenna number) and time recorded. For a general evaluation and computation of the experimental retention rates, only the first detection of each fish at the respective antenna was considered. Only stocked fish from the current trial were included and any possible residual fish from previous experiments were disregarded.
A considerable number of individuals passed antennas A1 and/or A2 without being detected. This was due to a reduced reliability of the antennas caused by their great dimensions and the fact that detection probability decreases with increasing distance [43]. Therefore, the data set has been corrected (“PIT-correction”). Individuals detected at A3 but not at A2 were also assigned to A2. Individuals detected at A2 and/or A3 but not at A1 were also assigned to A1.
These corrections were made in an attempt to represent the actual behavior of the fish as closely as possible. A temporal assignment of the corrected detections of the fish was made. Fish needed a certain time to swim from antenna A1 to A2/A3. On average, this took one and a half hours from initial detection at A1 to initial detection at A2 (359 observations) and approximately two hours from A1 to A3 (259 observations). This means that in the course of correction, fish detected at A2 were assigned to A1 one and a half hours earlier and fish detected at A3 were assigned to A1 two hours earlier.
Since a direct comparability of trials with four and eight-hour experimental duration is not justified, the longer trials were additionally reduced to four hours for the current evaluation. Cutting the PIT-corrected data does not produce a directly comparable data set due to the performed PIT-correction. For the shorter trials, PIT-correction of detections at antenna A1 is only possible up to two and a half hours after the start of the trial because no detections on A2 can be considered after four hours (end of the trial, disturbance of fish). This applies analogously to a correction by antenna A3. Therefore, all corrections of A1 by A2 were excluded after two and a half hours and corrections by A3 after two hours of evaluation time. This ensures that all twelve trials are directly comparable. All evaluations in the manuscript are based on the corrected data unless otherwise noted.
2.5.2. Participation and Activity during the Course of Trials
After the start of the trials, fish could either approach the bar rack, pass through it and migrate downstream, turn around in front of it, swim along the rack or remain inactive. It was assumed that the fish detected by antenna A1 also approached the bar rack and therefore “participated” in the experiment. The participation rate (PR) in this context was defined as the ratio of fish that approached the rack at least once into the area downstream of antenna A1 over the total number of fish stocked in the trial (Equation (1)).
An additional evaluation of the first detection every minute (minute wise detections, max. 60 detections per hour possible) at antenna A1 was performed to compare the activity during different trials and to facilitate comparisons of day and night-time activity levels. The interval of one minute was chosen arbitrarily. A sensitivity analysis showed no major differences in the results whether the interval was set to 30 s or two minutes.
2.5.3. Experimental Retention Rate—Overview and Definition
The number of degrees of freedom, more specifically the options for fish movement, in the current study were limited to one, namely rack passage and migration into the tailwater. Therefore, there was no coherent definition of a fish protection rate as used in other studies. Instead, the experimental retention rate (eRRt) was established and computed as the ratio of fish remaining in the headwater of the bar rack after a certain time. Thus, the eRRt depends on the parameters (i) reference number of fish, (ii) number of fish which passed through the rack downstream and (iii) time. The reference number of fish was initially defined as the number of participating fish (detections antenna A1) as describe in Section 2.5.2. Since the detection accuracy of the antennas was limited, the number of participating fish as quotient for the computation of the eRRt represents a lower limit. Consequently, the computation of the eRRt using the number of stocked individuals in the trial represents an upper boundary. Time also plays a key role as with increasing experimental duration, more and more fish would finally pass the rack downstream and was introduced in the analysis as the evaluation duration t [min].
After stocking the fish, it was observed that the activity of the fish (detections A1, minute wise) and the number of individuals passing through the bar rack downstream was very high. To account for the potential influence of either stress-induced initial escape reactions or exploration behavior after stocking on the experimental retention rate (missing acclimatization), the evaluation period of four hours was reduced by exclusion of the first experimental hour for an additional evaluation. In doing so, the reference number of fish (detected participants or stocked fish) was reduced by the number of rack passages during the first hour of the trials.
Consequently, the study includes four definitions of the eRRt depending on the reference number of fish and either consideration or exclusion of initial effects (Table 3).
The time dependent experimental retention rate eRRt based on the number of participating fish (Antenna A1) without exclusion of initial effects was defined as
with ∑ Fish, participating = Number of fish detected at antenna A1 after PIT-correction during the first four hours of the trial, ∑ Detections A2t = Sum of initial detections at antenna A2 after PIT-correction during the considered time interval (start of trial to t min, equivalent to the number of rack passages) and t = Evaluation duration [min] on which the experimental retention rate is based on.
The time dependent experimental retention rate based on the number of stocked fish without exclusion of initial effects was defined as
with ∑ Fish, stocked = Number of fish stocked for the trial.
The time dependent experimental retention rate based on the number of participating fish (Antenna A1) with exclusion of initial effects was defined as
with = Number of fish detected at antenna A1 after PIT-correction during the first four hours of the trial minus the number of fish which passed through the bar rack during the first hour of the trial (Detections A2), = Sum of first detections at antenna A2 after PIT-correction during the considered time interval (one hour after start of the trial until t min after that).
The time dependent experimental retention rate based on the number of stocked fish with exclusion of initial effects was defined as
with = Number of fish stocked for the trial minus the number of fish passed through the bar rack during the first hour of the trial (detections A2).
The abovementioned initial effects caused by stress due to handling or initial exploration behavior and the long experimental durations of several hours resulting in many approaches and hence passage attempts would most certainly not occur at a real water intake due to a greater number of degrees of freedom for fish movement (no closed confinement, multitude of alternative corridors). Also, at in-situ applications fish would presumably approach the barrier a single time, possible several times before choosing an alternative migration corridor and not linger for an extended period of time. This gave reason for utilizing the experimental retention rate based on the number of stocked fish with exclusion of initial effects and limited to a 60-min interval () when a transfer of the obtained results to a real-life application is intended. Therefore, further species and length specific as well as statistical analysis were performed using the . Statistical analysis was additionally performed using the experimental retention rates for two hours () and three hours () to account for the temporal development of fish protection.
The effect of fish length and species (barbel, bream and roach) on the experimental retention rates was quantified using the three size classes 100–200 mm, 200–300 mm and 300–400 mm. The mean species-specific experimental retention rates of the size classes were determined based on the number of fish stocked in the trials and up to one hour after the start of evaluation with exclusion of the initial effects () pooled for all reference trials and trials with electric field present. Perches were excluded from the analysis due to the small sample sizes.
2.5.4. Statistical Analysis—χ2-Test
The Pearson’s χ2-test was used to investigate a correlation between the experimental retention rates ( to ) and the different treatment conditions. Each fish could either pass (y = 1) or not pass (y = 0) the rack. Consequently, each fish represented one row in the data set. Additionally, the χ2-test was used to investigate whether the application of an electric field had a greater influence on the eRRt during the day or during the night. A two-sided error probability of p = 0.05 was applied. Significance was assumed when the p value was less than 0.05 (* p < 0.05, ** p < 0.01, and *** p < 0.001). Fisher’s exact test was used to test the influence by calculating the effect size (φ and Cramer’s V, [44]). An effect size was assumed weak if φ or V = 0.1, medium if φ or V = 0.3, and strong if φ or V = 0.5 [44]. All calculations were performed using SPSS, version 24.
2.5.5. Statistical Analysis—Binary Logistic Regression
In order to quantify the influences of several independent variables (treatment condition, time of day, fish species and fish length) on the probability of a rack passage (conversely, the influence on the experimental retention rate), a logistic regression model was used since the dependent variable (y, rack passage) had a binary outcome (y = 0: no passage, y = 1: rack passage, [45]). The probability of a rack passage P(y = 1) was calculated as
where, z is the logit, which is composed of the regression coefficients and the expressions of the individual predictors (independent variables).
where xk = independent variable/predictor, βk = regression coefficient for variable k and ε = error term.
The position (upstream or downstream of the bar rack) of each fish after the end of the evaluation period was used as input for the model. The independent categorical variables “treatment condition”, ”time of day” and “fish species” (reference categories were: electrified, day and roach) and the continuous variable “fish length” were introduced as independent parameters xi. All treatment conditions with electric field present were pooled in the class “electrified”. Goodness-of-fit was assessed using the Hosmer-Lemeshow-Test.
The logistic regression was expressed via the odds ratios (Exp(β)) which was calculated for each independent variable. The odds ratio represented the change of the relative probability P(y = 1) when the independent variable was increased by one increment if all other variables were kept constant. Also, the effect size could be determined from Exp(β) with a weak effect size if Exp(β) = 1.5–2.0, medium effect size if Exp(β) = 3.0–3.5 and large effect size if Exp(β) = 4.0–7.0 [46]. The binary logistic regression calculation was performed in SPSS, version 24.
3. Results
3.1. Participation and Fish Activity
Participation rates during the night considering all species within the first four hours of reference trials averaged 90% and decreased slightly to 85% for trials with electric field present. Participation rates during the day were generally lower (reference: 69%, electrified: 77%). Figure 3 shows the species-specific average participation rates for the four parameter combinations of treatment condition and time of day. During the night-time trials, barbel, bream and roach represented the interspecies average well while perch fell below that (not included in reference trials). The participation rates of barbel and perch in reference trials during the day differed notably, being sub-standardly active or detected. It has to be mentioned that the number of stocked barbels and perches lied well below the number of stocked breams and roaches. When considering the trials with electric field present during the day, roaches showed outstanding participation compared to the other species.
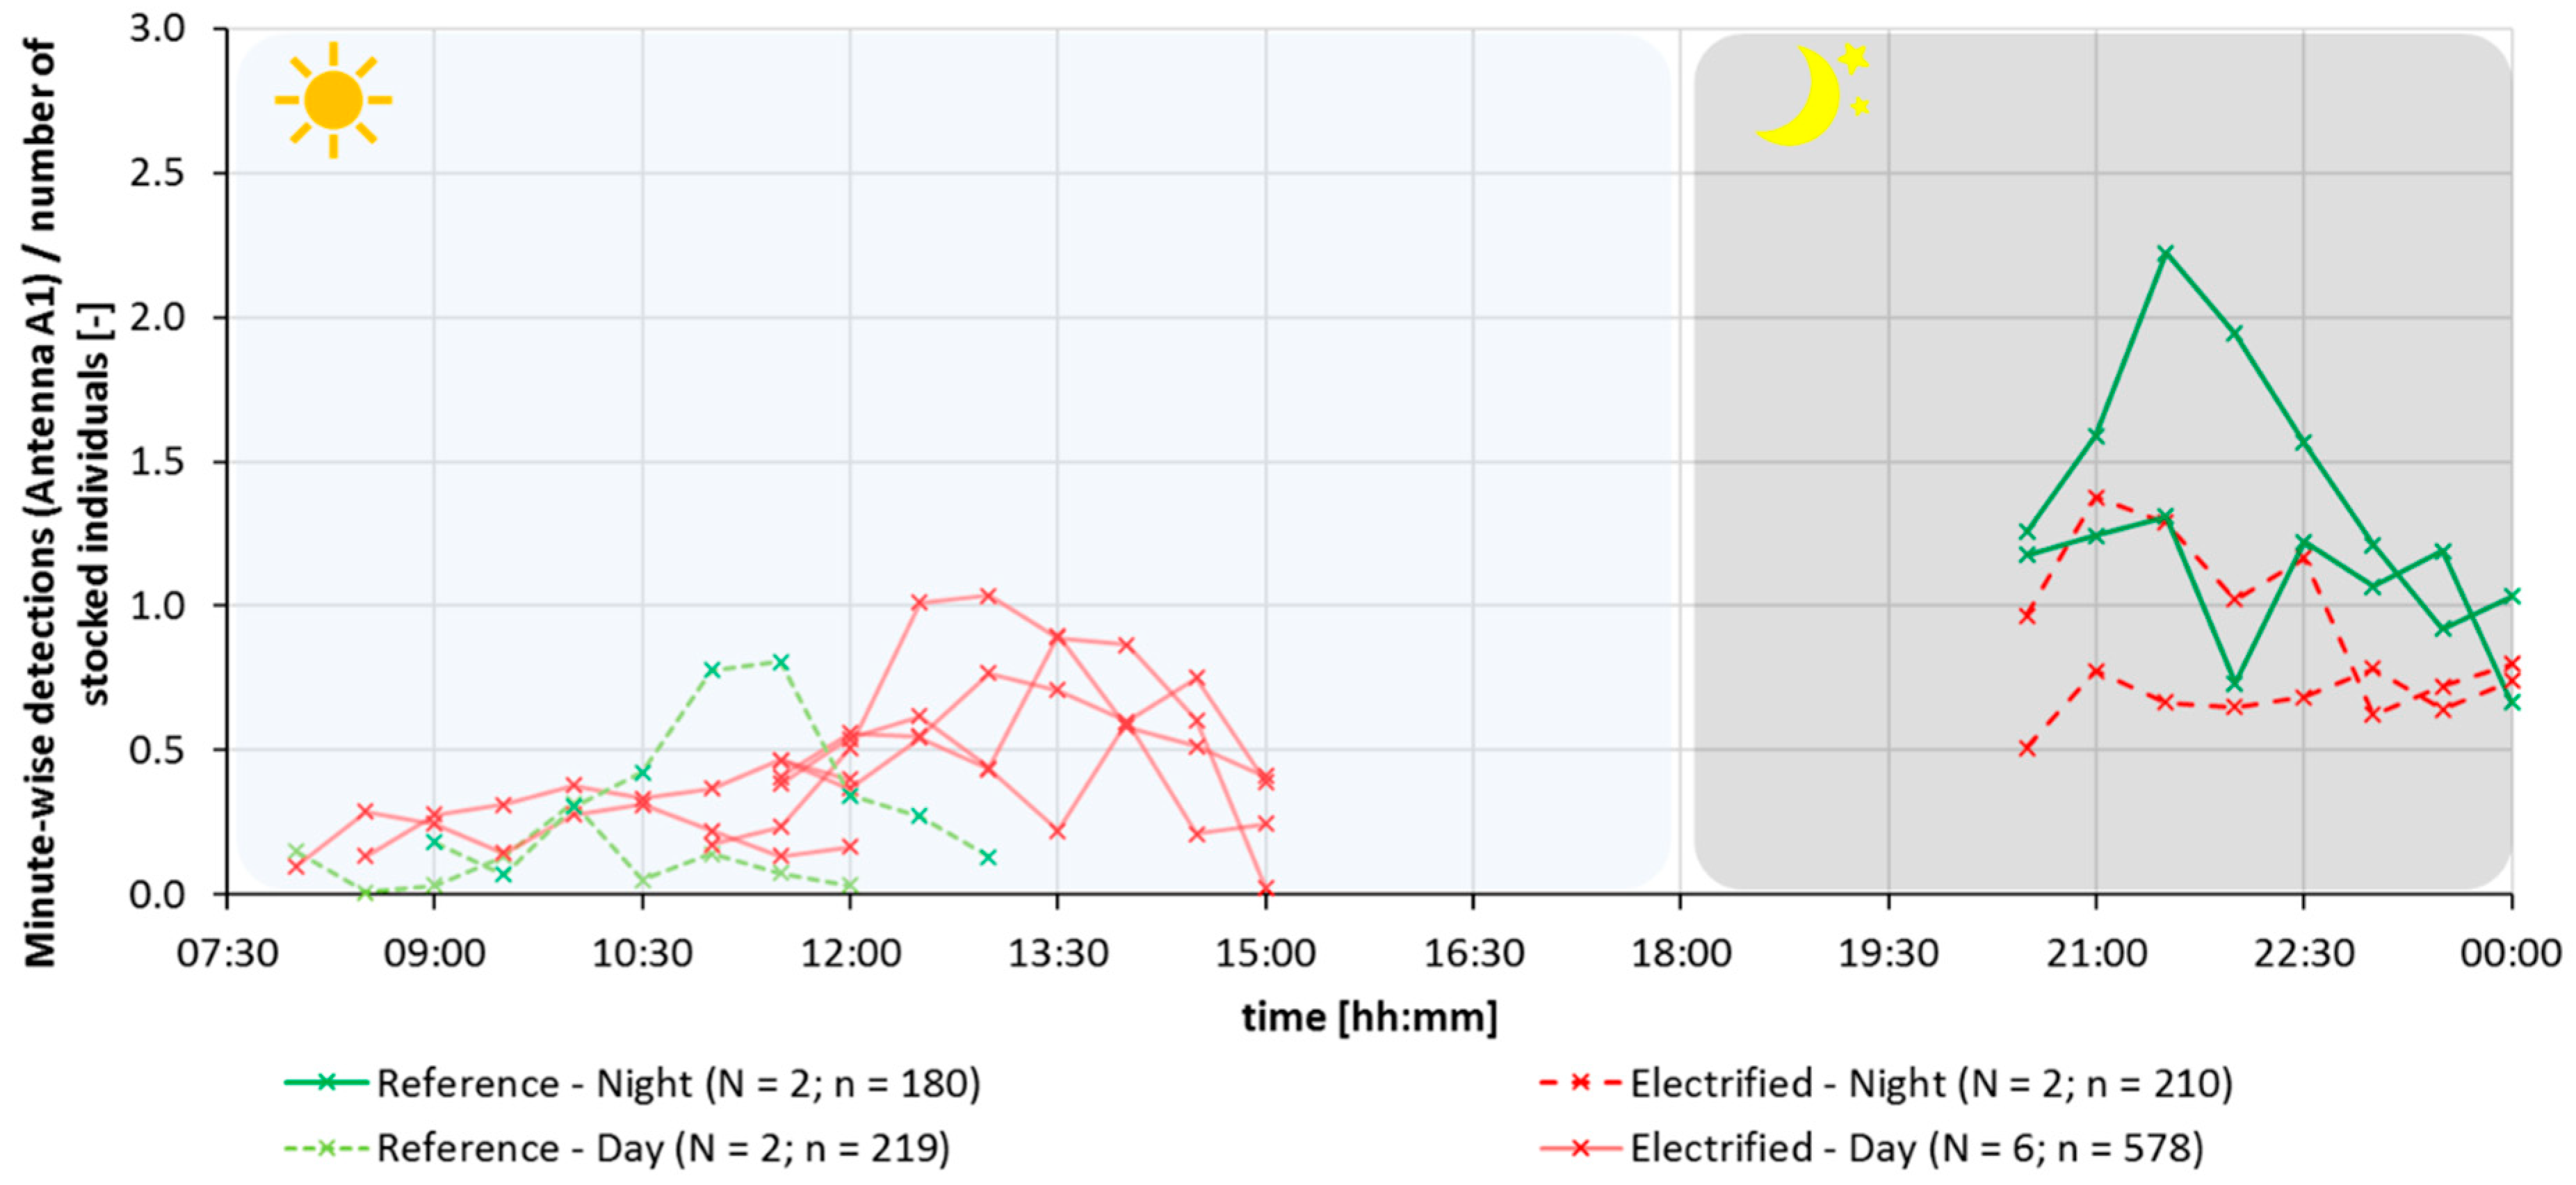
Figure 4 shows the minute wise detections at antenna A1 divided by the number of stocked fish per trial (standardization) plotted over time during individual trials (data points in 30-min intervals) including all four investigated species. Reference trials are plotted in green, trials with electric field present in red. The activity during night-time trials was notably higher than during day-time trials with a distinct peak during one reference trial. Activity at night peaked after approximately one to one and a half hours after start of the trials. During the day-time trials, activity did not peak until approximately two and a half hours into the trials. There was no indication of the participating individuals to entirely stop moving within the experimental area after a certain amount of time and activity was maintained for even longer periods than included in the graphic (eight-hour trials). No major deviation of activity could be identified in individual test runs.
A species-specific evaluation revealed that the interspecies activity shown in Figure 4 represents the activity of barbels, breams and roach relatively well in all trials. Perches were only active during the first half hour of the single night-time trial conducted with them and stayed inactive for the remainder of the trial.
3.2. Experimental Retention Rates
3.2.1. Interspecies Experimental Retention Rates
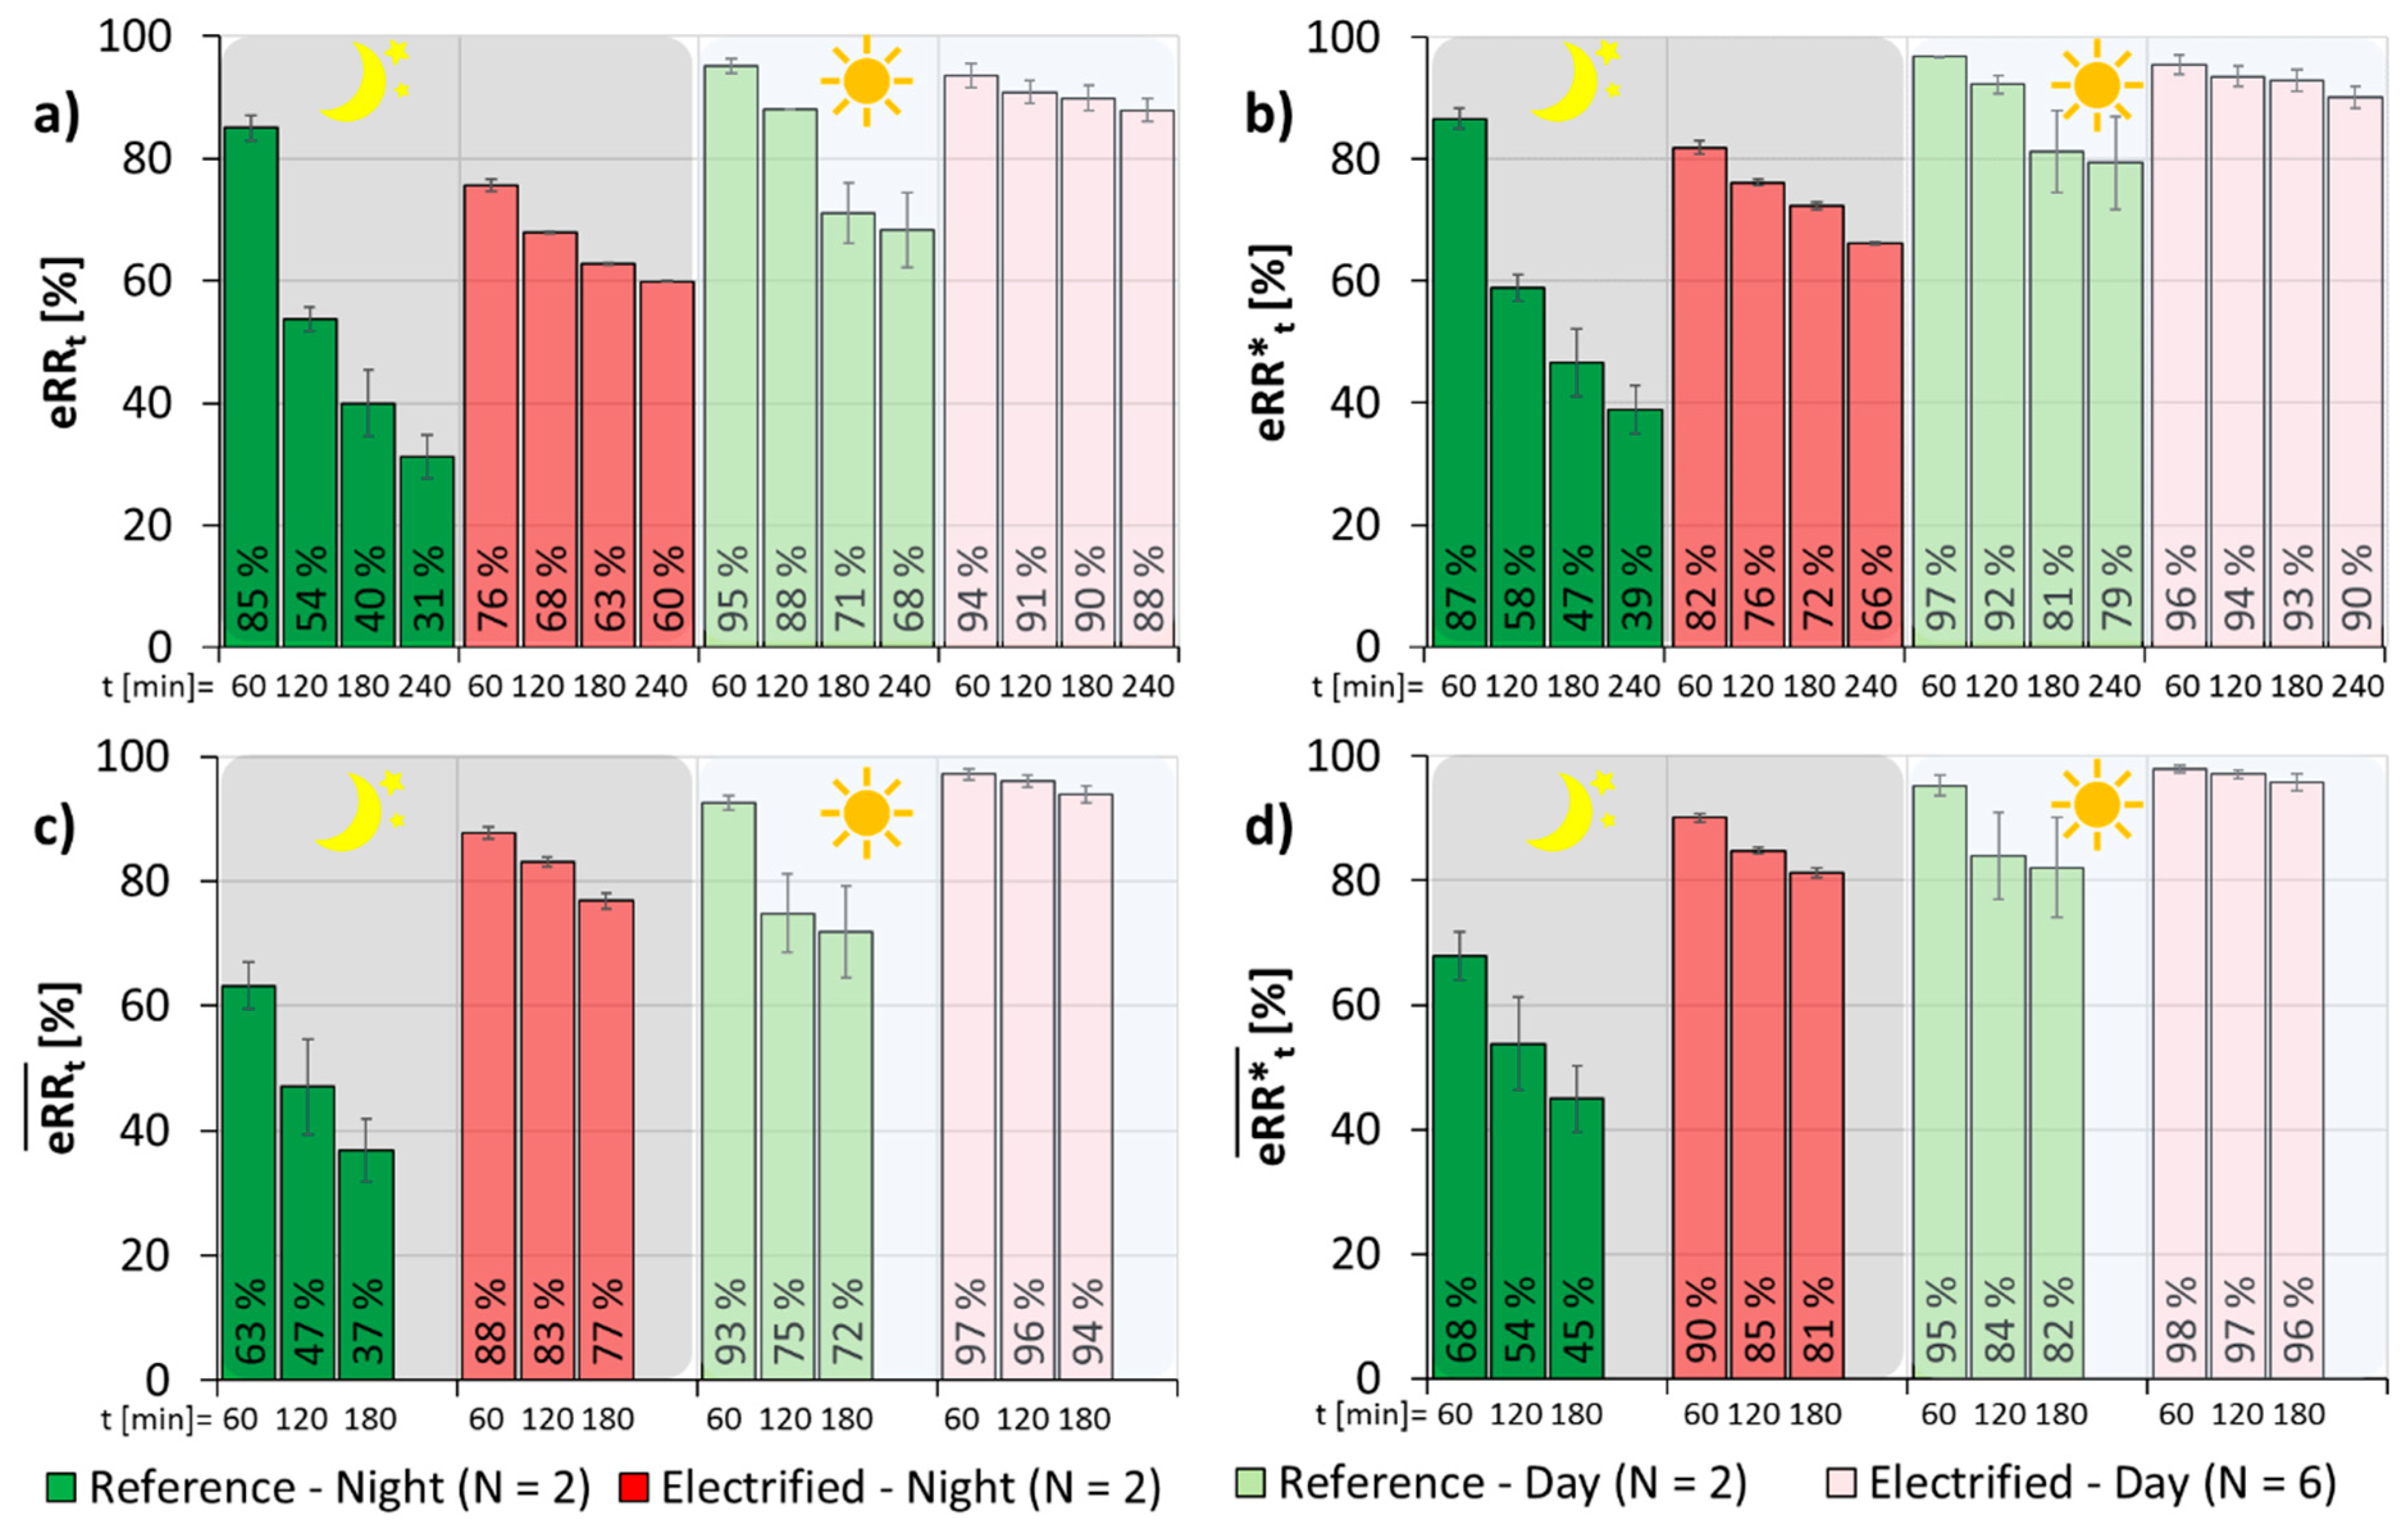
Generally, the experimental retention rates were lower for reference conditions than for treatment conditions, lower during the night than during the day and decreased with increasing duration of the trials (Figure 5). The experimental retention rate decreased more slowly during trials with electric field present, both during the day and during night-time trials. The scatter of the retention rate is lower for all treatment conditions.
Figure 5a shows the time dependent experimental retention rates based on the number of participating fish without exclusion of initial effects . During the night, the was lower within the first hour of the trials for the electrified setups (76%) as compared to the reference (85%).
This effect was reversed starting from the second hour within the experiments and was most pronounced after four hours (reference 31% and treatment 60%). The same applies for the day-time trials where the experimental retention rate during the first hour of reference trials averaged 95% while it was 94% with electrification of the bar rack. Also, here the retention rate of the treatment conditions succeeded the one of the reference clearly starting from the second hour (reference 68% and treatment 88% after four hours). The same logic, but with generally slightly increased retention rates, applies for an analysis referring to the number of stocked fish instead of the number of participating fish in each trial (Figure 5b).
Due to great activity and a drastically increased number of rack passage within the first hour of the trials, an additional evaluation with exclusion of these initial effects (Section 2.5.3) was performed. Figure 5 c shows the experimental retention rates based on the number of participating fish with exclusion of initial effects . Here, the experimental retention rate for treatment conditions lay above the one during reference trials which applied for both day and night-time trials. After the first hour of the trials at night, the experimental retention rates averaged 63% during reference trials and 88% during trials with electric field present. This effect became more pronounced with increasing experimental duration (reference 37% and treatment 77% after three hours). During the day, the was generally higher than at night. With the application of the electric field it could be increased from 93% (reference) to 97% after the first hour. After three hours the retention rate was increased from 72% (reference) to 94% with electrification.
The same applied with slightly increased retention rates when referring to the number of stocked fish and computation of the . Here, the initial retention rate for the reference trials of 68% at night and 95% during the day after the first hour could be increased to 90% and 98% respectively by the application of an electric field. This increase was even more pronounced after three hours with an experimental retention rate in reference trials of 45% at night and 82% during the day to 81% and 96% in treatments.
3.2.2. Species- and Size-Specific Experimental Retention Rates
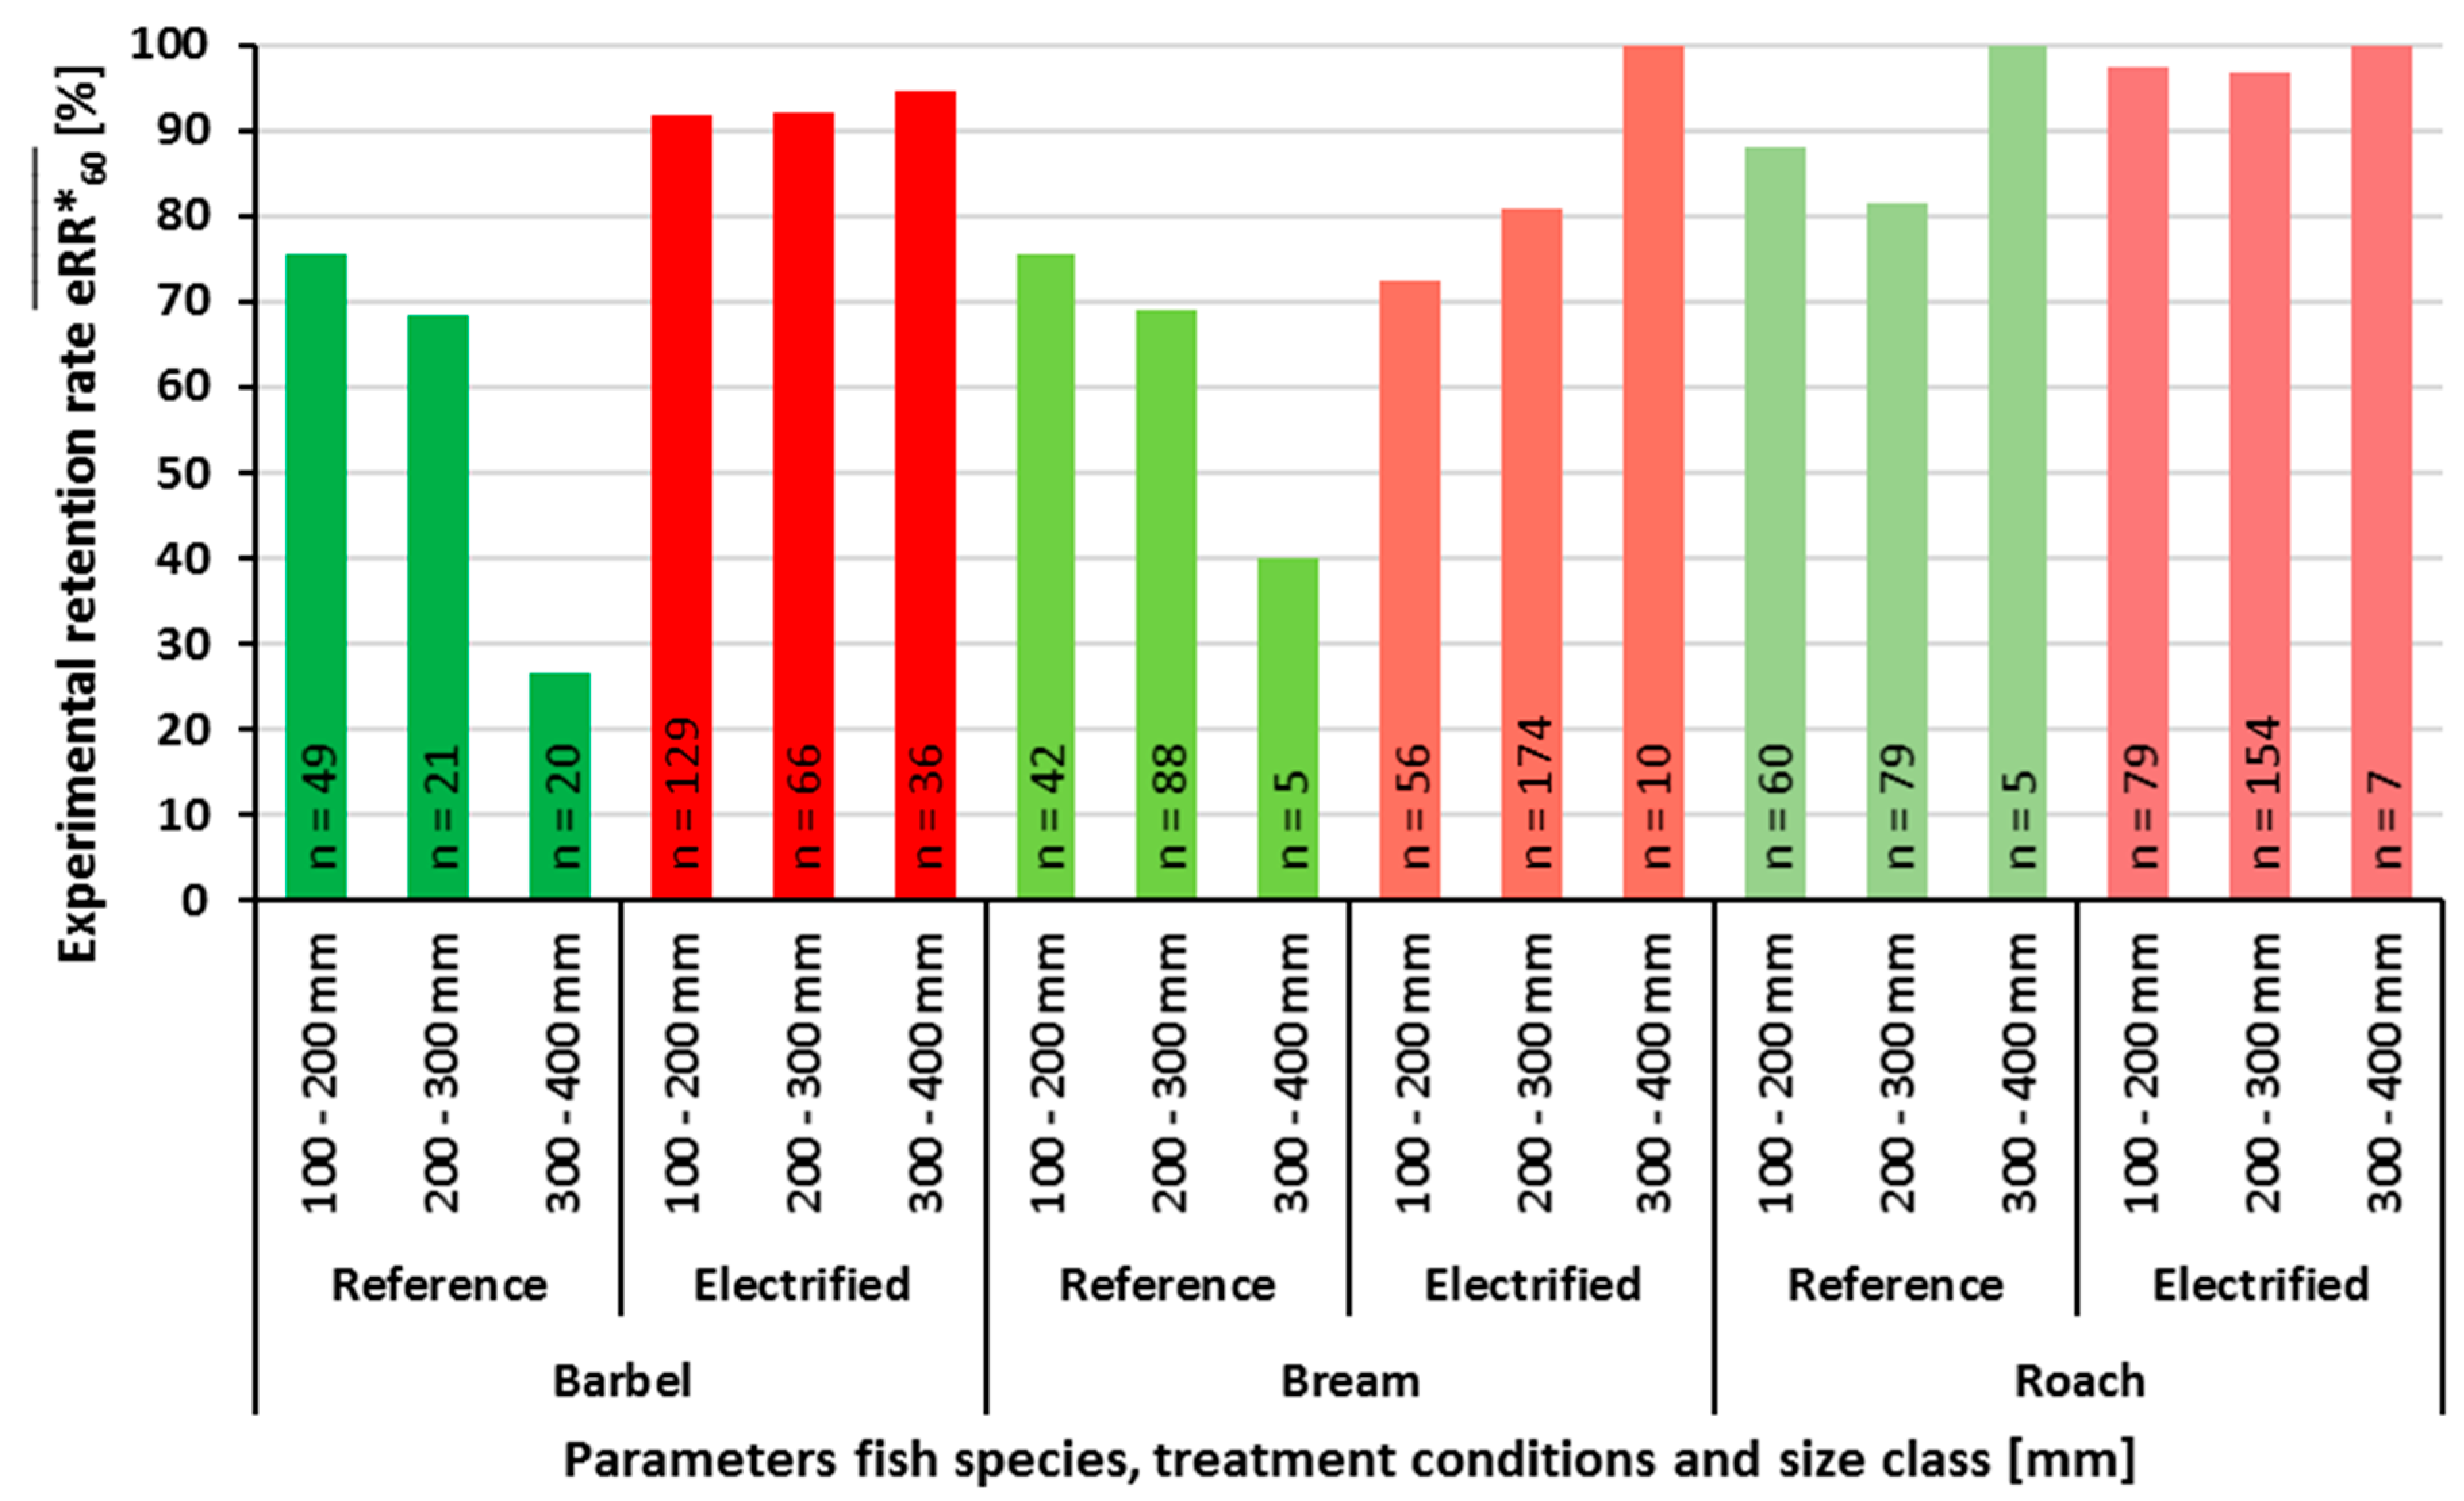
During reference trials, it seemed that smaller barbels and breams of the size classes 100–200 mm and 200–300 mm were prevented more effectively from a rack passage than the size class 300–400 mm with questionable validity for bream due to a minor sample size (n = 5, Figure 6).
This implied higher passage probability of larger individuals. Roaches passed the bar rack less frequently in reference conditions compared to barbels and breams with no passages in the large size class 300–400 mm (small sample size, n = 5). No clear trend could be identified across species in reference conditions. In treatment conditions with electric field present, the retention rates were consistently high and increased slightly with fish size for barbels and roaches while this effect was even more distinct for breams. For roaches the average experimental retention rates for all three size classes during reference and treatment conditions were higher compared to barbel and bream.
3.2.3. Statistical Analysis
Χ2-tests were used for a comparison of the experimental retention rates of the reference and treatment conditions based on the number of stocked fish during the first one, two and three hours of evaluation with exclusion of initial effects (, and ). The global test was able to identify a significant correlation between the presence of an electric field and the experimental retention rates with moderate effect sizes (p < 0.001, Φ/Cramer-V 0.291 to 0.389, Table 4) with effect sizes increasing with the evaluation time. Local tests comparing the reference to the different applied voltages showed a significant influence of the electric field present on the experimental retention rates in all considered cases with moderate effect sizes (p < 0.001, Φ/Cramer-V 0.218 to 0.367). A comparison of the different applied voltages revealed no significant differences (0.085 ≤ p ≤ 0.773). Therefore, pooling of the treatment conditions with different applied voltages in the category “electrified” seemed appropriate.
Table 5 shows that in both cases (night-time and day-time) there is a significant effect of the application of an electric field on the experimental retention rate with the exception of the 60-min evaluation period during the day, (p = 0.06). During the day, the effect sizes were in the range of weak to medium (0.102 ≤ Φ ≤ 0.258) whereas for trials conducted during night the effect sizes ranged from medium to strong (0.429 ≤ Φ ≤ 0.503) with effect sizes increasing with the duration. This confirms the stronger influence of the electric field on the experimental retention rate at night compared to during the day. The binomial regression model showed that the rack passage probability during trials with the reference setup (no application of an electric field) was significantly increased with large effect sizes for evaluation durations of one, two and three hours (each β ≥ 2.102, p < 0.001, Exp(β) ≥ 8.186, Table 6). This was also the case for experiments conducted during the night (each β ≥ 1.538, p < 0.001, Exp(β) ≥ 4.655) as compared to trials conducted during the day. According to the model, the species barbel, bream and perch showed a tendency of higher rack passage probability than roach for all three evaluation durations while a significant influence could only be identified for bream for all three evaluation durations and perch within the first hour (p < 0.05). A slightly significant increase of rack passage probability with increasing fish length could only be identified within the first hour of evaluation (β = 0.005, p = 0.030, Exp(β) = 1.005) which disappears with prolonged experimental duration.
4. Discussion
4.1. Participation and Fish Activity
Interspecies participation rates were generally high and therefore provided a basis for further statistical analysis (Section 3.1, Figure 3). They were higher during the night-time trials than during the day and remained on a constant level during night-time trials for reference and treatment conditions and for all species. During the day-time trials the recorded participation of the different species deviated notably without any clear trends for certain species.
The utilization of the PIT-corrected initial detections at antenna A1 for the computation of the participation rate has to be interpreted as a lower boundary since fish can pass the antenna and approach the FishProtector without being detected. Failures of detections may occur when larger swarms pass the antenna simultaneously. The participation rate does by definition (Section 2.5.2) not allow for statements about the activity of the fish.
The recorded fish activity (minute-wise detections at antenna A1 divided by number of stocked individuals, Section 2.5.2) was highest during midday for day-time trials and around 10:00 p.m. during night-time trials (Section 3.1, Figure 4). Overall, the recorded activity was highest during the night indicating an increased importance of functional fish protection measures at water intakes during the night. The day-time of highest activity, feeding and migration activities depends strongly on factors like species, developmental stage, habitat conditions and location [47]. Downstream movement at HPPs has been recorded in recent studies to be significantly higher for the investigated species in autumn and at night in a diurnal consideration [48]. The current study also found slightly increased activity patterns during the night for barbel, bream and roach.
The decrease of activity in the course of trials also depends on the number of rack passages. Fish having passed the bar rack downstream cannot further contribute to the number of minute-wise detections at antenna A1. Therefore, the activity has to be assumed higher than illustrated in Figure 4 depending on the number of occurred passages which is particularly the case for reference trials, especially during the night. Therefore, the peak activity during the night is presumably even higher.
The species-specific activity was in good accordance with the interspecies activity with exception of perches which were only active during the first half hour of the night-time trial and subsequently stayed either inactive or have already passed through the Bar Rack FishProtector downstream and therefore could not be detected at antenna A1 anymore. It has to be mentioned that this statement is not to be considered as generally valid due to the minor sample size (N = 1, n = 30, Figure 3). This is in accordance with perches representing predators hunting visually and thus being mainly inactive during the night [49]. Generally, downstream movement takes place primarily during the night and in autumn [48] which may be caused by minimizing the risk of predation if the predators are hunting visually [6]. Studies in England found that barbel tend to migrate downstream in autumn with peaks of activity in the early morning and late in the evening [50]. Still, downstream movement behavior may vary for different rivers when comparing the same species [48] and therefore is also a site-specific parameter.
4.2. Experimental Retention Rates
The evaluation of the experimental retention rate based on the number of participating fish without exclusion of initial effects (eRRt) revealed that within the first hour of the trials it is slightly lower for the treatment conditions compared to reference conditions (Section 3.2.1, Figure 5). This effect is clearly reversed when the evaluation excludes initial effects (stress from handling and stocking, ) and decisively increases with the experimental duration implying greater long term fish protection potential by the application of an electric field. This also indicates the importance of acclimatization period in ethohydraulic investigations.
The lower retention rates within the first hour also imply a greater number of rack passages in treatments with an electric field present. Presumably, the orientation of the fish is essential to the deterring effect and the direction of the flight response when approaching the electrified hybrid barrier. When the fish enters the electric field and the field intensity rises above the threshold value triggering a reaction, the fish will most certainly accelerate maintaining its current orientation. If the direction of the field source cannot be localized, the current direction will be maintained. This implies that if the fish is moving downstream in negative rheotaxis and approaches the Bar Rack FishProtector rapidly (potentially caused by stress due to handling), an escape in the “wrong” (downstream) direction may occur. This has also been visually observed in prior studies [22] and may explain an increased number of rack passages within the first hour of the trials.
Retention rates are higher during the day for reference and treatment conditions as compared to the trials conducted during night-time. This may partly be due to generally lower activity and therefore also reduced searching behavior, feeding and migration activity of the investigated species during the day (Section 3.1). Additionally, the visual perception of the barrier is suspected to play a major role in the fish protection efficiency of this system. Prior studies have shown that fish approaching the FishProtector during day light orient themselves rheotactically positive approximately 0.50 m upstream the barrier indicating clear visual perception [22,37]. This perception may be enough to prevent a passage in reference configuration where the fish might analyze the bar rack thigmotactically (scanning it with their caudal fin, as described by Albayrak et al. [51] and Beck et al. [18]). Within treatment conditions, positive rheotaxis is suspected to be crucial for a flight reaction in the right direction (upstream in the case of a barrier intended to prevent downstream passage) when the fish enters the electric field and the response triggering stimulus is exceeded. Recent studies found a significant positive relation between turbidity, which directly impacts visibility of barriers, and the number of downstream moving fish at HPPs [48].
Prior studies have shown that fish moving in schools approaching the hybrid barrier react according to the reaction of single individuals [22]. Therefore, rack passage at hybrid barriers is suspected to be reduced if more fish (greater schools) are still upstream the barrier which is generally the case for social or schooling species as opposed to solitary fish species.
The current study also aims at a transferability of the obtained experimental retention rates to in-situ applications. The experimental setup in this investigation implies several decisive constrictions. Spatially, only one option remains for fish movement which is downstream requiring a rack passage which will not be the case at most real-life intake structures. The duration fish are inevitably confronted with the barrier (several hours in the trials with often numerous approaches and passage attempts) is also to be considered an extreme premise.
The following considerations are related to the experimental retention rates based on the number of stocked fish in the trials with exclusion of initial effects (, Section 2.5.3).
Generally, the application of an electric field was able to significantly improve the experimental retention rates with exclusion of initial effects for evaluation durations of one, two and three hours with medium effect sizes (Section 3.2.3, p < 0.001, 0.228 < Φ < 0.367). No significant correlation could be identified for the different applied voltages (0.054 < p < 0.773) which justifies pooling all three applied voltages in the category “electrified”. This may also give reason for future systematic investigations of the applied voltage of ± 40 V in order to minimize the necessary voltage magnitude and subsequent corrosion effects.
A size- and species-specific evaluation of the experimental retention rates based on the number of stocked fish with exclusion of initial effects and an evaluation duration of one hour (, Section 2.5.3) revealed a slight indication of fish length influencing the retention rate. For barbel and bream the size class 300–400 mm passed the barrier more frequently in reference conditions with questionable validity due to meagre sample sizes (nbarbel 300–400 mm = 20, nbream 300–400 mm = 5). This finding could be verified by the statistical analysis where a binomial regression analysis showed a slightly significant influence of the continuous variable fish length on the rack passage probability within the first hour (β = 0.005, p = 0.030). Within an evaluation of the second and third hour of the evaluation this correlation disappeared. Therefore, it is assumed that fish length has no influence on the long term retention capability of the Bar Rack FishProtector.
When considering the improvement of the experimental retention rates based on the number of stocked fish and with exclusion of initial effects, the improvement of the experimental retention rates after one hour is significant at night but not during day-time trials (, pnight < 0.001, pday = 0.060) with moderate effect size (Φ = 0.429). After two and three hours the improvement of the experimental retention rate due to the application of the electric field becomes significant for both day and night-time trials (: pnight < 0.001, pday < 0.001) with moderate effect size during the day and high effect size during the night (: Φday = 0.241, Φnight = 0.503). Consequently, the Bar Rack FishProtector can be considered to significantly improve long term retention of fish being particularly beneficial for fish protection at water intakes during the night-time with low average flow velocities (0.43 m/s in the current study).
4.3. Limitations and Recommendations
Comparing the current to prior studies, the increased duration of the trials and the conduction of night-time trials represent a major improvement in the methodology. Still, for future research the authors recommend conduction of 24 h-trials starting at different times of the day instead of four to eight hour trials split up into day and night-time trials to allow for a continuous monitoring of fish activity and behavior patterns. This would preferably be the case with naturally occurring fish and a non-invasive monitoring methodology like sonar investigations.
The conduction of night-time trials supported the findings of earlier studies stating that the visual perception of the hybrid barrier takes a major role in the functionality of the Bar Rack FishProtector [22]. If the visual perception of the hybrid barrier is considered to be a key element in its functionality, increasing the perceptibility by short-distance artificial lighting might be considered as an option in very specific cases. But artificial lighting is suspected to rather attract certain fish species [52] and therefore most certainly corrupting the purpose of the system.
The flow velocity was in the range of 0.43 m/s and is low when compared to many real-life intake racks. Therefore, a general transferability of the obtained results has to be handled with care. It is recommended to conduct further studies under several different flow regimes, also with increased flow velocities. It has to be mentioned, that a proper functionality of hybrid barriers is known to be limited to facilities with lower flow velocities [27].
Racks and screens intended to prevent fish from turbine passage may themselves have a negative impact like impingement or abrasion if improperly installed [53]. In the present experimental setup, no rack parallel, so-called sweeping velocity component was present [20]. It is commonly known that fish guidance is limited when structures are oriented perpendicular to the main flow [54]. When the Bar Rack FishProtector is used as a barrier preventing turbine passage, but at the same time oriented in a horizontal angle to the main flow direction it may be utilized for guiding the fish [22,55]. A bottom overlay may further increase the guiding effect since the fish were found to be rather bottom oriented as confirmed by the findings of similar studies [56,57].
The rack bars in the current study were constructed using PVC and the frame consisted of wood. Previous numerical simulations showed a negligible deviation of the effective upstream electric field attenuation when performing the simulation with PVC or steel rack bars. This was not the case for the field intensities in close proximity to the bar rack and slightly downstream of it.
In-situ applications could be realized using screwed connections with dowels fixated with epoxy resin and an insulation layer spanning the entire connection face of electrode and rack bar (e.g., insulating coating or electrical tape). Alternatively, a connection between electrode and rack bar only using resin bonding, preferably with a milled tongue and groove joint could represent feasible options.
In order to extend the understanding of fish reactions to hybrid barriers, further studies are strongly advised. Three-dimensional radio telemetry or the use of sonar video cameras might offer further insight into the fish’s behavior in close proximity to the barrier and facilitate deeper understanding.
The current experimental setup was strictly limited to one degree of freedom concerning the spatial movements of fish, namely downstream passing through the FishProtector and this confinement was sustained for a prolonged period of time possibly exceeding the time spent at a real-life application. Thus, the experimental retention rates acquired in this study could be interpreted as a lower boundary of retention rates expected at real life intakes.
5. Conclusions
The present study aimed to investigate multiple aspects of a hybrid fish protection barrier at water intakes, the Bar Rack FishProtector. This system enhances the mechanical barrier of a simple bar rack by the application of an electric field in the water. This field expands around supplementary electrodes mounted to the bars creating the additional behavioral barrier. The essential results of the conducted ethohydraulic experiments are the following:
- The application of an electric field at the upstream side of a bar rack increases long term experimental retention rates of fish significantly and therefore reduces the number of rack passages.
- The basic fish protection effect (mechanical barrier) of non-electrified racks is significantly higher during the day than at night.
- The experimental retention rates during the trials decrease notably faster for reference conditions compared to treatments with electric field present for increasing trial duration.
- The reduction of rack passages by the application of the electric field for longer durations are valid during the day and at night with an even more pronounced effect during the night.
- No significant length dependency of the retention rates could be found. Therefore, the FishProtector is considered to be suitable as a barrier for fish of all size classes.
- These findings are true across species, as well as species-specific, although some differences between species were found during the first hour of trials. It became clear that of the species studied, roach tended to be retained best, followed by bream, barbel and perch.
Even though the current study facilitated comprehensive insights in the functionality and efficiency of the hybrid barrier, further investigations eradicating the present limitations and shortcomings are recommended. Despite these limitations, it is already clear that equipping a bar rack with electrodes significantly improves its fish protection effect. The system can already be recommended for use in practice. Therefore, extensive monitoring, preferably utilizing non-invasive methods and naturally occurring fish fauna at a pilot site have to be favored.
Author Contributions
Conceptualization, J.H., C.F., M.A. and B.B.; methodology, J.H., C.F., M.A. and B.B.; software, J.H.; validation, J.H., C.F., M.A. and B.B.; formal analysis, J.H. and M.A.; investigation, J.H.; resources, M.A. and B.B.; data curation, J.H.; writing—original draft preparation, J.H.; writing—review and editing, J.H., C.F., M.A. and B.B.; visualization, J.H.; supervision, M.A. and B.B.; project administration, M.A. and B.B.; funding acquisition, M.A. and B.B. All authors have read and agreed to the published version of the manuscript.
Funding
The current research has been funded by a research cooperation between UIBK and Verbund AG.
Data Availability Statement
The data presented are available upon request from the authors.
Acknowledgments
The authors would like to thank the Machlanddamm GmbH for their kind support in providing the experimental facility at the Danube river and their dedicated employees assisting during the entire duration of the project.
Conflicts of Interest
The Authors declare no conflict of interest.
Abbreviations
| sb | Clear spacing between rack bars [mm] |
| tb | Thickness of the rack bars [mm] |
| db | Bar depth [mm] |
| U | Applied voltage [V] |
| PIT | Passive integrated transponder |
| std. dev. | Standard deviation [%] |
| n | Number of participating individuals [-] |
| N | Number of performed replicates [-] |
| Nday | Number of performed replicates during day [-] |
| Nnight | Number of performed replicates during night [-] |
| PR | Participation rate [%] |
| eRR | Experimental retention rate [%] |
| p | Error probability [-] |
| eRRt | Experimental retention rate (time dependent) [%] |
| t | Evaluation duration [min] |
| Sig. | Significance |
Appendix A

Table A1.
Conducted trials including main parameters, date, trial number, time of day, start and end-time, duration, treatment conditions U (voltage) and stocked fish.
Table A1.
Conducted trials including main parameters, date, trial number, time of day, start and end-time, duration, treatment conditions U (voltage) and stocked fish.
| Date | # | Time of Day | Start [hh:mm] | End [hh:mm] | Duration [h] | U [V] | Stocked Fish | ||||
|---|---|---|---|---|---|---|---|---|---|---|---|
| Barbel | Bream | Roach | Perch | Total | |||||||
| 14 October 2021 | V01 | Night | 20:00 | 04:00 | 8 | 80 | 30 | 30 | 30 | - | 90 |
| 18 October 2021 | V02 | Night | 20:00 | 04:00 | 8 | - | 30 | 30 | 30 | - | 90 |
| 19 October 2021 | V03 | Day | 08:00 | 16:00 | 8 | 80 | 30 | 30 | 30 | - | 90 |
| 19 October 2021 | V04 | Night | 20:00 | 04:00 | 8 | - | 30 | 30 | 30 | - | 90 |
| 20 October 2021 | V05 | Day | 07:45 | 15:45 | 8 | 80 | 30 | 30 | 30 | - | 90 |
| 20 October 2021 | V06 | Night | 20:00 | 04:00 | 8 | ±40 | 30 | 30 | 30 | 30 | 120 |
| 21 October 2021 | V07 | Day | 07:45 | 15:45 | 8 | - | 30 | 30 | 30 | 30 | 120 |
| 22 October 2021 | V08 | Day | 11:00 | 15:00 | 4 | ±40 | 30 | 30 | 30 | - | 90 |
| 23 October 2021 | V09 | Day | 11:00 | 15:00 | 4 | 34 | 30 | 30 | 30 | 30 | 120 |
| 24 October 2021 | V10 | Day | 11:00 | 15:00 | 4 | 80 | 30 | 30 | 30 | 17 | 107 |
| 25 October 2021 | V11 | Day | 10:30 | 15:00 | 4 | ±40 | 21 | 30 | 30 | - | 81 |
| 26 October 2021 | V12 | Day | 08:45 | 12:45 | 4 | - | - | 45 | 54 | - | 99 |
References
- Nilsson, C.; Reidy, C.A.; Dynesius, M.; Revenga, C. Fragmentation and flow regulation of the world’s large river systems. Science 2005, 308, 405–408. [Google Scholar] [CrossRef] [PubMed] [Green Version]
- Schilt, C.R. Developing fish passage and protection at hydropower dams. Appl. Anim. Behav. Sci. 2007, 104, 295–325. [Google Scholar] [CrossRef]
- Ebel, G. Fischschutz und Fischabstieg an Wasserkraftanlagen—Handbuch Rechen- und Bypasssysteme, 1st ed.; Ebel, Büro für Gewässerökologie und Fischereibiologie: Halle (Saale), Germany, 2013. [Google Scholar]
- Kuriqi, A.; Pinheiro, A.N.; Sordo-Ward, A.; Bejarano, M.D.; Garrote, L. Ecological impacts of run-of-river hydropower plants—Current status and future prospects on the brink of energy transition. Renew. Sustain. Energy Rev. 2021, 142, 110833. [Google Scholar] [CrossRef]
- Sindelar, C.; Schobesberger, J.; Habersack, H. Effects of weir height and reservoir widening on sediment continuity at run-of-river hydropower plants in gravel bed rivers. Geomorphology 2017, 291, 106–115. [Google Scholar] [CrossRef]
- Lucas, M.C.; Baras, E.; Thom, T.J.; Duncan, A.; Slavik, O. Migration of Freshwater Fishes; Blackwell Science Ltd.: London, UK, 2001; ISBN 9780470999653. [Google Scholar]
- Treeck, R.; Geist, J.; Pander, J.; Tuhtan, J.; Wolter, C. Impacts and Risks of Hydropower. In Novel Developments for Sustainable Hydropower; Springer International Publishing: Cham, Switzerland, 2022; pp. 41–60. [Google Scholar]
- Brodersen, J.; Nilsson, A.; Ammitzbøll, J.; Hansson, L.-A.; Skov, C.; Brönmark, C. Optimal Swimming Speed in Head Currents and Effects on Distance Movement of Winter-Migrating Fish. PLoS ONE 2008, 3, e2156. [Google Scholar] [CrossRef] [Green Version]
- Larinier, M.; Travade, F. Downstream migration: Problems and facilities. Bull. Français De La Pêche Et De La Piscic. 2002, 364, 181–207. [Google Scholar] [CrossRef] [Green Version]
- Williams, J.G.; Armstrong, G.; Katopodis, C.; Larinier, M.; Travade, F. Thinking like a fish: A key ingredient for development of effective fish passage facilities at river obstructions. River Res. Appl. 2011, 28, 407–417. [Google Scholar] [CrossRef] [Green Version]
- Thorstad, E.B.; Havn, T.B.; Sæther, S.A.; Heermann, L.; Teichert, M.A.K.; Diserud, O.H.; Tambets, M.; Borcherding, J.; Økland, F. Survival and behaviour of Atlantic salmon smolts passing a run-of-river hydropower facility with a movable bulb turbine. Fish. Manag. Ecol. 2017, 24, 199–207. [Google Scholar] [CrossRef]
- Čada, G.F. The development of advanced hydroelectric turbines to improve fish passage survival. Fisheries 2001, 26, 14–23. [Google Scholar] [CrossRef]
- Harrison, P.M.; Martins, E.G.; Algera, D.A.; Rytwinski, T.; Mossop, B.; Leake, A.J.; Power, M.; Cooke, S.J. Turbine entrainment and passage of potadromous fish through hydropower dams: Developing conceptual frameworks and metrics for moving beyond turbine passage mortality. Fish Fish. 2019, 20, 403–418. [Google Scholar] [CrossRef]
- Calles, O.; Greenberg, L. Connectivity is a two-way street—The need for a holistic approach to fish passage problems in regulated rivers. River Res. Appl. 2009, 25, 1268–1286. [Google Scholar] [CrossRef]
- Kriewitz-Byun, C.R. Leitrechen an Fischabstiegsanlagen: Hydraulik und Fischbiologische Effizienz; ETH-Zürich: Zürich, Switzerland, 2015. [Google Scholar]
- Noatch, M.R.; Suski, C.D. Non-physical barriers to deter fish movements. Environ. Rev. 2012, 20, 71–82. [Google Scholar] [CrossRef]
- Schwevers, U.; Adam, B. Fish Protection Technologies and Fish Ways for Downstream Migration; Springer: Berlin/Heidelberg, Germany, 2020. [Google Scholar]
- Beck, C.; Albayrak, I.; Meister, J.; Peter, A.; Selz, O.M.; Leuch, C.; Vetsch, D.F.; Boes, R.M. Swimming Behavior of Downstream Moving Fish at Innovative Curved-Bar Rack Bypass Systems for Fish Protection at Water Intakes. Water 2020, 12, 3244. [Google Scholar] [CrossRef]
- Boes, R.; Beck, C.; Meister, J.; Peter, A.; Kastinger, M.; Albayrak, I. Effect of bypass layout on guidance of downstream moving fish at bar rack bypass systems. In Proceedings of the 39th IAHR World Congress, Granada, Spain, 19–24 June 2022; pp. 1312–1321. [Google Scholar]
- Maddahi, M.; Hagenbüchli, R.; Mendez, R.; Zaugg, C.; Boes, R.M.; Albayrak, I. Field Investigation of Hydraulics and Fish Guidance Efficiency of a Horizontal Bar Rack-Bypass System. Water 2022, 14, 776. [Google Scholar] [CrossRef]
- Haug, J.; Brinkmeier, B.; Tutzer, R.; Aufleger, M. Hybrid barriers for adaption of bar-screens for fish protection. Wasserwirtschaft 2021, 111, 48–53. [Google Scholar] [CrossRef]
- Haug, J.; Auer, S.; Frees, C.; Brinkmeier, B.; Tutzer, R.; Hayes, D.S.; Aufleger, M. Retrofitting of Existing Bar Racks with Electrodes for Fish Protection—An Experimental Study Assessing the Effectiveness for a Pilot Site. Water 2022, 14, 850. [Google Scholar] [CrossRef]
- Rowland, W.J. Studying visual cues in fish behavior: A review of ethological techniques. Environ. Biol. Fishes 1999, 56, 285–305. [Google Scholar] [CrossRef]
- Tutzer, R.; Röck, S.; Walde, J.; Zeiringer, B.; Unfer, G.; Führer, S.; Brinkmeier, B.; Haug, J.; Aufleger, M. Ethohydraulic experiments on the fish protection potential of the hybrid system FishProtector at hydropower plants. Ecol. Eng. 2021, 171, 106370. [Google Scholar] [CrossRef]
- Enders, E.C.; Gessel, M.H.; Williams, J.G. Development of successful fish passage structures for downstream migrants requires knowledge of their behavioural response to accelerating flow. Can. J. Fish. Aquat. Sci. 2009, 66, 2109–2117. [Google Scholar] [CrossRef]
- Bird, D.J.; Cowx, I.G. The selection of suitable pulsed currents for electric fishing in waters. Fish. Res. 1993, 18, 363–376. [Google Scholar] [CrossRef]
- Beaumont, W.R.C. Electricity in Fish Research and Management; Wiley Online Library: Hoboken, NJ, USA, 2016. [Google Scholar]
- Hicks, B.J.; Jones, M.H.; de Villiers, J.E.; Ling, N. Use of electrofishing for capturing invasive fish. New Zealand Invasive Fish Manag. Handb. 2015, 1, 72–80. [Google Scholar]
- Snyder, D.E. Electrofishing and Its Harmful Effects on Fish; Technical Report; Geological Survey Reston VA Biological Resources DIV: Reston, VA, USA, 2003. [Google Scholar]
- Beck, C.; Albayrak, I.; Meister, J.; Peter, A.; Selz, O.M.; Leuch, C.; Vetsch, D.F.; Boes, R. Fish Swimming Behavior and Bypass Acceptance at Curved-Bar Rack Bypass Systems. In Proceedings of the 39th IAHR World Congress, Granada, Spain, 19–24 June 2022; pp. 1246–1255. [Google Scholar]
- Parasiewicz, P.; Wisniewolski, W.; Mokwa, M.; Ziola, S.; Prus, P.; Godlewska, M. A low-voltage electric fish guidance system-NEPTUN. Fish. Res. 2016, 181, 25–33. [Google Scholar] [CrossRef]
- O’Farrell, M.; Burger, C.; Crump, R.; Smith, K. Blocking or guiding upstream-migrating fish: A commentary on the success of the graduated field electric fish barrier. WIT Trans. State Art Sci. Eng. 2014, 71, 11. [Google Scholar]
- Dolan, C.R.; Miranda, L.E. Immobilization Thresholds of Electrofishing Relative to Fish Size. Trans. Am. Fish. Soc. 2003, 132, 969–976. [Google Scholar] [CrossRef]
- Layhee, M.J.; Sepulveda, A.J.; Shaw, A.; Smuckall, M.; Kapperman, K.; Reyes, A. Effects of electric barrier on passage and physical condition of juvenile and adult rainbow trout. J. Fish Wildl. Manag. 2016, 7, 28–35. [Google Scholar] [CrossRef] [Green Version]
- Bullen, C.-R.; Carlson, T.-J. Non-physical fish barrier systems: Their development and potential applications to marine ranching. Rev. Fish Biol. Fish. 2003, 13, 201–212. [Google Scholar] [CrossRef]
- Rous, A.M.; Forrest, A.; McKittrick, E.H.; Letterio, G.; Roszell, J.; Wright, T.; Cooke, S.J. Orientation and position of fish affects recovery time from electrosedation. Trans. Am. Fish. Soc. 2015, 144, 820–828. [Google Scholar] [CrossRef]
- Tutzer, R.; Röck, S.; Walde, J.; Haug, J.; Brinkmeier, B.; Aufleger, M.; Unfer, G.; Führer, S.; Zeiringer, B. A Physical and Behavioral Barrier for Enhancing Fish Downstream Migration at Hydropower Dams: The Flexible FishProtector. Water 2022, 14, 378. [Google Scholar] [CrossRef]
- Hammerschlag, N.; Meyer, C.G.; Grace, M.S.; Kessel, S.T.; Sutton, T.T.; Harvey, E.S.; Paris-Limouzy, C.B.; Kerstetter, D.W.; Cooke, S.J. Shining a light on fish at night: An overview of fish and fisheries in the dark of night, and in deep and polar seas. Bull. Mar. Sci. 2017, 93, 253–284. [Google Scholar] [CrossRef]
- Chrysafi, A.; Jepsen, N.; Villar-Guerra, D.; Larsen, M.H.; Skov, C. Effects of passive integrated transponder tags on short-term feeding patterns in European perch (Perca fluviatilis). J. Fish Biol. 2021, 99, 2035–2039. [Google Scholar] [CrossRef]
- Clough, S.C. Swimming Speeds in Fish: Phase 2: Literature Review; Environment Agency: Bristol, UK, 2004; ISBN 1-84432-252-1. [Google Scholar]
- Cano-Barbacil, C.; Radinger, J.; Argudo, M.; Rubio-Gracia, F.; Vila-Gispert, A.; García-Berthou, E. Key factors explaining critical swimming speed in freshwater fish: A review and statistical analysis for Iberian species. Sci. Rep. 2020, 10, 1–12. [Google Scholar] [CrossRef] [PubMed]
- Lichtenberg, N.; Cleynen, O.; Thévenin, D. Numerical investigations of a water vortex hydropower plant implemented as fish ladder-part I: The water vortex. In Proceedings of the 4th IAHR Europe Congress, Liege, Belgium, 27–29 July 2016; p. 277. [Google Scholar]
- Weber, C.; Scheuber, H.; Nilsson, C.; Alfredsen, K.T. Detection and apparent survival of PIT-tagged stream fish in winter. Ecol. Evol. 2016, 6, 2536–2547. [Google Scholar] [CrossRef] [PubMed]
- Cohen, J. Statistical Power Analysis for the Behavioral Sciences; Academic Press: Cambridge, MA, USA, 2013. [Google Scholar]
- Sahu, P. Research Methodology: A Guide for Researchers in Agricultural Science, Social Science and Other Related Fields; Routledge: Oxfordshire, UK, 2013; ISBN 978-81-322-1019-1. [Google Scholar]
- Backhaus, K.; Erichson, B.; Weiber, R. Fortgeschrittene Multivariate Analysemethoden: Eine Anwendungsorientierte Einführung; Springer-Verlag: Berlin/Heidelberg, Germany, 2015. [Google Scholar]
- Banarescu, P.M.; Bogutskaya, N. The Freshwater Fishes of Europe. Volume 5/II. Cyprinidae 2. Part II: Barbus; Aula-Verlag: Wiesbaden, Germany, 2003. [Google Scholar]
- Knott, J.; Mueller, M.; Pander, J.; Geist, J. Seasonal and diurnal variation of downstream fish movement at four small-scale hydropower plants. Ecol. Freshw. Fish 2020, 29, 74–88. [Google Scholar] [CrossRef]
- Eckmann, R. Der Flussbarsch: Perca Fluviatilis; Biologie, Ökologie und Fischereiliche Nutzung, 1st ed.; Verlags KG Wolf: Magdeburg, Germany, 2013; ISBN 9783894322496. [Google Scholar]
- Lucas, M.C.; Batley, E. Seasonal movements and behaviour of adult barbel Barbus barbus, a riverine cyprinid fish: Implications for river management. J. Appl. Ecol. 1996, 33, 1345–1358. [Google Scholar] [CrossRef]
- Albayrak, I.; Boes, R.M.; Kriewitz-Byun, C.R.; Peter, A.; Tullis, B.P. Fish guidance structures: Hydraulic performance and fish guidance efficiencies. J. Ecohydraulics 2020, 5, 113–131. [Google Scholar] [CrossRef]
- Latchem, E.; Madliger, C.L.; Abrams, A.E.I.; Cooke, S.J. Does Artificial Light at Night Alter the Subsequent Diurnal Behavior of a Teleost Fish? Water Air Soil Pollut. 2021, 232, 1–8. [Google Scholar] [CrossRef]
- de Bie, J.; Peirson, G.; Kemp, P.S. Effectiveness of horizontally and vertically oriented wedge-wire screens to guide downstream moving juvenile chub (Squalius cephalus). Ecol. Eng. 2018, 123, 127–134. [Google Scholar] [CrossRef]
- Goodwin, R.A.; Politano, M.; Garvin, J.W.; Nestler, J.M.; Hay, D.; Anderson, J.J.; Weber, L.J.; Dimperio, E.; Smith, D.L.; Timko, M. Fish navigation of large dams emerges from their modulation of flow field experience. Proc. Natl. Acad. Sci. USA 2014, 111, 5277–5282. [Google Scholar] [CrossRef] [Green Version]
- Johnson, N.S.; Thompson, H.T.; Holbrook, C.; Tix, J.A. Blocking and guiding adult sea lamprey with pulsed direct current from vertical electrodes. Fish. Res. 2014, 150, 38–48. [Google Scholar] [CrossRef]
- Kammerlander, H.; Schlosser, L.; Zeiringer, B.; Unfer, G.; Zeileis, A.; Aufleger, M. Downstream passage behavior of potamodromous fishes at the fish protection and guidance system “Flexible Fish Fence”. Ecol. Eng. 2020, 143, 105698. [Google Scholar] [CrossRef]
- Meister, J.; Fuchs, H.; Beck, C.; Albayrak, I.; Boes, R.M. Velocity fields at horizontal bar racks as fish guidance structures. Water 2020, 12, 280. [Google Scholar] [CrossRef]
Figure 1.
Experimental setup (a) in plan view; Bar Rack FishProtector in blue, approximate effective extensions of the electric field with U = 80 V in light green with dotted black line, Pit-Antennae A1-A3 in red and diversion net upstream of the experimental area and (b) close-up of the Bar Rack FishProtector with electrodes, cable connections and approach flow indicated with arrows.

Figure 2.
Flow velocity distribution [m/s] 0.15 m upstream of the Bar Rack FishProtector in a vertical plane looking in flow direction; x-axis: distance from orographic left-hand side [m], y-axis: distance from channel bottom [m], low flow velocities represented in blue, higher velocities in red. Measuring locations indicated with black crosses. Increased velocities at the left bank.

Figure 3.
Species-specific participation rate during the first four hours of trials [%] for reference and treatment conditions in night-time and day-time trials separately for barbel, bream, roach and perch. N denotes the number of conducted trials with the considered species in the setup, n the number of stocked fish per treatment condition and species.

Figure 4.
Fish activity including all species for individual trials plotted as the number of minute-wise detections on Antenna A1 (upstream of the bar rack) divided by the number of stocked fish per trial (n, standardization) over time [hh:mm]. Reference trials in green, treatments in red. Data-points are plotted in 30-min intervals. Data points are indicated with crosses. Number of trials per condition is denoted N, number of stocked fish per conditions is denoted n. Increased activity patterns during the night with distinct peak.

Figure 5.
Average experimental retention rates eRRt [%] depending on the evaluation duration t [min] distinguished by treatment conditions and day-time based on (a) the number of participating fish (detection antenna A1) without exclusion of initial effects (first hour of the trials) , (b) the number of stocked fish without exclusion of initial effects , (c) the number of participating fish with exclusion of initial effects and (d) the number of stocked fish with exclusion of initial effects . Error indicators mark lower and upper boundaries in performed trials.

Figure 6.
Experimental retention rates [%] with exclusion of initial effects based on the number of stocked fish for the species barbel, bream and roach divided by treatment conditions and size classes of 100–200 mm, 200–300 mm and 300–400 mm. Reference conditions indicated in green tones, treatment conditions in red tones.

Table 1.
Number, length and width of stocked fish in trials, minimum, maximum and average with standard deviations (std. dev.) [mm] used for during all conducted replicates.
Table 1.
Number, length and width of stocked fish in trials, minimum, maximum and average with standard deviations (std. dev.) [mm] used for during all conducted replicates.
| Total Length [mm] | Width [mm] | ||||||
|---|---|---|---|---|---|---|---|
| Species | Min | Max | Average (±std. dev.) | Min | Max | Average (±std. dev.) | |
| Barbel | (n = 321) | 105 | 440 | 206 (±65) | 16 | 51 | 30 (±10) |
| Bream | (n = 375) | 155 | 375 | 213 (±29) | 14 | 40 | 20 (±4) |
| Roach | (n = 384) | 145 | 325 | 213 (±36) | 17 | 41 | 24 (±5) |
| Perch | (n = 107) | 100 | 215 | 151 (±28) | 16 | 30 | 21 (±3) |
| Total | (n = 1187) | 100 | 440 | 211 (±54) | 14 | 51 | 23 (±7) |
Table 2.
Treatment conditions with number of replicates (N) and number of stocked fish according to the species used in the experiments and for the specific testing conditions: reference and electrified setup each during night and day.
Table 2.
Treatment conditions with number of replicates (N) and number of stocked fish according to the species used in the experiments and for the specific testing conditions: reference and electrified setup each during night and day.
| Treatment | N | Stocked Fish | ||||
|---|---|---|---|---|---|---|
| Barbel | Bream | Roach | Perch | Total | ||
| Reference—Night | 2 | 60 | 60 | 60 | - | 180 |
| Electrified—Night | 2 | 60 | 60 | 60 | 30 | 210 |
| Reference—Day | 2 | 30 | 75 | 84 | 30 | 219 |
| Electrified—Day | 6 | 171 | 180 | 180 | 47 | 578 |
Table 3.
Overview of the four different definitions of the experimental retention rate depending on the main parameter combinations without and with exclusion of initial effects (during the first hour of the experiments) and referring to either the number of participating fish (detection at antenna A1) or all stocked fish in the trials.
| Definition of the Experimental Retention Rate | Reference Number of Fish for Evaluation | |
|---|---|---|
| Participating Fish (Detection Antenna A1) | All Stocked Fish | |
| Without exclusion of initial effects | ||
| With exclusion of initial effects | ||
Table 4.
Global and local Χ2-tests comparing the average experimental retention rates for the different treatment conditions with exclusion of initial effects and referring to the number of stocked fish. Experimental retention rates for one, two and three hours evaluation time (, and ). Included are the error probability p, Φ resembling the effect size and the significance (Sig.) where n.s. denotes no significance, * p < 0.05, ** p < 0.01 and *** p < 0.001).
| p | Φ | Sig. | p | Φ | Sig. | p | Φ | Sig. | |
|---|---|---|---|---|---|---|---|---|---|
| All | <0.001 | 0.291 | *** | <0.001 | 0.383 | *** | <0.001 | 0.389 | *** |
| Ref–80 V | <0.001 | 0.282 | *** | <0.001 | 0.364 | *** | <0.001 | 0.367 | *** |
| Ref–±40 V | <0.001 | 0.244 | *** | <0.001 | 0.317 | *** | <0.001 | 0.323 | *** |
| Ref–34 V | <0.001 | 0.218 | *** | <0.001 | 0.282 | *** | <0.001 | 0.299 | *** |
| 80 V–±40 V | 0.382 | −0.036 | n.s. | 0.254 | −0.046 | n.s. | 0.307 | −0.410 | n.s. |
| 80 V–34 V | 0.773 | 0.014 | n.s. | 0.560 | 0.027 | n.s. | 0.246 | 0.054 | n.s. |
| ±40 V–34 V | 0.397 | 0.044 | n.s. | 0.205 | 0.066 | n.s. | 0.085 | 0.089 | n.s. |
Table 5.
Χ2-Tests investigating the influence of the daytime on the experimental retention rates with exclusion of the first hour of the trials and referring to the number of stocked fish. Experimental retention rates for one, two and three hours evaluation time (, and ). Error probability p, Φ and significance (n.s. denoting no significance, * p < 0.05, ** p < 0.01 and *** p < 0.001).
| Time of Day | p | Φ | Sig. | |
|---|---|---|---|---|
| Night | <0.001 | −0.429 | *** | |
| <0.001 | −0.486 | *** | ||
| <0.001 | −0.503 | *** | ||
| Day | 0.060 | −0.102 | n.s. | |
| <0.001 | −0.258 | *** | ||
| <0.001 | −0.241 | *** |
Table 6.
Results of the binary regression analysis for the three evaluation durations of one, two and three hours (, and ) based on the number of stocked fish with exclusion of initial effects. Regression coefficient β, standard deviation (std. dev.), Wald statistic (Wald), error probability p, Odds ratio (Exp(β)) and lower and upper boundaries of the 95% confidence interval for Exp(β).
| eRR | Variable | β | std. dev. | Wald | p | Exp(β) | 95% Confidence Interval for Exp(β) | |
|---|---|---|---|---|---|---|---|---|
| Lower Boundary | Upper Boundary | |||||||
| Reference | 2.102 | 0.293 | 51.451 | < 0.001 | 8.186 | 4.609 | 14.539 | |
| Night | 2.141 | 0.293 | 53.395 | < 0.001 | 8.505 | 4.790 | 15.101 | |
| Barbel | 0.322 | 0.372 | 0.750 | 0.387 | 1.379 | 0.666 | 2.857 | |
| Bream | 0.810 | 0.340 | 5.676 | 0.017 | 2.249 | 1.155 | 4.380 | |
| Perch | 1.230 | 0.535 | 5.279 | 0.022 | 3.422 | 1.198 | 9.774 | |
| Length | 0.005 | 0.002 | 4.724 | 0.030 | 1.005 | 1.001 | 1.010 | |
| Constant | −4.084 | 0.633 | 41.678 | 0.000 | 0.017 | |||
| Reference | 2.430 | 0.249 | 95.208 | <0.001 | 11.363 | 6.974 | 18.514 | |
| Night | 1.612 | 0.225 | 51.296 | <0.001 | 5.012 | 3.224 | 7.790 | |
| Barbel | 0.183 | 0.304 | 0.361 | 0.548 | 1.200 | 0.662 | 2.177 | |
| Bream | 0.870 | 0.268 | 10.519 | 0.001 | 2.386 | 1.411 | 4.035 | |
| Perch | 0.647 | 0.477 | 1.841 | 0.175 | 1.909 | 0.750 | 4.858 | |
| Length | 0.004 | 0.002 | 3.302 | 0.069 | 1.004 | 1.000 | 1.008 | |
| Constant | −5.250 | 0.556 | 89.314 | <0.001 | 0.005 | |||
| Reference | 2.239 | 0.220 | 103.707 | <0.001 | 9.387 | 6.100 | 14.445 | |
| Night | 1.538 | 0.205 | 56.103 | <0.001 | 4.655 | 3.113 | 6.962 | |
| Barbel | 0.169 | 0.277 | 0.374 | 0.541 | 1.185 | 0.688 | 2.038 | |
| Bream | 0.795 | 0.246 | 10.481 | 0.001 | 2.215 | 1.369 | 3.584 | |
| Perch | 0.600 | 0.428 | 1.965 | 0.161 | 1.822 | 0.788 | 4.213 | |
| Length | 0.003 | 0.002 | 2.178 | 0.140 | 1.003 | 0.999 | 1.007 | |
| Constant | −4.643 | 0.507 | 83.862 | <0.001 | 0.010 | |||
Publisher’s Note: MDPI stays neutral with regard to jurisdictional claims in published maps and institutional affiliations. |
© 2022 by the authors. Licensee MDPI, Basel, Switzerland. This article is an open access article distributed under the terms and conditions of the Creative Commons Attribution (CC BY) license (https://creativecommons.org/licenses/by/4.0/).
Share and Cite
MDPI and ACS Style
Haug, J.; Frees, C.; Brinkmeier, B.; Aufleger, M. Ethohydraulic Experiments Investigating Retention Rates of an Electrified Bar Rack. Water 2022, 14, 4036. https://doi.org/10.3390/w14244036
AMA Style
Haug J, Frees C, Brinkmeier B, Aufleger M. Ethohydraulic Experiments Investigating Retention Rates of an Electrified Bar Rack. Water. 2022; 14(24):4036. https://doi.org/10.3390/w14244036
Chicago/Turabian StyleHaug, Jonas, Calvin Frees, Barbara Brinkmeier, and Markus Aufleger. 2022. "Ethohydraulic Experiments Investigating Retention Rates of an Electrified Bar Rack" Water 14, no. 24: 4036. https://doi.org/10.3390/w14244036
Note that from the first issue of 2016, this journal uses article numbers instead of page numbers. See further details here.