Article

Effects of Bacillus pumilus BP-171 and Carbon Sources on the Growth Performance of Shrimp, Water Quality and Bacterial Community in Penaeus vannamei Culture System

1
The Key Laboratory of Mariculture, Ocean University of China, Ministry of Education, Qingdao 266003, China
2
Qingdao Ruizi Group Co., Ltd., Qingdao 266003, China
3
Function Laboratory for Marine Fisheries Science and Food Production Processes, Qingdao National Laboratory for Marine Science and Technology, Qingdao 266003, China
*
Author to whom correspondence should be addressed.
Water 2022, 14(24), 4037; https://doi.org/10.3390/w14244037
Submission received: 30 October 2022 / Revised: 7 December 2022 / Accepted: 8 December 2022 / Published: 10 December 2022
(This article belongs to the Special Issue Advances in Aquaculture Ecology Research)

Abstract

:
A strain of Bacillus pumilus BP-171 with the ability of heterotrophic nitrification-aerobic denitrification was isolated from a shrimp culture pond and showed good denitrification ability under laboratory conditions. In order to investigate the effects of strain BP-171 and its combinations with different carbon sources, i.e., poly-3-hydroxybutyrate-co-3-hydroxyvalerate (PHBV) and molasses, on the growth performance of shrimp, water quality and bacterial community in culture system of Penaeus vannamei, this experiment was set up. Four experimental groups were designed, i.e., group B applied with a single B. pumilus BP-171, the BP added with BP-171 and PHBV, the BM added with BP-171 and molasses, and the control DZ without the probiotic and carbon source. The results showed that the specific growth rate, final body weight, gross weight, feed efficiency rate and survival rate of shrimp in the BP and BM groups were better than those in the control (p < 0.05), while the survival rate and gross weight of shrimp in group B were also better than those in the control (p < 0.05). Among them, the best growth performance of shrimp was observed in the group BP. The concentrations of ammonia, nitrite, nitrate and total nitrogen were significantly lower in all treatment groups than in the control (p < 0.05). The lowest concentrations of ammonia and nitrite were found in group B, while those of nitrate and total nitrogen were found in group BP (p < 0.05). The concentrations of dissolved organic carbon and total organic carbon in both BP and BM groups were significantly higher than in group B and the control (p < 0.05). Compared to the control, the abundance and diversity of the bacterial community in water did not change with the addition of probiotics and carbon sources. However, altered structure and predicted function, as well as improved stability of the ecological network of the bacterial community, were observed in water. In view of the above, the addition of B. pumilus BP-171 and PHBV significantly promoted the growth performance of shrimp, effectively improved water quality, and enhanced the stability of the ecological network of bacterial communities in water, which could have great potential for the application in intensive culture of P. vannamei.

1. Introduction

Penaeus vannamei has become the most dominant species in shrimp farming worldwide [1]. The high demand in the market has led to the expansion of shrimp production and the widespread availability of high stocking density culture patterns. However, with the increasing intensification of shrimp farming, feed residues and shrimp metabolic products led to the accumulation of nitrogen pollutants, including ammonia, nitrite and nitrate nitrogen, in cultured water [2,3]. This problem is of increasing concern in intensive farming practices. The continued increase of nitrogen pollution in culture systems not only leads to the deterioration of water quality in the culture system but also affects the normal physiological functions and immune performance of shrimp and eventually possibly causes frequent diseases in shrimp culture [4,5,6]. Therefore, it is urgent to develop healthy farming modes and good water quality management technologies for the sustainable development of aquaculture.
Previous studies have shown that the concentration of harmful nitrogen such as ammonia, nitrite and nitrate in culture water could be effectively controlled by adding appropriate probiotics [7,8,9], ultimately reducing the morbidity of farmed species and increasing the production of farmed animals [10,11,12]. Probiotics can not only reduce the concentration of hazardous nitrogenous substances accumulated in water through the process of nitrification, denitrification and assimilation but also inhibit the growth of pathogenic microorganisms by competing for physical space and nutrients and secreting bacteriocins and lysozyme [13,14,15], and thus are widely used in aquaculture.
The addition of a carbon source at an appropriate dosage to the culture water can increase the carbon-to-nitrogen ratio (C/N ratio) and promote the proliferation of heterotrophic bacteria so that ammonia, nitrite and nitrate nitrogen can be removed by the assimilation and denitrification of heterotrophic bacteria [2,16,17]. Molasses is currently one of the most commonly used carbon sources in shrimp aquaculture [18]. However, molasses as an added carbon source is highly soluble and can lead to the rapid growth of heterotrophs and consumption of oxygen, which can easily lead to a rapid decrease in dissolved oxygen, affect the stability of water quality, and eventually threaten the survival of aquatic animals [18,19]. For example, Pérez-Fuentes et al. [18] found that dissolved oxygen decreased significantly from 3.2 mg·L−1 to 1–1.5 mg·L−1 when the concentration of added molasses exceeded 0.12 g·L−1, which may lead to mortalities of aquatic animals. PHBV (poly-3-hydroxybutyrate-co-3-hydroxyvalerate) produced by bacteria has many excellent properties, such as thermoplastic, biodegradable, and can exist as a solid material, and has been used as a carbon source for denitrifiers in wastewater treatment systems with good results [20,21,22]. Compared with conventional carbon sources such as molasses, PHBV is characterized by slow carbon release and easy control, which means the concentration of dissolved organic carbon in water that can be used by heterotrophic bacteria will keep appropriate and stable, so it is a continuous carbon source after application in water and can be used as a biofilm carrier for bacteria [20,22]. However, to our knowledge, the practical application of PHBV as a carbon source in shrimp culture has rarely been reported [3,20].
Biological denitrification is considered one of the most effective, environmentally friendly, and inexpensive biotechnologies for reducing nitrogen levels in aquaculture wastewater [23]. As more heterotrophic nitrifying-aerobic denitrifying bacteria have been isolated, interest in their use for the effective removal of nitrogen accumulated in aquaculture systems has increased in recent years [24,25,26,27]. Studies have shown that heterotrophic nitrifying bacteria can convert nitrogen-containing compounds into NH2OH, NO2-N or NO3-N, etc., by nitrification while using carbon sources for their growth [20,28]. Meanwhile, some bacteria also have simultaneous aerobic denitrification, which can convert NO2-N or NO3-N into gasses such as NO, N2O and N2 [20,28]. Therefore, denitrification treatment with heterotrophic nitrifying-aerobic denitrifying bacteria has the advantages of high economic benefits and environmental friendliness and has gradually become a research focus in recent years [24,26,27]. Unlike the traditional methods of nitrogen removal by autotrophic nitrification and anaerobic denitrification, heterotrophic nitrifying-aerobic denitrifying bacteria can not only avoid the manipulation of separation of aerobic and anaerobic zones but also have the advantage of rapid growth and high denitrification efficiency [24,29]. Heterotrophic nitrifying and aerobic denitrifying microorganisms such as Halomonas spp., Pseudomonas spp., Alcaligenes spp., Bacillus spp. and other genera have been isolated successively [26,27]. However, the relevant research was conducted only on the laboratory scale, with few reports on the pilot scale and above, and most of them are based on biofortification, i.e., aerobic denitrifying microorganisms are exogenously added to the bioreactor in the form of microbial agents to improve the denitrification efficiency of the reactor [24,25,29]. A strain of Bacillus pumilus BP-171 with the ability of heterotrophic nitrification-aerobic denitrification was isolated from a shrimp culture pond and showed good denitrification ability under laboratory conditions [29]. In addition, Li et al. [20] found that BP-171 significantly reduced nitrite concentration when added to a P. vannamei culture system with two other probiotic strains and PHBV simultaneously.
In this study, a shrimp culture experiment was set up to determine the possible effects of different treatments by adding a single BP-171, the combination of BP-171 and PHBV, and the combination of BP-171 and molasses on shrimp growth performance, water quality, and water microbiota in a P. vannamei culture system to understand the mechanisms of action of B. pumilus BP-171 and provide necessary information for its potential application in shrimp culture practice.

2. Materials and Methods

2.1. Experimental Animals

The juvenile P. vannamei were purchased from Qingdao Zhengda Agricultural Development Co., Ltd. (Qingdao, China). Before the culture experiment, shrimp were allowed to acclimate under experimental conditions for two weeks. During acclimation, the water temperature was controlled at 25 ± 0.5 °C and salinity at 29.0 ± 1.0‰. Water was exchanged once daily at a 10% exchange rate and continuously aerated. P. vannamei was fed three times a day (7:00, 12:00 and 18:00). At the end of acclimation, healthy P. vannamei of similar size were used for the culture experiment. The feed was obtained from Guangdong Yuehai Feeds Group; the main components and nutrient contents of the feed are shown in Supplementary Table S1.

2.2. Experimental Strain and Carbon Sources

Bacillus pumilus BP-171 was obtained from the Microbial Culture Collection, Lab of Aquaculture Ecology, Ocean University of China, a heterotrophic nitrifying-aerobic denitrifying strain [29]. PHBV was purchased from Ningbo Tianan Biological Material Co., Ltd. (Ningbo, China). It is white and cylindrical, with a height of 4 mm and an inner diameter of 1 mm. PHBV was activated in seawater with sufficient aeration for 10 d before the experiment [22]. Molasses (23.7% of total organic carbon content) was purchased from Jinan Pengduo Trading Co., Ltd. (Jinan, China).

2.3. Experimental Design

The experiments were performed in 12 white polyethylene tanks with a volume of 500 L. Four experimental groups were designed, i.e., the probiotic group B applied with a single B. pumilus BP-171, the group BP added with the strain BP-171 and PHBV, the group BM with the strain BP-171 and molasses, and the control group DZ without the probiotic and carbon source. Three replicates were set up for each treatment group, and each replicate was randomly stocked with 70 shrimp, and the average weight of the shrimp was 6.06 ± 0.02 g.
The viable bacteria of B. pumilus BP-171 were regularly added to the water every seven days. The final concentration of probiotic bacteria in the water of each treatment group was designed as 1 × 10⁷ cfu·L−1.
PHBV particles were placed in a PVC pipe with an inner diameter of 10 cm and a height of 35 cm, and the ends of the PVC pipe were covered with suitable sieves to prevent the PHBV particles from leaking. For aeration, an air stone was placed in the PVC pipe to allow the continuous release of the carbon source into the water with water currents. After assembly, the entire device containing 500 g of PHBV was placed in the corresponding tanks [20].
The molasses was applied with reference to the formula of Avnimelech [30] as follows:
∆N = (Feed × N%) × %N excretion
∆CH = ∆N × [C/N] mic/(%C × E)
∆N is the amount of nitrogen required to produce new bacteria. Feed is the amount of feed fed, and N% is the percentage of nitrogen in the feed, %N excretion is the percentage of feed nitrogen converted to ammonia in the culture system and is approximately 50%. ∆CH is the amount of molasses added. [C/N] mic is the C/N ratio of the heterotrophic bacteria themselves, %C is the carbon content of the added carbohydrate, and E is the efficiency of assimilation by heterotrophic bacteria, approximately 0.4.
An appropriate amount of molasses was diluted with seawater and poured evenly into the experimental tanks twice daily.

2.4. Experimental Management

The strain of B. pumilus BP-171 was inoculated into 2216E liquid medium and cultured at 160 r/min, (28.0 ± 1.0) °C to logarithmic phase, and the concentration of viable bacteria in the fermentation broth was 1 × 10⁹ cfu·mL−1.
During the experimental period, P. vannamei was fed 5% of the total weight of shrimp three times daily (7:00, 12:00, and 18:00). Uneaten feed particles and feces were collected for 1 h after feeding, dried at 60 °C, and weighed. Using a portable dissolved oxygen meter (YSI 550A, Fisher Scientific, Hanover Park, IL, USA), a salinity meter (YSI EC300A, Fisher Scientific, Hanover Park, IL, USA), and a pH meter (YSI pH100A, Fisher Scientific, Hanover Park, IL, USA), temperature (25–28 °C), salinity (28–31‰), pH (7.8–8.0), and dissolved oxygen (>5 mg·L−1) were measured daily.
The feeding trial was conducted in workshop 16 of Qingdao Ruizi Group Co. (Qingdao, China) and lasted for 30 days.

2.5. Sample Collection and Measurement

2.5.1. Growth Performance of Shrimp

The shrimp were counted and weighed for each treatment group at the beginning and end of the experiment, respectively. The survival rate, feed efficiency rate, and specific growth rate of P. vannamei were calculated as follows.
Survival rate (SR) = (Nt/N0) × 100%;
Feed efficiency rate (FER) = (Wt − W0)/Wf × 100%;
Specific growth rate (SGR) = (lnWt − lnW0)/T × 100%.
Nt is the number of alive shrimp on the day the feeding trial ended, and N0 is the number of shrimp put in the tank when the feeding trial started. Wt is the final wet weight of shrimp when the feeding trial ended, and W0 is the initial wet weight when the feeding trial started. T represented the days from the start to the end of the experiment.

2.5.2. Water Quality Parameters

The water sample of 500 mL was collected every seven days. The parameters of ammonia, nitrite, nitrate, total nitrogen, soluble reactive phosphate, and total phosphorus were determined using an automatic chemical analyzer (Clever Chem 380G, DeChem-Tech. GmbH, Germany) according to the instructions. Water samples for DOC (Dissolved organic carbon) and TOC (Total organic carbon) were analyzed by a multi-2100s TOC analyzer (Analytik Jena). Besides, the average values at different time points of the above parameter were calculated to compare the difference of corresponding parameters among different treatments.

2.5.3. DNA Extraction, Amplification, Purification, and Sequencing

Bacterial samples were collected on Day 30 when the feeding trial ended. A 1L water sample was filtered through a filter membrane with a pore size of 0.22 μm, then the bacterial samples were stored in a −80 °C refrigerator. Total genomic DNA was extracted from the water sample using the E.Z.N.A.® Water DNA Kit (Omega, GA, USA), and PCR amplification was performed using primers 338F (5′-ACTCCTACGGGAGGCAGCA-3′) and 806R (5′-GGACTACHVGGGTWTCTAAT-3′) specific for the V3 and V4 regions of the 16S rRNA gene. PCR products were then recovered to generate sequencing libraries, and the constructed libraries were sequenced at high throughput using the Illumina HiSeq platform. Raw reads were processed by splicing, filtering, and removal of chimeras to obtain effective reads. The sequences were clustered to obtain operational taxonomic units (OTUs) using UPARSE software (version 7.0) [31] with sequenced reads at a 97.0% similarity level. OTUs were taxonomically annotated using the Silva database (http://www.arb-silva.de/ (accessed on 1 July 2022)).

2.6. Statistical Analysis

Mothur software (version 1.30.2) was used to analyze the diversity of sample sequences, including alpha diversity such as ACE index, Chao1 index, Shannon index, Simpson index, and Good-coverage as well as beta diversity such as PCA (Principal Component Analysis), PCoA (Principal Co-ordinates analysis), and PLS-DA (Partial Least Squares Discriminant Analysis). Chao index and ACE index were used to estimate the number of OTU, the total number of species, reflecting the species richness of α diversity in a community, but the algorithms are different. Both the Shannon index and Simpson index were used to estimate the α diversity of the bacterial community in samples. They consider not only the richness of species in the community but also the evenness of species. However, the algorithms of the two are different. In addition, the higher the Shannon value is, the higher α-diversity is. However, the higher the Simpson value is, the lower α-diversity is. Analysis and visualization of OTU-based Venn diagrams were performed using the VennDiagram package in R (v3.3.1). Based on the species composition of each treatment group at each taxonomic level, bar graphs were generated using the ggplot2 package in R (v.3.3.1), which can be used to visualize the dominant species of each group at a given taxonomic level and the relative abundance of each dominant species. Using the stats package in R (v.3.3.1) and the scipy package in Python, hypothesis tests were performed among species in the different groups based on the species abundance data of bacterial community using the one-way test ANOVA or the Kruskal-Wallis H test to evaluate the significance level of differences in species abundance and obtain species with significant differences between groups.
RDA analysis (redundancy analysis) was performed using the vegan package in R (v.3.3.1), and the significance of RDA analysis was determined by permutest analysis similar to ANOVA. Spearman correlation coefficients between environmental factors and selected species were calculated using the vegan package in R (v.3.3.1) for correlation analysis, and Spearman correlation significance tests were performed using the corrplot package in R (v.3.3.1). Ecological networks were created based on CoNet software in Cytoscape (v.3.8.2) and visualized using Cytoscape (Faust et al., 2016). The KEGG Module database was used to link bacterial taxa to gene sets with particular metabolic capacities and other phenotypic traits. The Shapiro-Wilk test was used to test the data for normal distribution (p > 0.05), and Levene’s test was used to test for chi-square (p > 0.05). One-way analysis of variance (ANOVA) and Duncan’s multiple comparison method in IBM SPSS Statistics 24.0 software were used to analyze the significance of differences between groups. The Kruskal-Wallis test was used for analysis when the data were not normally distributed or when there was unequal overall variance. p < 0.05 indicated significant differences.

3. Results

3.1. Growth Performance of Shrimp

The growth performance of shrimp is shown in Table 1. The survival rate of shrimp in groups B, BP, and BM was significantly higher than that in the control (p < 0.05), and there was no significant difference among groups B, BP, and BM (p > 0.05). The final body weight and specific growth rate (SGR) of shrimp were significantly higher in groups BP and BM than in groups B and the control (p < 0.05), and they were highest in group BP (p < 0.05). The gross weight of shrimp in the BP group was the highest and significantly higher than that of the other groups (p < 0.05), while that of groups B and BM was significantly higher than that of the control group (p < 0.05). The feed efficiency rate of shrimp in the BP group was significantly higher than that in other groups (p < 0.05), while no significant difference was found between other groups and the control (p > 0.05).

3.2. Water Quality Parameters

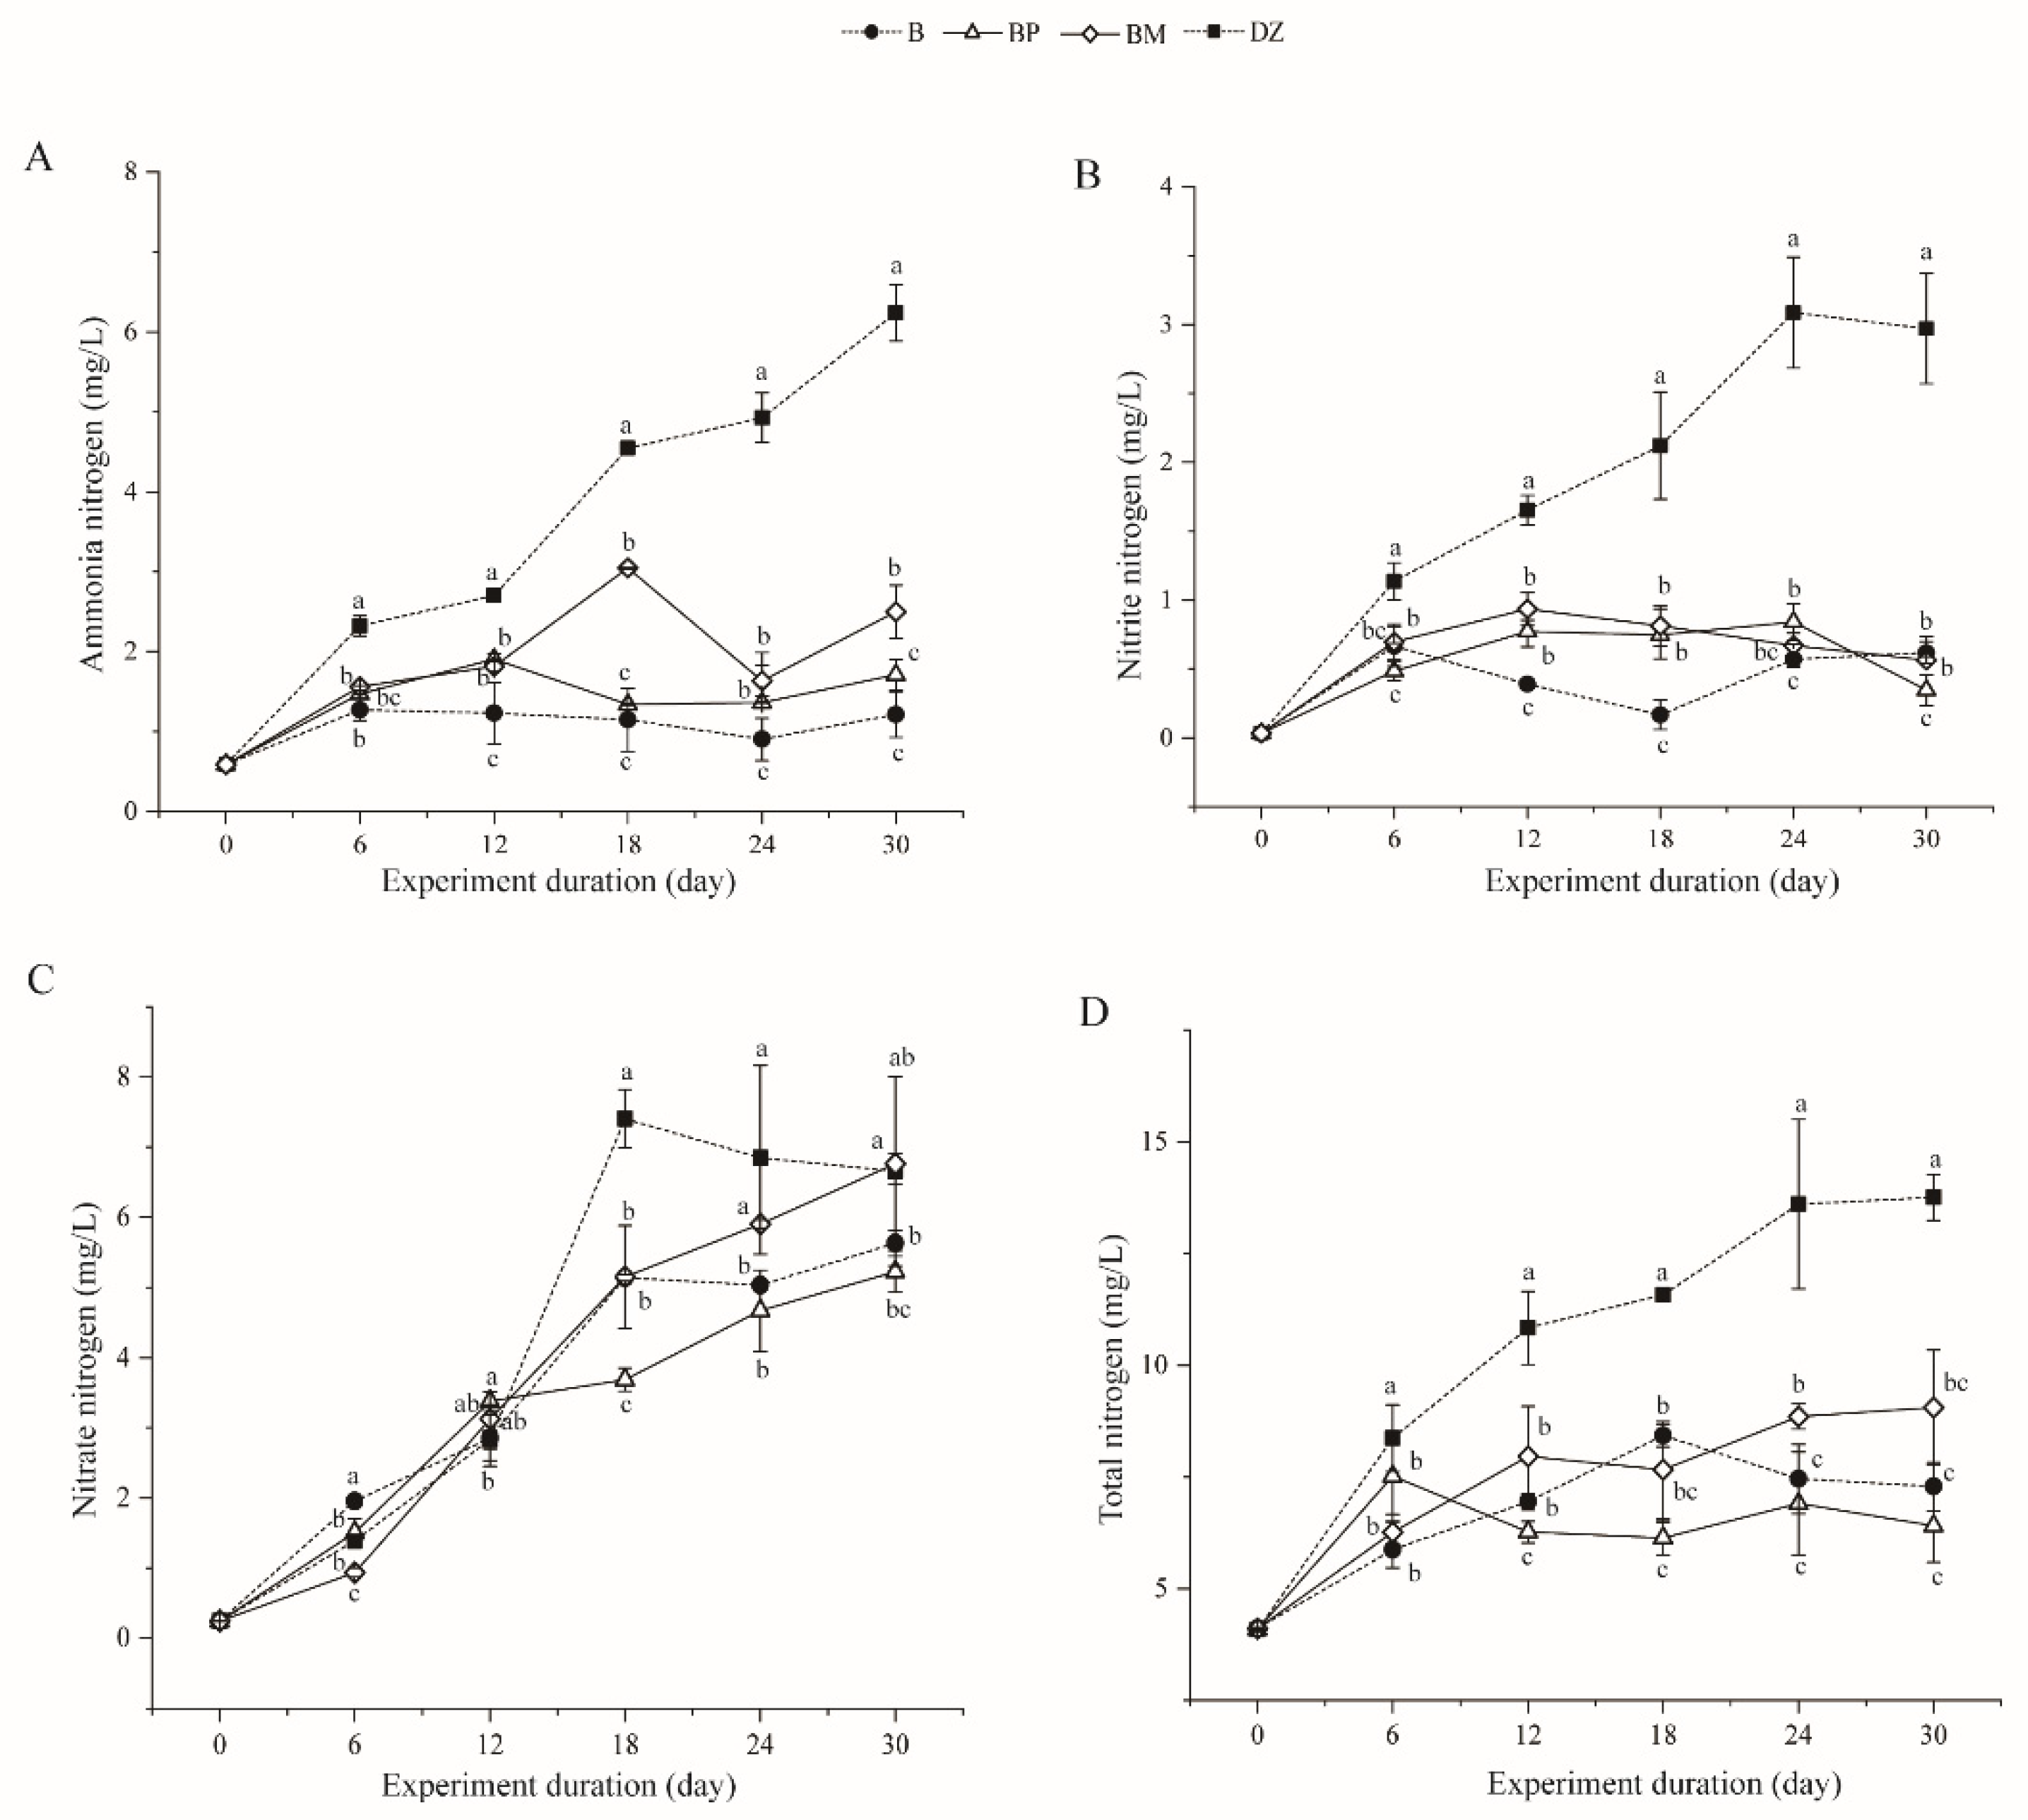
3.2.1. Changes in Ammonia, Nitrite, Nitrate, and Total Nitrogen

The average values of the temperature, dissolved oxygen, and pH in the water changed from 25.6 ± 0.3 °C, 7.21 ± 0.51 mg/L, and 7.46 ± 0.21 °C to 25.9 ± 0.3 mg/L, 7.43 ± 0.17 and 7.62 ± 0.19 during the period of the experiment, and no significant differences were found among the groups (p > 0.05). The salinity of the water was (30.0 ± 1.0) ‰ during the feeding experiment.
The concentrations and changes of nitrogen in water during the feeding experiment are shown in Figure 1. The concentration of total ammonia nitrogen (TAN) in groups B, BP, and BM was significantly lower than that in the control (p < 0.05), and the concentration in group BM was significantly higher than that in groups B and BP. The lowest concentration occurred in the B group and was reduced by 70.22% compared with the control (p < 0.05). The concentrations of TAN in the control increased during the experimental period (Figure 1A). In contrast, the TAN concentration in the BM group peaked at about Day 18, whereas the concentration in the B and BP groups leveled off after Day 6 and was significantly lower than that in the control group during the experiment (p < 0.05).
Similarly, the concentration of nitrite nitrogen in the B, BP, and BM groups was significantly lower than that in the control (p < 0.05). The concentration in the B group was significantly lower than that in the other groups (p < 0.05) and reduced by 76.88% compared to the control. In addition, the nitrite-nitrogen concentration in the control group increased from Day 1 to Day 24, stabilized after Day 24, and was significantly higher than all treatment groups (Figure 1B). In comparison, the concentration in the treatment groups leveled off after Day 6 and was significantly lower than that in the control during the experiment (p < 0.05).
The concentration of nitrate nitrogen in groups B, BP, and BM was significantly lower than that in the control group (p < 0.05). The concentration in the BP group was significantly lower than that in the other groups (p < 0.05) and reduced by 26.24% compared to the control. Moreover, the nitrate-nitrogen concentration in water showed an increasing trend in all treatment groups until Day 18 and stabilized after Day 18 in groups B and DZ (Figure 1C). However, concentration in groups BP and BM continued to increase until the end of the experiment. From Day 18 to 30, the nitrate-nitrogen concentration was significantly higher in the control group than in groups B and BP.
The concentration of total nitrogen was significantly lower in groups B, BP, and BM than in the control group (p < 0.05). The concentration in group BP was significantly lower than in the other groups (p < 0.05) and was reduced by 40.02% compared to the control. The concentration of total nitrogen in the control group showed an increasing trend (Figure 1D). The values in the treatment groups leveled off between Day 6 and 30 and were significantly lower than that in the control group (p < 0.05).

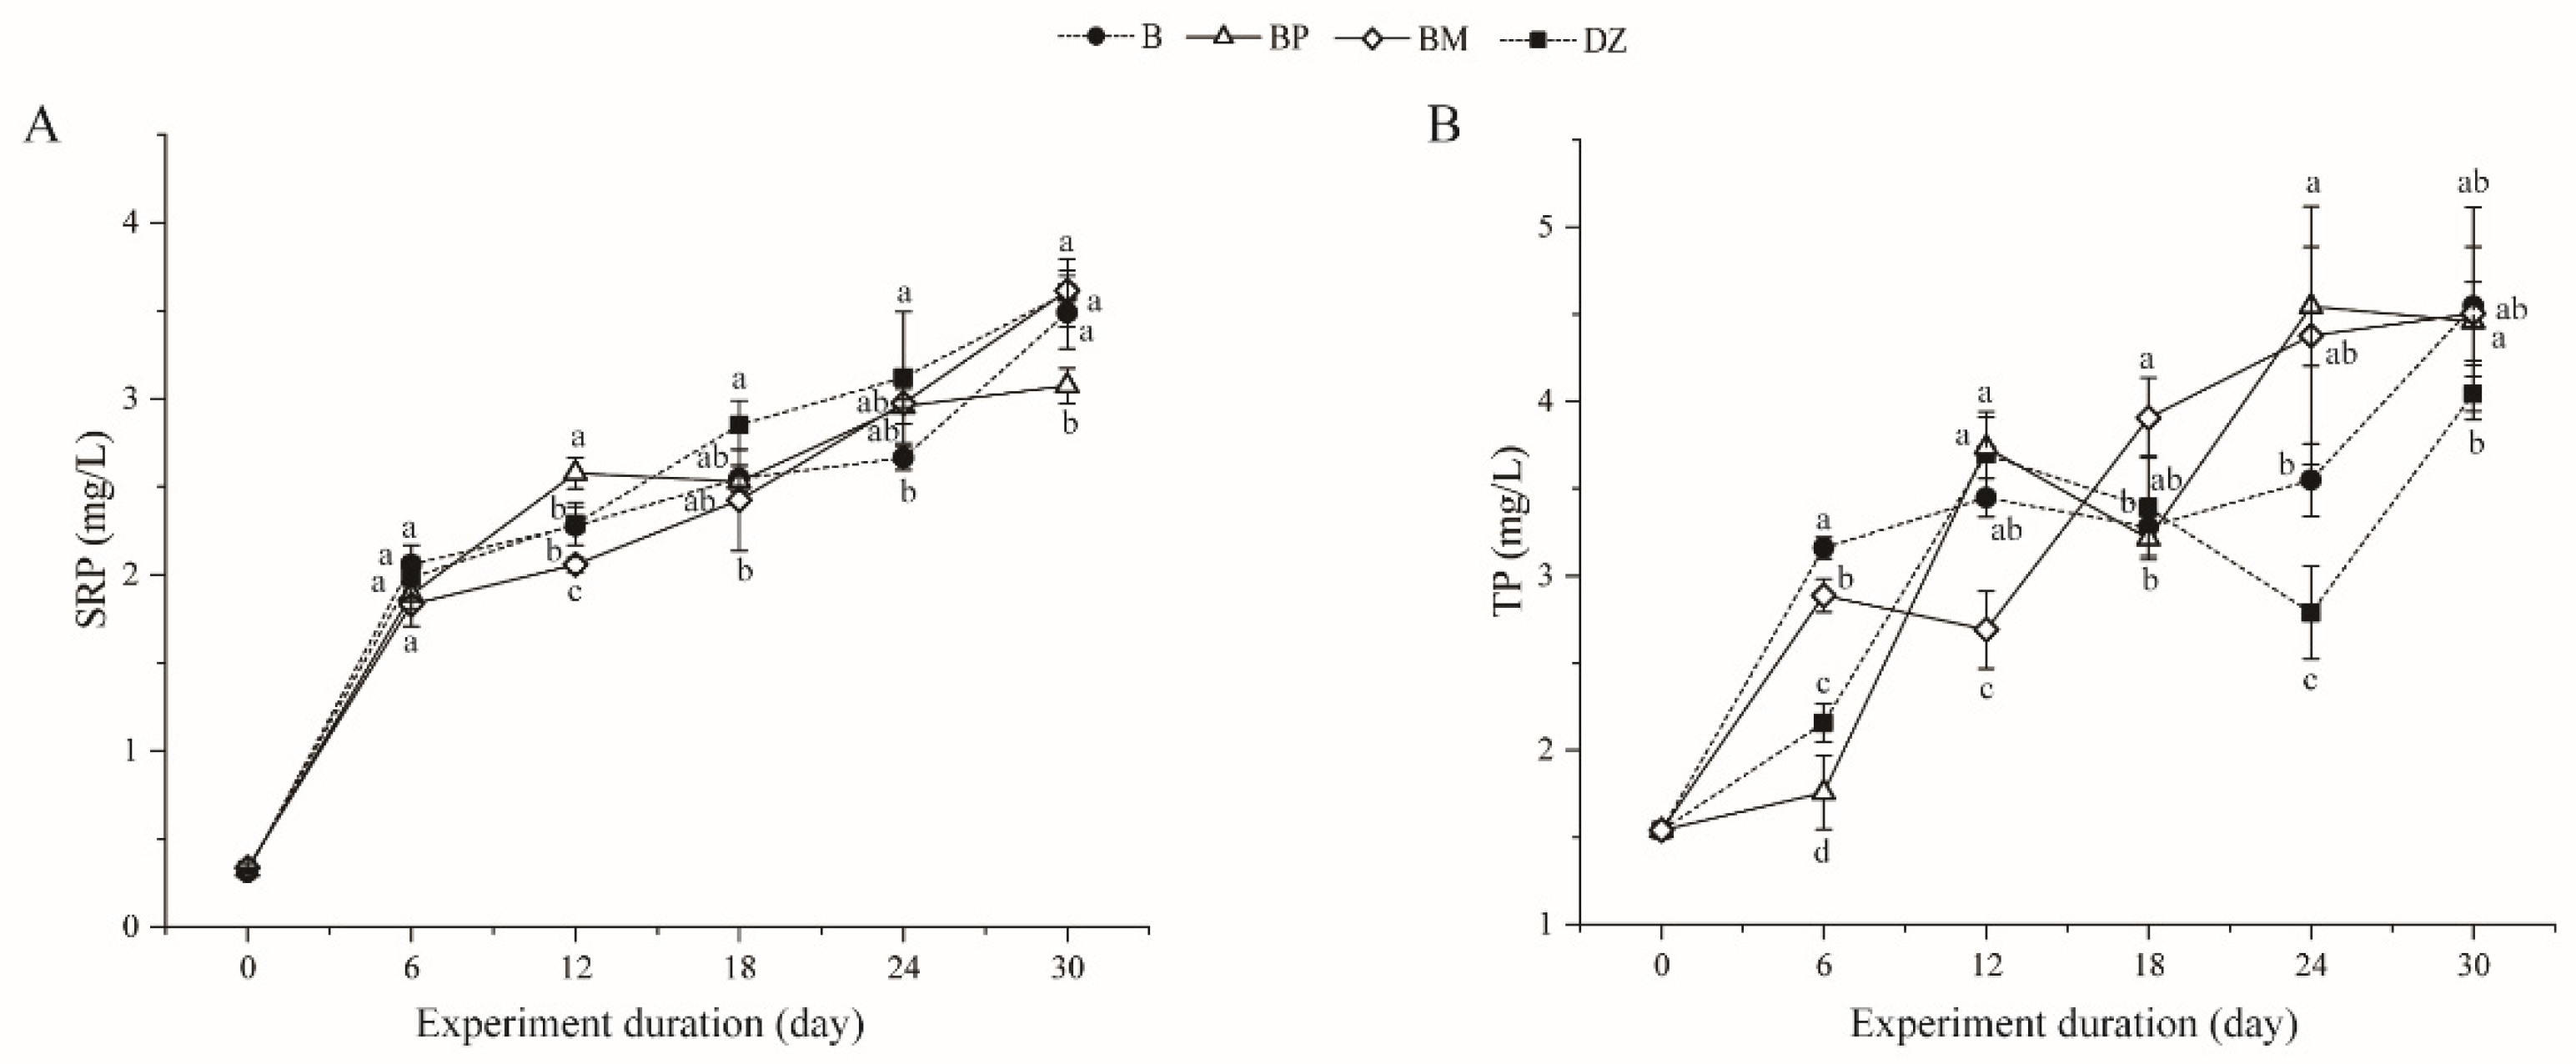
3.2.2. Changes in Soluble Reactive Phosphorus (SRP) and Total Phosphorus (TP)

The concentrations of SRP and TP are presented in Figure 2. There was no significant difference in SRP and TP concentrations among all the groups during the experiment, with an overall increasing trend.

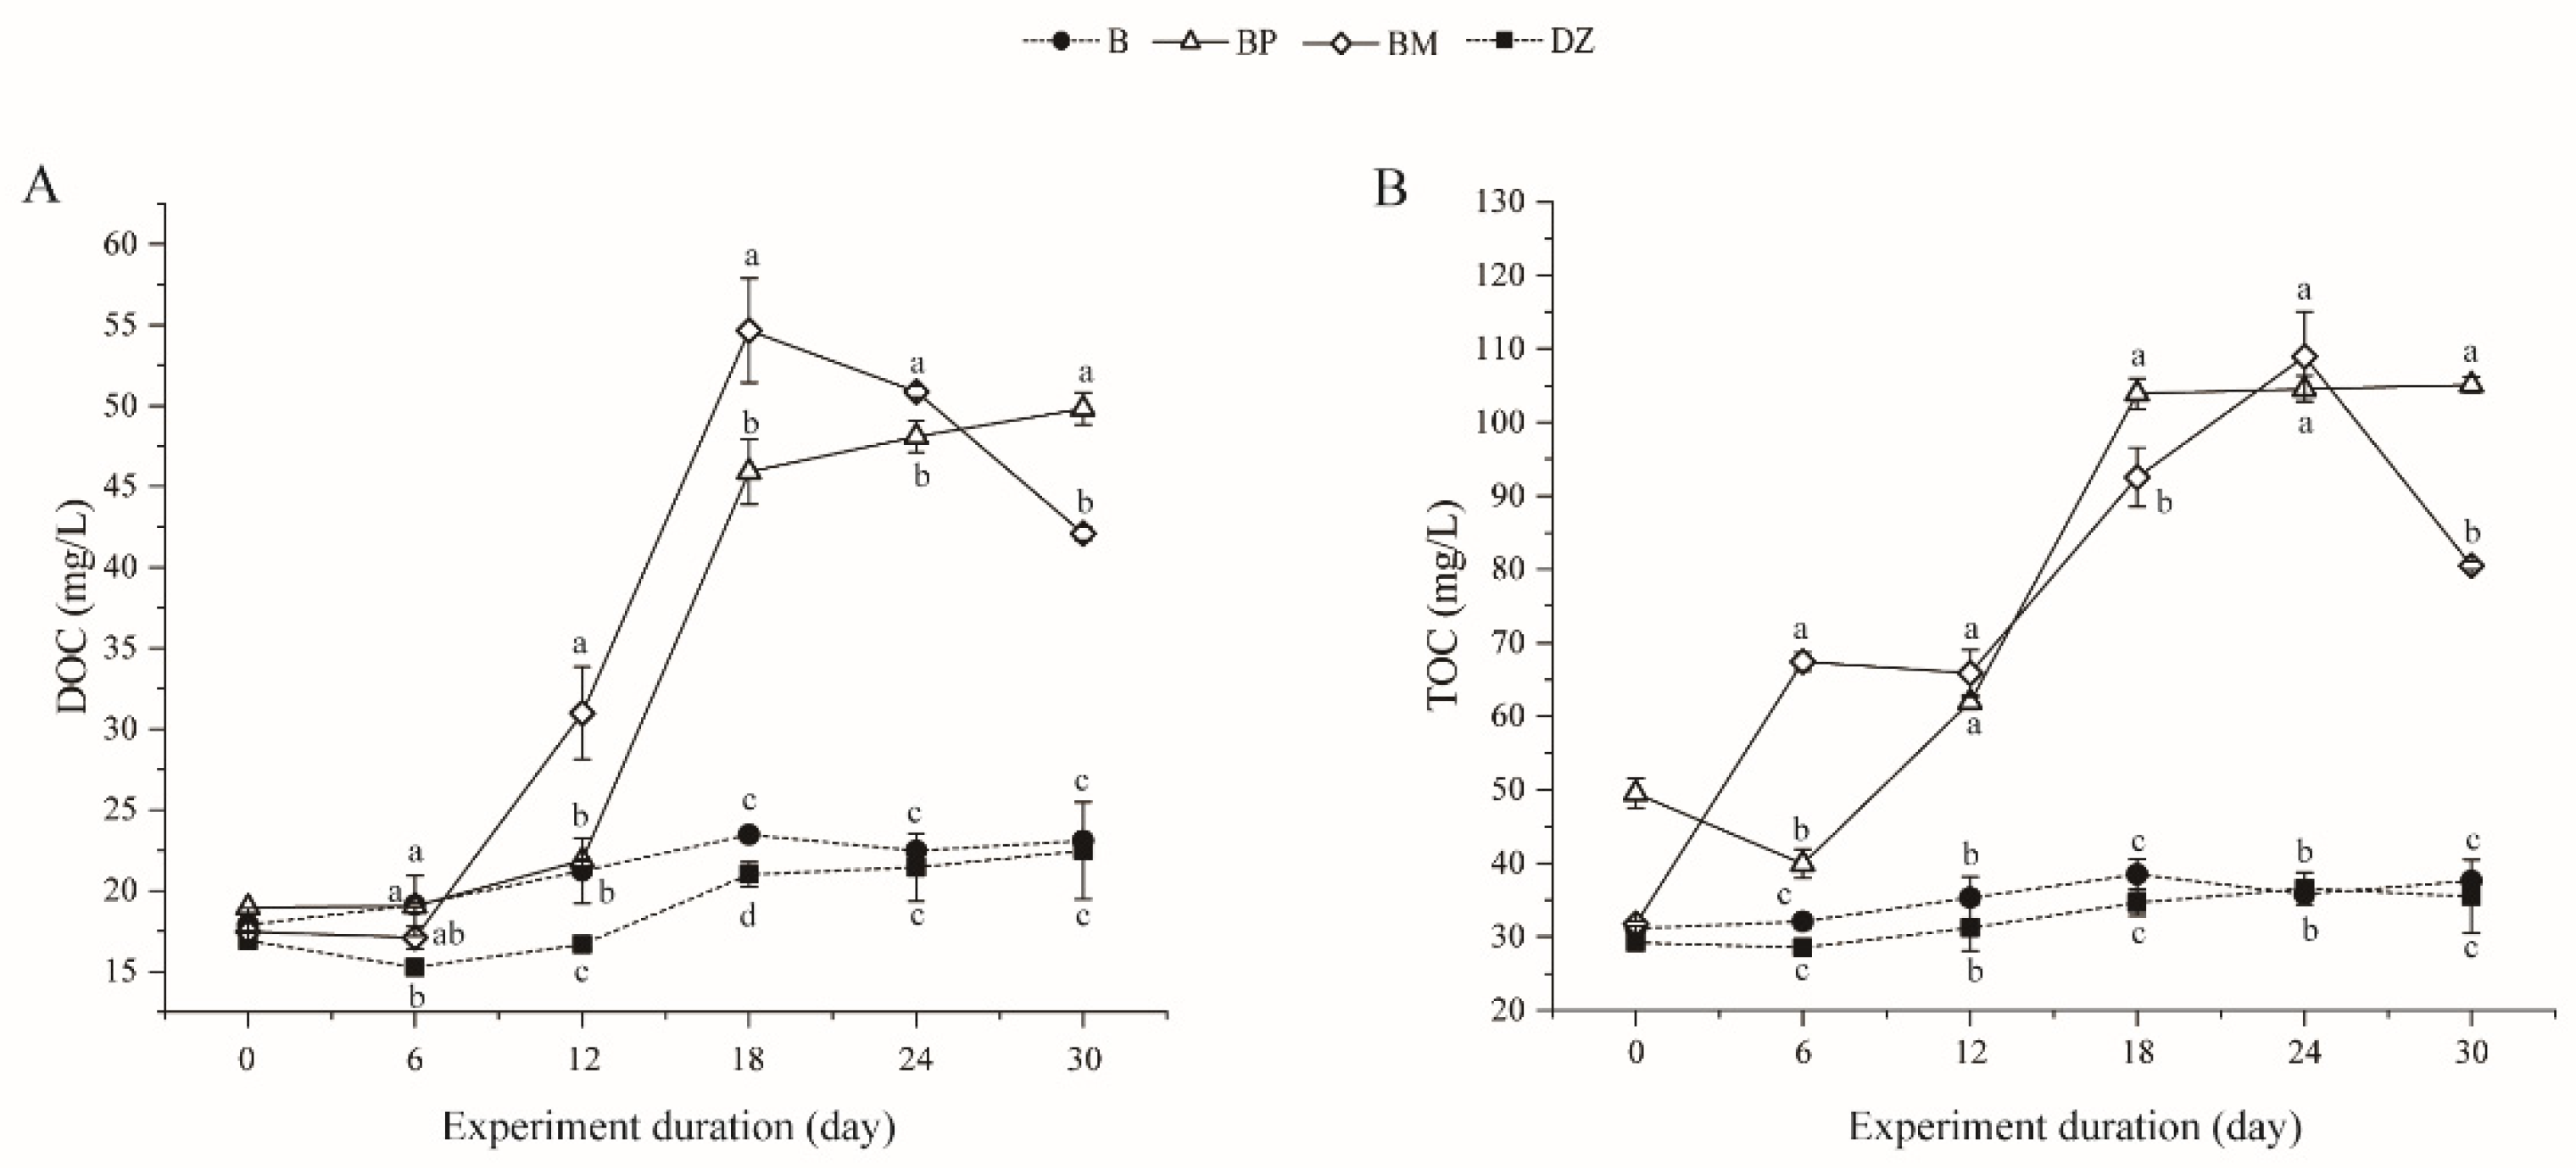
3.2.3. Changes of Dissolved Organic Carbon (DOC) and Total Organic Carbon (TOC)

The concentrations and changes of organic carbon are presented in Figure 3, respectively. The concentrations of DOC and TOC in the groups without the addition of carbon sources (DZ and B) were significantly lower than those in the groups with the addition of carbon sources (BP and BM) (p < 0.05). The DOC and TOC concentrations in the DZ and B groups showed a trend of stabilization, while the concentrations in the culture system with carbon source addition increased until Day 18. After Day 18, the concentrations of DOC and TOC in the BP group increased slowly and stabilized gradually, while the concentrations in the BM group decreased rapidly. The average concentrations of DOC and TOC between the B group and the control group showed no significant difference (p > 0.05).

3.3. The Microbial Diversity, Community Structure, and Function

3.3.1. Microbial Diversity

The bacterial diversity indices are shown in Table 2. The coverage indices of all groups were above 0.99, indicating that the sequencing data were adequate to represent the bacterial community structure. The Shannon, Simpson, Chao, and Ace indices of bacterial communities of all groups did not show significant differences, indicating that the addition of probiotics and carbon sources did not change the abundance and diversity of bacterial communities in the culture system.
As shown in Figure 4, the similarity analysis among groups using partial least squares discriminant analysis (PLS-DA) showed that the samples of group BP were separated from those of groups BM, DZ, and B along the COMP1 axis. Meanwhile, the samples of group B were separated from those of groups BM and DZ along the COMP2 axis. In addition, the samples within the same group clustered together while the samples from different groups moved away from each other.

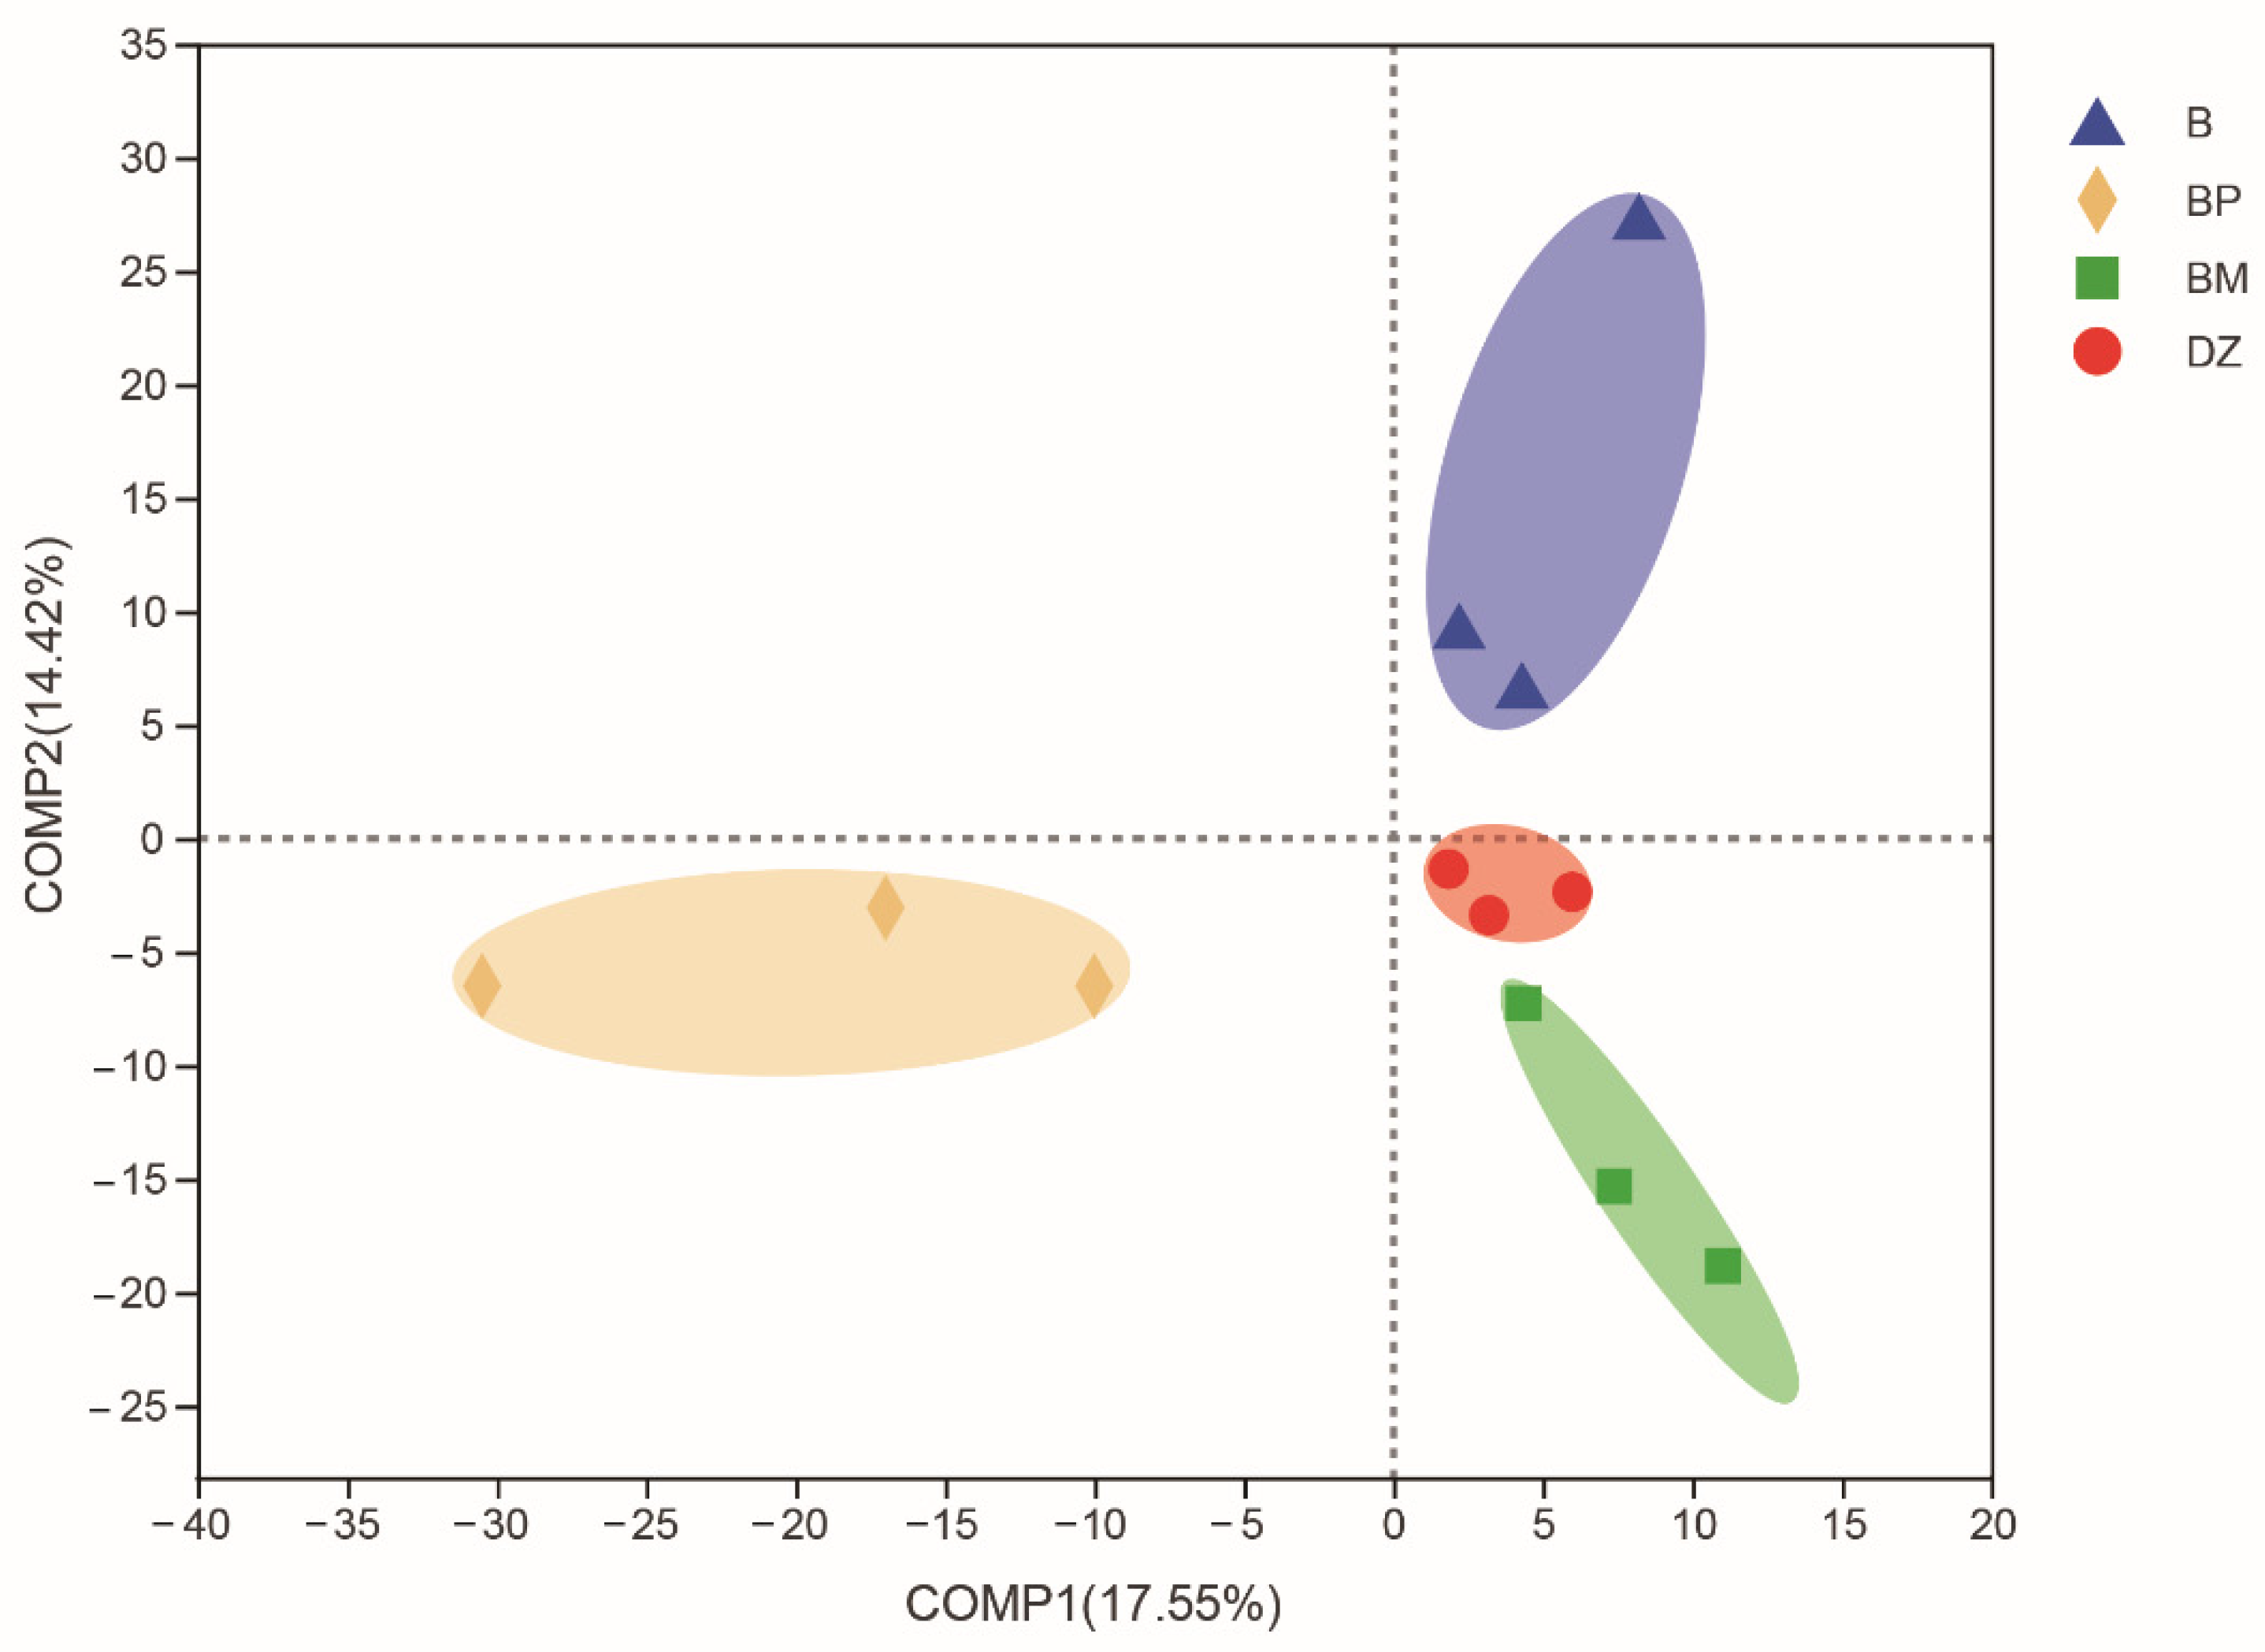
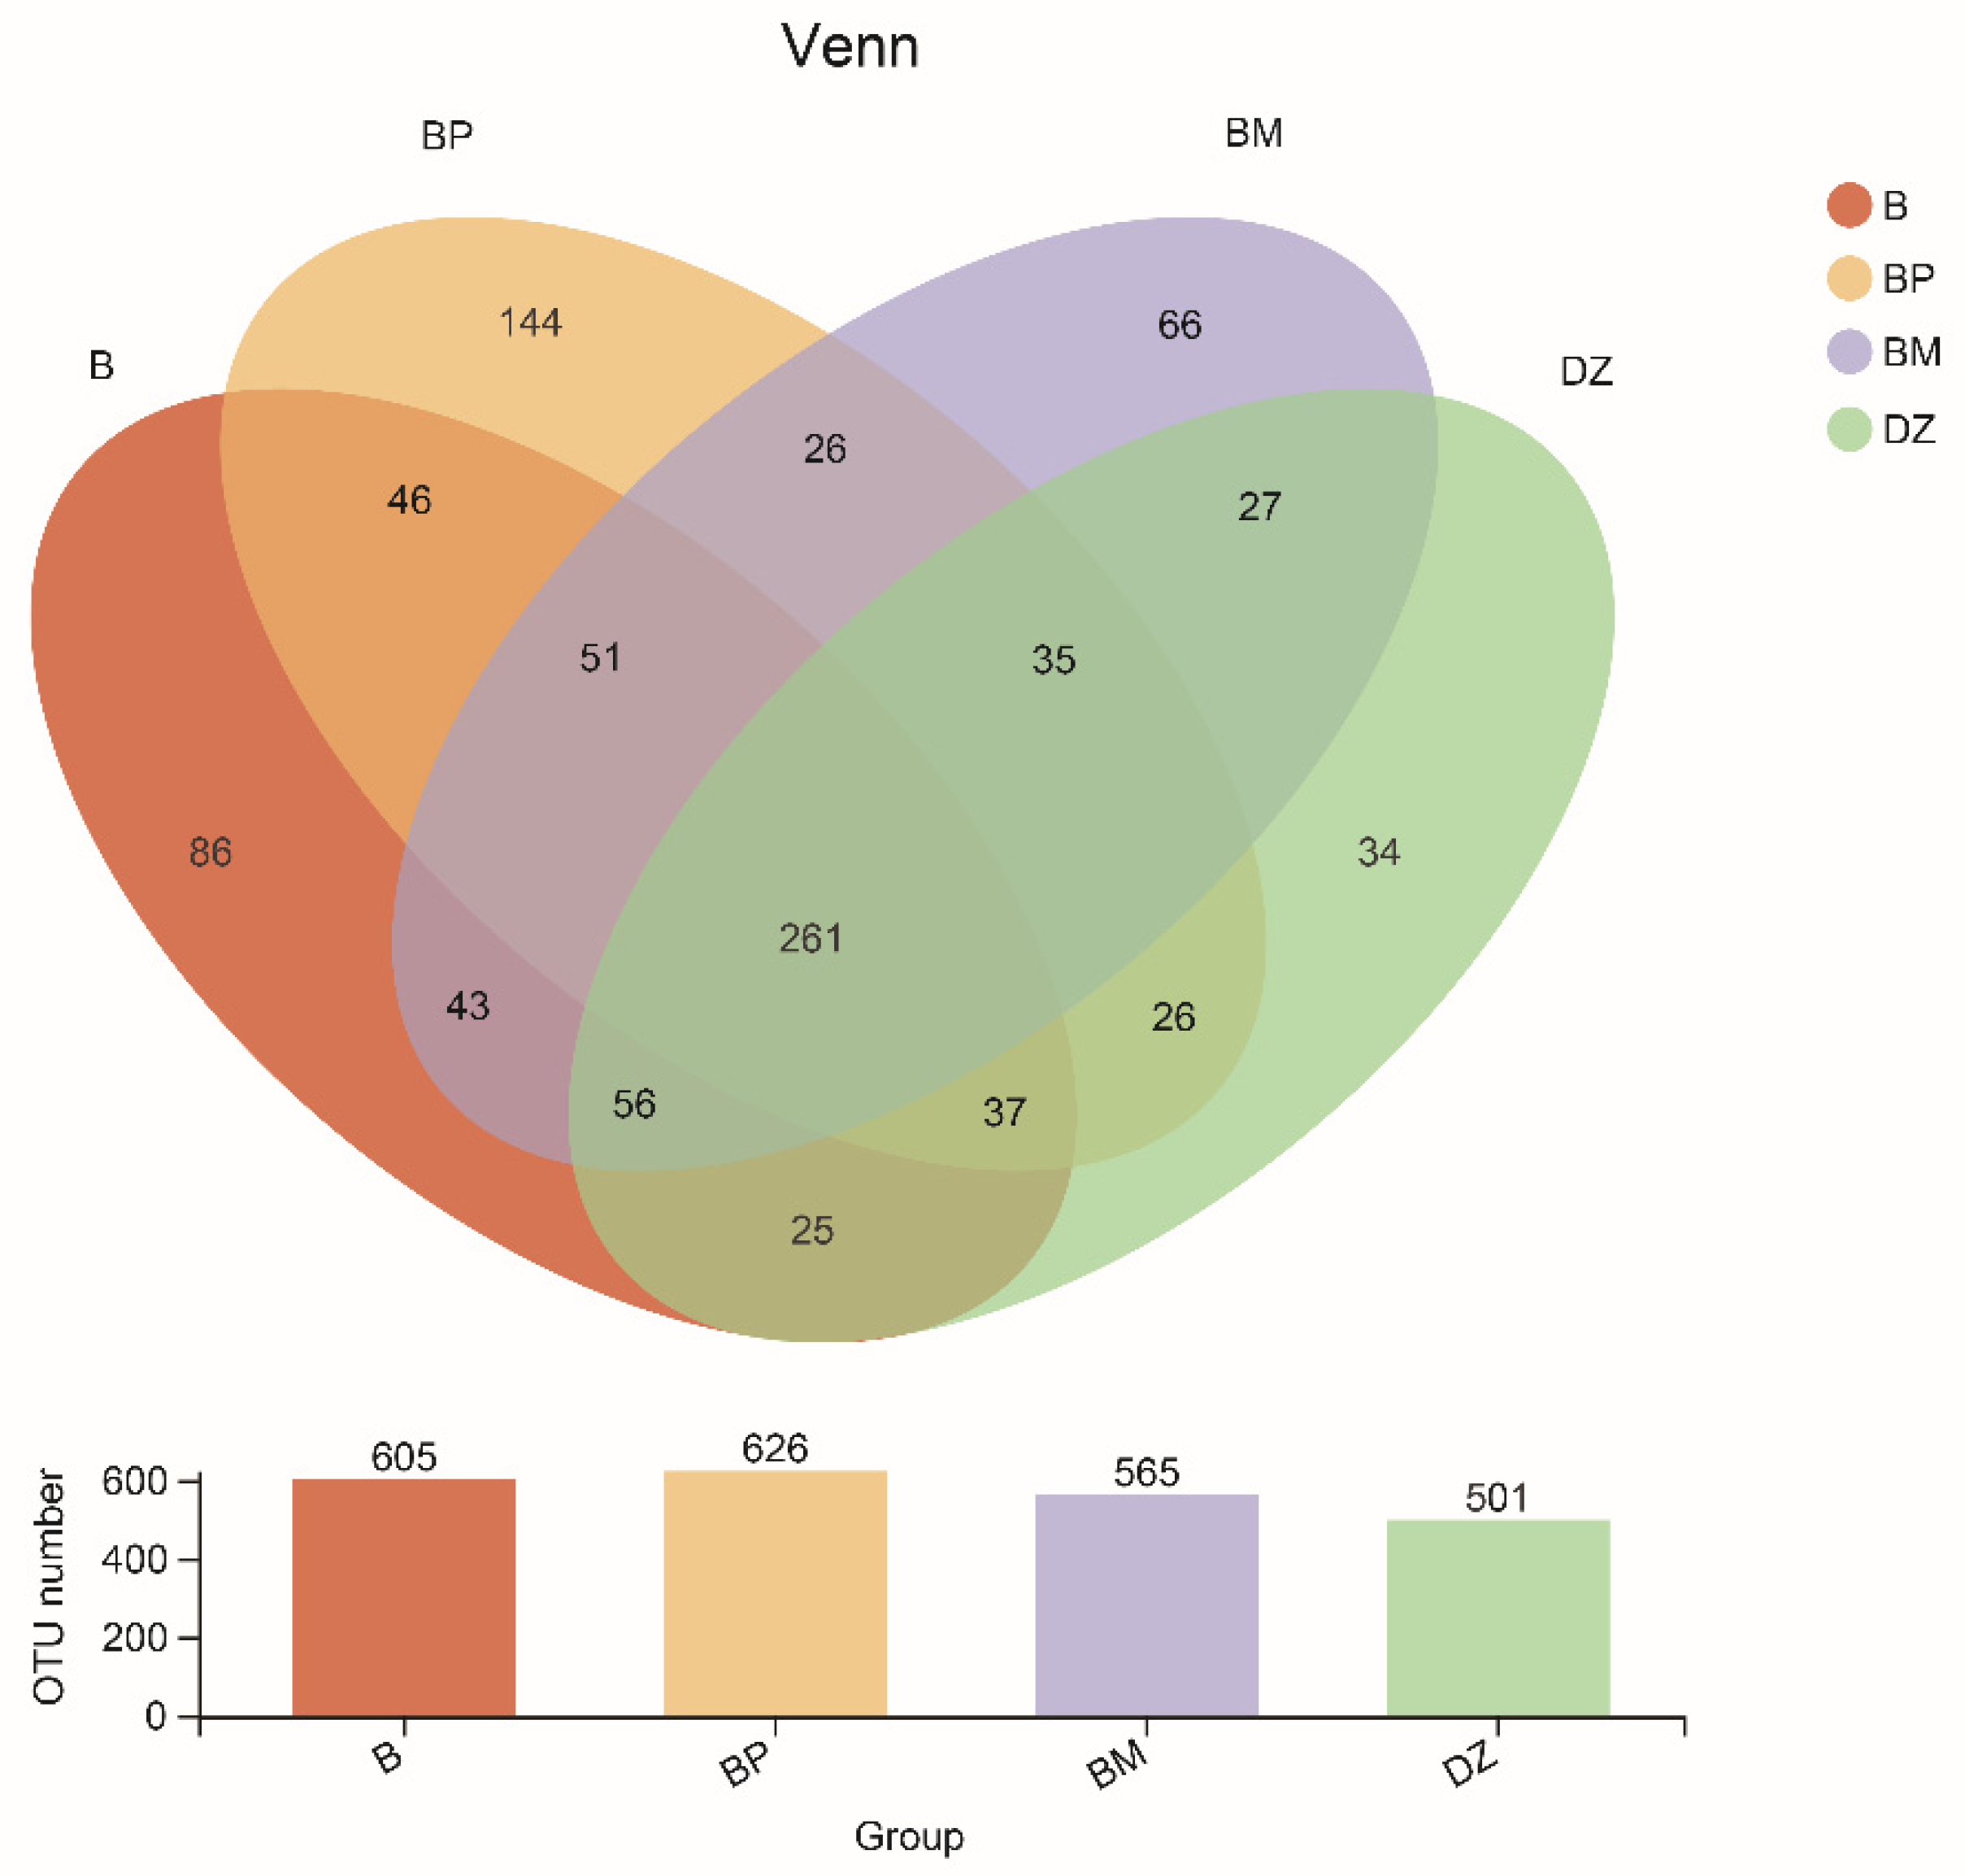
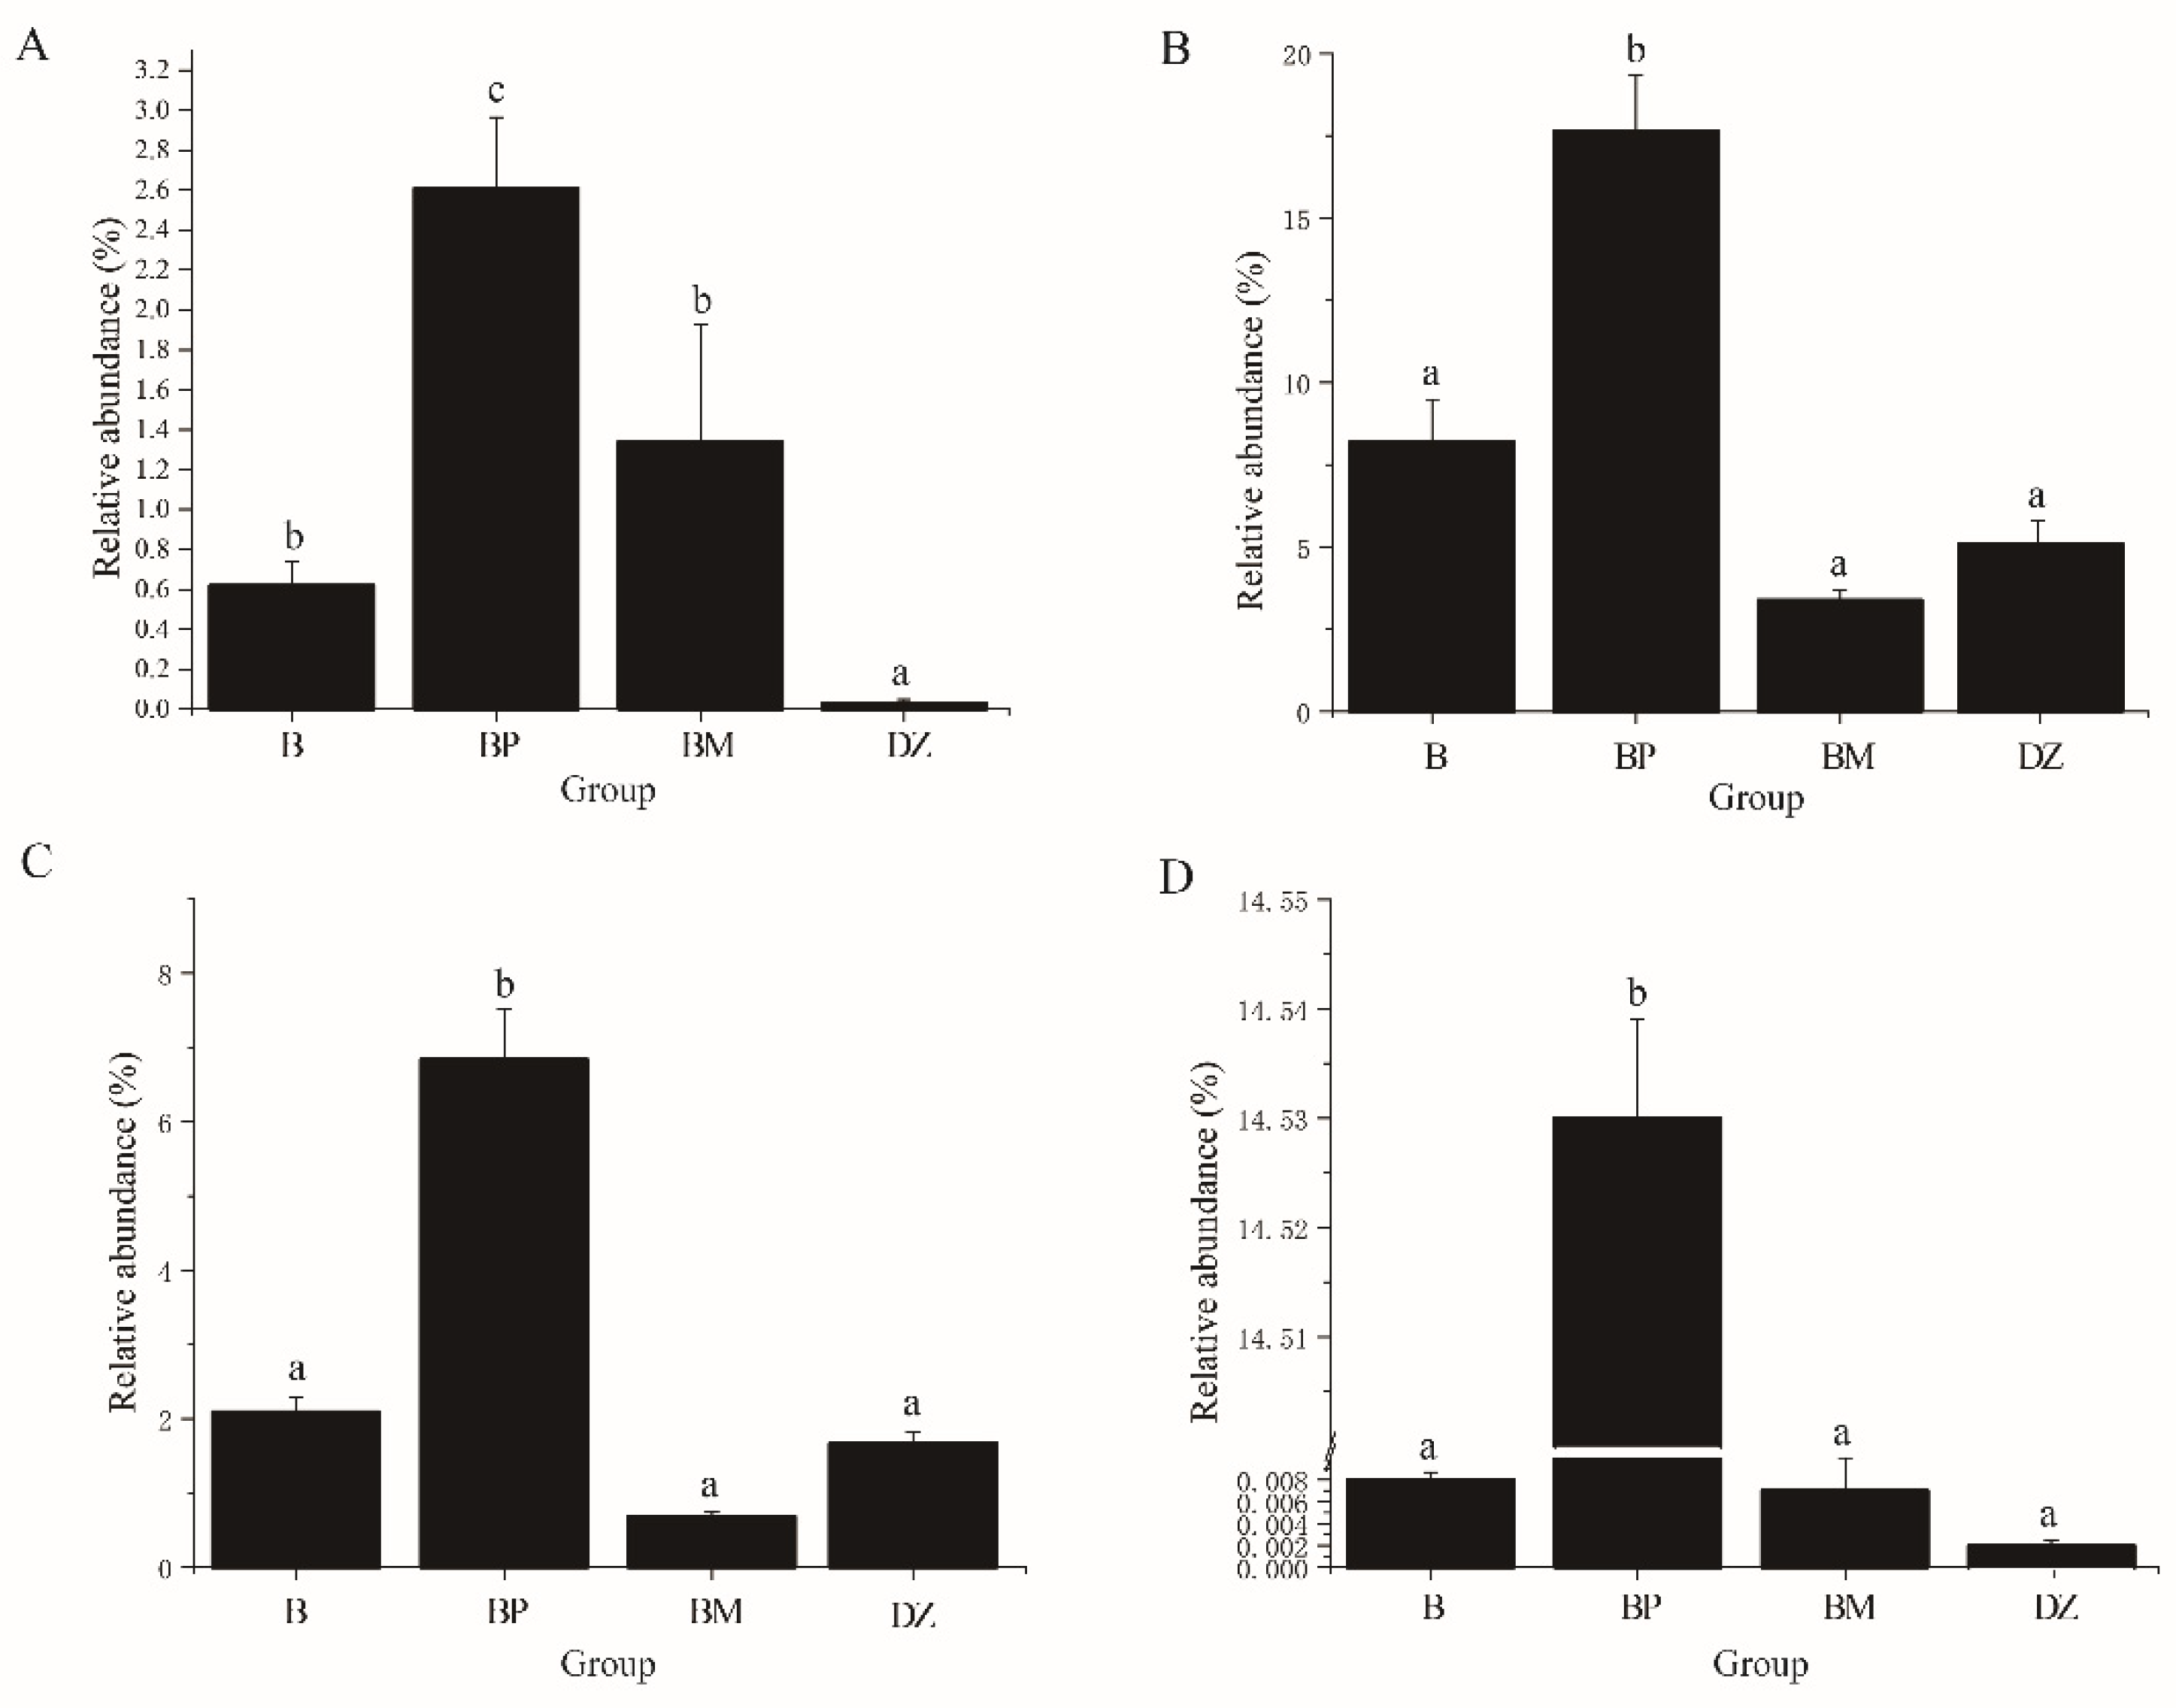
3.3.2. Bacterial Community Composition

There were 501, 605, 626, and 565 OTUs in the DZ, B, BP, and BM groups, respectively (Figure 5). In addition, the unique OTUs in the DZ, B, BP, and BM groups were 34, 86, 144, and 66, respectively. The group with the lowest number of specific OTUs was the control group, while the most were found in the BP group.
The predominant phyla were Proteobacteria, Bacteroidetes, Actinobacteria, and Verrucomicrobia (Figure 6A). The relative abundance of the phylum Bacteroidetes was significantly lower in the BP group than in the control group (p < 0.05). However, the relative abundance of the phylum Proteobacteria was distinctly higher compared with the control (p < 0.05). In addition, the relative abundance of the phylum Verrucomicrobia in the B group was observably higher than that in the other groups (p < 0.05).
Additionally, the classes Alphaproteobacteria, Flavobacteriia, Actinobacteria, and Verrucomicrobiae dominated each group (Figure 6B). The relative abundance of Flavobacteria was significantly lower in the BP group than in the other groups (p < 0.05). Compared to the control, the relative abundance of Alphaproteobacteria was significantly increased in the BP group (p < 0.05). Besides, the relative abundance of Verrucomicrobiae was remarkably higher in the B group than in the other groups (p < 0.05).
At the order level, Rhodobacterales, Flavobacteriales, Propionibacteriales, Rhizobiales, and Verrucomicrobiales were the dominant bacterial taxa in each treatment (Figure 6C). The relative abundance of Flavobacteriales was significantly lower in the BP group than in the other groups (p < 0.05). In contrast, the abundance of Rhizobiales and Rhodobacterales, which belong to the bacterial taxonomic class Alphaproteobacteria of the phylum Proteobacteria, was significantly increased in the BP group compared with the control (p < 0.05). In addition, the relative abundance of Verrucomicrobiales was prominently higher in the B group than in the other groups (p < 0.05).
At the family level, Rhodobacteraceae, Flavobacteriaceae, Propionibacteriaceae, Phyllobacteriaceae, and Verrucomicrobiaceae were relatively abundant and dominant in each treatment (Figure 6D). The relative abundance of Flavobacteriaceae in the BP group was notably lower than that in the other groups (p < 0.05), while the abundance of Phyllobacteriaceae and Rhodobacteraceae in the BP group was significantly higher than that in the control group (p < 0.05). Furthermore, Verrucomicrobiaceae in the B group was more abundant than in the other groups (p < 0.05).
At the genus level, the unclassified Rhodobacteraceae, Donghicola, Ruegeria, Tessaracoccus, Oricola, and Marivita dominated the B, BP, and BM groups (Figure 6E). As depicted in Figure 7, the relative abundance of Oricola spp., Donghicola spp., and Marivita spp. was significantly higher in the BP group than in the other groups (p < 0.05). Compared with the control, the relative abundance of Bacillus spp. in groups B, BP, and BM was significantly increased, and the relative abundance of Bacillus spp. in the BP group was significantly higher than that in groups B and BM (p < 0.05).

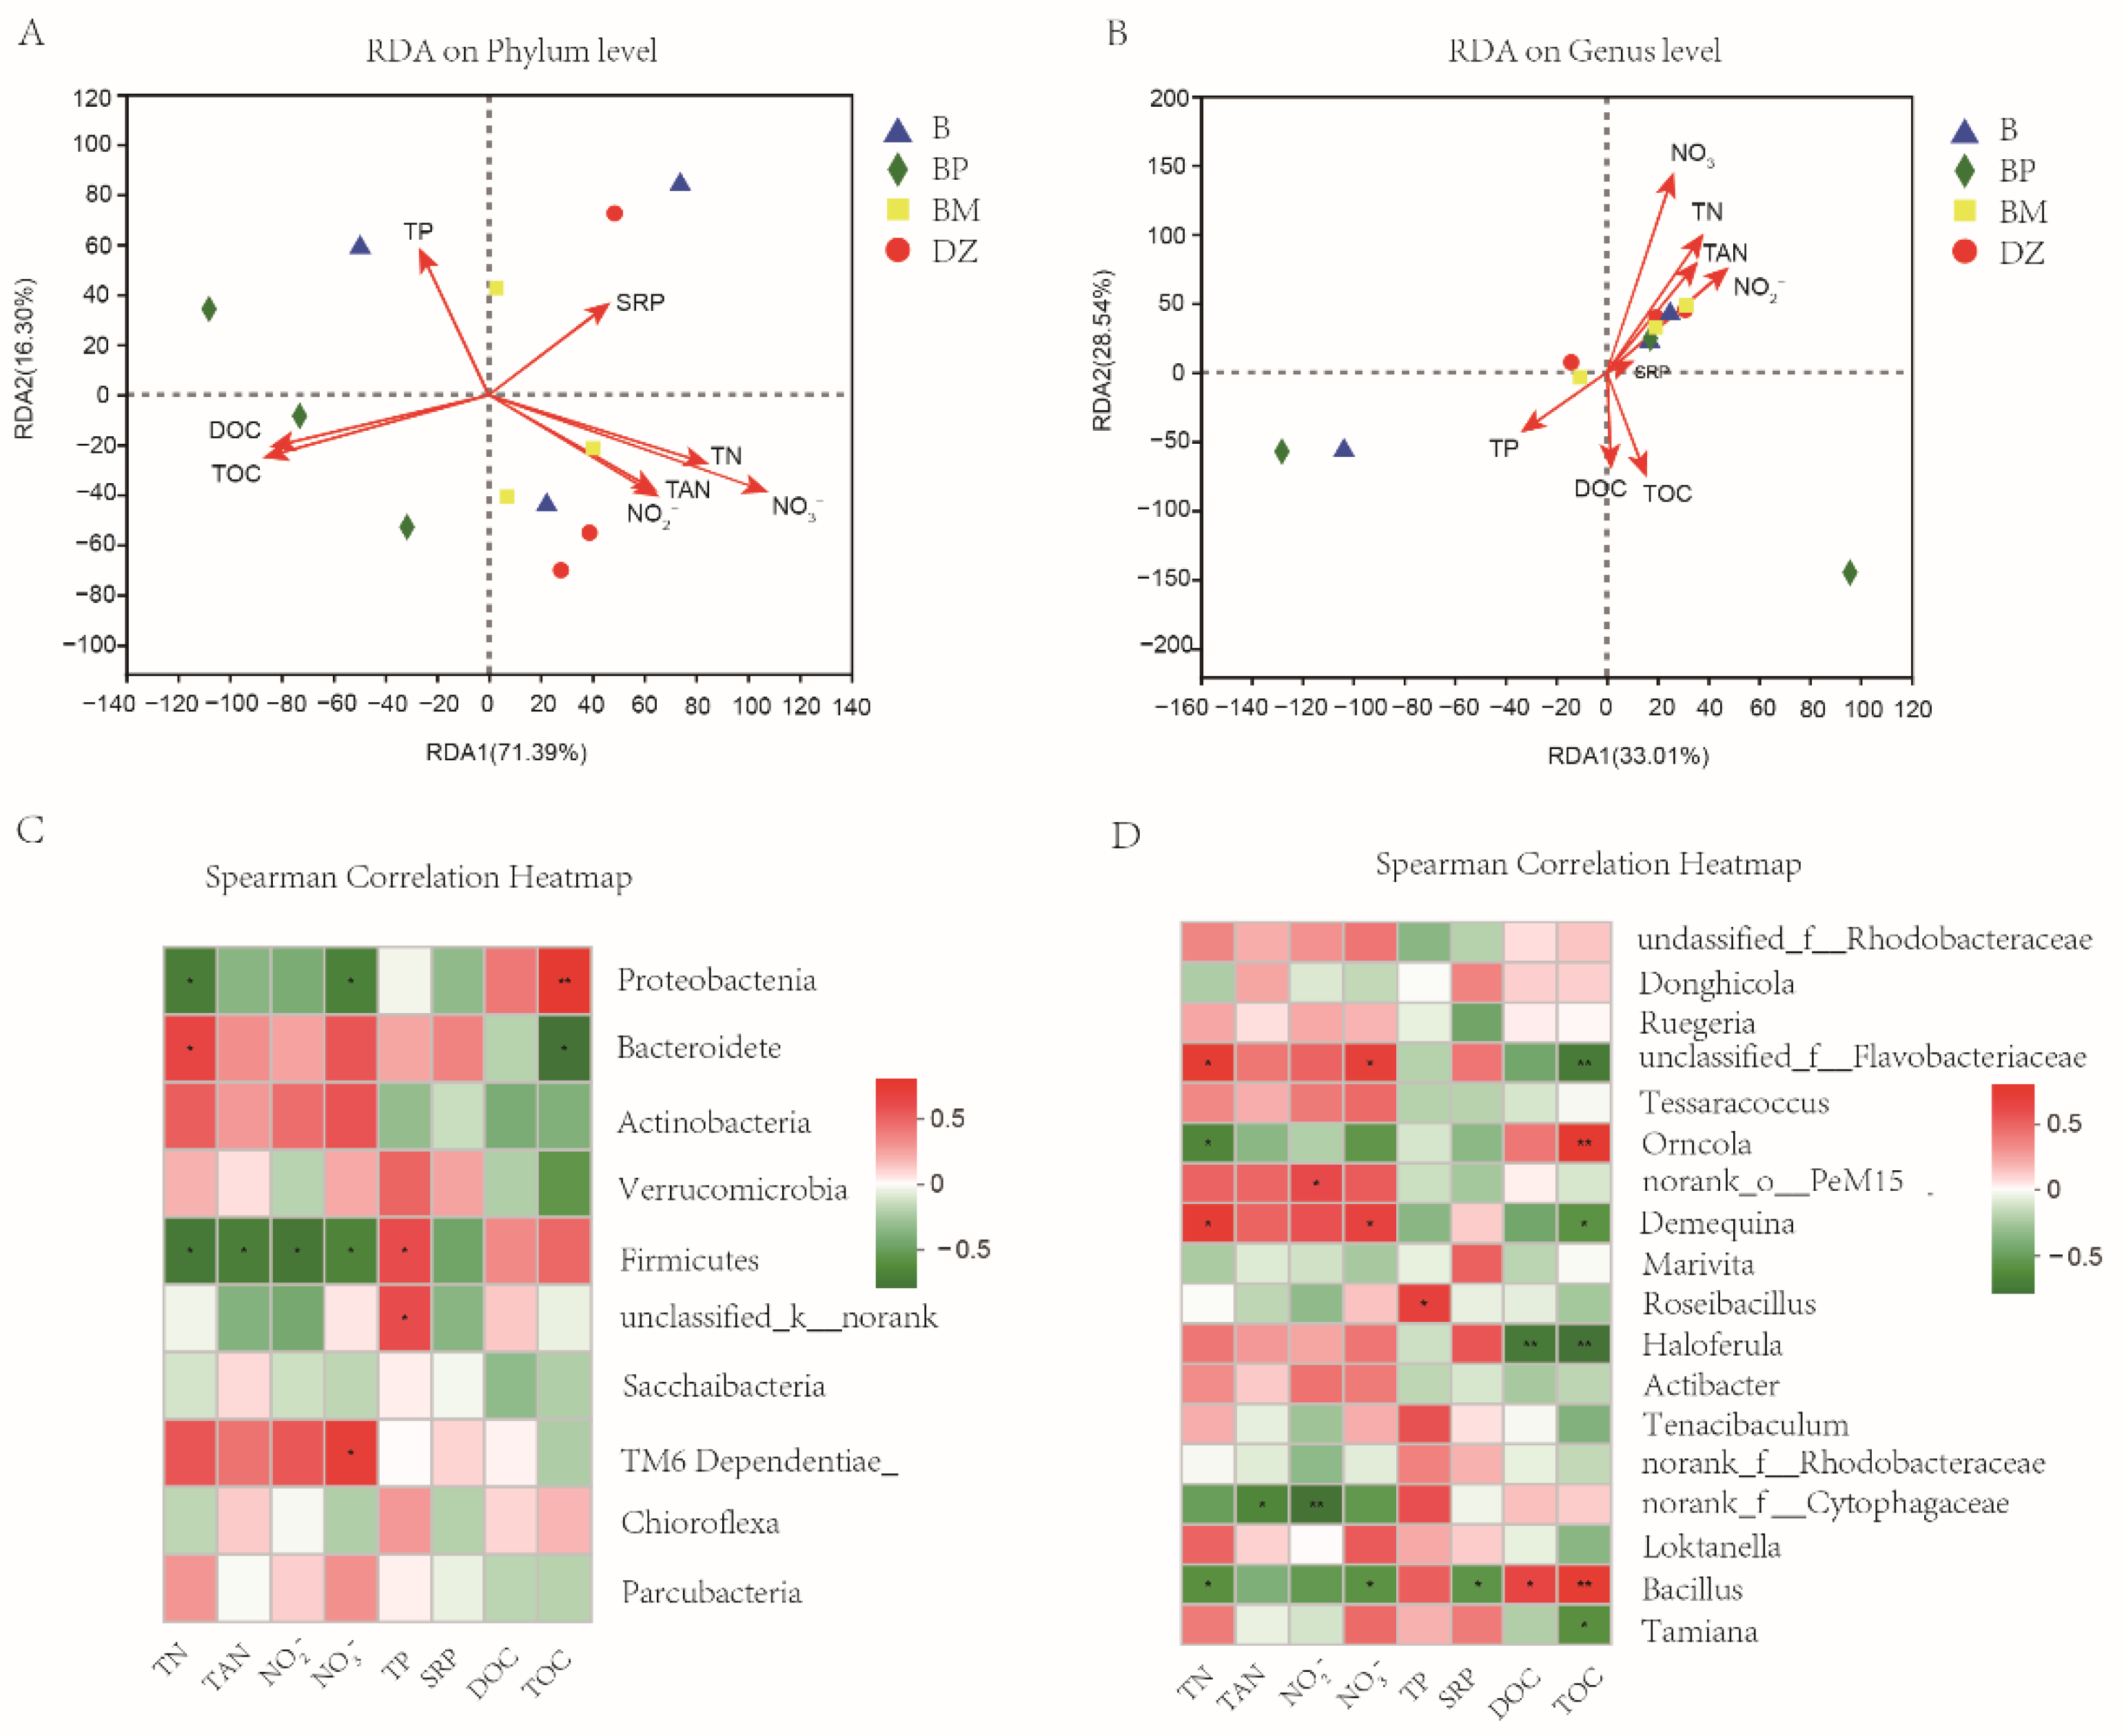
3.3.3. The Correlation of Water Quality Indexes and Microbial Community Structure

Redundancy analysis (RDA) revealed the effects of environmental variables (TAN, NO2-N, NO3-N, TN, SRP, TP, DOC, and TOC) on microbial community structure. It can be seen that TAN, NO2-N, NO3-N, and TN had strong positive impacts on the distribution of flora at the phylum level on the first typical axis, and the above four environmental factors had synergistic effects on community structure (Figure 8A). In contrast, DOC and TOC had strong negative effects on the distribution of flora at the phylum level on the first typical axis, and the two environmental factors had synergistic effects on community structure. In addition, nitrate nitrogen was the most influential variable that had a significant effect on bacterial community structure (r2 = 0.538, p = 0.043).
Similar to the phylum level, TAN, NO2-N, NO3-N, and TN had strong positive effects on the distribution of flora at the genus level on the second typical axis, and the four environmental factors had synergistic effects on community structure (Figure 8B). In addition, DOC and TOC had strong negative effects on the distribution of flora at the genus level on the second typical axis, and the two environmental factors also had synergistic effects on community structure. Moreover, nitrate nitrogen had the greatest effect on bacterial community structure at the genus level (r2 = 0.409, p = 0.038).
The correlation between environmental variables and bacteria was explored by calculating Spearman coefficients of water quality factors and bacterial taxa at phylum and genus levels, respectively. At the phylum level, Proteobacteria showed a significant positive correlation with TOC (p < 0.05), while it showed a significant negative correlation with nitrate nitrogen and total nitrogen, respectively (p < 0.05) (Figure 8C). In addition, the phylum Firmicutes was significantly negatively correlated with ammonia nitrogen, nitrite nitrogen, nitrate nitrogen, and total nitrogen, respectively (p < 0.05). Besides, the phylum Bacteroidetes had a significant negative correlation with TOC (p < 0.05) but had a significant positive correlation with total nitrogen (p < 0.05).
At the genus level, Bacillus spp. showed a significant positive correlation (p < 0.05) with DOC and TOC but had a significant negative correlation with nitrate nitrogen and total nitrogen (p < 0.05) (Figure 8D). Additionally, Oricola spp. was positively correlated with TOC (p < 0.05) while negatively correlated with total nitrogen (p < 0.05). The unclassified_f__Flavobacteriaceae spp. and Demequina spp. both had a significant negative correlation with TOC, while they had a significant positive correlation with nitrate nitrogen and total nitrogen (p < 0.05).

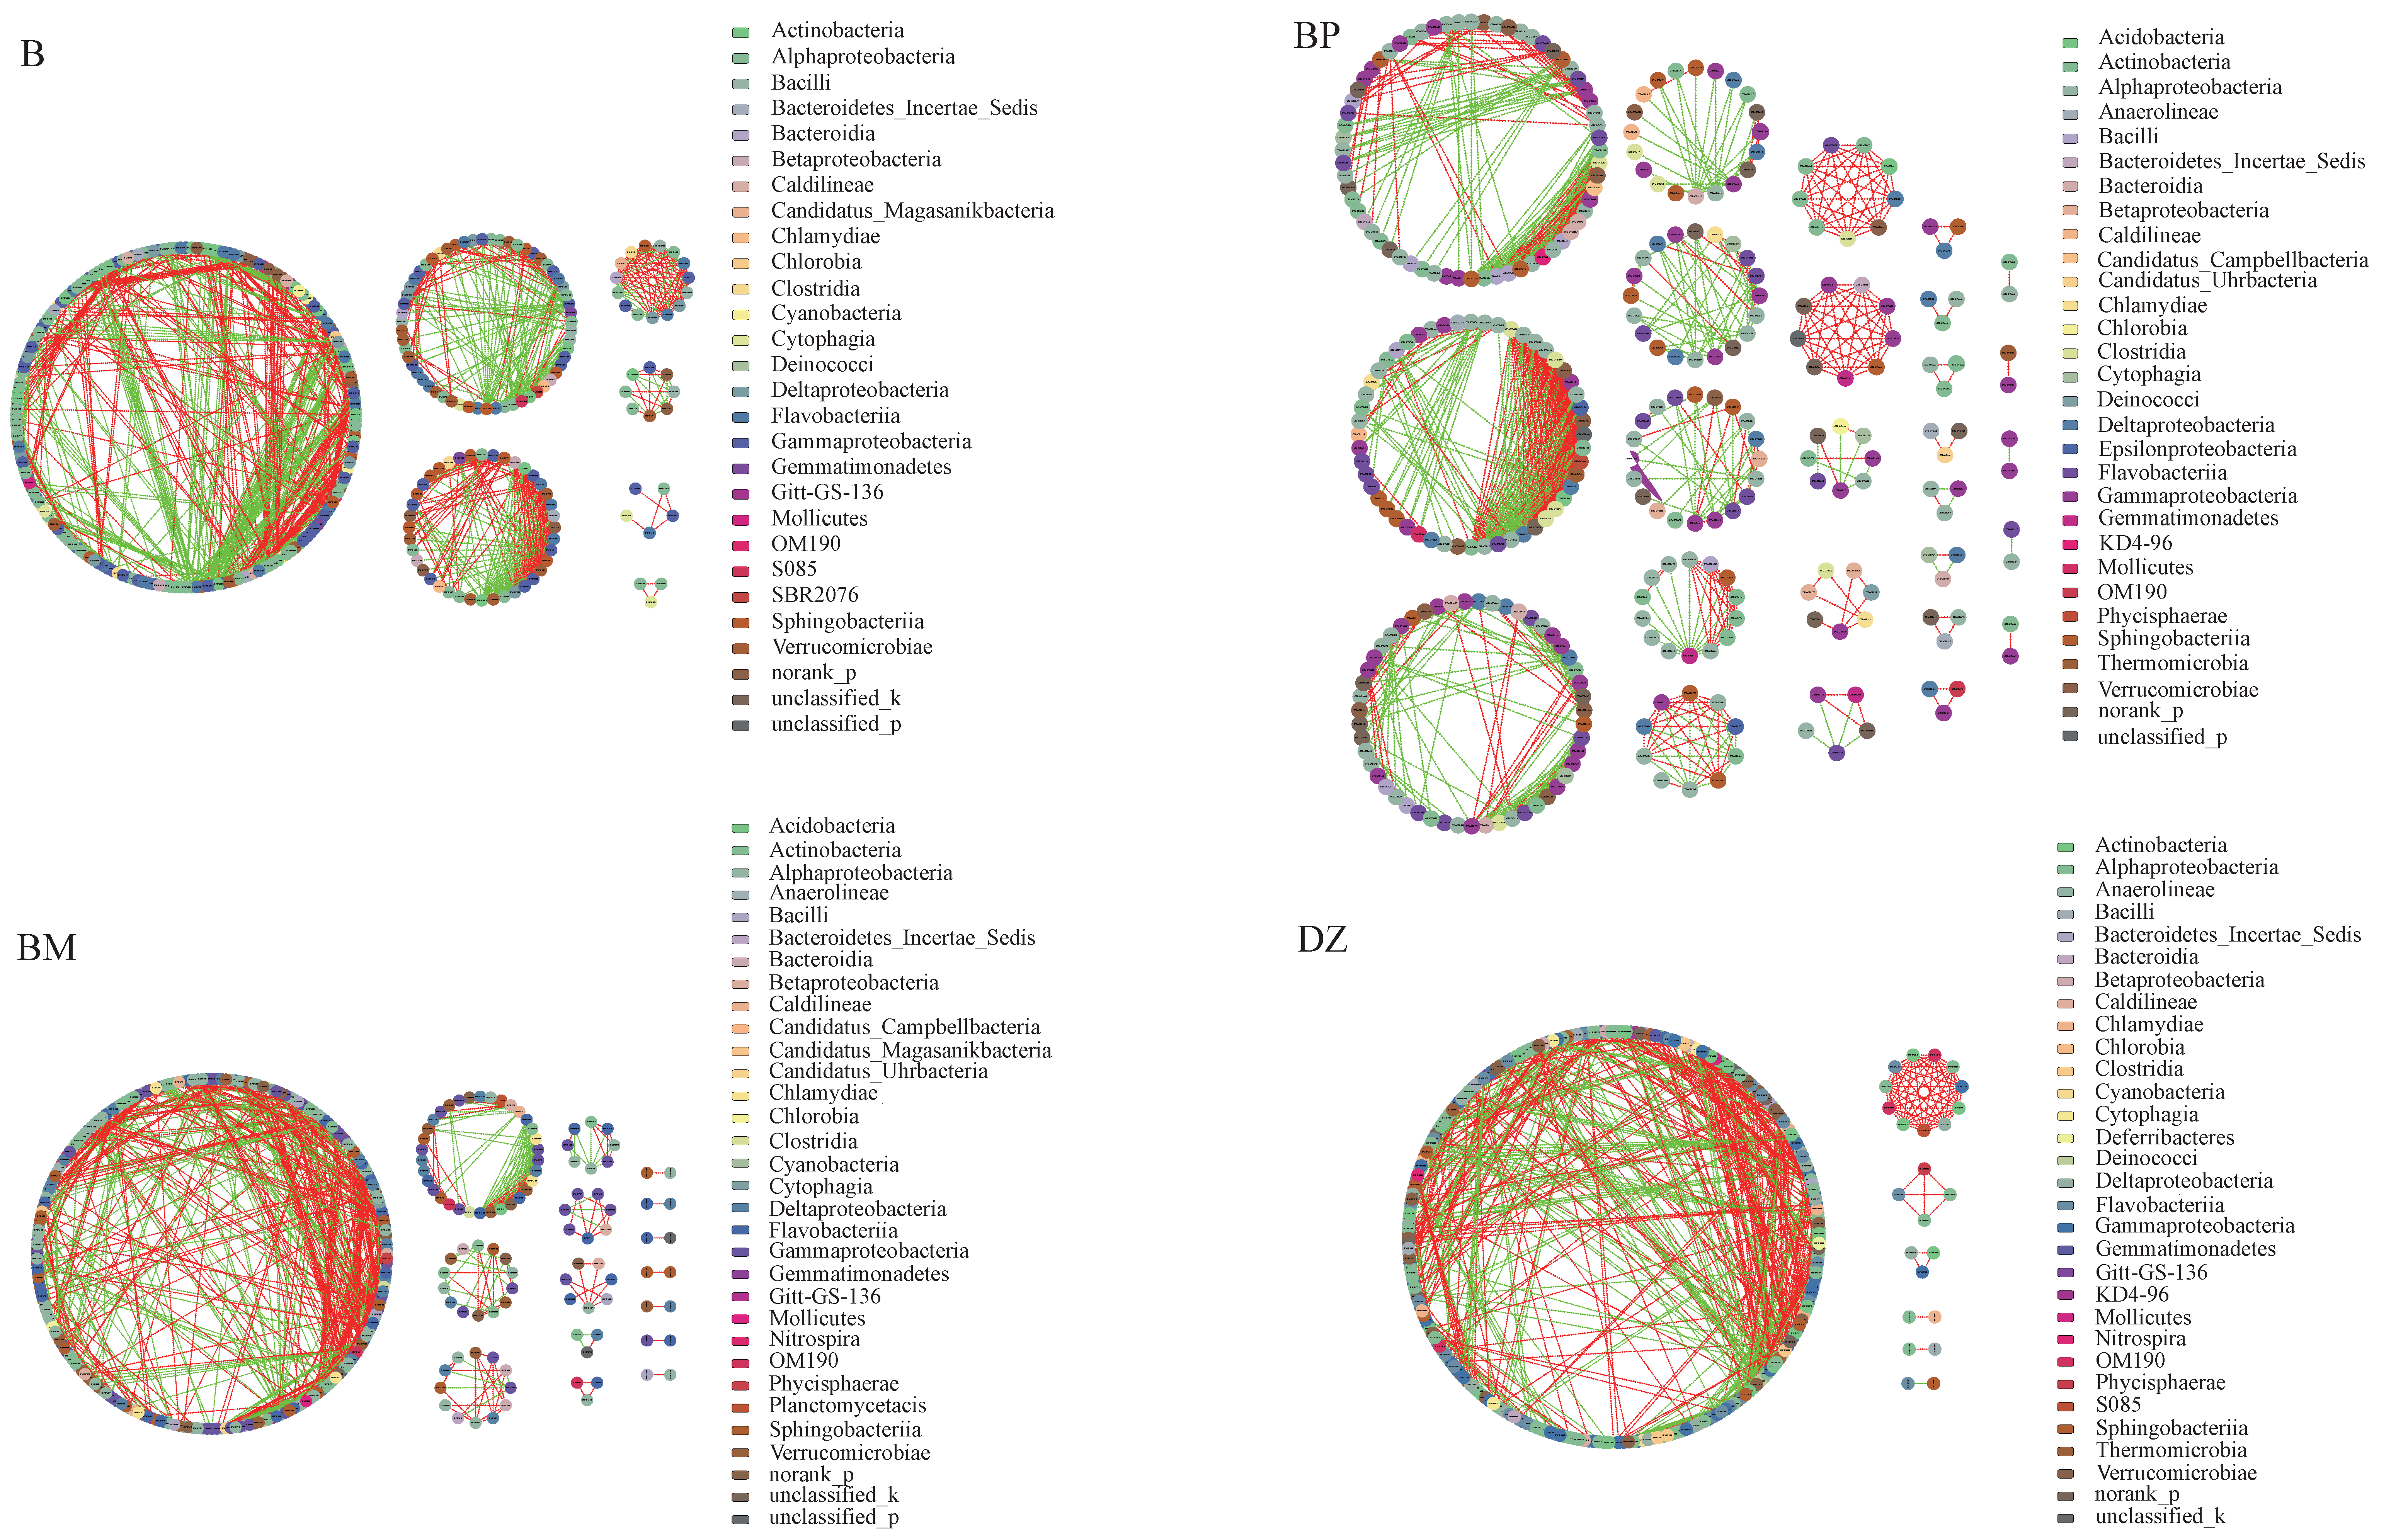
3.3.4. Ecological Network Analysis

Ecological network analysis showed that there were more nodes in groups B, BP, and BM than in the control group (Table 3). However, no significant difference was found in negative or positive interactions among different groups. There were more functional modules in the groups to which carbon sources were added (BP and BM) than in the control and B groups, with the highest number of modules in the BP group (Figure 9). The number of functional modules in the B, BP, BM and DZ groups was 7, 26, 16, and 7, respectively.

3.3.5. Predictive Functions of Microbiota in the Water

As shown in Figure 10, compared to the control, eight functional modules (Cationic antimicrobial peptide resistance, photosystem II, coenzyme M biosynthesis, bacilysin biosynthesis, kanosamine biosynthesis, cytochrome aa3-600 menaquinol oxidase, photosystem I and lysine biosynthesis) were significantly improved in the B group (p < 0.05). In the BP group, 12 functional modules (ketone body biosynthesis, pentose phosphate pathway, ethylmalonyl pathway, entner-Doudoroff pathway, hydroxypropionate-hydroxybutylate cycle, urea cycle, cobalamin biosynthesis, D-Galacturonate degradation, purine degradation, tyrosine biosynthesis, and molybdenum cofactor biosynthesis and nicotinate degradation) were significantly higher than the control (p < 0.05). However, 19 functional modules (tetrahydrobiopterin biosynthesis, C4-dicarboxylic acid cycle, nodulation, N-glycan precursor biosynthesis, tetrahydrofolate biosynthesis, threonine biosynthesis, biotin biosynthesis, biotin biosynthesis of BioW pathway, methionine degradation, assimilatory sulfate reduction, abscisic acid biosynthesis, tetrahydrofolate biosynthesis, ascorbate biosynthesis, dTDP-L-rhamnose biosynthesis, pyrimidine ribonucleotide biosynthesis, and coenzyme A biosynthesis) were significantly decreased (p < 0.05). In the BM group, three functional modules (coenzyme M biosynthesis, N-glycan biosynthesis, and assimilatory nitrate reduction) were enriched (p < 0.05), whereas one functional module (D-Glucuronate degradation) was significantly decreased (p < 0.05).

4. Discussion

4.1. Effects of Addition of B. pumilus 171 and Carbon Sources on the Growth Performance of Shrimp

Many previous studies have shown that the addition of probiotics to culture water can promote the growth of aquatic animals by improving FER and regulating the balance of aquatic flora, and reducing toxic substances such as ammonia and nitrite [8,9,32,33]. The results from the present study were consistent with the above findings. Higher survival rate and gross weight of shrimp were observed in the group with the single addition of B. pumilus BP-171 compared to the control. In addition to probiotics, carbon sources with the property of improving growth performance were also observed [34,35,36,37,38,39]. In this study, the shrimp in the group to which both B. pumilus BP-171 and carbon sources were added showed better growth performance than the group to which only one probiotic was added, and the group using PHBV as a carbon source showed the best performance. The above results suggest that B. pumilus BP-171 promoted the growth performance of shrimp, and a suitable carbon source such as PHBV could further enhance the growth-promoting function of probiotics.

4.2. Effects of the Addition of B. pumilus 171 and Carbon Sources on the Water Quality

Some probiotics, such as Bacillus spp. could be used to improve water quality by reducing the concentration of ammonia and nitrite in the culture system [7,8,9]. For example, Lee et al. [40] found that total NH4+ concentration was significantly lower when Bacillus spp. were added to the culture system. Decreased nitrite concentration was observed when B. subtilis FY99-01 was used in the culture system of P. vannamei [32]. Barman et al. [23] also found that B. cereus PB45 could consume nitrite in the culture pond effluent. The addition of carbon sources could also promote the removal of nitrogen from water by increasing the C/N ratio [2,16,17]. However, to our knowledge, the effects of combining probiotics and carbon sources on aquaculture water quality have rarely been reported. In this study, B. pumilus BP-171, a heterotrophic nitrifying-aerobic denitrifying strain isolated from shrimp ponds [29], was tested in a shrimp culture system. This strain can not only convert ammonia nitrogen into bacterial biomass by heterotrophic assimilation but also convert nitrite and nitrate nitrogen into gaseous nitrogen by denitrification [29]. This study showed that the concentration of ammonia nitrogen was reduced by more than 60% in the B and BP groups compared to the control, while the concentration of nitrite nitrogen was reduced by more than 69% in the B and BP groups. The removal rates of ammonia and nitrite nitrogen in the B group reached 70.22% and 76.88%, respectively. The average concentrations of nitrate nitrogen in the B and BP groups were reduced by more than 17%, while the concentrations of total nitrogen in the B and BP groups were reduced by more than 35%. The nitrate and total nitrogen removal rates in group BP were 26.24% and 40.02%, respectively. In conclusion, the addition of B. pumilus BP-171 alone could reduce the concentrations of ammonia and nitrite in the culture system, while the simultaneous addition of B. pumilus BP-171 and PHBV could reduce the concentrations of nitrate and total nitrogen. In addition, PHBV was better than molasses both as a solid carbon source and as a biofilm carrier when used together with B. pumilus BP-171.

4.3. Effects of Addition of B. pumilus 171 and Carbon Sources on the Microbial Diversity and Microbiota Compositions in Water

Bacillus spp. is a type of common probiotic used as a water quality improver in aquaculture systems [7,8,9,41]. BP-171 is a strain of heterotrophic nitrifying-aerobic denitrifying bacteria isolated from shrimp environments with high nitrogen removal capacity [29]. In this study, a single B. pumilus BP-171 and various combinations of B. pumilus BP-171 with PHBV and molasses were added to the shrimp culture system. Interestingly, no significant difference in the Ace, Chao, Shannon, and Simpson indices of microbiota was observed between the groups in this study, which was in agreement with the results of Kokkuar et al. [3]. However, the addition of B. pumilus BP-171 and carbon sources altered the microbiota composition in the water. The number of OTUs and unique OTUs in the B, BP, and BM groups were all higher than that in the control, and that in the BP group was the highest. In addition, the microbial composition at various taxonomic levels differed distinctly in the different groups.
The abundance of the phylum Verrucomicrobia, the class Verrucomicrobiae, the order Verrucomicrobiales, and the family Verrucomicrobiaceae was significantly higher in group B, to which only B. pumilus BP-171 was added, than in the other groups. Although the role of Verrucomicrobia in aquaculture has rarely been reported, some studies have shown that they were widely distributed in drinking water, freshwater lakes, and marine sediments [42]. In addition, some Verrucomicrobia taxa isolated from seawater have been shown to be strictly aerobic chemoheterotrophs that use mono- or disaccharides as carbon and energy sources and can convert nitrate nitrogen to nitrite nitrogen [43,44]. Besides, some Verrucomicrobia taxa, which can utilize a variety of organic and inorganic gas molecules such as methane, carbon dioxide, ammonia, and nitrogen gas, were involved in the natural carbon and nitrogen cycles [45]. Thus, Verrucomicrobia might involve in the conversion of nitrogen in the culture system, leading to the low concentration of ammonia and nitrite nitrogen in the B group.
The relative abundance of the phylum Proteobacteria in the BP group was significantly increased compared with the control when B. pumilus BP-171 and PHBV were added simultaneously. Previous studies have shown that the phylum Proteobacteria was widely distributed in various regions of the marine environments [46], and many microorganisms involved in nitrogen removal belong to this phylum, including nitrifying and denitrifying bacteria [47]. In this study, it was demonstrated that the abundance of phylum Proteobacteria had a negative correlation with the concentration of nitrate and total nitrogen, which might be one origin of a lower concentration of nitrate and total nitrogen in the BP group. In addition, the relative abundance of the class Alphaproteobacteria in the BP group reached 75.01%, which was strikingly higher than in other groups. Alphaproteobacteria have been shown to have excellent denitrification ability [47,48]. Moreover, the abundance of several dominant bacteria of various taxonomic levels belonging to the class Alphaproteobacteria was significantly higher in the BP group than in the control. For example, the order Rhodobacterales and Rhizobiales, the family Erythrobacteriaceae and Rhizobacteriaceae, and the genus Donghicola, Oricola, and Marivita as well as Bacillus, whose relative abundance was significantly higher in the BP group than in the control. Rhodobacterales is considered to be the most abundant denitrifying bacterium widely distributed in the environment [49]. Hu et al. [50] found that the family Rhodobacteraceae, as one of the core taxa in shrimp culture ponds, removed nitrite nitrogen from the system mainly by denitrification. Besides, the genus taxa of Donghicola and Marivita, which were isolated from seawater and are both Gram-negative and aerobic, belong to the class Rhodobacteraceae, but their role in bacterial communities has hardly been studied [51]. The order Rhizobiales, a type of heterotrophic bacteria with denitrification character, was found to be the second most abundant functional bacterium in ammonia-oxidizing anaerobic systems with a relative abundance of 18.2% [52]. The family Phyllobacteriaceae was a group of aerobic bacteria that can utilize various forms of nitrogen for reproduction and was found in marine environments [53,54]. In addition, Zheng et al. [55] identified the most abundant transporter proteins involved in the transport and uptake of carbohydrates from a strain of Oricola sp. based on metagenomic and metaproteomic analysis. Among them, three proteins involved in ammonia assimilation and a large number of genes involved in the uptake and metabolism of inorganic nitrogen were also observed in this strain [55]. These results suggest that Oricola sp. might be able to utilize carbon sources in the environment and participate in the conversion and removal of nitrogen.
Many studies have shown that Bacillus plays an important role in nitrogen cycling via nitrification [56] and denitrification [57]. B. pumilus BP-171 was periodically added into different shrimp culture systems in this study. Although an increase in the relative abundance of Bacillus spp. compared to other taxa in the microbial community was not observed, the relative abundance of Bacillus spp. in groups B, BP, and BM was significantly higher than in the control. Of course, due to methodological limitations, it could not be determined whether the Bacillus spp. was the strain BP-171. The results of the present study showed that the microbial composition shifted distinctly at different taxonomic levels when B. pumilus BP-171 and different combinations of the strain BP-171 with PHBV and molasses were added. It was also found that the relative abundance of Oricola spp. was positively correlated with TOC concentration, while the relative abundance of Bacillus spp. was positively correlated with the concentration of TOC and DOC, indicating that the addition of carbon source promoted the proliferation of Oricola spp. and Bacillus spp. Furthermore, the relative abundance of Bacillus spp. showed a significant negative correlation between the concentration of nitrate nitrogen and total nitrogen, while the relative abundance of Oricola spp. showed a significant negative correlation with total nitrogen concentration, suggesting an increase in the abundance of Bacillus spp. and Oricola spp. promoted the conversion and removal of nitrogen. The above correlations between the relative abundance of bacteria, the concentration of TOC and DOC, and the concentration of nitrate and total nitrogen might partially explain the higher removal rate of nitrate nitrogen and total nitrogen in the BP group.

4.4. Effects of Addition of B. pumilus 171 and Carbon Sources on the Ecological Network and Function of the Microbial Community

The complicated ecological network consisted of negative interactions and positive interactions of interspecies in the bacterial community, which sustained the stability of the bacterial ecosystem in water [58,59]. In general, the cooperative network involving mutualism or synergy bacteria can be efficient but not stable [60]. Negative interactions such as competition can weaken the efficiency of the cooperating network but enhance its stability [60]. In this study, a higher ratio of negative to positive interactions was observed in the ecological network of the BP group, suggesting that the addition of PHBV might strengthen the stability of the shrimp culture ecosystem. Moreover, each module was considered a functional unit, performing an identifiable task [58,61]. In the present study, the largest number of modules was observed in the BP group, which indicated that the addition of PHBV could alter the bacteria in the water to perform more biological functions.
The functional modules in the KEGG Module database represent cellular and organismal level functions, and these modules generally contain various molecular level functions stored in the KO (KEGG Orthology) database [62]. The bacterial community in water can affect the growth of aquatic animals in various ways, such as the inhibition of pathogenic bacteria and the secretion of nutrients [9,11,13,15]. The antimicrobial effect of organic acids has been demonstrated [63,64,65]. Hydroxybutyrate can exert its inhibitory effect against pathogenic Vibrio bacteria [66,67]. In this study, the function prediction analysis showed that 8, 12, and 3 functional modules were significantly enhanced in groups B, BP, and BM, respectively. The hydroxypropionate-hydroxybutylate cycle, ethylmalonyl pathway, and the metabolic activity of organic acids, such as fumarate, were significantly enhanced in the BP group. In addition, previous studies have shown that urea dissolved free amino acids, as well as inorganic nitrogen together sustained the nitrogen demand of bacteria for growth in natural water [68,69]. In the present study, the urea cycle, metabolic activities of nutrient substances such as tyrosine, pyruvate, glyceraldehyde-3P, ribose 5P, and cobalamin, as well as molybdenum cofactor were also remarkably enhanced. Just as previous research has shown that many invertebrates like shrimps have demonstrated the ability to take up a variety of organic compounds, including amino acids, even against the concentration gradient [70,71,72,73,74]. Therefore, the overall promotion of numerous metabolic functions of the microbial community in the water might be partially responsible for the improvement in shrimp growth performance.

5. Conclusions

In summary, probiotics and various combinations of probiotics with different carbon resources had differential impacts on the growth performance of shrimp, water quality, and bacterial community in the P. vannamei culture system. The addition of BP-171 and carbon sources could promote the growth of shrimp to varying degrees and improve the yield of farmed shrimp, with the best in the group of simultaneous addition of BP-171 and PHBV. The single addition of BP-171 could effectively reduce the concentration of ammonia and nitrite nitrogen in the culture system, and the simultaneous addition of BP-171 and PHBV could effectively improve the removal rates of nitrate and total nitrogen. In addition, the addition of BP-171 and carbon sources did not change the abundance and diversity of the bacterial community in the shrimp culture system but altered the structure and function of the bacterial community and enhanced the stability of the community’s ecological network.

Supplementary Materials

The following supporting information can be downloaded at: https://www.mdpi.com/article/10.3390/w14244037/s1, Table S1: Composition of the basic feed; Figure S1: Analysis of rarefaction curves.

Author Contributions

Conceptualization, methodology, and writing—original draft preparation, X.T. and M.W.; investigation, Y.L., K.L. and Q.L.; formal analysis, M.W. and T.L.; visualization, Y.L. and K.L.; data curation and project administration, M.W. and T.L.; writing—review and editing, validation, resources, supervision and funding acquisition, X.T. All authors have read and agreed to the published version of the manuscript.

Funding

This study was funded by the National Key Research and Development Program of China (2020YFD0900201, 2019YFD0900403), and the Joint Fund of Think Tank for Biomanufacturing Industry of Qingdao (QDSWZK202111).

Data Availability Statement

The data from this study are available from the corresponding author upon reasonable request.

Acknowledgments

We thank all the students whom participated the field works and laboratory analysis.

Conflicts of Interest

The authors declare no conflict of interest.

References

  1. Goh, J.X.H.; Tan, L.T.; Law, J.W.; Ser, H.; Khaw, K.; Letchumanan, V.; Lee, L.; Goh, B. Harnessing the Potentialities of Probiotics, Prebiotics, Synbiotics, Paraprobiotics, and Postbiotics for Shrimp Farming. Rev. Aquac. 2022, 14, 1478–1557. [Google Scholar] [CrossRef]
  2. Robles-Porchas, G.R.; Gollas-Galván, T.; Martínez-Porchas, M.; Martínez-Cordova, L.R.; Miranda-Baeza, A.; Vargas-Albores, F. The Nitrification Process for Nitrogen Removal in Biofloc System Aquaculture. Rev. Aquac. 2020, 12, 2228–2249. [Google Scholar] [CrossRef]
  3. Kokkuar, N.; Li, L.; Srisapoome, P.; Dong, S.; Tian, X. Application of Biodegradable Polymers as Carbon Sources in Ex Situ Biofloc Systems: Water Quality and Shift of Microbial Community. Aquac. Res. 2021, 52, 3570–3579. [Google Scholar] [CrossRef]
  4. Hlordzi, V.; Kuebutornye, F.K.A.; Afriyie, G.; Abarike, E.D.; Lu, Y.; Chi, S.; Anokyewaa, M.A. The Use of Bacillus Species in Maintenance of Water Quality in Aquaculture: A Review. Aquac. Rep. 2020, 18, 100503. [Google Scholar] [CrossRef]
  5. Lieke, T.; Meinelt, T.; Hoseinifar, S.H.; Pan, B.; Straus, D.L.; Steinberg, C.E.W. Sustainable Aquaculture Requires Environmental-friendly Treatment Strategies for Fish Diseases. Rev. Aquac. 2020, 12, 943–965. [Google Scholar] [CrossRef] [Green Version]
  6. Zokaeifar, H.; Babaei, N.; Saad, C.R.; Kamarudin, M.S.; Sijam, K.; Balcazar, J.L. Administration of Bacillus subtilis Strains in the Rearing Water Enhances the Water Quality, Growth Performance, Immune Response, and Resistance against Vibrio Harveyi Infection in Juvenile White Shrimp, Litopenaeus vannamei. Fish Shellfish Immunol. 2014, 36, 68–74. [Google Scholar] [CrossRef]
  7. Devaraja, T.; Banerjee, S.; Yusoff, F.; Shariff, M.; Khatoon, H. A holistic approach for selection of Bacillus spp. as a bioremediator for shrimp postlarvae culture. Turk. J. Biol. 2013, 37, 92–100. [Google Scholar] [CrossRef]
  8. Kuebutornye, F.K.A.; Abarike, E.D.; Lu, Y. A Review on the Application of Bacillus as Probiotics in Aquaculture. Fish Shellfish Immunol. 2019, 87, 820–828. [Google Scholar] [CrossRef]
  9. Soltani, M.; Ghosh, K.; Hoseinifar, S.H.; Kumar, V.; Lymbery, A.J.; Roy, S.; Ringø, E. Genus Bacillus, Promising Probiotics in Aquaculture: Aquatic Animal Origin, Bio-Active Components, Bioremediation and Efficacy in Fish and Shellfish. Rev. Fish. Sci. Aquac. 2019, 27, 331–379. [Google Scholar] [CrossRef] [Green Version]
  10. Crab, R.; Defoirdt, T.; Bossier, P.; Verstraete, W. Biofloc Technology in Aquaculture: Beneficial Effects and Future Challenges. Aquaculture 2012, 356–357, 351–356. [Google Scholar] [CrossRef]
  11. Abbaszadeh, A.; Keyvanshokooh, S.; Yavari, V.; Naderi, M. Proteome Modifications of Pacific White Shrimp (Litopenaeus vannamei) Muscle under Biofloc System. Aquac. Nutr. 2019, 25, 358–366. [Google Scholar] [CrossRef]
  12. Gao, F.; Liao, S.; Liu, S.; Bai, H.; Wang, A.; Ye, J. The Combination Use of Candida tropicalis HH8 and Pseudomonas stutzeri LZX301 on Nitrogen Removal, Biofloc Formation and Microbial Communities in Aquaculture. Aquaculture 2019, 500, 50–56. [Google Scholar] [CrossRef]
  13. El-Saadony, M.T.; Alagawany, M.; Patra, A.K.; Kar, I.; Tiwari, R.; Dawood, M.A.O.; Dhama, K.; Abdel-Latif, H.M.R. The Functionality of Probiotics in Aquaculture: An Overview. Fish Shellfish Immunol. 2021, 117, 36–52. [Google Scholar] [CrossRef] [PubMed]
  14. Duan, Y.; Zhang, Y.; Dong, H.; Wang, Y.; Zhang, J. Effect of the Dietary Probiotic Clostridium Butyricum on Growth, Intestine Antioxidant Capacity and Resistance to High Temperature Stress in Kuruma Shrimp Marsupenaeus japonicus. J. Therm. Biol. 2017, 66, 93–100. [Google Scholar] [CrossRef] [PubMed]
  15. Dash, P.; Tandel, R.S.; Bhat, R.A.H.; Mallik, S.; Pandey, N.N.; Singh, A.K.; Sarma, D. The Addition of Probiotic Bacteria to Microbial Floc: Water Quality, Growth, Non-Specific Immune Response and Disease Resistance of Cyprinus Carpio in Mid-Himalayan Altitude. Aquaculture 2018, 495, 961–969. [Google Scholar] [CrossRef]
  16. Dauda, A.B. Biofloc Technology: A Review on the Microbial Interactions, Operational Parameters and Implications to Disease and Health Management of Cultured Aquatic Animals. Rev. Aquac. 2020, 12, 1193–1210. [Google Scholar] [CrossRef]
  17. Ray, A.J.; Lotz, J.M. Comparing a Chemoautotrophic-Based Biofloc System and Three Heterotrophic-Based Systems Receiving Different Carbohydrate Sources. Aquac. Eng. 2014, 63, 54–61. [Google Scholar] [CrossRef]
  18. Pérez-Fuentes, J.A.; Hernández-Vergara, M.P.; Pérez-Rostro, C.I.; Fogel, I. C: N Ratios Affect Nitrogen Removal and Production of Nile Tilapia Oreochromis niloticus Raised in a Biofloc System under High Density Cultivation. Aquaculture 2016, 452, 247–251. [Google Scholar] [CrossRef]
  19. De Schryver, P.; Crab, R.; Defoirdt, T.; Boon, N.; Verstraete, W. The Basics of Bio-Flocs Technology: The Added Value for Aquaculture. Aquaculture 2008, 277, 125–137. [Google Scholar] [CrossRef]
  20. Li, Y.; Li, T.; Tian, X.; Luo, K.; Wang, L.; Zhang, S.; Wei, C.; Liu, Y. Effects of probiotics and polyhydroxybutyrate on growth and non-specific immunity of Litopenaeus vannamei and its culturing water quality. Period. Ocean Univ. China 2021, 51, 22–31. [Google Scholar] [CrossRef]
  21. Xu, Z.; Song, L.; Dai, X.; Chai, X. PHBV Polymer Supported Denitrification System Efficiently Treated High Nitrate Concentration Wastewater: Denitrification Performance, Microbial Community Structure Evolution and Key Denitrifying Bacteria. Chemosphere 2018, 197, 96–104. [Google Scholar] [CrossRef]
  22. Xu, Z.; Dai, X.; Chai, X. Biological Denitrification Using PHBV Polymer as Solid Carbon Source and Biofilm Carrier. Biochem. Eng. J. 2019, 146, 186–193. [Google Scholar] [CrossRef]
  23. Barman, P.; Kati, A.; Mandal, A.K.; Bandyopadhyay, P.; Mohapatra, P.K.D. Biopotentiality of Bacillus cereus PB45 for Nitrogenous Waste Detoxification in Ex Situ Model. Aquac. Int. 2017, 25, 1167–1183. [Google Scholar] [CrossRef]
  24. Sun, X.; Li, Q.; Zhang, Y.; Liu, H.; Zhao, J.; Qu, K. Phylogenetic analysis and nitrogen removal characteristics of a heterotrophic nitrifying-aerobic denitrifying bacteria strain from marine environment. Acta Microbiol. Sin. 2012, 52, 687–695. [Google Scholar] [CrossRef]
  25. Zhao, K.; Tian, X.; Li, H.; Dong, S.; Jiang, W. Characterization of a Novel Marine Origin Aerobic Nitrifying–Denitrifying Bacterium Isolated from Shrimp Culture Ponds. Aquac. Res. 2019, 50, 1770–1781. [Google Scholar] [CrossRef]
  26. Xie, F.; Thiri, M.; Wang, H. Simultaneous Heterotrophic Nitrification and Aerobic Denitrification by a Novel Isolated Pseudomonas mendocina X49. Bioresour. Technol. 2021, 319, 124198. [Google Scholar] [CrossRef]
  27. Lei, X.; Jia, Y.; Chen, Y.; Hu, Y. Simultaneous Nitrification and Denitrification without Nitrite Accumulation by a Novel Isolated Ochrobactrum Anthropic LJ81. Bioresour. Technol. 2019, 272, 442–450. [Google Scholar] [CrossRef]
  28. Chen, P.; Li, J.; Li, Q.X.; Wang, Y.; Li, S.; Ren, T.; Wang, L. Simultaneous Heterotrophic Nitrification and Aerobic Denitrification by Bacterium Rhodococcus Sp. CPZ24. Bioresour. Technol. 2012, 116, 266–270. [Google Scholar] [CrossRef]
  29. Song, J.; Zhao, K.; Tian, X.; Xie, Y.; He, Y.; Dong, S. Effects of different environmental factors and carbon and nitrogen sources on the nitrogen removing performance of Bacillus pumilus BP-171. Period. Ocean. Univ. China 2019, 49, 34–42. [Google Scholar] [CrossRef]
  30. Avnimelech, Y. Carbon/Nitrogen Ratio as a Control Element in Aquaculture Systems. Aquaculture 1999, 176, 227–235. [Google Scholar] [CrossRef]
  31. Edgar, R.C. UPARSE: Highly Accurate OTU Sequences from Microbial Amplicon Reads. Nat. Methods 2013, 10, 996–998. [Google Scholar] [CrossRef] [PubMed]
  32. Wu, D.X.; Zhao, S.M.; Peng, N.; Xu, C.P.; Wang, J.; Liang, Y.X. Effects of a Probiotic (Bacillus subtilis FY99-01) on the Bacterial Community Structure and Composition of Shrimp (Litopenaeus vannamei, Boone) Culture Water Assessed by Denaturing Gradient Gel Electrophoresis and High-Throughput Sequencing. Aquac. Res. 2016, 47, 857–869. [Google Scholar] [CrossRef]
  33. Moriarty, D.J.W. Control of Luminous Vibrio Species in Penaeid Aquaculture Ponds. Aquaculture 1998, 164, 351–358. [Google Scholar] [CrossRef]
  34. Azim, M.E.; Little, D.C. The Biofloc Technology (BFT) in Indoor Tanks: Water Quality, Biofloc Composition, and Growth and Welfare of Nile Tilapia (Oreochromis Niloticus). Aquaculture 2008, 283, 29–35. [Google Scholar] [CrossRef]
  35. Megahed, M.E.; Mohamed, K. Sustainable Growth of Shrimp Aquaculture Through Biofloc Production as Alternative to Fishmeal in Shrimp Feeds. J. Agric. Sci. 2014, 6, p176. [Google Scholar] [CrossRef] [Green Version]
  36. Khanjani, M.H.; Sajjadi, M.M.; Alizadeh, M.; Sourinejad, I. Nursery Performance of Pacific White Shrimp (Litopenaeus vannamei Boone, 1931) Cultivated in a Biofloc System: The Effect of Adding Different Carbon Sources. Aquac. Res. 2017, 48, 1491–1501. [Google Scholar] [CrossRef]
  37. Crab, R.; Avnimelech, Y.; Defoirdt, T.; Bossier, P.; Verstraete, W. Nitrogen Removal Techniques in Aquaculture for a Sustainable Production. Aquaculture 2007, 270, 1–14. [Google Scholar] [CrossRef] [Green Version]
  38. Emerenciano, M.; Cuzon, G.; Arévalo, M.; Miquelajauregui, M.M.; Gaxiola, G. Effect of Short-Term Fresh Food Supplementation on Reproductive Performance, Biochemical Composition, and Fatty Acid Profile of Litopenaeus vannamei (Boone) Reared under Biofloc Conditions. Aquac. Int. 2013, 21, 987–1007. [Google Scholar] [CrossRef]
  39. Ahmad, I.; Babitha Rani, A.M.; Verma, A.K.; Maqsood, M. Biofloc Technology: An Emerging Avenue in Aquatic Animal Healthcare and Nutrition. Aquac. Int. 2017, 25, 1215–1226. [Google Scholar] [CrossRef] [Green Version]
  40. Lee, C.; Kim, S.; Shin, J.; Kim, M.-G.; Gunathilaka, B.E.; Kim, S.H.; Kim, J.E.; Ji, S.-C.; Han, J.E.; Lee, K.-J. Dietary Supplementations of Bacillus Probiotic Improve Digestibility, Growth Performance, Innate Immunity, and Water Ammonia Level for Pacific White Shrimp, Litopenaeus vannamei. Aquac. Int. 2021, 29, 2463–2475. [Google Scholar] [CrossRef]
  41. Abdel-Latif, H.M.R.; Yilmaz, E.; Dawood, M.A.O.; Ringø, E.; Ahmadifar, E.; Yilmaz, S. Shrimp Vibriosis and Possible Control Measures Using Probiotics, Postbiotics, Prebiotics, and Synbiotics: A Review. Aquaculture 2022, 551, 737951. [Google Scholar] [CrossRef]
  42. Op den Camp, H.J.M.; Islam, T.; Stott, M.B.; Harhangi, H.R.; Hynes, A.; Schouten, S.; Jetten, M.S.M.; Birkeland, N.-K.; Pol, A.; Dunfield, P.F. Environmental, Genomic and Taxonomic Perspectives on Methanotrophic Verrucomicrobia: Perspectives on Methanotrophic Verrucomicrobia. Environ. Microbiol. Rep. 2009, 1, 293–306. [Google Scholar] [CrossRef]
  43. Yoon, J.; Matsuo, Y.; Adachi, K.; Nozawa, M.; Matsuda, S.; Kasai, H.; Yokota, A. Description of Persicirhabdus sediminis Gen. Nov., Sp. Nov., Roseibacillus ishigakijimensis Gen. Nov., Sp. Nov., Roseibacillus ponti Sp. Nov., Roseibacillus persicicus Sp. Nov., Luteolibacter pohnpeiensis Gen. Nov., Sp. Nov. and Luteolibacter algae Sp. Nov., Six Marine Members of the Phylum “Verrucomicrobia”, and Emended Descriptions of the Class Verrucomicrobiae, the Order Verrucomicrobiales and the Family Verrucomicrobiaceae. Int. J. Syst. Evol. Microbiol. 2008, 58, 998–1007. [Google Scholar] [CrossRef] [PubMed]
  44. Szuróczki, S.; Abbaszade, G.; Szabó, A.; Bóka, K.; Schumann, P.; Tóth, E. Phragmitibacter flavus Gen. Nov., Sp. Nov. a New Member of the Family Verrucomicrobiaceae. Int. J. Syst. Evol. Microbiol. 2020, 70, 2108–2114. [Google Scholar] [CrossRef] [PubMed]
  45. Schmitz, R.A.; Peeters, S.H.; Versantvoort, W.; Picone, N.; Pol, A.; Jetten, M.S.M.; Op den Camp, H.J.M. Verrucomicrobial Methanotrophs: Ecophysiology of Metabolically Versatile Acidophiles. FEMS Microbiol. Rev. 2021, 45, fuab007. [Google Scholar] [CrossRef] [PubMed]
  46. Arrigo, K.R. Marine Microorganisms and Global Nutrient Cycles. Nature 2005, 437, 349–355. [Google Scholar] [CrossRef]
  47. Gao, Y.; Wang, X.; Li, J.; Lee, C.T.; Ong, P.Y.; Zhang, Z.; Li, C. Effect of Aquaculture Salinity on Nitrification and Microbial Community in Moving Bed Bioreactors with Immobilized Microbial Granules. Bioresour. Technol. 2020, 297, 122427. [Google Scholar] [CrossRef]
  48. Wyman, M.; Hodgson, S.; Bird, C. Denitrifying Alphaproteobacteria from the Arabian Sea That Express NosZ, the Gene Encoding Nitrous Oxide Reductase, in Oxic and Suboxic Waters. Appl. Environ. Microbiol. 2013, 79, 2670–2681. [Google Scholar] [CrossRef] [Green Version]
  49. Wang, Y.; Qi, L.; Huang, R.; Wang, F.; Wang, Z.; Gao, M. Characterization of Denitrifying Community for Application in Reducing Nitrogen: A Comparison of NirK and NirS Gene Diversity and Abundance. Appl. Biochem. Biotechnol. 2020, 192, 22–41. [Google Scholar] [CrossRef]
  50. Hu, D.; Wang, L.; Zhao, R.; Zeng, J.; Shao, Z. Core Microbiome Involved in Nitrite Removal in Shrimp Culture Ponds. Aquac. Res. 2022, 53, 1663–1675. [Google Scholar] [CrossRef]
  51. Hameed, A.; Shahina, M.; Lin, S.-Y.; Nakayan, P.; Liu, Y.-C.; Lai, W.-A.; Hsu, Y.-H. Youngimonas vesicularis Gen. Nov., Sp. Nov., of the Family Rhodobacteraceae, Isolated from Surface Seawater, Reclassification of Donghicola xiamenensis Tan et al. 2009 as Pseudodonghicola xiamenensis Gen. Nov., Comb. Nov. and Emended Description of the Genus Donghicola yoon et al. 2007. Int. J. Syst. Evol. Microbiol. 2014, 64, 2729–2737. [Google Scholar] [CrossRef] [PubMed] [Green Version]
  52. Islam Chowdhury, M.M.; Nakhla, G. Anammox Enrichment: Impact of Sludge Retention Time on Nitrogen Removal. Environ. Technol. 2021, 43, 4426–4437. [Google Scholar] [CrossRef] [PubMed]
  53. Brailo, M.; Schreier, H.J.; McDonald, R.; Maršić-Lučić, J.; Gavrilović, A.; Pećarević, M.; Jug-Dujaković, J. Bacterial Community Analysis of Marine Recirculating Aquaculture System Bioreactors for Complete Nitrogen Removal Established from a Commercial Inoculum. Aquaculture 2019, 503, 198–206. [Google Scholar] [CrossRef] [PubMed]
  54. Mergaert, J.; Swings, J.  Phyllobacterium. In Bergey’s Manual of Systematics of Archaea and Bacteria; Whitman, W.B., Rainey, F., Kämpfer, P., Trujillo, M., Chun, J., DeVos, P., Hedlund, B., Dedysh, S., Eds.; Wiley: Hoboken, NJ, USA, 2015; pp. 1–7. ISBN 978-1-118-96060-8. [Google Scholar]
  55. Zheng, Q.; Wang, Y.; Lu, J.; Lin, W.; Chen, F.; Jiao, N. Metagenomic and Metaproteomic Insights into Photoautotrophic and Heterotrophic Interactions in a Synechococcus Culture. mBio 2020, 11, e03261-19. [Google Scholar] [CrossRef] [Green Version]
  56. Rout, P.R.; Bhunia, P.; Dash, R.R. Simultaneous Removal of Nitrogen and Phosphorous from Domestic Wastewater Using Bacillus cereus GS-5 Strain Exhibiting Heterotrophic Nitrification, Aerobic Denitrification and Denitrifying Phosphorous Removal. Bioresour. Technol. 2017, 244, 484–495. [Google Scholar] [CrossRef]
  57. Verbaendert, I.; Boon, N.; De Vos, P.; Heylen, K. Denitrification Is a Common Feature among Members of the Genus Bacillus. Syst. Appl. Microbiol. 2011, 34, 385–391. [Google Scholar] [CrossRef]
  58. Deng, Y.; Jiang, Y.-H.; Yang, Y.; He, Z.; Luo, F.; Zhou, J. Molecular Ecological Network Analyses. BMC Bioinform. 2012, 13, 113. [Google Scholar] [CrossRef] [Green Version]
  59. Venturelli, O.S.; Carr, A.V.; Fisher, G.; Hsu, R.H.; Lau, R.; Bowen, B.P.; Hromada, S.; Northen, T.; Arkin, A.P. Deciphering Microbial Interactions in Synthetic Human Gut Microbiome Communities. Mol. Syst. Biol. 2018, 14, e8157. [Google Scholar] [CrossRef]
  60. Coyte, K.Z.; Schluter, J.; Foster, K.R. The Ecology of the Microbiome: Networks, Competition, and Stability. Science 2015, 350, 663–666. [Google Scholar] [CrossRef]
  61. Liu, L.; Wang, M.; Wei, C.; Liu, Y.; Pan, M.; Wang, S.; Cui, L.; Tian, X. Effects of Dietary Poly-β-Hydroxybutyrate Supplementation on the Growth, Non-Specific Immunity, and Intestinal Microbiota of the Sea Cucumber Apostichopus japonicus. Front. Mar. Sci. 2022, 9, 855938. [Google Scholar] [CrossRef]
  62. Kanehisa, M. Enzyme Annotation and Metabolic Reconstruction Using KEGG. In Protein Function Prediction; Kihara, D., Ed.; Methods in Molecular Biology; Springer: New York, NY, USA, 2017; Volume 1611, pp. 135–145. ISBN 978-1-4939-7013-1. [Google Scholar]
  63. Peh, E.; Kittler, S.; Reich, F.; Kehrenberg, C. Antimicrobial Activity of Organic Acids against Campylobacter Spp. and Development of Combinations—A Synergistic Effect? PLoS ONE 2020, 15, e0239312. [Google Scholar] [CrossRef]
  64. Yu, H.; Huang, G.H.; Zhang, X.D.; Li, Y. Inhibitory Effects of Organic Acids on Bacteria Growth During Food Waste Composting. Compos. Sci. Util. 2010, 18, 55–63. [Google Scholar] [CrossRef]
  65. Nieto-Peñalver, C.G.; Savino, M.J.; Bertini, E.V.; Sánchez, L.A.; de Figueroa, L.I.C. Gluconic Acid Produced by Gluconacetobacter Diazotrophicus Pal5 Possesses Antimicrobial Properties. Res. Microbiol. 2014, 165, 549–558. [Google Scholar] [CrossRef] [PubMed]
  66. Defoirdt, T.; Mai Anh, N.T.; De Schryver, P. Virulence-Inhibitory Activity of the Degradation Product 3-Hydroxybutyrate Explains the Protective Effect of Poly-β-Hydroxybutyrate against the Major Aquaculture Pathogen Vibrio campbellii. Sci. Rep. 2018, 8, 7245. [Google Scholar] [CrossRef] [PubMed] [Green Version]
  67. Fukami, K.; Takagi, F.; Sonoda, K.; Okamoto, H.; Kaneno, D.; Horikawa, T.; Takita, M. Effects of the Monomeric Components of Poly-Hydroxybutyrate-Co-Hydroxyhexanoate on the Growth of Vibrio penaeicida In Vitro and on the Survival of Infected Kuruma Shrimp (Marsupenaeus japonicus). Animals 2021, 11, 567. [Google Scholar] [CrossRef]
  68. Cho, B.; Park, M.; Shim, J.; Azam, F. Significance of Bacteria in Urea Dynamics in Coastal Surface Waters. Mar. Ecol. Prog. Ser. 1996, 142, 19–26. [Google Scholar] [CrossRef] [Green Version]
  69. Jørgensen, N. Uptake of Urea by Estuarine Bacteria. Aquat. Microb. Ecol. 2006, 42, 227–242. [Google Scholar] [CrossRef]
  70. Siebers, D. Bacterial—Invertebrate Interactions in Uptake of Dissolved Organic Matter. Am Zool 1982, 22, 723–733. [Google Scholar] [CrossRef] [Green Version]
  71. Preston, R.L. Transport of Amino Acids by Marine Invertebrates. J. Exp. Zool. 1993, 265, 410–421. [Google Scholar] [CrossRef]
  72. Moss, S.M.; Pruder, G.D. Characterization of Organic Particles Associated with Rapid Growth in Juvenile White Shrimp, Penaeus vannamei Boone, Reared under Intensive Culture Conditions. J. Exp. Mar. Biol. Ecol. 1995, 187, 175–191. [Google Scholar] [CrossRef]
  73. Vogt, G. Synthesis of Digestive Enzymes, Food Processing, and Nutrient Absorption in Decapod Crustaceans: A Comparison to the Mammalian Model of Digestion. Zoology 2021, 147, 125945. [Google Scholar] [CrossRef] [PubMed]
  74. Li, X.; Han, T.; Zheng, S.; Wu, G. Nutrition and Functions of Amino Acids in Aquatic Crustaceans. Amino Acids Nutr. Health 2021, 1285, 169–198. [Google Scholar] [CrossRef]
Figure 1. Changes of Ammonia nitrogen (A), Nitrite nitrogen (B), Nitrate nitrogen (C), and Total nitrogen (D) in the water of different groups. Note: group B, a single B. pumilus BP-171, was added; the group BP, B. pumilus BP-171, and PHBV were added; the group BM, B. pumilus BP-171, and molasses were added; the group DZ, the control without any probiotics and carbon sources addition. Values with different superscripts on the same day are significantly different among treatments in each figure (p < 0.05).
Water 14 04037 g001
Figure 2. Changes of SPR (A) and TP (B) in the water of different groups. Note: group B, a single B. pumilus BP-171, was added; the group BP, B. pumilus BP-171, and PHBV were added; the group BM, B. pumilus BP-171, and molasses were added; the group DZ, the control without any probiotics and carbon sources addition. Values with different superscripts on the same day are significantly different among treatments in each figure (p < 0.05).
Water 14 04037 g002
Figure 3. Changes of DOC (A) and TOC (B) in the water of different groups. Note: group B, a single B. pumilus BP-171, was added; the group BP, B. pumilus BP-171, and PHBV were added; the group BM, B. pumilus BP-171, and molasses were added; the group DZ, the control without any probiotics and carbon sources addition. Values with different superscripts on the same day are significantly different among treatments in each figure (p < 0.05).
Water 14 04037 g003
Figure 4. PLS-DA analysis based on OTU level of different P. vannamei culture systems. Note: group B, a single B. pumilus BP-171, was added; the group BP, B. pumilus BP−171, and PHBV were added; the group BM, B. pumilus BP-171, and molasses were added; the group DZ, the control without any probiotics and carbon sources addition.
Water 14 04037 g004
Figure 5. Venn diagram based on OTU level for different P. vannamei culture systems. Note: group B, a single B. pumilus BP-171, was added; the group BP, B. pumilus BP-171, and PHBV were added; the group BM, B. pumilus BP-171, and molasses were added; the group DZ, the control without any probiotics and carbon sources addition.
Water 14 04037 g005
Figure 6. Bacterial composition at different levels of phylum (A), class (B), order (C), family (D), and genus level (E) in different culture systems. Note: group B, a single B. pumilus BP-171, was added; the group BP, B. pumilus BP-171, and PHBV were added; the group BM, B. pumilus BP-171, and molasses were added; the group DZ, the control without any probiotics and carbon sources addition.
Water 14 04037 g006
Figure 7. The relative abundance of Bacillus spp. (A), Donghicola spp. (B), Marivita spp. (C) and Oricola spp. (D) in different groups. Note: group B, a single B. pumilus BP-171, was added; the group BP, B. pumilus BP-171, and PHBV were added; the group BM, B. pumilus BP-171, and molasses were added; the group DZ, the control without any probiotics and carbon sources addition. Values with different superscripts are significantly different among treatments in each figure (p < 0.05).
Water 14 04037 g007
Figure 8. The Redundancy Analysis on phylum (A) and genus (B) level and the correlation heatmap analysis between bacterial taxa and water quality parameters on phylum (C) and genus (D). Note: group B, a single B. pumilus BP-171, was added; the group BP, B. pumilus BP-171, and PHBV were added; the group BM, B. pumilus BP-171, and molasses were added; the group DZ, the control without any probiotics and carbon sources addition.
Water 14 04037 g008
Figure 9. Ecological Network based on OTUs of the bacterial community in the different culture systems. Note: In the ecological network diagram, different nodes represent bacteria from different OTUs, and the line between two nodes indicates that there is some interaction between bacteria from two OTUs, and the red line represents a positive relationship between bacteria from two OTUs, the green line represents a negative relationship. The group B, a single B. pumilus BP-171 was added; the group BP, B. pumilus BP-171, and PHBV were added; the group BM, B. pumilus BP-171, and molasses were added; the group DZ, the control without any probiotics and carbon sources addition.
Water 14 04037 g009
Figure 10. Differences of predicted functions based on the KEGG Module database using STAMP. Note: Only data with significant differences (p < 0.05) between groups are shown. (A) DZ and B group, (B) DZ and BP group, (C) DZ and BM group. The group B, a single B. pumilus BP-171 was added; the group BP, B. pumilus BP-171, and PHBV were added; the group BM, B. pumilus BP-171, and molasses were added; the group DZ, the control without any probiotics and carbon sources addition.
Water 14 04037 g010
Table 1. Gross weight, survival rate, specific growth rate, and the feed efficiency rate of P. vannamei (Mean ± S.E.).
TreatmentBBPBMDZ
Initial body weight (g)6.05 ± 0.056.07 ± 0.076.03 ± 0.066.12 ± 0.01
Final body weight (g)13.64 ± 0.63 a17.23 ± 0.18 c15.12 ± 0.13 b12.92 ± 0.53 a
Gross weight (g)504.23 ± 7.74 b637.78 ± 14.89 c526.13 ± 16.88 b478.15 ± 12.56 a
Survival rate (%)70.00 ± 0.06 b88.57 ± 0.01 b82.74 ± 0.03 b64.31 ± 0.03 a
SGR (%)2.70 ± 0.13 a3.47 ± 0.07 c3.07 ± 0.06 b2.48 ± 0.14 a
FER (%)51.36 ± 6.96 a70.27 ± 2.65 b55.77 ± 3.50 a45.34 ± 1.94 a
Note: The group B, a single B. pumilus BP-171 was added; the group BP, B. pumilus BP-171 and PHBV were added; the group BM, B. pumilus BP-171 and molasses were added; the group DZ, the control without any probiotics and carbon sources addition. Data are expressed as mean ± standard error, n = 3. Values in the same row with different superscripts are significantly different among treatments (p < 0.05).
Table 2. α-diversity indices of bacterial communities in shrimp culture systems.
Groupsα-Diversity IndexCoverage
ShannonSimpsonAceChao
B3.23 ± 0.690.10 ± 0.07438.93 ± 97.23440.16 ± 87.690.998
BP2.74 ± 0.690.18 ± 0.11443.16 ± 134.35435.90 ± 122.110.997
BM3.56 ± 0.460.06 ± 0.02459.62 ± 30.45447.41 ± 31.130.998
DZ3.36 ± 0.080.07 ± 0.01411.01 ± 29.19370.11 ± 19.180.998
Note: group B, a single B. pumilus BP-171, was added; the group BP, B. pumilus BP-171, and PHBV were added; the group BM, B. pumilus BP-171, and molasses were added; the group DZ, the control without any probiotics and carbon sources addition. Data are expressed as mean ± standard error, n = 3.
Table 3. Topological properties of the networks.
BBPBMDZ
Nodes328323334285
Edges1270105612561223
Positive relationship800616753733
Negative relationship470440503490
negative interactions/positive interaction ratio58.75%71.43%66.80%66.85%
Module number726167
Note: group B, a single B. pumilus BP-171, was added; the group BP, B. pumilus BP-171, and PHBV were added; the group BM, B. pumilus BP-171, and molasses were added; the group DZ, the control without any probiotics and carbon sources addition. Data are expressed as mean ± standard error, n = 3.
Publisher’s Note: MDPI stays neutral with regard to jurisdictional claims in published maps and institutional affiliations.

