
A Dilemma between Flood and Drought Management: Case Study of the Upper Chao Phraya Flood-Prone Area in Thailand

1
Department of Civil Engineering, Faculty of Engineering, King Mongkut’s University of Technology North Bangkok, Bangkok 10800, Thailand
2
Department of Civil Engineering, Faculty of Engineering, King Mongkut’s University of Technology Thonburi, Bangkok 10140, Thailand
3
Department of River & Harbor Engineering, National Taiwan Ocean University, Keelung 20224, Taiwan
4
Center of Excellence for Ocean Engineering, National Taiwan Ocean University, Keelung 20224, Taiwan
*
Author to whom correspondence should be addressed.
Water 2022, 14(24), 4056; https://doi.org/10.3390/w14244056
Submission received: 22 October 2022
/
Revised: 8 December 2022
/
Accepted: 9 December 2022
/
Published: 12 December 2022
(This article belongs to the Special Issue Simulation and Analysis of Flood Disaster in River Basins during Typhoons and Heavy Rainstorms)
Abstract
:Floods are the greatest natural disaster in Thailand, but they are an important part of recharging the water volume for groundwater resources. This paper focused on evaluating and discussing the relationship between flood magnitudes and flood management impacting groundwater storage in the Upper Chao Phraya River basin in Thailand, where the intensive rice production of the region is located. Based on satellite image data, there were annual flood inundations varying from 1950 to 10,470 km2 over the period 2005–2019. The evaluation shows those flooding events yielded floodwater recharge of approximately 0.5–5.9 km3. To lessen the flood damage, floodways with 2000 m3 s−1 of drainage capacity are proposed by the government. This measure aims to accelerate flood surplus out to the gulf of Thailand and to confine the flooding areas to a maximum value of 4650 km2. A reduction of approximately 3.4 km3 of groundwater storage is estimated if the floodways are implemented. Staple crops in the dry season, especially rice fields outside an irrigation project (rainfed area), cope with water stress. To sustain basin water demand in the dry season, approximately 1820 km2 should be allowed for an area flooded for a month where 0.9 km3 of water volume is harvested annually. Although flood control is important, potential impact on the reduction of groundwater recharge needs to be carefully considered. Therefore, a flood control policy shows the balance of available basin water occasionally supplied by the groundwater while rice water demand is being proposed.
1. Introduction
Thailand is located in the tropical monsoon region, and approximately 88% of annual rainfall is observed in the wet season from May to October. Among several disasters, floods are is the most frequent natural tragedy, affecting multiple sectors with direct and indirect impacts. The largest natural disaster historically recorded in Thailand was the mega-flood of 2011, which caused approximately USD 46.5 billion in economic losses. [1]. However, this event awoke people to the causes and effects of flooding and called for mitigation measures to handle future floods.
On the one hand, drought is also a frequent and regular threat in Thailand. Approximately 44.73% of the total population lives in the agricultural sector. Based on the official report of the Department of Disaster Prevention and Mitigation [2], 2013, 2014, 2015, 2016, and 2019 were severe drought years. At the end of the rainy season, water storage in major reservoirs is below a lower rule curve. For example, the Bhumibol and Sirikit reservoirs were designed for 22,972 MCM (Million Cubic Meter) as their total capacity, while the available active storage over the mentioned drought years varied between 3262 and 8499 MCM or 14.2–36.9% of the total storage. Therefore, 44 out of 76 provinces across the country faced water stress. In addition, climate variability and change are triggering imbalances and the irregular distributions in time and space of water resources.
Under climate change conditions, a flood of serious magnitude such as the 2011 flood event is projected to be repeated [3,4,5]. Therefore, countermeasures against floods are important for mitigating and protecting against potential damage. Meanwhile, the prolonged droughts, such events as those of 2013 to 2016 are also a critical water issue in Thailand. The dilemma of flooding and drought triggered by climate change are challenging for the decision process and for finding a sustainable solution [6].
In Thailand, there are several options proposed for flooding countermeasures, for instance, reforestation, improving reservoir operation rules, flood retarding basin, floodway or flood diversion canals, and polder systems [3,7,8,9,10]. However, there is no measure without its negative impacts. Kazama et al. (2007) [11] demonstrated that confining flood inundation areas by 19% by using a floodwall in Cambodia (a lower part of the Mekong River basin) causes a 31% reduction in groundwater storage. In Ho Chi Minh city, Vietnam, land use has changed, and rapid urbanization has impacted a significant decrease in groundwater recharge [12]. For nonstructural measures, there is a controversial issue between people living in upstream and downstream areas and changing their activities to manage flood flow and its temporary retarded water volume.
Floodwater harvesting is a conceptual framework compromise for cutting flood peaks by directing surplus volume into an aquifer and pumping it back whenever the surface water is insufficient. Yet, it needs a large area to be allocated as the recharging groundwater basin for some periods. Moreover, the implementation of a groundwater recharge zone should consider a basin’s basic characteristics (e.g., people’s practices, land use, and production). Chao Phraya River basin (CP), the largest basin in Thailand, is an intensive rice production area and known as “Thailand’s Rice Bowl”, so a solution should maintain this strong point and supply its production (rice) to the world market. In fact, groundwater has been used for compensating the surface water shortage in the CP [13,14,15]. A preliminary study of the floodwater harvesting concept was conducted by Pavelic et al. (2012) [16]. However, the capacity of the system at the basin scale is still unclear because it depends on specific features of aquifer properties.
Therefore, it information will be more precise and useful if the interrelationship between flood and groundwater can be determined. There are four main objectives in the paper, as follows: (1) analyze river discharge and flood inundation areas, (2) evaluate government flood-management policy, (3) construct and assess the relationship between flood and groundwater in the Upper Chao Phraya River basin (UCP), and (4) propose a flood management scheme for sustaining the basin’s water demand. The discussion covers a policy on flood mitigation as well as a desired flood magnitude for recharging temporary groundwater storage for balancing out basin water demand under the target of the basin development master plan. The findings will be facilitated by the organization in charge of or a decision maker planning flood control and evaluating its potential impact on groundwater as well as be a lesson learned for other areas.
2. Study Area: The Upper Chao Phraya River Basin (UCP)
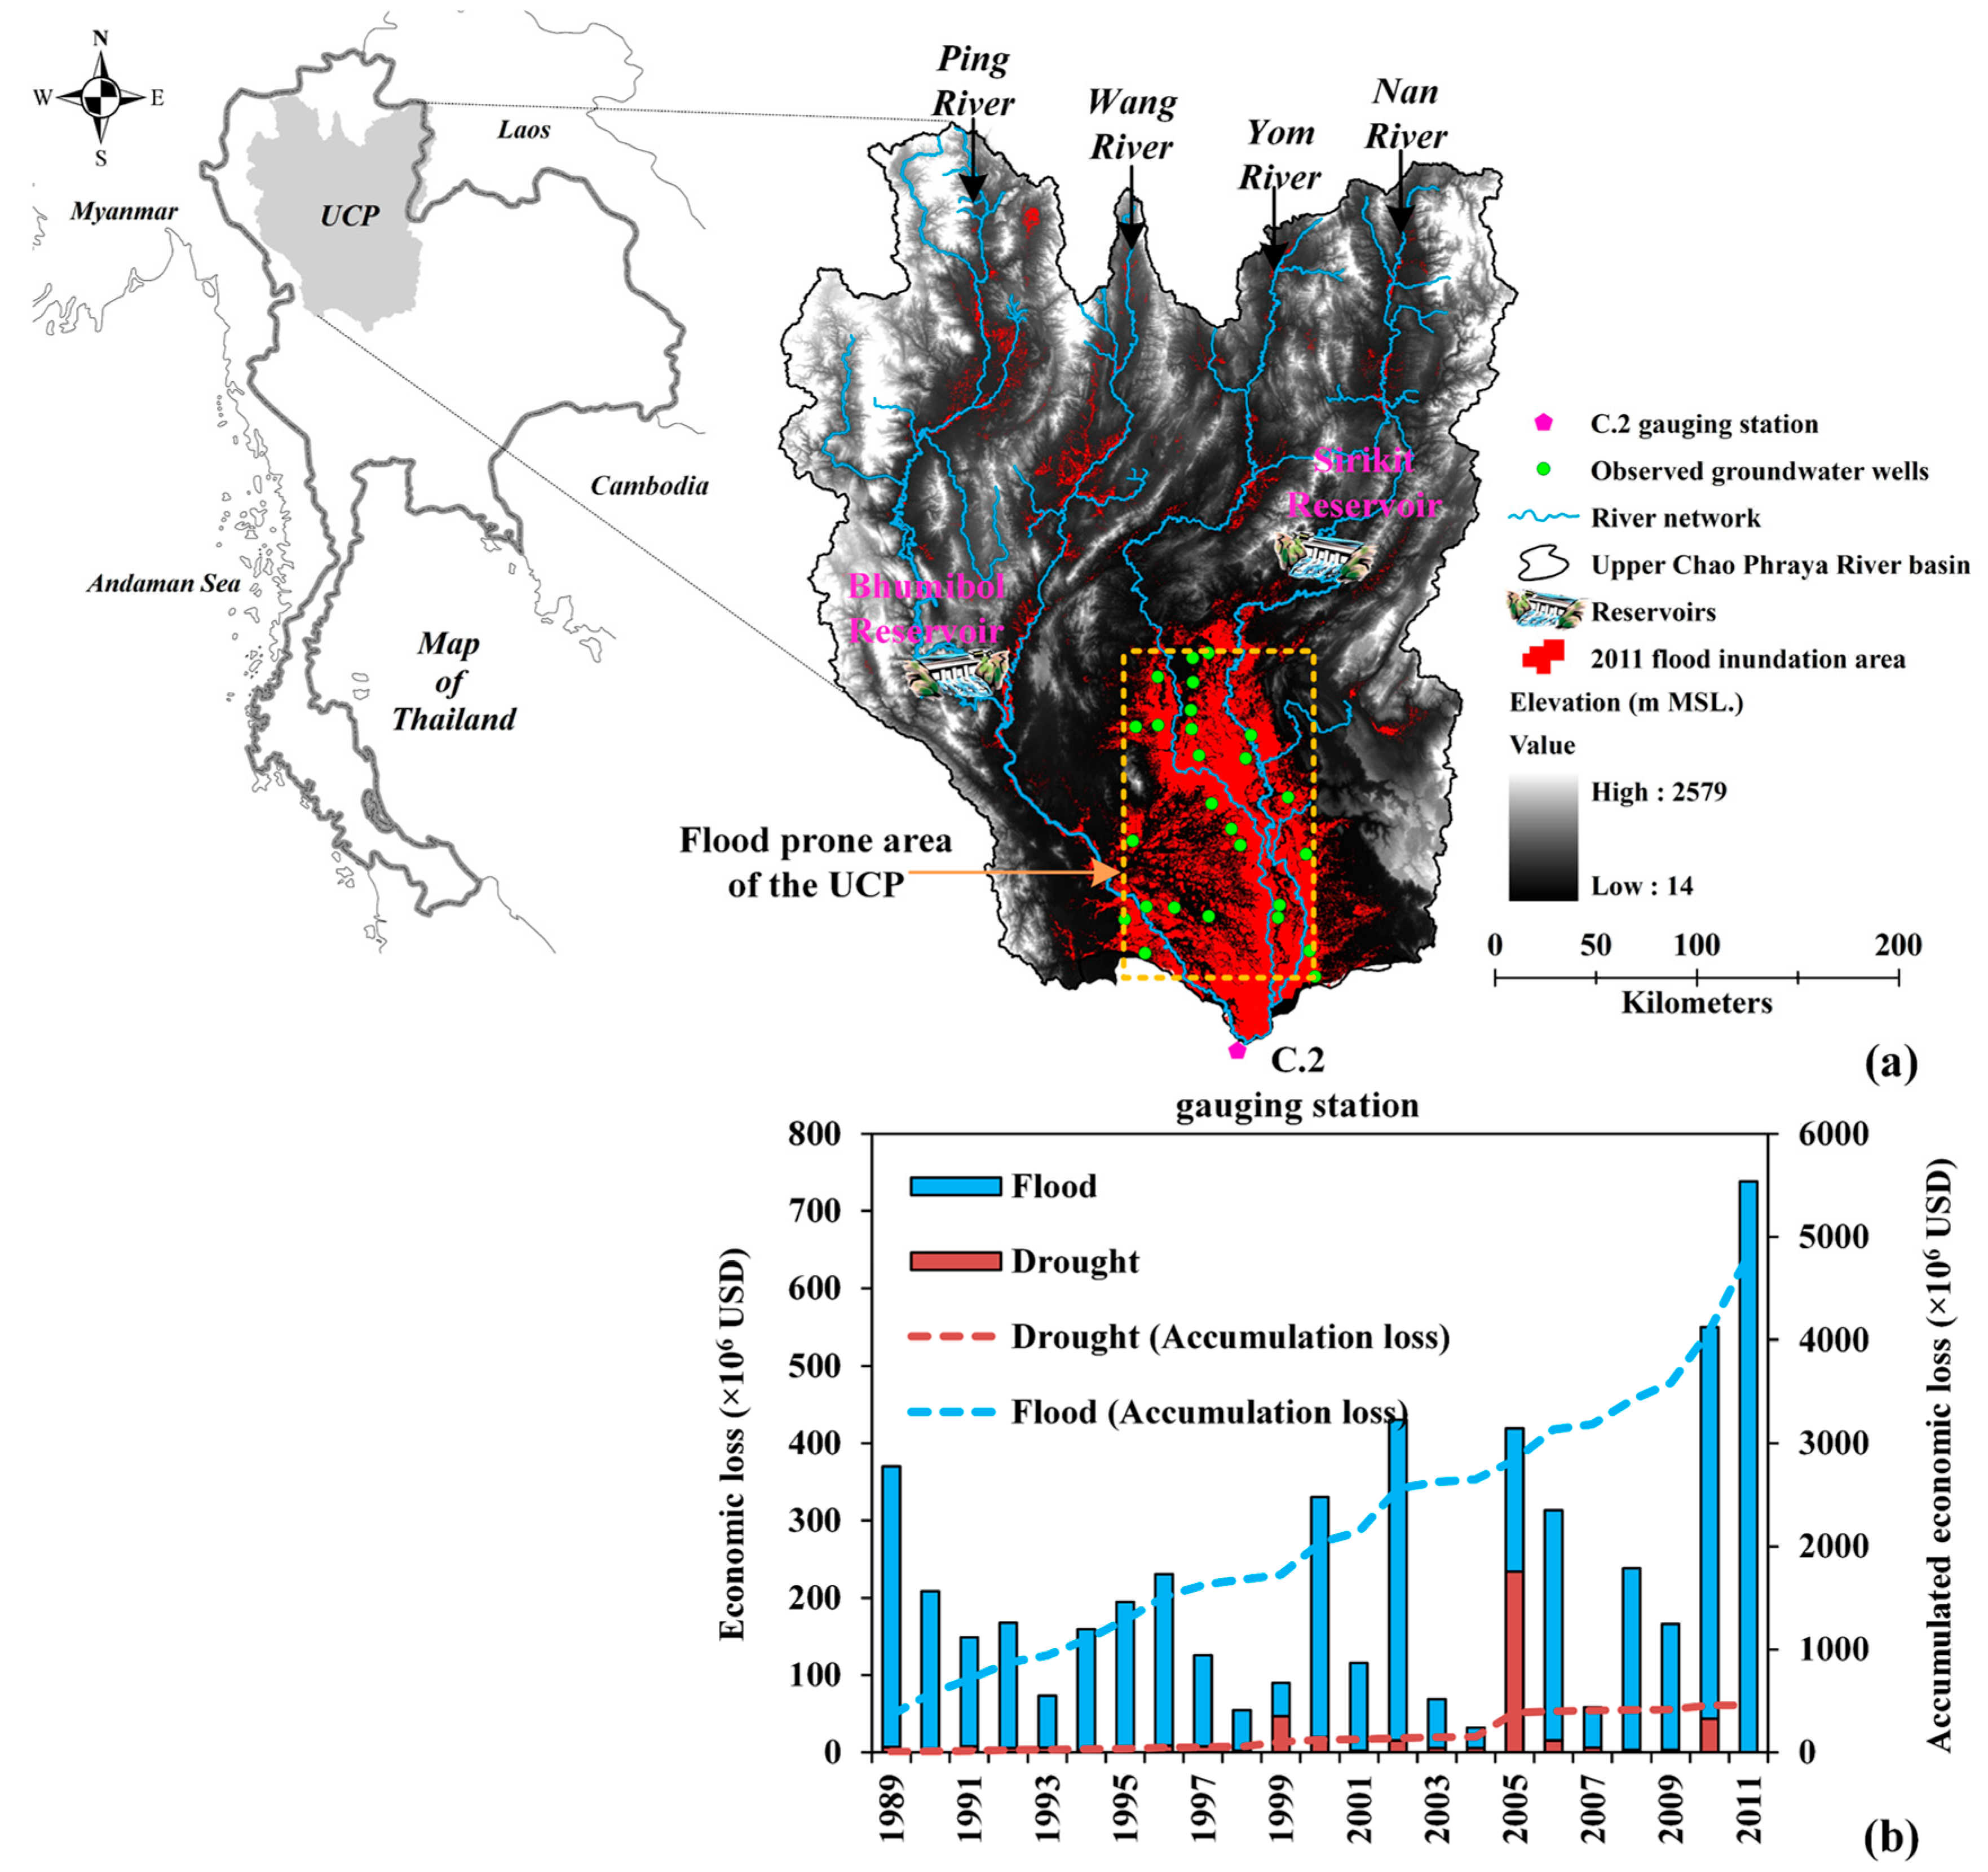
Figure 1a shows the location (15°39′–19°50′ N and 98°13′–101°25′ E) and topographical setting of the UCP, which covers an area approximately 109,973 km2 or 22% of the whole country. There are four tributaries, i.e., the Ping, Wang, Yom, and Nan Rivers, all flowing to Nakhon Sawan province (C.2 gauging station, which is the station used for monitoring and managing water resources in the Upper and Lower Chao Phraya River basin, LCP). The upper part of the UCP is a mountainous area; therefore, a huge water volume from heavy rainfall speedily flows to the lowland areas, as shown by the orange dotted line in Figure 1a. This lowland area is hereafter called UCP’s flood-prone area, which extends approximately 16,000 km2. For structural measures, there are two large reservoirs, namely Bhumibol reservoir on the Ping River and Sirikit reservoir on the Nan River, which have approximately 23 km3 in total storage. During the monsoon season (May to October), the basin is sustained by tropical rainfall from the South China Sea. On average, there is approximately 987 mm of annual rainfall and about 18% of that amount is estimated as runoff [17].
As shown in Figure 1b, floods and draughts caused important economic loss in Thailand during 1989–2011 [2]. There were accumulated losses of approximately USD 4828 and 459 million counted for floods and droughts, respectively. In fact, flood loss occurs not only in the UCP but also extends to the lower part of the CP, which receives flood volume from the UCP [16,18]. Therefore, reducing the flood discharge from the UCP is a key concept to reducing flood damage in the LCP, which is the heart of Thailand’s economy.
For the UCP, the main basis for production is rice, which covers approximately 35.6% of the basin area and involves around 3.1 million people working in this sector [19]. However, only 20% of the planting area is supplied by irrigation systems [20]. As growing rice is a lifeline for the UCP’s people, exploitation of groundwater is conducted in rainfed areas. This practice shows an increasing trend which is observed by an increasing number of shallow groundwater pumping wells [14,21].
3. Data and Methodology
In order to construct and investigate the interaction of the various flood magnitudes that drive groundwater storage in the UCP, data, as shown in Table 1, were collected. Observation of daily river discharge, flood and drought warning data, and their management policies were collected from the Royal Irrigation Department (RID), which is the main organization in charge of water resource management in Thailand. Although groundwater levels are monitored in the study area, the data were not complete. Once every month, the groundwater data were observed by a DGR officer (Department of Groundwater Resources, DGR) manually. The satellite image data of annual flood inundation areas were obtained from the GISTDA (Geo-Informatics and Space Technology Development Agency). Data for economic loss due to floods and droughts in Thailand were retrieved from the Department of Disaster Prevention and Mitigation (DDPM), while the crops and plantation area data were recorded by the Office of Agricultural Economics (OAE).
Flow duration analysis [22] and Man–Kendall test [23] were used for analyzing variations in river discharge and long-term trends. The change is statically significant if it satisfies a 95% confidence level (p-value < 0.05). The extension of flood inundation areas was analyzed by ArcGIS with the topographical and geographical setting data, e.g., river networks, land use, and administrative boundaries (shapefiles), provided by the RID. For the floodways management policy, the data were retrieved and analyzed from the RID’s report “Feasibility study and environmental impact assessment for the water management in the Chao Phraya River”.
Temporal (monthly) and spatial distributions of groundwater surface were analyzed by using the Kriging interpolation method in ArcGIS [24], and groundwater storage was calculated as the total groundwater storage (TGS) [11] expressed in Equation (1). A different depth (after and before monsoon season) of groundwater surfaces (levels) is defined as hydrological driving groundwater depth (, m) from rainfall and flood inundation.
where and are effective porosity (dimensionless) and interpolated grid size areas (m2), respectively. According to a hydro-geological survey of soil layers, the average value of in the UCP’s flood-prone area is fairly even and approximately 0.22 [13,14]. The interpolation of groundwater surfaces was performed on a grid size of 300 m × 300 m or equal to 90,000 m2.
To investigate the dry season’s basin water use, the difference in groundwater storages between December and April is estimated as a change of storage (, km3). Inflows (, km3) into the UCP’s flood-prone area are river discharge at P.7A (Ping River), Y.6 (Yom River), and N.60 (Nan River), and the flow out of the system (, km3) is discharge at C.2 (basin outlet). There is a trivial amount of rainfall during December–April. Therefore, estimating the rest of the water (evapotranspiration, which is claimed as basin water use for this study, ) is performed by using the water balance approach [22] as expressed in Equation (2).
The in Equation (2) accounts for all kinds of water out of the system; however, the main activity of water use is rice water consumption.
4. Results and Discussion
There are four sub-sections in this chapter. Firstly, we present the analysis of river discharge (the long-term flow duration that categorized flows into high, slightly high, normal, slightly low, and low flow stages) and variations in flood inundation areas in the UCP. Secondly, the government policy on floodways and flood situations in the CP are discussed. Thirdly, discussion of agricultural activities, groundwater and its role, especially in the UCP’s rainfed area, and flood-inundation-induced groundwater recharge are carried out. Finally, groundwater and its function for sustaining basin water demand and a proposal for a sustainable flood management scheme are presented.
4.1. Variations in River Discharge and Floods in the UCP
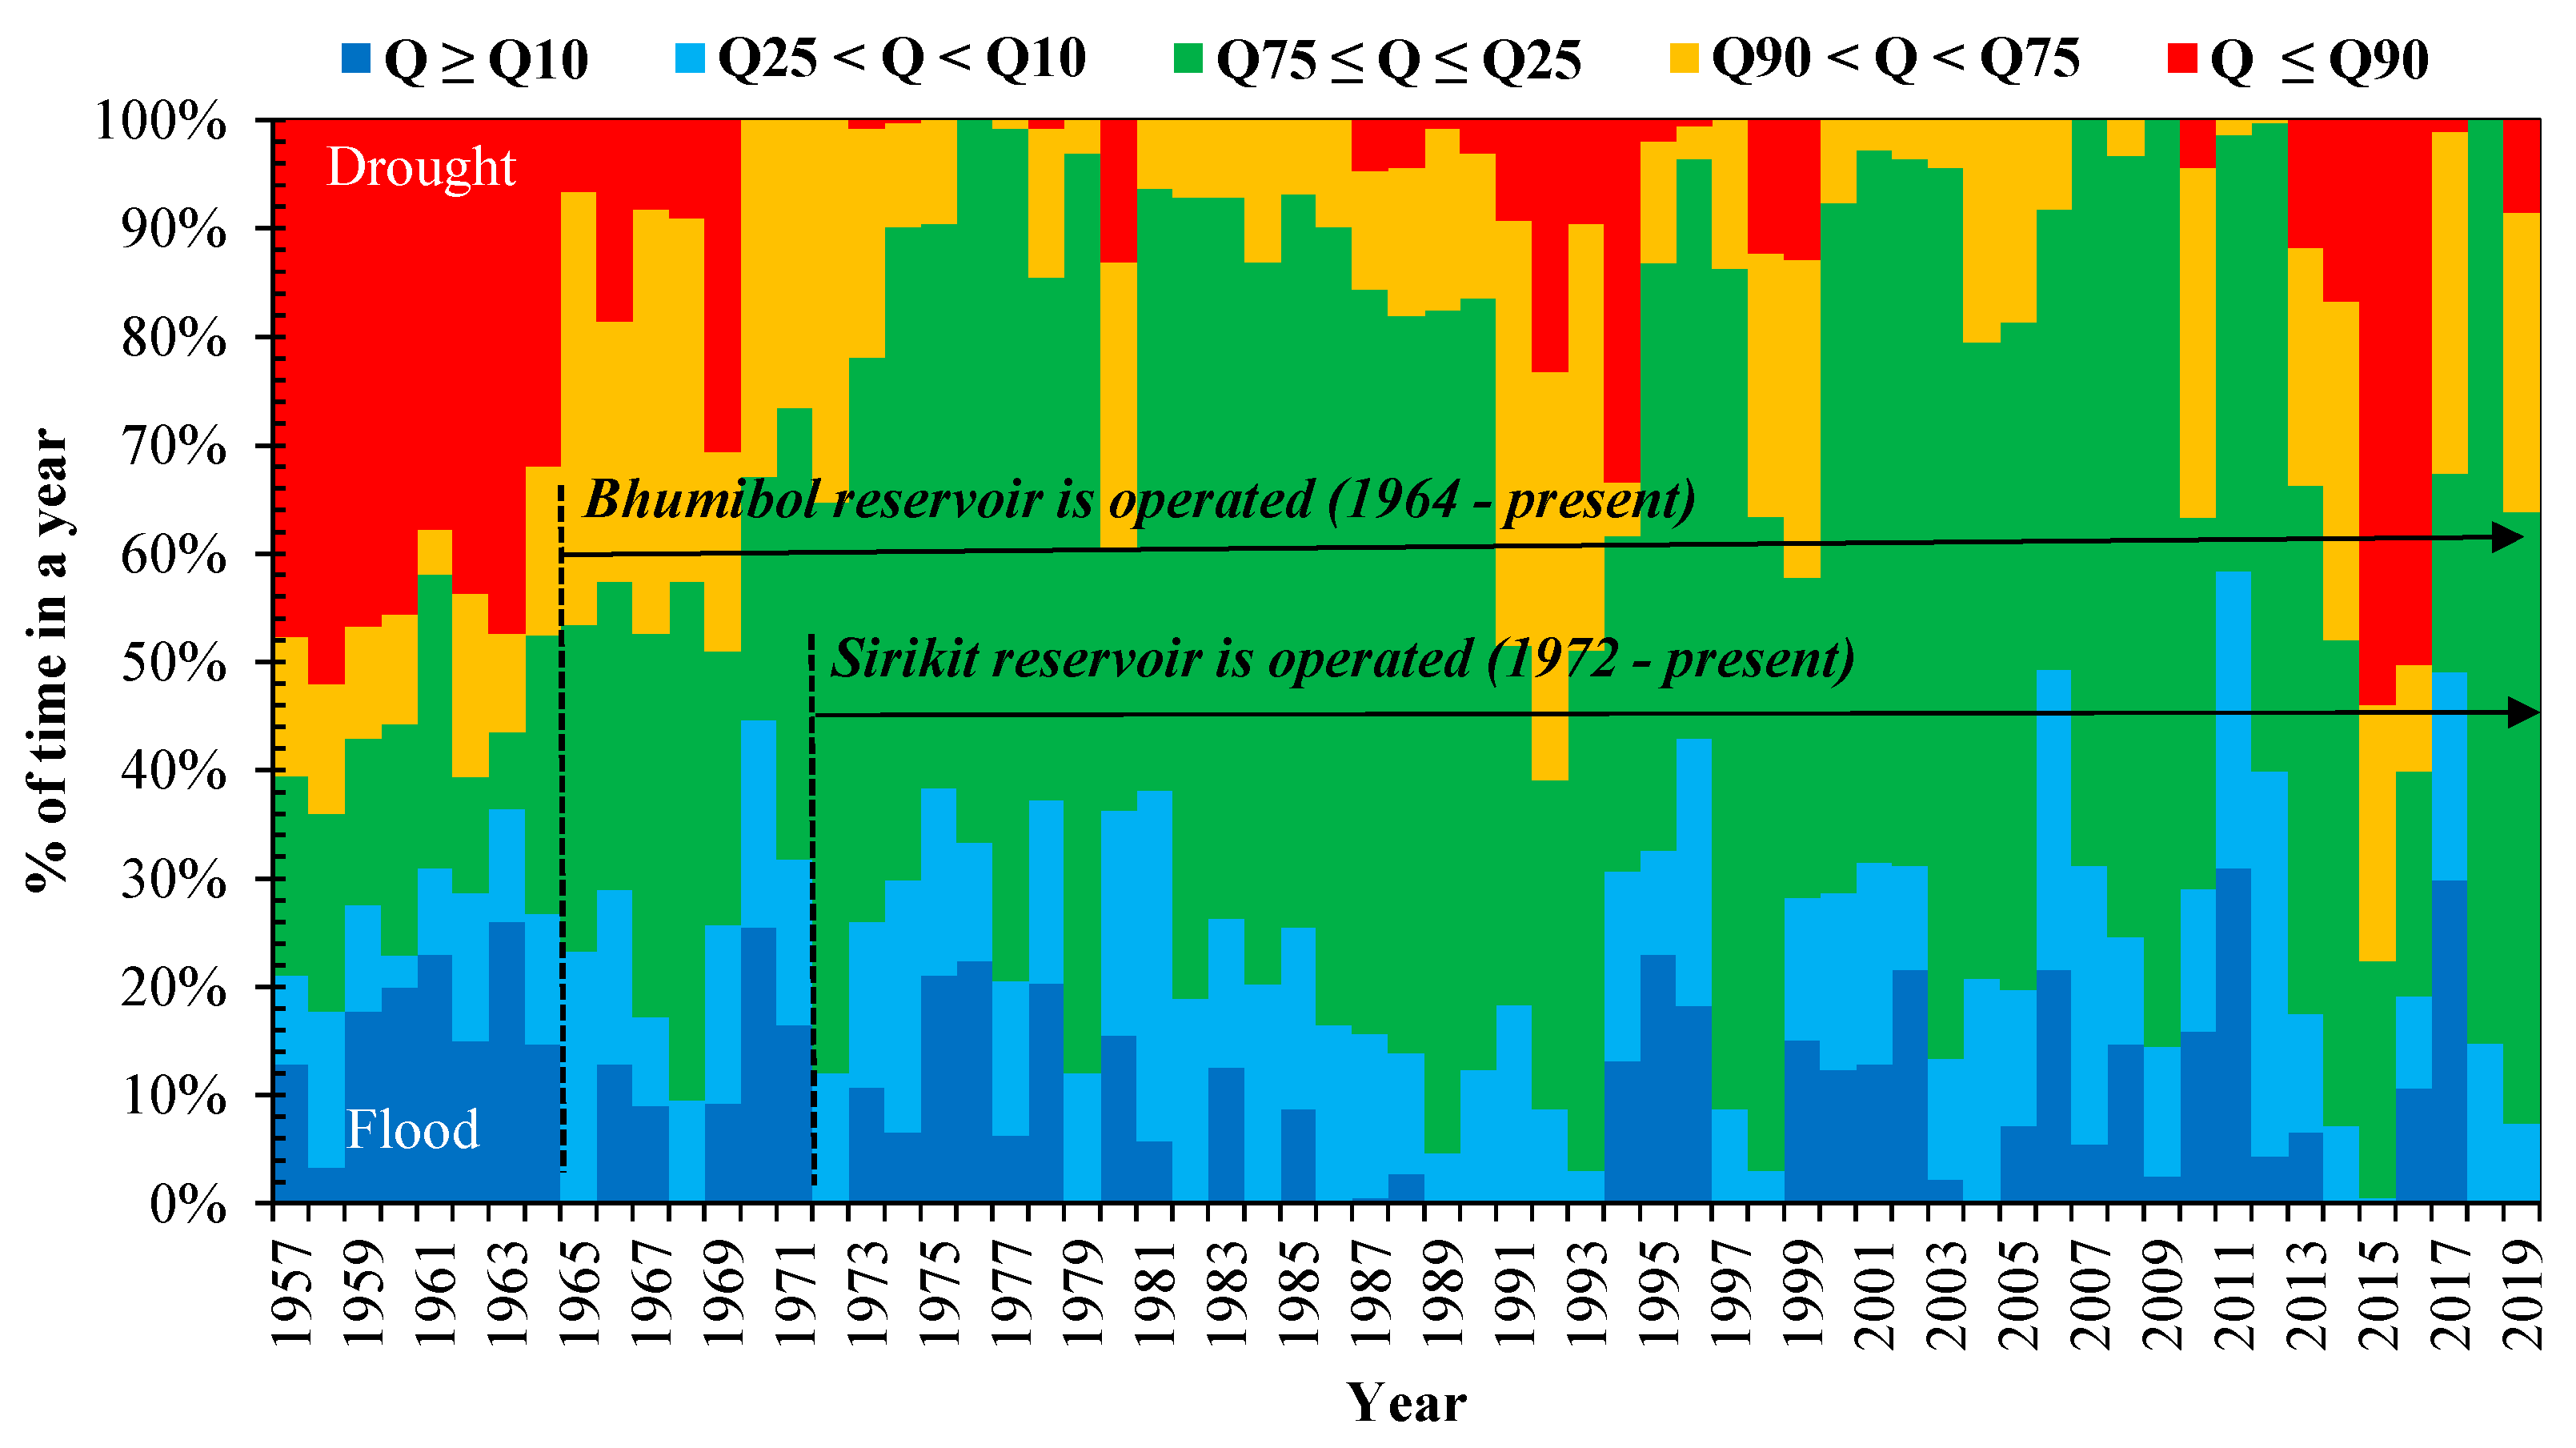
Based on the observed runoff data at C.2 station from 1956 to 2019, there was approximately 22,991 × 106 m3 or 729 m3 s−1 in mean annual discharge. During the period 1956–1980, there were more often high flows (above the mean) relative to the period 1981–2019. According to the Bhumibol and Sirikit reservoir operation, the number of flooding events and flood durations decreased. Komori et al. (2013) [25] found a reduction in the flood period by approximately 3 months from August–November to September–October as the result of the reservoir operations. However, the flood magnitude (peak discharge) did not decrease. For example, the 1995, 2006, and 2011 flood peaks still showed the same magnitude as or even higher than the 1961 flood peak, which was released from the reservoir management. Indeed, increasing normal flow (see Figure 2) is clearly observed after the reservoirs began operating.
To assess the flow characteristics, a flow-duration analysis [22] and Man–Kendall test [23] were applied to the C.2 discharge data. Q10, Q25, Q75, and Q90 (which are the discharge values corresponding to 10, 25, 75, and 90 percent probability of exceedance in a year, respectively) were approximately 1600, 850, 317, and 188 m3 s−1, respectively. These values resulted from the exceedance probability of the flow-duration curve using the daily discharge in the analysis. In this study, we defined high (blue), slightly high (light blue), normal (green), slightly low (light orange), and low (orange) flows if Q ≥ Q10, Q25 < Q < Q10, Q75 ≤ Q ≤ Q25, Q90 < Q < Q75, and Q ≤ Q90, respectively, and the trends of the discharge are considered statistically significant if the p-value using the Man–Kendall test ≤ 0.050 or at a 95% confidence level.
Based on the above conditions, several days per year that were classified in high and low flows were fed into the Man–Kendall test. A decreasing trend with a p-value of 0.171 was found for the high-flow testing. For the low flow test, a 95% statistically significant decreasing trend (p-value = 0.000 ≤ 0.050) was found. As presented in Figure 2, the number of days that were classified as normal flow showed an increase after starting the operations at the dams. This analysis suggests that the reservoirs can reduce the flood frequency in the basin but might not be sufficient to reduce the flood magnitude (the flood peak is still high even after the reservoir operation period). However, the reservoirs contribute a great role to reducing the number of low flows and increasing normal flow days, by which the riparian areas benefit. This finding agrees with a couple of reservoir operations and the spatial distribution of the hydrological model by Gopalan (2020) [3].
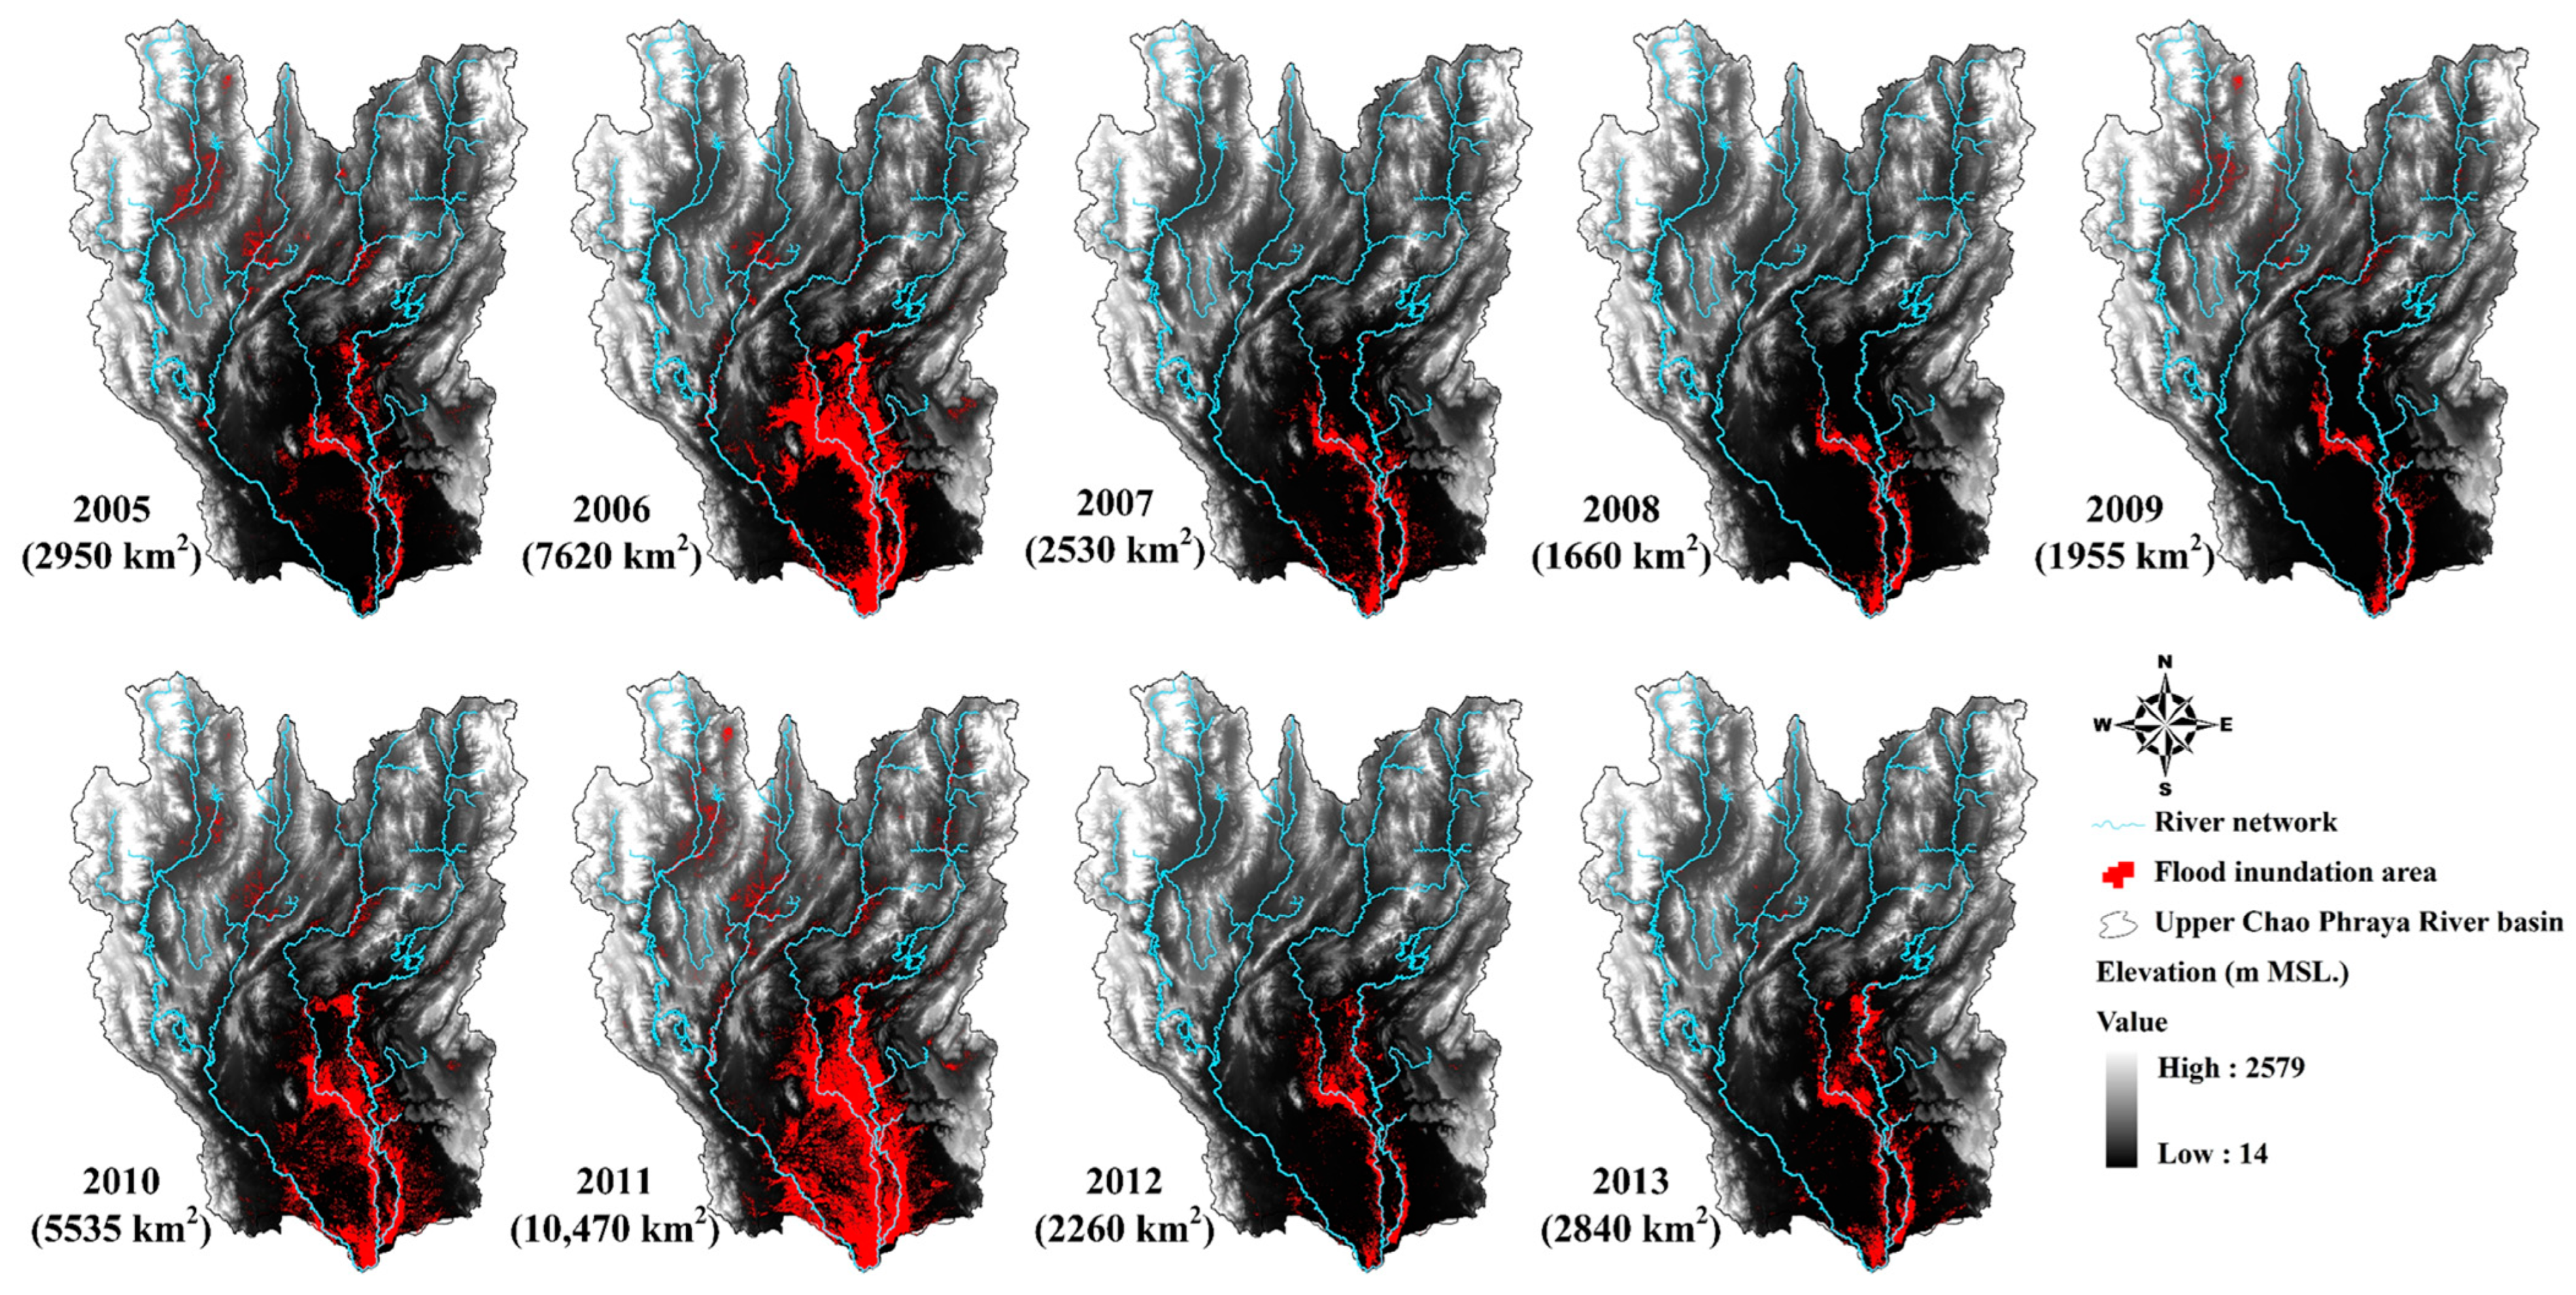
Flooding is the major threat to the basin’s production (rice growing area). In Figure 3 is shown the spatial distribution of annual flood inundation areas in the UCP over the period 2005–2013. There are satellite image data (Table 1) of flood inundation areas (red shading areas in Figure 1 and Figure 3). Calculated flooding areas varied from approximately 1950 to 10,470 km2 or 1.7 to 9.5% of the UCP. The 2011 flood event was the largest natural disaster in the country’s history. The inundation area covered almost the entire lowland area of the basin (red shading area approximately 65.4% of the UCP’s flood-prone area). That event forced the government to setup a policy on future flood management [7,9,10]. If one looks at the distributions of the inundated areas, it can be noticed that along the lower Yom and Nan Rivers are areas at risk of flooding. Especially for the areas along the Yom River (Sukhothai province is discussed later) have always suffered from floods, even in the years that have a low peak discharge such as in 2008, 2009, and 2012. Among several flooding countermeasures, floodways are proposed by the RID, which is the main organization in charge of managing floods in Thailand and for mitigating and protecting against potential loss from future floods [9].
4.2. Government Policy on Floodways
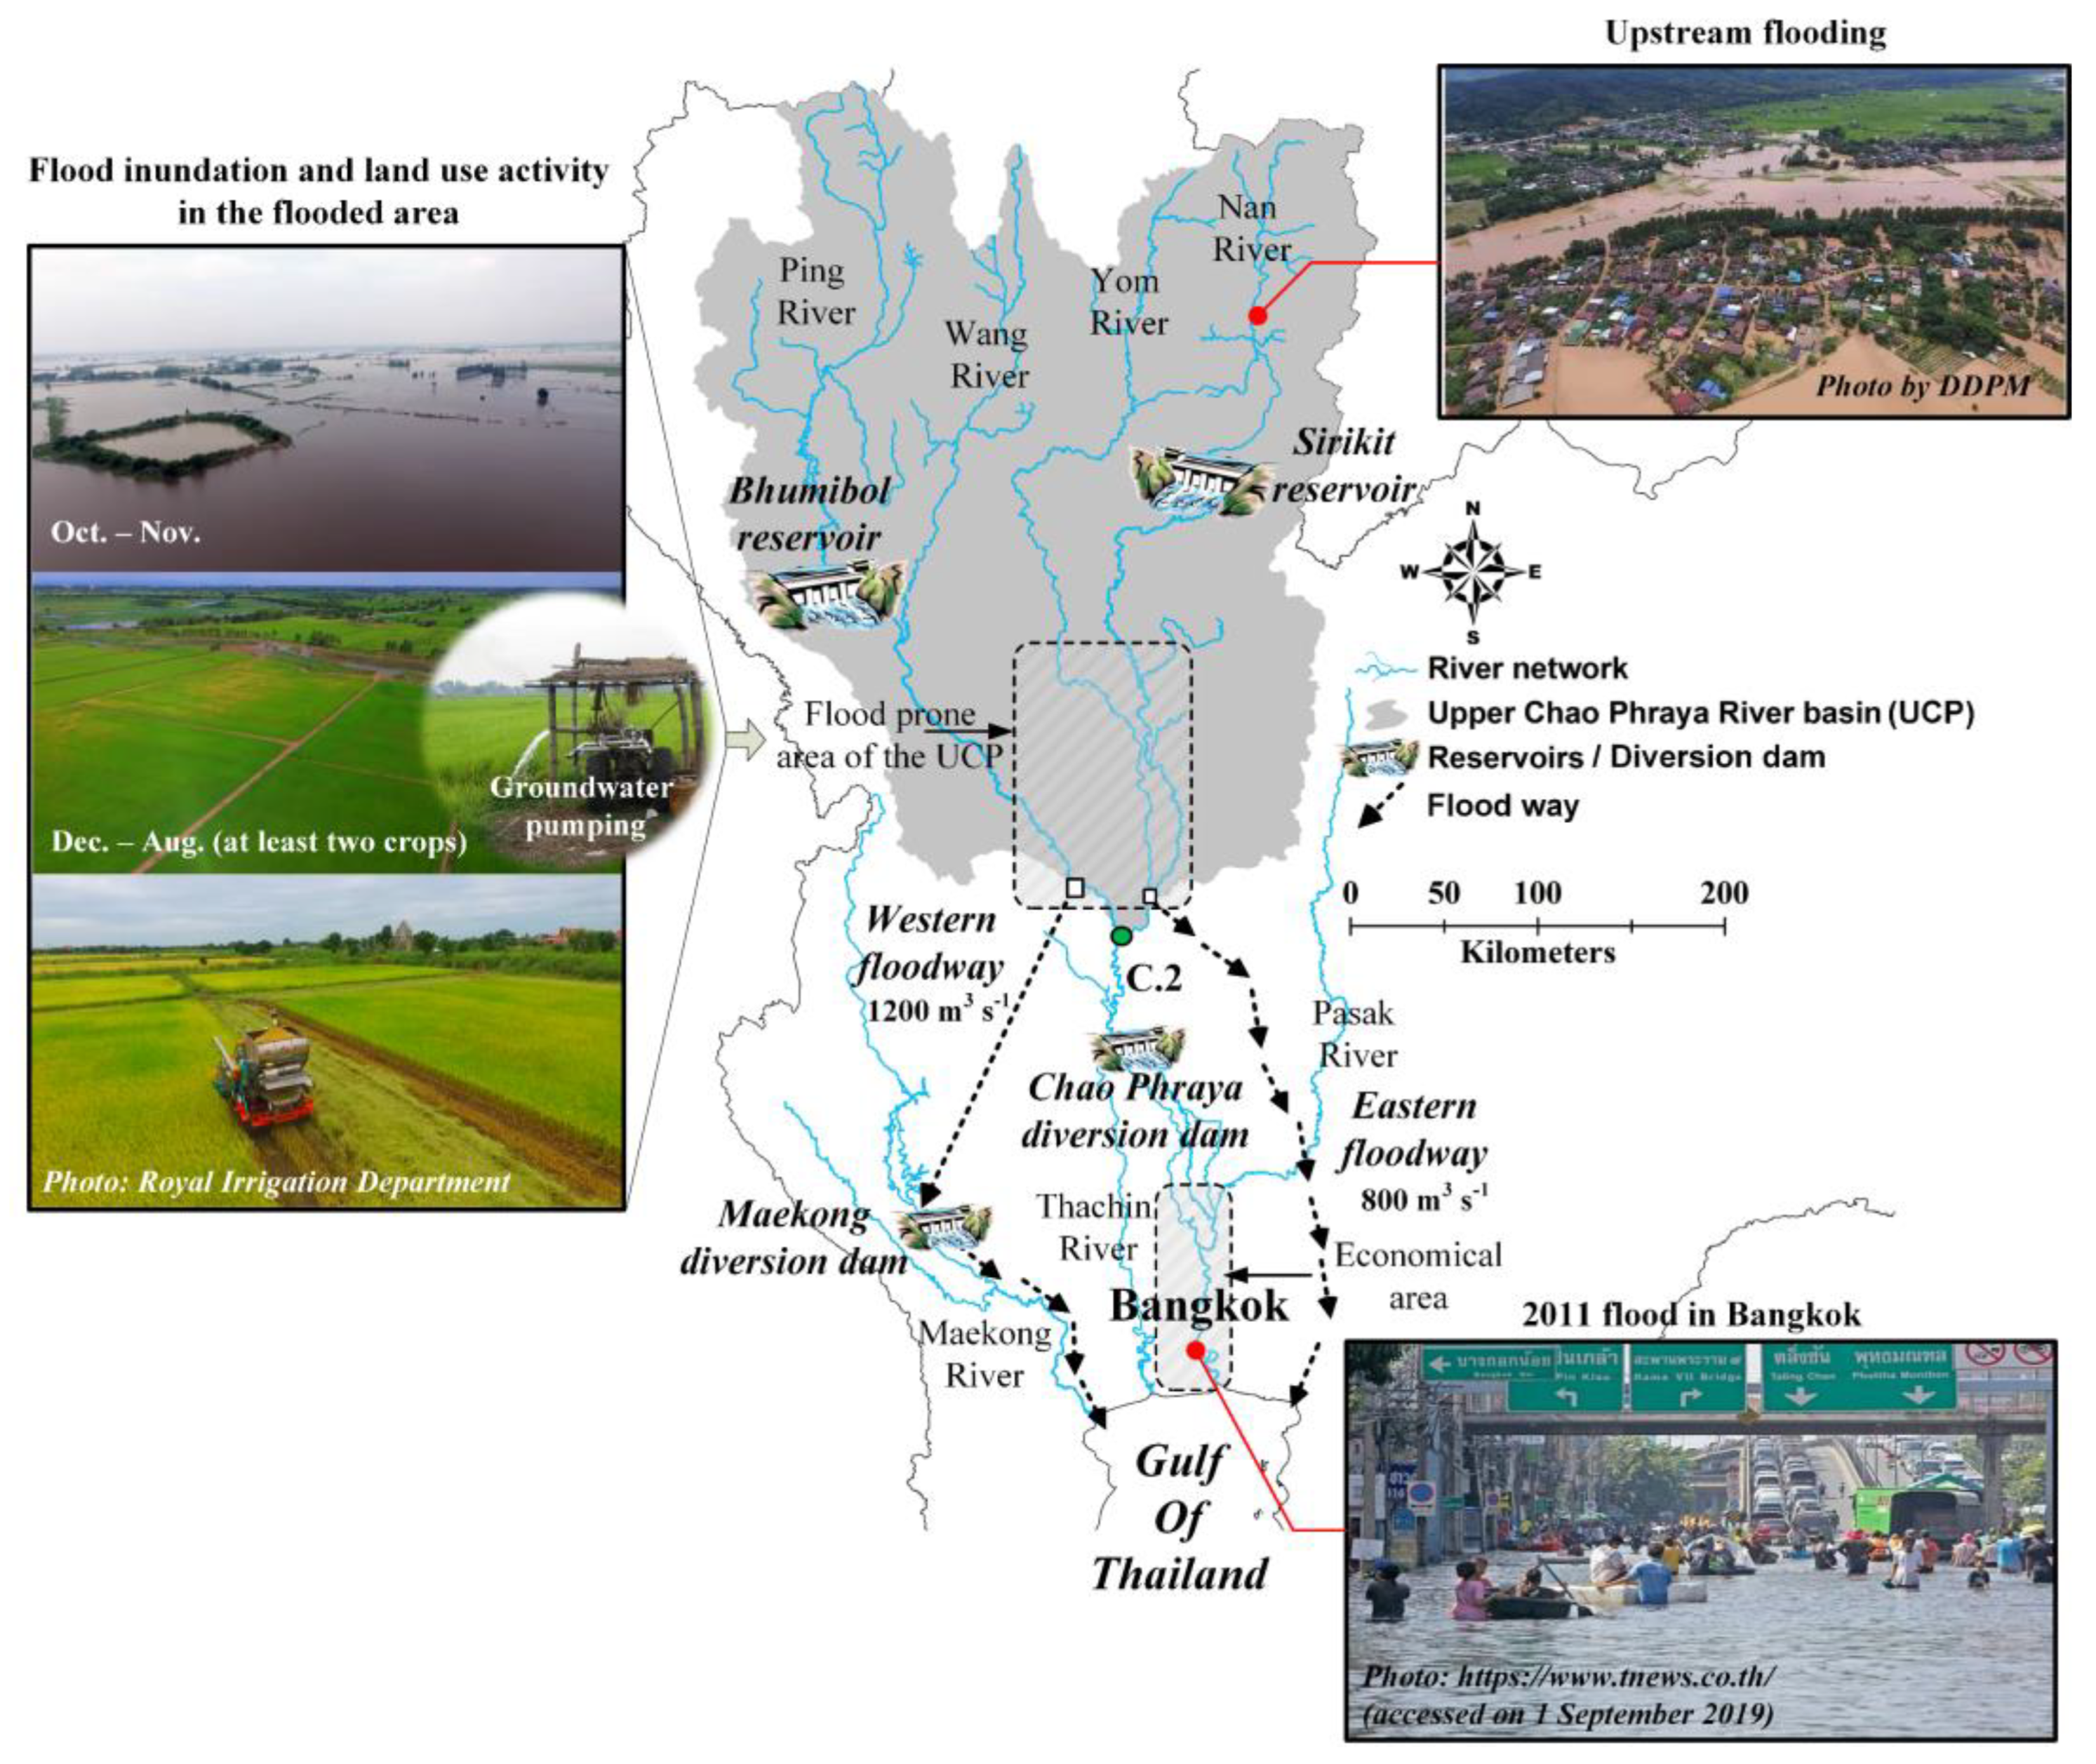
There is no doubt that the government pays more attention to floods rather than drought mitigation if we take a look at the economic loss as shown in Figure 1b. Several measures of flood protection and mitigation are proposed. Briefly, they are classified as structural and nonstructural measures. According to the scope that we focused on, the following sub-section discusses only floodways proposed by the RID with the expectation of reducing the flood peak and inundation area in the UCP. Since then the UCP has had a strong impact on flood management in the LCP (Bangkok, the center of the country’s economy and the capital city). The discussion in this section covers the whole CP (UCP and LCP), as shown in Figure 4.
Because of the physical condition of the river flow network in the CP, C.2 station is a suitable location used for monitoring and warning of water situations. There will be flooding if a flow overflows the drainage or channel capacity for a particular reach. At the UCP outlet (C.2), the channel capacity is approximately 3500 m3 s−1. However, there are floods in the LCP if discharge at C.2 is over 3000 m3 s−1. This is because the drainage capacity in the LCP is less than the UCP; for example, the river section of an area below Chao Phraya diversion dam (see Figure 4) has a maximum capacity to carry flood water up to 2800 m3 s−1. According to Prajamwong and Suppataratarn (2009) [26], the LCP’s flood reaches a critical level if the discharge at the C.2 approaches 4000 m3 s−1, e.g., as it did in the 1995, 2006, and 2011 flood events. Thus, controlling the peak of the flood at C.2 to be under 3000 m3 s−1 (maximum) and using the Chao Phraya diversion dam to divert surplus flood water to the Thachin River and irrigation canal networks are proposed as the master plan to mitigate flooding for the LCP. Based on the observed data analysis, there were 14 out of 64 years (1956–2019) with floods having peak discharge values of ≥ 3000 m3 s−1), or floods of this magnitude usually take place approximately once in 4 years.
To reduce flood damage, approximately 1200 and 800 m3 s−1 are the designed capacities for the western and eastern floodways, respectively [9]. With this structural function in operation, about 2000 m3 s−1 of flood peak is expected to be reduced. Other measures such as constructing a big reservoir in the UCP to retard and store flood surplus is difficult because there are no suitable locations and available area, e.g., in Yom sub-basin, there is very strong protest from the local people. The floodways are designed to operate with their full capacity once in every 4 years. The flood magnitudes, for example, in the 2005, 2007, 2008, 2009, 2012, and 2013 events might not take place again due to the operation of the floodways.
If 3000 m3 s−1 is the allowable maximum flood peak (after the floodway construction), an approximate upper limit for the flooding area in the UCP is not over 4650 km2. The value was evaluated from the relationship between the peak discharge and satellite image data of flood inundation areas. This suggests 47% of the flooding area in the UCP was reduced relative to the 2011 mega-flood event. The function of the floodways is clear in terms of diverting and cutting flood surplus; however, an effect of the floodways (controlling inundation area and flooded time) on groundwater recharge induced by the inundation area needs to be investigated.
4.3. Flood and Groundwater Relationship in the UCP’s Flood-Prone Area
4.3.1. Agricultural Activities in the UCP’s Flood-Prone Area
A majority of land use activity in the UCP is for agricultural purposes. As shown in Figure 5, there are 3 types of agricultural land areas, i.e., (1) surface water irrigation (green area), (2) groundwater irrigation (Sukhothai Groundwater Irrigation Project, red area), and (3) rainfed (light yellow area). A surface irrigation area lies along the Ping and Nan Rivers irrigated water from the Bhumibol and Sirikit reservoirs. The rest of the area (a majority area—approximately 80% of the agricultural areas) is rainfed. In fact, this area is one of considerable rice production for the country, which means three crop-cycles per year. In the past, only farmers living in the surface water irrigation areas/projects could grow their rice in the dry season. Nowadays, agriculture in rainfed areas is developed even in the dry season. Extracting groundwater for watering the rice is commonly practiced. The amount of groundwater extraction is increasing year by year because of the expansion of shallow groundwater irrigation areas [13,15]. Therefore, a role of groundwater and its sustainable use in the UCP, including driving factors, should be investigated.
4.3.2. Variations in Groundwater Levels and Groundwater Use in Rainfed Agriculture
Change of groundwater levels from the observation wells that are located along the Yom River (pink squares in Figure 5) were used for assessing an interaction of flooding magnitudes and groundwater. This is because they are free from a big infrastructure regulation—there is no reservoir in the Yom basin. Thus, it is reasonable to discuss an interrelationship between flood-induced groundwater and its benefit for rainfed agriculture. Figure 6 shows temporal variability in groundwater levels of the seven observation wells (meters above mean sea level or m MSL.). In general, groundwater levels tended to decrease during the period 2008 (July)–2010 (July). It was implied that groundwater recharge during the mentioned period was not balanced with the extraction. From Figure 3, the 2006 flood event was one of the big floods in the UCP. Comparing the groundwater levels (Figure 6) in January 2007 (which was assumed as the consequence of the 2006 flood, with 7620 km2 of flood inundation area) and in October 2011 (10,470 km2 of flood inundation area) there was not much difference between the two flood events. Based on the observation and in terms of flood control, we would note that controlling the flood inundation area of 2850 km2 (the different between inundation areas in 2011 and 2006) will not affect groundwater storage in the basin much.
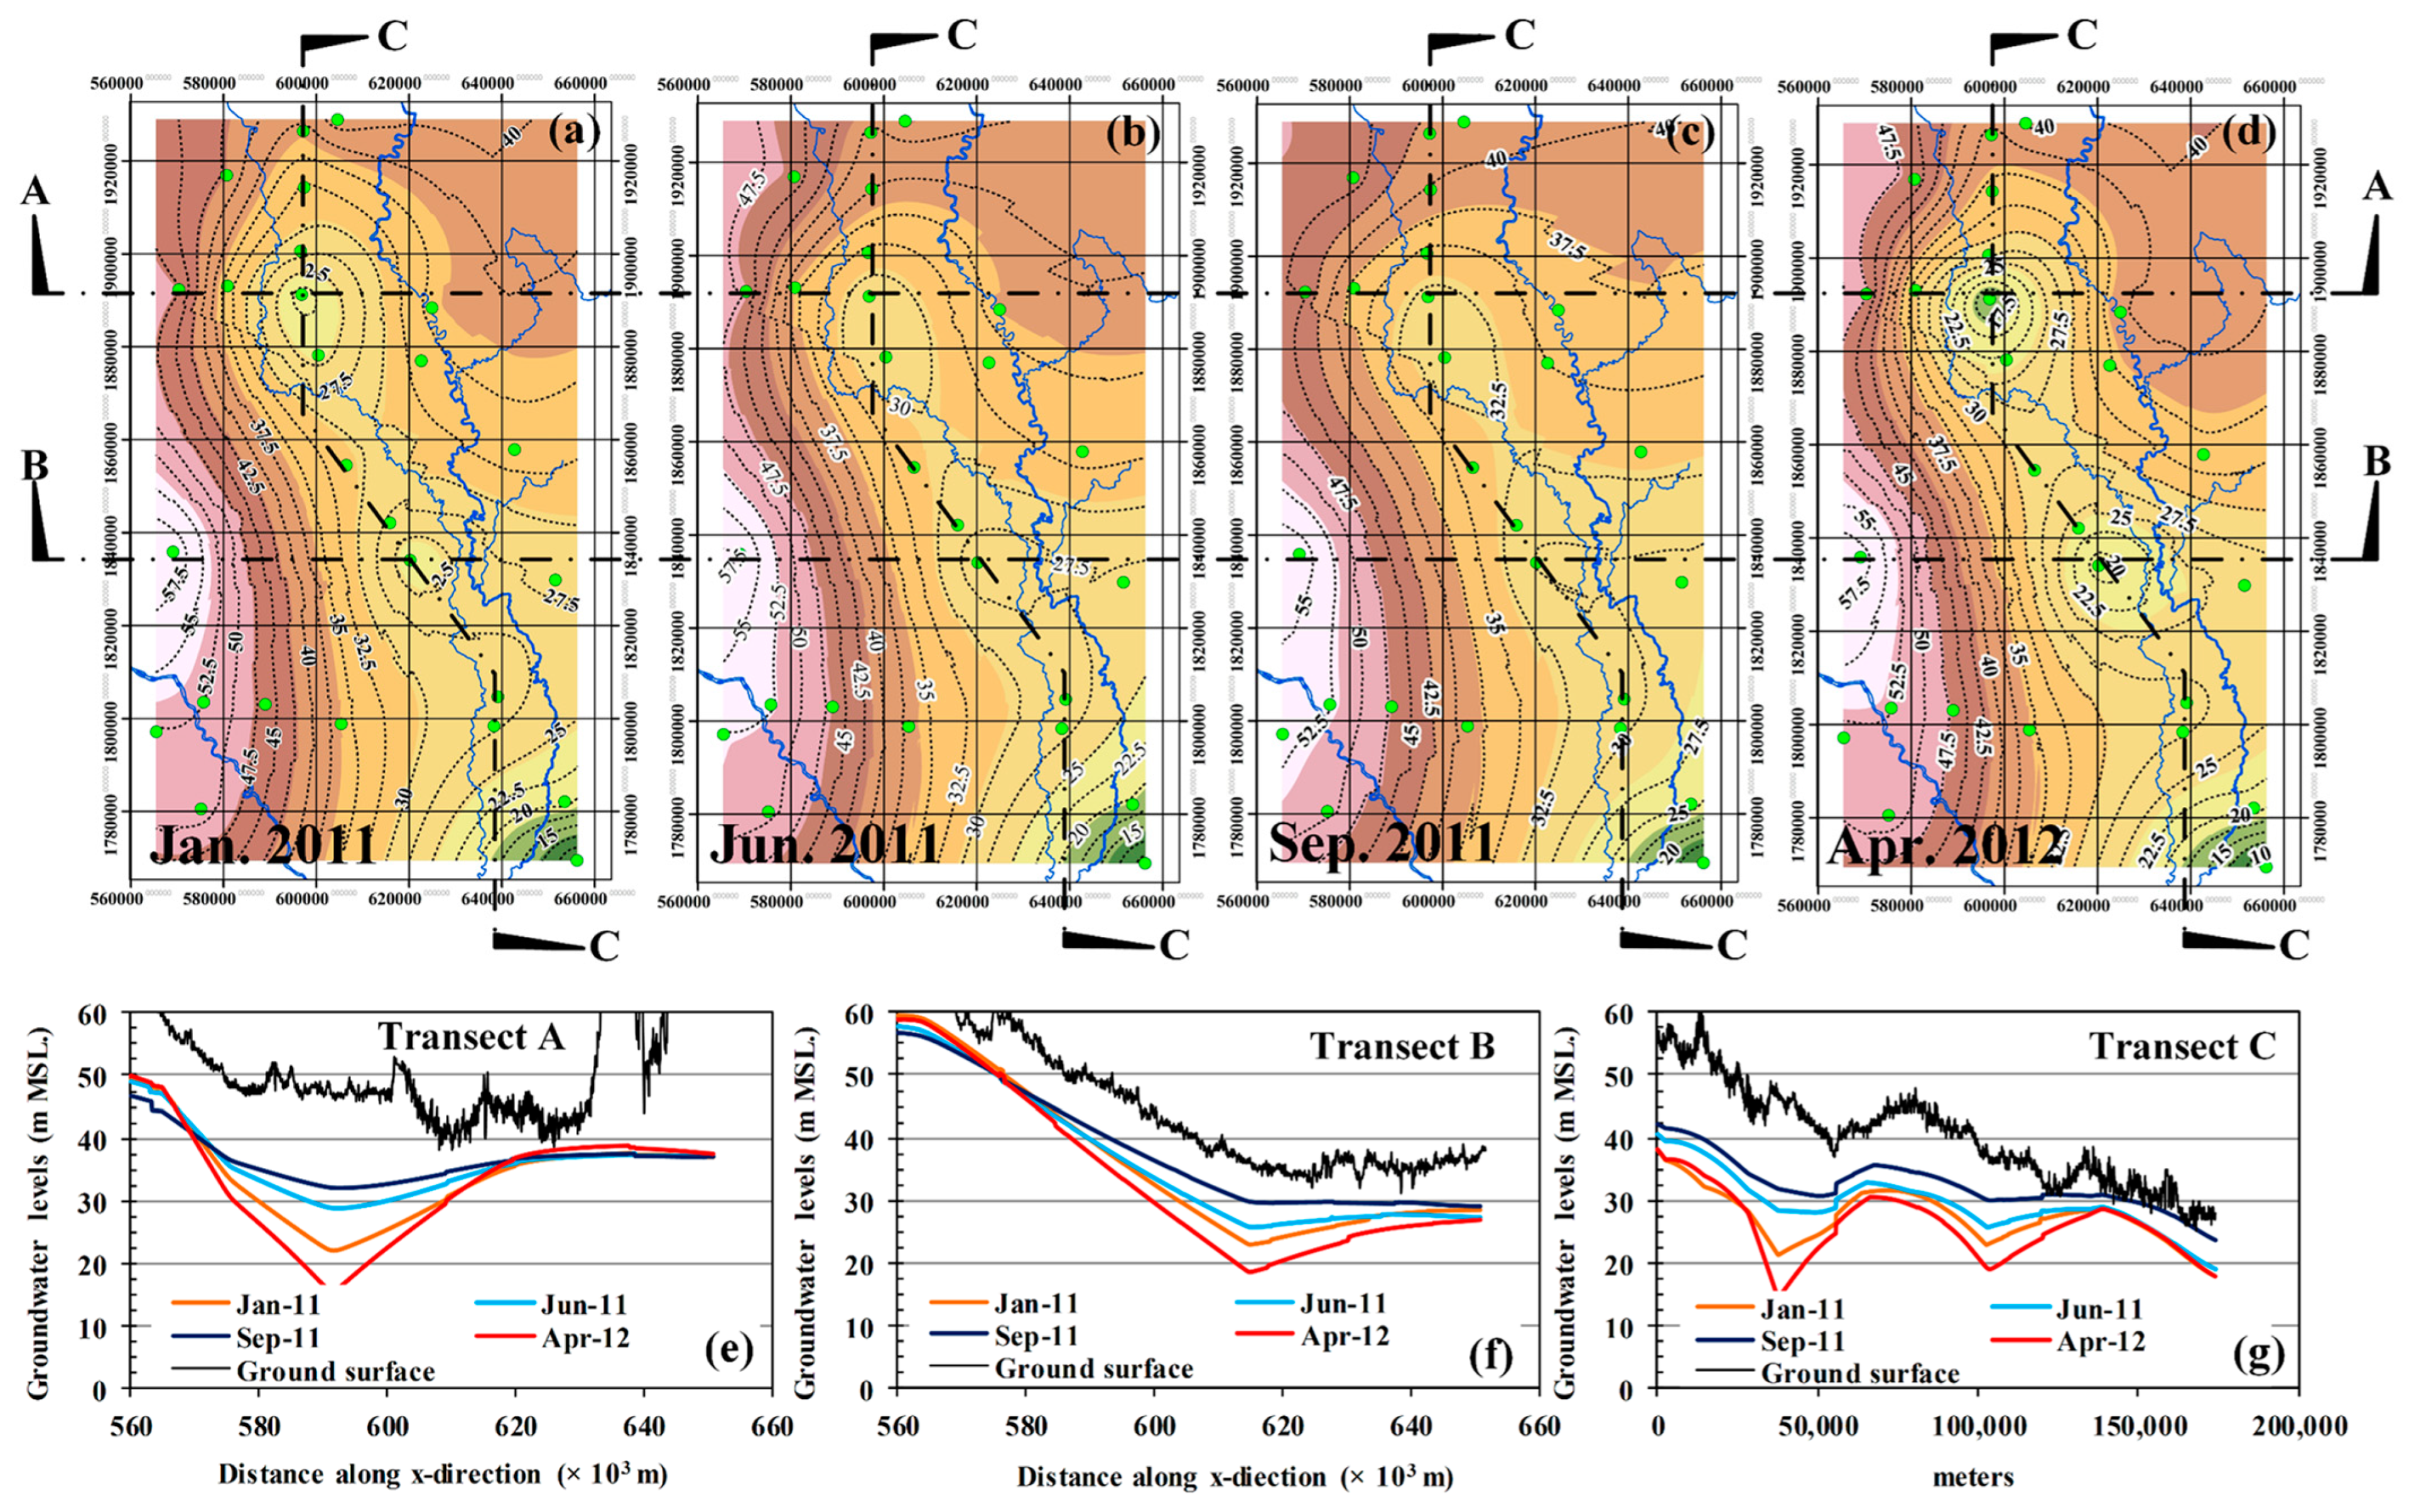
Figure 7a–d show spatial and temporal distributions of groundwater levels (m MSL.) in the UCP’s flood-prone area before and after the 2011 flood event. Contour lines of groundwater levels were interpolated from 26 observation wells using the Kriging method. Usually, the inundation period occupied approximately 45 days (from the end of September to the middle of November) [9,16,17]. To assess flood-induced groundwater storage and spatial distribution of groundwater use, we created three cross-sections, i.e., A, B, and C transects, as shown in Figure 7a–d. Variability of groundwater levels for each transect line for January (2011), June (2011), September (2011), and April (2012) are shown in Figure 7e–g. Transect-A cuts across Sukhothai and Phitsanulok provinces. Figure 7e shows that variability in groundwater levels in the Sukhothai area (by the Yom River) is very high relative to the Phitsanulok area (by the Nan River). Transect-B (Figure 7f) cuts across Kampaeng Phet and the area between Phitsanulok and Phichit provinces, and we noticed that groundwater levels on the right-hand side of the Yom River were relatively deeper than those in other areas. Finally, Transect-C (Figure 7g) was cut across the longitudinal direction of the Yom River.
We can determine that the farmers in Sukhothai and the western side of the Phitsanulok areas use a lot of groundwater for growing rice in the dry season by interpreting the difference in groundwater levels between September (2011) and April (2012). In addition, we also added ground surface elevation (black line) in each particular transect in order to reveal the variability in groundwater depths. For instance, we can observe an effort of Sukhothai’s people (see Figure 7e, between 580,000–600,000 m in x-direction) in pumping groundwater for their rice cultivation even when the groundwater levels were relatively deep (15–33 m below the ground surface) because the surface water in the Yom River is not sufficient.
It would be reasonable to make an assumption that groundwater levels during October–November of 2011, which was flooded by a huge surplus of water over the area, were the highest levels compared with other years. However, the groundwater level suddenly decreased in April (2012), which was the result of the high extraction for growing rice in the dry season motivated by the price insurance policy [27]. In October (2012), there were flooded areas of 2260 km2 that yielded recharge into groundwater storage but not enough to refill the extracting volume. Based on the decreasing trend of groundwater levels, we should note that the people are making use of groundwater for their production, which is not balanced by the recharge. Indeed, if the recharging does not balance the extracted volume, the area might be faced with future groundwater depletion and other consequences.
4.3.3. Flood Inundation-Induced Groundwater Recharge
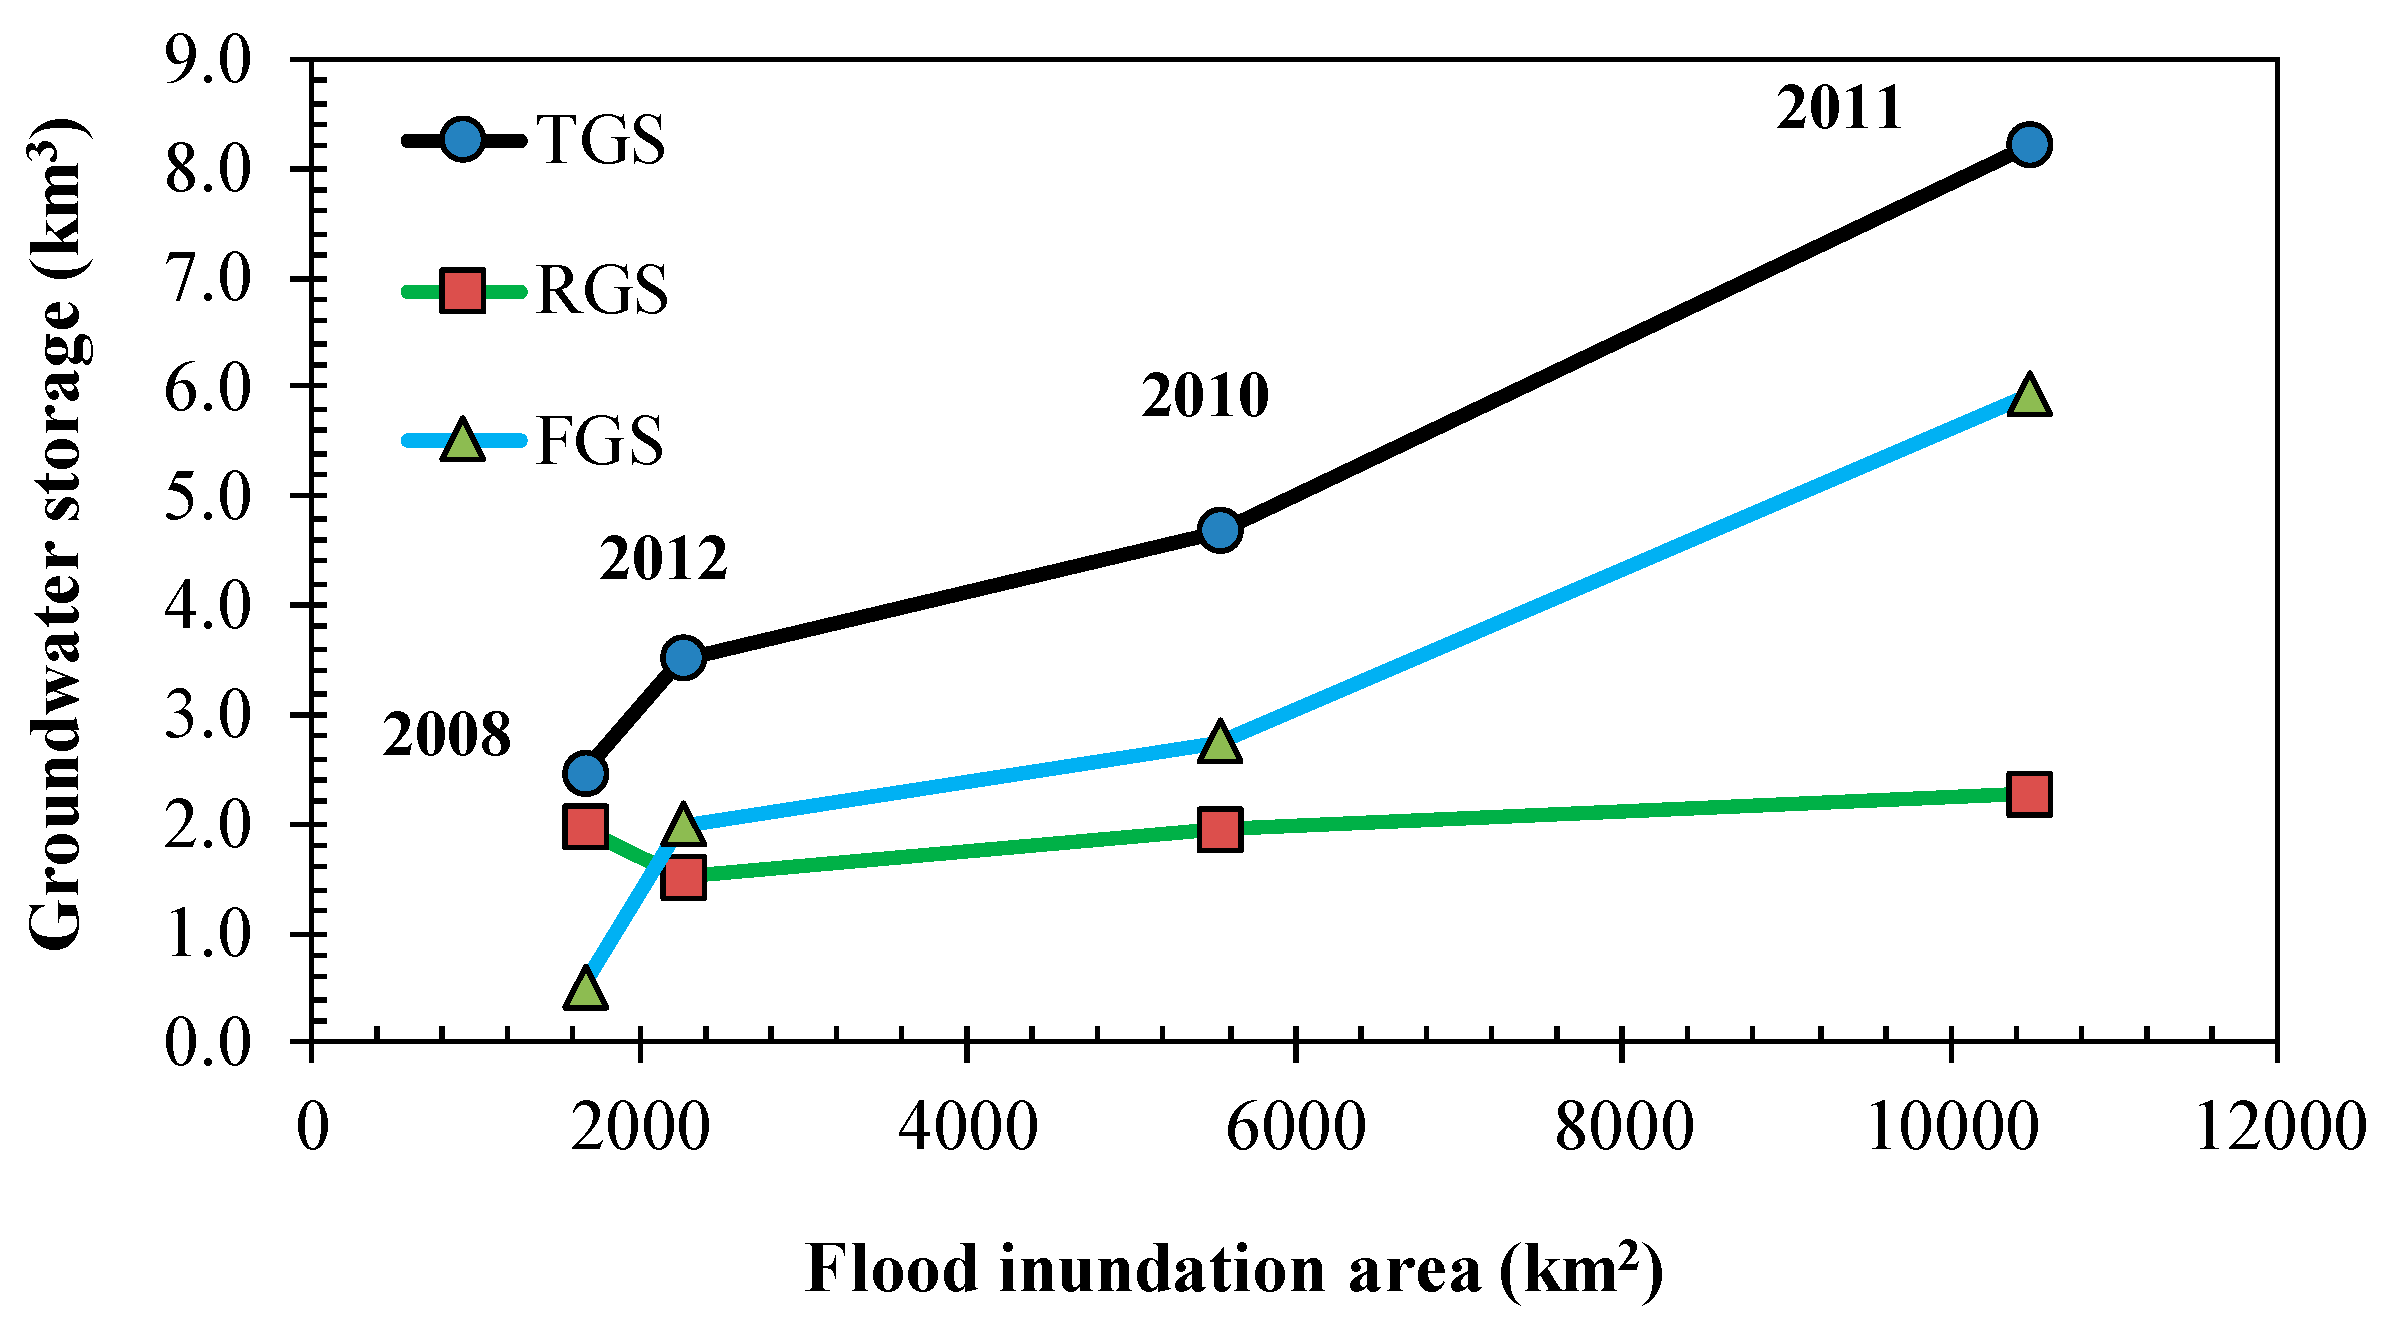
Naturally, two factors are driving the groundwater recharge, i.e., rainfall over the land area and flood inundation-induced groundwater recharge. Therefore, we need to separate the groundwater storage driven by rainfall from the total groundwater storage. Indeed, there are quite even rainfall patterns and evapotranspiration because there are no topographical barriers, and the majority of land use is for paddy fields. Pratoomchai et al. (2015) [17] used a soil moisture deficit model and found that 9.3% of rainfall is recharged into groundwater storage. According to this study, the area is not complex (e.g., fairly even in geo-hydrological conditions as well as land use [13]), and thus the constant proportion of 9.3% of rainfall was assumed for estimating the rainfall driving the groundwater storage (RGS), and we assumed that the difference in groundwater storage before and after the monsoon season is total (temporary) groundwater storage (TGS), which is driven by rainfall and flood inundation (FGS). Thus, subtraction of RGS from TGS is the FGS.
Using the 26 groundwater observation-well data points, groundwater surface levels in the UCP’s flood-prone area for the months that data were available were created, as shown in Figure 7a–d. Figure 8 shows flood events (i.e., 2008, 2010, 2011, and 2012) recharging groundwater storages, which were the difference from the groundwater storages after and before the monsoon season in the UCP’s flood-prone area. Four events (years) were selected because of the observed data available. However, the selected events covered small (2008), medium (2010), and large (2011) flood magnitudes (see Figure 3) which allows us to discuss the possible ranges of the TGS. The finding showed the TGS (black line) in the UCP’s flood prone area varying from 2.46 to 8.2 km3 depending on hydrological conditions. As is also shown in Figure 8, there was a certain amount (approximately 1.91 km3 or 119 mm) of groundwater storage induced by rainfall (RGS—green line). It is quite a stable amount because the rainfall (in the rainy season) over that area is not much different. The blue line is FGS under various flood magnitudes, there were approximately 0.50 (305 mm), 1.98 (850 mm), 2.74 (495 mm), and 5.90 (566 mm) km3 corresponding to the 1660, 2260, 5535, and 10,470 km2 of the flood inundation areas, respectively. Additionally, the amount of FGS of the 2011 event was relatively 50.8% of the Bhumibol and Sirikit effective reservoir storages. This figure reveals the huge volume of FGS induced by flooding. Furthermore, we found that an effective infiltration rate over the study area is approximately 15–20 mm day−1. These results can provide informative parameter ranges for designing, for example, an artificial groundwater recharge pond or a similar system.
4.4. FGS and Its Function for Sustaining Rice Water Demand
As shown in Figure 5, the majority of the agricultural area is rainfed rice paddy (light yellow area). Still, farmers usually conduct their rice cultivation two to three times per year (wet and dry seasons). In the dry season, areas along the Ping and Nan Rivers (green shading areas) can get water from the rivers that is supplied by the reservoirs (Bhumibol and Sirikit reservoirs). Because there are no reservoirs in the Yom River, extracting groundwater is the only available choice for the farmers living in the Yom sub-basin. Based on the variability in groundwater levels (Figure 7e–g), they reflect and explain how much effort the people require to obtain groundwater. For example, Transect A cuts across the Yom and Nan Rivers; groundwater levels by the Nan River were shown to be almost stable relative to the area by the Yom River. This suggests that groundwater is important for rainfed agriculture. Even though the groundwater level was approximately 33 m below the ground surface (red line (April 2012) in Figure 7e) in the dry season, people are still trying to use this resource. In addition, extracting groundwater for mitigating the surface water shortage will be used more in the future. The above statement is supported by a questionnaire survey on people’s perceptions of groundwater usage [14,15].
According to the Royal Irrigation Department [9,20], the master plan for basin development has a maximum rice production area (cropping intensity (CI) or production area) planned at CI = 1.50 (growing 100% and 50% of agricultural area in the wet and dry seasons, respectively). The above limit is a target for the basin development based on, e.g., suitable soil texture for rice growing areas and supporting markets.
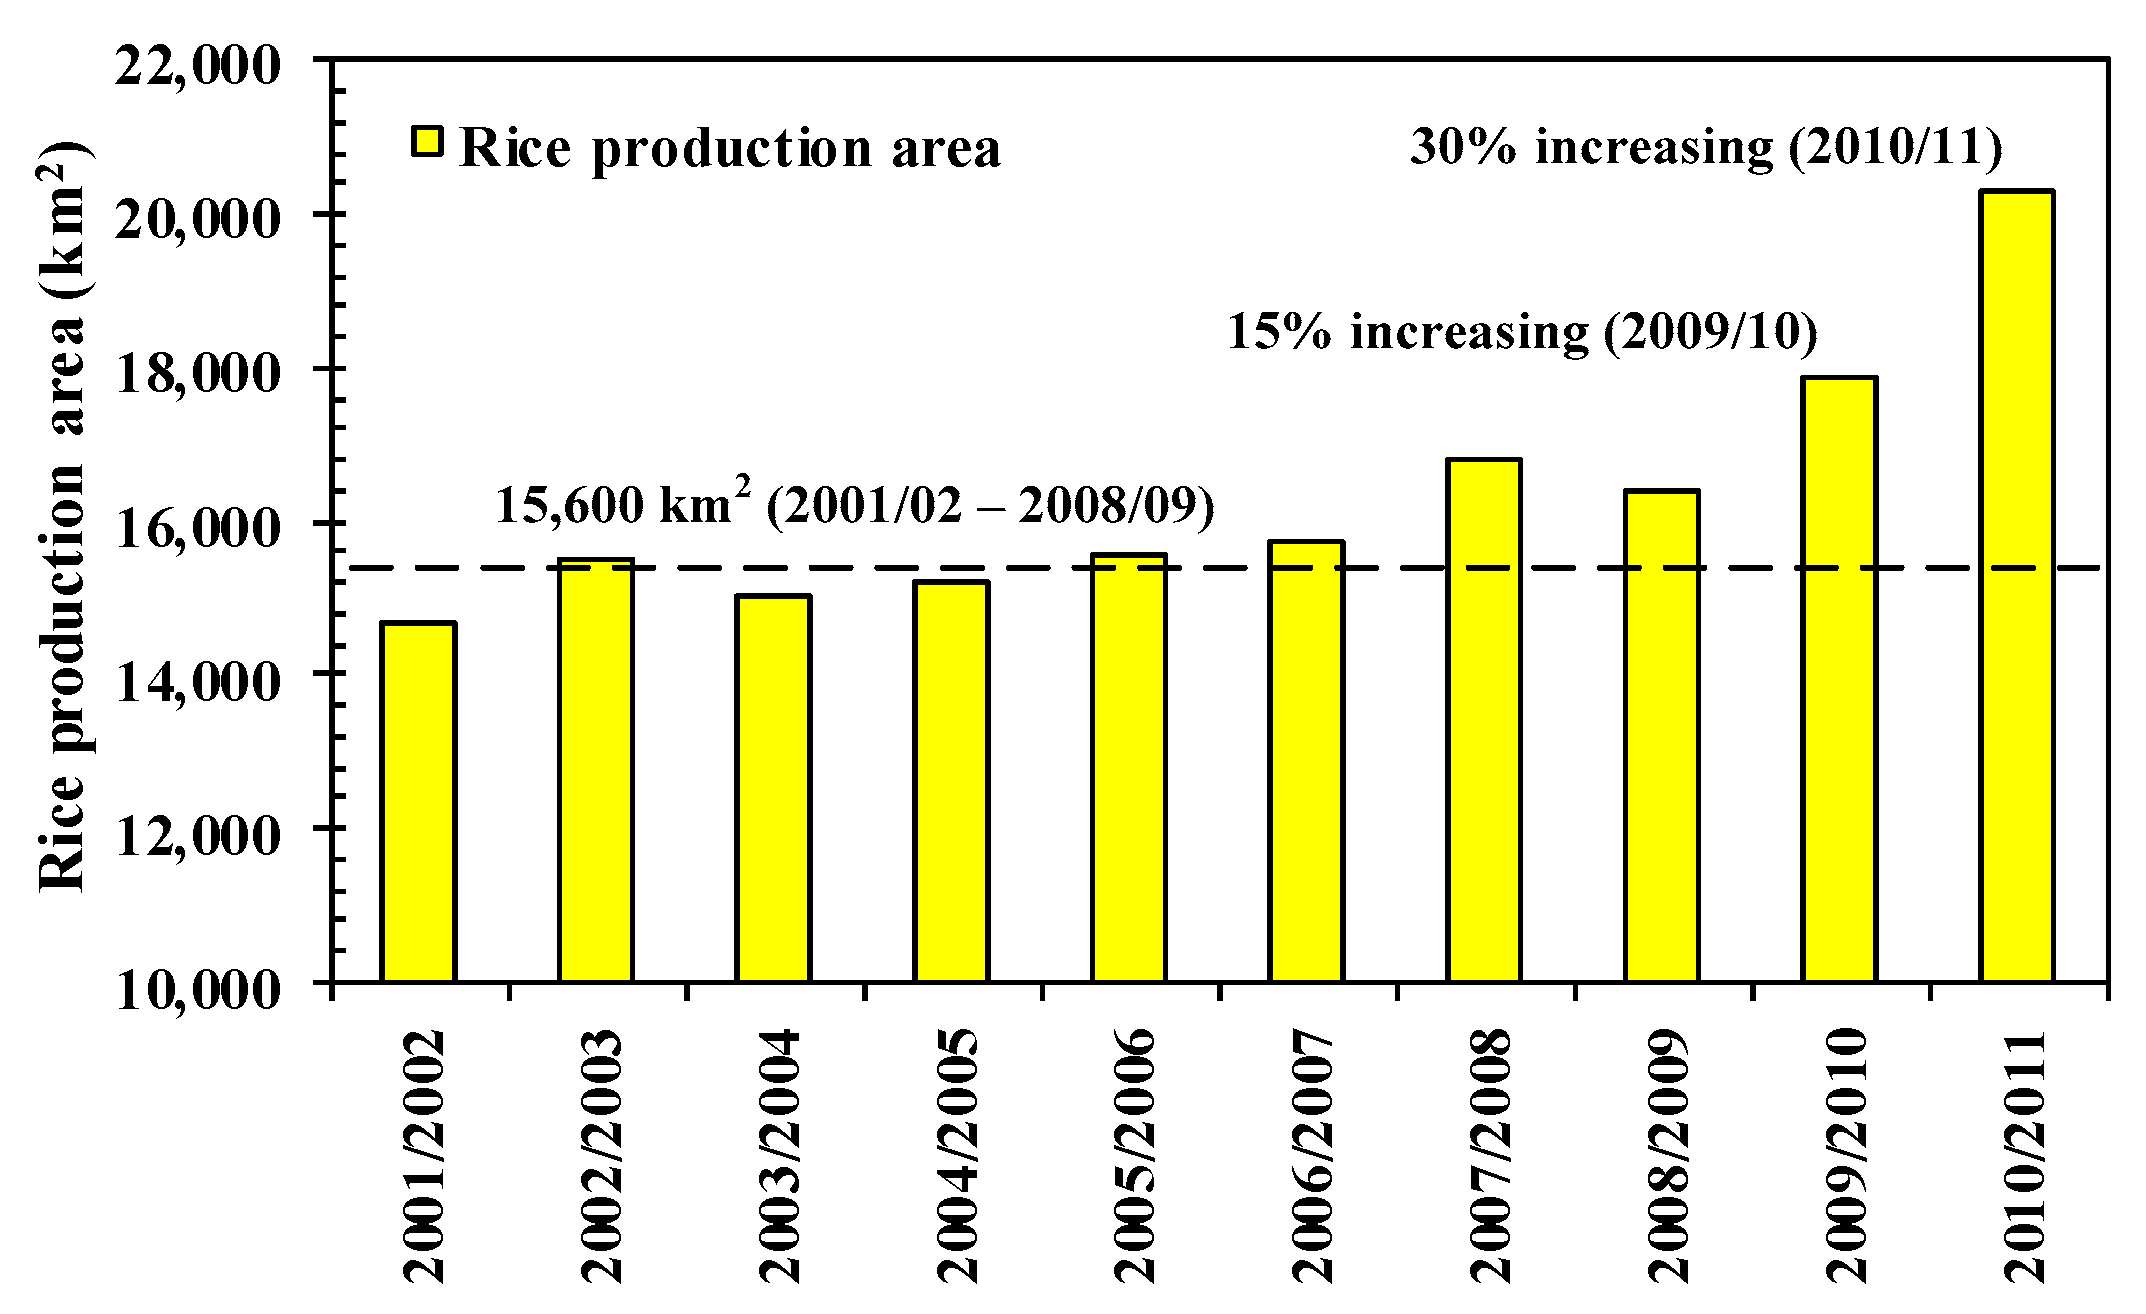
Figure 9 shows a statistical rice production area [27] in the UCP’s flood-prone area that covers 5 provinces (i.e., Sukhothai, Phitsanulok, Kamphaeng Phet, Phichit, and Nakhon Sawan provinces). It is clearly seen that in 2010 (15%) and 2011 (30%) the production areas were suddenly increasing relative to the average value throughout 2001–2009. Based on the data, the CI of the 2011 year was 1.56. It was a little over the maximum basin development plan. Therefore, understanding dry season basin water use in the year 2011 might be reflected in maximum groundwater use under the basin development goal.
The calculations of basin water consumption () were 2.82 (176 mm) and 3.21 (201 mm) km3 for the 2010 and 2011 dry seasons, respectively. According to the estimated figures, the increase in rice production areas was supported by FGS because the RGS yielded approximately 1.91 km3, which is not enough for the water demand. From this point of view, we note that flood inundation is needed for recharging TGS. Given 2011 as a reference year (CI closed to the basin target), thus, approximately 1.30 km3 is required from the FGS. Based on Figure 8 (2012 flood magnitude with occupied 2260 km2 of flooded area), it yielded approximately 1.90 km3 in FGS together with RGS, which satisfied the water consumption as calculated above.
If the floodways were implemented, the maximum allowable peak discharge at the C.2 would be approximately 3000 m3 s−1. Using the peak discharge value, we can determine that approximately 4600 km2 is the maximum inundation area. Regarding flood statistic data, flood magnitudes such as those of the 2006 or 2010 events will take place approximately once in every 4 years [7,16,25]. We expect the small floods, such as those in 2007, 2008, 2009 and 2012, to disappear because of the expected floodway function. Thus, the basin may have approximately 2.53 km3 (estimated from 4600 km2 of flood inundation area) additional capacity from the FGS every 4 years or 0.63 km3 year−1 (on average), while the requirement is approximately 1.30 (km3 year−1) × 4 (years) = 5.20 km3 (under the CI = 1.5). The calculated figure suggests that there will be an imbalance between recharging and subtracting water volume. Thus, approximately 0.90 km3 year−1 (or about 1820 km2 of flooded area) is needed every year and 2.53 km3 is required once in every 4 years. Therefore, the FGS is expected to balance out every 4 years under the CI = 1.50. This finding suggests that a flood scale similar to the 2009 event (1955 ≥ 1820 km2 of inundation area) is needed to maintain the basin water consumption.
5. Conclusions
Flooding is a commonly natural disaster in Thailand, especially in the UCP. The mega-flood in 2011 was declared to have a damage cost of USD 46.5 billion and called for flood mitigation measures. However, flooding acts as an important function for recharging groundwater storage. Indeed, it is a certain and reliable water resource for growing rice in the dry season, of which the farmers can benefit by obtaining production or income after the flood destroyed their paddy fields in the wet season.
The evaluation of various flood magnitudes from 1660 to 10,470 km2 of inundation area in the UCP contributes to groundwater storages between 0.50 and 5.92 km3. Since the inundated duration is of about 1 month (October), the assessment of the effective infiltration rate is approximately 15–20 mm day−1.
To address flood damages, floodways are proposed for cutting flood peaks at the C.2 station (UCP’s outlet). Approximately 4930 km2 (47%) of inundation area is expected to decrease relative to the 2011 flood event. In addition, the floodway function is expected to protect almost 100% against small floods. In other words, there will be flooding once in every 4 years and the maximum inundation area is not over 4600 km2. However, the operation of floodways will reduce groundwater storage that is a considerable water source for coping with the water shortage and particularly for the rainfed areas in the dry season.
Regarding the master plan of basin development (CI = 1.50), the growing areas need approximately 3.21 km3 of water demand from groundwater. Our finding showed approximately 1.91 km3 (on average) is expected from RGS and that is not enough for the requirement. To maintain the basin development goal, approximately 1.30 km3 of water volume is needed from the FGS. Thus, we suggest approximately 1820 km2 should be allowed for a month of flooding, with 0.90 km3 of water volume harvested as the FGS, and approximately 2.53 km3 of FGS from a big event (discharge at C.2 ≥ 3000 m3 s−1) that usually takes place every 4 years. Therefore, groundwater extraction and recharging volume will be met in every four years. This concludes that floodways are still an important structure to protect from potential water losses; however, the consequences for groundwater and reliable water sources should be carefully considered. Thereby, the floodway accumulates a buffer water volume to supply the basin for water consumption. Regarding the Sustainable Development Goals of the UN, the socio-economics of the trade-off between flood and drought management should be further investigated in detail. In addition, the delineation of flood-confinement boundaries for retarding flood volume is also an issue challenging researchers, engineers and stakeholders cooperating for long-term and sustainable management.
Author Contributions
Conceptualization, W.P., C.E., and K.T.L.; methodology, W.P., C.E., and N.Y.; data collection, W.P., C.E., and N.Y.; formal analysis, investigation, discussion and validation, W.P., C.E., N.Y., and K.T.L.; writing—original draft manuscript, W.P. All authors have read and agreed to the published version of the manuscript.
Funding
This research was supported by the Faculty of Engineering, King Mongkut’s University of Technology North Bangkok, under grant number ENG-NEW-64-32, and the Department of Civil Engineering, King Mongkut’s University of Technology Thonburi, under grant number CE-KMUTT-6505.
Data Availability Statement
Data and source were cited in the paper.
Acknowledgments
The authors gratefully acknowledge Royal Irrigation Department (RID), Department of Groundwater Resources (DGR), Department of Disaster Prevention and Mitigation (DDPM), Land Development Department (LDD), and Geo-Informatics and Space Technology Development Agency (GISTDA) for providing the data. We are also grateful to the anonymous reviewers and MDPI for all the edits, remarks, and suggestions that are very helpful and constructive for improving our paper.
Conflicts of Interest
The authors declare no conflict of interest.
References
- World Bank. Thai Flood 2011, Rapid Assessment for Resilient Recovery and Reconstruction Planning; The World Bank: Washington, DC, USA, 2012; p. 377. Available online: https://openknowledge.worldbank.org/handle/10986/26862 (accessed on 1 September 2020).
- Department of Disaster Prevention and Mitigation (DDPM). Disaster Data Center. 2019. Available online: http://110.78.23.203/in.datacenter-5.289 (accessed on 1 April 2019).
- Gopalan, S.P.; Hanasaki, N.; Champathong, A.; Tebakari, T. Impact Assessment of Reservoir Operation in the Context of Climate Change Adaptation in the Chao Phraya River Basin. Hydrol. Process. 2021, 35, e14005. [Google Scholar]
- Yoobanpot, N.; Pratoomchai, W. A near future climate change impacts on water resources in the Upper Chao Phraya River basin in Thailand. Geogr. Technol. 2022, 17, 193–207. [Google Scholar] [CrossRef]
- Watanabe, S.; Hirabayashi, Y.; Kotsuki, S.; Hanasaki, N.; Tanaka, K.; Mateo, C.M.; Kiguchi, M.; Ikoma, E.; Kanae, S.; Oki, T. Application of performance metrics to climate models for projecting future river discharge in the Chao Phraya River basin. Hydrol. Res. Lett. 2014, 8, 33–38. [Google Scholar] [CrossRef] [Green Version]
- United Nations. Sustainable Development Golds. Available online: https://www.un.org/sustainabledevelopment/wp-content/uploads/2019/01/SDG_Guidelines_AUG_2019_Final.pdf (accessed on 14 December 2021).
- Ministry of Agriculture and Cooperatives, Japan International Cooperation Agency (JICA). The Project for Flood Countermeasures for Thailand Agricultural Sector in the Kingdom of Thailand. 2013; p. 303. Available online: https://openjicareport.jica.go.jp/pdf/12128914.pdf (accessed on 1 April 2019).
- Mateo, C.M.; Hanasaki, N.; Komori, D.; Tanaka, K.; Kiguchi, M.; Champathong, A.; Sukhapunnaphan, T.; Yamazaki, D.; Oki, T. Assessing the impacts of reservoir operation to floodplain inundation by combining hydrological, reservoir management, and hydrodynamic models. Water Resour. Res. 2014, 50, 7245–7266. [Google Scholar] [CrossRef]
- Royal Irrigation Department (RID). Project of Feasibility and Environmental Impact Assessment Study for the Water Management in the Western Chao Phraya. 2014. Available online: http://largescale.rid.go.th/2021/th/datacenter/archives-documents (accessed on 1 April 2018).
- Japan International Cooperation Agency; Pacific Consultants Co., Ltd.; Oriental Consultants Global Co., Ltd. Data Collection Survey on the Outer Ring Road Diversion Channel in the Comprehensive Flood Management Plan for the Chao Phraya River Basin in the Kingdom of Thailand. 2018; p. 165. Available online: https://openjicareport.jica.go.jp/pdf/12308631_01.pdf (accessed on 7 December 2022).
- Kazama, S.; Hagiwara, T.; Ranjan, P.; Sawamoto, M. Evaluation of groundwater resources in wide inundation areas of the Mekong River basin. J. Hydrol. 2007, 340, 233–243. [Google Scholar] [CrossRef]
- Adhikari, R.K.; Mohanasundaram, S.; Shrestha, S. Impacts of land-use changes on the groundwater recharge in the Ho Chi Minh city, Vietnam. Environ. Res. 2020, 185, 109440. [Google Scholar] [CrossRef] [PubMed]
- Department of Groundwater Resources (DGR). The Integrated Conjunctive Groundwater and Surface Water Use and the Pilot Groundwater Resources Management in Northern Region of Thailand; Department of Groundwater Resources: Bangkok, Thailand, 2011; p. 350.
- Koontanakulvong, S.; Chaowiwat, W.; Miyazato, T. Climate change’s impact on irrigation system and farmers’ response: A case study of the Plaichumpol Irrigation Project, Phitsanulok Province, Thailand. Paddy Water Environ. 2013, 12, 241–254. [Google Scholar] [CrossRef]
- Pratoomchai, W.; Kazama, S.; Manandhar, S.; Ekkawatpanit, C.; Saphaokham, S.; Komori, D.; Tongduang, J. Sharing of people’s perceptions of past and future hydro-meteorological changes in the groundwater use area. Water Resour. Manag. 2015, 29, 3807–3821. [Google Scholar] [CrossRef]
- Pavelic, P.; Srisuk, K.; Saraphirom, P.; Nadee, S.; Pholkern, K.; Chusanathas, S.; Munyou, S.; Tangsutthinon, T.; Intarasut, T.; Smakhtin, V. Balancing-out floods and droughts: Opportunities to utilize floodwater harvesting and groundwater storage for agricultural development in Thailand. J. Hydrol. 2012, 470–471, 55–64. [Google Scholar] [CrossRef]
- Pratoomchai, W.; Kazama, S.; Ekkawatpanit, C.; Komori, D. Opportunities and constraints in adapting to flood and drought condition in the Upper Chao Phraya River basin in Thailand. Int. J. River Basin. Manag. 2015, 13, 413–427. [Google Scholar] [CrossRef]
- Loc, H.H.; Park, E.; Chitwatkulsiri, D.; Lim, J.; Yun, S.; Maneechot, L.; Phuong, D.M. Local rainfall or river overflow? Re-evaluating the cause of the Great 2011 Thailand flood. J. Hydrol. 2020, 589, 125368. [Google Scholar] [CrossRef]
- Department of Water Resources (DWR). Strategic Plan for Water Resources Management in 25 Basins; Department of Water Resources: Bangkok, Thailand, 2007; p. 397.
- Royal Irrigation Department (RID). The Systematic of Irrigation Plan under the Framework of 60 Million Rai. 2010. Available online: https://www.rid.go.th/main/index.php?option=com_content&view=article&id=87&Itemid=19 (accessed on 1 April 2019).
- Department of Groundwater Resources (DGR). History of Groundwater Development in Thailand. Available online: http://www.dgr.go.th/en/about/391 (accessed on 14 December 2020).
- Dingman, S.L. Physical Hydrology, 3rd ed.; Waveland Press, Inc.: Long Grove, IL, USA, 2015; p. 643. [Google Scholar]
- Helsel, D.R.; Mueller, D.K.; Slack, J.R. Computer Program for the Kenndall Family of Trend Tests. U.S. Geological Survey Scientific Investigations Report 2005–5275. 2006; p. 4. Available online: https://pubs.usgs.gov/sir/2005/5275/pdf/sir2005-5275.pdf (accessed on 15 September 2015).
- Kennedy, K.H. Introduction to 3D Data: Modeling with ArcGIS 3D Analysis and Google Earth, 1st ed.; John Wiley & Sons, Inc.: Hoboken, NJ, USA, 2009; p. 329. [Google Scholar]
- Komori, D.; Mateo, C.M.; Saya, A.; Nakamura, S.; Kiguchi, M.; Klinkhachorn, P.; Sukhapunnaphan, T.; Champathong, A.; Takeya, K.; Oki, T. Application of the probability evaluation for the seasonal reservoir operation on flood mitigation and water supply in the Chao Phraya River watershed, Thailand. J. Disaster Res. 2013, 8, 432–446. [Google Scholar] [CrossRef]
- Prajamwong, S.; Suppataratarn, P. Integrated flood mitigation management in the Lower Chao Phraya River basin. In Proceedings of the Expert Group Meeting on Innovative Strategies towards Flood Resilient Cities in Asia-Pacific, Bangkok, Thailand, 21–23 July 2009. [Google Scholar]
- Office of Agricultural Economics (OAE). Agricultural Statistics of Thailand. Available online: https://www.oae.go.th/ (accessed on 1 December 2016).
Figure 1.
Study area. (a) Upper Chao Phraya River basin and (b) flood and drought damage in Thailand.
Figure 1.
Study area. (a) Upper Chao Phraya River basin and (b) flood and drought damage in Thailand.

Figure 2.
Flow-duration analysis at the C.2 gauging station.

Figure 3.
Spatial distributions of annual flood inundation areas (figures in parentheses are in km2).
Figure 3.
Spatial distributions of annual flood inundation areas (figures in parentheses are in km2).

Figure 4.
The Chao Phraya river network and scheme of floodways.

Figure 5.
The UCP’s flood-prone, agricultural areas, and observation wells along the Yom River (pink squares).
Figure 5.
The UCP’s flood-prone, agricultural areas, and observation wells along the Yom River (pink squares).

Figure 6.
Temporal variability in groundwater levels along the Yom River.

Figure 7.
Temporal and spatial variability of groundwater levels in the UCP’s flood-prone area before and after the 2011 flood event.
Figure 7.
Temporal and spatial variability of groundwater levels in the UCP’s flood-prone area before and after the 2011 flood event.

Figure 8.
The Relationship between flood inundation areas and groundwater storage in the UCP’s flood-prone area.
Figure 8.
The Relationship between flood inundation areas and groundwater storage in the UCP’s flood-prone area.

Figure 9.
Rice production area in the UCP’s flood-prone area.


Table 1.
Data used in this study.
| Item | Data Owner and Source |
|---|---|
| River discharge | Royal Irrigation Department (RID): http://hydro-5.rid.go.th/ (accessed on 1 September 2021) |
| Flood inundation area | Geo-Informatics and Space Technology Development Agency (GISTDA): https://flood.gistda.or.th/ (accessed on 1 September 2021) |
| Groundwater level | Department of Groundwater Resources (DGR): http://tgms.dgr.go.th/#/home (accessed on 15 September 2019) |
| Economic loss due to disaster | Department of Disaster Prevention and Mitigation (DDPM) http://110.78.23.203/in.datacenter-5.289 (accessed on 1 April 2019) |
| Land use | Land Development Department (LDD): https://dinonline.ldd.go.th/ (accessed on 1 June 2021) |
| Flood monitoring and management policy | Royal Irrigation Department (RID): http://wmsc.rid.go.th/ (accessed on 1 April 2018) |
| Crop, plantation areas, and production | Office of Agricultural Economics (OAE): https://www.oae.go.th/ (accessed on 1 December 2016) |
Publisher’s Note: MDPI stays neutral with regard to jurisdictional claims in published maps and institutional affiliations. |
© 2022 by the authors. Licensee MDPI, Basel, Switzerland. This article is an open access article distributed under the terms and conditions of the Creative Commons Attribution (CC BY) license (https://creativecommons.org/licenses/by/4.0/).
Share and Cite
MDPI and ACS Style
Pratoomchai, W.; Ekkawatpanit, C.; Yoobanpot, N.; Lee, K.T. A Dilemma between Flood and Drought Management: Case Study of the Upper Chao Phraya Flood-Prone Area in Thailand. Water 2022, 14, 4056. https://doi.org/10.3390/w14244056
AMA Style
Pratoomchai W, Ekkawatpanit C, Yoobanpot N, Lee KT. A Dilemma between Flood and Drought Management: Case Study of the Upper Chao Phraya Flood-Prone Area in Thailand. Water. 2022; 14(24):4056. https://doi.org/10.3390/w14244056
Chicago/Turabian StylePratoomchai, Weerayuth, Chaiwat Ekkawatpanit, Naphol Yoobanpot, and Kwan Tun Lee. 2022. "A Dilemma between Flood and Drought Management: Case Study of the Upper Chao Phraya Flood-Prone Area in Thailand" Water 14, no. 24: 4056. https://doi.org/10.3390/w14244056
Note that from the first issue of 2016, this journal uses article numbers instead of page numbers. See further details here.