
Temporal–Spatial Variability of Dissolved Carbon in the Tributary Streams of the Lower Yangtze River Basin

1
State Key Laboratory of Vegetation and Environmental Change, Institute of Botany, Chinese Academy of Sciences, Nanxincun 20, Xiangshan, Beijing 100093, China
2
University of Chinese Academy of Sciences, Yuquanlu, Beijing 100049, China
3
School of Life Sciences, Qufu Normal University, 57 Jingxuan West Road, Qufu 273165, China
4
Key Laboratory of Dryland Agriculture, MOA, Institute of Environment and Sustainable Development in Agriculture, Chinese Academy of Agricultural Sciences, Beijing 100081, China
*
Authors to whom correspondence should be addressed.
Water 2022, 14(24), 4057; https://doi.org/10.3390/w14244057
Submission received: 18 October 2022
/
Revised: 24 November 2022
/
Accepted: 6 December 2022
/
Published: 12 December 2022
(This article belongs to the Section Water Quality and Contamination)
Abstract
:Dissolved carbon has been widely investigated in natural rivers worldwide. However, it has been rarely studied in riverine system of farming regions, where small streams have been usually modified by a water gate and flood levee. This study was conducted to investigate dissolved organic and inorganic carbon (DOC, DIC) in artificially modified tributary streams, namely the Desheng and Shuangqiao-Shiba streams, in a farming region of the lower Yangtze River basin. The results showed that the DOC and DIC concentrations had remarkable temporal–spatial variability in the Desheng and Shuangqiao-Shiba streams. The mean DOC concentrations were 5.4 and 6.7 mg L−1 in the Desheng and Shuangqiao-Shiba streams during the period of about 1 year, while the DIC concentrations were 14.0 and 9.6 mg L−1 in both streams, respectively. The DOC and DIC concentrations mainly showed the linear decreasing trends from source through to export in the spring, summer, autumn, and winter. The DOC concentration was almost always lower than the DIC concentration. The DOC concentration was positively correlated with the DIC concentration in the Desheng stream over the four seasons, indicating that the DOC and DIC potentially had similar sources. The DOC and DIC concentrations increased with sewage discharge, which introduced a potential hazard to human health. The water gate and flood levee in the Desheng and Shuangqiao-Shiba streams were constructed for discharging floods and recharging irrigation in the farming region, and their effects on dissolved carbon require further research.
1. Introduction
Riverine systems are remarkable transport conduits for carbon and nitrogen. A previous long-term monitoring study indicated an increasing trend of dissolved organic carbon (DOC) concentrations across most of the northern Hemisphere [1]. A large quantity of riverine carbon is transported and transformed into the oceans and the atmosphere. For instance, the global riverine system exported 710 Tg C yr−1 of fluvial carbon into the oceans and emitted 230 Tg yr−1 of carbon dioxide (CO2) into the atmosphere [2]. Wallin et al. [3] found that CO2 emissions represent 53% of the carbon flux in rivers, which would be partly due to rapid turnover of DOC. Sunlight, particularly ultraviolet irradiation, oxidizes DOC to lower-weight organic compounds such as CO2 and carbon monoxide (CO). The loss of dissolved inorganic carbon (DIC) through CO2 degassing from lakes, reservoirs, and rivers represented a remarkable portion of the terrestrial carbon [4]. The global methane (CH4) emissions from riverine systems were estimated at 26.8 Tg yr−1, which was comparable to the emissions from lakes and wetlands [5]. However, estimates of dissolved carbon and related greenhouse gases are highly uncertain due to their temporal and spatial variability. Thus, more integrated measurements are required on various scales.
Dissolved carbon is largely affected by a range of processes in riverine systems. For instance, DOC is derived from in situ production and atmospheric deposition, but it is depleted via photodegradation, flocculation, and microbial consumption. Similarly, DIC is produced by carbonate dissolution, silicate weathering, atmospheric CO2 invasion, and aquatic and soil respiration, but it is removed by CO2 emissions to the atmosphere, aquatic photosynthesis, and carbonate mineral reactions [4,6]. Furthermore, in farming regions, a source of dissolved carbon to riverine systems is discharge from potential sewage systems. Increasing dissolved carbon concentrations in waters has caused wide concern for public health over the past decades [1].
Factors driving dissolved carbon processes have been widely investigated in riverine system worldwide. DOC concentrations in riverine systems change spatially depending on the catchment geophysical characteristics and depend temporally on climatic patterns. For instance, riverine DOC and DIC concentrations are affected by climatic conditions, hydrological variables, and source and sink characteristics [4]. Heavy rainfall events can export a remarkable quantity of DOC and DIC from streams to estuaries [7]. Furthermore, the effects of freezing and cold storage on bulk DOC and dissolved nitrogen (DN) concentrations and their fractions were observed in lake water, leaf leachates, and peat soil water [8]. However, investigations on the drivers of dissolved carbon in riverine systems are still limited for understanding regional and global carbon budgets.
Dissolved carbon has often been investigated in natural riverine systems. For instance, the DOC concentration was investigated in lowland fen- and upland peat-dominated catchments in north Wales, UK [9]. The effects of temperature and moisture on DOC concentration were investigated in south-central Ontario, Canada, where the DOC concentration was strongly associated with temperature but weakly and negatively correlated with river discharge [10]. Stream flora and fauna had the potential for affecting the production and degradation of DOC [11]. On the basis of population dividing lines, China can be coarsely divided into southeastern farming and northwestern nomadic regions [12] (Figure S1). The population line is highly identical with the annual precipitation line of about 400 mm. Riverine systems are intensively distributed in farming region, where rivers are usually modified by water gates and flood levees for flood protection and cropland irrigation. However, natural rivers are scarcely modified in northwestern nomadic region. Relative to natural rivers, artificially modified rivers are rarely investigated in the southeastern farming region.
The Yangtze River is the largest river in China, with an approximate length of 6397 km and a basin area of 1.8 × 10⁶ km2 [13]. A number of branches and streams are distributed in the Yangtze River basin. Previous studies on the fluxes and processes of dissolved carbon have mainly focused on the trunk riverine system in the Yangtze River basin [14,15,16]. However, dissolved carbon fluxes and processes have been rarely investigated in small branches and streams.
The overall objective of this study was to investigate the dissolved carbon in artificially modified small streams in the farming region of the lower Yangtze River basin. Specifically, we wanted to address the issues of how DOC and DIC were distributed in spatial and seasonal scales and which factors drove the processes of dissolved carbon. Furthermore, we wanted to discuss the effects of anthropogenic activity on dissolved carbon.
2. Materials and Methods
2.1. Site Description
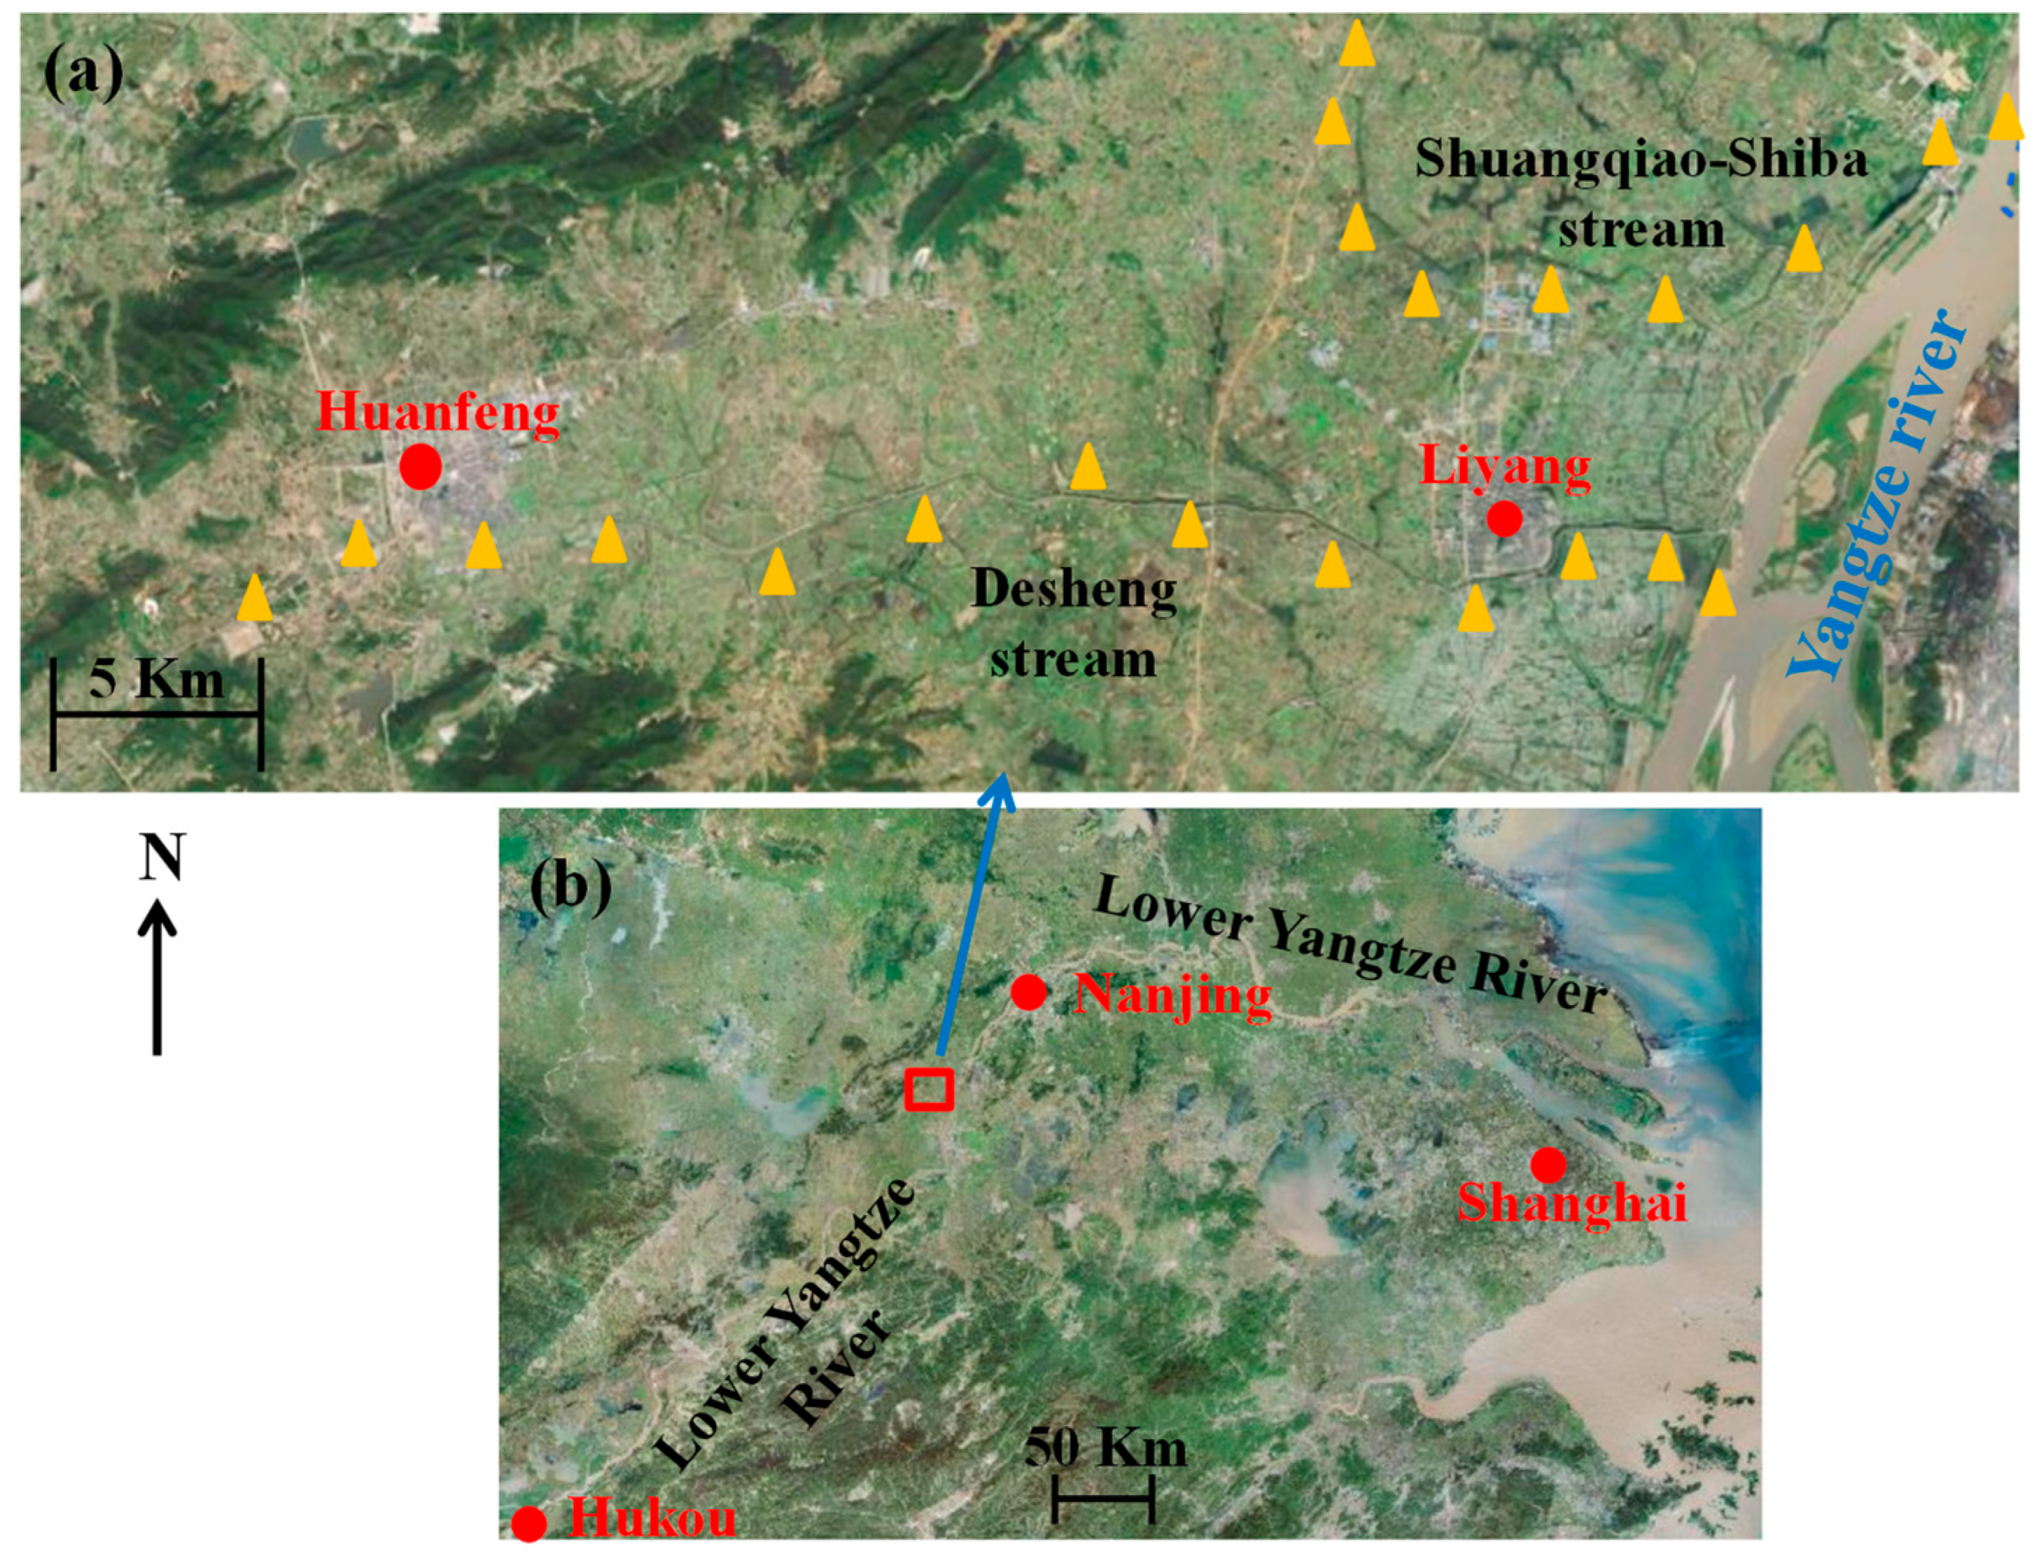
This study was carried out in tributary streams of the lower Yangtze River, namely the Desheng and Shuangqiao-Shiba streams (Figure 1). The streams are distributed in the lowland floodplains within the He and Hanshan counties, Anhui province, China, where the altitude ranges approximately between 5–15 m. The streams are located in a subtropical monsoon climatic zone, where rice is widely cultivated. The mean annual temperature is about 15.7 °C. The coolest monthly temperature is 2.5 °C in January, while the warmest is 28.2 °C in July. The mean annual precipitation is about 1085 mm, with the rainy season between May and September. Plants usually grow from March to November, while the soils are mainly brown loam.
The Desheng and Shuangqiao-Shiba streams originate from hilly and mountainous areas. The Desheng stream flows about 36.3 km from its source into the Yangtze River with a basin area of 427.3 km2. The Shuangqiao-Shiba stream is approximately 20.9 km in the length in terms of surface water with a basin area of 91.8 km2. A water gate and flood levee are prominent features in the Desheng and Shuangqiao-Shiba streams. The streams gradually grow wider from the source through to the export, with about 50–80 and 40–60 m in the middle sections of the Desheng and Shuangqiao-Shiba streams, respectively. In general, the water flows in the flooding summer but it is relatively stagnant in the other seasons. Detailed information on physical-chemical characteristics in both streams can be found in Table 1.
2.2. Field Investigation and Sampling
A series of field investigations and water samplings were conducted in the Desheng and Shuangqiao-Shiba streams, and results were enhanced by using the data from both streams. For the main understanding of the temporal-spatial variability in terms of dissolved carbon, water samples were collected from 13 and 9 sites in the Desheng and Shuangqiao-Shiba streams, respectively. In each sampling site, three water samples were collected as replicates at intervals of about 100 m. Water samples were collected from the Desheng and Shuangqiao-Shiba streams at quarterly and semiannual intervals, respectively. Specifically, water samples were collected in late October 2018, late March, early August, the middle of October 2019, and the middle of January 2020 in the Desheng stream and late March and the middle of October 2019 in the Shuangqiao-Shiba stream.
In order to understand the potential changes in dissolved carbon and nitrogen across the transects of the streams, water samples were collected across the transect of the S5 site in the middle section of the Desheng stream in the middle of October 2019. For understanding background physical-chemical characteristics, water samples were collected around the S2, S3, and S11 sites in the Desheng stream and the S4, S5, and S6 sites in the Shuangqiao-Shiba stream. The normal areas and sewage outlets of the streams and their surrounding ponds were investigated in early March 2020 (Table 1).
Water sampling was possible at about 2 m from the shore edges of the streams and ponds, while the sampling could reach the center of the Desheng stream by boat access. Water related to pollutant discharge was sampled in the area near the discharge outlets. Water was sampled at a depth of 0.3–0.5 m below the surface using a stainless pipe equipped with a gastight 100 mL disposable polypropylene syringe fitted with a three-way stopcock. In the field, the water temperature was directly measured using a portable thermometer. Stagnant water in the stainless pipe was completely removed before collecting water into a beaker for determining the pH. Specifically, the pH was measured using a portable pH meter (Mettler Toledo, FG2, Shanghai, China) after an equilibration for about 5 min after water collection. Water was further collected into 100 mL polyethylene bottles for determining the DOC, DIC, DN, and/or environmental variables. The polyethylene bottles were always rinsed with 0.2 M HCl and deionized water in advance. Water samples were directly collected into the bottles after rinsing with stream water. They were put in a black bag for protecting from photolysis and subsequently put in a cooler box with ice packs to suppress microbial activity during transportation to the laboratory. Once in the laboratory, the water samples were stored in a refrigerator at −20 °C until analysis within one month. It was assumed that the water quality was not changed during the freezing and thawing of the water samples.
Water samples were additionally collected into gas bags for measuring the concentrations of CH4, CO2, and nitrous oxide (N2O). In order to minimize the possibility of degassing during the sampling, it was ensured that the sampled water was not exposed to the atmosphere. Specifically, 60 mL of water was injected into a 120 mL gas bag that was evacuated and injected with 60 mL of local air in advance. Water in the bag was vigorously shaken by hand for about 1 min to allow the gases dissolved in the water to be degassed into the headspace. In order to avoid potential microbial contamination, the headspace gases were further transferred into another gas bag that was evacuated in advance.
2.3. The Analyses of Variables
The water samples were defrosted at room temperature after removing them from the refrigerator. DOC is generally characterized as the fraction of organic carbon capable of passing through a 0.45 μm filter [17]. The water samples were filtered through 0.45 μm nylon syringe filter and thereby carbon and nitrogen that were dissolved in forms such as DOC, DIC, and DN were measured. In contrast, the measured carbon and nitrogen were defined as the total organic carbon (TOC) and total nitrogen (TN) when the water samples were not filtered through the nylon syringe filter. For measuring the DOC, the water samples were blown with 3 M HCl for removing the SIC. The concentrations of DOC, DIC, and DN were measured using a C/N analyzer (Multi N/C 3100, Analytik-Jena AG, Jena, Germany). The carrier gas was high-purity oxygen at a flow rate of 160 mL min−1 and an injection volume of 500 μL. The DOC, DIC, and DN concentrations were calibrated using standard solutions with known concentrations, and only calibration curves with an R2 value of 0.95 or above were accepted. The water samples with substantial concentrations were diluted within the detectable range of the machine using deionized water, which was also used as a blank. Analyses of dissolved carbon and nitrogen standard solutions at 10 mg L−1 intervals demonstrated that the machine was linear from 0 up to at least 200 mg L−1, with an R2 value ≥ 0.95. The concentrations of TOC and TN were also measured using the Analytik Jena Multi N/C 3100 analyzer. NH4+ and NO3− concentrations were colorimetrically measured by an automated flow injection analyzer (AutoAnalyzer 3 High Resolution SEAL Analytical GmbH, Jena, Germany). The concentrations of Ca2+ were measured by an ICP-OES Spectrometer (ICAP6300; Thermo Fisher, Waltham, MA, USA). The sulfate (SO42−) and chloride (Cl−) concentrations were analyzed using a Thermo ICS-1500 device by the ion chromatography method [18].
The concentrations of CH4, CO2, and N2O were analyzed by gas chromatography (GC). The GC was an Agilent Technologies 7890 A or 7890 B equipped with an injection loop, a flame-ionization detector operated at 250 °C, and an electron capture detector operated at 350 °C. The column oven temperature was 60 °C, and the carrier gas was N2 with a flow rate of 48 mL min−1. Certified CH4, CO2, and N2O standards at 2.0, 404, and 0.355 μL L−1, respectively, (Beijing AP-BAIF Gases Industry Co. Ltd., Beijing, China) were used for calibration. The concentrations of greenhouse gases were adjusted for the local temperature and atmospheric pressure according to the ideal gas law.
2.4. Calculation and Statistical Analysis
The concentration of CH4 dissolved in the water samples was calculated from the CH4 concentration in the headspace of gas bag measured by GC. The calculation method was described in [19]. The concentrations of CO2 and N2O dissolved in the water samples were also calculated using this method.
Statistical analysis was conducted using the SPSS 25.0 software package. Statistical differences were tested for values on both a spatial and seasonal basis. Firstly, original data sets were checked using a series of tests. For instance, the Shapiro–Wilk test was used for normality while the Levene test was used for equality of variances. The data in each group of treatments were normally distributed. Secondly, the data among each group of treatments were tested by one-way ANOVA. When a significant difference was identified, a comparison of means test was applied. Duncan’s multiple range test was employed to determine significant differences in each group of treatments. The Pearson test was used to examine the significance of correlation between the DOC and DIC concentrations. Statistically significant differences among treatments (p < 0.05) were indicated by different letters.
3. Results
3.1. Physical-Chemical Characteristics
The physical-chemical characteristics were investigated in subsurface water layer of the Desheng and Shuangqiao-Shiba streams and their surrounding ponds (Table 1). The pH was always higher than 7, indicating an alkaline condition in the water system. The temperature had no significant difference among the normal areas and sewage outlets of the streams and their surrounding ponds. The TOC concentration was significantly higher in the streams than in the surrounding ponds (p < 0.05). Specifically, the TOC was 14.7, 15.1, and 4.9 mg L−1 in the normal areas and sewage outlets of the Desheng stream and its surrounding ponds, respectively, while the TOC was 34.9, 36.0, and 4.4 mg L−1 in the areas and sewage outlets of the Shuangqiao-Shiba stream and its surrounding ponds, respectively. However, the TN concentration was higher in the sewage outlets of the streams than in the other habitats, of which the differences reached statistical significance in the Desheng stream. Most of NO3−-N and NH4+-N concentrations were significantly higher in the streams than in their surrounding ponds. The Ca2+ concentration showed less differences among the three habitats relative to the other physical-chemical factors. The SO42− and Cl− concentrations were significantly higher in the sewage outlets than in the other habitats (p < 0.05).
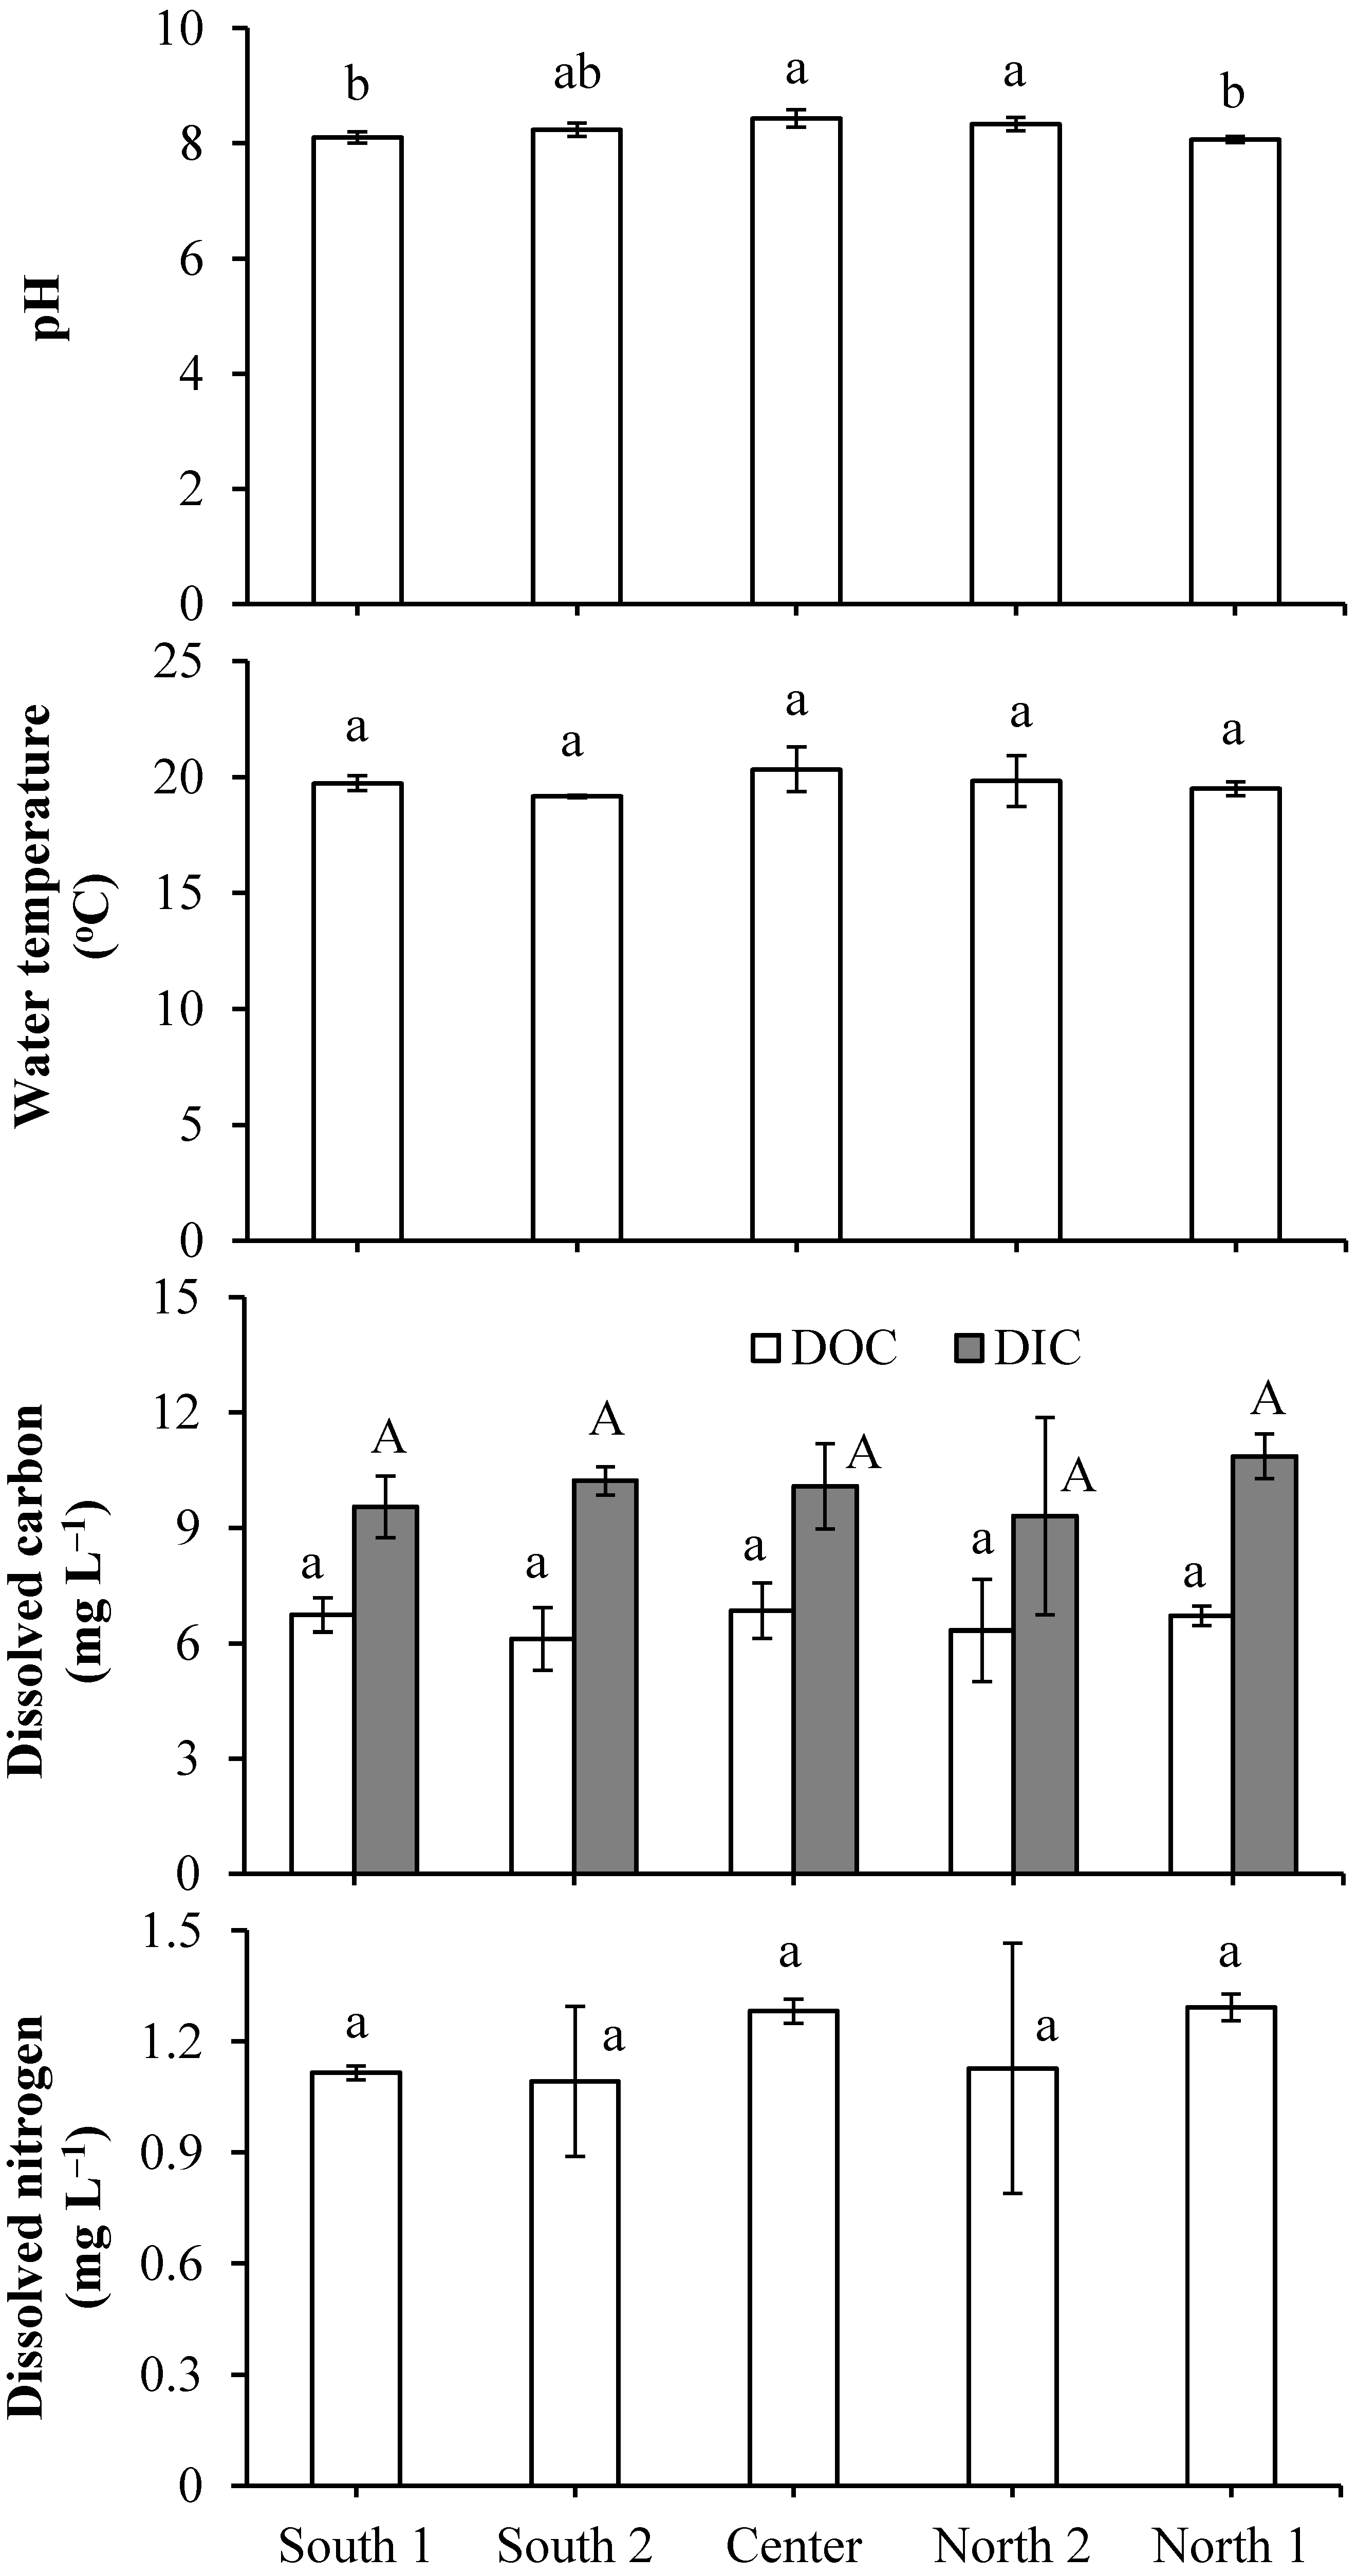
Across the transect of the S5 site in middle section of the Desheng stream, the pH showed significant differences, but the water temperature, DOC, DIC, and DN showed no significant differences among the five locations of the transect (p > 0.05) (Figure 2). Accordingly, the water sampling near the shores was thought to be representative of the streams.
3.2. Dissolved Organic and Inorganic Carbon Concentrations
The DOC and DIC concentrations had different degrees of seasonal variability in the Desheng and Shuangqiao-Shiba streams (Table 2). In general, the DOC concentration was much lower than the DIC concentration. The mean DOC and DIC concentrations were much higher in October 2018 than in October 2019, indicating significant interannual variability (p < 0.05, n = 13). The DOC and DIC concentrations were much higher than the DN concentration, but they consistently showed seasonal variability in both streams. Accordingly, the subsequent results and discussion on the DOC and DIC approximately reflected the status of the DN.
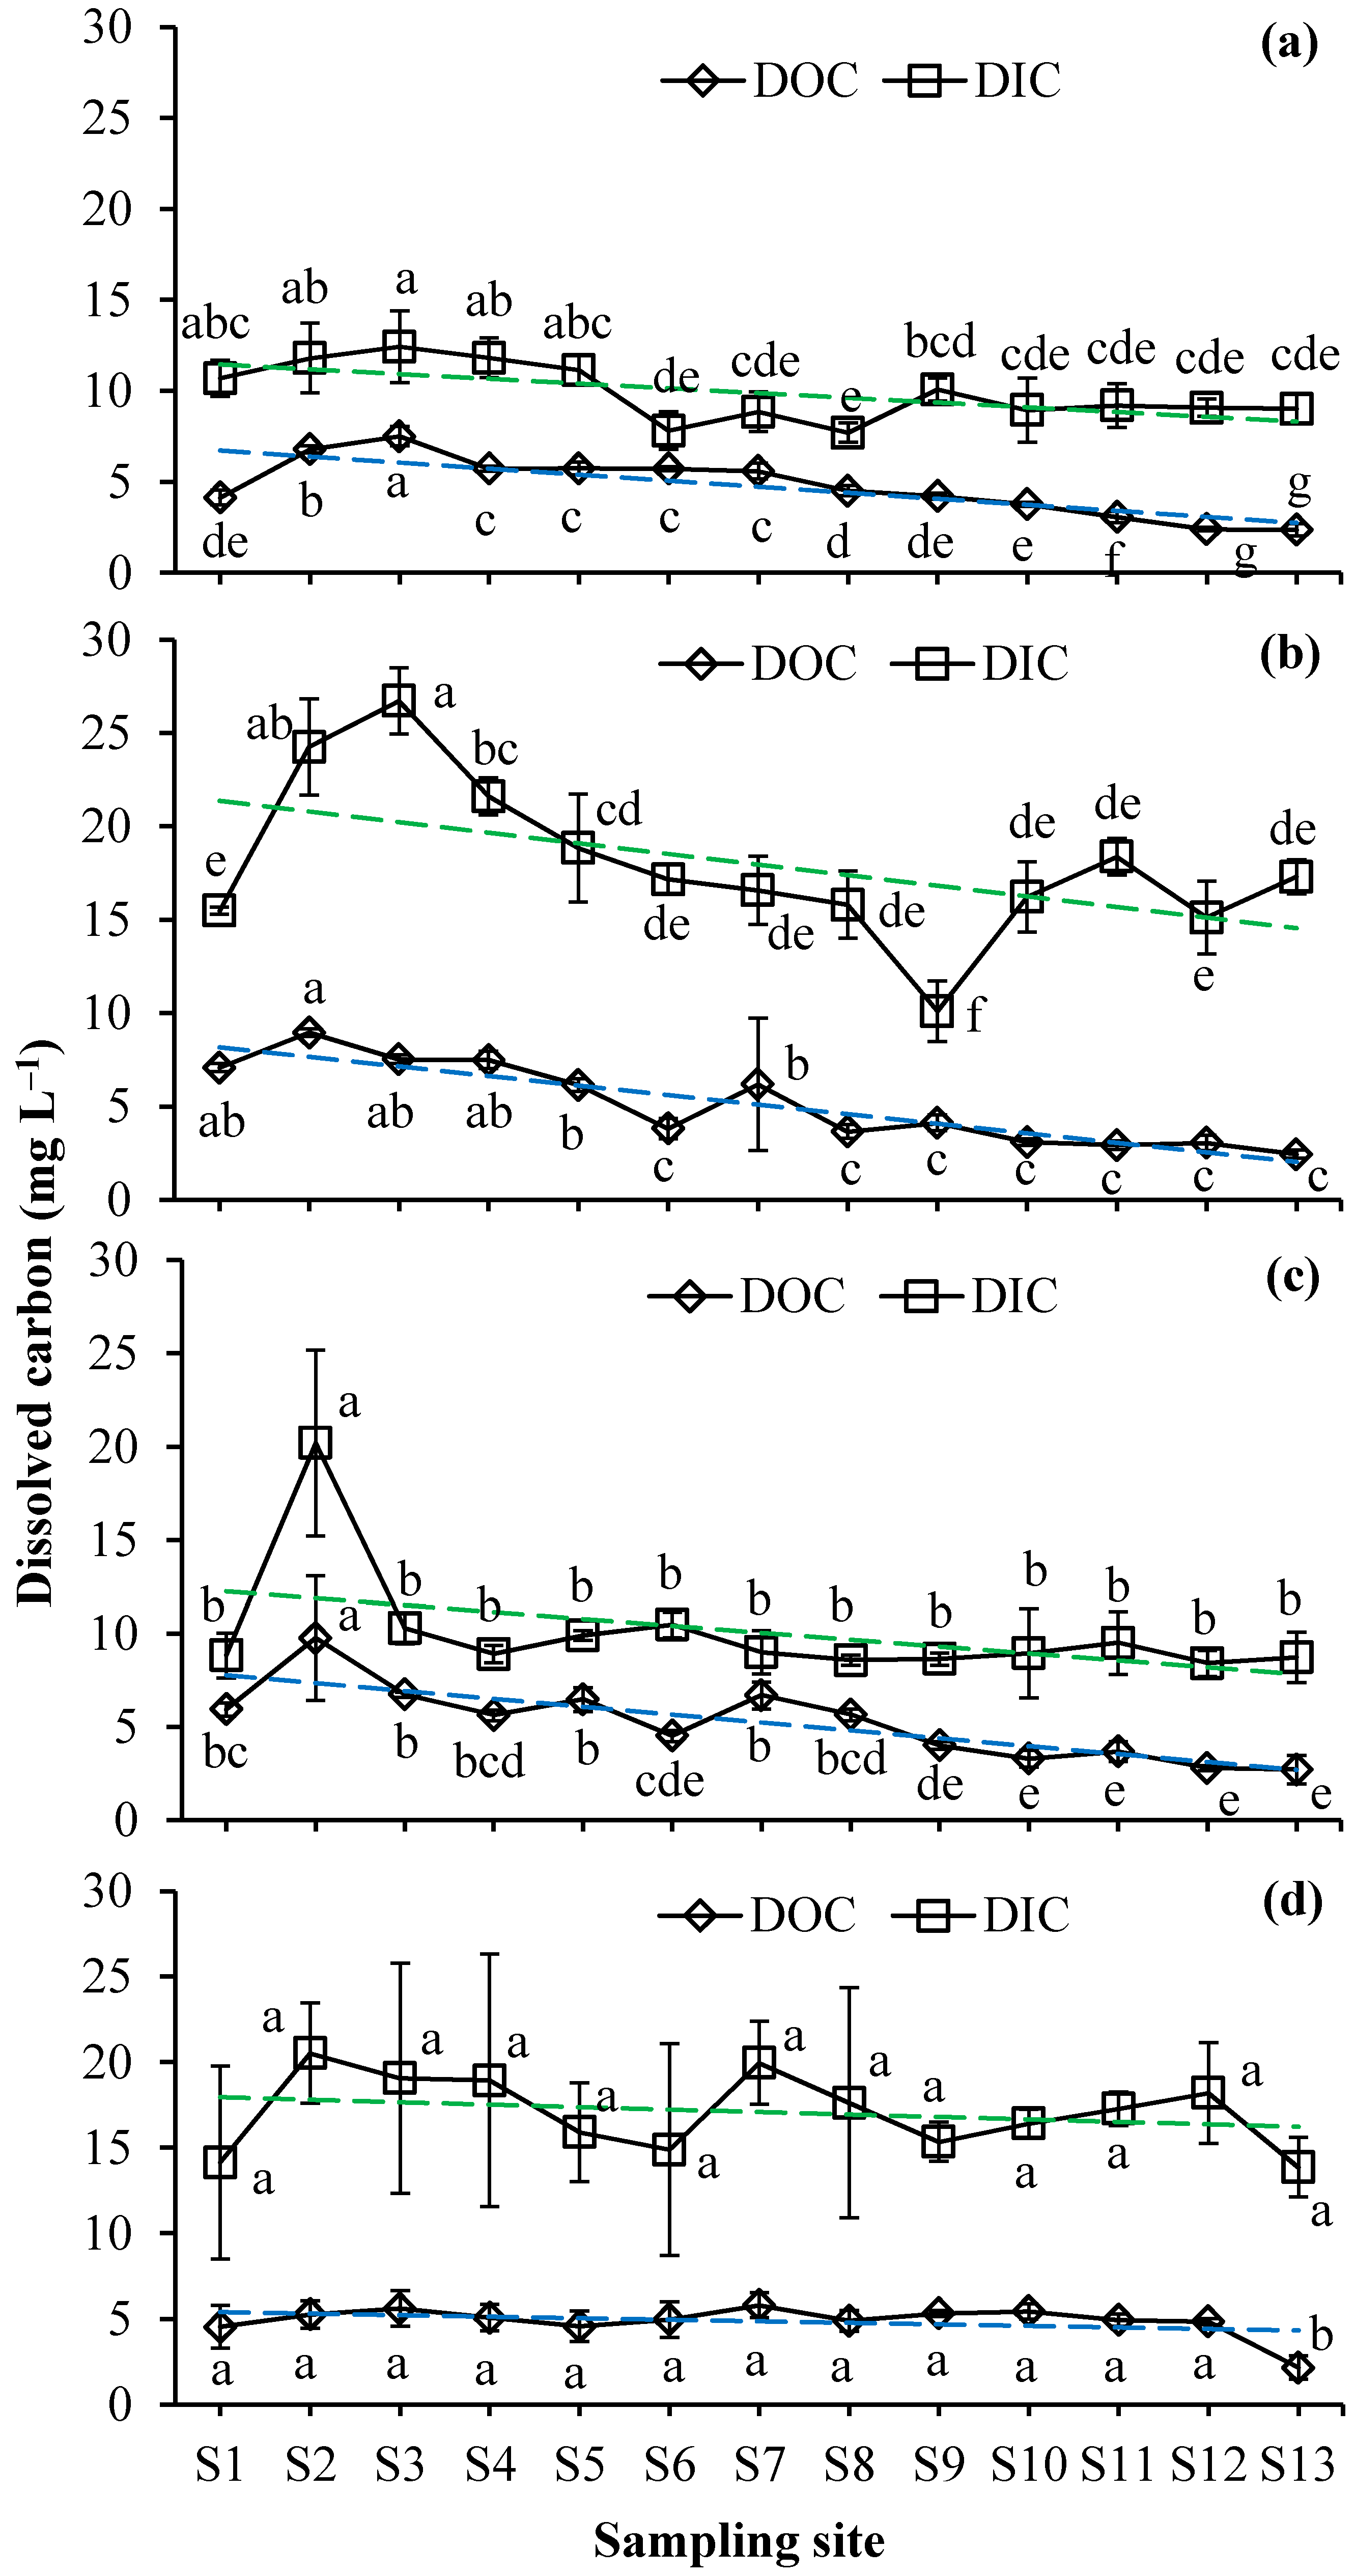
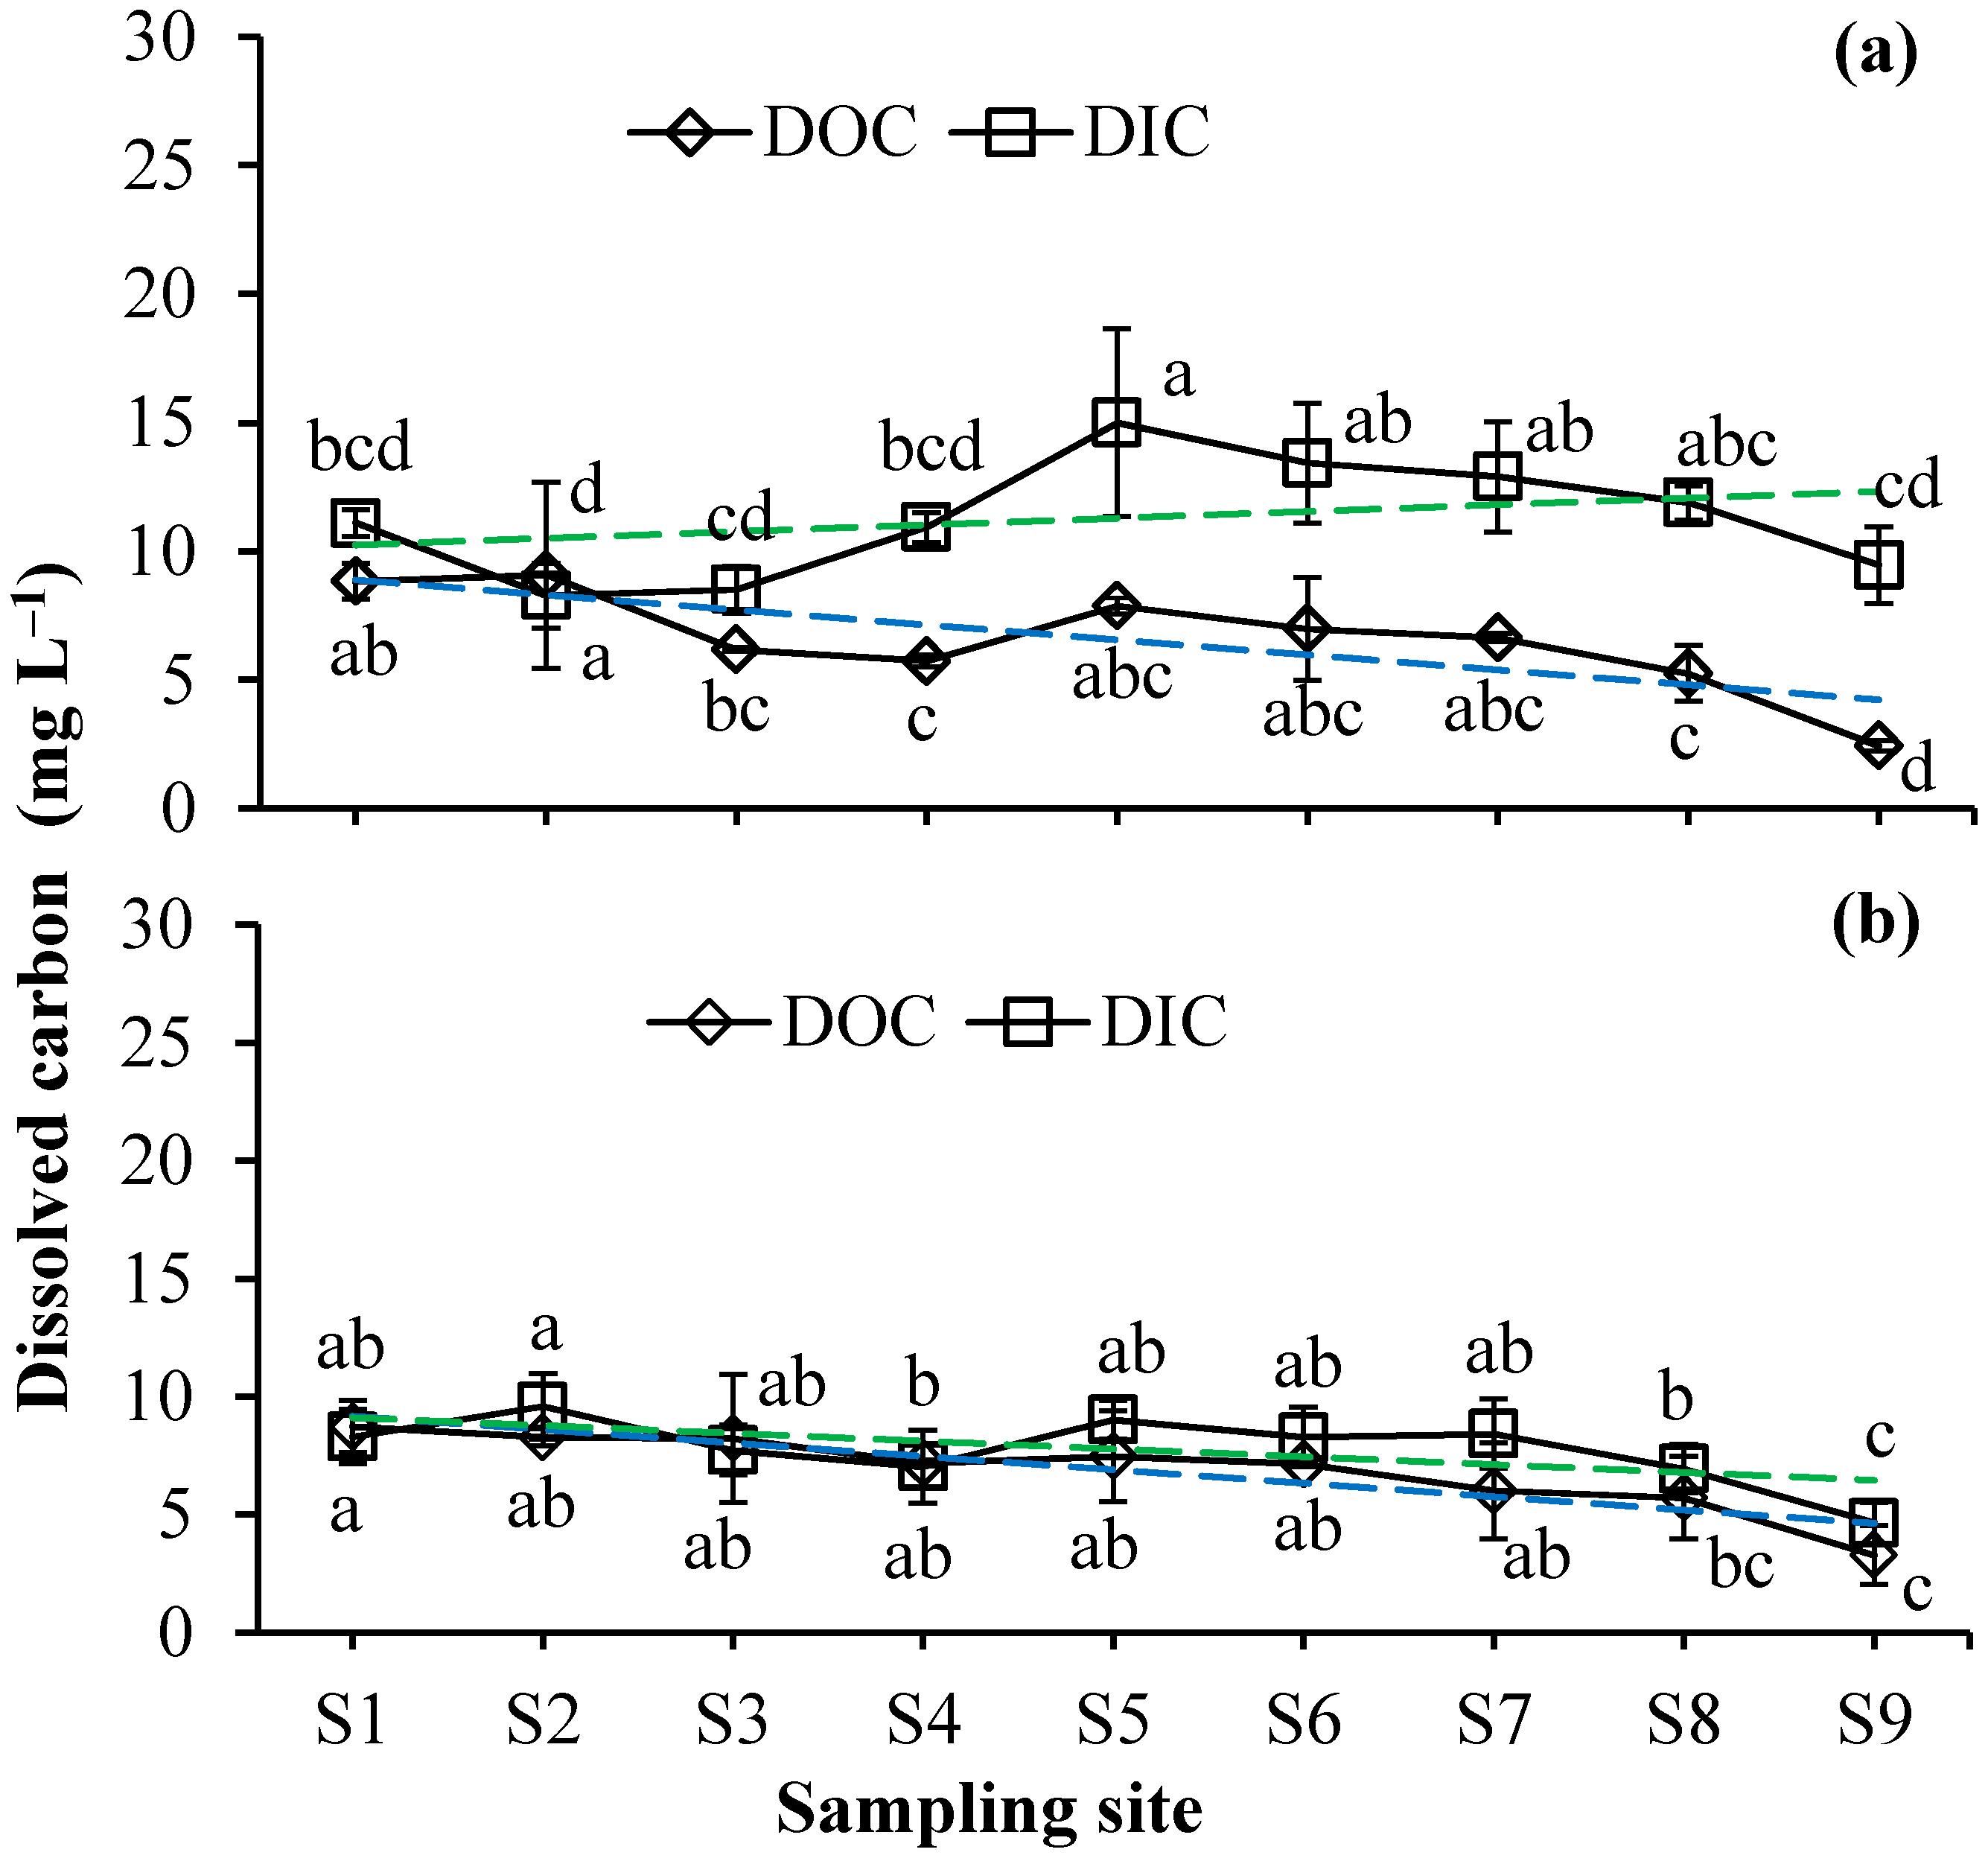
The DOC and DIC concentrations had great spatial variability in the Desheng and Shuangqiao-Shiba streams (Figure 3 and Figure 4). In general, the DOC and DIC concentrations showed significant differences in the sampling sites of the two streams (p < 0.05) and showed a much larger spatial variability in the summer than in the winter. The DOC and DIC concentrations showed linear decreasing trends from the source through to the export of the Desheng stream in all four seasons. The DOC concentration linearly decreased from the source through to the export of the Shuangqiao-Shiba stream, whereas the DIC concentration showed contrasting linear trends between the spring and autumn seasons. On average, the annual DOC concentration was 6.5, 5.2, and 3.3 mg L−1 in the upper, middle, and lower sections of the Desheng stream, while annual the DIC concentration was 16.0, 12.7, and 12.8 mg L−1 in the three sections, respectively. For measurements in the spring and autumn seasons, the mean DOC concentration was 8.2, 7.1, and 4.9 mg L−1 in the upper, middle, and lower sections of the Shuangqiao-Shiba stream, whereas the mean DIC concentration ranged approximately between 9–10.5 mg L−1 in three sections, respectively.
The sampling S2 and S3 in the Desheng stream were in the southern Huanfeng town, while the S10 and S11 were in the southern Liyang town; the S5 in the Shuangqiao-Shiba stream was in the northern Liyang town (Figure 1a). There were visible sewage discharge in the sampling S2 and S3 in the Desheng stream, and the S5 in the Shuangqiao-Shiba stream but sewage was partly treated for decreas-ing pollution in the S10 and S11 in the Desheng stream. In general, DOC and DIC con-centrations were higher in the southern Huanfeng town relative to the other sampling sites in the Desheng stream (Figure 3), while the concentrations were higher in the northern Liyang town relative to the other sampling sites in the Shuangqiao-Shiba stream (Figure 4). Accordingly, sewage discharge increased DOC and DIC concentrations in both streams.
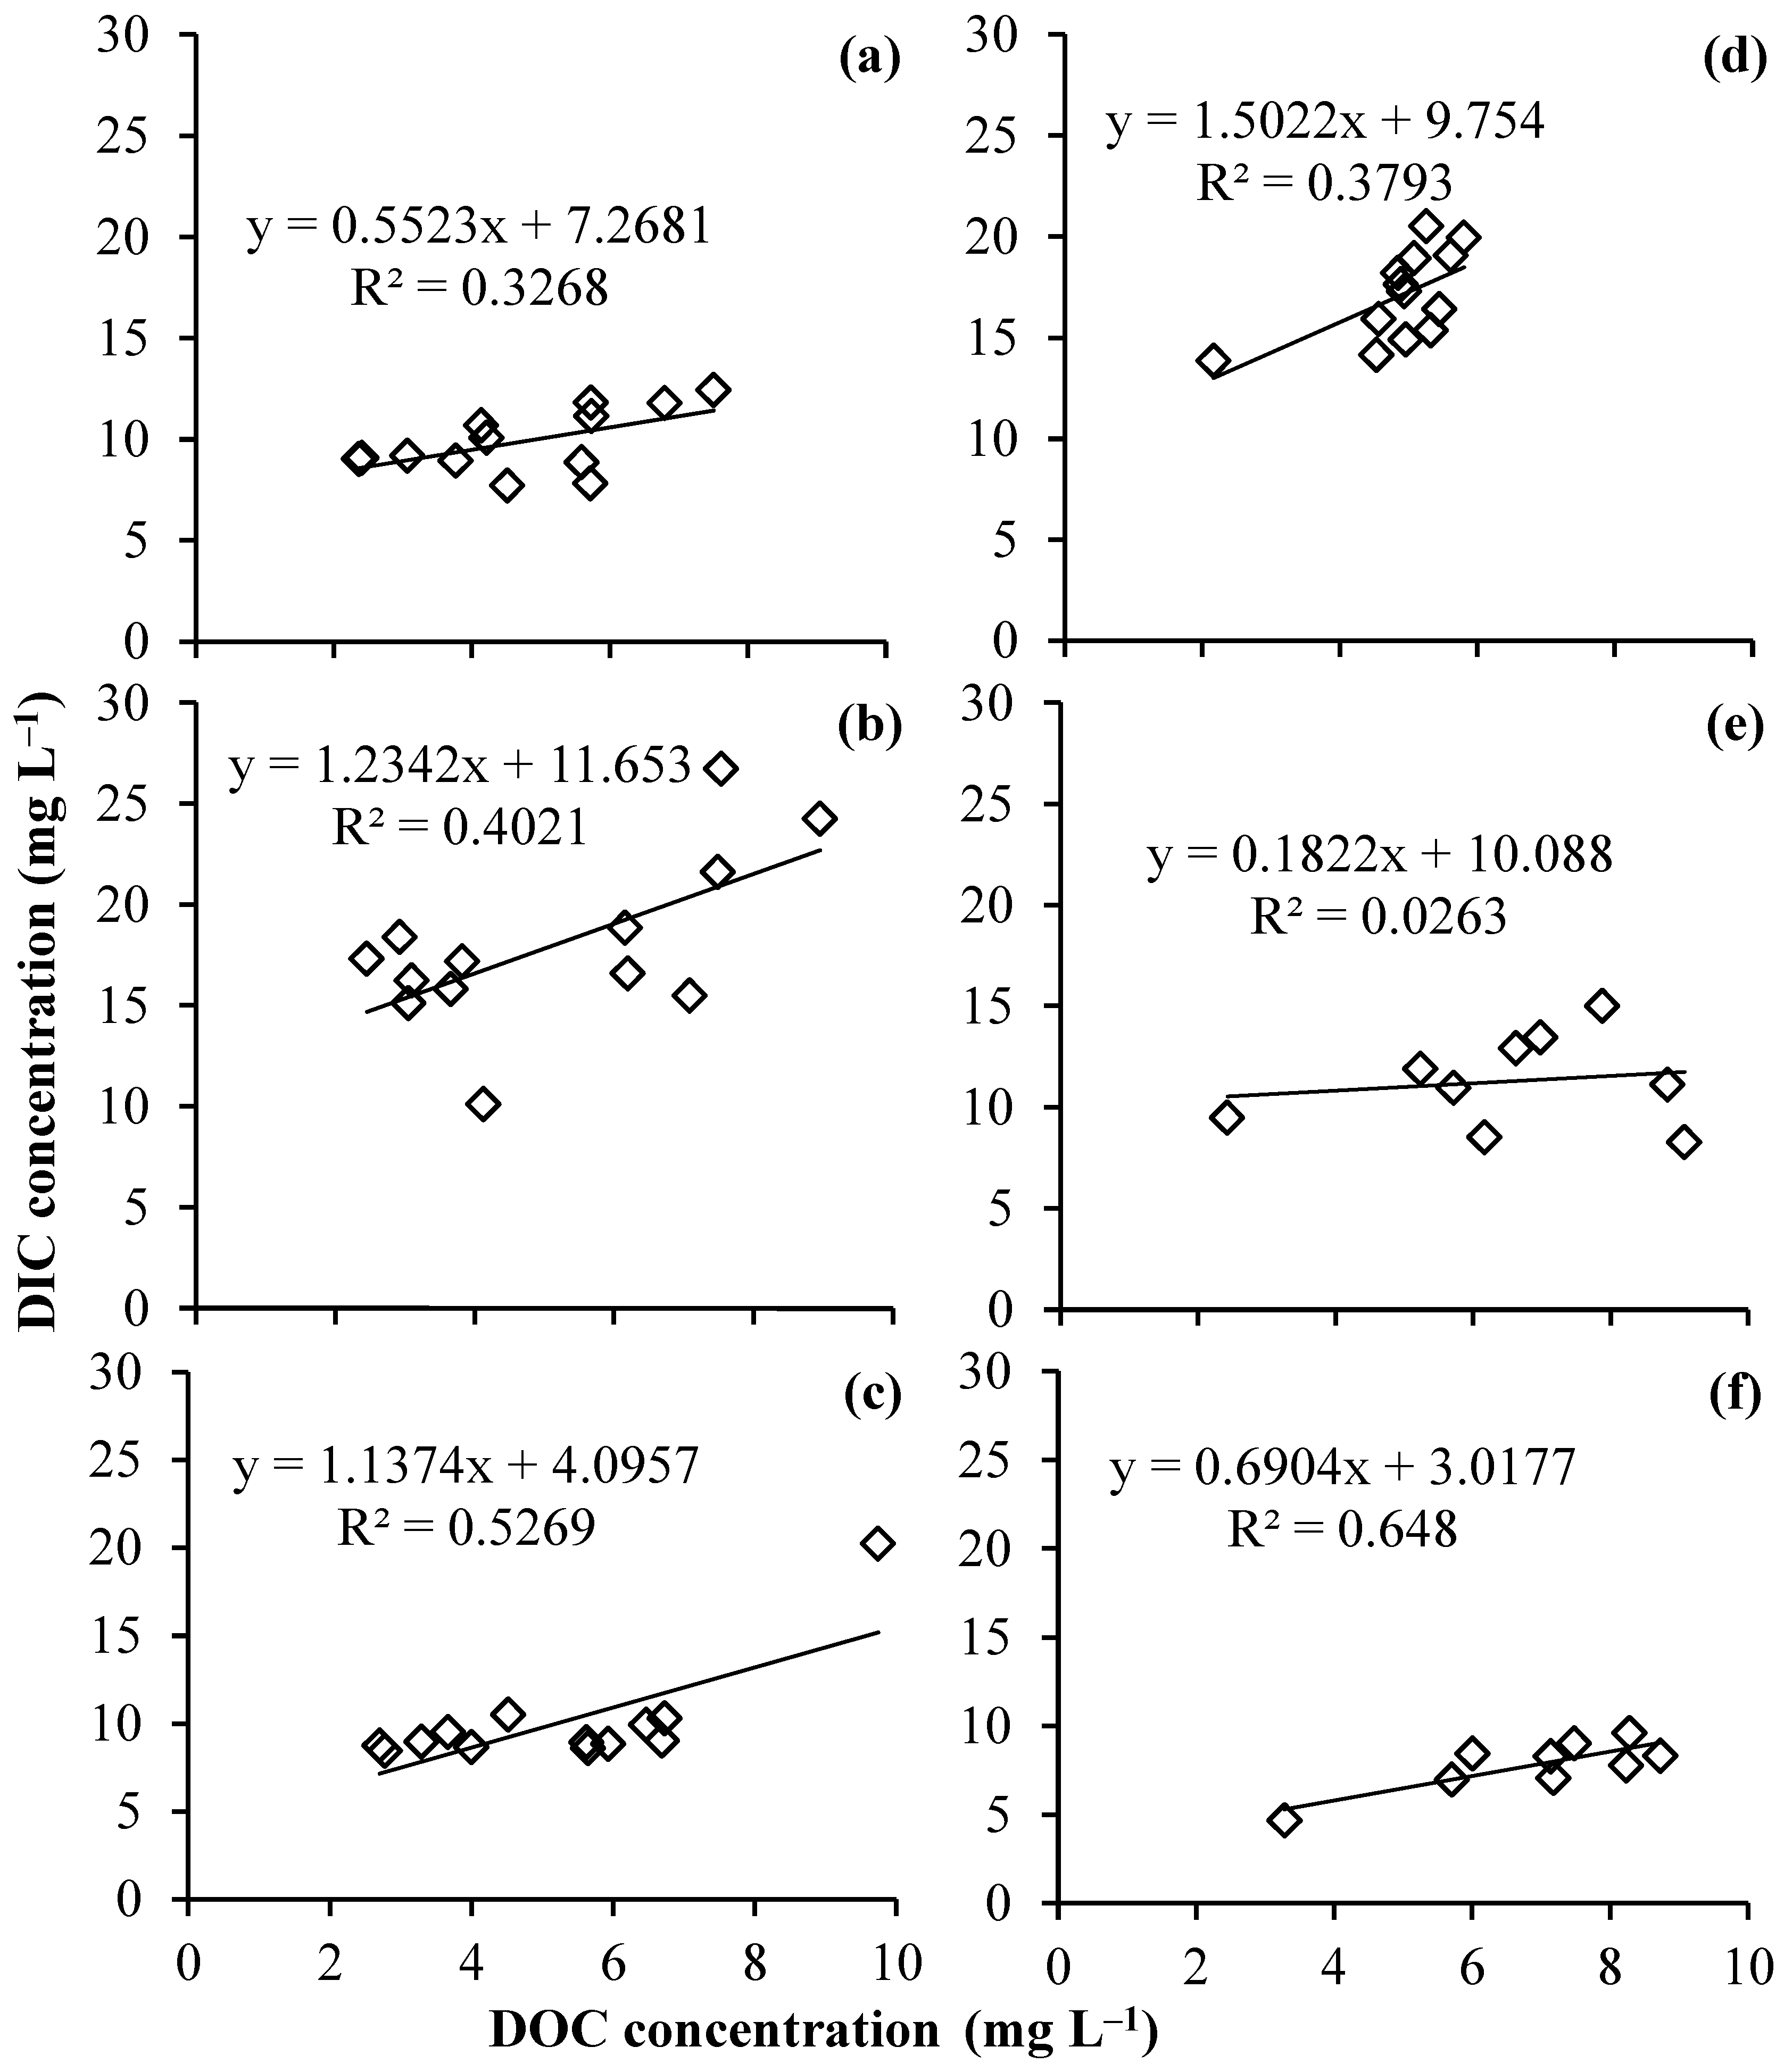
When the DIC concentration was linearly fitted with the DOC concentration, the DIC concentration was significantly correlated with the DOC concentration in the Desheng stream during the four seasons (p < 0.05, n = 13) (Figure 5a–d), indicating they might have similar origins such as parent matter, precipitation, and/or biological processes. In the Shuangqiao-Shiba stream, however, the DIC concentration was not significantly correlated with the DOC concentration in the spring (p > 0.05, n = 9) (Figure 5e), but the correlation was significant in the autumn (p < 0.05, n = 9) (Figure 5f). Accordingly, the correlation between the DOC and DIC concentrations was slightly different between both streams.
3.3. Greenhouse Gases Concentrations
The CH4, CO2, and N2O concentrations showed almost no significant differences between the spring and autumn seasons in the Desheng stream (Table 2). The CH4 concentration in the subsurface water was approximately 37 and 11 μL L−1 in the Desheng and Shuangqiao-Shiba streams, respectively. The CH4 concentration was remarkably higher than its atmospheric concentration, and thereby CH4 had potential emissions from the streams. However, the N2O and CO2 concentrations were low, close to their atmospheric concentrations, indicating they had no potential emissions by infiltration from the streams.
4. Discussion
4.1. Seasonal and Spatial Variability in Dissolved Carbon
The mean DOC concentration was 5.4 and 6.7 mg L−1 in the Desheng and Shuangqiao-Shiba streams during the investigated period of about 1 year, respectively (Table 2). The concentration was much higher than those in the other tributary rivers of the Yangtze River basin. For instance, the mean DOC concentration was 0.82 and 0.33 mg L−1 in small rivers of Yeniugou and Hulugou in the upper Yangtze River basin during the period from August 2015 to September 2018, respectively [20]. The mean DOC concentration was summarized at 1.88 mg L−1 in the rivers of the Yangtze River basin [21]. However, our DOC concentration was much lower than those in the lakes of the Tibetan plateau [22], where the overall mean DOC concentration was 23.9 mg L−1.
The mean DIC concentration was 14.0 and 9.6 mg L−1 in the Desheng and Shuangqiao-Shiba streams, respectively (Table 2). The concentration was obviously lower than the mean DIC concentration in the upper Yangtze River basin [20], where the concentration was 18.7 and 18.0 mg L−1 in the Yeniugou and Hulugou rivers, respectively. Accordingly, our DIC concentration was located in the middle-lower section of the range summarized from data reported. In this study, the DIC concentration was almost always higher than the DOC concentration (Figure 3 and Figure 4). It was consistent with the result reported by [20], where the DIC concentration was much higher than the DOC concentration in the Yeniugou and Hulugou rivers. Most of our DOC and DIC concentrations were positively correlated with each other (Figure 5), whereas the DOC and DIC concentrations reported by Gao et al. [20] were not correlated with each other. DIC is mainly derived from carbonate and/or silicate dissolution by carbonic acid, and thereby most riverine DIC is present in the forms of bicarbonate ions (HCO3−) and carbonate ions (CO32−) or is converted into CO2 dissolved in water. Riverine DIC concentrations are reduced mainly by CO2 outgassing, biological photosynthesis, and bicarbonate/carbonate reactions, and thereby pH is an important factor in determining riverine DIC concentrations. In this study, a pH of more than 7 indicated an alkaline condition in the Desheng and Shuangqiao-Shiba streams (Table 1). The remarkable DIC concentration was partly derived from the alkaline conditions in the streams.
The DOC and DIC concentrations showed seasonal trends in the Desheng and Shuangqiao-Shiba streams, generally with higher values in the summer and autumn than in the spring and winter (Table 2; Figure 3 and Figure 4). This was consistent with those in other streams. For instance, the DOC and DIC concentrations generally followed seasonal trends, where the DOC concentration increased from spring through to winter but the DIC concentration decreased from spring through to winter [4]. The DOC concentration of 11.0 mg L−1 in the summer was obviously higher than the concentration of 8.4 mg L−1 in the winter in the final effluent from the rivers of the United Kingdom [23]. The seasonality of DOC and DIC is closely associated with temperature, since temperature drives the seasonality of dissolved carbon production and processes. One field investigation indicated a positive correlation between the DOC concentration and temperature within peatlands and forested catchments [10]. The rising temperature may approximately explain the 10–20% increase in the DOC concentration in peatlands [24]. In this study, the temperature largely changed throughout the seasons (Table 2), and therefore the higher DOC production under the rising temperature may explain the higher DOC concentration in the summer and autumn than in the spring and winter.
Obviously, temperature is unlikely to be the sole factor driving the dynamics of dissolved carbon. Dilution effects may be used for partly explaining the decreasing trends of the DOC and DIC concentrations from source through to export in the Desheng and Shuangqiao-Shiba streams (Figure 3 and Figure 4). In situ aquatic processes such as photodegradation, microbial remineralization, and sediment sorption can exert a weaker control over dissolved carbon pools in larger riverine systems because of the longer residence time in larger rivers when compared with smaller streams. The dry season often increases the water residence time and causes in situ processes to take effect and transform dissolved carbon. The water residence time was shorter in the rainfall season than during the no-flooding months in the Desheng and Shuangqiao-Shiba streams. This could partly explain why the DIC concentration was significantly higher in the summer than in the other seasons in the Desheng stream. This also affected the spatial distribution of the DOC and DIC concentrations in both streams. To our knowledge, hydrology plays an important role in the spatial distribution of dissolved carbon in riverine system. A relatively low DOC concentration in the downstream sections of rivers is in part due to a dilution effect, in addition to photo- and bio-degradation during transit through the upper and middle stream [25].
In general, dissolved carbon in riverine systems is primarily from the surrounding landscapes [9,22]. Rainfall events flush dissolved carbon from the surrounding uplands into low-lying waters [26]. The leaching of DOC and DIC from soils into riverine system represents a remarkable flux in the terrestrial carbon budget on regional and global scales [27]. Globally, about 15% of net productivity in terrestrial ecosystems is exported to aquatic systems mainly as leached DOC and DIC and eroded POC [27]. This could be used to partly explain the higher DIC concentration in the flooding summer relative to those in the other seasons in the Desheng stream. Soil DOC is derived from litter leachates, root exudates, and microbial degradation products, variations of which are primarily controlled by soil texture, moisture, and total organic carbon [28]. The global DOC concentration is, on average, summarized at 7.2 mg L−1 for all sampling events from 2006 to 2009 [29]. Our mean DOC concentration was lower than the global mean value, presumably due to the lack of measurements in the surrounding cropland soils. How the surrounding croplands affect dissolved carbon in the Desheng and Shuangqiao-Shiba streams will require further research.
The mean atmospheric concentrations of CH4, N2O, and CO2 were 1.803, 0.324, and 391 μL L−1 on the global scale in 2011 [30]. The CH4, N2O, and CO2 concentrations in the subsurface water were 20.5, 2.4, and 1.6 times that of their atmospheric concentrations in the Desheng stream and 6.0, 2.1, and 1.0 times that in the Shuangqiao-Shiba stream, respectively (Table 2). Anaerobic conditions, which prevail in water, tend to favor the production of CH4 as a metabolic end product. CH4 might be produced in the beds of the streams, transported by infiltration, and then be emitted into the atmosphere. In this study, the gradient of CH4 concentration between the subsurface water and the atmosphere was much higher than those of N2O and CO2, indicating that CH4 might have potential emissions from the streams. However, the gradient of CH4 concentration was much lower than those in wetlands and tree stems [31,32], where a substantial CH4 gradient between two systems is a premise for detectable CH4 emissions into the atmosphere. Accordingly, CH4 emissions between the subsurface water and the atmosphere should be negligible in the Desheng and Shuangqiao-Shiba streams. This was consistent with previous studies, where the small contribution of CH4 to the total carbon loss is generally lower than 1% in riverine system [4,5,33]. The CO2 and N2O concentrations were close to their atmospheric concentrations, indicating they had no emissions by infiltration in the Desheng and Shuangqiao-Shiba streams.
4.2. Effects of Anthropogenic Activity on Dissolved Carbon
In general, water gates and flood levees are prominent landscape features of artificially modified rivers in farming regions, whereas neither a water gate nor a flood levee appears in natural rivers in nomadic regions (Figure S1). Water gates and flood levees are widely present in the Desheng and Shuangqiao-Shiba streams. Small wetlands have developed along the outside perimeters of the streams where soil was removed for constructing flood levees. Areas outside the streams have been generally reclaimed for croplands. The seasonal distribution of DOC concentration was weaker in the artificially modified Desheng and Shuangqiao-Shiba streams (Table 2) than in natural streams [20,21,22]. The DOC and DIC concentrations showed remarkable differences between artificially modified and natural rivers in the Yangtze River basin [this study; [20,21,22]. All these differences may be explained by a comprehensive result of multiple variables, of which water gates and flood levees should have a remarkable effect. The detailed effects of water gates and flood levees on dissolved carbon in riverine systems of farming regions require further research.
In this study, physical-chemical factors generally had higher concentrations in sewage outlets than in the other habitats (Table 1), indicating that the streams were more or less polluted. Sewage discharge is a source of dissolved carbon to artificially modified riverine systems. In general, riverine areas receiving sewage discharge have higher DOC and DIC concentrations than those without sewage influence. Higher DOC and DIC concentrations were distributed in the sampling sites close to sewage outlets than in the other sites (Figure 3 and Figure 4). Specifically, sewage discharge was visible in the S2 and S3 in the southern Huanfeng town in the Desheng stream, where DOC and DIC concentrations were usually higher relative to the other sampling sites. Sewage discharge was partly controlled for de-creasing pollution in the sampling S10 and S11 in the southern Liyang town in the Desheng stream, whereas sewage discharge was visible in the S5 in the northern Li-yang town in the Shuangqiao-Shiba stream (Figure 1a). These can be used to partly explain why the DOC and DIC concentrations were not significantly higher in the sampling sites S10 and S11 than in the nearby sampling sites of the Desheng stream (Figure 3), whereas the concentrations were significantly higher in the S5 site of the Shuangqiao-Shiba stream than in the nearby sampling sites (Figure 4). In addition, the pH of more than 7 (Table 1 and Table 2) also indicated sewage discharge into the Desheng and Shuangqiao-Shiba streams. Riverine areas receiving sewage discharge generate higher fluxes of greenhouse gases to the atmosphere than those without sewage influences, such as those in naturally used land [34,35]. Furthermore, rising nutrient concentrations due to sewage discharge might promote phytoplankton photosynthesis, which might change the DOC and DIC pool in riverine systems.
DOC contains a diverse array of compounds, a complex viewed as the sum of thousands of individual organic compounds. The complexity of DOC compositions and reactions in the influence of sewage discharge indicate that DOC is associated with human health. A substantial DOC concentration might indicate a potential hazard to human health when people drink the water. For instance, a rising DOC concentration in many upland catchments of the United Kingdom represents a challenge for drinking water quality, in particular due to the role of DOC as a precursor in the formation of trihalomethanes [9]. Measured DOC concentrations from natural/unpolluted groundwater are typically below 4 mg L−1, above which anthropogenic influence and/or contamination issues might occur [36]. In nature, organic matter originates from plant, microbial, and animal products both in the forms of metabolized products and their decomposing products. Alternatively, it may be produced in waters from aquatic plants, plankton, and higher organisms. The influence of dissolved organic matter on contaminants and its effects on pathogenic microorganisms are helpful for understanding the DOC and DIC processes and fluxes in riverine systems. In future, we would like to compare the dissolved carbon between natural and artificially modified rivers.
Supplementary Materials
The following supporting information can be downloaded at: https://www.mdpi.com/article/10.3390/w14244057/s1, Figure S1: Modified and natural streams are mainly distributedin southeastern farming and northwestern nomadic regions of China, respectively. Water gate and flood leveeare prominent landscapes in artificially modifiedstreams, while neither water gate nor flood levee in natural streams. Red dotted line is an assumed population dividing linebetween the farming and nomadic regions (Hu 1935). Table S1: Detailed coordinates and altitudes of the sampling sites.
Author Contributions
Conceptualization, Z.-P.W., S.-J.H. and X.-G.H.; methodology, Z.-P.W. and X.-M.Z.; formal analysis, J.-F.C. and X.-M.Z.; investigation, J.-F.C. and Z.-P.W.; data curation, J.-F.C.; writing—original draft preparation, Z.-P.W.; writing—review and editing, Z.-P.W. and J.-F.C.; funding acquisition, S.-J.H., X.-M.Z. and Z.-P.W. All authors have read and agreed to the published version of the manuscript.
Funding
This work was jointly funded by the National Natural Science Foundation of China (41930643), the Top-Notch Young Talents Program of China (to Ximei Zhang), and the National Key Research and Development Program of China (2016YFA0600803).
Data Availability Statement
Data are available when required.
Conflicts of Interest
The authors declare no conflict of interest.
References
- Sawicka, K.; Monteith, D.T.; Vanguelova, E.I.; Wade, A.J.; Clark, J.M. Fine-scale temporal characterization of trends in soil water organic carbon and potential drivers. Ecol. Indic. 2016, 68, 36–51. [Google Scholar] [CrossRef] [Green Version]
- Cole, J.; Prairie, Y.; Caraco, N.; McDowell, W.; Tranvik, L.; Striegl, R.; Duarte, C.; Kortelainen, P.; Downing, J.; Middelburg, J.; et al. Plumbing the global carbon cycle: Integrating inland waters into the terrestrial carbon budget. Ecosystems 2007, 10, 172–185. [Google Scholar] [CrossRef] [Green Version]
- Wallin, M.B.; Grabs, T.; Buffam, I.; Laudon, H.; Agren, A.; Oquist, M.G.; Bishop, K. Evasion of CO2 from streams—The dominant component of the carbon export through the aquatic conduit in a boreal landscape. Glob. Chang. Biol. 2013, 19, 785–797. [Google Scholar] [CrossRef] [PubMed]
- Atkins, M.L.; Santos, I.R.; Maher, D.T. Seasonal exports and drivers of dissolved inorganic and organic carbon, carbon dioxide, methane and δ13C signatures in a subtropical river network. Sci. Total Environ. 2017, 575, 545–563. [Google Scholar] [CrossRef]
- Stanley, E.H.; Casson, N.J.; Christel, S.T.; Crawford, J.T.; Loken, L.C.; Oliver, S.K. The ecology of methane in streams and rivers: Patterns, controls, and global significance. Ecol. Monogr. 2016, 86, 146–171. [Google Scholar] [CrossRef]
- Santos, I.R.; Beck, M.; Brumsack, H.J.; Maher, D.T.; Dittmar, T.; Waska, H.; Schnetger, B. Porewater exchange as a driver of carbon dynamics across a terrestrial-marine transect: Insights from coupled 222Rn and pCO2 observations in the German Wadden Sea. Mar. Chem. 2015, 171, 10–20. [Google Scholar] [CrossRef]
- Huntington, T.G.; Aiken, G.R. Export of dissolved organic carbon from the Penobscot River basin in north-central Maine. J. Hydrol. 2013, 476, 244–256. [Google Scholar] [CrossRef]
- Heinz, M.; Zak, D. Storage effects on quantity and composition of dissolved organic carbon and nitrogen of lake water, leaf leachate and peat soil water. Water Res. 2018, 130, 98–104. [Google Scholar] [CrossRef] [Green Version]
- Brooks, E.; Freeman, C.; Gough, R.; Holliman, P.J. Tracing dissolved organic carbon and trihalomethane formation potential between source water and finished drinking water at a lowland and an upland UK catchment. Sci. Total Environ. 2015, 537, 203–212. [Google Scholar] [CrossRef]
- Preston, M.D.; Eimers, M.C.; Watmough, S.A. Effect of moisture and temperature variation on DOC release from a peatland: Conflicting results from laboratory, field and historical data analysis. Sci. Total Environ. 2011, 409, 1235–1242. [Google Scholar] [CrossRef]
- Obernosterer, I.; Benner, R. Competition between biological and photochemical processes in the mineralisation of dissolved organic carbon. Limnol. Oceanogr. 2004, 49, 117–124. [Google Scholar] [CrossRef]
- Hu, H.Y. The distribution of population in China, with statistics and maps. Acta Geogr. Sin. 1935, 2, 33–74, (In Chinese with English abstract). [Google Scholar]
- Jia, S.W. Carbon storage distribution and its dynamic changes of forest vegetation in Yangtze River basin based on continuous forest resources inventory. J. Ecol. Rural. Environ. 2018, 34, 997–1002. (In Chinese) [Google Scholar]
- Wang, X.; Ma, H.; Li, R.; Song, Z.; Wu, J. Seasonal fluxes and source variation of organic carbon transported by two major Chinese rivers: The Yellow River and Changjiang (Yangtze) River. Glob. Biogeochem. Cycles 2012, 26, GB2025. [Google Scholar] [CrossRef]
- Wu, Y.Y.; Fang, H.W.; Huang, L.; Cui, Z.H. Particulate organic carbon dynamics with sediment transport in the upper Yangtze River. Water Res. 2020, 184, 116193. [Google Scholar] [CrossRef]
- Zhang, L.; Xue, M.; Wang, M.; Cai, W.; Wang, L.; Yu, Z. The spatiotemporal distribution of dissolved inorganic and organic carbon in the main stem of the Changjiang (Yangtze) River and the effect of the Three Gorges Reservoir. J. Geophys. Res. Biogeosci. 2014, 119, 741–757. [Google Scholar] [CrossRef]
- Perdue, E.M. Natural organic matter. In Encyclopedia of Inland Waters; Likens, G.E., Ed.; Academic Press: San Diego, CA, USA, 2009; pp. 806–819. [Google Scholar]
- Xie, X.Q.; Wang, L.J. Measurement and Analysis on Hydro-Environment Factors; China Standard Press: Beijing, China, 1998. (In Chinese) [Google Scholar]
- Wang, Z.P.; Zhang, L.; Wang, B.; Hou, L.Y.; Xiao, C.W.; Zhang, X.M.; Han, X.G. Dissolved methane in groundwater of domestic wells and its potential emissions in arid and semi-arid regions of Inner Mongolia, China. Sci. Total Environ. 2018, 626, 1193–1199. [Google Scholar] [CrossRef]
- Gao, T.G.; Kang, S.C.; Chen, R.S.; Zhang, T.G.; Zhang, T.J.; Han, C.T.; Tripathee, L.; Sillanpää, M.; Zhang, Y.L. Riverine dissolved organic carbon and its optical properties in a permafrost region of the Upper Heihe River basin in the Northern Tibetan Plateau. Sci. Total Environ. 2019, 686, 370–381. [Google Scholar] [CrossRef]
- Qu, B.; Sillanpaa, M.; Li, C.; Kang, S.; Stubbins, A.; Yan, F.; Aho, K.S.; Zhou, F.; Raymond, P.A. Aged dissolved organic carbon exported from rivers of the Tibetan Plateau. PLoS ONE 2017, 12, e0178166. [Google Scholar] [CrossRef] [Green Version]
- Wen, Z.D.; Song, K.S.; Liu, G.; Shang, Y.X.; Hou, J.B.; Lyu, L.; Fang, C. Impact factors of dissolved organic carbon and the transport in a river-lake continuum in the Tibet Plateau of China. J. Hydrol. 2019, 579, 124202. [Google Scholar] [CrossRef]
- Worrall, F.; Howden, N.J.K.; Burt, T.P.; Bartlett, R. The importance of sewage effluent discharge in the export of dissolved organic carbon from UK. rivers. Hydrol. Process. 2019, 33, 1851–1864. [Google Scholar]
- Freeman, C.; Fenner, N.; Ostle, N.J.; Kang, H.; Dowrick, D.J.; Reynolds, B.; Lock, M.A.; Sleep, D.; Hughes, S.; Hudson, J. Export of dissolved organic carbon from peatlands under elevated carbon dioxide levels. Nature 2004, 430, 195–198. [Google Scholar] [CrossRef] [PubMed]
- Ilina, S.M.; Drozdova, O.Y.; Lapitskiy, S.A.; Alekhin, Y.V.; Demin, V.V.; Zavgorodnyaya, Y.A.; Shirokova, L.S.; Viers, J.; Pokrovsky, O.S. Size fractionation and optical properties of dissolved organicmatter in the continuumsoil solution-bog-river and terminal lake of a boreal watershed. Org. Geochem. 2014, 66, 14–24. [Google Scholar] [CrossRef]
- Moyer, R.P.; Powell, C.E.; Gordon, D.J.; Long, J.S.; Bliss, C.M. Abundance, distribution, and fluxes of dissolved organic carbon (DOC) in four small sub-tropical rivers of the Tampa Bay Estuary (Florida, USA). Appl. Geochem. 2015, 63, 550–562. [Google Scholar] [CrossRef]
- Nakhavali, M.; Lauerwald, R.; Regnier, P.; Guenet, B.; Chadburn, S.; Friedlingstein, P. Leaching of dissolved organic carbon from mineral soils plays a significant role in the terrestrial carbon balance. Glob. Change Biol. 2021, 27, 1083–1096. [Google Scholar] [CrossRef]
- Guo, Z.Y.; Wang, Y.H.; Wan, Z.M.; Zuo, Y.J.; He, L.Y.; Li, D.; Yuan, F.H.; Wang, N.N.; Liu, J.Z.; Song, Y.Y.; et al. Soil dissolved organic carbon in terrestrial ecosystems: Global budget, spatial distribution and controls. Glob. Ecol. Biogeogr. 2020, 29, 2159–2175. [Google Scholar] [CrossRef]
- Cool, G.; Lebel, A.; Sadiq, R.; Rodriguez, M.J. Impact of catchment geophysical characteristics and climate on the regional variability of dissolved organic carbon (DOC) in surface water. Sci. Total Environ. 2014, 490, 947–956. [Google Scholar] [CrossRef]
- IPCC. Summary for Policymakers. In Climate Change 2013, the Physical Science Basis. Contribution of Working Group I to the Fifth Assessment Report of the Intergovernmental Panel on Climate Change; Stocker, T.F., Qin, D., Plattner, G.K., Tignor, M., Allen, S.K., Boschung, J., Nauels, A., Xia, Y., Bex, V., Midgley, P.M., Eds.; Cambridge University Press: Cambridge, UK, 2013. [Google Scholar]
- Wang, Z.P.; Han, X.G.; Li, L.H.; Chen, Q.S.; Duan, Y.; Cheng, W.X. Methane emission from small wetlands and implications for semiarid region budgets. J. Geophys. Res. 2005, 110, D13304. [Google Scholar] [CrossRef] [Green Version]
- Wang, Z.P.; Li, H.L.; Wu, H.H.; Han, S.J.; Huang, J.H.; Zhang, X.M.; Han, X.G. Methane concentration in the heartwood of living trees and estimated methane emission on stems in upland forests. Ecosystems 2021, 24, 1485–1499. [Google Scholar] [CrossRef]
- Striegl, R.G.; Dornblaser, M.M.; McDonald, C.P.; Rover, J.R.; Stets, E.G. Carbon dioxide and methane emissions from the Yukon River system. Glob. Biogeochem. Cycles 2012, 26, GB0E05. [Google Scholar] [CrossRef]
- Aitkenhead-Peterson, J.A.; Steele, M.K. Dissolved organic carbon and dissolved organic nitrogen concentrations and exports upstream and downstream of the Dallas—Fort Worth metropolis, Texas, USA. Mar. Freshw. Res. 2016, 67, 1326–1337. [Google Scholar] [CrossRef]
- Wang, X.F.; He, Y.X.; Yuan, X.Z.; Chen, H.; Peng, C.H.; Yue, J.S.; Liu, S.S. Greenhouse gases concentrations and fluxes from subtropical small reservoirs in relation with watershed urbanization. Atmos. Environ. 2017, 154, 225–235. [Google Scholar] [CrossRef]
- Regan, S.; Hynds, P.; Flynn, R. An overview of dissolved organic carbon in groundwater and implications for drinking water safety. Hydrogeol. J. 2017, 25, 959–967. [Google Scholar] [CrossRef]
Figure 1.
Field investigation and water sampling were conducted in the tributary streams of the lower Yangtze River basin. Triangles indicate sampling sites in the Desheng and Shuangqiao-Shiba streams, where water flows from west to east and further into the lower Yangtze River (a). The lower Yangtze River basin (b). Sampling sites were sequenced from west to east (i.e., from site S1 to S13 in the Desheng stream and from S1 to S9 in the Shuangqiao-Shiba stream). Detailed coordinates and altitudes of the sampling sites can be found in Table S1.

Figure 2.
Changes in pH, temperature, and dissolved carbon and nitrogen (DOC, DIC, and DN) across the transect of the Desheng stream. Sampling locations at the sampling site 5 (see Table S1) were successively the south shore (south 1), south 2, center, north 2, and north shore (north 1). Water was sampled in the middle of October 2019. Values are displayed as mean ± SD (n = 3). The means with the same upper- or lower-case letters identify no significant differences (p > 0.05) among five sampling locations, which was analyzed using Duncan’s multiple range test.

Figure 3.
Spatial variations in DOC and DIC in the Desheng stream. Sampling was conducted in the spring (a), summer (b), autumn (c), and winter (d), respectively. Sampling sites were sequenced in the X-axis from mouth (S1, i.e., Site 1) to export (S13) of the stream; the S1–4, S5–9, and S10–13 sites were located in the upper, middle, and lower sections of the stream. The S2 and S3 sites were located near the town of Huanfeng, while the S10 and S11 sites were near the town of Liyang. Dotted lines indicate spatial change trends. Values in each sampling site are displayed as mean ± SD (n = 3 replicates). The different letters indicate statistically significant differences (p < 0.05) among the sampling sites, which was analyzed using Duncan’s multiple range test.

Figure 4.
Spatial variations in DOC and DIC in the Shuangqiao-Shiba stream. Sampling was conducted in the spring (a) and autumn (b), respectively. Sampling sites were sequenced in the X-axis from mouth (S1, i.e., Site 1) to export (S9) of the stream; the S1–3, S4–6, and S7–9 sites were located in the upper, middle, and lower sections of the stream. The S5 site was located close to the town of Liyang. Dotted lines indicate spatial change trends. Values are displayed as mean ± SD (n = 3). The different letters indicate statistically significant differences (p < 0.05) among the sampling sites, which was analyzed using Duncan’s multiple range test.

Figure 5.
DIC concentrations in relation to DOC concentrations in the spring (a), summer (b), autumn (c), and winter (d) in the Desheng stream (n = 13 sites) and in the spring (e) and autumn (f) in the Shuangqiao-Shiba stream (n = 9 sites), respectively. The Y-axes labels are the same for the left and right columns.


Table 1.
Physical-chemical characteristics in the Desheng and Shuangqiao-Shiba streams and their surrounding ponds.
Table 1.
Physical-chemical characteristics in the Desheng and Shuangqiao-Shiba streams and their surrounding ponds.
| Stream | Sampling Habitat | pH | Temperature | TOC | TN | NO3−-N | NH4+-N | Ca2+ | SO42− | Cl− |
|---|---|---|---|---|---|---|---|---|---|---|
| (°C) | (mg L−1) | (mg L−1) | (mg L−1) | (mg L−1) | (mg L−1) | (mg L−1) | (mg L−1) | |||
| Desheng | Normal area | 7.7 (0.3) A | 10.9 (0.2) A | 14.7 (0.6) A | 1.65 (0.10) B | 1.50 (0.08) B | 0.47 (0.01) A | 19.0 (2.7) A | 28.8 (16.4) C | 23.4 (7.7) C |
| Sewage outlet | 7.8 (0.3) A | 10.8 (0.2) A | 15.1 (3.5) A | 2.55 (0.31) A | 2.20 (0.12) A | 0.33 (0.01) B | 19.2 (1.8) A | 59.6 (15.7) A | 60.3 (24.7) A | |
| Surrounding pond | 7.9 (0.2) A | 10.4 (0.4) A | 4.9 (0.3) B | 0.61 (0.15) C | 0.20 (0.13) C | 0.25 (0.09) B | 26.4 (8.3) A | 50.3 (46.2) AB | 49.6 (9.5) B | |
| Shuangqiao | Normal area | 8.2 (0.2) a | 10.4 (0.1) a | 34.9 (7.6) a | 0.55 (0.09) a | 0.21 (0.06) a | 0.17 (0.01) ab | 27.4 (2.3) a | 66.8 (26.2) ab | 67.6 (18.7) a |
| -Shiba | Sewage outlet | 7.9 (0.4) a | 10.9 (0.4) a | 36.0 (5.6) a | 0.60 (0.07) a | 0.20 (0.04) a | 0.22 (0.01) a | 25.5 (0.9) a | 75.7 (12.7) a | 71.1 (10.0) a |
| Surrounding pond | 7.8 (0.2) a | 10.4 (0.3) a | 4.4 (1.5) b | 0.54 (0.06) a | 0.14 (0.10) a | 0.13 (0.05) b | 18.7 (3.6) b | 15.9 (2.1) c | 20.8 (8.9) b |
Note(s): For the measurements of background physical-chemical characteristics, water samples were not filtered through 0.45 μm nylon syringe filter. Value is mean (standard deviation) of three replicates (n = 3). Abbreviations are used for total organic carbon (TOC) and total nitrogen (TN). The different upper and lower letters indicate statistically significant differences (p < 0.05) among three habitats in the Desheng and Shuangqiao-Shiba streams, respectively, analyzed using Duncan’s multiple range test.
Table 2.
Seasonal variations of dissolved carbon/nitrogen and greenhouse gases in the Desheng and Shuangqiao-Shiba streams.
Table 2.
Seasonal variations of dissolved carbon/nitrogen and greenhouse gases in the Desheng and Shuangqiao-Shiba streams.
| Stream | Sampling Date | Number of | pH | Water | DOC | DIC | DN | CH4 | CO2 | N2O |
|---|---|---|---|---|---|---|---|---|---|---|
| sampling sites (n) | temperature (°C) | (mg L−1) | (mg L−1) | (mg L−1) | (μL L−1) | (μL L−1) | (μL L−1) | |||
| Desheng | October, 2018 | 13 | 8.2 (0.4) AB | 20.2 (1.2) B | 6.9 (1.8) A | 14.8 (2.6) B | 3.1 (1.5) A | |||
| March, 2019 | 13 | 8.5 (0.6) A | 16.1 (0.6) C | 4.7 (1.6) B | 9.9 (1.6) C | 2.7 (1.2) A | 37.6 (73.9) A | 787.4 (205.7) A | 0.35 (0.08) B | |
| August, 2019 | 13 | 7.6 (0.6) CD | 31.5 (1.4) A | 5.1 (2.2) B | 18.0 (4.3) A | 1.1 (0.7) B | ||||
| October, 2019 | 13 | 8.0 (0.6) BC | 20.7 (1.0) B | 5.2 (2.0) B | 10.0 (3.1) C | 2.7 (3.4) A | 36.7 (96.5) A | 1109.6 (987.6) A | 0.70 (0.50) A | |
| January, 2020 | 13 | 7.5 (0.2) D | 6.9 (1.5) D | 4.9 (0.9) B | 17.1 (2.2) A | 3.0 (1.4) A | ||||
| Shuangqiao | March, 2019 | 9 | 8.0 (0.5) a | 16.3 (0.7) b | 6.6 (2.0) a | 11.3 (2.3) a | 1.5 (1.2) a | |||
| -Shiba | October, 2019 | 9 | 7.8 (0.4) a | 20.0 (0.7) a | 6.9 (1.7) a | 7.8 (1.5) b | 0.5 (0.2) b | 10.8 (7.3) | 812.6 (234.8) | 0.34 (0.02) |
Note(s): Water samples were filtered through 0.45 μm nylon syringe filter, and thereby measured carbon and nitrogen were the dissolved organic and inorganic carbon and nitrogen (DOC, DIC, and DN). Value is mean (standard deviation) of all sampling sites; datum in each sampling site is an average of three replicates. The different upper and lower letters indicate statistically significant differences (p < 0.05) among the sampling seasons in the Desheng and Shuangqiao-Shiba streams, respectively, analyzed using Duncan’s multiple range test.
Publisher’s Note: MDPI stays neutral with regard to jurisdictional claims in published maps and institutional affiliations. |
© 2022 by the authors. Licensee MDPI, Basel, Switzerland. This article is an open access article distributed under the terms and conditions of the Creative Commons Attribution (CC BY) license (https://creativecommons.org/licenses/by/4.0/).
Share and Cite
MDPI and ACS Style
Cui, J.-F.; Han, S.-J.; Zhang, X.-M.; Han, X.-G.; Wang, Z.-P. Temporal–Spatial Variability of Dissolved Carbon in the Tributary Streams of the Lower Yangtze River Basin. Water 2022, 14, 4057. https://doi.org/10.3390/w14244057
AMA Style
Cui J-F, Han S-J, Zhang X-M, Han X-G, Wang Z-P. Temporal–Spatial Variability of Dissolved Carbon in the Tributary Streams of the Lower Yangtze River Basin. Water. 2022; 14(24):4057. https://doi.org/10.3390/w14244057
Chicago/Turabian StyleCui, Ji-Fa, Shi-Jie Han, Xi-Mei Zhang, Xing-Guo Han, and Zhi-Ping Wang. 2022. "Temporal–Spatial Variability of Dissolved Carbon in the Tributary Streams of the Lower Yangtze River Basin" Water 14, no. 24: 4057. https://doi.org/10.3390/w14244057
Note that from the first issue of 2016, this journal uses article numbers instead of page numbers. See further details here.