
Groundwater Vulnerability Indicator Assessment of Karst Island Water Resources: Enhancement of the Freshwater Lens Assessment Protocol

1
National Institute of Geological Sciences, Diliman Campus, University of the Philippines, Diliman 1101, Philippines
2
School of Architecture, Building and Civil Engineering, Water Engineering Development Centre, Loughborough University, Loughborough LE 11 3TU, UK
*
Author to whom correspondence should be addressed.
Water 2022, 14(24), 4071; https://doi.org/10.3390/w14244071
Submission received: 28 October 2022
/
Revised: 7 December 2022
/
Accepted: 9 December 2022
/
Published: 13 December 2022
(This article belongs to the Section Hydrogeology)
Abstract
:Karst islands such as those found in the Philippine Archipelago present challenges for local stakeholders to manage their water resources sustainably. Anthropogenic climate change, an increasing population and changes in land use and industry have all combined to altering the water balance on these islands. The freshwater lens is susceptible to saltwater intrusion through human drivers (such as over-abstraction) and natural processes (including variable precipitation and storm surges). The dynamics of such freshwater lenses involve an interplay between physical, chemical and socio-economical processes; therefore, finding a solution necessitates an interdisciplinary approach and a range of data collection strategies. This approach was formalized in a Freshwater Lens Assessment Protocol (FLAP) and expanded through the application of a Vulnerability Indicator Assessment (VIA). The VIA provides an accessible framework for data integration and an improved knowledge base, from which it is possible to make better decisions and establish effective management programs to protect and maintain this vital resource. The FLAP approach and VIA analysis were developed and tested on Bantayan Island (Cebu Province) in the Philippines. The results of the analysis reveal areas of saltwater intrusion vulnerability located along coastal boundary margins, mapped structural discontinuities and zones of upconing due to over-pumping. We infer that the VIA forms an appropriate, cost-effective interdisciplinary tool that synthesizes data sets through hazard characterization, integrates stakeholder knowledge pertaining to water resource management and operational policy, assesses the risk and assigns a risk designation for groundwater vulnerability to saltwater intrusion.
1. Introduction
Water is a critical natural resource that defines equitable, stable and productive societies and ecosystems. Its importance is recognized by the UN, which identifies water security as one of the 17 Sustainable Development Goals (SDGs) [1]. Although key literature on this topic spans several decades, both international and national efforts to improve water security over the same period have had limited impact, with approximately 3.6 billion people (approximately half the global population) living in areas that are potentially water-scarce for one month each year. It is estimated that this population may increase to 4.8–5.7 billion by 2050 [2].
Mapping by Hong et al. [3] suggests that approximately 20–25 percent of the global population depends largely or entirely on groundwater obtained from karst aquifers. Karst aquifers are characterized by solution-enlarged fractures, bedding planes and hydraulically connected drainage networks [4] that add complexity in assessing their hydrogeologic characteristics. This complexity is further enhanced in small island environments with distinct karst geology, as saltwater affects the morphology and dynamics of their groundwater supply. In such islands, fresh groundwater exists as a convex-shaped body that floats above denser saltwater, typically called freshwater lenses.
The need for this research originated from a recognition of the gaps in the existing literature on the island landform selected, as well as a dearth of research on freshwater lens performance in the Republic of the Philippines. Saltwater intrusion is a global problem for coastal water resources and is worsened by sea level rise, climate change and a growing dependency on groundwater resources for water supply [5].
Responding to the world’s main development challenges, the fundamental understanding of the influence of global climate change on the hydrologic cycle in small oceanic islands has become an important field of concern and research [6]. A key component of achieving a better understanding of water security issues needs to concentrate on the performance and utilization of freshwater lenses that naturally occur under islands worldwide [7,8,9,10,11,12].
Physical processes such as tidal forcing, upconing due to over-abstraction and inundation by storm surges render coastal freshwater lenses vulnerable to salinization [13]. A primary factor of this salinization in the relative position and movement of fresh groundwater and saltwater is the density difference of the two fluids [14]. These conditions pose great challenges for local stakeholders who rely on the resource. Hence, there is a need to fully understand the dynamic processes affecting the composition and quality of freshwater lenses.
However, there is a paucity of means to assess the risks that freshwater lenses are exposed to, which is partly driven by a poor understanding of the root causes of saltwater intrusion [15]. Thus, there is a need for a baseline understanding of the processes that drive saltwater intrusion and the degradation of freshwater lenses to improve water management practices [5]. In small karst islands, greater insight into how a freshwater lens behaves is acquired through the collection of credible, local monitoring data while improving capacity by engaging local stakeholders. However, while the necessary level of national political commitment towards effective water resource management exists in states such as the Philippines, local capacity to proactively address the problem of water scarcity has often been lacking [15].
Conditions that are prevalent in low- to middle-income countries are a major influence on the design of this research. These include field scale conditions, funding constraints, limited technical capacity and strained governance. Real world application, generating translational knowledge and linking science to stakeholders are key criteria of this research. It is how the dissemination of facts takes place that is of importance in effecting change and improving the sustainable management of the freshwater lens, and where possible, hydrogeologists should endeavor to generate and share such knowledge in support of sustainable groundwater resource management [16].
This paper introduces the Vulnerability Indicator Assessment (VIA), an advancement of the Freshwater Lens Assessment Protocol (FLAP) [17], which is a new interdisciplinary approach that can be used for systematic hydrogeologic characterization of a freshwater lens beneath a carbonate island in a low- to middle-income country (LMIC), including its vulnerability to saltwater intrusion. The VIA posits the integration of social data sets with technical data, forming a framework for data management. As such, this research intends to address an important social component that aims to capture water management at the local level, achieved by factoring in water resource policies triangulated against information obtained from three tiers of government in the Republic of the Philippines. The VIA is not a predictive instrument; rather, it is prescriptive in setting out a step-by-step approach to assess the hazard, determine the risk and evaluate the mechanism as either anthropogenic or naturally occurring in the determination of saltwater intrusion.
2. Materials and Methods
2.1. Freshwater Lens Assessment Protocol (FLAP) and the Vulnerability Indicator Assessment (VIA)
Figure 1 illustrates the conceptual approach to research data acquisition of the Freshwater Lens Assessment Protocol [17]. The data sets referenced below are illustrated, and the critical integration of results then leads to a simplified vulnerability indicator assessment and an island-wide observational model for stakeholder use. The findings from the research inform the stakeholder on areas of active saltwater intrusion and the mechanisms causing the contamination [17].
In terms of practical operation of the FLAP, the disciplines identified represent the minimum required for completion of the protocol. However, establishing collaborations with the specific disciplines identified in Table 1 can overcome this requirement. An example from this research was the Memorandum of Agreement (MOA) drawn between Loughborough University and Cebu Technological University (CTU) to support the social science components of the research by providing language translation support services for the semi-structured interviews. In addition, the CTU engagement introduced the research to the University of San Carlos (USC), which provided the DGPS Survey and LiDAR data post-processing support to make up for the lack of GIS specialist skills.
Available freshwater resources in coastal settings and associated ecosystems are vulnerable to saltwater intrusion [65]. Assessing vulnerability in this dynamic aquifer setting demands an analysis specific to freshwater lens behavior [17]. Kura et al. [66] posit that most past research on the DRASTIC model for vulnerability assessment has been applied on a broad and regional scale, rather than small island settings. A principal restriction in the application of this method for small island settings is that the source of contamination is not only from the land surface, but also from the shoreline and from the effects of saltwater intrusion underneath. In an examination of the methods presented, the advantages of nimbleness, exemplified in an approach similar to GALDIT, have been described as an offset through its subjectivity, which limits its theoretical support in translating hydrogeologic attributes into the vulnerability of saltwater intrusion [5].
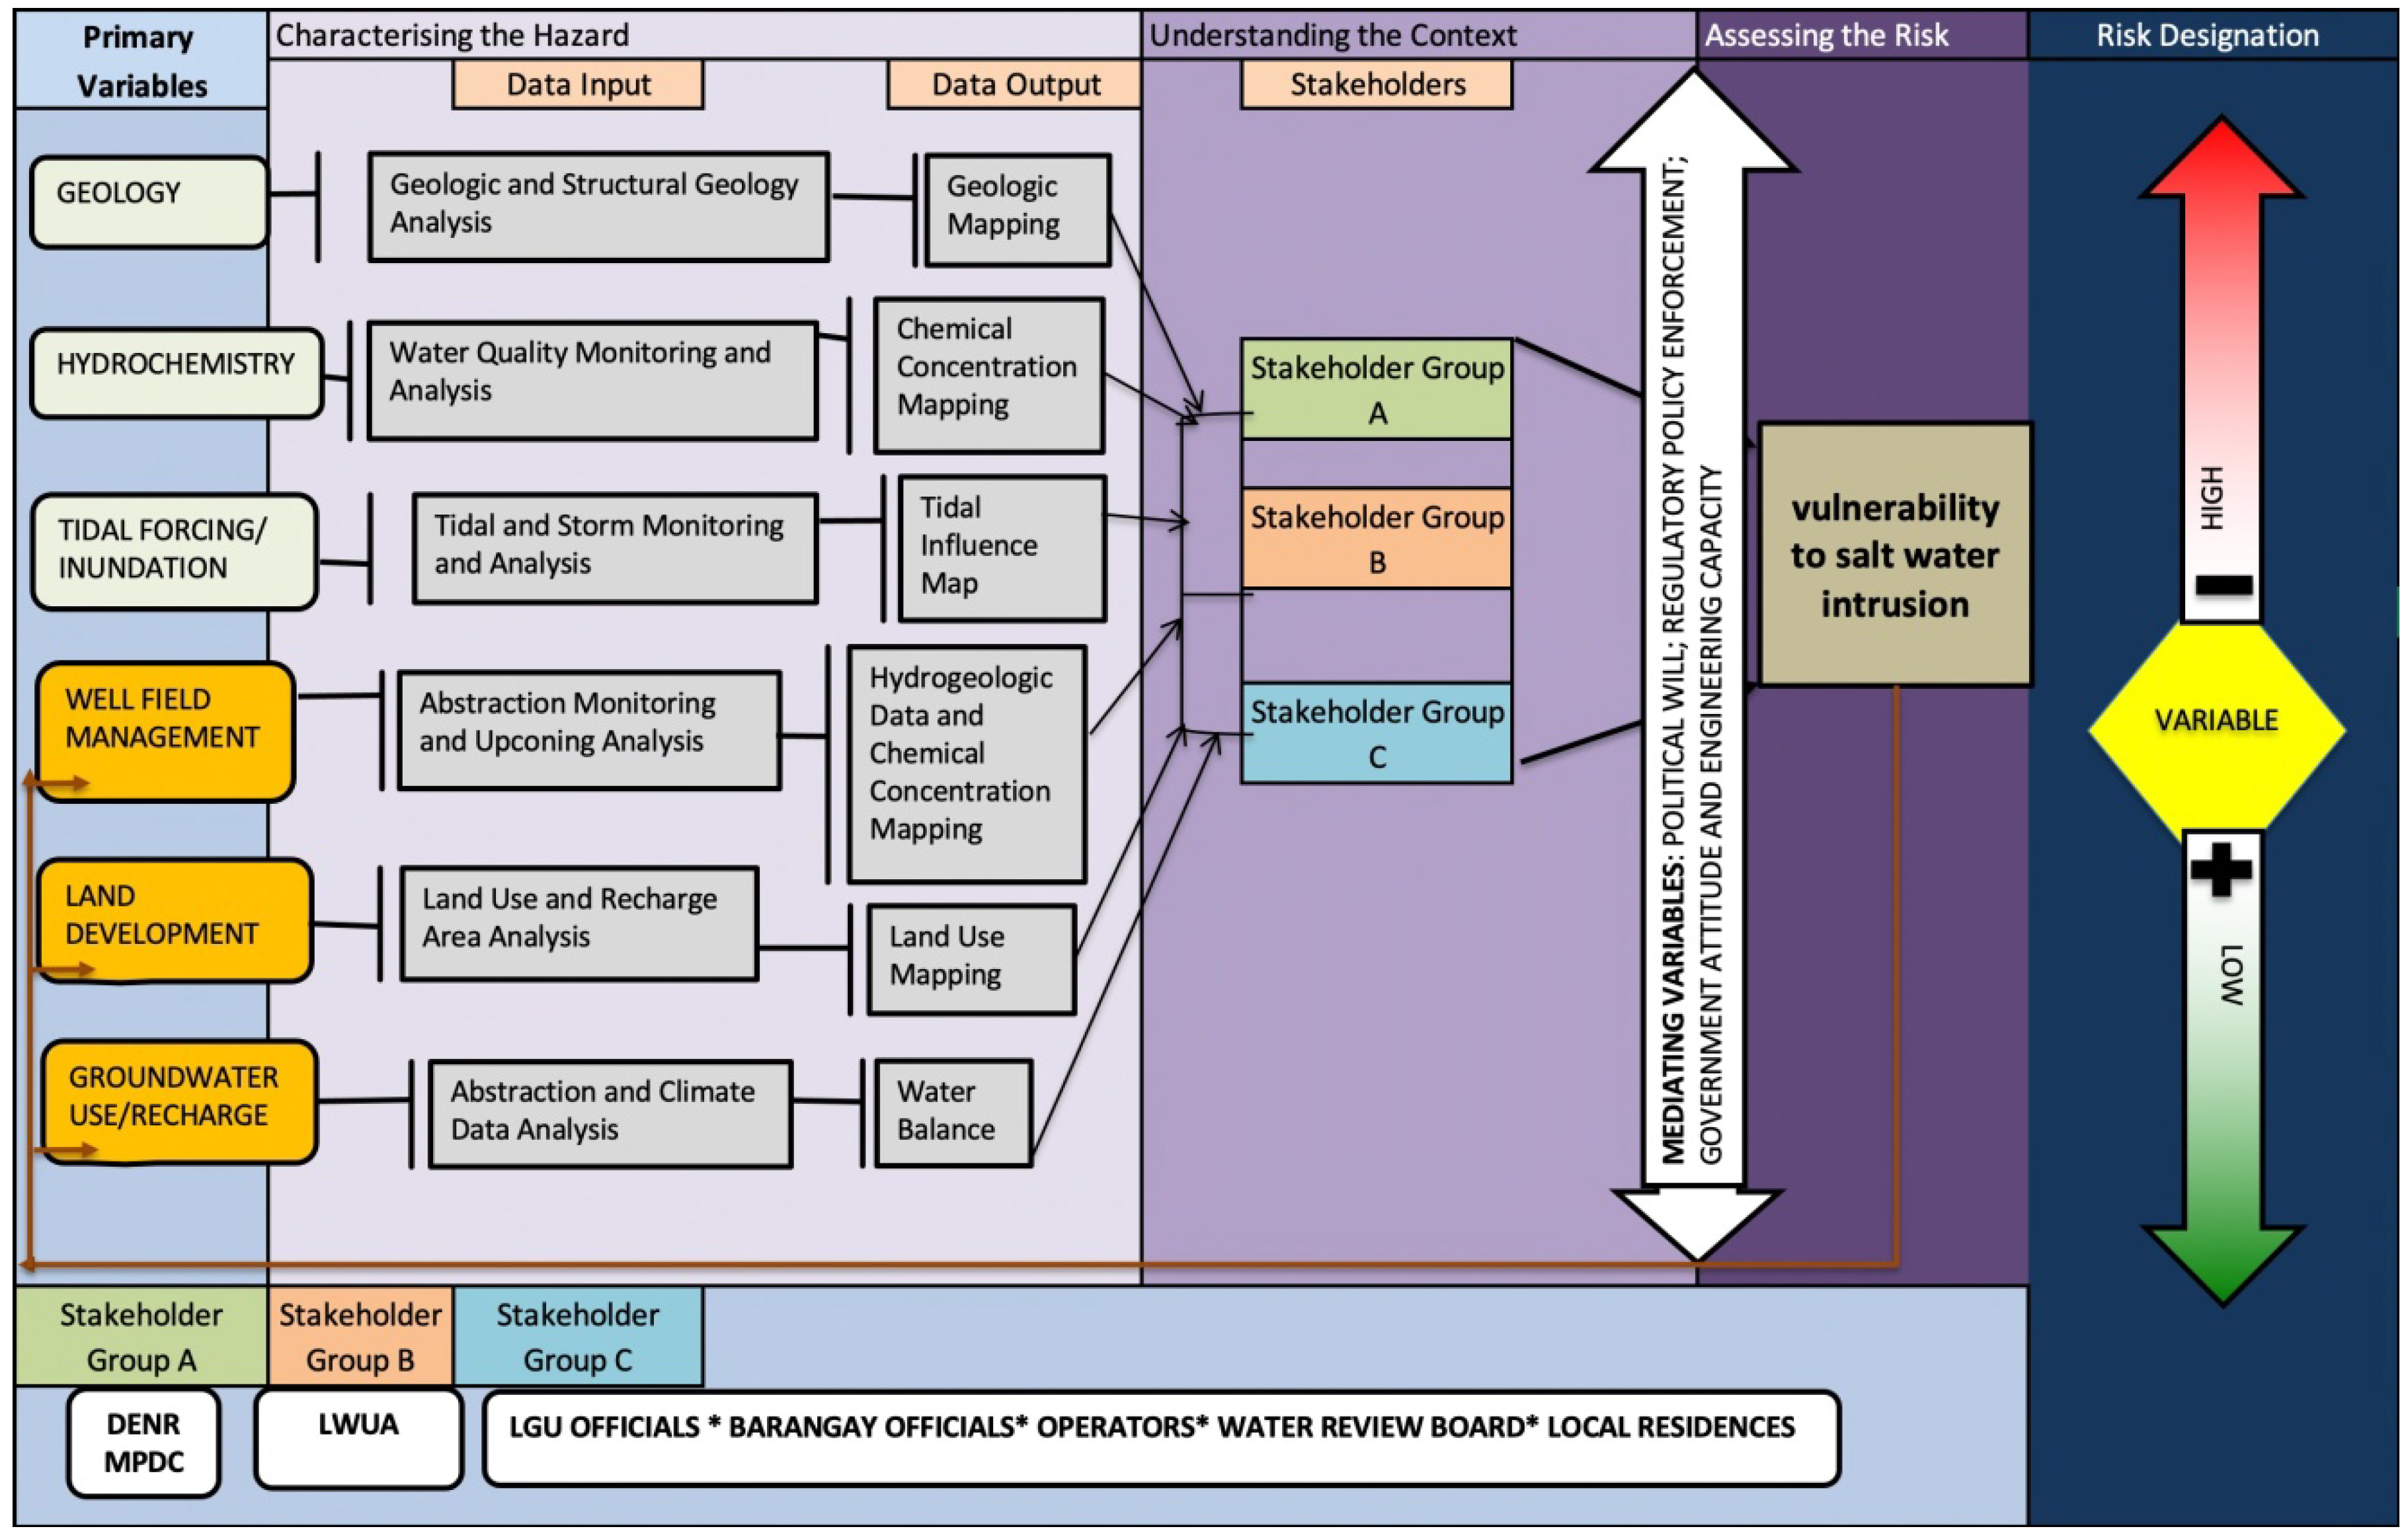
Presented below in Figure 2 is the VIA framework for this research. The framework includes characterization of the hazard through data input and data output, understanding the context through stakeholder group engagement, assessing the risk and concluding with the risk designation criteria. Once the risk is assessed, a feedback loop, which is represented by the orange line in Figure 2, points back to the primary variables (well field management, land development and groundwater use/recharge), indicating where the mediating variables (embedded in the double headed arrow) can be applied to alter the risk identified by the research. Also presented are the critical attributes applied in determining three unique degrees of vulnerability and associated risk with the freshwater lens. These are “High” where saltwater intrusion is ongoing, “Variable” where saltwater intrusion is intermittent and “Low” where no evidence of saltwater intrusion is discovered.
2.2. Data Input
1. Primary Variable Type (Technical): this variable group represents the physical data sets acquired during the research, which can be inclusive of quantitative and qualitative data. Variables a, b and c are static, whereby interventions by stakeholders are not likely to alter the results found by the research. Variables d, e and f are dynamic, in that the results from the research can change through attributes identified in the mediating variables and, if applied, the risk designation can be changed as described below:
- Geology: geologic, geomorphologic and structural geologic data interpretations.
- Hydrochemistry: physio-chemical concentrations from the water quality testing.
- Tidal Forcing/Inundation: tidal measurement and storm monitoring performed in the research area.
- Well Field Management: hydrogeologic data sets developed through data acquisition and interpretation. Groundwater Gradient Maps and freshwater lens morphology analysis.
- Land Development and Land Use Analysis: evaluating encroachment upon the freshwater lens recharge zone and land development activities near areas of freshwater lens abstraction well fields.
- Groundwater Use/Recharge: abstraction and climate data analysis.
2. Mediating Variables (Social): this variable group represents the social data sources collected through quantitative methods (including results from the questionnaires with well owners) and qualitative methods (including semi-structured interviews), both exhibiting indirect causation of vulnerability as further described below:
- Political Will: the level of desire or determination of a political entity to provide actions that produce a desired outcome. A lack of government support towards matters involving freshwater sustainability would produce a negative result in vulnerability, increasing the risk for saltwater intrusion. For example, lack of regulation in the abstraction of the freshwater lens from resorts that use saltwater for non-consumptive use worsens the problems of saltwater intrusion.
- Regulatory Policy Enforcement/Government Attitude: this pertains to the degree of policy enforcement from the government. Policies and associated regulatory directives vary in their understanding of a problem. Improved regulatory enforcement that promotes policy on monitoring salts and establishing abstraction targets would reduce the risk of saltwater intrusion through upconing. These examples were uncovered in this research and reflect a (−) result in vulnerability that would increase the risk of saltwater intrusion.
- Engineering Capacity: assessed from three tiers of government, which indicate a strong degree of knowledge in water resource management principles. However, due to insufficient funding, staff retention is low and negatively impacts the government’s ability to ensure protection of the freshwater lens. This condition was described according to each tier of government in this research and has a (−) impact on vulnerability that would increase the risk of saltwater intrusion to the freshwater lens.
The mediating variables are intended to identify critical attributes that, through positive/constructive actions, can alter the vulnerability and thereby reduce the risk of saltwater intrusion. In summary, mediating variables can shift vulnerability from negative (i.e., High Risk) to positive (i.e., Low Risk) through actions that will improve the management of the freshwater lens and render the supply sustainable for future safe use.
2.3. Stakeholder Group Discussion
The VIA framework (Figure 2) includes all three of the stakeholder groups examined in this research. Presented below is a brief description of these groups as informed by the semi-structured interviews, with their perceived data type interests and data needs, which this research will deliver by designating zones of risk and vulnerability in the freshwater lens resulting from saltwater intrusion.
- Stakeholder Group A (Department of Natural Resources (DENR) and Municipal Planning Development Coordinator (MPDC)): includes the individuals most responsible for providing safe and equitable delivery of drinking water to the people of Bantayan. This group is well versed in water resource management concepts through education and practice. They are the most likely group to benefit from all aspects of the research.
- Stakeholder Group B (Local Water Utility Administration (LWUA) and Department of Interior and Local Government (DILG)): includes individuals responsible for management of water resources through a broad array of policy dissemination and enforcement. In particular, expanding their understanding regarding national and provincial policy enforcement at the Local Government Unit (LGU) level would be a primary concern.
- Stakeholder Group C (LGU and barangay officials, local operators and residents and Water Review Board): includes the broadest group of stakeholders with the greatest diversity of knowledge. However, this group deals with day-to-day concerns regarding water quality and quantity, which incorporate both technical and social data sets. The LGU and barangay officials share responsibility for interfacing with MPDC staff and local residents on matters involving water access and quality; operators are responsible for the supervision of LGU pumping wells. Multiple lines of data access will support this group.
A key feature of the VIA is its functionality; each stakeholder group can access specific elements of the findings for their own purposes. An example is that the LGU stakeholders (who manage public water utility) can access water quality and hydrogeologic data sets to inform their decisions on the placement of new supply wells. National or provincial government stakeholders may find them more useful for understanding the attitudes of the LGU or barangay captains on issues regarding the enforcement of national water resource policy. In each case, new knowledge is gained and can be applied to the overall improvement of water resource management.
2.4. Risk Designation
The process to determine a level of risk for saltwater intrusion is defined below:
- (−) High risk (red) represents high salt concentrations in groundwater, a positive result for tidal forcing and evidence of inundation, which collectively raises the vulnerability to “High Risk”.
- (+) Low risk (green) represents low salt concentrations in groundwater, no tidal forcing and no evidence of inundation, which collectively lowers the vulnerability to “Low Risk”.
- Variable risk (yellow) represents a variance (+/−) of the data sets over the monitoring period and hence, a level of “Variable Risk”.
The VIA data output per monitoring site is assigned a risk designation such as (−) for high risk or (+) for low risk. A third risk designation is defined as variable risk and is an intermediate output identifying a location with a variable risk of saltwater intrusionthat would warrant stakeholder attention to the possibility of degrading water quality conditions.
2.5. The Research Area
The Philippines Archipelago is composed of more than 7100 islands and islets, stretching to about 1854 km from north to south. Briones [67] describes the archipelago as having a total coastline of about 18,000 km and a land area of about 11,000 square kilometers (km2). Approximately 70 percent of the 1526 municipalities, including large cities, are located within the land portion of the coastal zone. Moreover, about two-thirds of the country’s population live in the coastal zone and are, therefore, directly influenced by the coastal environment [67]. The Archipelago is in the western Pacific Ocean between 5 and 20◦ northern latitude [68], positioned between the western rim of the Pacific Ocean and the West Philippine Sea.
2.6. Site Selection
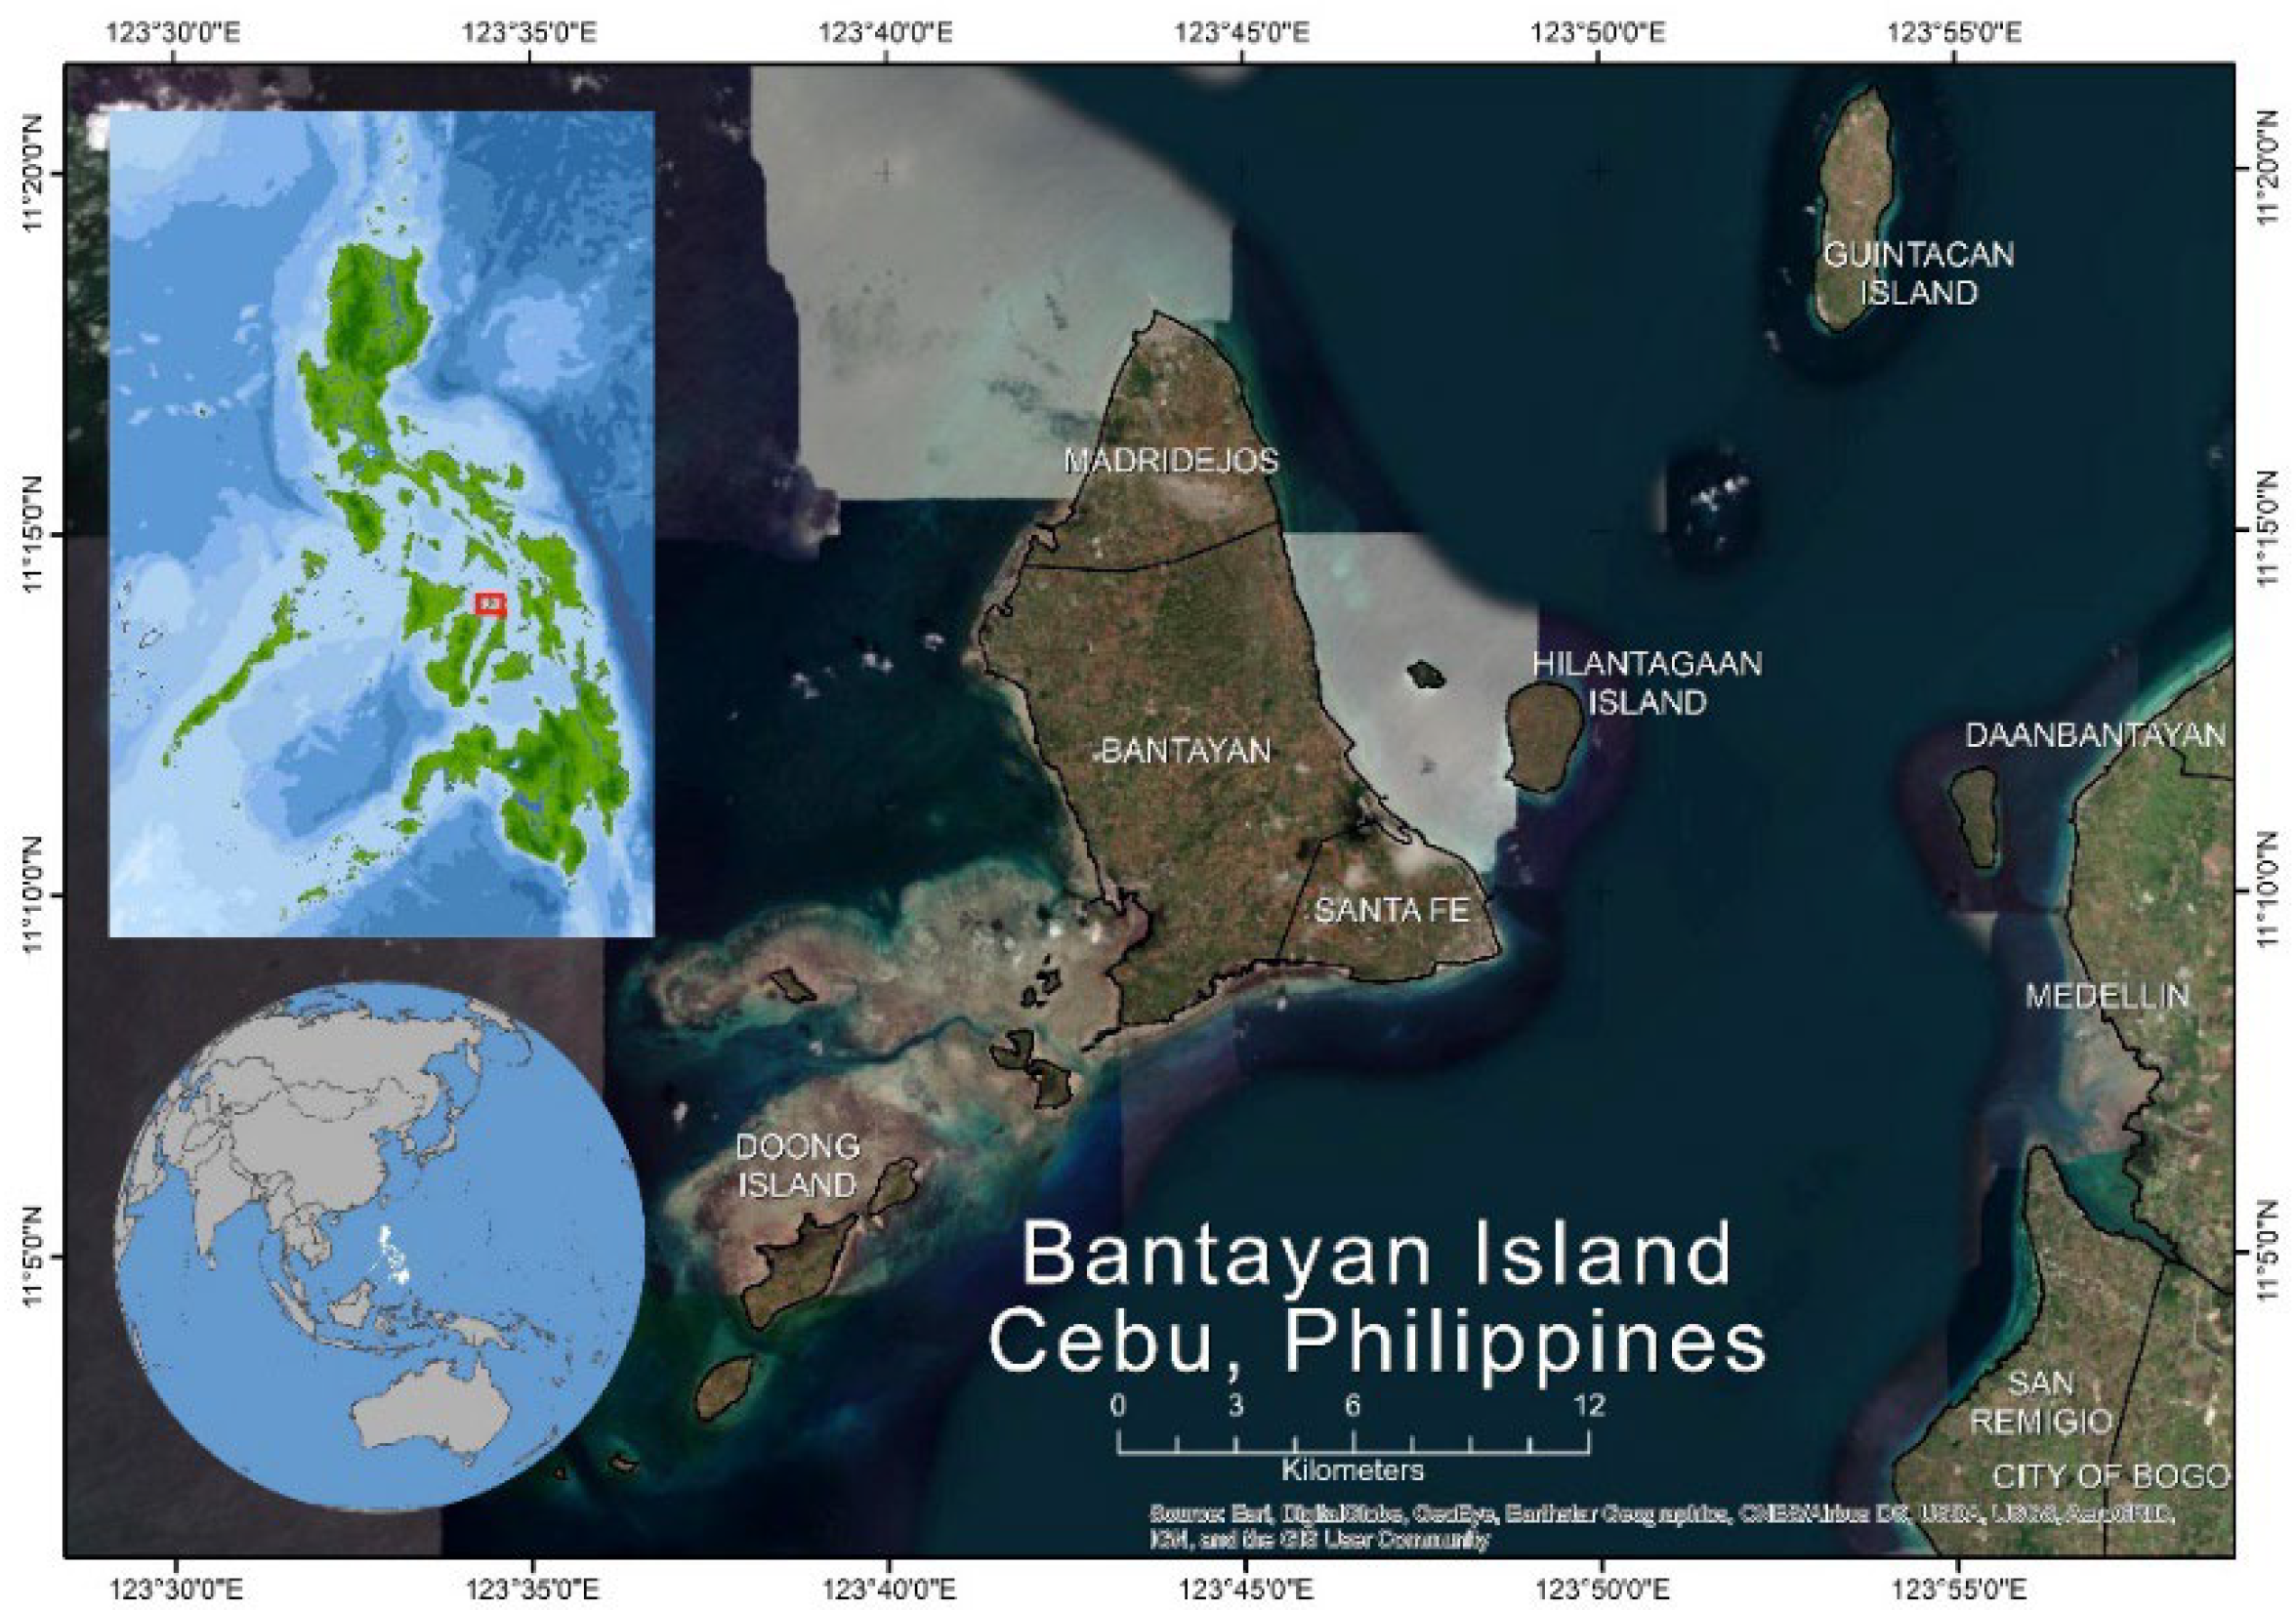
Within the Archipelago lie the Visayas Basin and the Cebu Province, which is central to the Archipelago. The island of Bantayan is located approximately 15 km northwest of Cebu, in the Visayas Basin (Figure 3). Bantayan Island is strategically a fishing island with a land area of 8163 hectares, reaching a maximum elevation of 82 m above sea level (asl) [69]. According to the Philippine National Statistics Office [69], Bantayan has a population of 144,000 people distributed across three municipalities. As a tourist destination, the island is known for its white sand beaches, old churches and poultry industry [70].
Bantayan is an island dominated by limestone that shows signs of several phases of deposition and uplift. In the higher, central parts of the island, lithified eolian deposits overlie this limestone, forming an undulating topography. Lagoon deposits, particularly in the western parts of the island, cover coastal margins. The eastern coastal margins are exposed to prevailing wind and wave action, and this affects the coastal morphology; the eastern shores are predominantly rocky, while the western, leeward coastline is characterized by a broad depositional region comprising recent lagoon and associated marine deposits. The southern coastline displays a combination of limestone cliffs (~5 m high) and beach deposits [15].
Bantayan is affected by mixed semidiurnal tides and classified as Low-Mesotidal according to the classification of Hayes [36]. Mean high water (MHW) extends to 1.53 m asl and Mean low water (MLW) extends to 0.2 m asl [71].
The annual temperature fluctuation is less than 3 °C, and annual rainfall generally exceeds 1500 mm (DOST, 18). January to April constitutes the dry season, with typically only 14 per cent of the average annual rainfall. The wet season is characterized as having two typhoon seasons: one from June to July and one from August to September. The rainy season begins in October and extends through December.
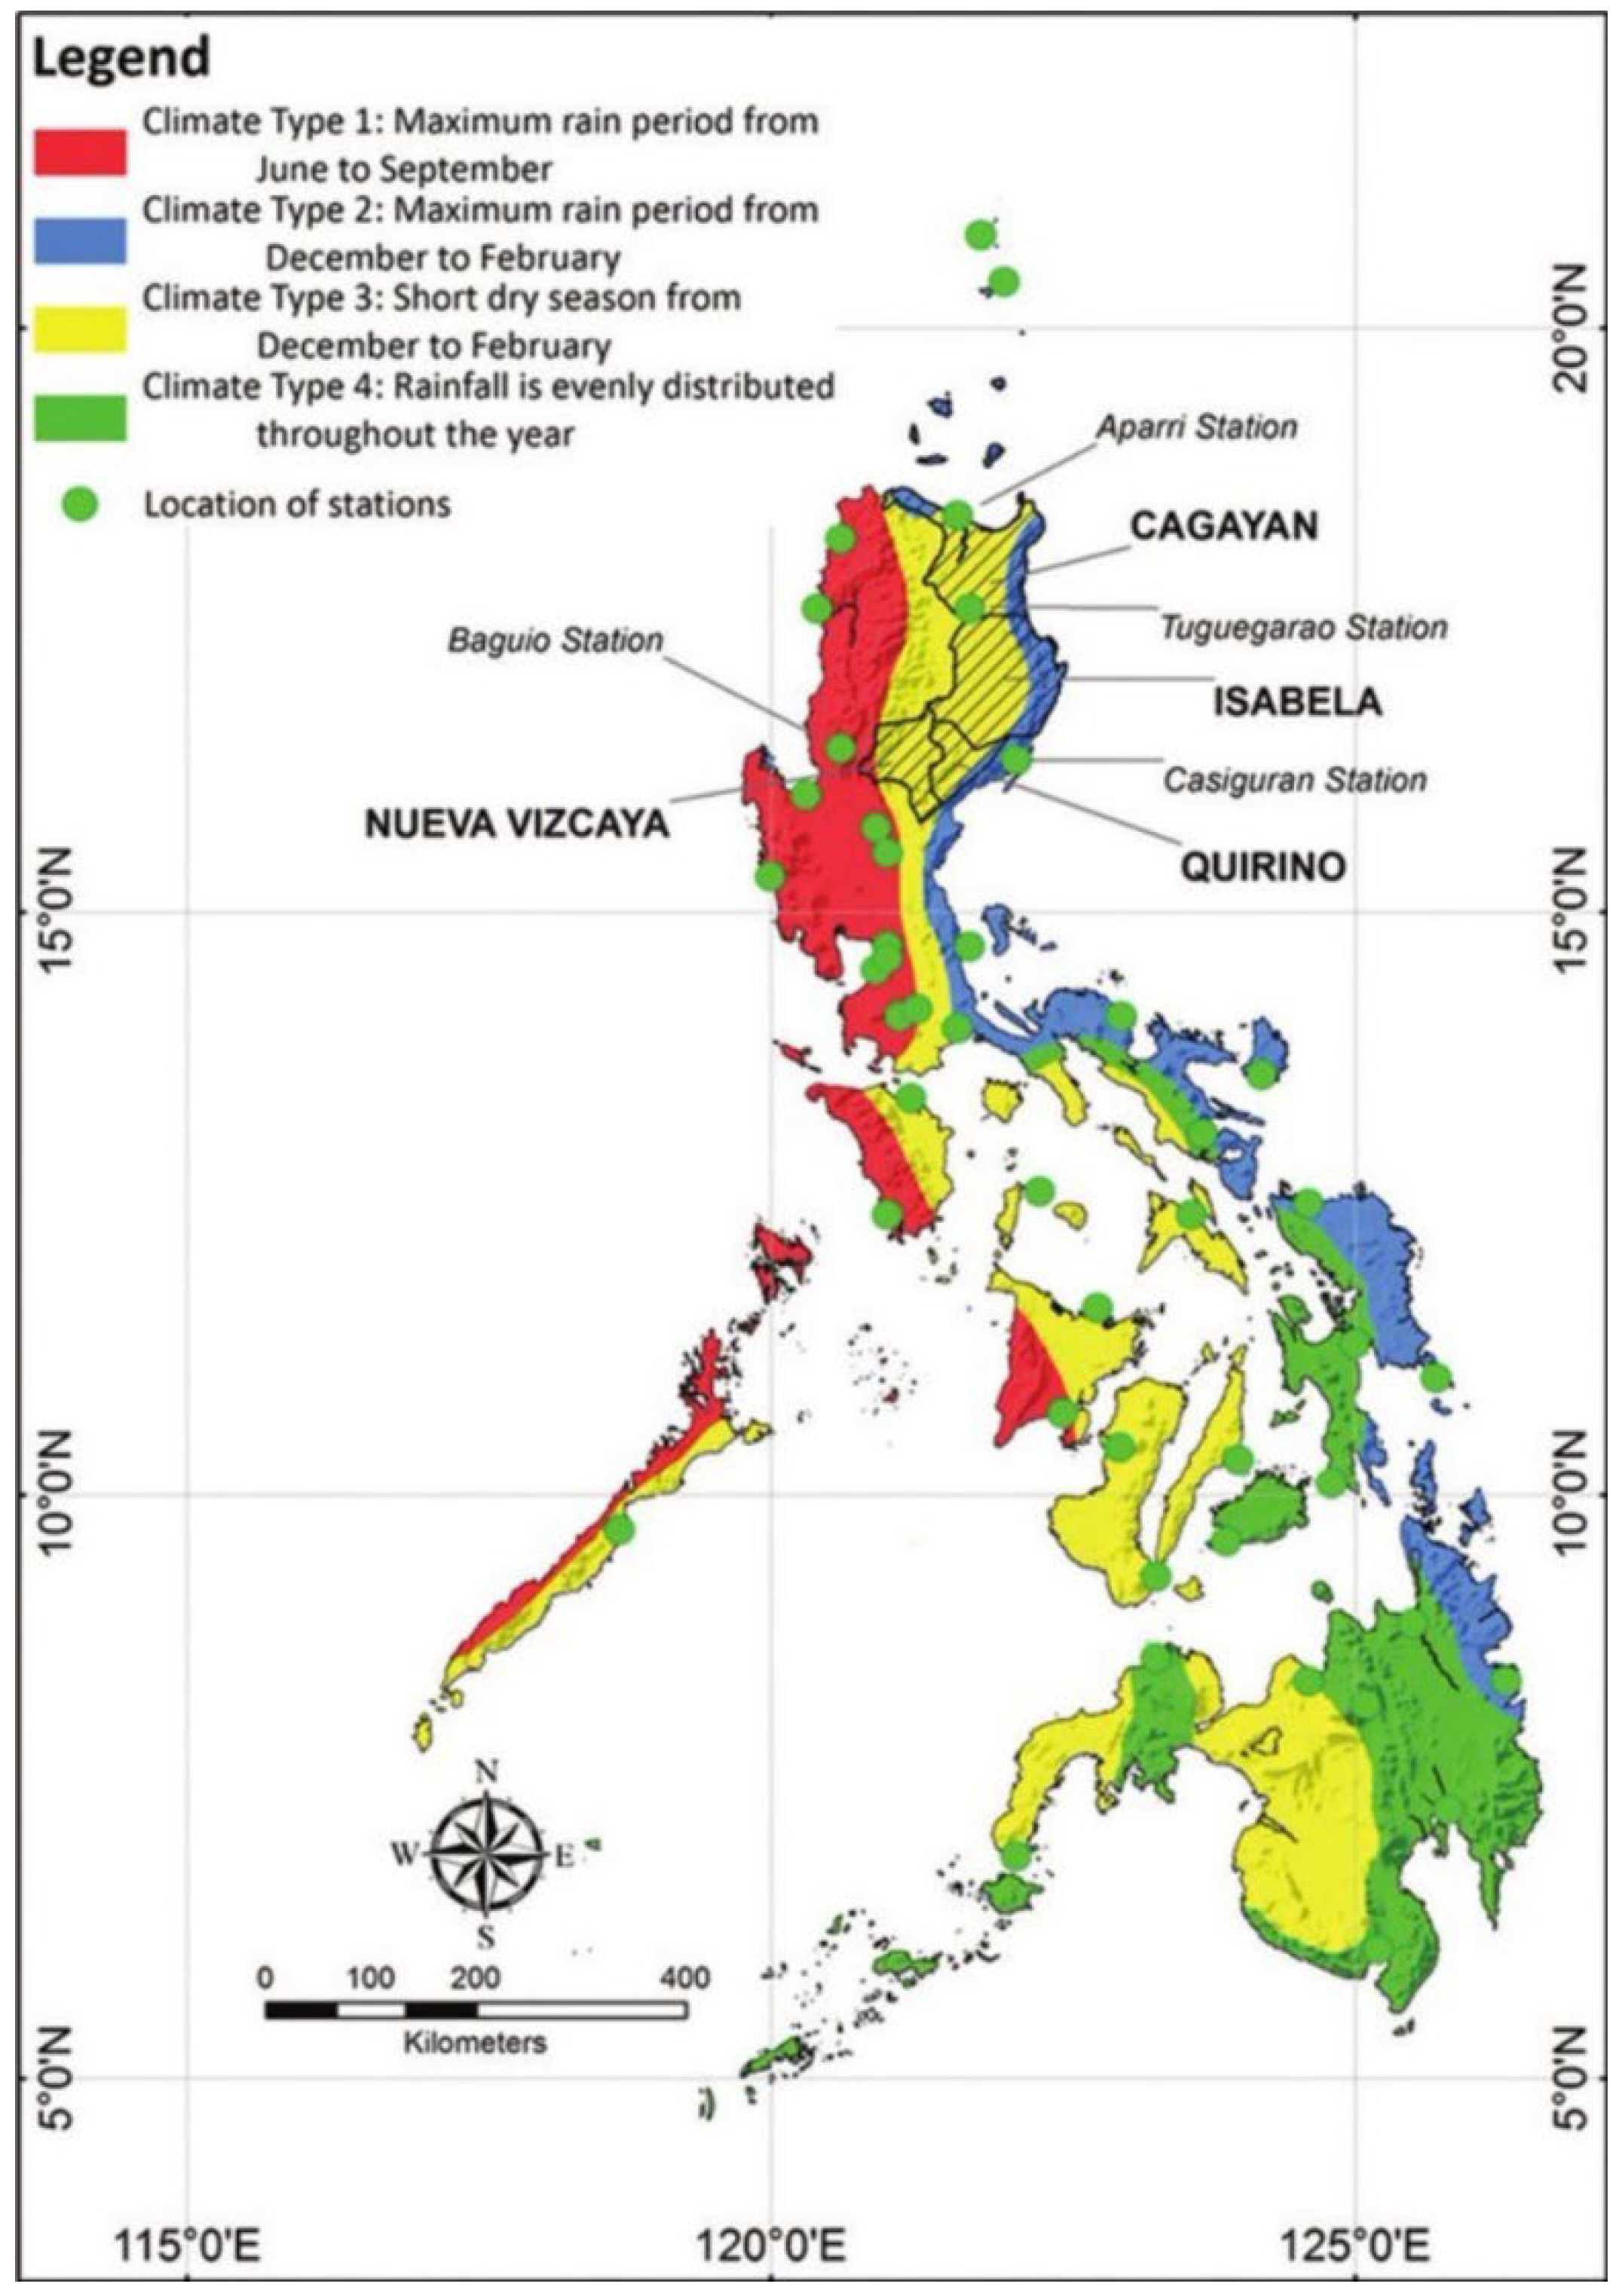
The distribution of rainfall across the archipelago can also be used to categorize climate types (Figure 4). Bantayan is in ‘Type III’; this is characterized by the absence of a very pronounced maximum rain period and a dry season lasting from one to three months, either during the period from December to February or from March to May. It also indicates that areas in this region are sheltered from trade winds but are frequented by tropical cyclones.
Groundwater is the only source of drinking water on Bantayan. There are no surface water supplies on the island. The underlying karstified limestone and rapid infiltration of precipitation do not facilitate formation of streams or surface water bodies.
3. Results and Discussion
3.1. Hydrogeochemical Characteristics of Bantayan Island
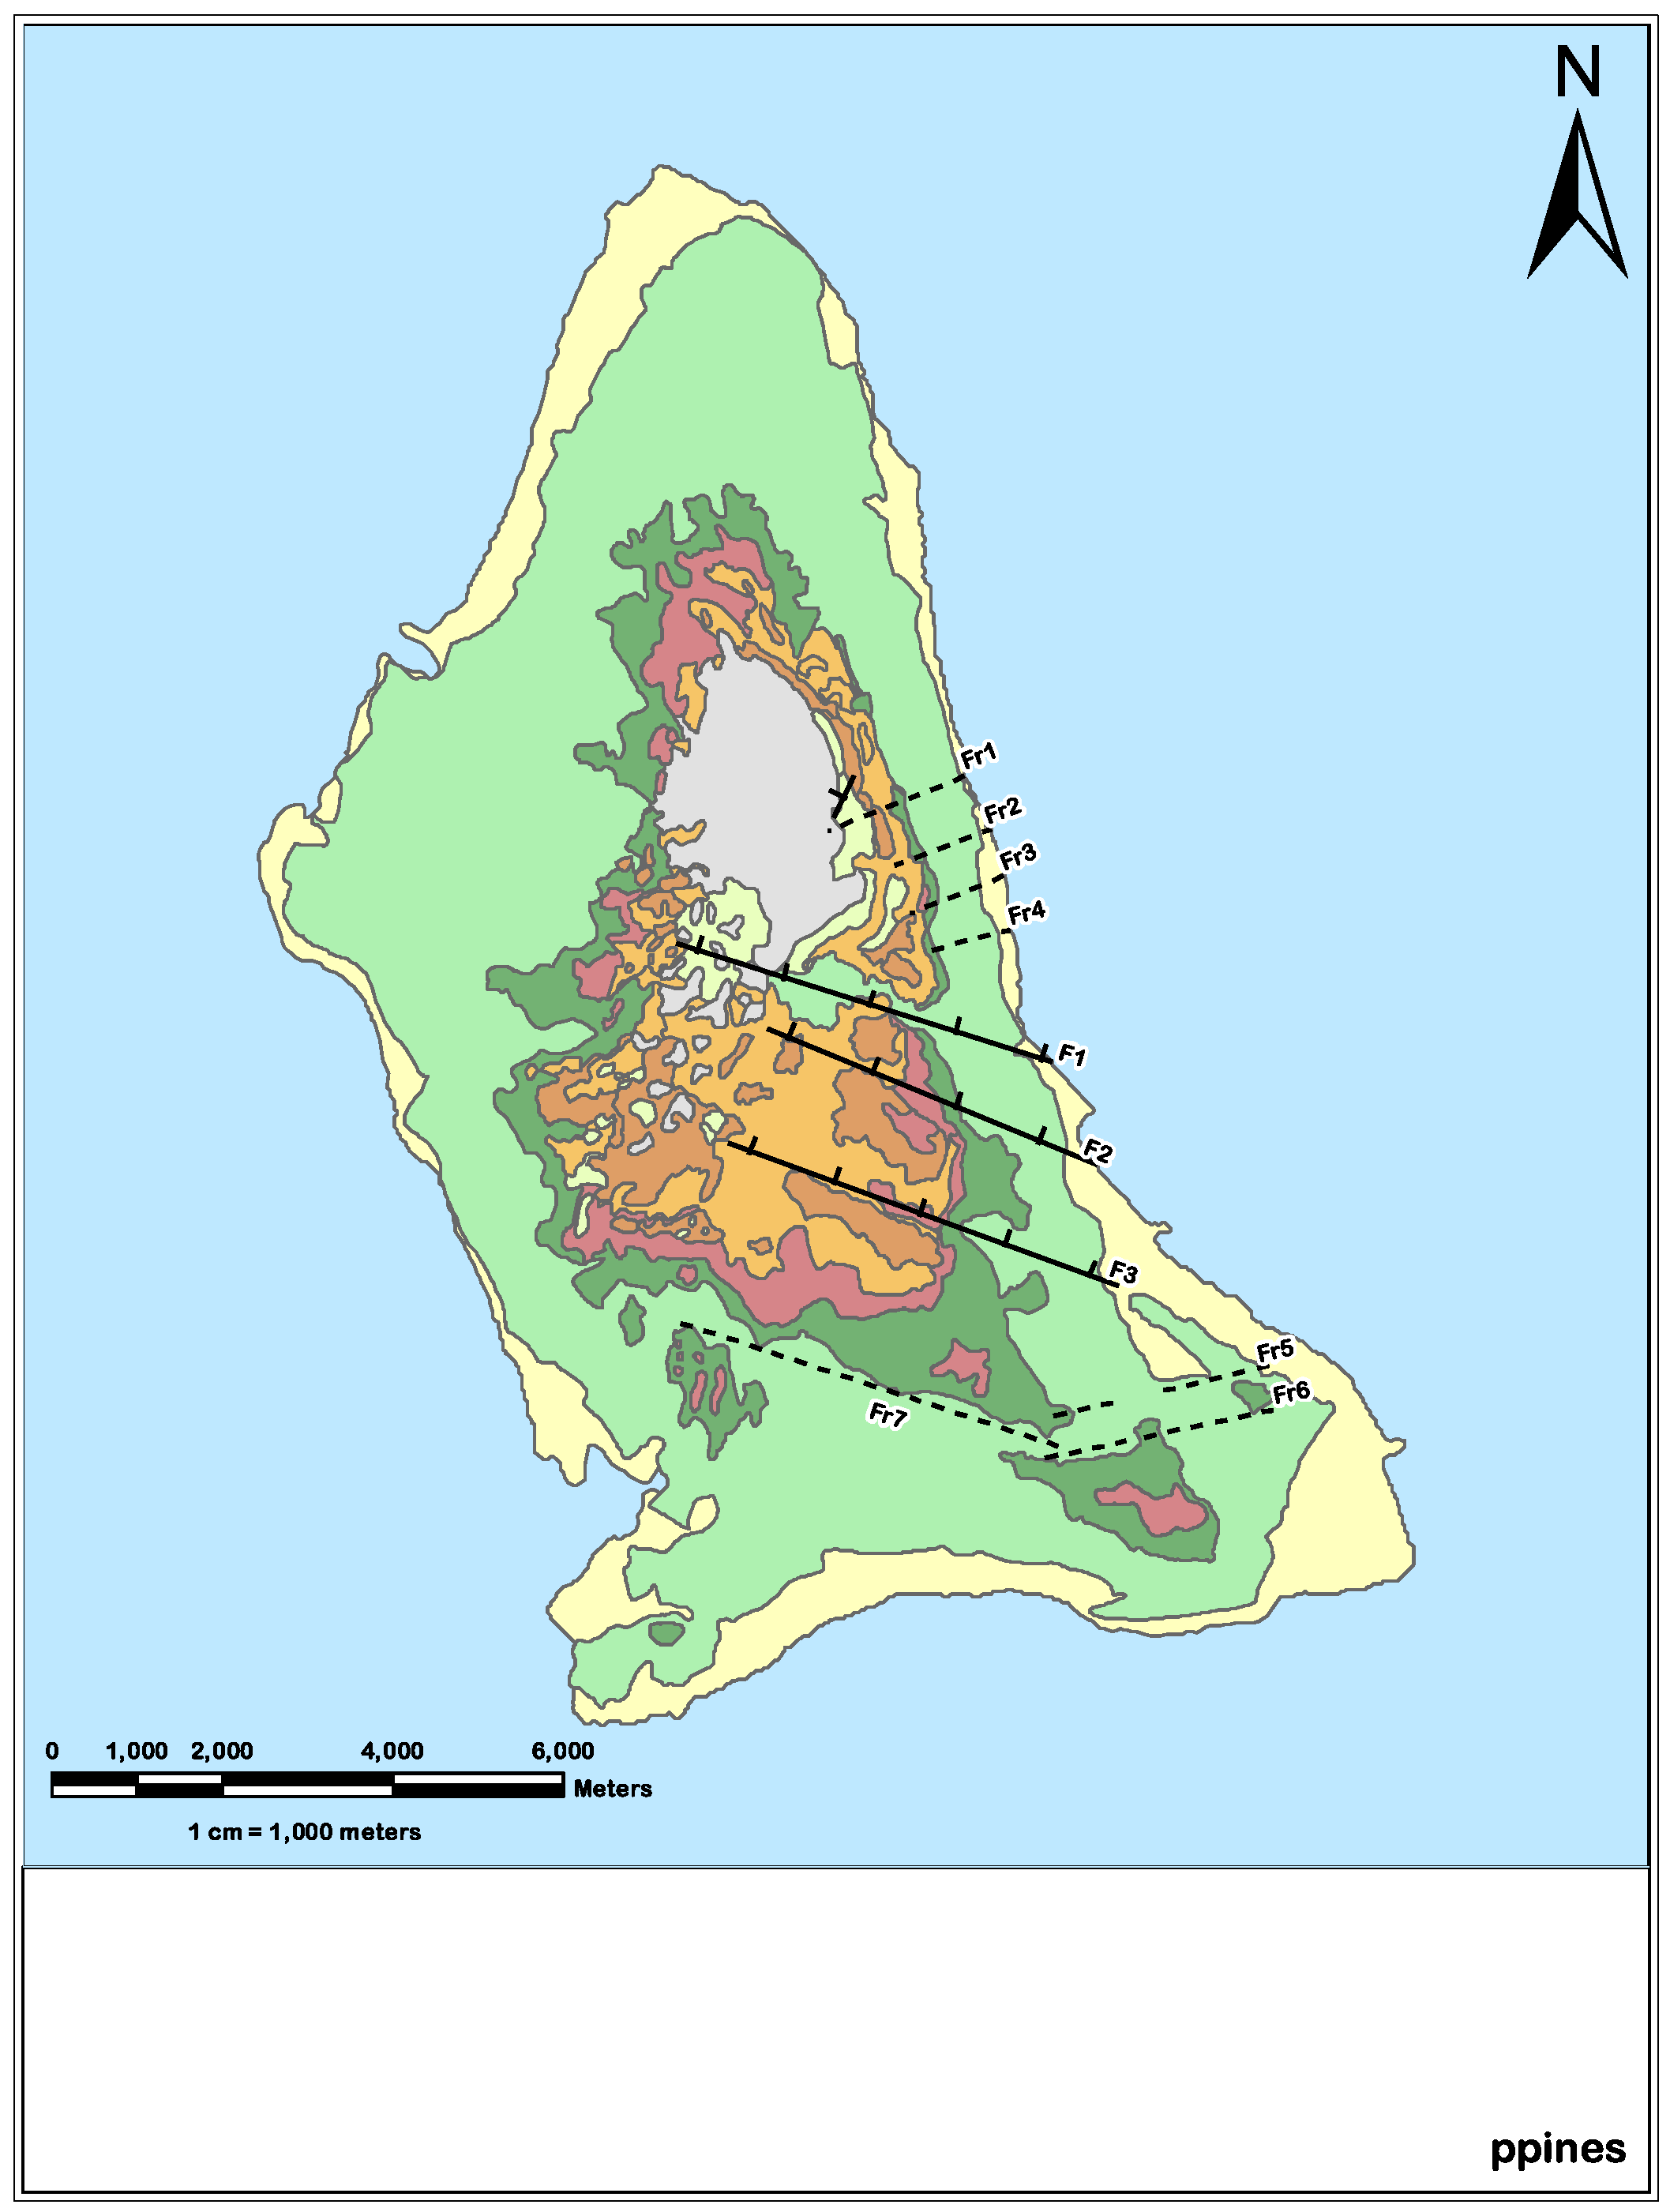
The Bantayan aquifer is representative of permeability features influenced by both karst processes and tectonics, widely found in other karst coastal aquifers. Horst-bound faults intersect the Quaternary carbonate rock and influence the groundwater migration pattern of the freshwater lens (Figure 5). Therefore, the behavior of the groundwater levels is inextricably linked with the mapped tectonic lineaments and their influence on the permeability of the rock matrix.
Linking hydraulic head behavior with tectonic influences in the horst-bound faulting regime on Bantayan Island and other structural discontinuities presents a critical output for defining freshwater lens vulnerability to saltwater intrusion. The changes of the hydraulic gradient, matching the upward isotherm convexity, suggest low conductivity of corresponding faults, while the decrease in water level in connection with downward convexity zones may represent faults of higher conductivity. The coupling of hydraulic and thermal information allows for the hypothesis that the faults crossing the field area, corresponding to the buried karst, simultaneously behave as a barrier to horizontal flow and as conduits for fault-parallel flow. According to Fidelibus [14], these findings suggest that groundwater beneath exposed karst characterized by low conductivity faults is less vulnerable than groundwater in the faulted and displaced basement, which is overlaid by significantly thick covers bisected by high conductivity faults.
Applying the VIA Framework on Bantayan Island
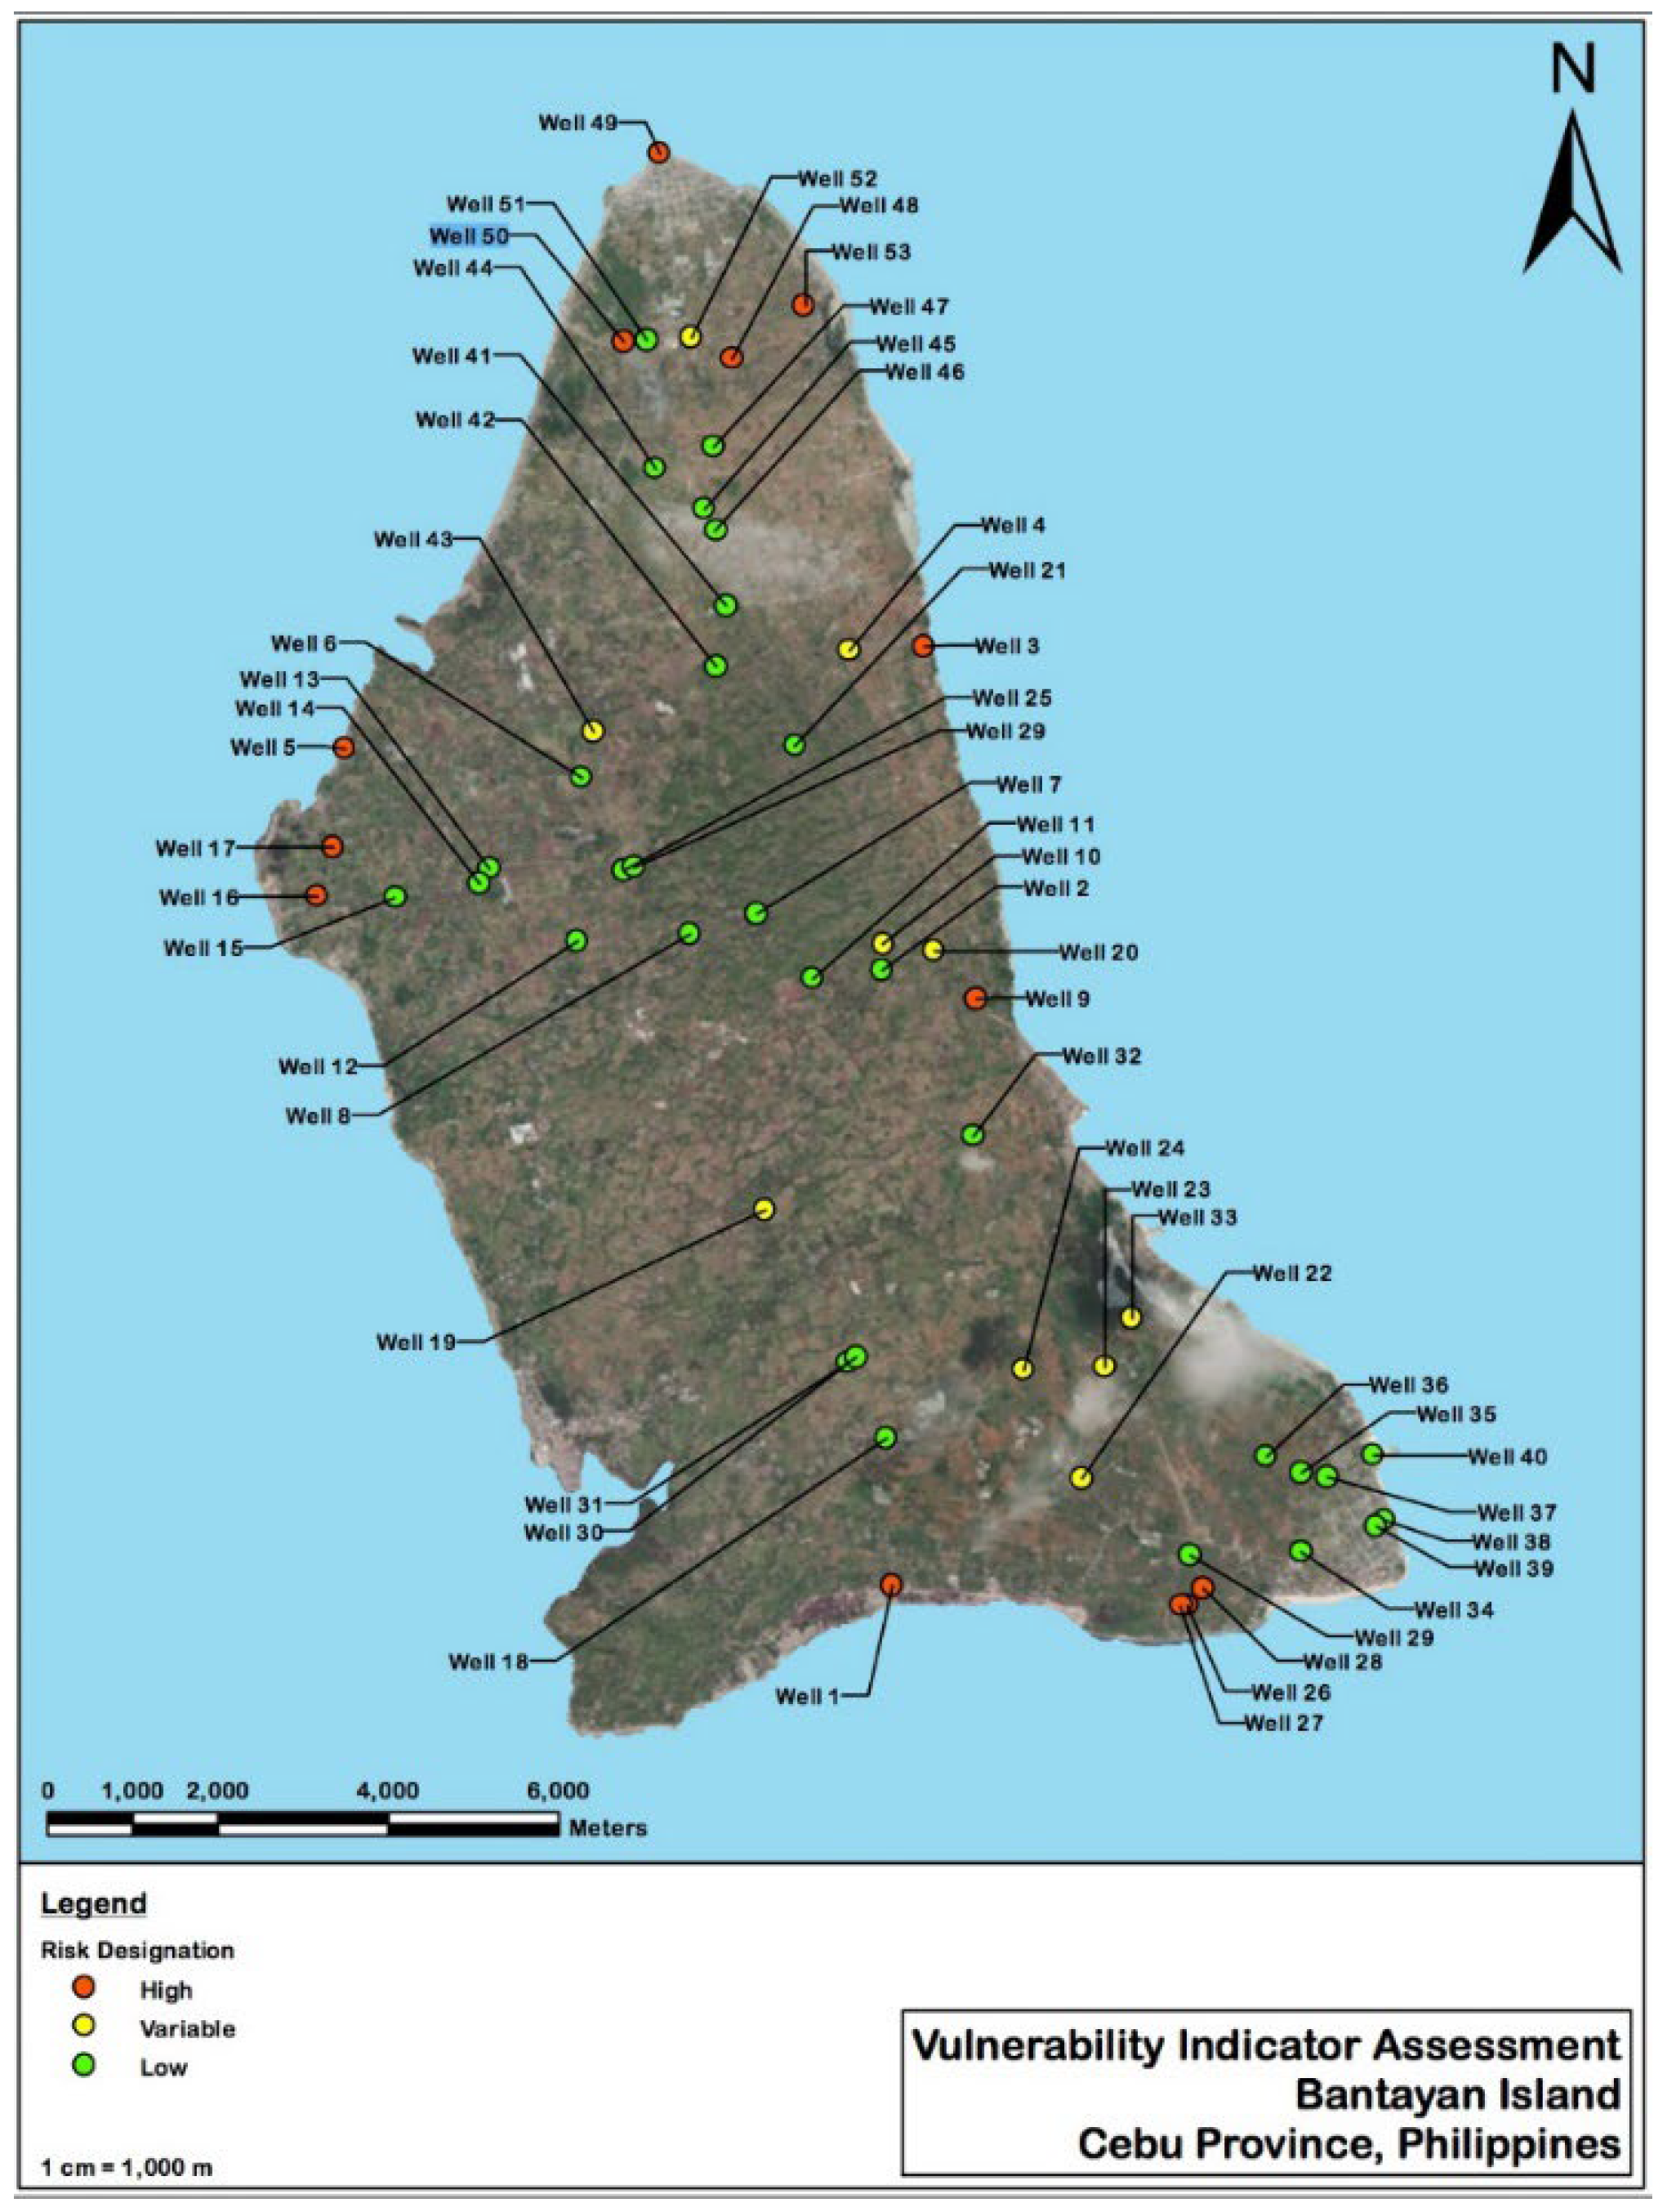
The VIA logic for assigning risk to the vulnerability of saltwater intrusion as applied in the research area is presented in Figure 6. The figure illustrates the three levels of groundwater vulnerability to saltwater intrusion. The VIA data output per monitoring site is assigned a risk designation, such as (−) for high risk noted in red or (+) for low risk noted in green. A third risk designation is defined as variable risk and is an intermediate output that identifies a location with a variable risk to saltwater intrusion. The key criteria in assigning risk is the presence of chloride in groundwater. However, the degree of risk is based upon the complete set of primary variables and how they collectively influence the migration of salts in the subsurface.
For instance, areas of high groundwater vulnerability to saltwater intrusion are grouped along the coastal margins, where ongoing tidal forcing and storm surge is creating saltwater intrusion (wells 49, 50, 53, 48, 3, 9, 5, 17, 1, 27 and 26); these conditions were documented through the application of the FLAP. Evidence in support of this designation included hydrochemistry results for chloride and other salt analytes. In addition, examination of well field abstraction data and evidence of upconing further contributed to the risk designation. Areas of variable vulnerability identified wells along structural discontinuities (wells 19, 33 and 4) in regions of tidal forcing (well 52) and active areas of upconing (wells 43, 20, 10, 22, 23 and 24), where saltwater intrusion was observed intermittently during the monitoring period. Areas of low vulnerability are locations where no evidence of saltwater intrusion was documented during the research.
A special area of interest was observed along the coastal boundary in Santa Fe in the southeast region of the study area. Wells 38, 39 and 40 revealed an area of low vulnerability to saltwater intrusion; however the wells, are located within an area of tidal forcing. This anomaly is a result of a newly constructed sea wall at the Port of Entry to Bantayan that has apparently sealed off the tidal coneectivity to the freshwater lens.
Figure 6.
Vulnerability Indicator Assessment Map, Bantayan Island, Cebu Province, Philippines [15].
Figure 6.
Vulnerability Indicator Assessment Map, Bantayan Island, Cebu Province, Philippines [15].

3.2. Social Characteristics of Bantayan Island
When evaluating the impact of land development on freshwater lens sustainability, local political decisions place an emphasis on economic growth over water resource protection. This was clear through discussion with MPDCs in each LGU on Bantayan, where projects are advanced in lieu of policies. Concerns over anthropogenic stressors, such as pollution from commercial projects and expansion of resorts along coastal boundaries, threaten an already vulnerable freshwater lens. It was found that no existing policies outlined freshwater lens management.
Lack of technical capacity creates challenges for proper water resource management at all levels of government. Additionally, the geographic remoteness prevalent in the Philippines results in a greater burden on national policy dissemination and lesser ability for capacity development workshops at the provincial and LGU levels. Public funding, technical capacity and geographic remoteness collectively impede effective management of water resource policy.
The lack of political will to prioritize the needs of constituents over commercial interests was expressed by the MPDC and the barangay captains interviewed. Nunn [42] came to a similar conclusion in his study of the Pacific Islands. The qualitative results from the semi-structured interviews were applied to the groundwater vulnerability indicator assessment, presented as a mediating variable; this demonstrates how political will, when applied to ensure protection of the freshwater lens, can reduce the risk of saltwater intrusion through positive action. Two critical observations include: (a) restoring the protection area status of the freshwater lens recharge area by prohibiting land development, and (b) reducing abstraction from wells where ongoing upconing is evident.
3.3. Synopsis of Results
The VIA provides an example that embraces the interdisciplinary nature of the type of research required to examine the risk of saltwater intrusion in this setting. As evidenced by the variables under consideration, geoscientists and social scientists maintain important roles in developing data sets for evaluation of vulnerability and associated risk in this context. Presented in Table 1 is a FLAP Interdisciplinary Resource Matrix, which advances this point by offering further evidence of the interdisciplinary nature of this approach and a roadmap for application, with the desired output by data type and source.
Findings from this research align with the work of Werner and Simmons [73], where identification of these variables and their implications for the sustainability of the freshwater lens is vital to stakeholder application of this knowledge. Various indexing methods in the literature focus on groundwater contamination using a relatively broad spectrum, e.g., DRASTIC [74], GOD [75], AVI [76], SINTACS [77], EPIK [78] and COP [79]. DRASTIC has probably been most widely applied in both research and applied science fields. The VIA framework presents a transformative approach not only because of its emphasis on stakeholder input, but also because of its non-numerical nature, providing flexibility to the evaluation process and ease in communication with diverse stakeholder groups.
4. Conclusions
The FLAP is a set of technical and social methodologies applied to systematically advance a non-invasive, hydrogeologic characterization and social scientific study. Coupled with the VIA, practitioners can gain a new understanding of water resource conditions on karst islands in LMICs. An important underpinning of this research is the participatory nature of the social science attributes and the accompaniment of the researcher by the stakeholders. This engagement is important in developing solutions to these multidisciplinary challenges.
As a non-invasive instrument, the FLAP systematically guides the research to gather the information necessary to assess the technical attributes and social aspects that influence a freshwater lens. This VIA will assimilate the results of this research and the associated intrinsic vulnerability of the local water resources to saltwater intrusion.
The value of this research does not rely on long-term, intense, academically driven studies. Instead, locally derived data sets that are readily available can advance appropriate data to inform stakeholders about the mechanisms in play that contribute to saltwater intrusion, and about how local stakeholders are adapting to this challenge.
The VIA, along with the FLAP framework, demonstrated how geologic field mapping and remote sensing data sets have advanced knowledge on the island’s geology, its physiographic provinces and its ability to influence the migration of salts in the freshwater lens of Bantayan Island. Observations have been compared with empirical data sets for similar island regimes; the Vulnerability Indicator Assessment Map presented a clear representation of the geologic and hydrogeologic environments and their combined influences on freshwater lens dynamics and saltwater intrusion.
In addition, this research highlights the need for transboundary engagement between the LGUs on matters involving groundwater usage. Output from the VIA offers a viable application for current groundwater monitoring policies at the LGU level. National, provincial and local water managers could gain technical and social insights from the data sets and how they are interwoven into vulnerability to saltwater intrusion. Sharing the data across government jurisdictions would open a dialogue regarding abstraction plans for the freshwater lens and introduce a much-needed holistic approach to water management.
5. Limitations of the Research
This research has developed credible findings and contributed to the body of knowledge regarding the vulnerability of a freshwater lens beneath a karst island in a low- to middle-income country to saltwater intrusion through the application of the FLAP and the VIA. However, it is also recognized that the research has several limitations in its research findings. Firstly, this research assessed island inhabitants to advance a process of data collection and quality. The presence of the researcher in interviews, in delivering the questionnaire to households and in reviewing water quality data with well owners may have influenced respondents’ answers in expectation of something in return from the researcher. The researcher managed this by clearly introducing himself and the purpose of the research to the participants in advance of data collection.
Secondly, field translators were used to facilitate communications between the researcher and respondents. This translation from local dialect to English may have led to inaccuracies in interpretation. To limit this, the translators were briefed in advance of their engagement about the purpose of the research, and a debriefing was held following the interactions to ensure the quality of their work.
Thirdly, map development was initially constrained due to limitations in the accuracy of field instrumentation. The use of a handheld GPS was initially applied during this research and found to be extremely limited in providing functional data that would correlate with available topographic information. In addition, data variance and lack of measurement repeatability restricted the use of a handheld GPS.
Mapping was further constrained due to the availability of GIS-based mapping at the LGU level. Bantayan was the only LGU that had GIS-based mapping. This created challenges at the outset of the research when developing an initial field map for executing the well survey, as well as challenges for geologic and geomorphologic mapping tasks.
To overcome these limitations, engaging USC in Cebu and initially applying the differential global positioning system (DGPS) resolved these mapping challenges. However, further inaccuracies of the data were then discovered during the data analysis phase of the research, and application of the Philippine Government LiDAR data set reconciled the limitations identified in the DGPS mapping methods. Therefore, the final mapping products are a result of LiDAR data sets that have undergone post-processing analysis and verification.
In summary, the qualitative (i.e., social science) limitations of this research noted above were mitigated through clear and open dialogue regarding the research purpose and the intentions of the researcher. Strong community engagement to clarify the intent of the research was established early in the process through strategic relationships with MPDCs and barangay captains.
The quantitative (i.e., field mapping) limitation of this research expressed above was mitigated through collaborative engagement with the USC GIS experts to reconcile mapping measurements and accuracies. In addition, ground truth data collection of remote sensing data aided field confirmation of map output in the interpretation and analysis. Therefore, these noted limitations had limited influence upon the quality of the research.
6. Suggestions for Further Research
The elements of FLAP and the VIA as presented in Figure 1 have been summarized below with proposed refinements.
- Remote Sensing Imagery: this research relied on land surface elevation control for multiple field measurement requirements. This included: confirmation of geologic unit assessment, Digital Elevation Modeling, groundwater gradient determination, tidal study work and freshwater lens 2D analysis. Conventional GPS equipment was inadequate for the generation of viable data. The use of DGPS was proven to be expensive and cumbersome in field application and post-processing of the data. The use of government-derived LiDAR data and post-processing software was adequate for the needs of the research and provided sound and technically justifiable data for the project’s needs. Therefore, future applications of FLAP would target access to government-derived LiDAR data and post-processing as the starting point in elevation control, before alternative methods are to be applied.
- Stakeholder Engagement: key respondent selection was based upon the three tiers of governance in the Philippines (i.e., national, provincial and local). Well owner questionnaires were delivered to the well owners who participated in the research by allowing their wells to be monitored. These fundamentals in key respondent selection were effective in supporting the research objectives and reconciling the research questions. Refinements to this approach would involve increasing the LGU key respondent pool to include mayors. With the addition of the chief executive of the LGU, an additional perspective would have been offered to the research, specifically in the areas of economic development, regulatory enforcement and transboundary water resource issues.
Effective application of FLAP and the VIA does not require in-depth analytical modeling of the hydrogeologic regime, but development of local data sets and better understanding of stakeholder attitudes regarding water resources in their communities. The goal of this research was to be translational to local stakeholders to improve capacity and understanding of freshwater lens management. This was evidenced in the local stakeholder workshops conducted at the close of the research, when the VIA output was communicated. It is through this accompaniment that knowledge transfer can be realized, and society can improve through its understanding of this fragile water resource.
Author Contributions
Conceptualization, R.M.D. and L.B; methodology, R.M.D.; validation, R.M.D., C.P.D. and L.B.; formal analysis, R.M.D.; investigation, R.M.D.; resources, R.M.D. and L.B.; data curation, R.M.D.; writing—original draft preparation, R.M.D.; writing—review and editing, R.M.D., C.P.D. and L.B.; supervision, R.M.D. and L.B.; project administration, R.M.D. All authors have read and agreed to the published version of the manuscript.
Funding
This research received no external funding.
Institutional Review Board Statement
Not applicable.
Informed Consent Statement
Not applicable.
Data Availability Statement
All data in support of this research can be found at: https://doi.org/10.26174/thesis.lboro.13721485.v1.
Conflicts of Interest
The authors declare no conflict of interest.
References
- Gain, A.K.; Giupponi, C.; Wada, Y. Measuring global water security towards sustainable development goals. Environ. Res. Lett. 2016, 11, 124015. [Google Scholar] [CrossRef]
- United Nations World Water Assessment Programme/UN-Water. The United Nations World Water Development Report 2018: Nature-Based Solutions for Water; UNESCO: Paris, France, 2018. Available online: https://unesdoc.unesco.org/ark:/48223/pf0000261424 (accessed on 26 September 2022).
- Hong, S.; Xia, J.; Chen, J.; Wan, L.; Ning, L.; Shi, W. Multi-object approach and its application to adaptive water management under climate change. J. Geogr. Sci. 2017, 27, 259–274. [Google Scholar] [CrossRef]
- Xanke, J.; Goeppert, N.; Sawarieh, A.; Liesch, T.; Kinger, J.; Ali, W.; Hötzl, H.; Hadidi, K.; Goldscheider, N. Impact of managed aquifer recharge on the chemical and isotopic composition of a karst aquifer, Wala reservoir, Jordan. Hydrogeol. J. 2015, 23, 1027–1040. [Google Scholar] [CrossRef]
- Werner, A.D.; Ward, J.D.; Morgan, L.K.; Simmons, C.T.; Robinson, N.I.; Teubner, M.D. Vulnerability indicators of sea water intrusion. Groundwater 2012, 50, 48–58. [Google Scholar] [CrossRef] [PubMed]
- Ogurcak, D.; Price, R.M. Groundwater geochemistry fluctuations along a fresh-saltwater gradient on carbonate islands of the lower Florida Keys. Chem. Geol. 2018, 527, 118925. [Google Scholar] [CrossRef]
- Bailey, R.T.; Jenson, J.W.; Taborosi, D. Estimating the freshwater lens of atoll islands in the Federated States of Micronesia. Hydrogeol. J. 2012, 21, 441–457. [Google Scholar] [CrossRef]
- Holding, S.; Allen, D.M. From days to decades: Numerical modelling of freshwater lens response to climate change stressors on small low-lying islands. Hydrol. Earth Syst. Sci. 2015, 19, 933–949. [Google Scholar] [CrossRef] [Green Version]
- Igel, J.; Günther, T.; Kuntzer, M. Ground-penetrating radar insight into a coastal aquifer: The freshwater lens of Borkum Island. Hydrol. Earth Syst. Sci. 2013, 17, 519–531. [Google Scholar] [CrossRef] [Green Version]
- Röper, T.; Greskowiak, J.; Freund, H.; Massmann, G. Freshwater lens formation below juvenile dunes on a barrier island (Spiekeroog, Northwest Germany). Estuar. Coast. Shelf Sci. 2013, 121–122, 40–50. [Google Scholar] [CrossRef]
- Vandenbohede, A.; Lebbe, L. Numerical modelling and hydrochemical characterisation of a fresh-water lens in the Belgian coastal plain. Hydrogeol. J. 2002, 10, 576–586. [Google Scholar] [CrossRef]
- Stoeckl, L.; Walther, M.; Graf, T. A new numerical benchmark of a freshwater lens. Water Resour. Res. 2016, 52, 2474–2489. [Google Scholar] [CrossRef] [Green Version]
- Werner, A.D.; Bakker, M.; Post, V.E.A.; Vandenbohede, A.; Lu, C.; Ataie-Ashtiani, B.; Simmons, C.T.; Barry, D.A. Seawater intrusion processes, investigation and management: Recent advances and future challenges. Adv. Water Resour. 2013, 51, 3–26. [Google Scholar] [CrossRef]
- Fidelibus, M.D.; Pulido, A.B. Groundwater Temperature as an Indicator of the Vulnerability of Karst Coastal Aquifers. Geosciences 2019, 9, 23. [Google Scholar] [CrossRef] [Green Version]
- DiFilippo, R.M. An Interdisciplinary Freshwater Lens Assessment Protocol for Karst Islands. Ph.D. Thesis, Water Engineering and Development Centre, School of Architecture, Building and Civil Engineering, Loughborough University, Loughborough, UK, 2020. [Google Scholar] [CrossRef]
- Foster, S.; Evans, R.; Escolero, O. The groundwater management plan: In praise of a neglected ‘tool of our trade’. Hydrogeol. J. 2015, 23, 847–850. [Google Scholar] [CrossRef]
- DiFilippo, R.M.; Bosher, L.; David, C.P. Freshwater Lens Assessment of Karst Island Water Resources-Towards an Inter-Disciplinary Protocol. Waterlines 2022, 41, 107–124. [Google Scholar] [CrossRef]
- Bakalowicz, M. Karst groundwater: A challenge for new resources. Hydrogeol. J. 2005, 13, 148–160. [Google Scholar] [CrossRef]
- Fetter, C.W., Jr. Position of the saline water interface beneath oceanic islands. Water Resour. Res. 1972, 8, 1307–1315. [Google Scholar] [CrossRef]
- Post, V.; Kooi, H.; Simmons, C. Using hydraulic head measurements in variable-density ground water flow analyses. Groundwater 2007, 45, 664–671. [Google Scholar] [CrossRef]
- Comte, J.-C.; Join, J.-L.; Banton, O.; Nicolini, E. Modelling the response of fresh groundwater to climate and vegetation changes in coral islands. Hydrogeol. J. 2014, 22, 1905–1920. [Google Scholar] [CrossRef]
- Ketabchi, H.; Mahmoodzadeh, D.; Ataie-Ashtiani, B.; Simmons, C.T. Sea-level rise impacts on seawater intrusion in coastal aquifers: Review and integration. J. Hydrol. 2016, 535, 235–255. [Google Scholar] [CrossRef]
- Hussain, M.S.; Abd-Elhamid, H.F.; Javadi, A.A.; Sherif, M.M. Management of seawater intrusion in coastal aquifers: A review. Water 2019, 11, 2467. [Google Scholar] [CrossRef] [Green Version]
- Ayers, J.F.; Vacher, H.L. Hydrogeology of an Atoll Island: A Conceptaul Model from Detailed Study of a Micronesian Example. Groundwater 1986, 24, 185–198. [Google Scholar] [CrossRef]
- Alberti, L.; La Licata, I.; Cantone, M. Saltwater intrusion and freshwater storage in sand sediments along the coastline: Hydrogeological investigations and groundwater modeling of Nauru island. Water 2017, 9, 788. [Google Scholar] [CrossRef] [Green Version]
- Gimenez, E.; Morell, I. Hydrogeochemical analysis of salinization processes in the coastal Aquifer of Oropesa (Castellon, Spain). Environ. Geol. 1997, 29, 118–131. [Google Scholar] [CrossRef]
- Morell, I.; Pulido-Bosch, A.; Sánchez-Martos, F.; Vallejos, A.; Daniele, L.; Molina, L.; Calaforra, J.M.; Francesc Roig, A.; Renau, A.; Renau, A. Characterization of the salinisation processes in aquifers using boron isotopes; application to south-eastern Spain. Water Air Soil Pollut. 2008, 187, 65–80. [Google Scholar] [CrossRef]
- Ha, K.; Lee, E.; An, H.; Kim, S.; Park, C.; Kim, G.B.; Ko, K.S. Evaluation of seasonal groundwater quality changes associated with groundwater pumping and level fluctuations in an agricultural area, Korea. Water 2020, 13, 51. [Google Scholar] [CrossRef]
- Lemieux, J.M.; Hassaoui, J.; Molson, J.; Therrien, R.; Therrien, P.; Chouteau, M.; Ouellet, M. Simulating the impact of climate change on the groundwater resources of the Magdalen Islands, Québec, Canada. J. Hydrol. Reg. Stud. 2015, 3, 400–423. [Google Scholar] [CrossRef] [Green Version]
- Werner, A.D. On the classification of seawater intrusion. J. Hydrol. 2016, 551, 619–631. [Google Scholar] [CrossRef] [Green Version]
- Zhang, D.; Yang, Y.; Wu, J.; Zheng, X.; Liu, G.; Sun, X.; Lin, J.; Wu, J. Global sensitivity analysis on a numerical model of seawater intrusion and its implications for coastal aquifer management: A case study in Dagu River Basin, Jiaozhou Bay, China. Hydrogeol. J. 2020, 28, 2543–2557. [Google Scholar] [CrossRef]
- Shi, W.; Lu, C.; Werner, A.D. Assessment of the impact of sea-level rise on seawater intrusion in sloping confined coastal aquifers. J. Hydrol. 2020, 586, 124872. [Google Scholar] [CrossRef]
- Kim, J.H.; Lee, J.; Cheong, T.J.; Kim, R.H.; Koh, D.C.; Ryu, J.S.; Chang, H.W. Use of time series analysis for the identification of tidal effect on groundwater in the coastal area of Kimje, Korea. J. Hydrol. 2005, 300, 188–198. [Google Scholar] [CrossRef]
- White, I.; Falkland, T.; Perez, P.; Dray, A.; Metutera, T.; Metai, E.; Overmars, M. Challenges in freshwater management in low coral atolls. J. Clean. Prod. 2007, 15, 1522–1528. [Google Scholar] [CrossRef]
- Liu, Y.; Shang, S.-h.; Mao, X.-m. Tidal effects on groundwater dynamics in coastal aquifer under different beach slopes. J. Hydrodyn. 2012, 24, 97–106. [Google Scholar] [CrossRef]
- Hayes, M.O. Barrier island morphology as a function of tidaland wave regime. In Barrier Islands; Leatherman, S.P., Ed.; Academic Press: New York, NY, USA, 1979. [Google Scholar]
- Dong, L.; Shimada, J.; Kagabu, M.; Yang, H. Barometric and tidal-induced aquifer water level fluctuation near the Ariake Sea. Environ. Monit. Assess. 2015, 187, 4187. [Google Scholar] [CrossRef] [PubMed]
- Chen, Y.; Gan, M.; Pan, S.; Pan, H.; Zhu, X.; Tao, Z. Application of auto-regressive (AR) analysis to improve short-term prediction of water levels in the Yangtze estuary. J. Hydrol. 2020, 590, 125386. [Google Scholar] [CrossRef]
- Tulipano, L.; Fidelibus, M.D. Temperature of groundwaters in coastal aquifers; some aspects concerning salt-water intrusion. In Proceedings of the SWIM10: 10th Salt-Water Intrusion Meeting, Ghent, Belgium, 16–20 May 1988; Volume 70, pp. 1–4, 308–316. [Google Scholar]
- Nguyen, T.T.; Yu, X.; Pu, L.; Xin, P.; Zhang, C.; Barry, D.A.; Li, L. Effects of temperature on tidally influenced coastal unconfined aquifers. Water Resour. Res. 2020, 56, e2019WR026660. [Google Scholar] [CrossRef]
- Blanco-Coronas, A.M.; Duque, C.; Calvache, M.L.; López-Chicano, M. Temperature distribution in coastal aquifers: Insights from groundwater modeling and field data. J. Hydrol. 2021, 603, 126912. [Google Scholar] [CrossRef]
- Nunn, P.D. Responding to the challenges of climate change in the Pacific Islands: Management and technological imperatives. Clim. Res. 2009, 40, 211–231. [Google Scholar] [CrossRef]
- Eslami, S.; Hoekstra, P.; Kernkamp, H.W.; Nguyen Trung, N.; Do Duc, D.; Nguyen Nghia, H.; Tran Quang, T.; Van Dam, A.; Darby, S.E.; Parsons, D.R.; et al. Dynamics of salt intrusion in the Mekong Delta: Results of field observations and integrated coastal–inland modelling. Earth Surf. Dyn. 2021, 9, 953–976. [Google Scholar] [CrossRef]
- Werner, A.D.; Sharp, H.K.; Galvis, S.C.; Post, V.E.; Sinclair, P. Hydrogeology and management of freshwater lenses on atoll islands: Review of current knowledge and research needs. J. Hydrol. 2017, 551, 819–844. [Google Scholar] [CrossRef]
- Werner, A.D.; Gallagher, M.R. Characterisation of sea-water intrusion in the Pioneer Valley, Australia using hydrochemistry and three-dimensional numerical modelling. Hydrogeol. J. 2006, 14, 1452–1469. [Google Scholar] [CrossRef]
- Bailey, R.T.; Khalil, A.; Chatikavanij, V. Estimating current and future groundwater resources of the maldives. J. Am. Water Resour. Assoc. 2015, 51, 112–122. [Google Scholar] [CrossRef]
- Sales, R.F.M. Vulnerability and adaptation of coastal communities to climate variability and sea-level rise: Their implications for integrated coastal management in Cavite City, Philippines. Ocean Coast. Manag. 2009, 52, 395–404. [Google Scholar] [CrossRef]
- Cruz, R.V.O. Philippine Climate Change Assessment; The Japan Scientists’ Association: Tokyo, Japan, 2017; Volume 42, pp. 198–203. Available online: http://ci.nii.ac.jp/naid/40015386704/ (accessed on 1 October 2019).
- Haq, M.A. CDLSTM: A novel model for climate change forecasting. Comput. Mater. Contin. 2022, 71, 2363–2381. [Google Scholar]
- Praveen, B.; Talukdar, S.; Mahato, S.; Mondal, J.; Sharma, P.; Islam, A.R.M.; Rahman, A. Analyzing trend and forecasting of rainfall changes in India using non-parametrical and machine learning approaches. Sci. Rep. 2020, 10, 10342. [Google Scholar] [CrossRef]
- Kuttippurath, J.; Murasingh, S.; Stott, P.A.; Sarojini, B.B.; Jha, M.K.; Kumar, P.; Nair, P.J.; Varikoden, H.; Raj, S.; Francis, P.A.; et al. Observed rainfall changes in the past century (1901–2019) over the wettest place on Earth. Environ. Res. Lett. 2021, 16, 024018. [Google Scholar] [CrossRef]
- Buckley, S.J.; Schwarz, E.; Terlaky, V.; Howell, J.A.; Arnott, R.W. Combining Aerial Photogrammetry and Terrestrial Lidar for Reservoir Analog Modeling. Photogramm. Eng. Remote Sens. 2010, 76, 953–963. [Google Scholar] [CrossRef]
- Fairbridge, R.W.; Bourgeois, W. Encyclopedia of Sedimentology; Springer: Berlin/Heidelberg, Germany, 2006. [Google Scholar]
- Cawood, A.J.; Bond, C.E.; Howell, J.A.; Butler, R.W.; Totake, Y. LiDAR, UAV or compass-clinometer? Accuracy, coverage and the effects on structural models. J. Struct. Geol. 2017, 98, 67–82. [Google Scholar] [CrossRef]
- Moudrý, V.; Gdulová, K.; Fogl, M.; Klápště, P.; Urban, R.; Komárek, J.; Moudrá, L.; Štroner, M.; Barták, V.; Solský, M. Comparison of leaf-off and leaf-on combined UAV imagery and airborne LiDAR for assessment of a post-mining site terrain and vegetation structure: Prospects for monitoring hazards and restoration success. Appl. Geogr. 2019, 104, 32–41. [Google Scholar] [CrossRef]
- Saunders, M.; Lewis, P.; Thornhill, A. Research Methods for Business Students, 5th ed.; Pearson Education: London, UK, 2009. [Google Scholar]
- Egbinola, C.N.; Amanambu, A.C. Groundwater contamination in Ibadan, south-west Nigeria. SpringerPlus 2014, 3, 448. [Google Scholar] [CrossRef]
- Okotto, L.; Okotto-Okotto, J.; Price, H.; Pedley, S.; Wright, J. Socio-economic aspects of domestic groundwater consumption, vending and use in Kisumu, Kenya. Appl. Geogr. 2015, 58, 189–197. [Google Scholar] [CrossRef]
- Webler, T.; Kastenholz, H.; Renn, O. Public Participation in Impact Assessment: A Social Learning Perspective. Environ. Impact Assess. Rev. 1995, 15, 443–463. [Google Scholar] [CrossRef]
- Pahl-Wostl, C. Towards sustainability in the water sector—The importance of human actors and processes of social learning. Aquat. Sci. 2002, 64, 394–411. [Google Scholar] [CrossRef]
- Boeije, H. A Purposeful Approach to the Constant Comparative Method in the Analysis of Qualitative Interviews. Qual. Quant. 2002, 36, 391–409. [Google Scholar] [CrossRef]
- O’Keeffe, J.; Buytaert, W.; Mijic, A.; Brozovic, N.; Sinha, R. The use of semi-structured interviews for the characterisation of farmer irrigation practices. Hydrol. Earth Syst. Sci. 2016, 20, 1911–1924. [Google Scholar] [CrossRef] [Green Version]
- Ceola, S.; Montanari, A.; Krueger, T.; Dyer, F.; Kreibich, H.; Westerberg, I.; Carr, G.; Cudennec, C.; Elshorbagy, A.; Savenije, H.; et al. Adaptation of water resources systems to changing society and environment: A statement by the International Association of Hydrological Sciences. Hydrol. Sci. J. 2016, 61, 2803–2817. [Google Scholar] [CrossRef] [Green Version]
- Van der Wal, M.; De Kraker, J.; Offermans, A.; Kroeze, C.; Kirschner, P.A.; Van Ittersum, M. Measuring social learning in participatory approaches to natural resource management. Environ. Policy Gov. 2014, 24, 1–15. [Google Scholar] [CrossRef]
- Holt, T.; Greskowiak, J.; Seibert, S.L.; Massmann, G. Modeling the evolution of a Ferwshwater Lens under Highly Dynamic Conditions on a Currently Developing Barrier Island. Geofluids 2019, 2019, 9484657. [Google Scholar] [CrossRef] [Green Version]
- Kura, N.U.; Ramli, M.F.; Ibrahim, S.; Sulaiman, W.N.A.; Aris, A.Z.; Tanko, A.I.; Zaudi, M.A. Assessment of groundwater vulnerability to anthropogenic pollution and seawater intrusion in a small tropical island using index-based methods. Environ. Sci. Pollut. Res. 2014, 22, 1512–1533. [Google Scholar] [CrossRef]
- Briones, N.D. Environmental sustainability issues in Philippine agriculture. Asian J. Agric. Dev. 2005, 2, 67–78. [Google Scholar] [CrossRef]
- Brill, D.; May, S.M.; Engel, M.; Reyes, M.; Pint, A.; Opitz, S.; Dierick, M.; Gonzalo, L.A.; Esser, S.; Brückner, H. Typhoon Haiyan’s sedimentary record in coastal environments of the Philippines and its palaeotempestological implications. Nat. Hazards Earth Syst. Sci. 2016, 16, 2799–2822. [Google Scholar] [CrossRef] [Green Version]
- Philippine Statistics Authority. The Philippine Statistical Development Program (PSDP); National Statistical Coordination Board (NSCB): Makati City, Philippines, 2013. Available online: https://psa.gov.ph/philippine-statistical-system/psdp (accessed on 1 October 2019).
- Cuadra, C.; Biton, N.I.; Cabacaba, K.M.; Santiago, J.; Suarez, J.K.; Lapidez, J.P.; Mahar, A. Project NOAH Open-File Reports Development of Inundation Map for Bantayan Island, Cebu Using Delft3D- Flow Storm Surge Simulations of 480. Typhoon Haiyan 2014, 3, 37–44. [Google Scholar]
- On-Line Reference. Available online: tideschart.com (accessed on 16 November 2022).
- PIDS. Basics on Philippine climatology. In Economic Issue of the Day; PIDS: Quezon City, Philippines, 2005; Volume 5. [Google Scholar]
- Werner, A.D.; Simmons, C.T. Impact of sea-level rise on sea water intrusion in coastal aquifers. Groundwater 2009, 47, 197–204. [Google Scholar] [CrossRef] [PubMed]
- Allen, L.; Bennett, T.; Lehr, J.H.; Petty, R.J.; Hackett, G. DRASTIC: A Standardized System for Evaluating Groundwater Pollution Potential Using Hydrogeological Settings; US Environmental Protection Agency: Ada, OK, USA, 1987. [Google Scholar]
- Foster, S.S.; Hirata, R.C.A. Groundwater Pollution Risk Assessment: A Methodology Using Available Data; CEPIS: Lima, Peru, 1988; p. 86. [Google Scholar]
- Stempvoort, D.V.; Ewert, L.; Wassenaar, L. Aquifer vulnerability index: A GIS-compatible method for groundwater vulnerability mapping. Can. Water Resour. J. 1993, 18, 25–37. [Google Scholar] [CrossRef] [Green Version]
- Civita, M. Le carte della Vulnerabilità degli Acquiferi All’inquinamento: Teoria e Pratica; Pitagora: Bologna, Italy, 1994. [Google Scholar]
- Doerfliger, N.; Jeannin, P.Y.; Zwahlen, F. Water vulnerability assessment in karst environments: A new method of defining protection areas using a multi-attribute approach and GIS tools (EPIK method). Environ. Geol. 1999, 39, 165–176. [Google Scholar] [CrossRef] [Green Version]
- Vías, J.M.; Andreo, B.; Perles, M.J.; Carrasco, F.; Vadillo, I.; Jiménez, P. Proposed method for groundwater vulnerability mapping in carbonate (karstic) aquifers: The COP method. Hydrogeol. J. 2006, 14, 912–925. [Google Scholar] [CrossRef]
Figure 1.
FLAP: Research Data Acquisition [15].
Figure 1.
FLAP: Research Data Acquisition [15].

Figure 2.
Vulnerability Indicator Assessment Framework with primary variables in light green (static) and dark yellow (dynamic) [15].
Figure 2.
Vulnerability Indicator Assessment Framework with primary variables in light green (static) and dark yellow (dynamic) [15].

Figure 3.
Satellite image: Philippines, Archipelago and Bantayan Island [15].
Figure 3.
Satellite image: Philippines, Archipelago and Bantayan Island [15].

Figure 4.
Climate map of the Philippines based on the Modified Coronas Classification (PIDS, 2005) [72].
Figure 4.
Climate map of the Philippines based on the Modified Coronas Classification (PIDS, 2005) [72].

Figure 5.
Geologic and Structural Geology Map, Bantayan Island, Cebu Province, Philippines [15].
Figure 5.
Geologic and Structural Geology Map, Bantayan Island, Cebu Province, Philippines [15].


Table 1.
FLAP Interdisciplinary Resource Matrix.
| Discipline | Activity | Output | Data Type | Data Source |
|---|---|---|---|---|
| Geoscience | Geo-characterization [1,2,13,18,19,20,21,22,23] | Geo-cognitive knowledge | Qualitative/ quantitative | Geology, physiography and hydrogeology |
| Groundwater assessment [24,25,26,27,28,29] | Hydrochemistry | Quantitative | Ion concentrations | |
| Hydrogeologic assessment [14,30,31,32] | Groundwater flow | Quantitative/ qualitative | Gradient maps | |
| Tidal study [33,34,35,36,37,38] | Tidal influence analysis | Quantitative/ qualitative | Tidal influence map | |
| Groundwater temperature study [39,40,41] | Groundwater flow analysis | Quantitative/ qualitative | Temperature gradient map | |
| Island-wide observational model [25,42,43] | Groundwater balance | Quantitative | GW resource assessment | |
| Freshwater lens thickness | Quantitative/ qualitative | Freshwater lens profile map | ||
| Meteorology | Climate [44,45,46,47,48,49,50,51] | Recharge determination | Quantitative | Precipitation and temp data |
| GIS specialist | Land survey [52,53,54,55] | DGPS survey | Quantitative | LiDAR and DEM |
| Social Science | Well owner Questionnaire [56,57,58] | Questionnaire data sets | Quantitative/ qualitative | Local water usage, impact assessment on climate |
| Semi-structured Interviews [59,60,61,62,63,64] | Transcribed interviews | Qualitative | Themes and perspectives on water resource policy |
Publisher’s Note: MDPI stays neutral with regard to jurisdictional claims in published maps and institutional affiliations. |
© 2022 by the authors. Licensee MDPI, Basel, Switzerland. This article is an open access article distributed under the terms and conditions of the Creative Commons Attribution (CC BY) license (https://creativecommons.org/licenses/by/4.0/).
Share and Cite
MDPI and ACS Style
DiFilippo, R.M.; David, C.P.; Bosher, L. Groundwater Vulnerability Indicator Assessment of Karst Island Water Resources: Enhancement of the Freshwater Lens Assessment Protocol. Water 2022, 14, 4071. https://doi.org/10.3390/w14244071
AMA Style
DiFilippo RM, David CP, Bosher L. Groundwater Vulnerability Indicator Assessment of Karst Island Water Resources: Enhancement of the Freshwater Lens Assessment Protocol. Water. 2022; 14(24):4071. https://doi.org/10.3390/w14244071
Chicago/Turabian StyleDiFilippo, Robert Michael, Carlos Primo David, and Lee Bosher. 2022. "Groundwater Vulnerability Indicator Assessment of Karst Island Water Resources: Enhancement of the Freshwater Lens Assessment Protocol" Water 14, no. 24: 4071. https://doi.org/10.3390/w14244071
Note that from the first issue of 2016, this journal uses article numbers instead of page numbers. See further details here.