Article

Experimental Investigation of Uniaxial Compressive Strength of Distilled Water Ice at Different Growth Temperatures

School of Naval Architecture, Ocean and Energy Power Engineering, Wuhan University of Technology, Wuhan 430063, China
*
Author to whom correspondence should be addressed.
Water 2022, 14(24), 4079; https://doi.org/10.3390/w14244079
Submission received: 12 November 2022 / Revised: 2 December 2022 / Accepted: 11 December 2022 / Published: 14 December 2022
(This article belongs to the Special Issue Sea, River, Lake Ice Properties and Their Applications in Practices)

Abstract

:
The existence of ice in nature will threaten the safety of navigation and water operations in cold regions. In order to improve the knowledge system of ice strength, the uniaxial compressive strength of distilled water ice grown at different temperatures is studied in this paper. Distilled water ice samples grown at −5 °C, −10 °C, −15 °C, −20 °C, −25 °C, −30 °C and −35 °C are prepared in the cryogenic laboratory. The density and grain size are measured. The uniaxial compressive strength tests are carried out at −10 °C. The stress-strain curves and the mechanical properties and failure modes of ice are obtained by loading along the vertical direction in the strain rate range of 10−6 s−1 to 10−2 s−1. It is found that the uniaxial compressive strength of ice is a power function of strain rate and a linear relationship with the −1/2 power of grain size. Combined with the relationship between strength and grain size and the relationship between grain size and temperature, it is deduced that the peak compressive strength has a logarithmic relationship with the growth temperature. In addition, it shows that the growth temperature affects the strength of ice by controlling the grain size.

1. Introduction

Ice can be regarded as a composite material with a complex internal structure [1]. Its mechanical properties have been widely studied [2,3]. The driving force of the research lies in the development of the oil and natural gas industry, the construction and operation of hydropower equipment and the design of ice breakers, offshore platforms and other structures. The purpose is to predict the maximum ice load acting on these structures and ensure the safety of maritime operations in cold regions. In icy waters, different failure modes such as compression, buckling and radial cracking will occur in the ice interaction with ships, oil and gas platforms and coastal buildings [4,5]. These failure modes mainly involve the mechanical properties of ice, such as compressive strength, bending strength and shear strength [6,7,8]. Compression is one of the main failure modes when ice interacts with vertical structures, and the ice compressive strength is a key parameter in the calculation of ice load [9,10,11]. Moreover, the ice compressive strength is also an important factor affecting the dynamic process and deformation characteristics of ice at the geophysical scale [12].
In the compressive strength test, the loading rate that determines the strain rate is an important external factor affecting the strength of ice. Generally, the mechanical properties and failure modes of ice under different strain rates are also different [13]. Jones [14] carried out compression tests on single crystal ice in the temperature range as low as −90 °C and discussed the stress dependence of strain rate. Wu [15] studied the dynamic response of lake ice and distilled water ice under dynamic uniaxial compression. The uniaxial compressive strength shows positive strain rate sensitivity in the selected high strain rate range 60–800 s−1. Kim indicated that the uniaxial compressive strength of ice is almost constant when the strain rate is high enough [16]. Timco and Frederking [17] studied the mechanical properties of freshwater ice and summarized the quantitative expressions of compressive strength and strain rate of ice in a ductile regime. Bonath, Sinha and Chen also discussed the relationship between strain rate and stress for different types of ice [18,19,20]. A series of studies have shown that the maximum compressive strength of ice appears in a special strain rate range, under which ice performs a transition state from ductility to brittleness, which is called the ductile-to-brittle transition regime. Qi’s results show that the ductile-to-brittle transition regime appears in the strain rate range of 10−4 s−1 to 10−3 s−1 [21]. However, some studies found that the compressive strength reaches a maximum at a larger strain rate. Deng [22] found that the ductile-to-brittle transition regime of ice at the test temperature of −18 °C was in the range of 10−4 s−1 to 10−2 s−1 through a uniaxial compression test. Schulson [23] obtained the peak compressive strength at the strain rate of 10−2 s−1.
The crystallization process of water will be different under different external conditions such as pressure and temperature, resulting in different structures of ice crystals. Crystals with the same structure are affected by the environment, which leads to diverse grain sizes [24,25]. Schulson [26] measured the uniaxial compressive strength of granular ice with different grain sizes and obtained that the brittle strength is related to the power exponent of grain diameter. Iliescu [27] investigated the relationship between the grain structure and the mechanical behavior of seasonal lake ice and river ice. The grain structure and the resulting mechanical properties change with the thickness of the ice. Cole’s research results are different from others, which show that the compressive strength of ice increases with the increase in particle size at a low strain rate [28]. Moreover, during the formation of ice, air may not be discharged in time, so it is limited to forming bubbles inside. Due to the salt content of seawater, there may also be brine cells in sea ice, forming ice with different porosity, density and salinity. Many studies have shown that natural defects such as bubbles have a significant impact on the uniaxial compressive strength of the ice, and the higher the air content, the lower the compressive strength of ice [29,30,31]. Han [32] found that the uniaxial compressive strength of Arctic summer sea ice decreases linearly with the increase in porosity. Timco and Frederking [33] indicated that the uniaxial compressive strength in the vertical direction will be lost when the porosity of sea ice reaches 200‰ and the uniaxial compressive strength in the horizontal direction will be lost when the porosity reaches 270‰.
Ice temperature is another important factor affecting the uniaxial compressive strength of ice [34,35]. Arakawa [36] conducted uniaxial compressive strength tests on polycrystalline ice and discussed the relationship between strength and temperature and strain rate. With the decrease in temperature and the increase in strain rate, the structural strength of ice increases systematically. Wu [37] found that the compressive strength of ice increases with the decrease in temperature, but when the temperature decreases to a certain extent, the strength almost remains unchanged. However, the research on the effect of temperature on compressive strength mainly focuses on the test temperature at present. In the process of ice growth, the heat exchange with the atmosphere and water will also affect the strength of ice. The strength in the early stage of ice formation in cold waters greatly affects the safety of ship navigation and structures. In this study, the freezing process of distilled water ice and the preparation of test samples were carried out in the cryogenic laboratory. The density, crystal structure and grain size of ice condensed at different growth temperatures were measured. The relationship between the compressive strength at the initial stage of freezing and the growth temperature was systematically discussed under laboratory conditions. At present, there are few studies on the effect of growth temperature on the compressive strength of ice. The purpose of this study is to summarize the relationship between the compressive strength of ice and growth temperature and conduct further supplementary research on the mechanical properties of ice.

2. Methods

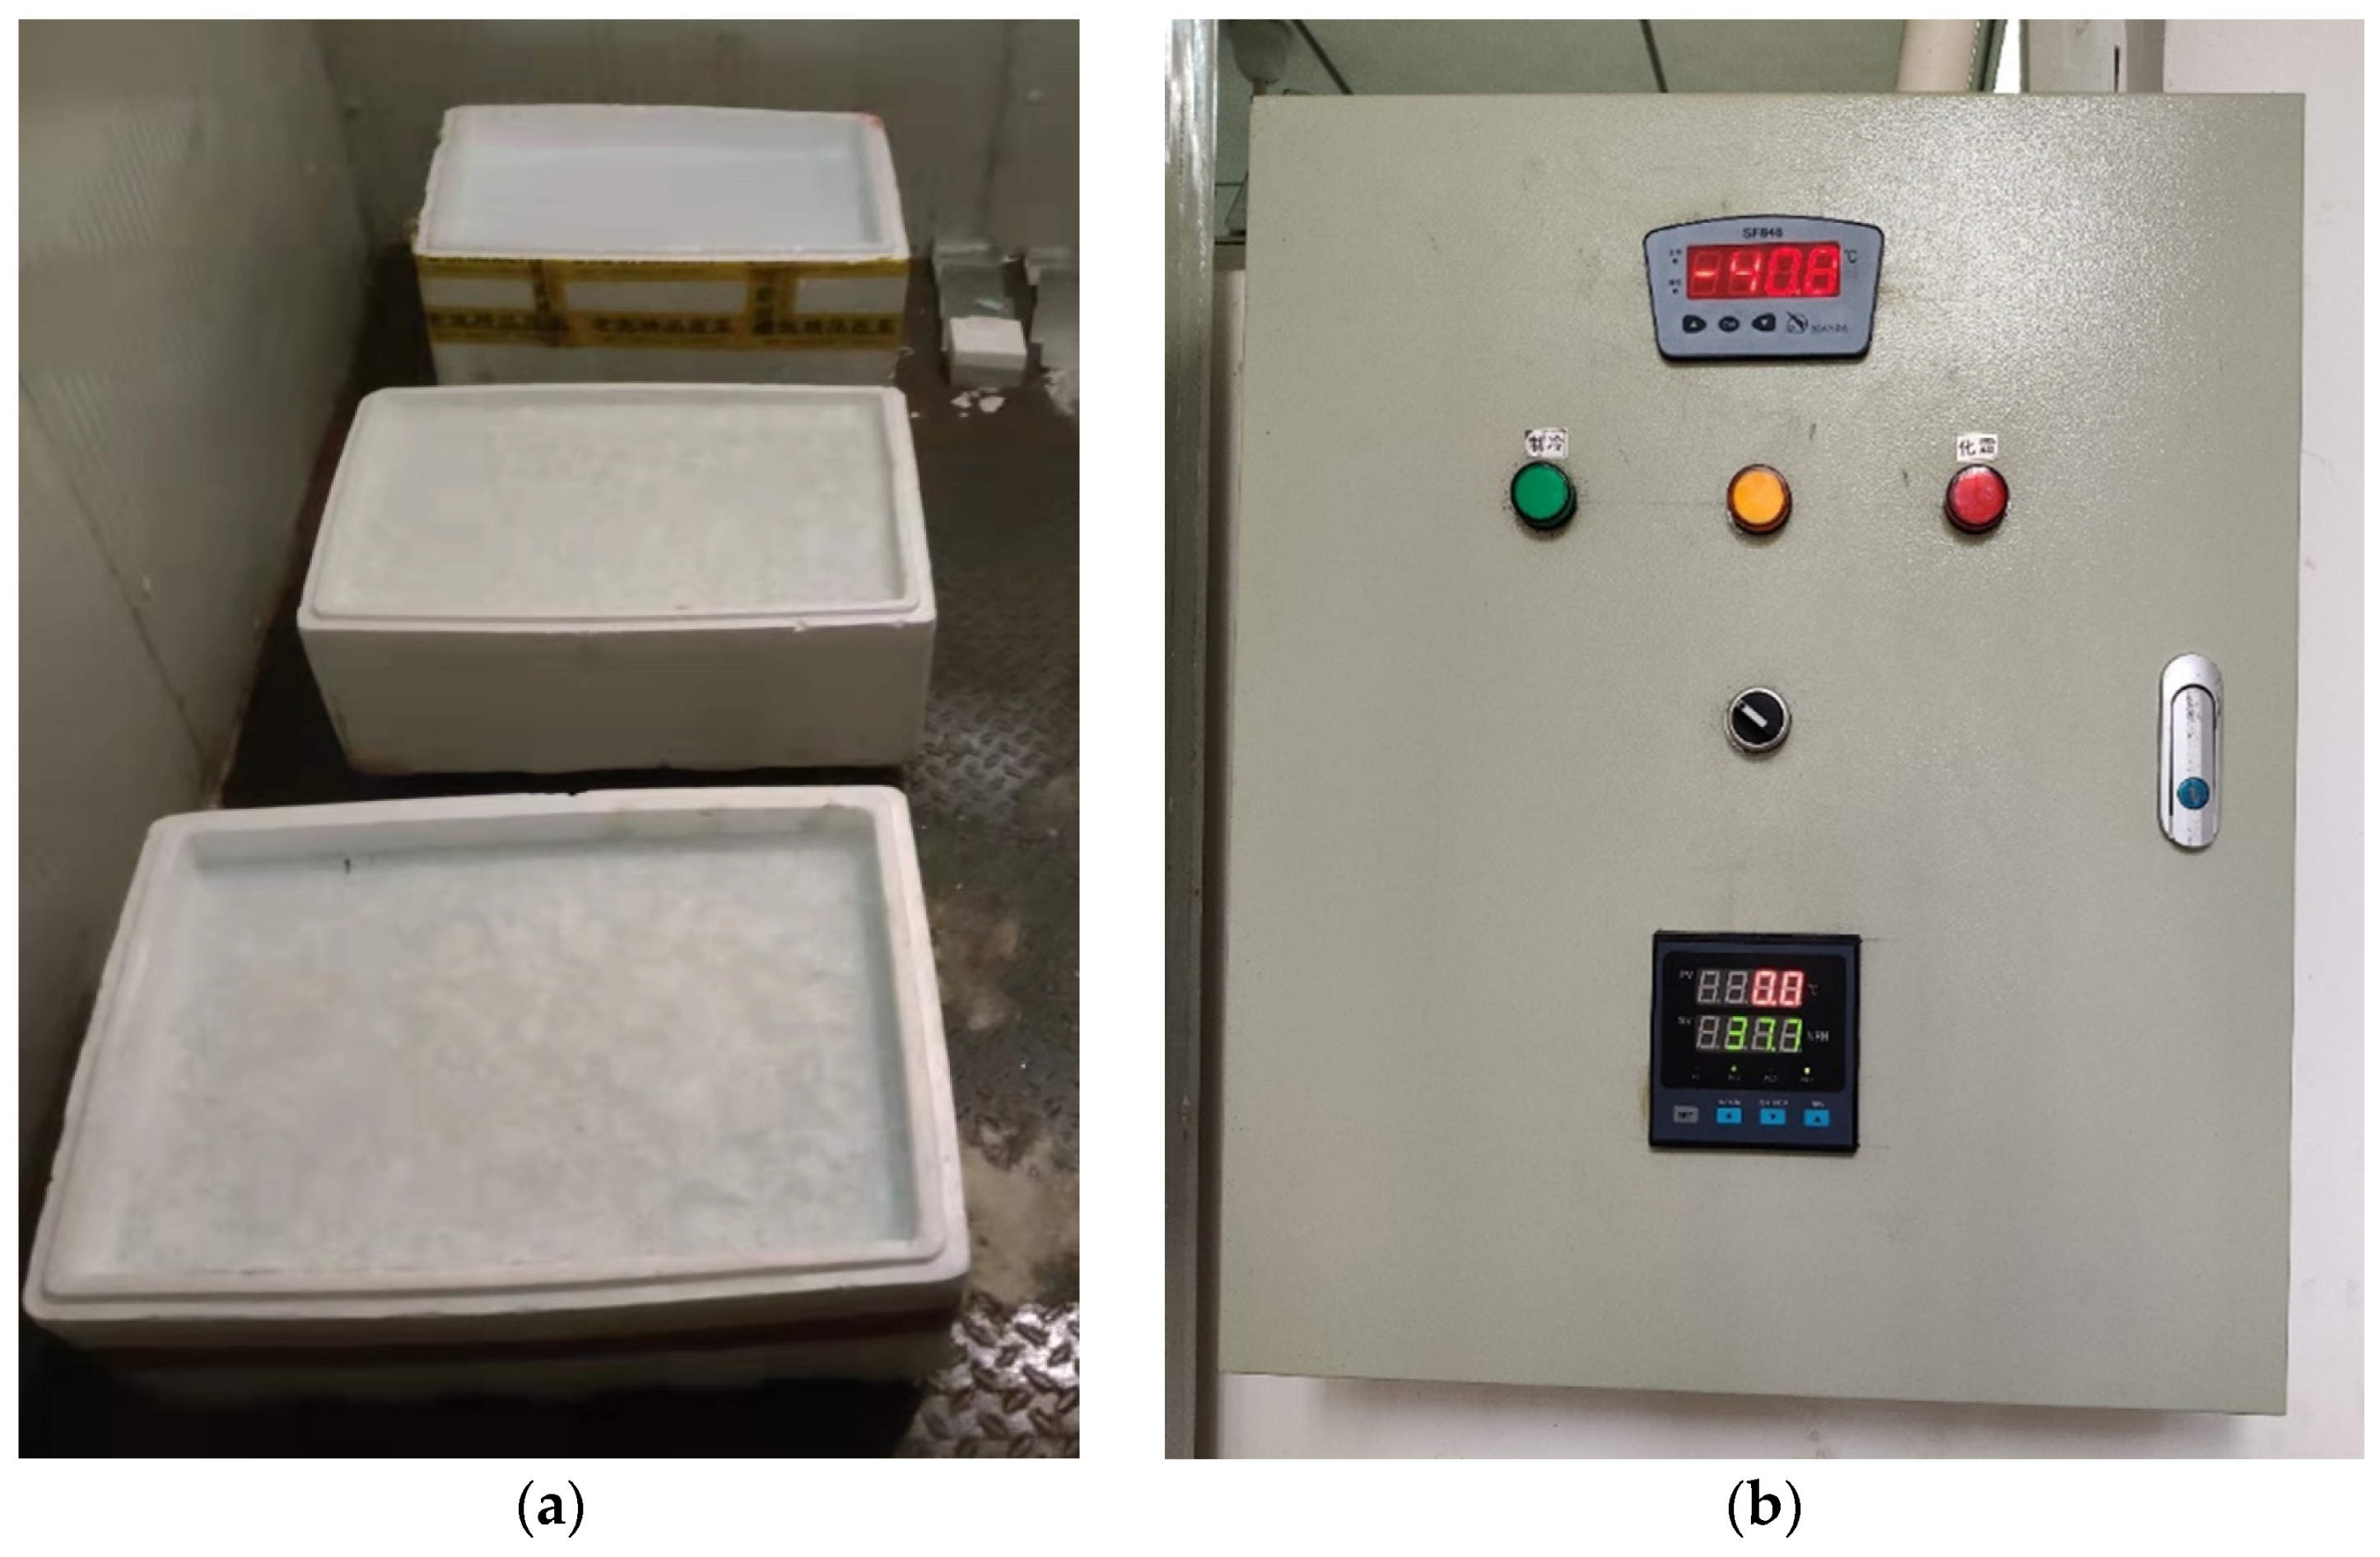
2.1. Preparation of Distilled Water Ice and Test Ice Samples

Distilled water ice was prepared in a cryogenic laboratory. The lowest ambient temperature of the cryogenic laboratory can be reduced to −40 °C. The temperature control accuracy is 0.1 °C. In order to study the effect of growth temperature on ice structural strength, the temperature of the cryogenic laboratory during ice making was set to −5 °C, −10 °C, −15 °C, −20 °C, −25 °C, −30 °C and −35 °C, respectively. The foam boxes with a length of 600 mm, a width of 450 mm and a depth of 300 mm were selected as the condensation tanks. The reason is that when water condensed in the box, the heat exchange intensity of the part close to the box was large, resulting in the growth of ice from the edge of the box to the middle. The smaller thermal conductivity of plastic foam leads to a smaller growth trend from the edge, which ensures that ice grows from top to bottom as in the natural environment. When sampling, an electric chain saw was used for cutting and taking out the distilled water ice in the middle of the box. Ice preparation and cryogenic laboratory temperature control panel are shown in Figure 1.
Preparation of the samples was also carried out in the cryogenic laboratory. According to the recommendations of the IAHR (International Association for Hydro-Environment Engineering and Research) [38], the upper and lower section dimensions of the ice uniaxial compressive strength test specimen are square with a side length of 7–10 cm (or circle with a diameter of 7–10 cm), and the length of the specimen is 2.5 times of the side length. The test samples were uniformly processed into 7 cm × 7 cm × 17.5 cm standard cuboids by a cutting machine. In order to prevent the samples from sticking together and weathering due to the continuous blowing of the laboratory, they were packed in plastic bags. The prepared samples needed to be kept at a constant temperature in the incubator for more than 24 h before the test, so that the samples can fully reach thermal equilibrium. In order to avoid the influence of ambient temperature on compressive strength and better study the relationship between growth temperature and compressive strength, the storage temperature and test temperature were both set to −10 °C. Test sample preparation is shown in Figure 2.

2.2. Physical Properties Measurement

2.2.1. Ice Density Measurement and Porosity Calculation

In this study, the ice density was measured by the mass volume method. Standard cuboid samples with a size of 10 cm × 10 cm × 5 cm were processed by a cutting machine, of which 5 cm is along the direction of ice thickness. The exact length, width and thickness of the samples were measured by the vernier caliper many times and the volumes were calculated. The mass of the samples was weighed with an electronic scale, and the ratio of mass to volume is the ice density. Ice porosity is the sum of brine volume fraction ν b and air volume fraction ν a . Cox has derived empirical formulas for the volume fraction of air and brine from the temperature, salinity and density of sea ice as follows [39]:
ν a = 1 ρ ρ i + ρ S F 2 ( T ) F 1 ( T )
ν b = ρ S F 1 ( T )    
ρ i = 0.917 1.403 × 10 4 T
where ρ is ice density (g/cm3); S is salinity (‰); T is ice temperature (°C); ρ i is the density of pure ice (g/cm3); F 1 ( T ) and F 2 ( T ) are cubic polynomials about temperature. The research object of this study is distilled water ice with a salinity of 0, thus the porosity is the air volume fraction. Equation (1) can be simplified as:
ν T = ν a = 1 ρ ρ i

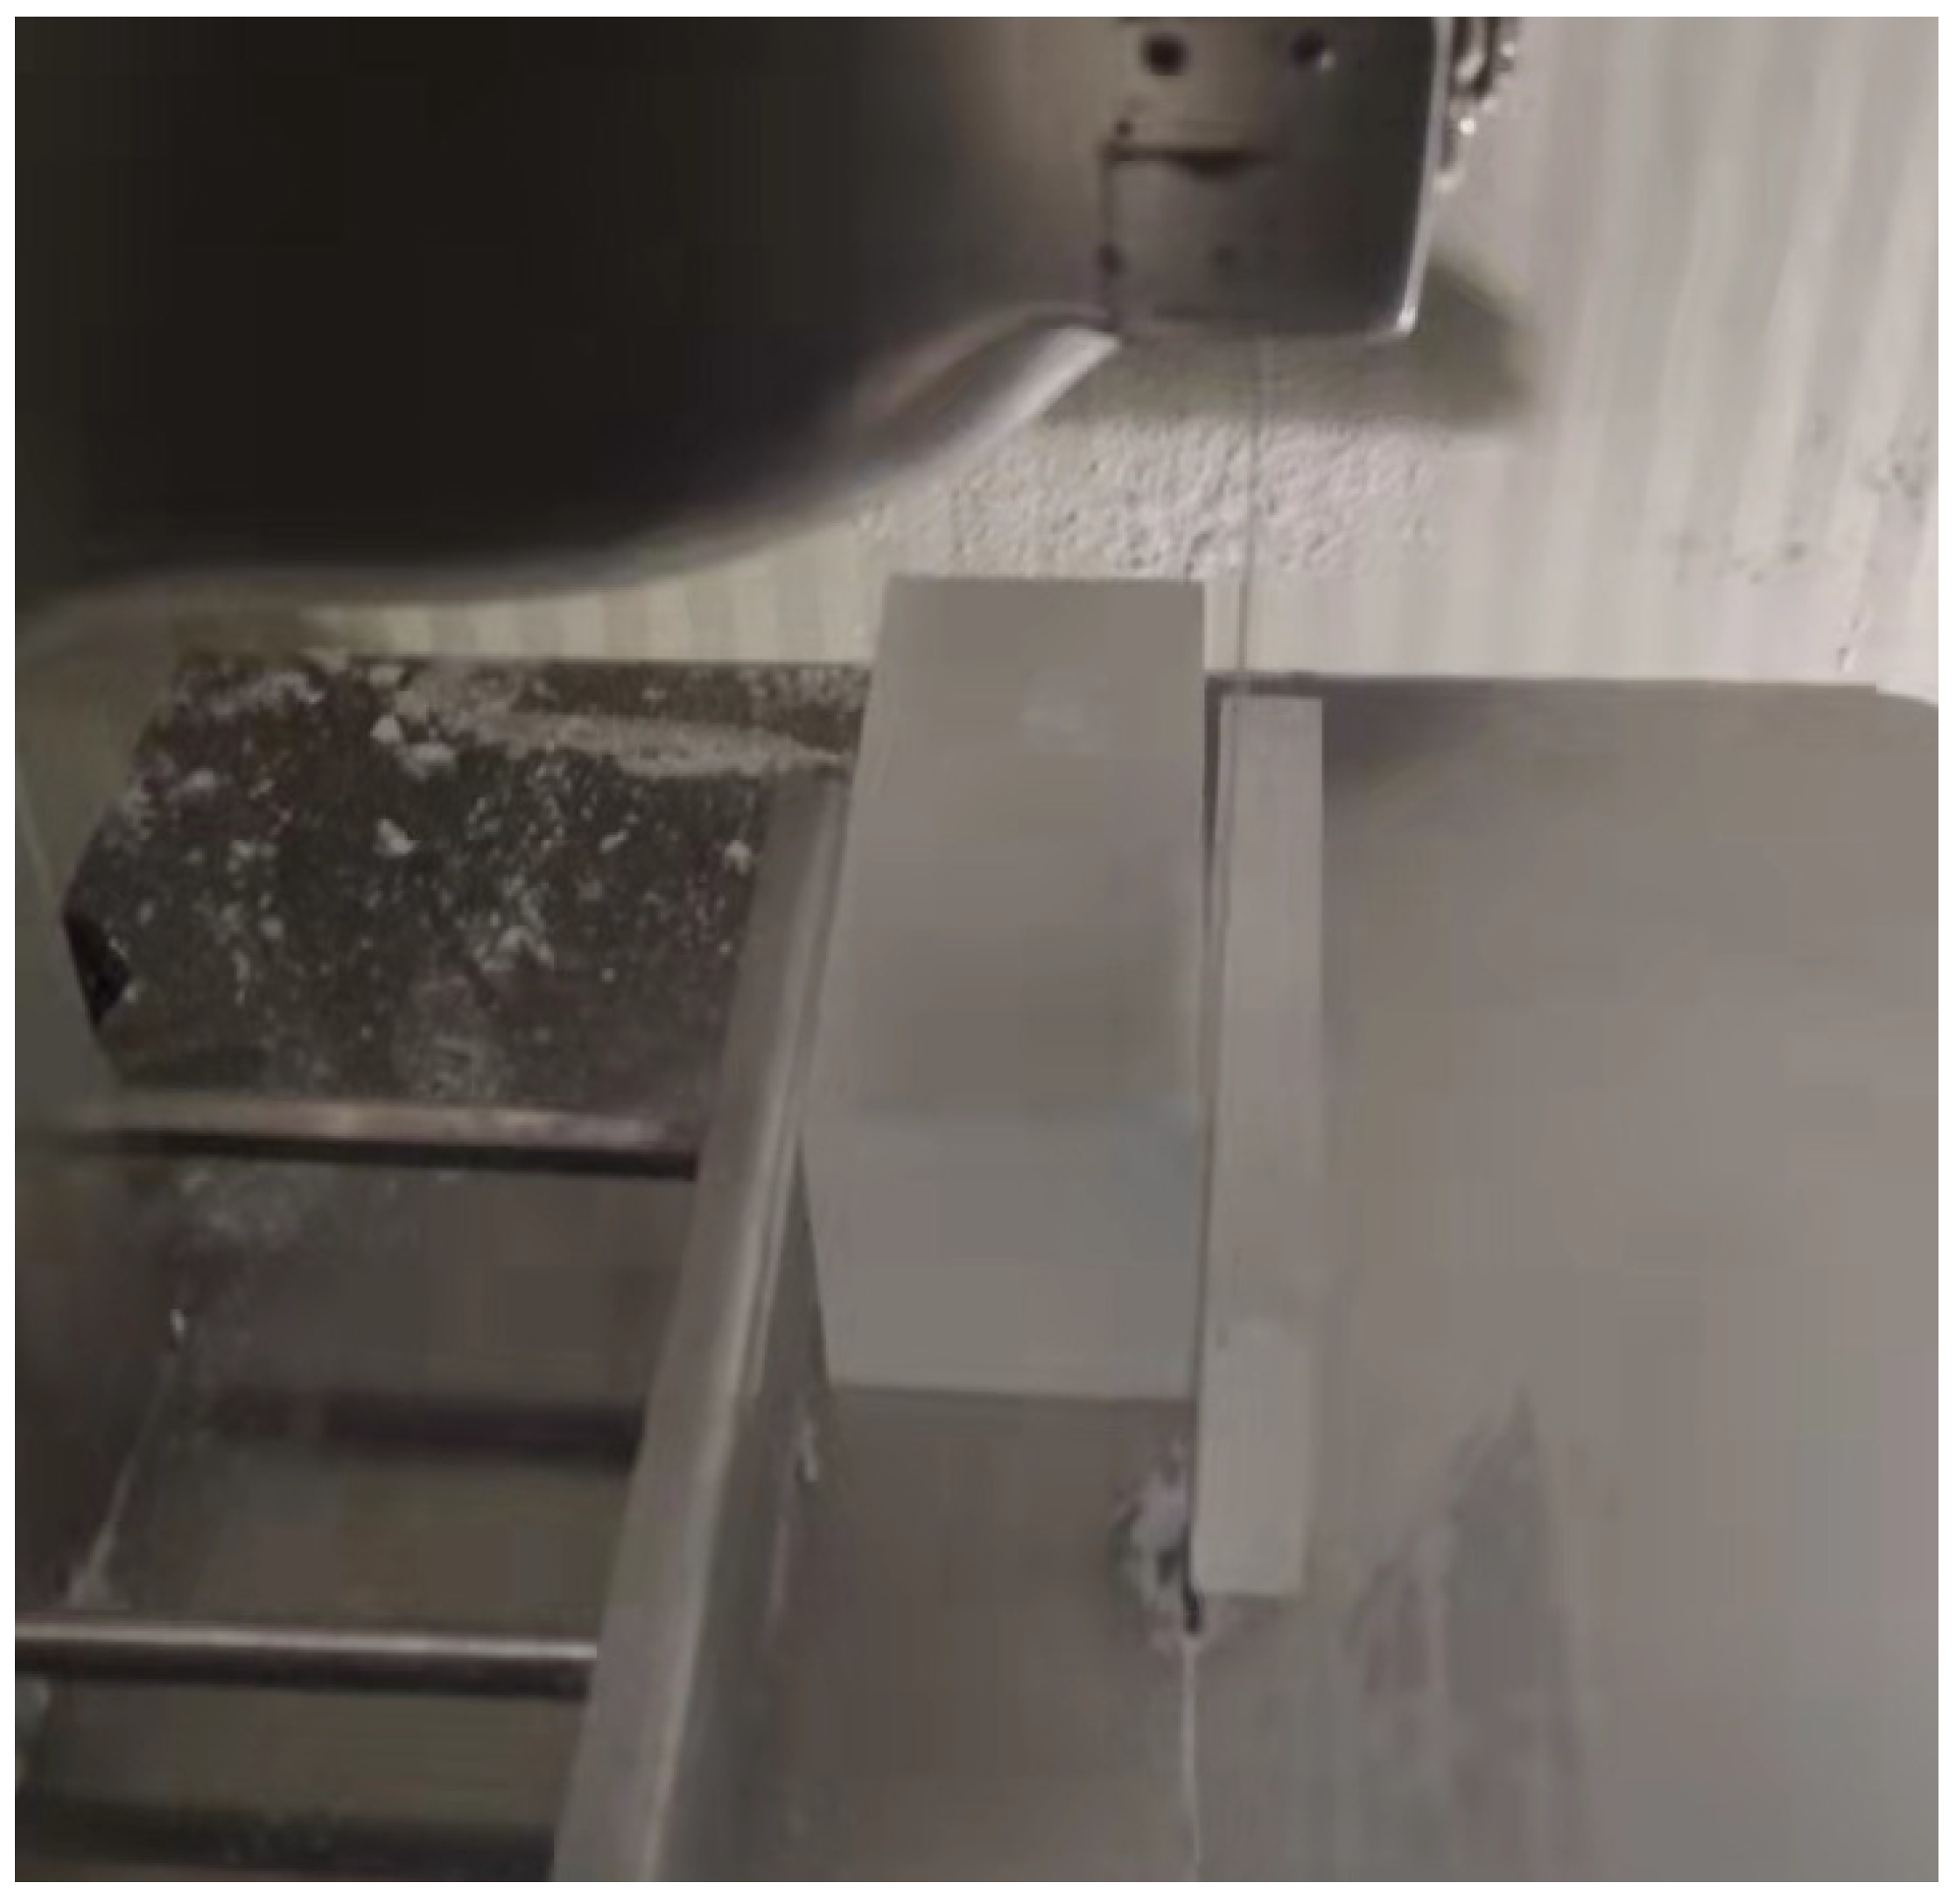
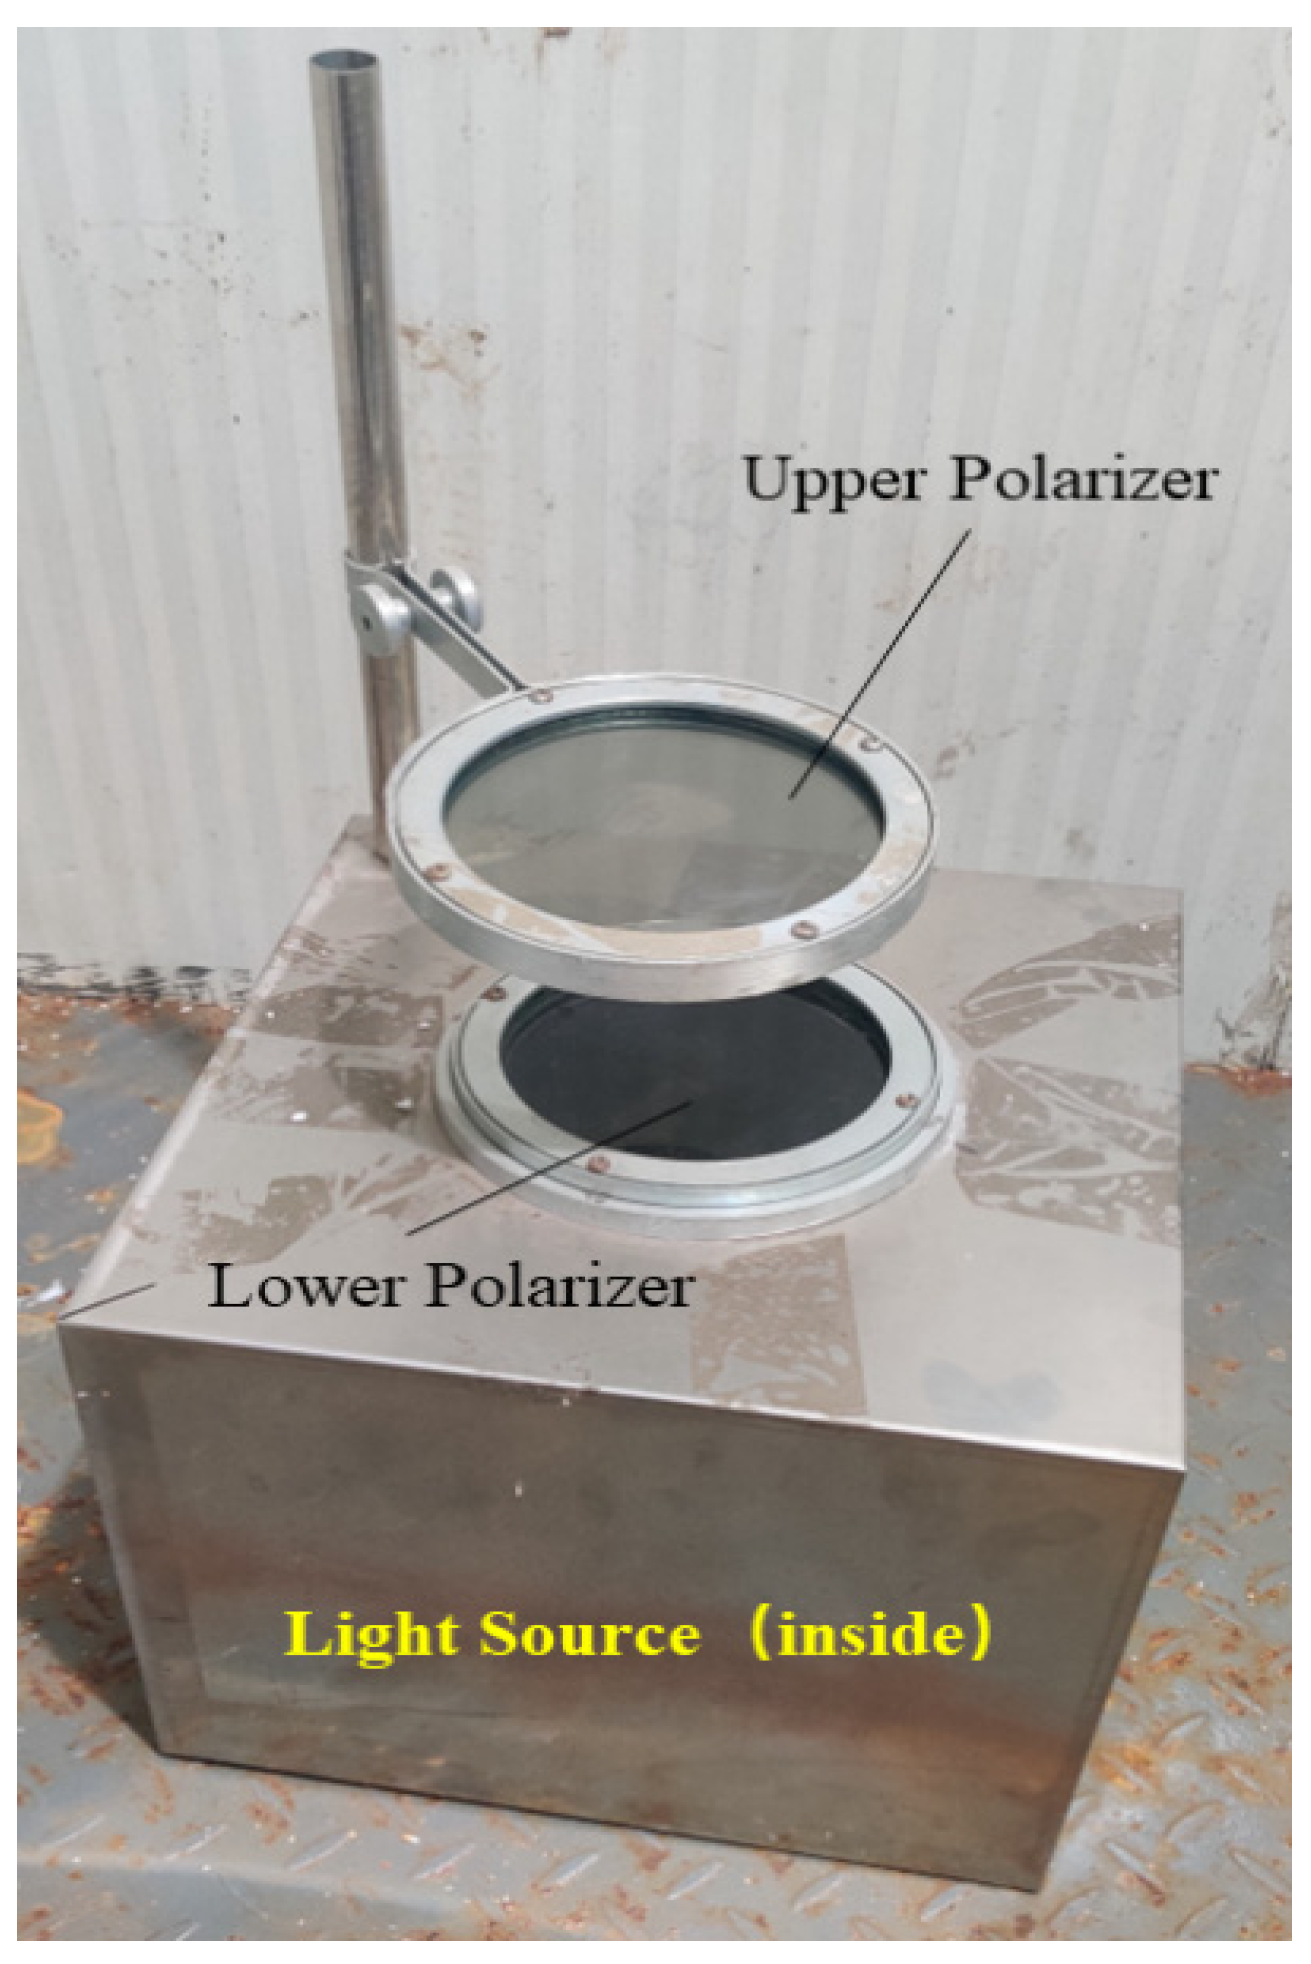
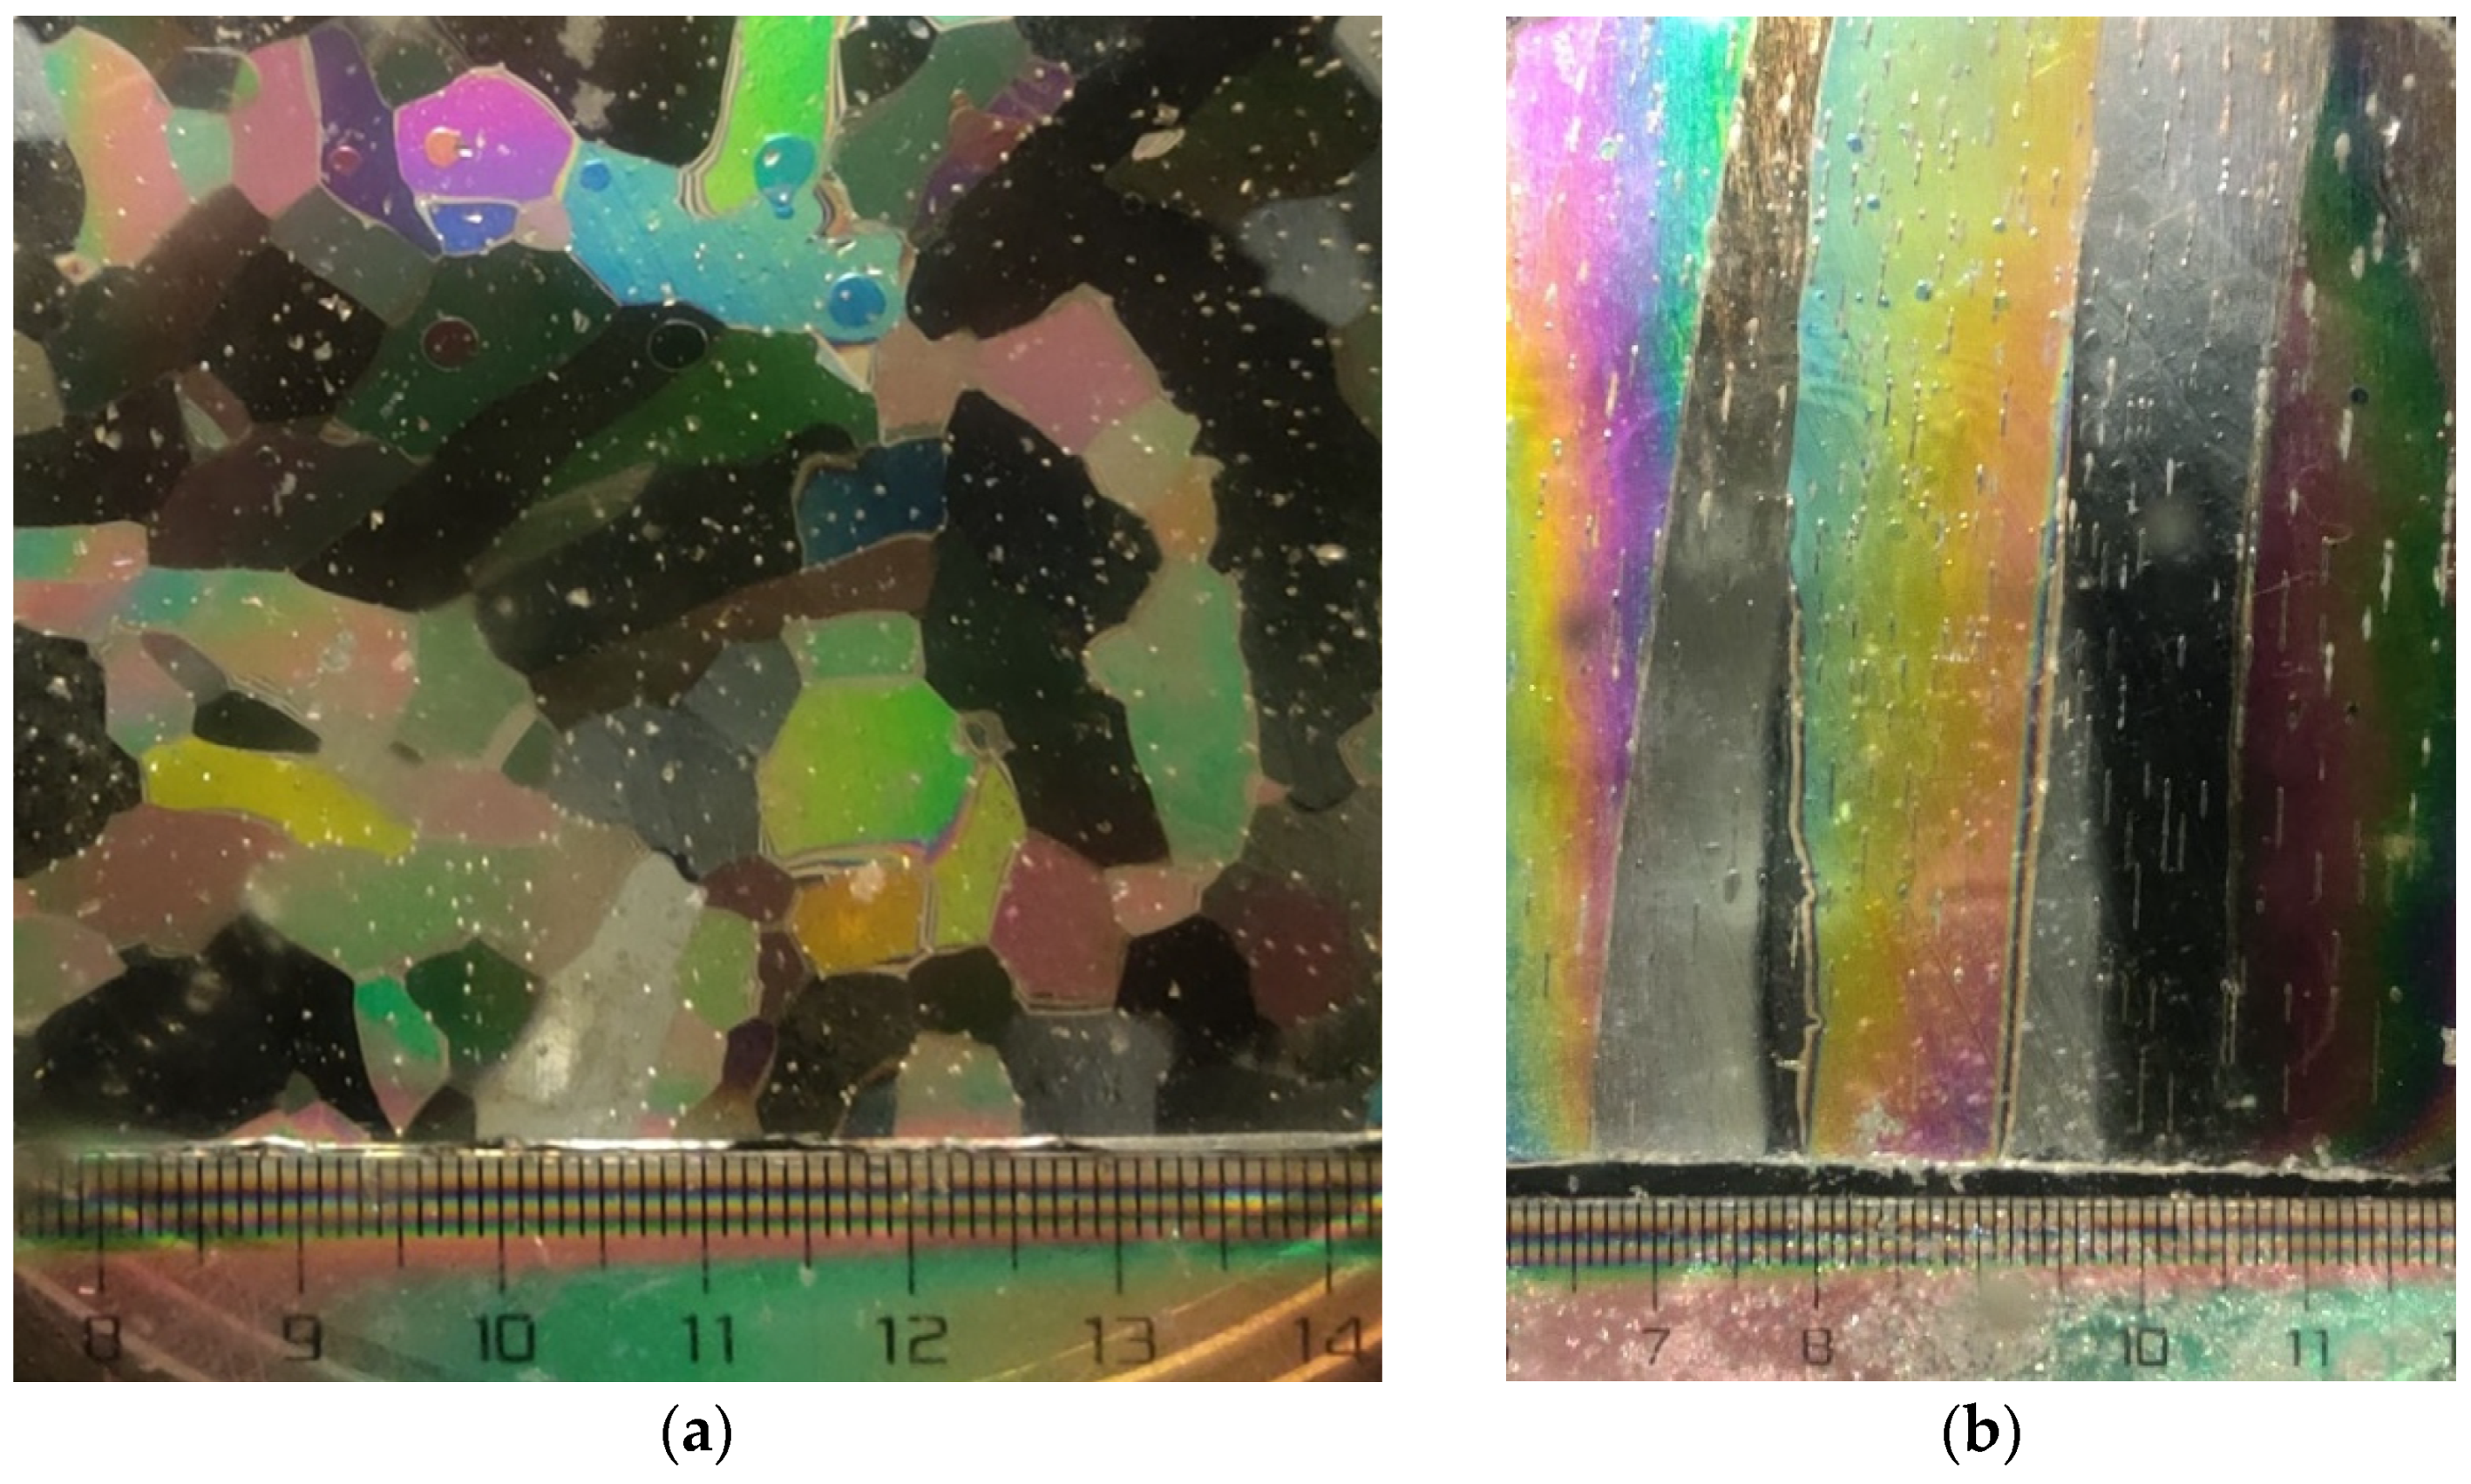
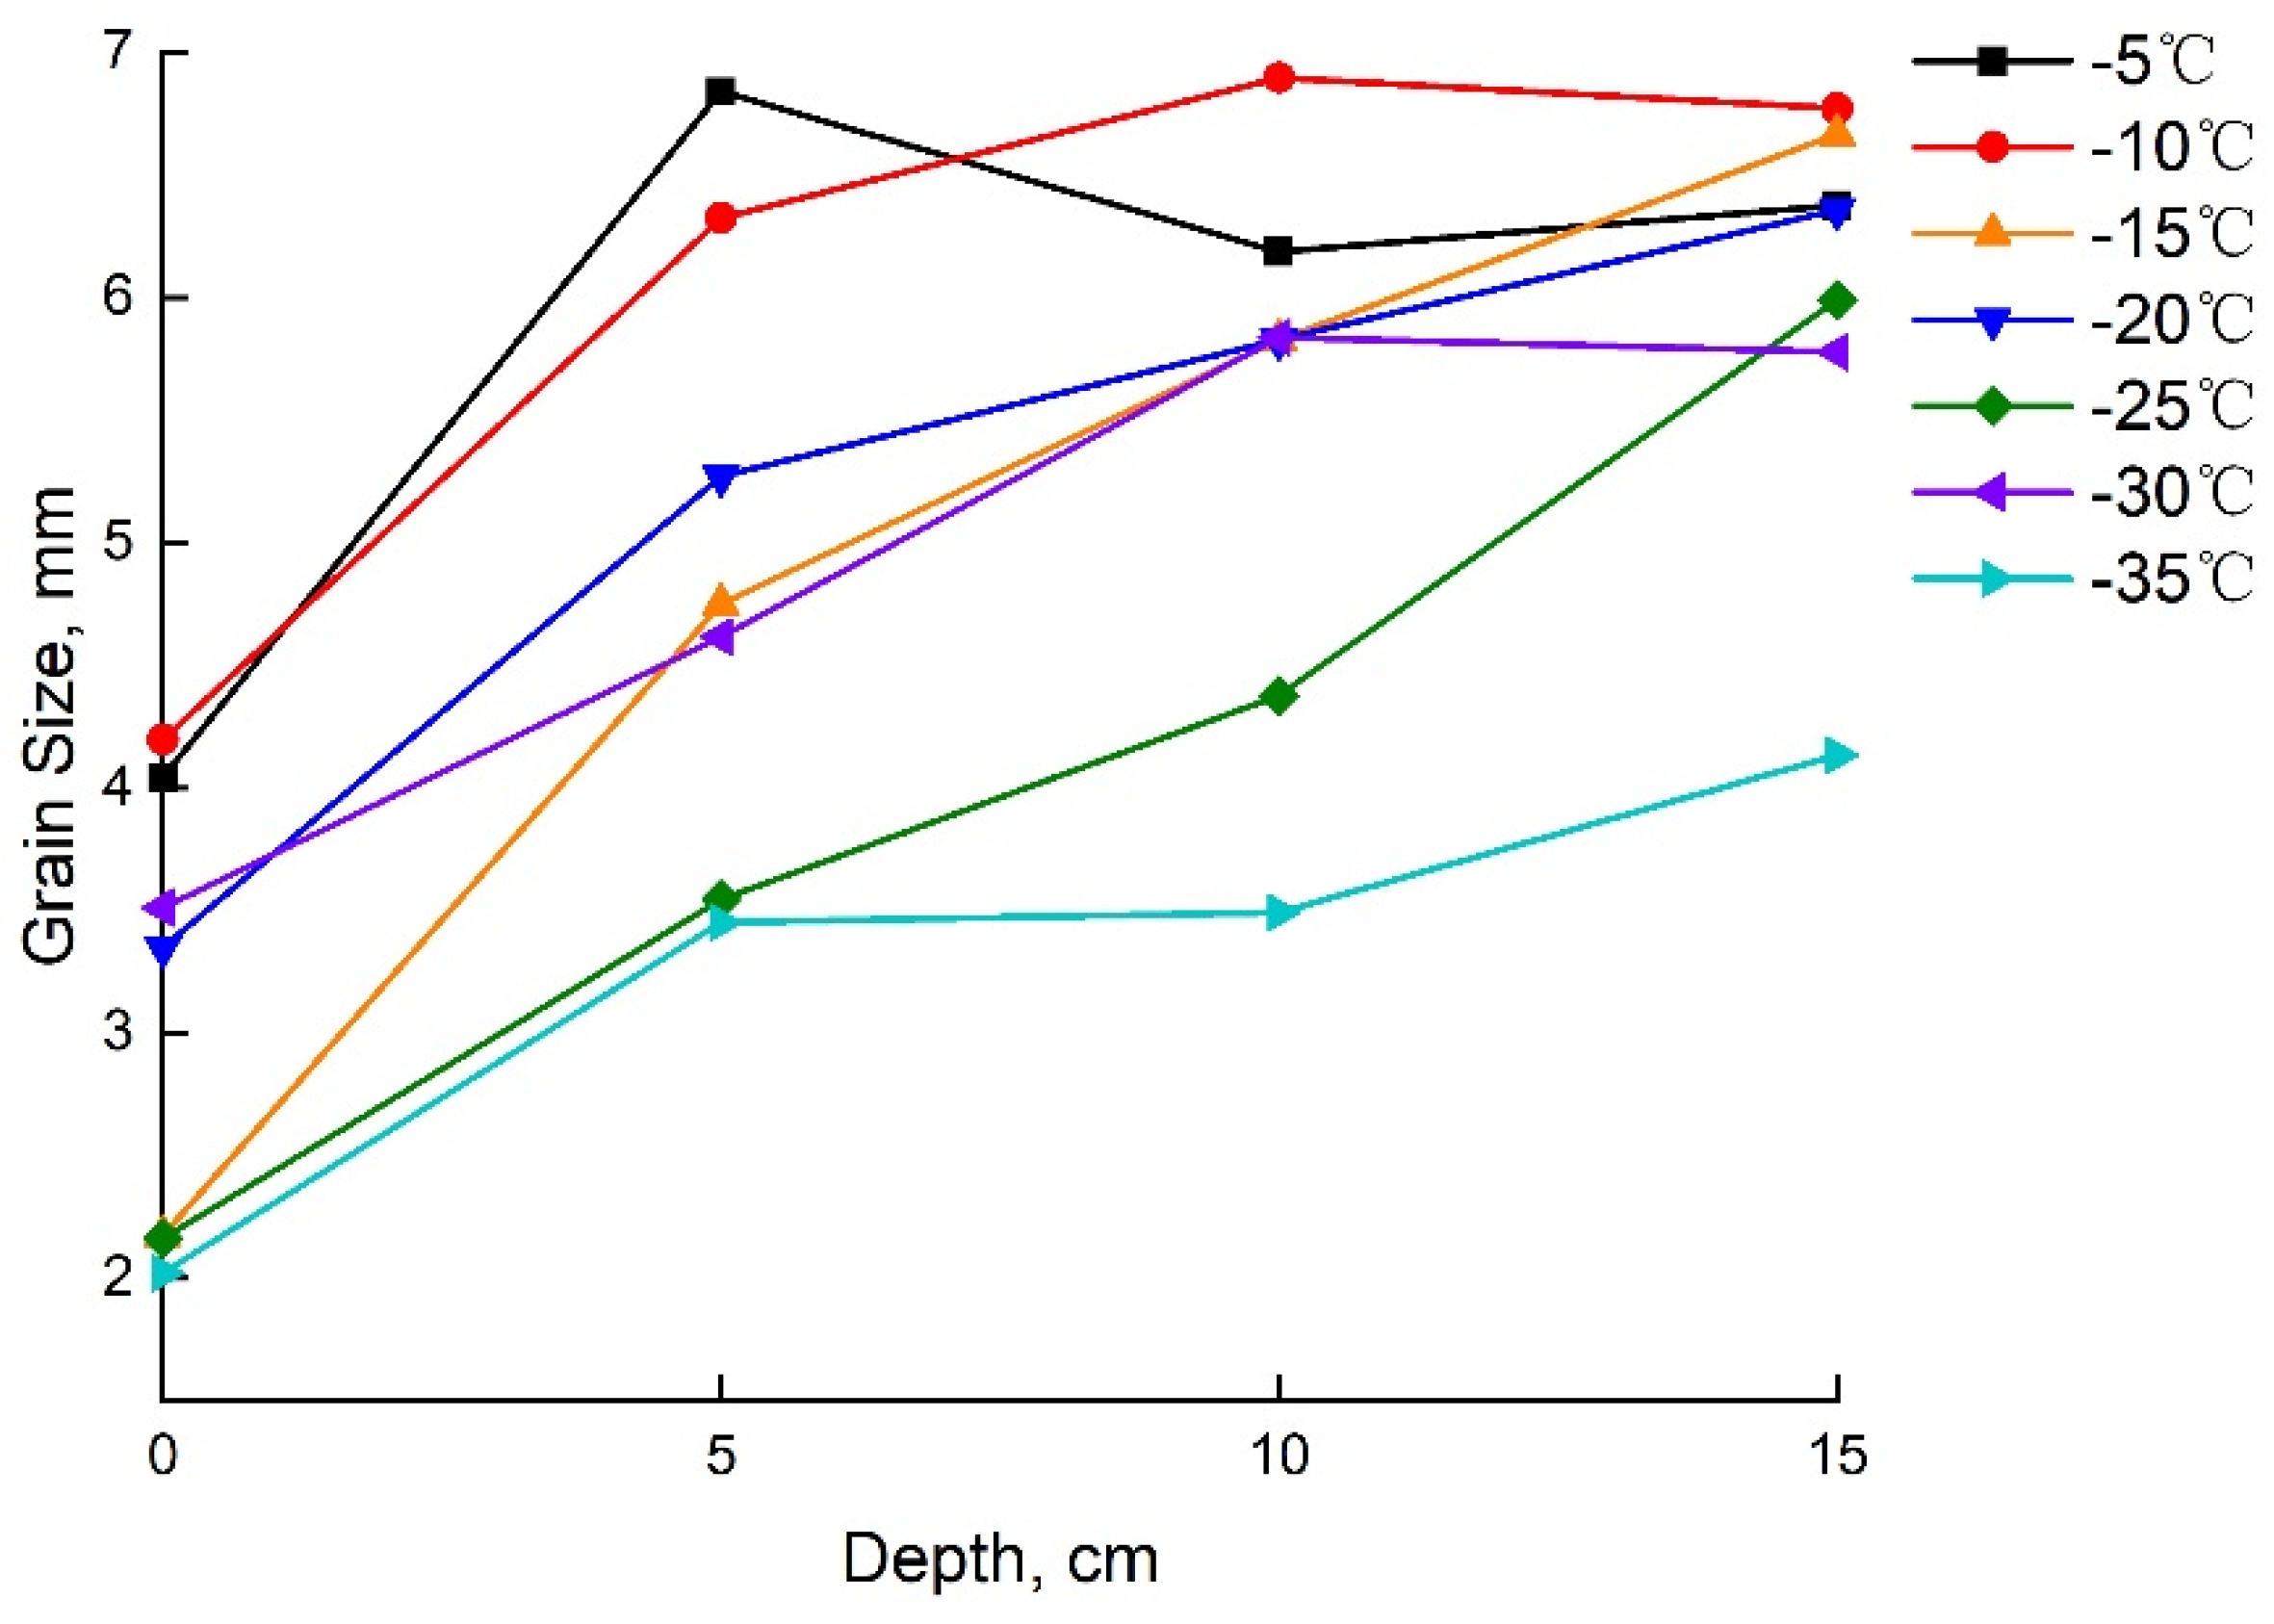
2.2.2. Ice Crystal Structure Measurement

There are two types of ice crystal structures: granular and columnar ice. The ice crystal structure was observed under orthogonally polarized light through the thin ice slice pasted on the glass. The observation device is shown in Figure 3.
The steps of preparing thin ice slices in the cryogenic laboratory are as follows: (1) After taking out the ice sample, slice the ice surface vertically and horizontally from different positions. The ice sections are 5–10 cm in length with a thickness of about 1–2 cm. Flatten one side of the slice gradually with a planer so that it can fit seamlessly with the clean glass. (2) Heat the prepared glass slice in a water bath and stick the flat surface of the ice section onto the glass slice slightly higher than 0 °C. Leave it for a few minutes to let the ice section freeze firmly with the glass. (3) Thin the slice to a thickness of less than 1 mm, which is convenient for distinguishing the crystal boundary. (4) Mark the slices, put them separately into clean plastic bags and keep them closed to prevent sublimation. The procedures of ice crystal structure observation under crossed polarized light are as follows: (1) Place the instrument in the cryogenic laboratory to reach room temperature. (2) Turn on the power, observe from the upper polarizer and rotate both upper and lower polarizer at the same time until the polarizers reach an angle of 90 ° to make it completely opaque. (3) Place and fix the cut ice crystal observation slice on the observation platform, and place the ruler on the ice slice. (4) Adjust the rotating disc until the ice crystal shows the clearest state for observation and take photos. The total area of the ice section can be measured by the ruler, and the total number of grains can also be obtained. The grain size is expressed by the equivalent circle diameter of the average crystal area on the section. The average grain diameter is calculated as follows:
D g = 2 S / n π
where D g is the average grain diameter (mm); S is the area of the ice section (mm2); n is the number of grains in the section.

2.3. Uniaxial Compression Test
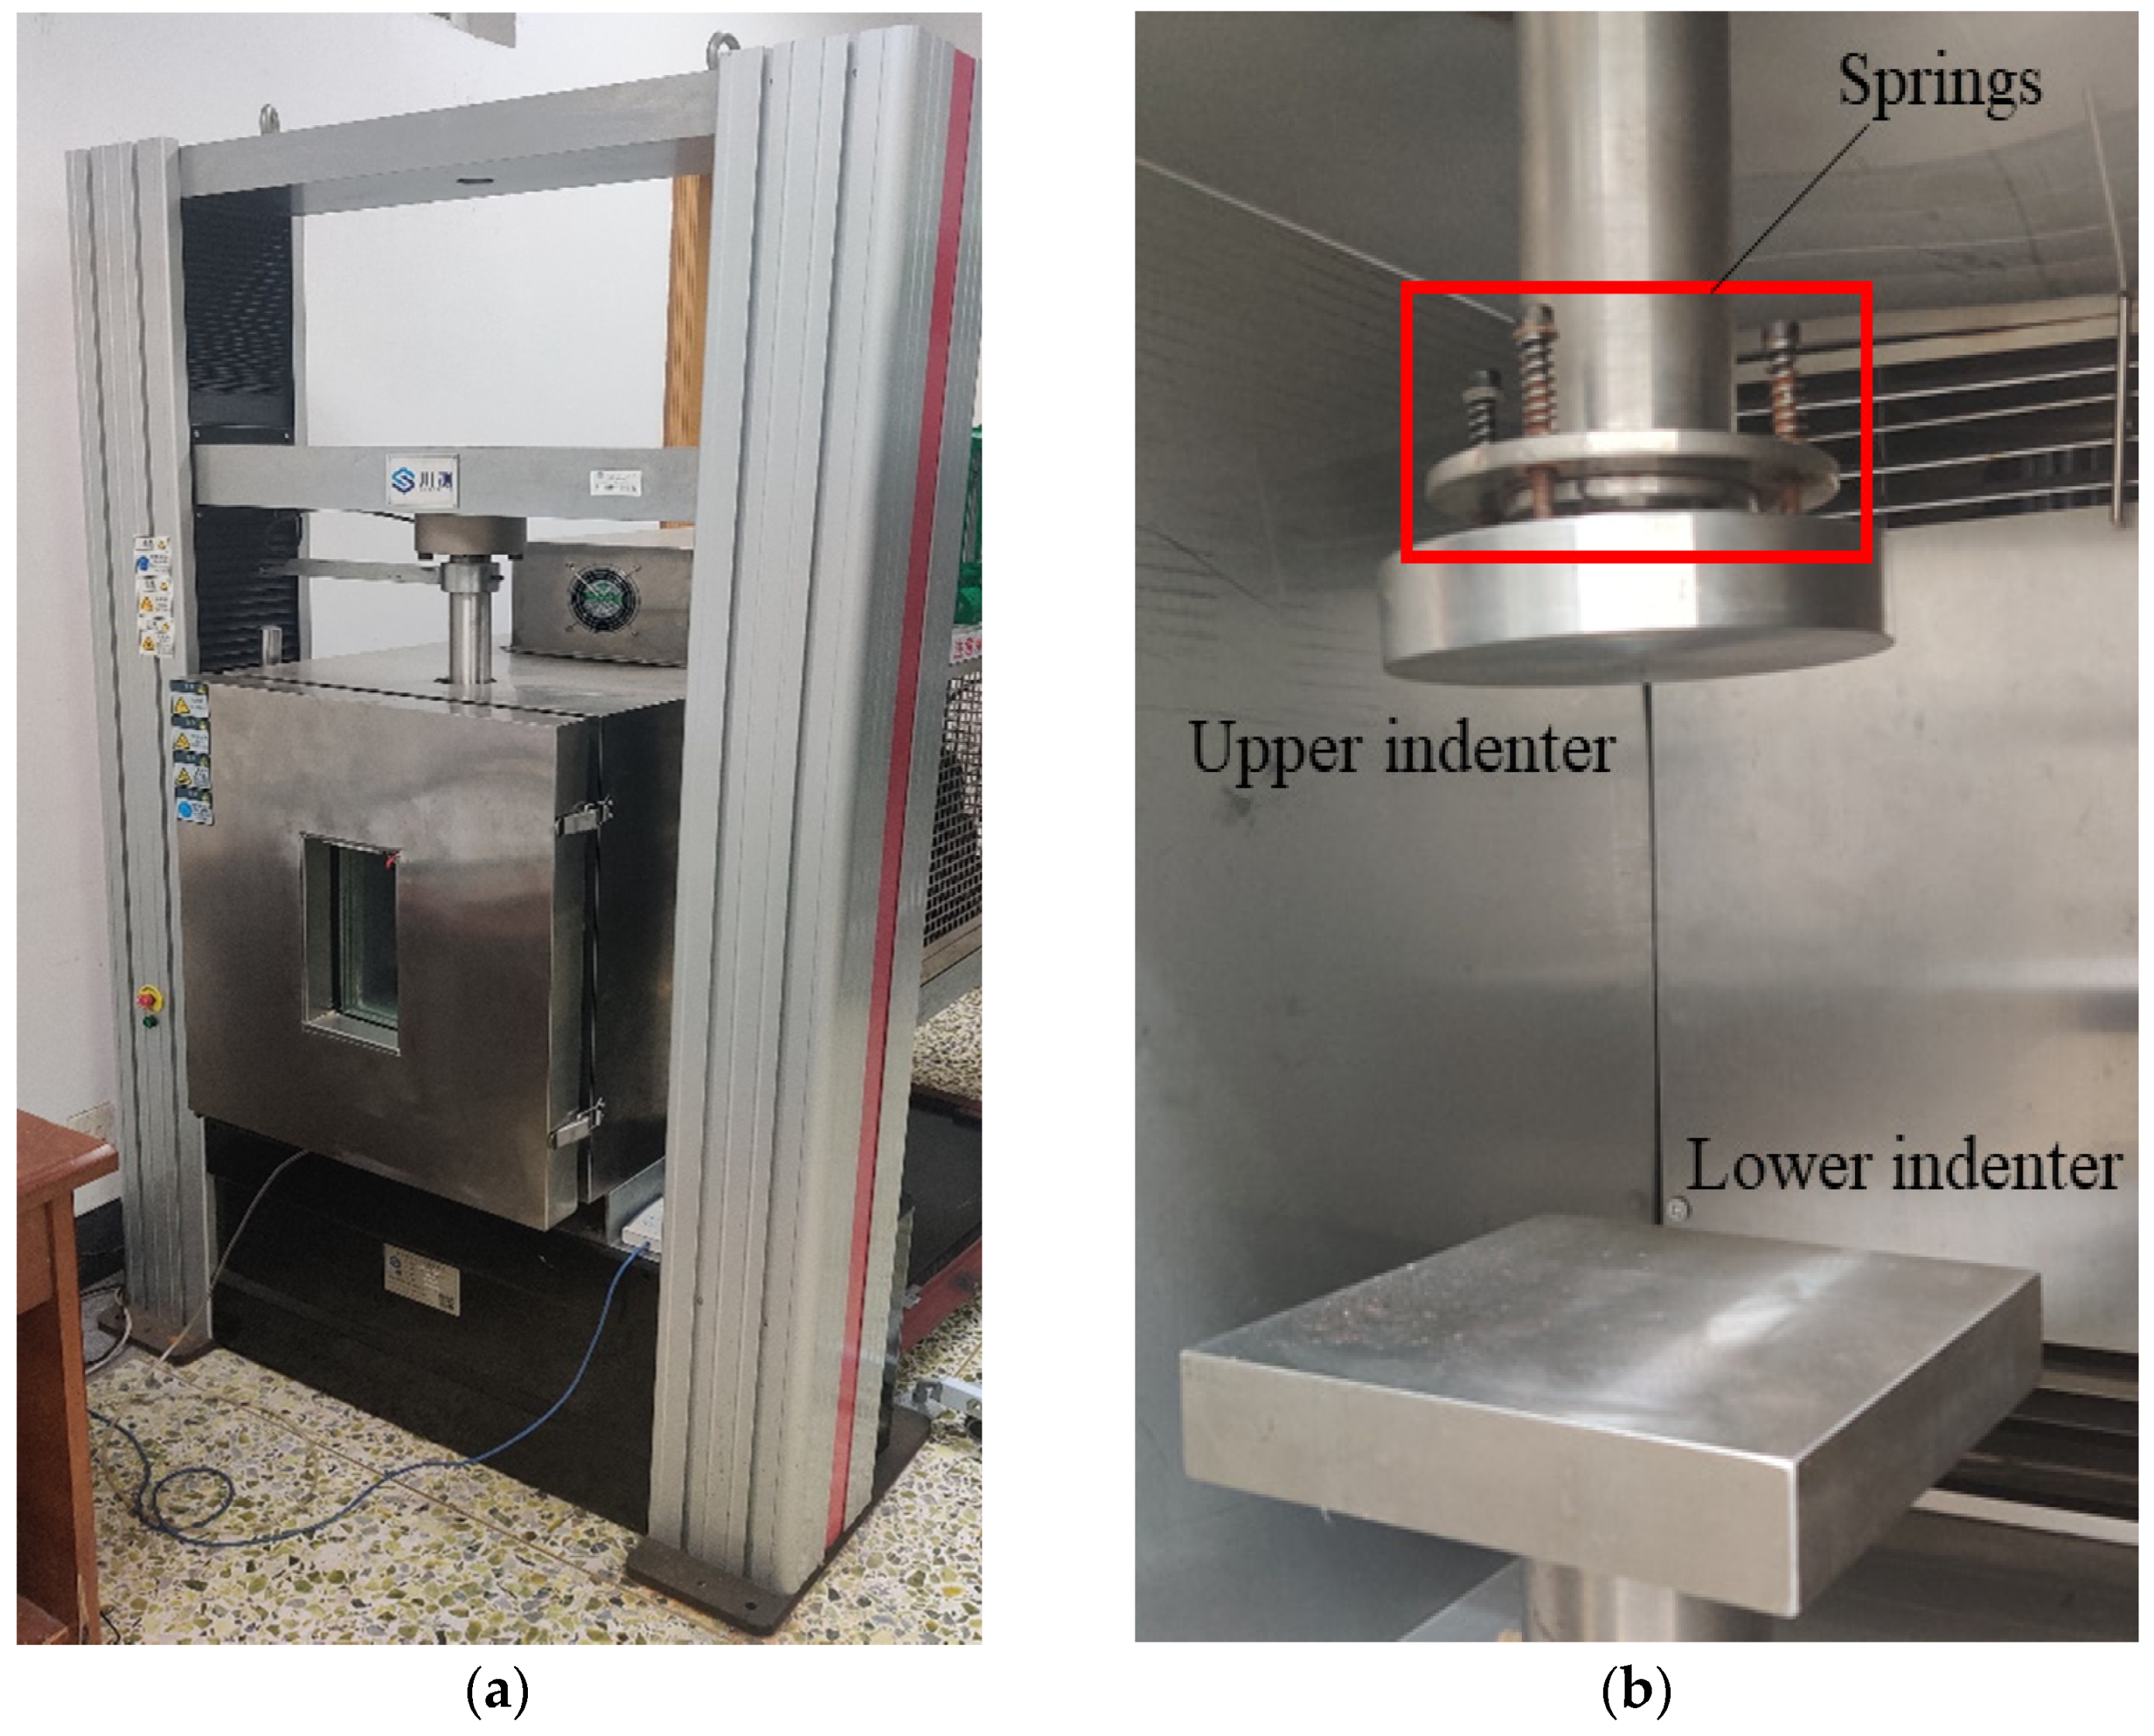
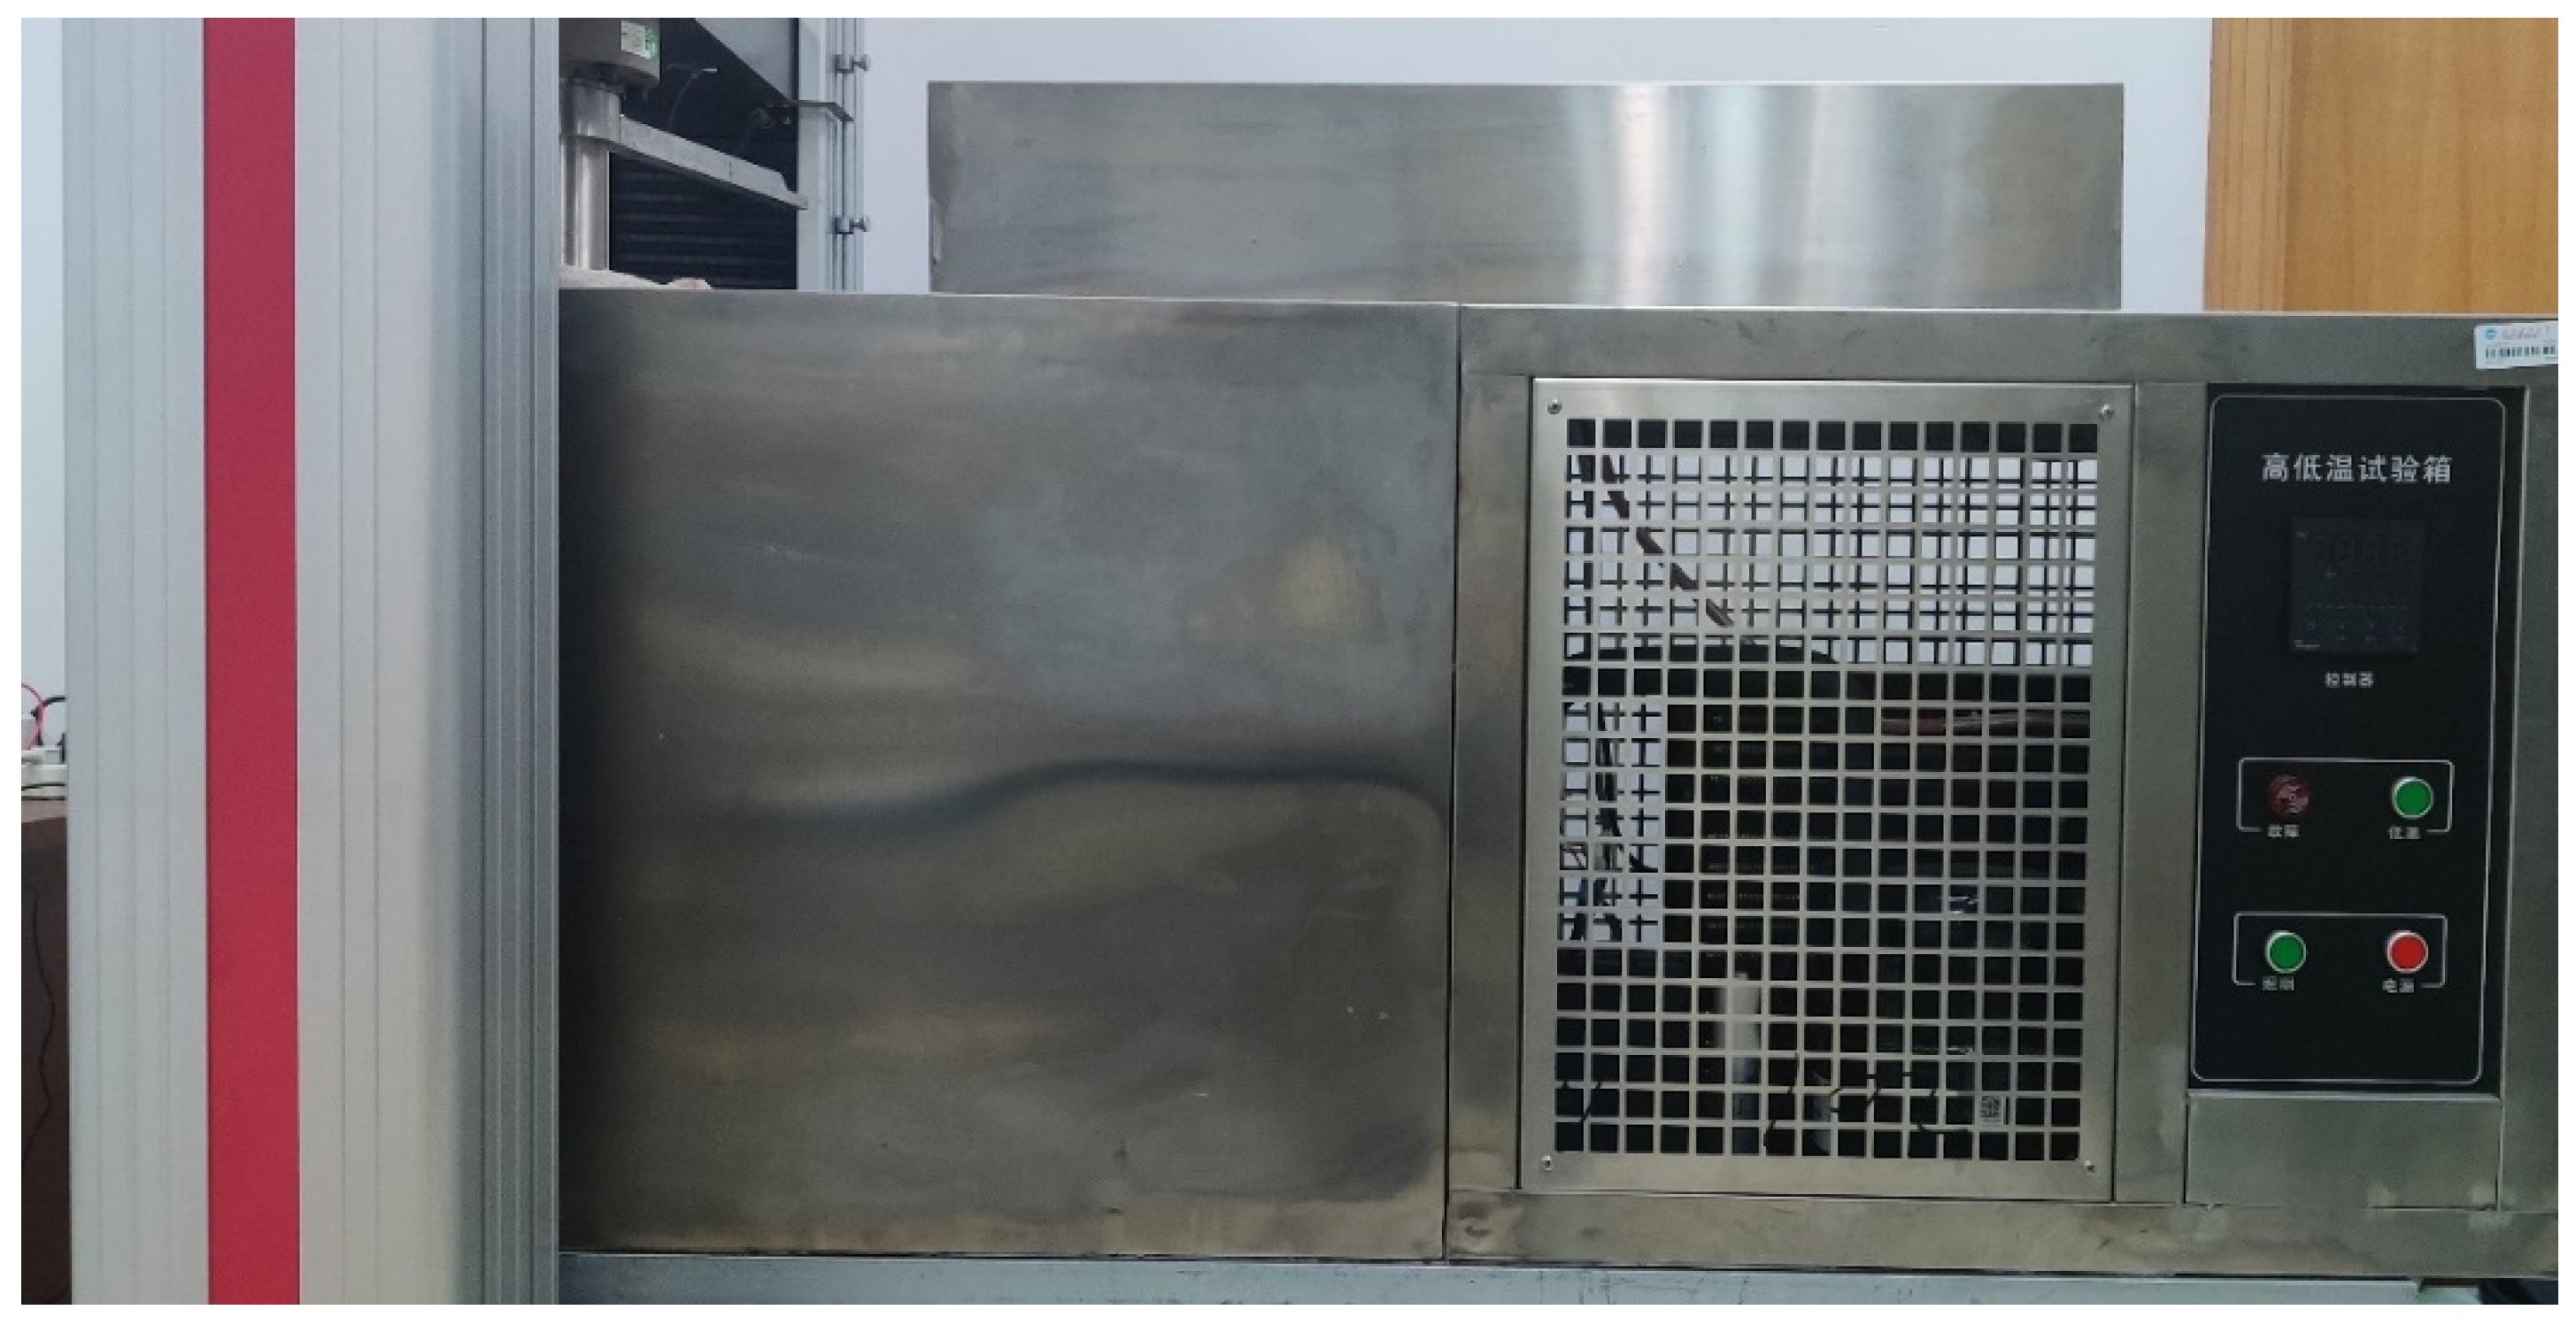
2.3.1. Test Devices

The main loading device required for the test is the WDW-100E electronic universal testing machine produced by Jinan Chuance Testing Equipment Co., Ltd. The testing machine is driven by a servo motor and the maximum test force is 100 kN. Previous studies have shown that the smaller the stiffness of the testing machine, the smaller the strain rate obtained, which affects the test results [40,41]. The parameters of the testing machine are as follows: displacement measurement accuracy is ±0.5%, test force measurement accuracy is ±0.5%, displacement resolution is 0.03 μm, the deformation resolution is 0.001 mm and the indication error of displacement and deformation is ±0.5%. In order to create a low-temperature test environment, DWC-40 low-temperature test chamber is installed between the beam and the bottom plate of the testing machine, and the temperature control accuracy can reach 0.1 °C to ensure strict control of the test temperature. In order to ensure that the upper indenter fits well with the surface of the test sample, springs are installed at the upper indenter. The test machine and testing zone and low-temperature test chamber are shown in Figure 4 and Figure 5.

2.3.2. Test Principle and Procedure

In the uniaxial compression test, the load is recorded by the pressure sensor, and the displacement of the beam and indenter is recorded by the laser displacement sensor. The load-time curve and displacement-time curve can be obtained in real time during each test. Combined with the cross-sectional area and initial length of the sample, the real-time stress and strain can be calculated, and then the stress-strain curve can be drawn. Generally speaking, the strength of materials is defined as the ability of materials to resist failure under the action of external forces, that is, the stress corresponding to the failure of materials. However, due to the particularity of ice materials, cracks occur and continue to develop during the external force loading process until it is completely destroyed. Therefore, it is difficult to judge the exact starting point of failure and the stress condition of this point cannot be monitored in the experiment. From the perspective of engineering, the uniaxial compressive strength of ice is represented by the maximum compressive stress measured in the test regardless of the real-time development of damage inside the ice during loading. The calculation method of uniaxial compressive strength is given as follows:
σ c = F m a x A
where F m a x is the maximum load on the load time curve; A is the original cross-sectional area of the sample. The strain rate ε ˙ (s−1) is controlled by adjusting the displacement rate X ˙ (mm/s) of the indenter. It can be calculated by combining the original length L 0 (mm) of the sample as follows:
ε ˙ = X ˙ L 0
In this study, the loading direction of the test is parallel to the core axis. The test procedure is as follows: (1) Set the low-temperature test chamber to the temperature required for the test and wait for it to complete the internal cooling. (2) After measuring the length, width and height of the ice sample, seal the sample with a plastic bag, and then put it into the low-temperature test chamber for constant temperature. The constant temperature time should be more than 24 h to ensure that the interior of the sample also reaches the temperature required for the test. (3) Place the sample at the center of the lower indenter to ensure that the geometric axis of the specimen is in the same line with the centerline of the testing machine. (4) Turn on the control and data acquisition program of the testing machine. After placing the sample, adjust the position of the upper indenter so that it just contacts the upper surface of the sample, then keep the temperature constant for a period of time to reduce the temperature disturbance during the manual placing of the sample. (5) Set the test parameters including sample sizes, loading speed, data acquisition frequency and turn on the testing machine for loading. (6) Stop loading immediately after the sample is destroyed and take photos. (7) Take out the damaged sample, clean up the residual fragments and prepare for the next test.

3. Results

Distilled water ice was prepared by controlling different growth temperatures in the cryogenic laboratory. The ice crystal structure was observed. The ice density and grain size were measured. Uniaxial compressive strength tests of distilled water ice grown at several temperatures were carried out at −10 °C. The loading direction was the same vertical direction as the natural growth direction of ice crystals. The loading speed was selected in the range of 0.01 mm/min to 105 mm/min and the strain rate range was 10−6 s−1 to 10−2 s−1 calculated by Equation (7).

3.1. Results of Uniaxial Compressive Strength Test

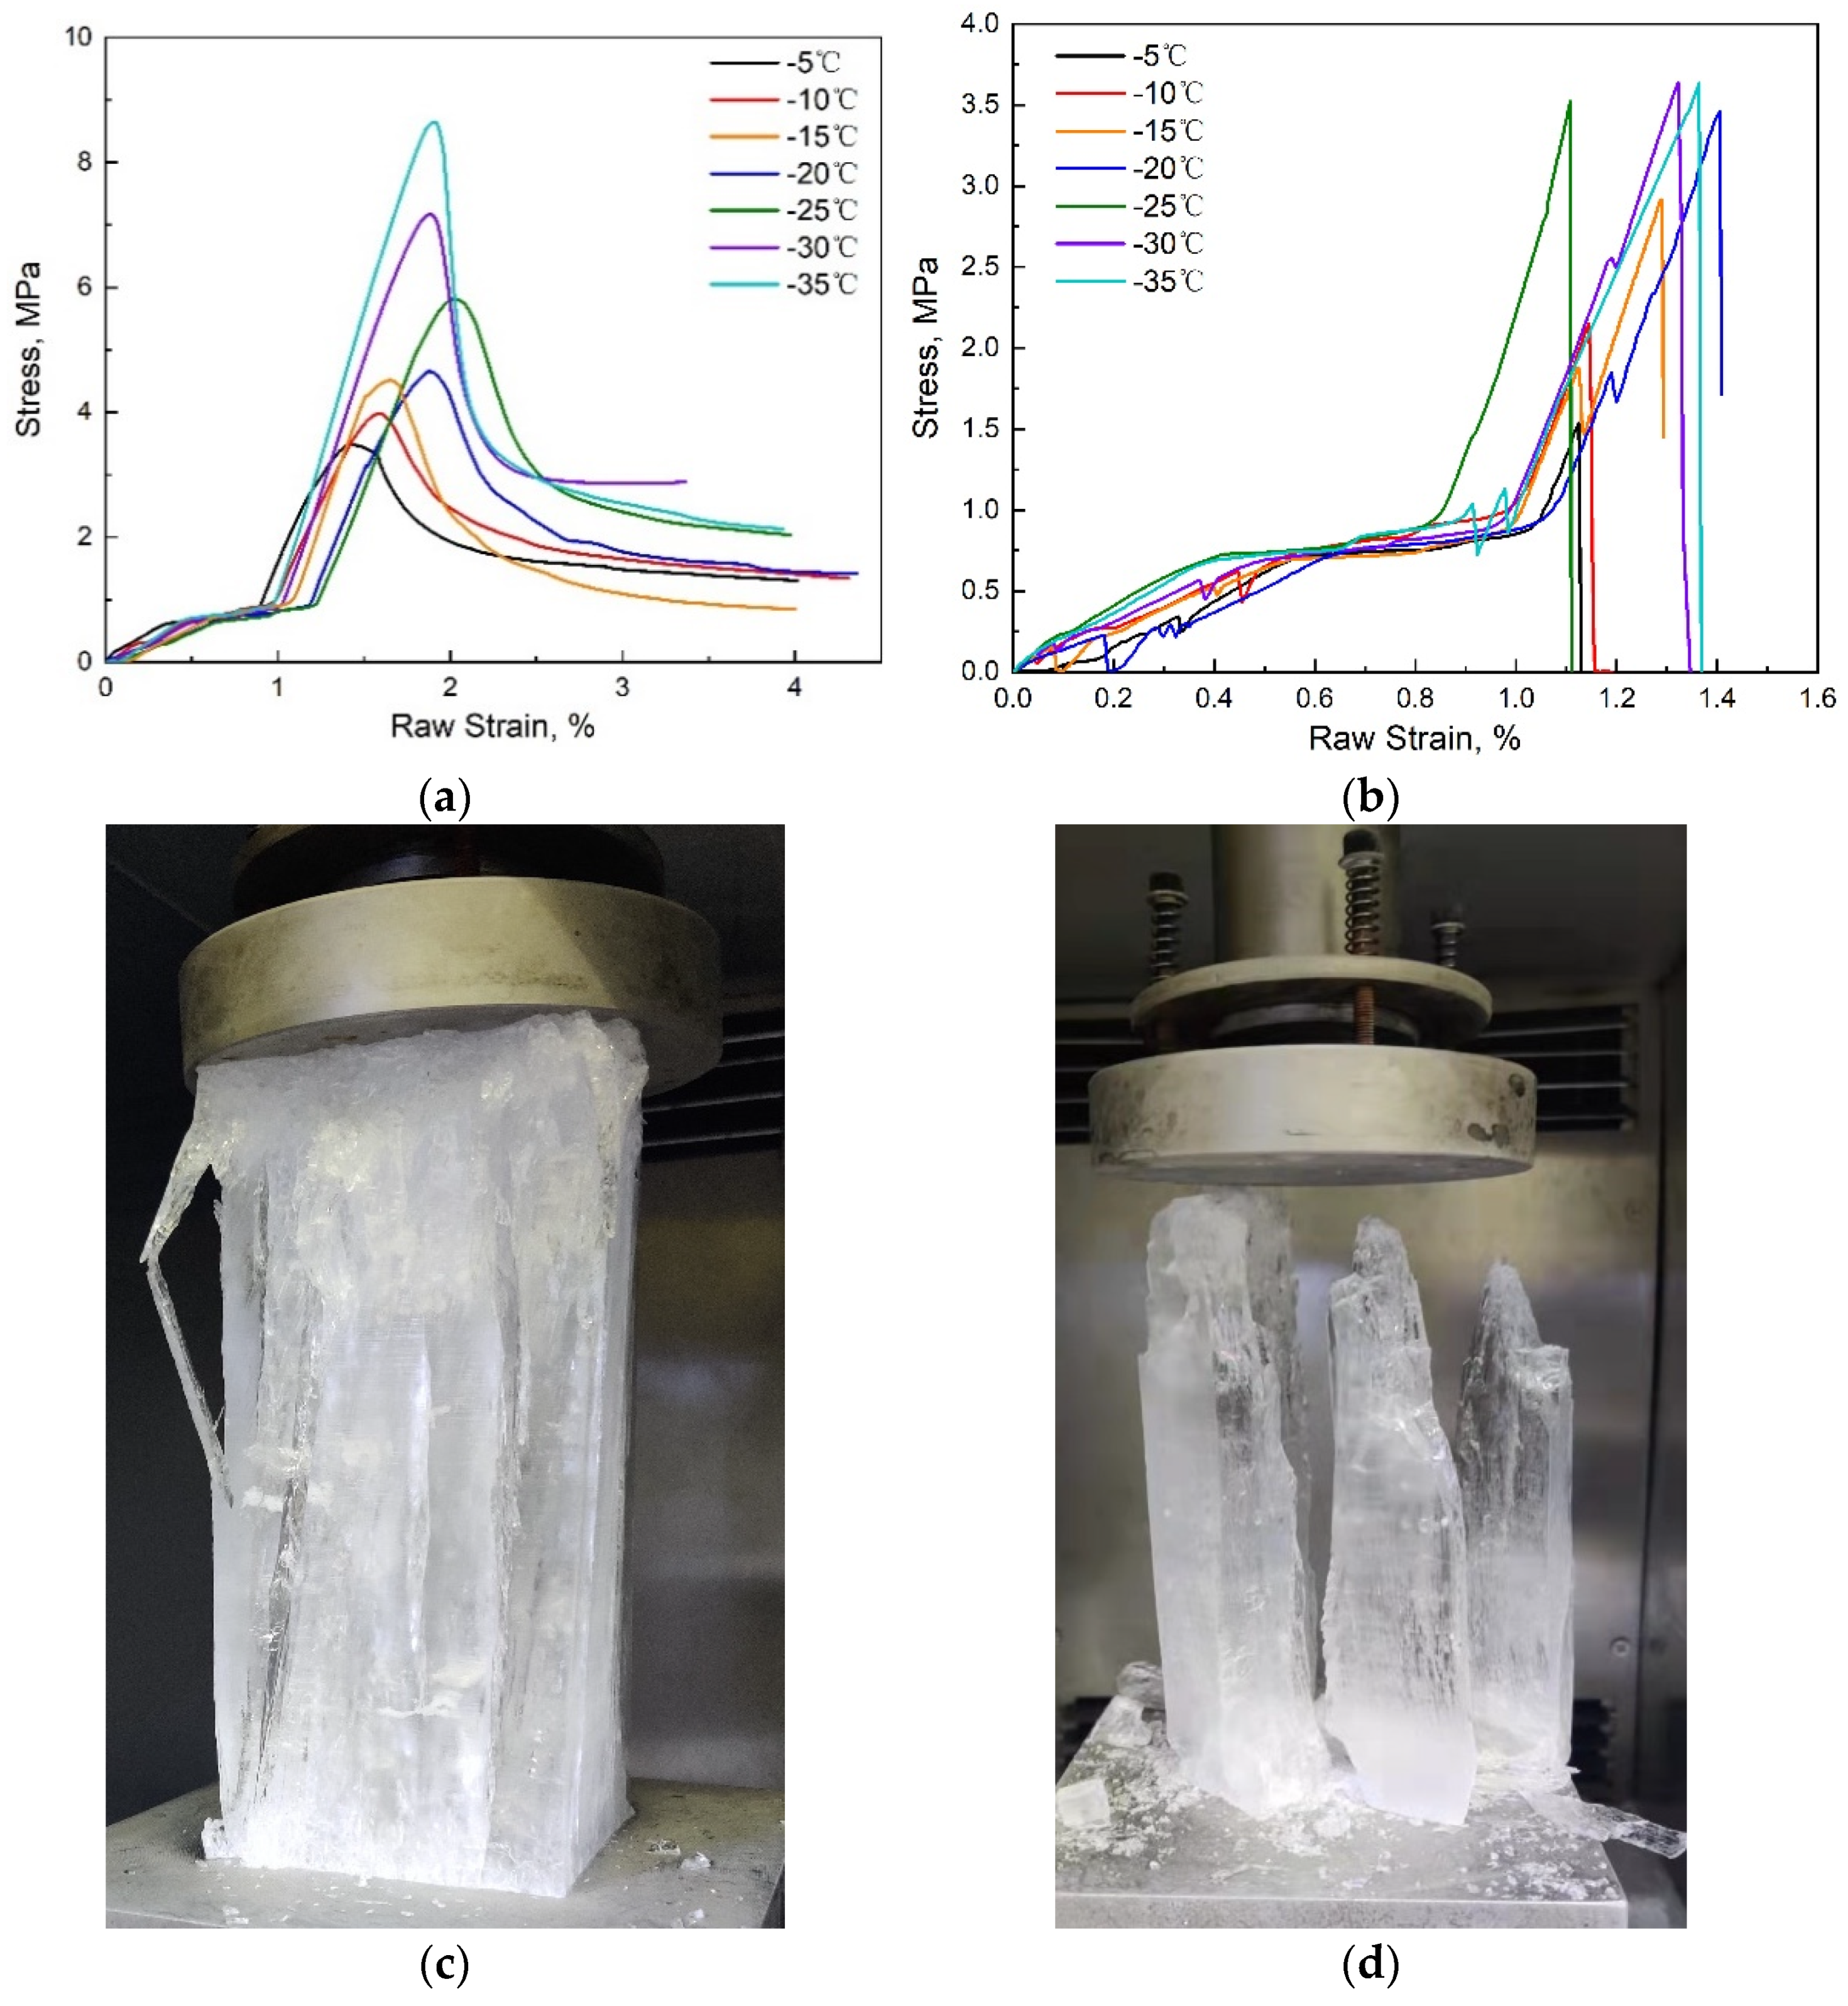
3.1.1. Deformation Types

Figure 6 shows the stress-strain curves of the uniaxial compressive strength test and the deformation types of distilled water ice.
It can be seen that although the strength of ice samples at different growth temperatures is different, the mechanical behavior and failure trend are almost the same. At a low strain rate, the uniaxial compressive strength increases linearly with the increase in strain. When the strength reaches the maximum value, the stress decreases with the increase in strain, and finally tends to a constant value, and the curve tends to be horizontal. The mechanical behavior of ice is ductile. Its failure mode is that with the progress of test loading, micro-cracks appear in the ice body of the sample and gradually expand with the progress of the test. When the cracks develop to a certain extent, the ability of the ice body to bear external loads decreases, but it will not completely lose its compressive capacity. At a high strain rate, the uniaxial compressive strength increases linearly with the increase in strain and then decreases rapidly after reaching the peak value. The mechanical behavior of ice is brittle. Its failure mode is that large cracks penetrating the upper and lower surfaces of the sample are directly generated in the ice during the loading process, and the sample is directly split into several pieces completely losing its compressive capacity. From the test results, the test duration in the high strain rate range is short, and the longitudinal displacement and deformation of the specimen are relatively small.

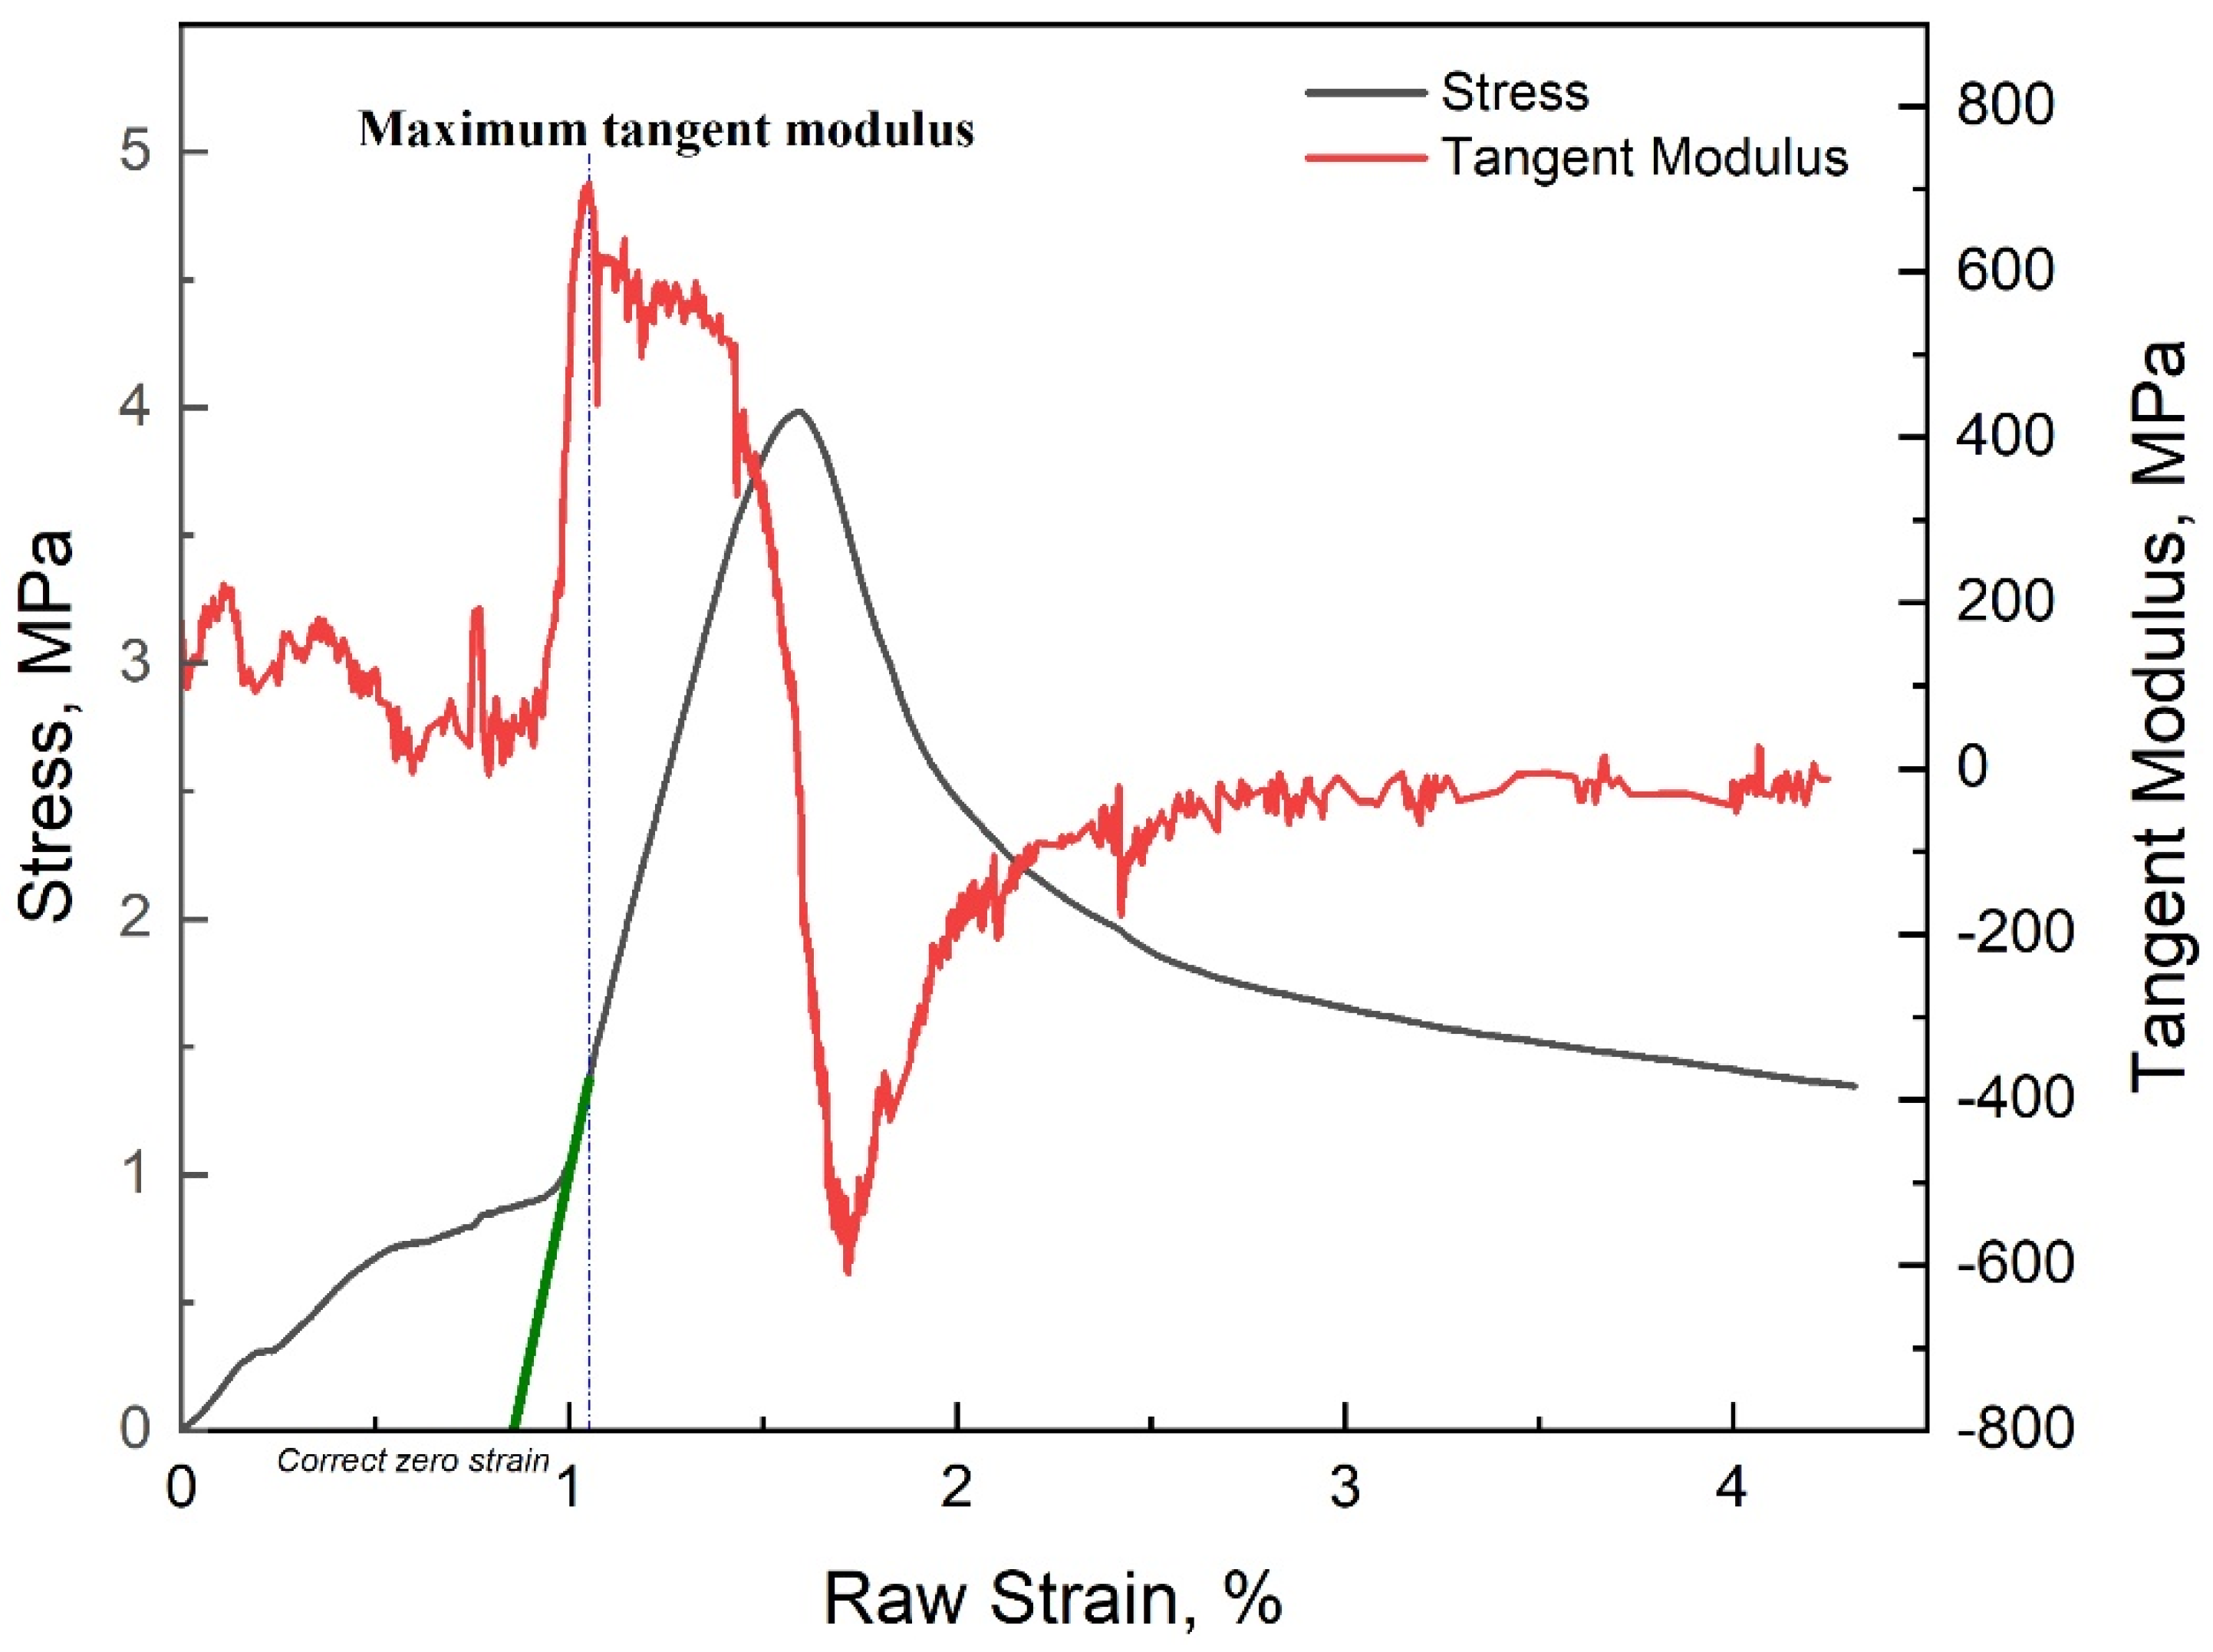
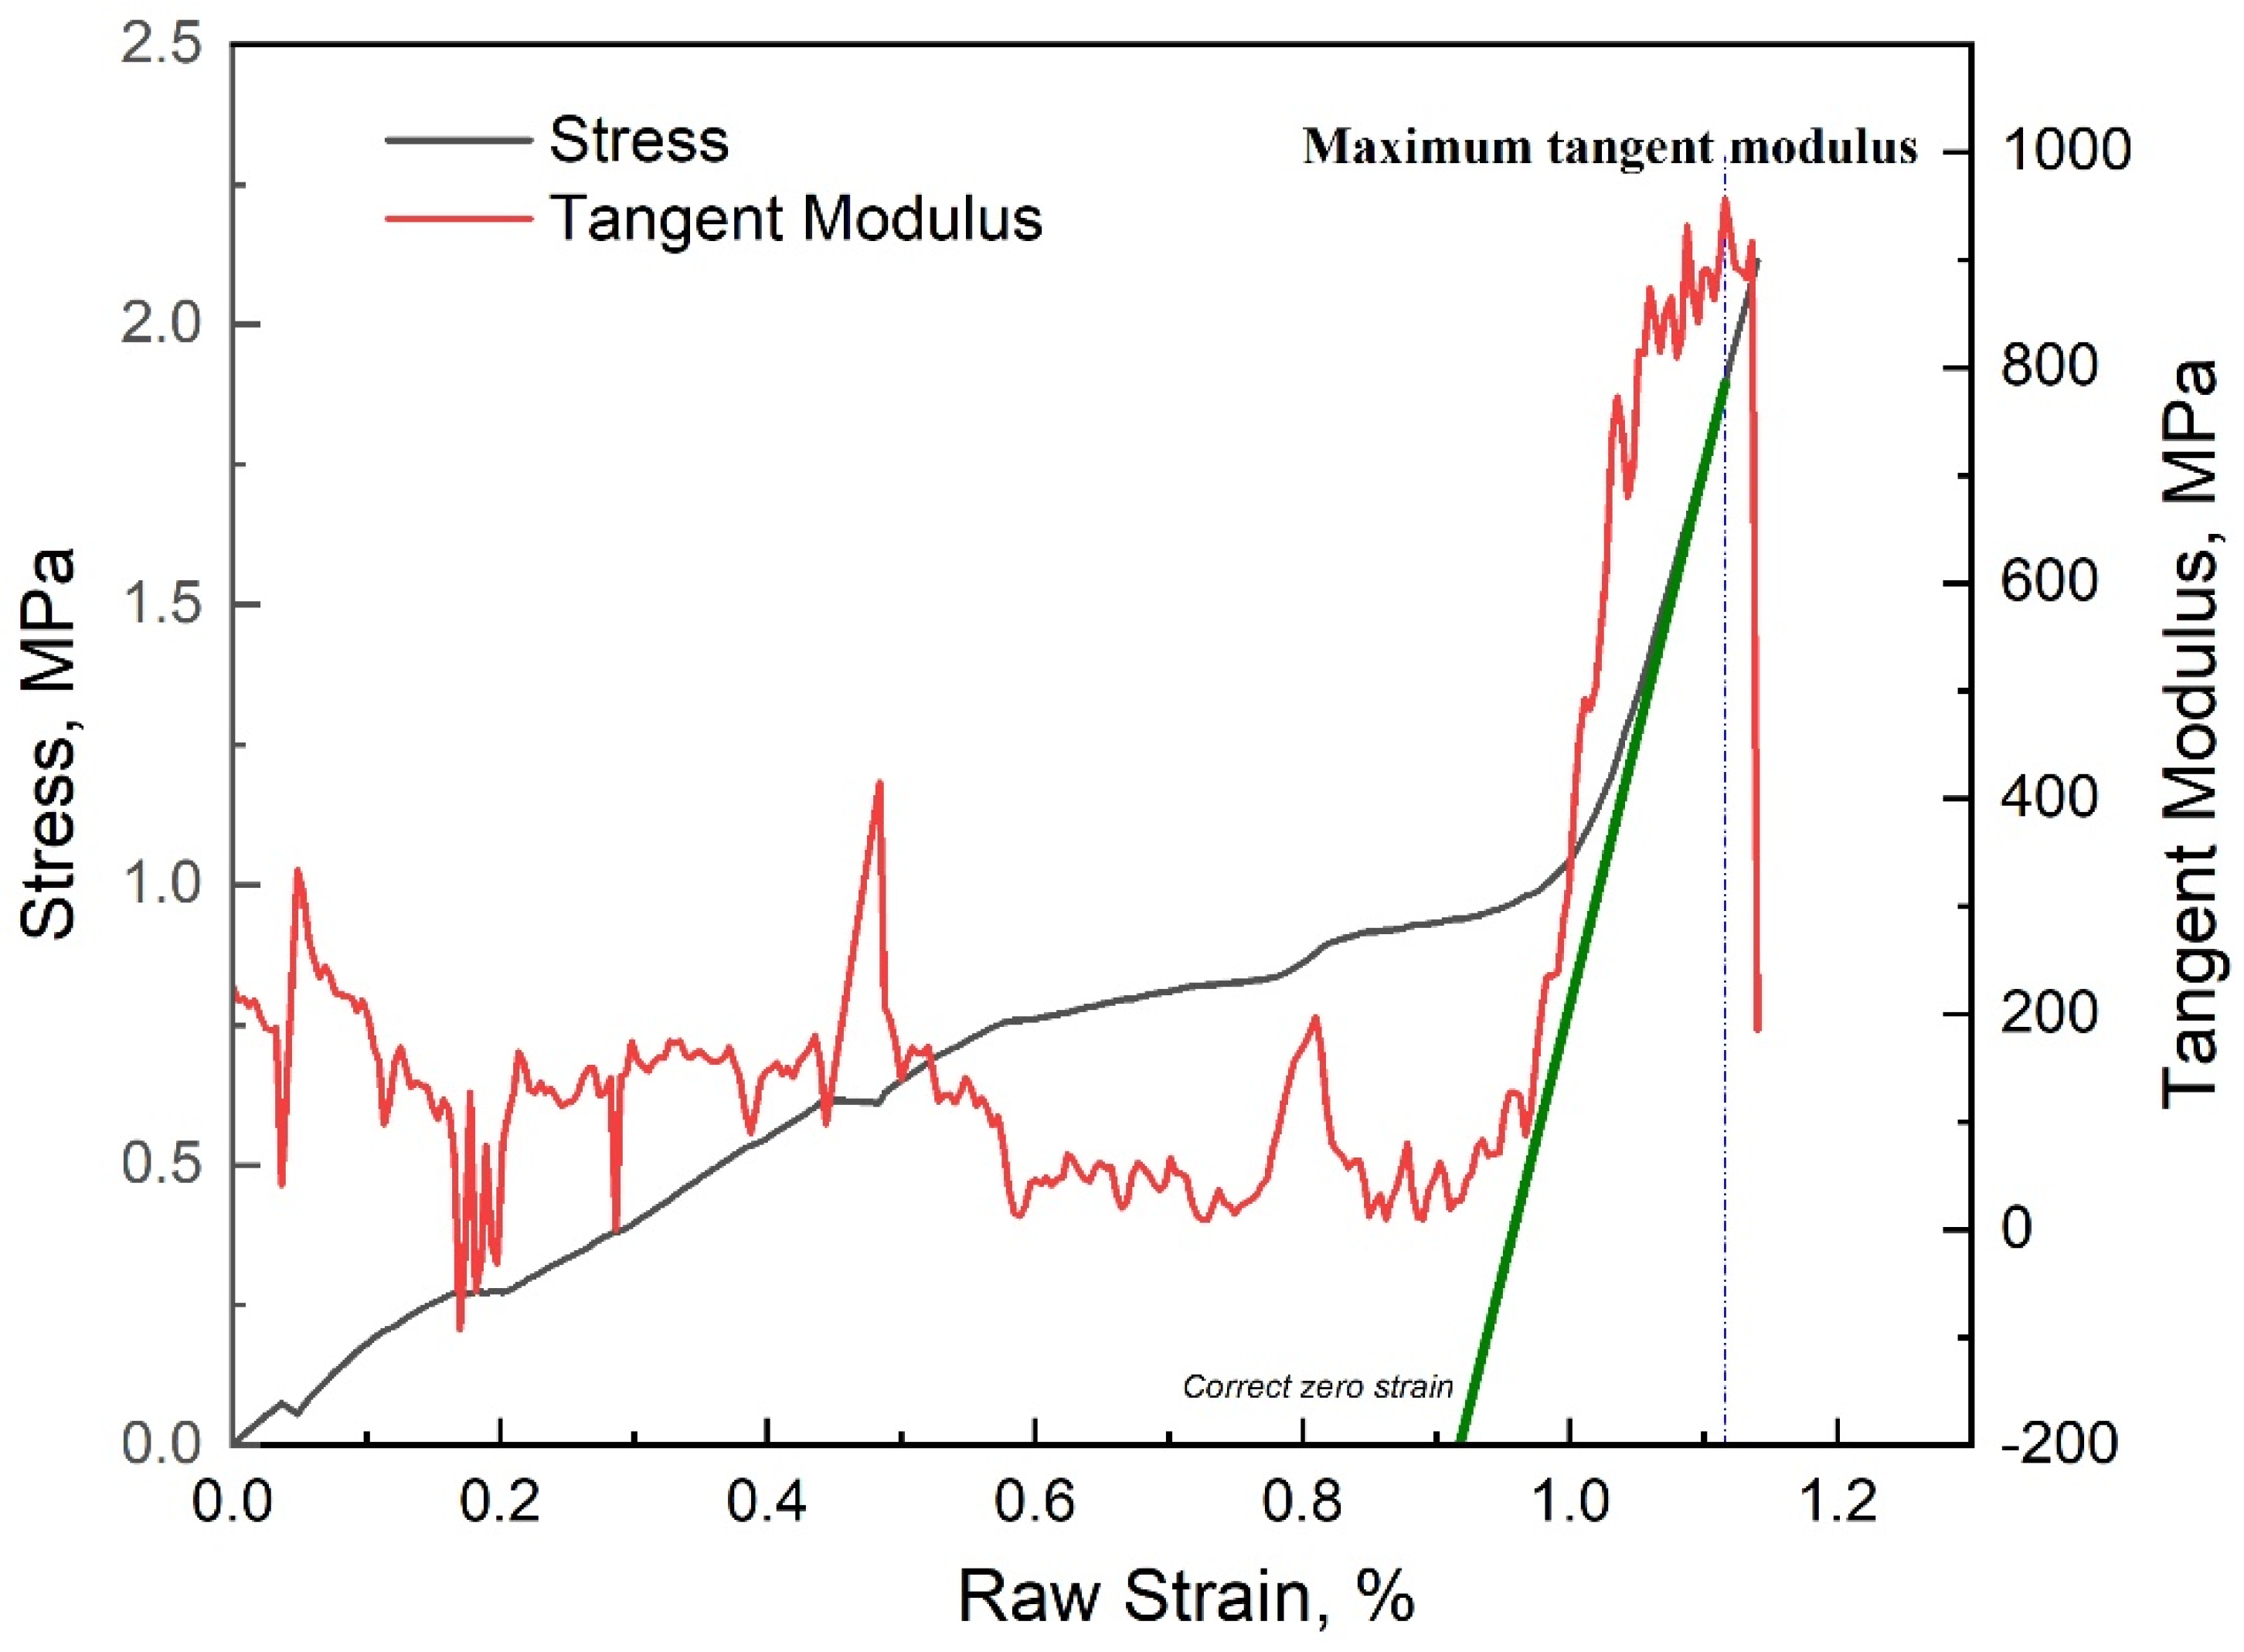
3.1.2. Stress-Strain Curves Correction

At the beginning of the compression test, the indenter of the testing machine needs to be fully attached to the surface of the sample, and the stress generated at this time is not the real stress of ice. From the stress-strain curve, it can be seen that the real stress of the sample is obtained when the raw strain reaches about 1%, so the stress-strain curve needs to be modified. The correction method refers to reference [36], which suggests using tangent modulus to calculate the true zero point of the stress-strain curve. The tangent modulus of a point on the stress-strain curve is the ratio of the stress change to the strain change near the point. Taking the test results of growth temperature −10 °C and strain rate 10−5 s−1 as an example, Figure 7 shows the correction method of the stress-strain curve when ice shows ductile behavior at a low strain rate.
When the raw strain reaches 0.93%, the upper surface of the sample is fully attached to the upper indenter, and the tangent modulus rises rapidly from 0, reaching the maximum value of 740 MPa at 1.04% raw strain. The point corresponding to the maximum tangent modulus is given on the curve. At this point, take the maximum tangent modulus as the slope as the auxiliary line, and the intersection with the x-axis is the correct zero strain, that is, 0.85% raw strain. When the tangent modulus curve reaches the maximum value, it decreases rapidly with the increase in strain. When the tangent modulus decreases to 0, the stress reaches the maximum value of 3.98 MPa, which is defined as the maximum compressive strength under this condition, and the corresponding corrected strain is 0.72%. After reaching the peak, the stress and tangent modulus decrease rapidly with the increase in strain. The tangent modulus reaches the minimum value at 0.85% of the corrected strain and then gradually rises, and the corresponding stress reduction rate also gradually decreases. Finally, the stress tends to be constant, and the tangent modulus tends to be 0. When ice shows brittle behavior at a high strain rate, the correction method of the stress-strain curve is the same as that of the ductile regime, as shown in Figure 8. See Table 1 for the maximum compressive strength σ m a x and corresponding corrected strain ε m a x in some typical tests.

3.2. Physical Properties and Crystal Structure of Distill Water Ice

The density of distilled water ice grown at different growth temperatures was measured in the low-temperature laboratory. The density range is 900–920 kg/m3 increasing with the decrease in temperature. The ice density measured in this study is relatively large because ice is frozen from distilled water without salt and other impurities. Because there is almost no disturbance of air and water flow, which makes the ice crystal growth more uniform and stable, the icing process is static. In this way, the bubble content is low. The average porosity of distilled water ice grown at different temperatures is calculated by Equations (3) and (4) combined with the average density of ice samples. The results are shown in Table 2.
Figure 9 shows the horizontal and vertical crystal structure of the ice sample. From the figure, it can be seen that the distilled water ice frozen in the laboratory is a typical columnar structure. The reason is that the temperature in the laboratory is almost constant during icing, and the growth rate of ice crystals is slow, which gives ice crystals enough time to develop. Each ice crystal can only grow vertically downward due to the restriction of surrounding ice crystals during growth, forming columnar ice crystals.
Figure 10 shows the variation curves of average grain size with depth. The average grain size of distilled water ice frozen under laboratory conditions ranges from 2 to 7 mm. The greater the depth, the slower the growth rate, and the larger the average grain size. The average grain size decreases roughly with the decrease in growth temperature.

4. Discussion

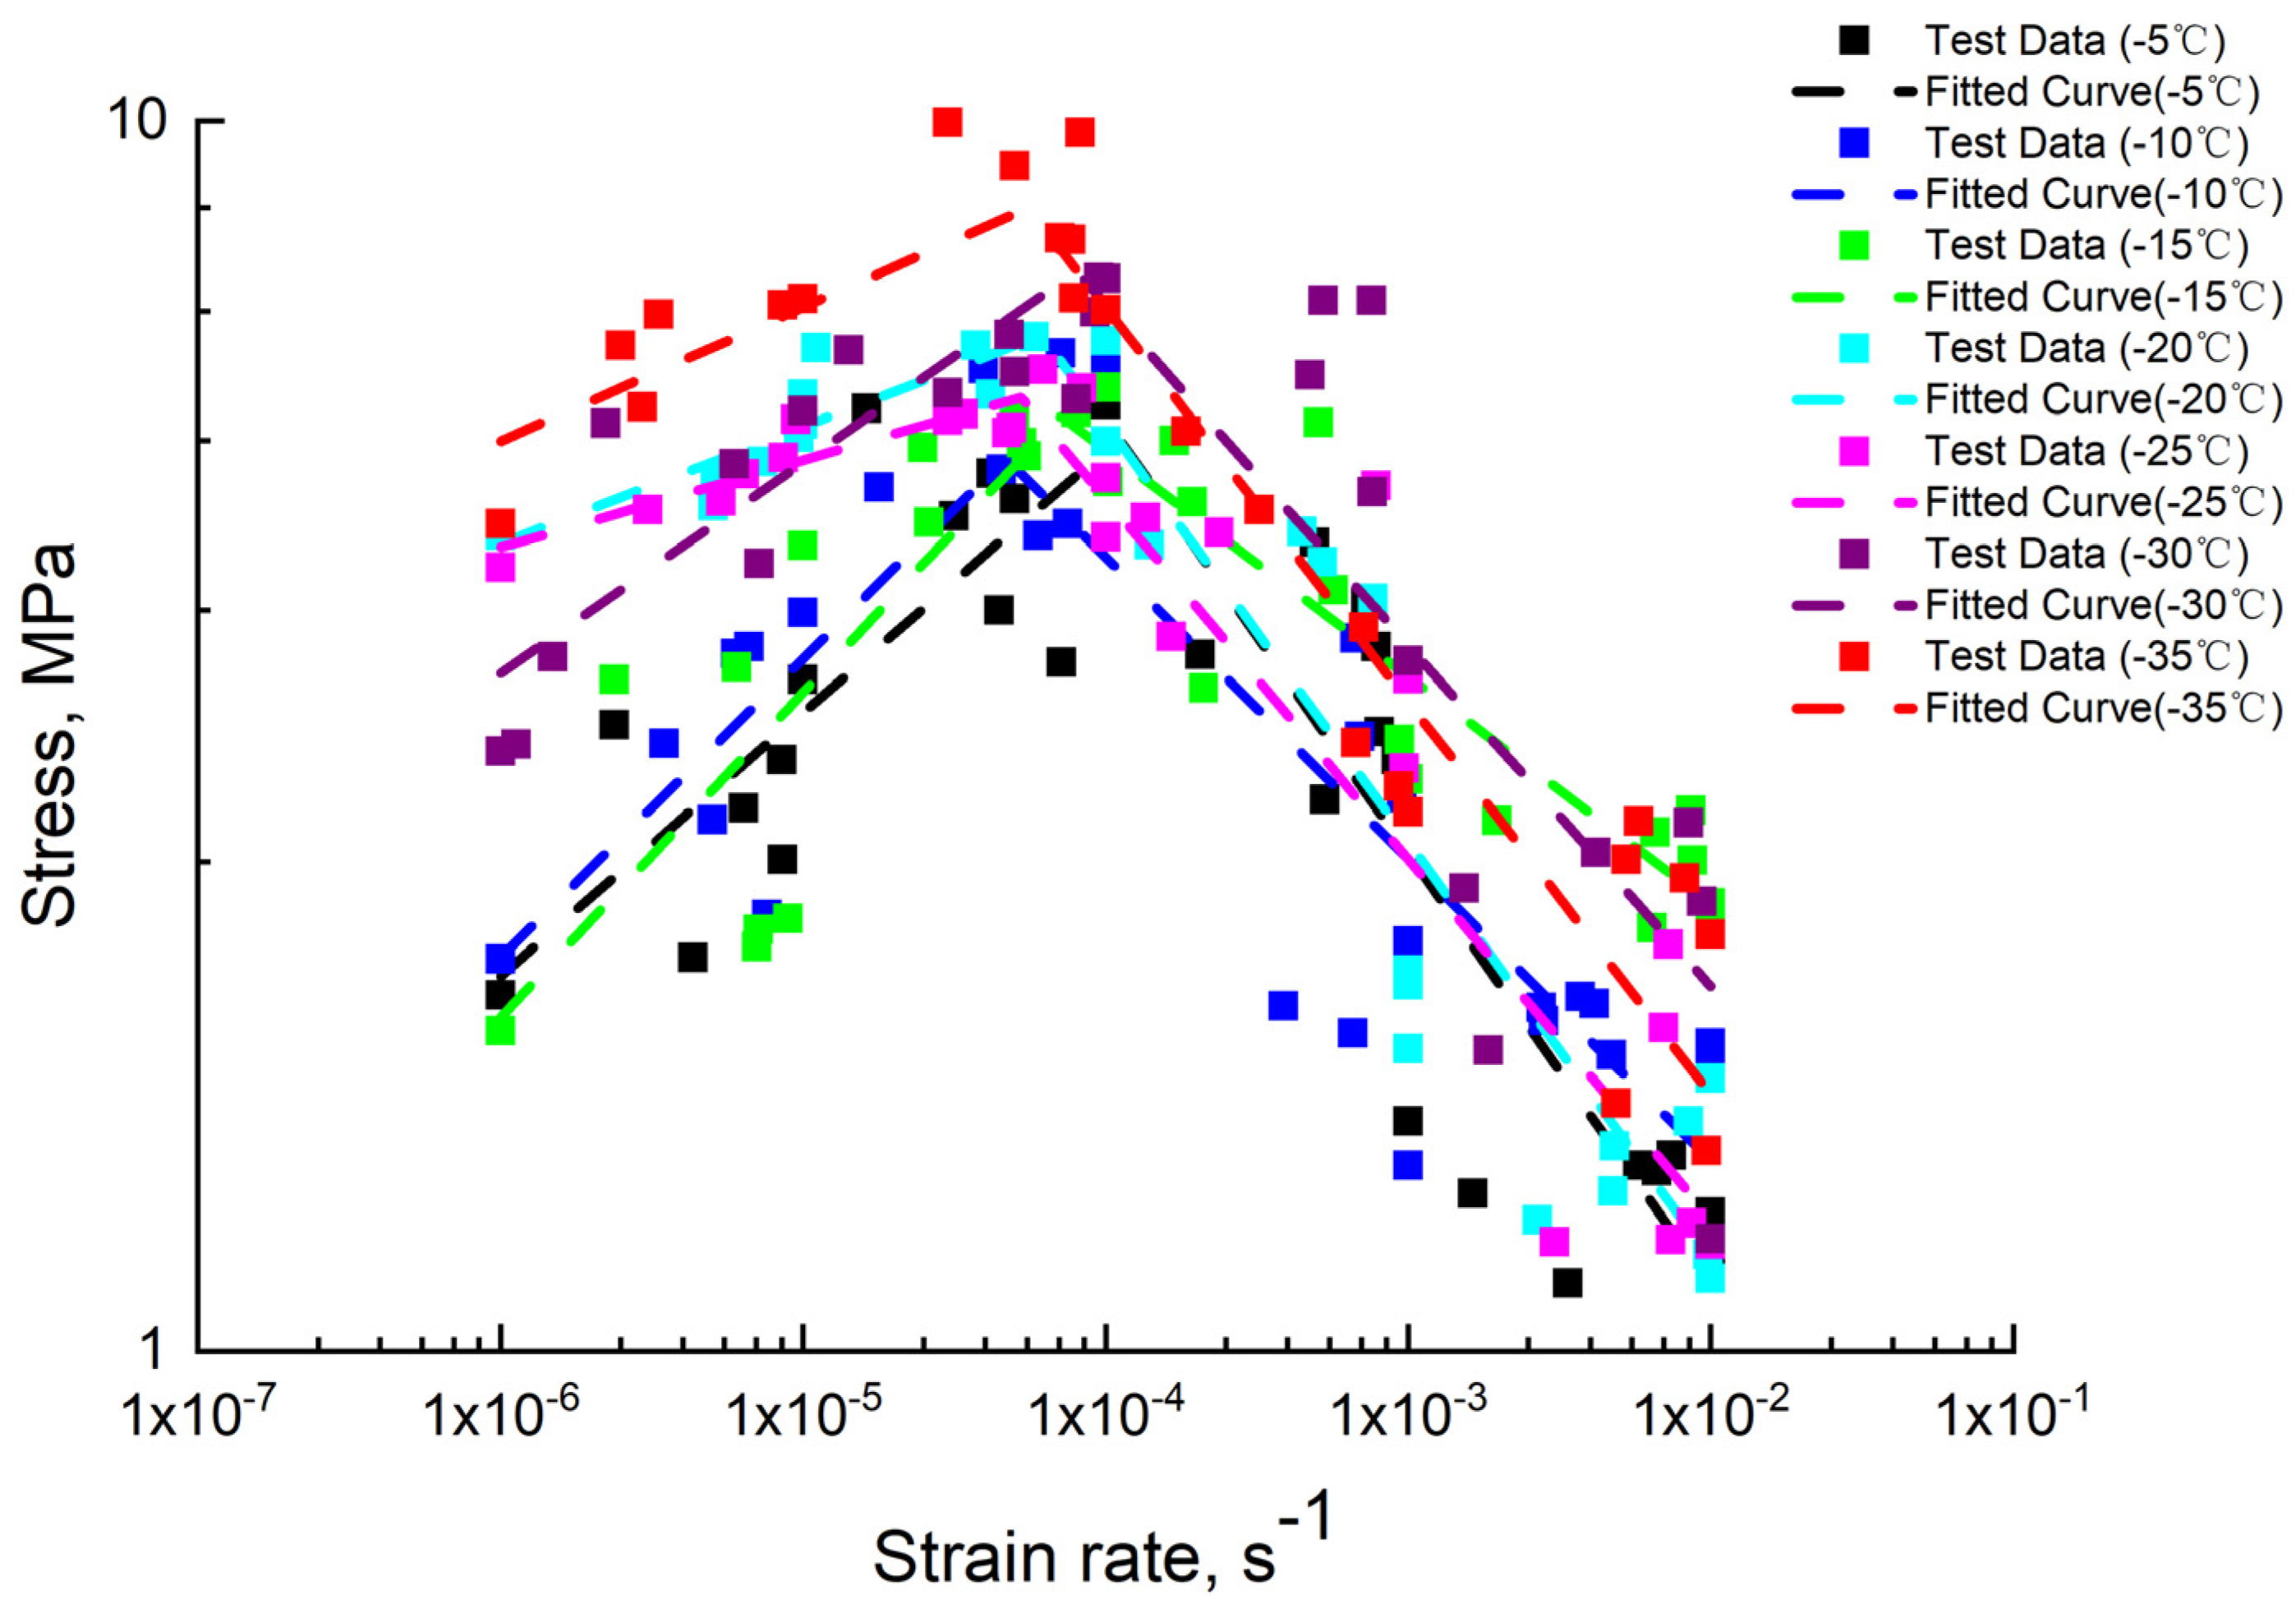
4.1. Stress vs. Strain Rate

In Section 3, ice shows different mechanical behaviors in different strain rate ranges, so the uniaxial compressive strength of ice can correspond to the strain rate. Figure 11 shows the curves of the uniaxial compressive strength of distilled water ice with strain rate in the double logarithmic coordinate system.
In the range of strain rate from 10−6 s−1 to 10−2 s−1, the uniaxial compressive strength first increases and then decreases. The strain rate range can be divided into ductile and brittle regimes according to the mechanical behavior of ice. The uniaxial compressive strength of ice reaches a maximum at the ductile-to-brittle transition point. The uniaxial compressive strength of ice at a strain rate higher than 10−2 s−1 was not obtained due to the limitation of test conditions. Some researchers have studied the uniaxial compressive strength of ice under a high strain rate. Test results from Jones [42] show that the uniaxial compressive strength of freshwater ice and low salinity sea ice does not decrease in the strain rate range of 10−1 s−1 to 101 s−1 but continues to increase. Wu et al. [17] conducted uniaxial compression tests on distilled water ice and lake ice in the range of strain rate 80 s−1 to 600 s−1 and the uniaxial compressive strength changed little.
The relationship between uniaxial compressive strength and strain rate of ice in the ductile regime should conform to Glen’s law [43] as shown in Equation (8).
ε ˙ = B σ c , v n
where B and n are empirical coefficients. In order to keep the equation consistent in dimension, Equation (8) is transformed into Equation (9) as follows:
σ c , v σ 1 = B ( ε ˙ ε 1 ˙ ) n
where σ 1   = 1 MPa, ε 1 ˙   = 1 s−1. The fitting curves of the relationship between uniaxial compressive strength and strain rate in the ductile regime are shown in the dashed lines in Figure 11 and the empirical coefficient and judgment coefficient are given in Table 3.
There is no unified conclusion about the relationship between uniaxial compressive strength and strain rate in a brittle regime. It can be seen from Figure 11 that within the strain rate range of this study, the relationship between uniaxial compressive strength and strain rate is still approximate to the power function. Therefore, Equation (9) is still used for fitting, and the fitting curves are shown in Figure 11. The empirical coefficient and judgment coefficient are also given. The fitting curve is in good agreement with the test data. The peak compressive strength of distilled water ice σ c p at different growth temperatures can be calculated through the fitting function, which is also listed in Table 3.

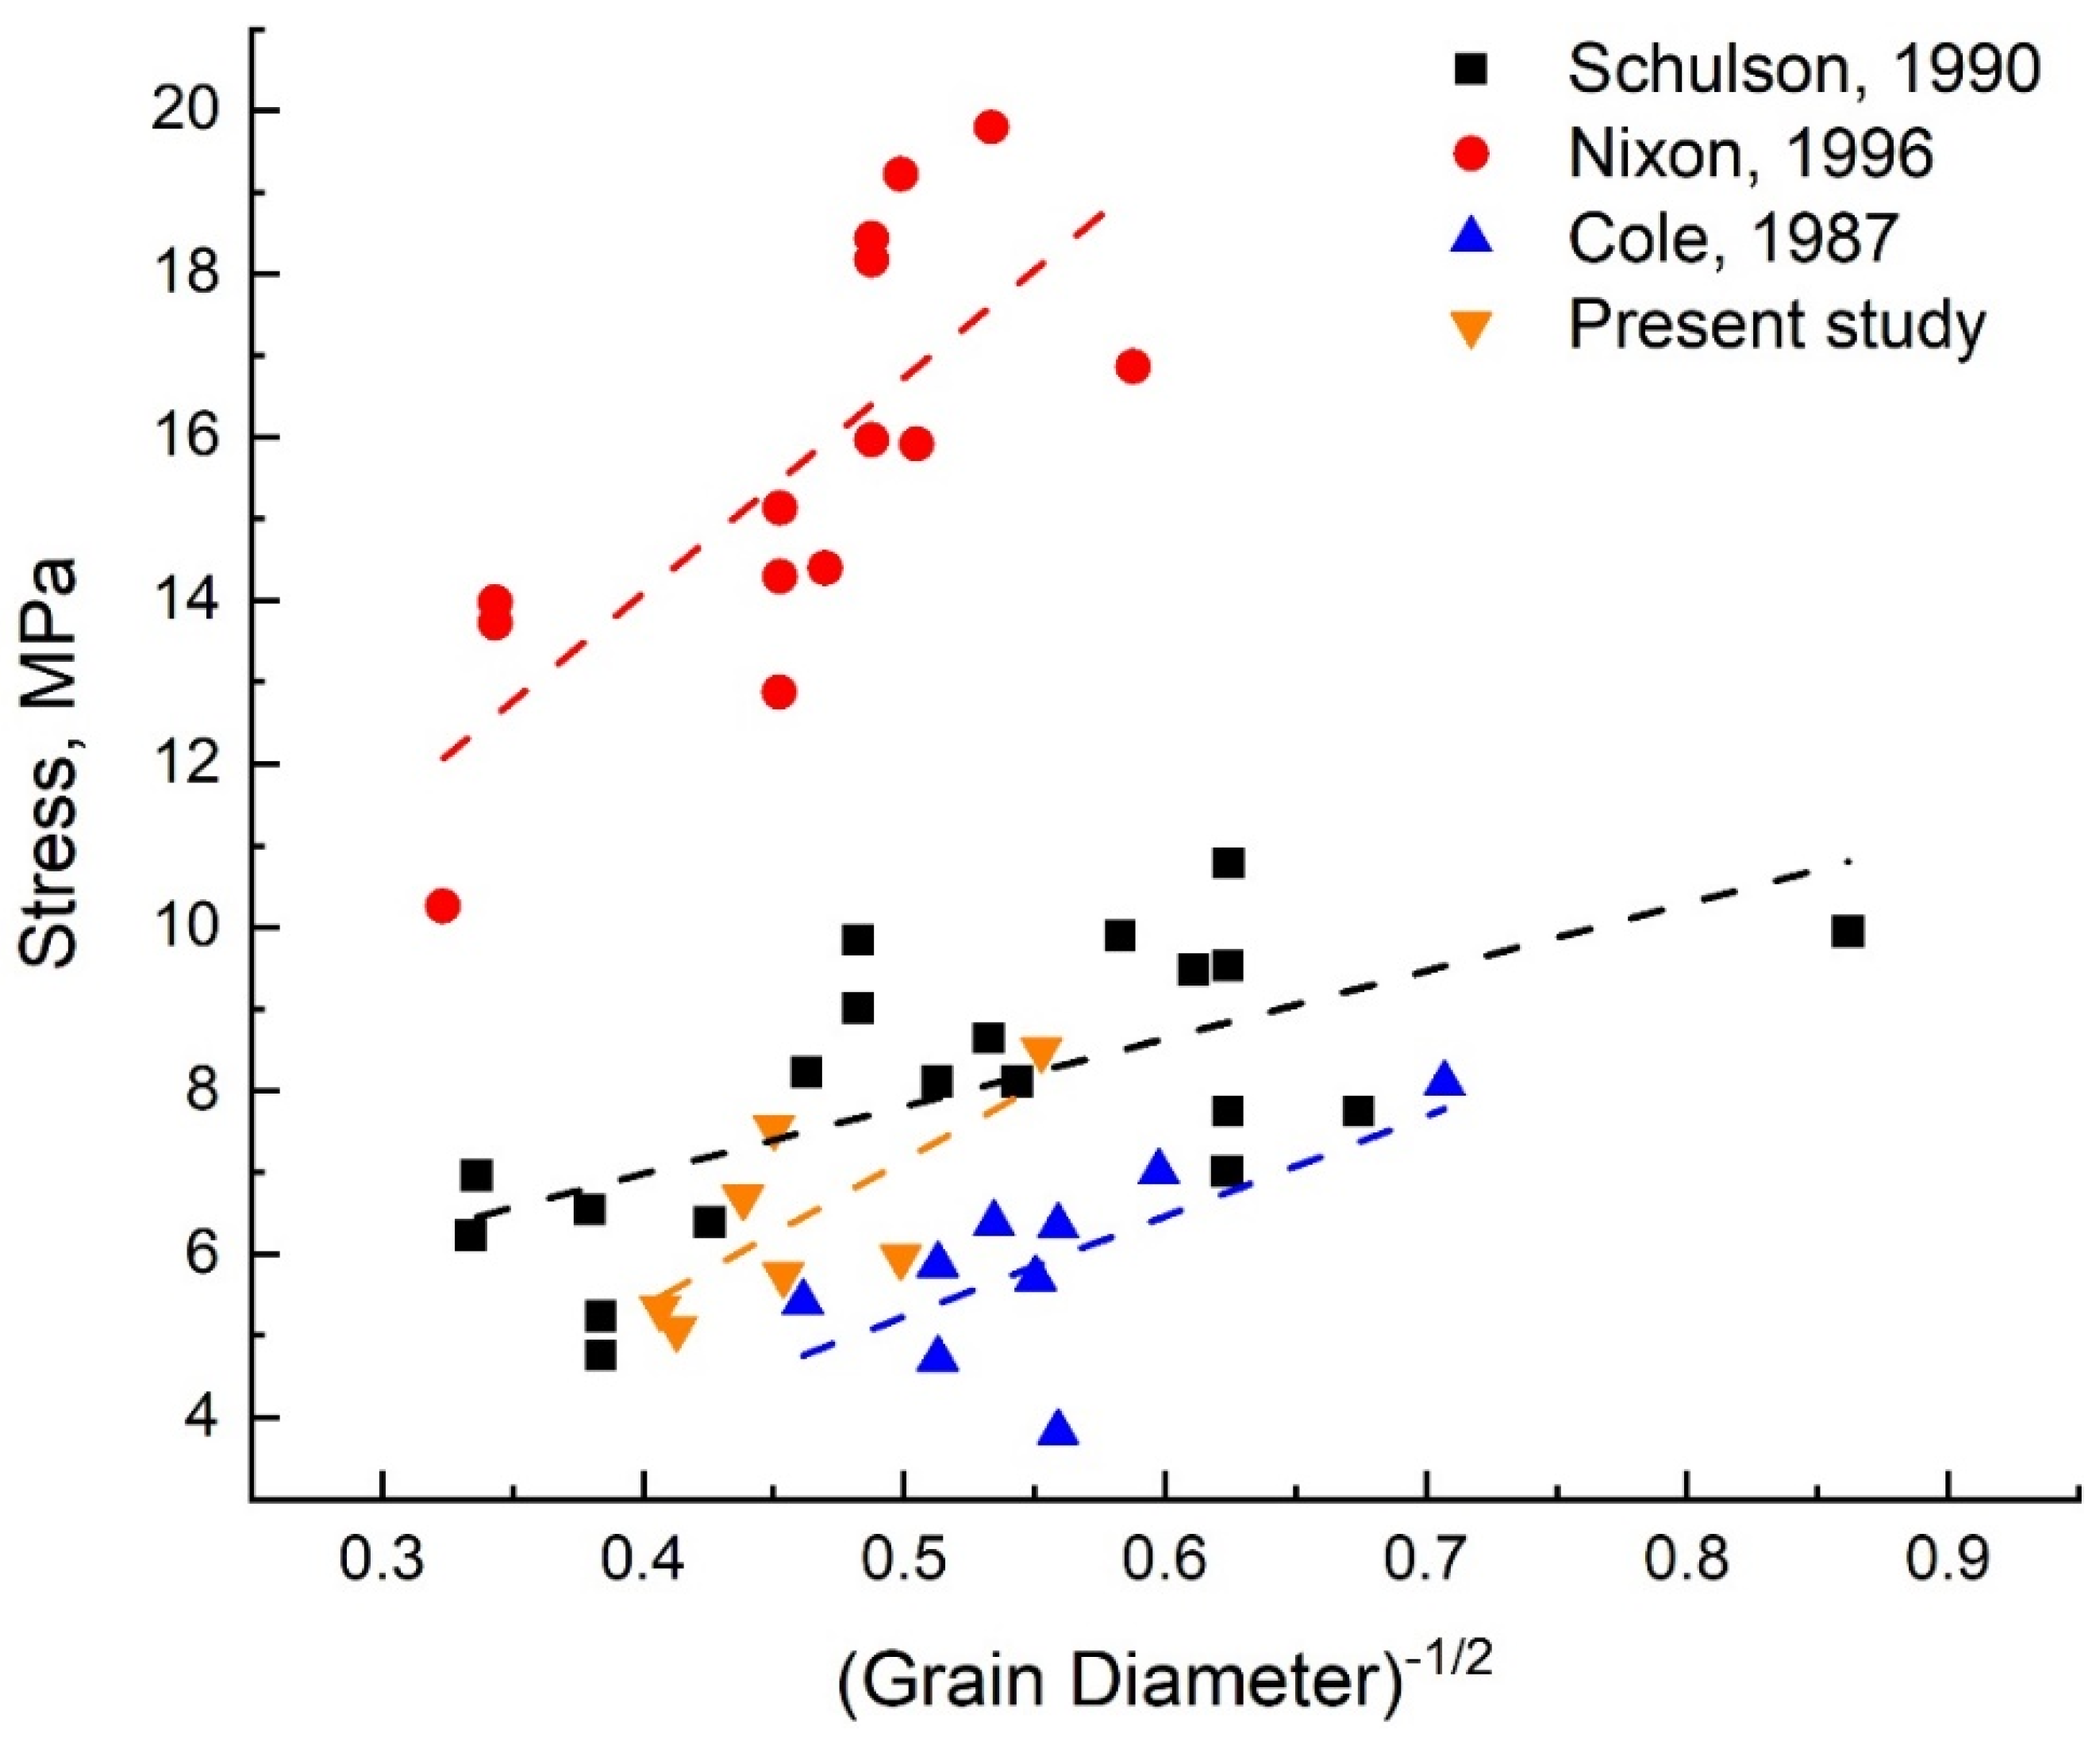
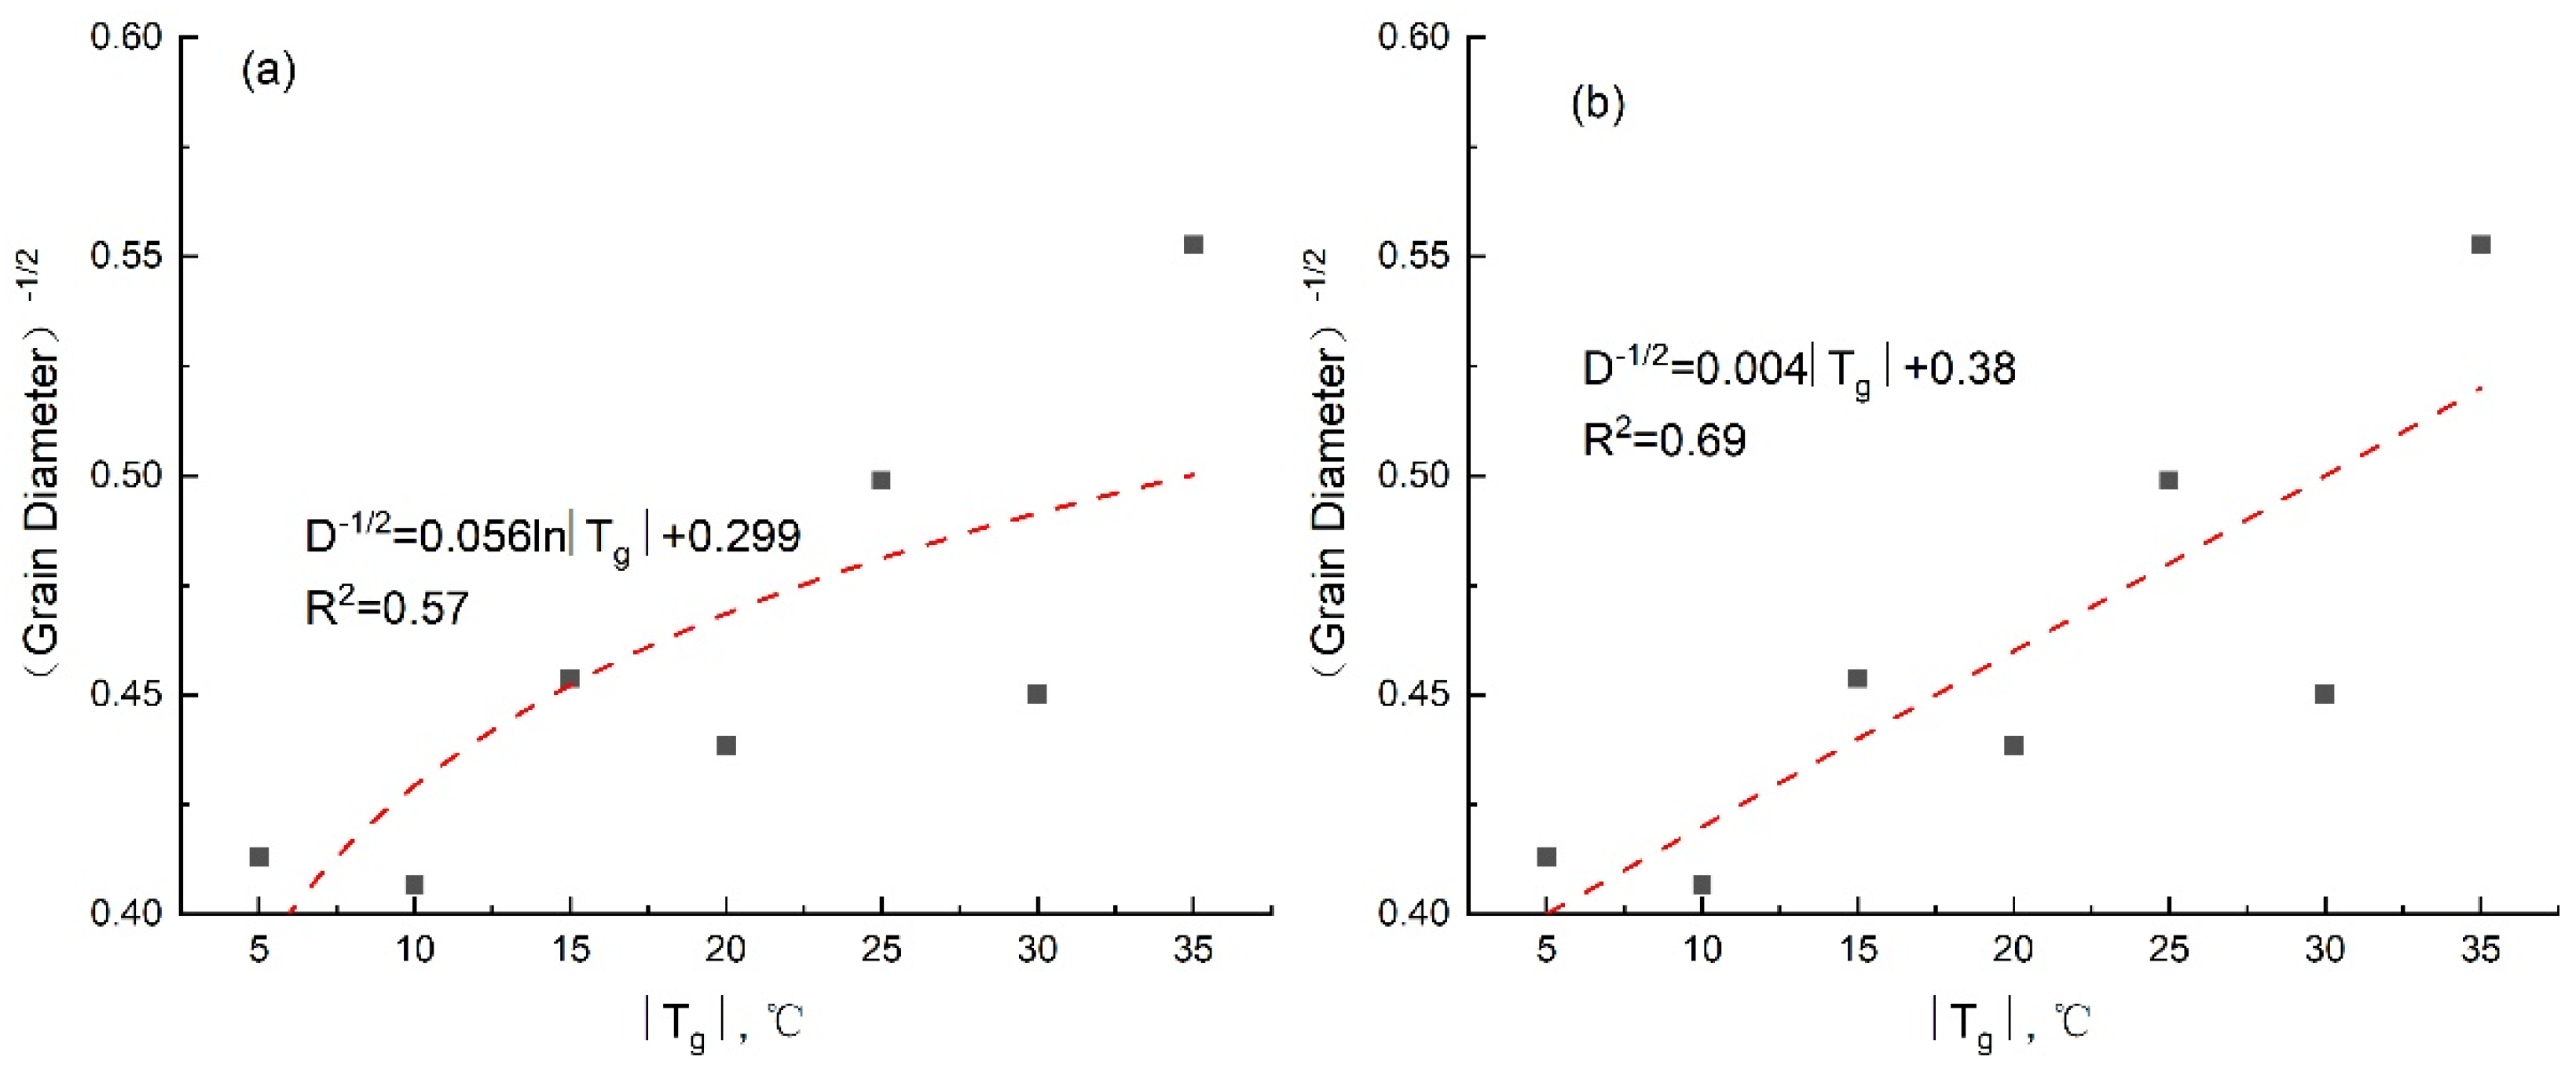
4.2. Stress vs. Grain Size

From Section 3, it can be seen that the grain size tends to decrease with the decrease in growth temperature. Grain size is another key factor affecting ice strength. Cole concluded from the tests that the stress of ice decreases with the increase in grain size [28]. This conclusion can be explained by dislocation theory, that is, for the same material, the smaller the grain diameter, the more the grain boundary; the greater the obstacle to dislocation movement, the greater the resistance to material deformation; and the higher the macro strength. Schulson [26] summarized the functional relationship between compressive strength and grain size after studying the brittle compression failure of ice, as shown in Equation (10):
σ c = σ 0 + k c d p
where σ c is compressive strength, d is grain size, σ 0 and k c are material constants and p = 1/2. Other researchers [26,28,44] mainly focused on the brittle regime to study the relationship between stress and grain size. In this paper, the relationship between the peak compressive strength of ice and grain size is analyzed in a larger range of strain rates (including ductile and brittle regime). Table 4 shows the average grain size of distilled water ice grown at different growth temperatures.
Combining the peak compressive strength given in Section 4.1, the relationship between the two is fitted with Equation (10). The test results and fitting curves are shown in Figure 12, and the empirical coefficients and judgment coefficients obtained by fitting this study with other studies are given in Table 5.
There is a good correlation between stress and the −1/2 power of grain size, and the trend of the results obtained in the present study is roughly the same as that of other studies. From the numerical point of view, the maximum stress in this study is roughly the same as the test results of Schulson. The stress obtained by Nixon is relatively large, while the result obtained by Cole is smaller. The reason is that the sample storage and test of this study and Schulson are carried out at −10 °C. The test temperatures of Nixon and Cole are −50 °C and −5 °C, respectively. The lower the test temperature, the greater the compressive strength of the ice. Many previous studies have also confirmed this conclusion [34,35,36,37].

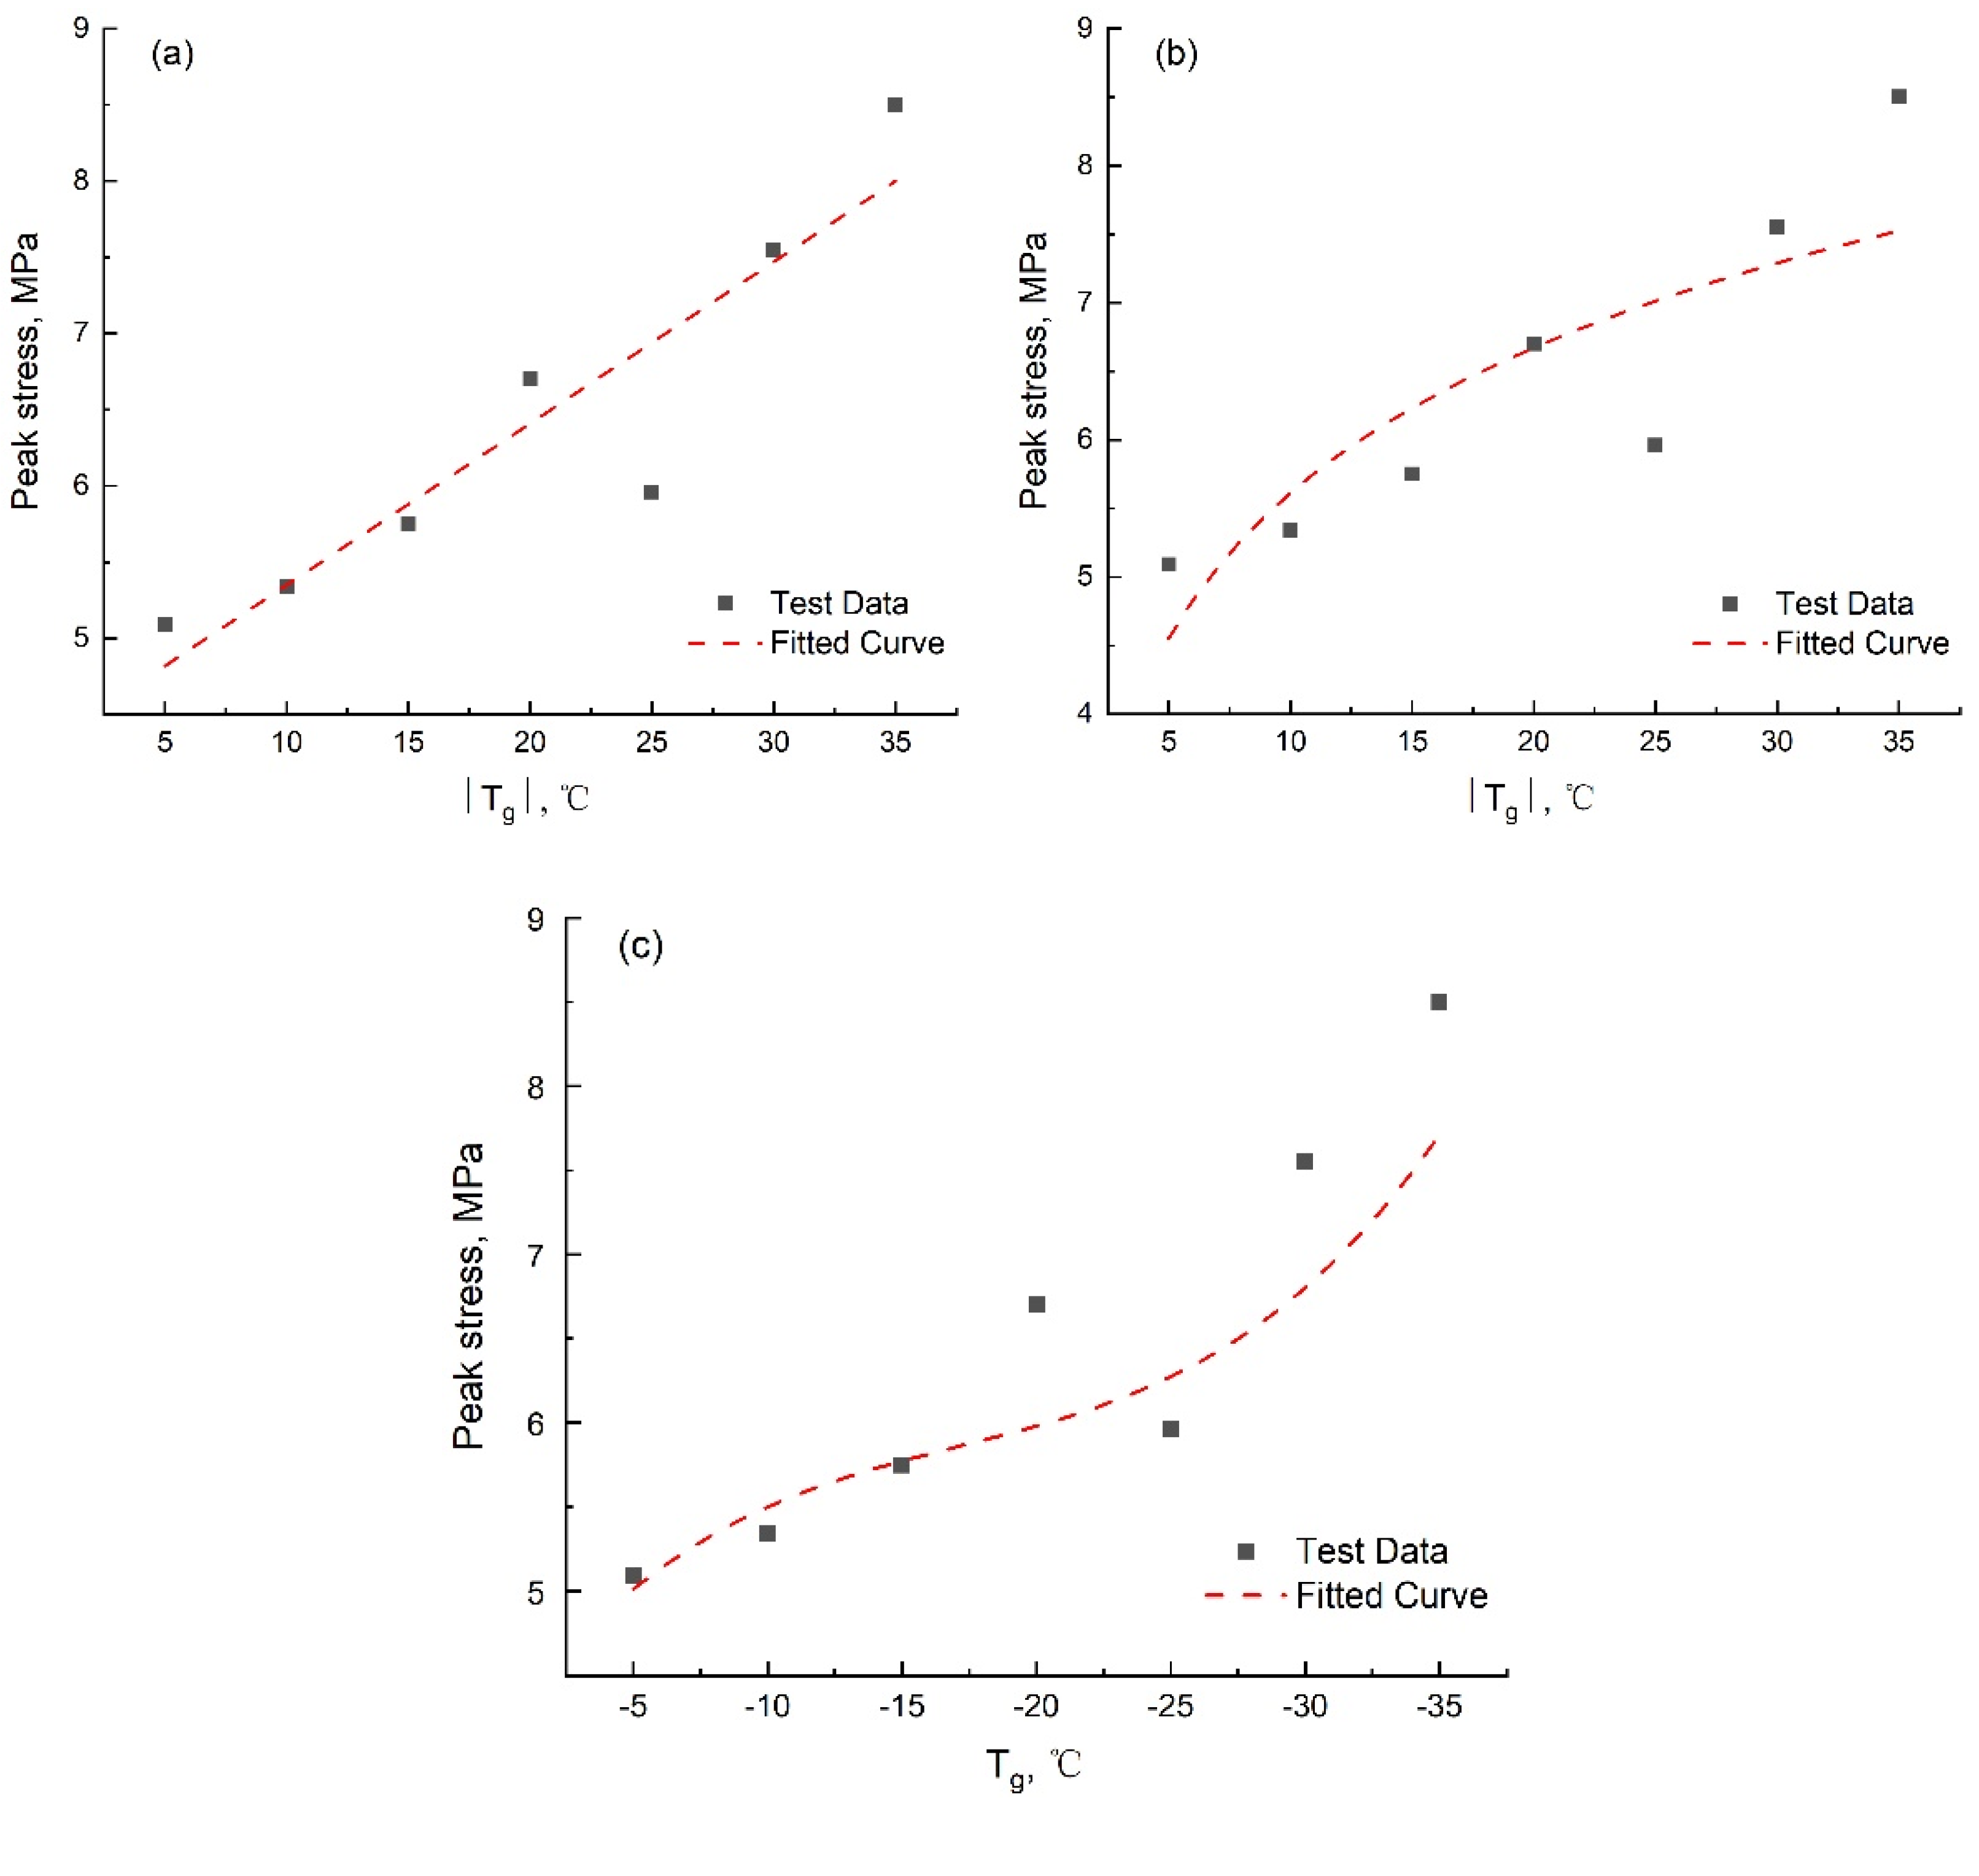
4.3. Stress vs. Growth Temperature

The uniaxial compressive strength of ice is closely related to temperature. Many previous studies on temperature and strength mainly discussed the influence of test temperature on strength. There is little research on the relationship between growth temperature and compressive strength at present. The test temperature in this study was kept constant at −10 °C in order to avoid the influence. The ice samples used in this study are distilled water ice, with no influence of salt and other solid impurities. The porosity of distilled water ice sample is small as shown in Section 3.2, so the influence of bubbles on strength can also be ignored, which can more directly study the influence of growth temperature on the peak compressive strength. It can be seen from the test results that the peak value of uniaxial compressive strength appears at −35 °C, which is 8.50 MPa calculated by using the fitting function.
Three functions are selected for data fitting referring to the relationship between test temperature and strength in previous studies. Yu [45] found that there is a linear relationship between the compressive strength of river ice and ice temperature in the range of −5 to −30 °C as Equation (11):
σ = A | θ | + B
Li [46] proposed the logarithmic relationship between the peak uniaxial compressive strength of Bohai Sea Ice and ice temperature as Equation (12):
σ c , m a x = A ln | θ | + B
Zhang [8] measured the shear and tensile strength of freshwater ice and sea ice at different temperatures and obtained the highest third-order polynomial relationship between shear/tensile strength and ice temperature as Equation (13):
σ = A θ 3 + B θ 2 + C θ + D
where σ is ice strength, θ is ice temperature, A , B , C , D are fitting coefficients. The peak uniaxial compressive strength σ c p and ice growth temperature T g ( T g replaces θ in the original equation) in this study are fitted by the three functions above, as shown in Figure 13. The empirical coefficient and judgment coefficient are listed in Table 6.
The correlation of the three functions is good according to the fitting results, but the most appropriate function should be selected from the perspective of physical facts. From the above, it can be seen that the growth temperature affects the grain size. It is found that the growth temperature has a logarithmic or linear relationship with the −1/2 power of the grain size, as shown in Figure 14.
The relationship between peak uniaxial compressive stress and growth temperature can be obtained by substituting the relationship between growth temperature and grain size into Equation (10) as follows:
σ c p = A 1 | T g | + B 1
σ c p = A 2 ln | T g | + B 2
Finally, the form of Equation (15) is selected as the relationship between the peak uniaxial compressive strength and the growth temperature. The reason is that the freezing process occurs below 0 °C. When the growth temperature is equal to 0 °C, there is no ice formation, that is, there will be no strength, which is inconsistent with the physical fact that the strength is close to zero when the temperature is near the freezing point. The logarithmic function conforms to the requirements of both physics and mathematics [46]. By deducing and summarizing the relationship between the peak uniaxial compressive strength and the growth temperature, it is found that the growth temperature affects the strength of ice by controlling the grain size of ice crystal when other factors are ignored. Finally, the relationship between peak uniaxial compressive stress and growth temperature is given as follows:
σ c p = 1.527 ln | T g | + 2.096
This conclusion improves the research system of ice strength. It is also conducive to guiding the estimation and judgment of ice strength in engineering applications in cold regions. Finally, it provides a theoretical basis and technical support for ships to choose appropriate routes and ice-breaking schemes, as well as the design of maritime structures and risk avoidance.

5. Conclusions

In this study, uniaxial compressive strength tests of distilled water ice at different growth temperatures were carried out. The conclusions based on experimental results and comparison with other research work are given as follows:
  • The growth temperatures were set at −5 °C, −10 °C, −15 °C, −20 °C, −25 °C, −30 °C and −35 °C. The ice crystal structure in this study is columnar. Ice density ranges from 900 kg/m3 to 920 kg/m3 and increases with decreasing temperature. Grain size increases with the increases in ice depth, and the average grain size range is 2–7 mm, which roughly decreases with the decrease in temperature.
  • The uniaxial compressive strength of ice at different strain rates is obtained, which first increases with the increase in strain rate, and then decreases with the increase in strain rate after reaching the peak value. The results show that ice is ductile at a low strain rate and brittle at a high strain rate. The relationship between uniaxial compressive strength and strain rate is a power function.
  • Compared with previous studies, it is found that the peak compressive strength of ice gradually increases with the decrease in grain size. The results show that the relationship between the peak compressive strength and the—1/2 power of grain size is a linear function.
  • Referring to the previous research, three functional forms of linear, logarithmic and polynomial have been proposed. The experimental results of this study are fitted in three functions to reveal the mathematical relationship. In addition, by summarizing the relationship between growth temperature and grain size, combined with mathematical requirements and physical facts, it is finally determined that the relationship between ice peak compressive strength and growth temperature conforms to the logarithmic function. This result explains that the growth temperature affects the compressive strength of ice by controlling the grain size.
The conclusions of this paper can help guide the safe navigation of ships and the design of offshore marine structures in cold regions.

Author Contributions

Conceptualization, Y.Z. and Z.Q.; methodology, Y.Z.; software, J.R.; validation, Y.Z., Z.Q. and S.L.; formal analysis, Y.Z.; investigation, Z.F.; resources, X.C.; data curation, Y.Z.; writing—original draft preparation, Y.Z.; writing—review and editing, S.L.; visualization, W.H.; supervision, Z.Q.; project administration, Z.Q. and Y.Z.; funding acquisition, Z.Q. All authors have read and agreed to the published version of the manuscript.

Funding

This research was funded by the National Natural Science Foundation of China, grant number 51676144.

Institutional Review Board Statement

Not applicable.

Informed Consent Statement

Not applicable.

Data Availability Statement

Not applicable.

Acknowledgments

The authors would like to thank the Wuhan University of Technology (WUT).

Conflicts of Interest

The authors declare no conflict of interest.

References

  1. Overland, J.E.; McNutt, S.L.; Salo, S.; Groves, J.; Li, S. Arctic sea ice as a granular plastic. J. Geophys. Res.-Oceans. 1998, 103, 21845–21867. [Google Scholar] [CrossRef]
  2. Schulson, E.M. Brittle failure of ice. Eng. Fract. Mech. 2001, 68, 1839–1887. [Google Scholar] [CrossRef]
  3. Snyder, S.A.; Schulson, E.M.; Renshaw, C.E. Effects of prestrain on the ductile-to-brittle transition of ice. Acta. Mater. 2016, 108, 110–127. [Google Scholar] [CrossRef] [Green Version]
  4. Kjerstad, Ø.K.; Metrikin, I.; Løset, S.; Skjetne, R. Experimental and phenomenological investigation of dynamic positioning in managed ice. Cold Reg. Sci. Technol. 2015, 111, 67–79. [Google Scholar] [CrossRef]
  5. Montewka, J.; Goerlandt, F.; Kujala, P.; Lensu, M. Towards probabilistic models for the prediction of a ship performance in dynamic ice. Cold Reg. Sci. Technol. 2015, 112, 14–28. [Google Scholar] [CrossRef]
  6. Sinha, N.K. Uniaxial compressive strength of first-year and multi-year sea ice. Can. J. Civ. Eng. 1984, 11, 82–91. [Google Scholar] [CrossRef]
  7. Saeki, H.; Ozaki, A.; Kubo, Y. Experimental study on flexural strength and elastic modulus of sea ice. In Proceedings of the 6th international Conference on Port and Ocean Engineering under Arctic Conditions, Quebec City, QC, Canada, 27–31 July 1981. [Google Scholar]
  8. Zhang, Y.; Zhang, Y.; Guo, R.; Cui, B. Method for Testing Shear and Tensile Strengths of Freshwater/Seawater Ice. Water 2022, 14, 1363. [Google Scholar] [CrossRef]
  9. Lainey, L.; Tinawi, R. The Mechanical Properties of Sea Ice—A compilation of available data. Can. J. Civ. Eng. 1984, 11, 884–923. [Google Scholar] [CrossRef]
  10. Richter, M.J.A. US Research in Ice Mechanics: 1987–1990. Cold Reg. Sci. Technol. 1992, 20, 231–246. [Google Scholar] [CrossRef]
  11. Moslet, P.O. Field Testing of Uniaxial Compression strength of columnar sea ice. Cold Reg. Sci. Technol. 2007, 48, 1–14. [Google Scholar] [CrossRef]
  12. Weertman, J. Creep deformation of ice. J. Annu. Rev. Earth Planet. Sci. 1983, 11, 215–240. [Google Scholar] [CrossRef] [Green Version]
  13. Timco, G.W.; Weeks, W.F. A review of the engineering properties of sea ice. Cold Reg. Sci. Technol. 2010, 60, 107–129. [Google Scholar] [CrossRef]
  14. Jones, S.J.; Glen, J.W. The mechanical properties of single crystals of pure ice. J. Glaciol. 1969, 54, 463–473. [Google Scholar] [CrossRef] [Green Version]
  15. Wu, X.; Prakash, V. Dynamic strength of distill water and lake water ice at high strain rates. Int. J. Impact. Eng. 2015, 76, 155–165. [Google Scholar] [CrossRef]
  16. Kim, H.; Keune, J.N. Compressive strength of ice at impact strain rates. J. Mater. Sci. 2007, 42, 2802–2806. [Google Scholar] [CrossRef]
  17. Timco, G.W.; Frederking, R.M.W. Comparative strengths of fresh water ice. Cold Reg. Sci. Technol. 1982, 6, 21–27. [Google Scholar] [CrossRef] [Green Version]
  18. Bonath, V.; Edeskär, T.; Lintzén, N.; Fransson, L.; Cwirzen, A. Properties of ice from first-year ridges in the Barents Sea and Fram Strait. Cold Reg. Sci. Technol. 2019, 168, 102890. [Google Scholar] [CrossRef]
  19. Sinha, N.K. Constant strain- and stress-rate compressive strength of columnar-grained ice. J. Mater. Sci. 1982, 17, 785–802. [Google Scholar] [CrossRef] [Green Version]
  20. Chen, A.C.T.; Lee, J. Large-Scale Ice Strength Tests at Slow Strain Rates. J. Offshore Mech. Arct. 1988, 110, 302–306. [Google Scholar] [CrossRef]
  21. Qi, S.; Schulson, E.M. The effect of temperature on the ductile-to-brittle transition in columnar ice. In Proceedings of the 14th International Symposium on ice, Potsdam, NY, USA, 27–31 July 1998. [Google Scholar]
  22. Deng, K.; Feng, X.; Tian, X.; Hu, Y. Experimental research on compressive mechanical properties of ice under low strain rates. Mater. Today Commun. 2020, 24, 101029. [Google Scholar] [CrossRef]
  23. Schulson, E.M.; Buck, S.E. The ductile-to-brittle transition and ductile failure envelopes of orthotropic ice under biaxial compression. Acta. Metall. Mater. 1995, 43, 3661–3668. [Google Scholar] [CrossRef]
  24. Baker, R.W. The influence of ice-crystal size on creep. J. Glaciol. 1978, 21, 485–500. [Google Scholar] [CrossRef] [Green Version]
  25. Jones, S.J.; Chew, H.A.M. Effect of sample and grain size on the compressive strength of ice. Ann. Glaciol. 1983, 4, 129–132. [Google Scholar] [CrossRef] [Green Version]
  26. Schulson, E.M. The brittle compressive fracture of ice. Acta Metall. Mater. 1990, 38, 1963–1976. [Google Scholar] [CrossRef]
  27. Iliescu, D.; Baker, I. The structure and mechanical properties of river and lake ice. Cold Reg. Sci. Technol. 2007, 48, 202–217. [Google Scholar] [CrossRef]
  28. Cole, D.M. Strain-rate and Grain-size Effects in Ice. J. Glaciol. 1987, 33, 274–280. [Google Scholar] [CrossRef] [Green Version]
  29. Potter, R.S.; Cammack, J.M.; Braithwaite, C.H.; Church, P.D.; Walley, S.M. A study of the compressive mechanical properties of defect-free, porous and sintered water-ice at low and high strain rates. Icarus 2020, 351, 113940. [Google Scholar] [CrossRef]
  30. Ouyang, Q.; Qi, C.; Lian, J.; Zhao, X. Dynamic Compressive Strength and Failure of Natural Lake Ice Under Moderate Strain Rates at Near Melting Point Temperature. Lat. Am. J. Solids. Stru. 2017, 14, 1669–1694. [Google Scholar] [CrossRef]
  31. Kovacs, A. Estimating the full-scale flexural and compressive strength of first-year sea ice. J. Geophys. Res-Oceans. 1997, 102, 8681–8689. [Google Scholar] [CrossRef]
  32. Han, H.; Li, Z.; Huang, W.; Lu, P.; Lei, R. The uniaxial compressive strength of the Arctic summer sea ice. Acta. Oceanol. Sin. 2015, 34, 129–136. [Google Scholar] [CrossRef]
  33. Timco, G.W.; Frederking, R.M.W. Compressive strength of sea ice sheets. Cold Reg. Sci. Technol. 1990, 17, 227–240. [Google Scholar] [CrossRef]
  34. Shazly, M.; Prakash, V.; Lerch, B.A. High strain-rate behavior of ice under uniaxial compression. Int. J. Solids Struct. 2009, 46, 1499–1515. [Google Scholar] [CrossRef] [Green Version]
  35. Farid, H.; Saeidi, A.; Farzaneh, M. Prediction of failure in atmospheric ice under triaxial compressive stress. Cold Reg. Sci. Technol. 2017, 138, 46–56. [Google Scholar] [CrossRef]
  36. Arakawa, M.; Maeno, N. Mechanical strength of polycrystalline ice under uniaxial compression. Cold Reg. Sci. Technol. 1997, 26, 215–229. [Google Scholar] [CrossRef]
  37. Wu, X.; Prakash, V. Dynamic compressive behavior of ice at cryogenic temperatures. Cold Reg. Sci. Technol. 2015, 118, 1–13. [Google Scholar] [CrossRef] [Green Version]
  38. Schwarz, J.; Frederking, R.; Gavrillo, V.; Petrov, I.G.; Hirayama, K.I.; Mellor, M.; Tryde, P.; Vaudrey, K.D. Standardized testing methods for measuring mechanical properties of ice. Cold Reg. Sci. Technol. 1981, 4, 245–253. [Google Scholar] [CrossRef]
  39. Cox, G.F.N.; Weeks, W.F. Equations for Determining the Gas and Brine Volumes in Sea-Ice Samples. J. Glaciol. 1983, 29, 306–316. [Google Scholar] [CrossRef] [Green Version]
  40. Sinha, N.K.; Frederking, R.M.W. Effect of test system stiffness on strength of ice. In Proceedings of the Fifth International Conference on Port and Ocean Engineering under Arctic Conditions, Trondheim, Norway, 13–18 August 1979. [Google Scholar]
  41. Timco, G.W.; Frederking, R.M.W. A procedure to account for machine stiffness in uni-axial compressive compression tests. In Proceedings of the International Symposium on Ice (IAHR), Hamburg, Germany, 27–31 August 1984. [Google Scholar]
  42. Jones, S.J. High strain-rate compression tests on ice. J. Phys. Chem. B. 1997, 101, 6099–6101. [Google Scholar] [CrossRef]
  43. Glen, J.W. The creep of polycrystalline ice. P. Roy. Soc. A-Math. Phy. 1955, 228, 519–538. [Google Scholar] [CrossRef]
  44. Nixon, W.A. Wing crack models of the brittle compressive failure of ice. Cold Reg. Sci. Technol. 1996, 24, 41–55. [Google Scholar] [CrossRef]
  45. Yu, T.; Wang, J.; Du, F.; Zhang, L. Experimental research on ice disaster in Huma River. J. Nat. Disaster. 2007, 16, 43–48. (In Chinese) [Google Scholar] [CrossRef]
  46. Li, Z.; Zhang, L.; Lu, P.; Leppäranta, M.; Li, G. Experimental study on the effect of porosity on the uniaxial compressive strength of sea ice in Bohai Sea. Sci. China Technol. Sci. 2011, 54, 2429–2436. [Google Scholar] [CrossRef]
Figure 1. Ice preparation and cryogenic laboratory temperature control panel. (a) Plastic foam condensation tanks filled with distilled water in a cryogenic laboratory. (b)Temperature control panel.
Water 14 04079 g001
Figure 2. Test sample preparation.
Water 14 04079 g002
Figure 3. Ice crystal structure observation device.
Water 14 04079 g003
Figure 4. Test devices. (a) WDW-100E electronic universal testing machine. (b) Testing zone.
Water 14 04079 g004
Figure 5. Low-temperature test chamber.
Water 14 04079 g005
Figure 6. Stress-strain curves and deformation types of uniaxial compression on distilled water ice grown at different temperatures. (a) The strain rate is 10−5 s−1, at which ice samples perform ductile deformation. (b) The strain rate is 10−3 s−1, at which ice samples perform brittle deformation. (c,d) are ductile and brittle deformation respectively.
Water 14 04079 g006
Figure 7. Correction of stress-strain curve in ductile regime.
Water 14 04079 g007
Figure 8. Correction of stress-strain curve in brittle regime.
Water 14 04079 g008
Figure 9. Thin sections of distilled water ice grown at −15 °C photographed in polarized light. (a) is the horizontal section at the depth of 0 cm (top) and (b) is the vertical section of 8–16 cm.
Water 14 04079 g009
Figure 10. Grain size vs. depth curves of distilled water ice grown at different temperatures.
Water 14 04079 g010
Figure 11. Test data of uniaxial compressive strength versus strain rate and fitted curves for distilled water ice samples grown at different temperatures.
Water 14 04079 g011
Figure 12. Stress versus grain size (data from Schulson (1990) [26], Nixon (1996) [44], Cole (1987) [28] and present study) and fitted curves.
Water 14 04079 g012
Figure 13. Peak stress versus growth temperature and curves fitted with different function types. Solid squares are test data. Dashed lines are fitted curves. (ac) are linear, logarithmic and polynomial function respectively.
Water 14 04079 g013
Figure 14. Grain size versus growth temperature and curves fitted with different function types. Solid squares are test data. Dashed lines are fitted curves. (a) is a logarithmic function and (b) is a linear function. Fitting equations and correlation coefficients are given.
Water 14 04079 g014
Table 1. Typical Experimental conditions and corrected results.
T (°C) ε ˙ (s−1) σ m a x   ( MPa ) ε m a x   ( % )
1 × 10 6 1.950.51
1 × 10 5 3.520.64
−5 1 × 10 4 5.880.71
1 × 10 3 1.540.18
1 × 10 2 1.300.26
1 × 10 6 2.080.49
1 × 10 5 3.980.72
−10 1 × 10 4 6.390.71
1 × 10 3 2.110.22
1 × 10 2 1.750.27
1 × 10 6 1.820.40
1 × 10 5 4.510.67
−15 1 × 10 4 6.080.54
1 × 10 3 2.910.29
1 × 10 2 2.290.27
1 × 10 6 4.610.63
1 × 10 5 4.670.79
−20 1 × 10 4 5.490.77
1 × 10 3 3.460.36
1 × 10 2 1.750.48
1 × 10 6 4.340.73
1 × 10 5 5.810.87
−25 1 × 10 4 5.130.52
1 × 10 3 3.520.27
1 × 10 2 1.220.34
1 × 10 6 3.070.83
1 × 10 5 7.170.94
−30 1 × 10 4 7.450.87
1 × 10 3 3.640.38
1 × 10 2 1.230.31
1 × 10 6 4.701.09
1 × 10 5 8.650.99
−35 1 × 10 4 7.020.74
1 × 10 3 3.630.48
1 × 10 2 2.180.22
Table 2. Measured average density and porosity of ice samples at different growth temperatures.
Growth Temperature (°C)Average Density (kg/m3)Average Porosity (‰)
−590612.75
−1090712.42
−159154.47
−209164.14
−259182.72
−309192.40
−359193.16
Table 3. The fitting coefficients and coefficients of determination R 2 of uniaxial compressive strength tests on distilled water ice.
T g
(°C)
Ductile RegimeBrittle Regime σ c p
(MPa)
BnR2BnR2
−538.7980.2140.580.225−0.350.785.09
−1060.2360.2430.700.460−0.2460.765.34
−1571.6110.2640.770.991−0.1840.775.75
−2016.8370.0950.730.248−0.340.886.70
−2512.0010.0710.750.332−0.2930.855.96
−3038.2620.1720.710.553−0.2770.637.55
−3524.7410.1090.600.370−0.320.898.50
Table 4. Result of grain size measurement.
T g (°C) Average Grain Size (mm) σ c p (MPa)
−55.865.09
−106.055.34
−154.855.75
−205.206.70
−254.025.96
−304.937.55
−352.378.50
Table 5. Regression and correlation coefficients for stress vs. grain size fitting function.
ItemsSchulson, 1990Nixon, 1996Cole, 1987Present Study
σ 0 3.673.52−0.89−1.81
k c 8.2726.412.2517.91
R20.440.560.450.54
Table 6. Regression and correlation coefficients for peak stress vs. growth temperature fitting functions.
Function TypeFit CoefficientsR2
ABCD
Linear0.1064.290//0.85
Logarithmic1.5272.096//0.71
Polynomial−0.0002−0.0103−0.2174.160.91
Publisher’s Note: MDPI stays neutral with regard to jurisdictional claims in published maps and institutional affiliations.

