

The Structural Characteristics of the Virtual Water Trade Network of the China’s Major Crops

1
College of Water and Architectural Engineering, Shihezi University, Shihezi 832000, China
2
State Key Laboratory of Simulation and Regulation of Water Cycle in River Basin, Department of Water Resources, China Institute of Water Resources and Hydropower Research, Beijing 100038, China
3
Zhejiang Ecological Civilization Academy, Huzhou 313300, China
4
School of Public Affairs, Zhejiang University, Hangzhou 310058, China
*
Authors to whom correspondence should be addressed.
Water 2022, 14(24), 4083; https://doi.org/10.3390/w14244083
Submission received: 6 November 2022
/
Revised: 11 December 2022
/
Accepted: 12 December 2022
/
Published: 14 December 2022
(This article belongs to the Special Issue Advance in Water Management and Water Policy Research)
Abstract
:The original intention of virtual water trade (VWT) is to help water-scarce areas adjust the crop trade structure to alleviate the water shortage problem. However, China’s existing virtual water trade (VWT) must effectively alleviate the problem. This paper’s structural features and stability of the VWT network (VWTN) in China’s major crop trade between 2000 and 2017 were characterized using complex network theory. The results in terms of time scale showed that the total content of VW in China’s major crops increased by ~23.6% for 18 years. Trade relations among most regions remained stable, whereas a few areas changed: Jilin, Henan, and Heilongjiang played essential roles in the output network, and so did Guangdong, Shanghai, and Fujian in the input network. Attributed to policy adjustment, Henan and Jilin became more prominent in the output network with the gradual decline of Jiangsu’s position. Regarding spatial scale, the cumulative distribution of degrees consistent with the power–law relationship showed high variability and vulnerability of China’s VWTN, especially when nodes were weighted. Since areas with more VWT partners/content provided connectivity to those with fewer partners/content, it is worthwhile to focus on developing protection policies for critical areas. The virtual water trade from North China (water-poor) to South China (water-rich) is contrary to the distribution of water resources. A similar situation showed in a global world that the long-term supply relationship would aggravate the water resources shortage and food security. Furthermore, we suggest combining network theory and VWT to lay the foundation for the invulnerability research of VWTN and the optimal regulation of crops.
1. Introduction
Water shortage is a crucial global challenge, in particular, because of its impacts on food production [1,2]. The percentage of agricultural water use in China has exceeded more than 60% since 2003, which is significantly higher than in developed countries [3]. The term “virtual water” was first proposed by Tony Allan in 1993 and provided a novel idea for water resource security management [4,5]. It gradually became a key to alleviating the food crisis and water shortage. Inter-regional food trade transfers virtual water (VW) resources between regions and has been shown to save ~6% of the water used in agriculture [6]. However, due to population growth, crop production must increase, but climate projections for many regions indicated unsuitable conditions to support incremental production, such as Iran [7]. Specifically, more than half a percent of global irrigation water and blue WF of crop production was unsustainable [8]. This situation is more prominent in China, which has the largest population. Therefore, it is essential to alleviate the shortage of water resources in China through the optimal regulation of VWT.
Most preliminary works were devoted to quantifying virtual water trade (VWT) between countries or regions [9,10,11]. With the maturity of VW content calculation models, it is essential to break the deadlock of VW quantification research. This is one of the goals of this paper: we devote ourselves to exploring and deepening the regulation of VWT based on quantitative research. Network theory was introduced into VWT research afterward. It was applied to analyze the flow pattern of the VWT network (VWTN) [12], network structure evolution [6,13], and geographical features [14,15,16]. Quantification analysis of the VWTN among different spatial scales allowed for assessing critical impacts of various factors (e.g., population, resources, economy, and technology) and contributed to the adjustments of policies and recommendations, even lower water pollution levels in trade openness [17,18]. Different models are used to analyze the effects of temporal evolution and estimate network evolution under future global climate change [19,20,21]. VWTN is a new idea for the optimal regulation of agricultural structure [22,23], especially in China [24,25], where water resources in spatial and temporal areas are distributed unevenly. We noticed that complex network theory could characterize networks and simulate optimal network structure, which also provided a new perspective for optimizing the crop planting structure.
However, many network theories have limitations, e.g., using ecological network theory to build only a closed network [16,26]. The complex network involves many real-world networks (e.g., World Wide Web, relationship network, power networks, and others), which first appeared in the random graphs in 1961 [27]. Since the discovery of features of small-world and scale-free networks [28], it has been widely applied to graph theory, computers, biology, and other fields [29,30] and gradually became a popular interdisciplinary. This study differs from previous quantitative studies because we not only focus on the changes in the time scale from 2000 to 2017 of China’s major crops VWTN but also the structural characteristics and stability of VWTN on the spatial scale. Furthermore, we used the trade content between regions to weigh the VWTN. It amplified the difference between the topological network and the weighted network and made vital areas more prominent to emphasize the protection of critical areas. More importantly, based on this research, we plan to simulate network invulnerability under two strategies: random and deliberate attacks and explore food and water security protection under sudden disasters or deliberate attacks. This work allows us to lay a foundation for future agricultural regulation and structural optimization of VWTN.
2. Methodology
2.1. Data Sources
The combined production of rice, wheat, and corn have accounted for ~85.5% of China’s crops output in the last 10 years (China Agricultural Sector Development Report, 2011–2020) [31]. Therefore, we select these three crops as representatives. The data on the productions of rice, wheat, and corn in China are obtained from the China Statistical Yearbook (2001–2018) and China Rural Statistical Yearbook (2001–2018) [32]. According to the Penman–Monteith recommended by FAO, we calculated the crop evapotranspiration () and corrected with the crop coefficient. Finally, we calculated the unit virtual water content () (for more details, see Supplementary Materials).
2.2. Methods
Complex network theory covers many indicators, such as node degree, node strength, correlation degree, etc., applying more objective and scientific mathematical thinking to the VWTN research, simply characterizing the network structure [14], and intuitively reflecting the relationship and content among regions. We construct an unweighted directed network () and a weighted directed network () [14,33] to examine the features of the VWTN. The nodes and links represent the regions and the flow path of the VWTN and weighting nodes by the trade VW content. In this way, we build two directional networks involving 31 nodes and trade relations of VWTN in China’s major crops. According to the direction of regional trade, the region can be divided into input areas and output areas, as follows.
Node degree () is a basic attribute of complex network theory, identifying the number of links at each node. In , the trade relationship among regions was regarded as a topological adjacency matrix. Since regions do not trade with themselves, the main diagonal element () is 0; the other element () represents the virtual water trade from to . When there is a link between and , . The formula is:
where can be divided into two types: is the in-node degree, meaning the amount of input regions of , and is the out-node degree, meaning the amount of output regions of . The node strength () refers to the weight of each node, i.e., . In , the matrix elements and indicate the content between and .
where also has two types: indicates the total content of the input area and is the total content of the output area. Many natural and social networks have phenomena on power–law distribution matching the stretch index ) [34].
Since networks with similar degree distribution may have different properties or behaviors [35,36], it is necessary to further study the high-order topological features, i.e., the correlation degree, which is calculated by K-Nearest Neighbor () (not distinguishing the network direction).
where identifies all nodes in the neighborhood of , and then sums their respective node degrees, and finally normalizes the node degree of node [14]. is divided into four categories including , , , and . The first element in the superscript determines the neighbors of the node , whereas the second element labels the characteristic of the neighbors (Supplementary Materials show more details). can also be extended to the weighted network, i.e., amplifying regional differences using weighted features. The is calculated as:
3. Results
3.1. VWTN of China’s Major Crops
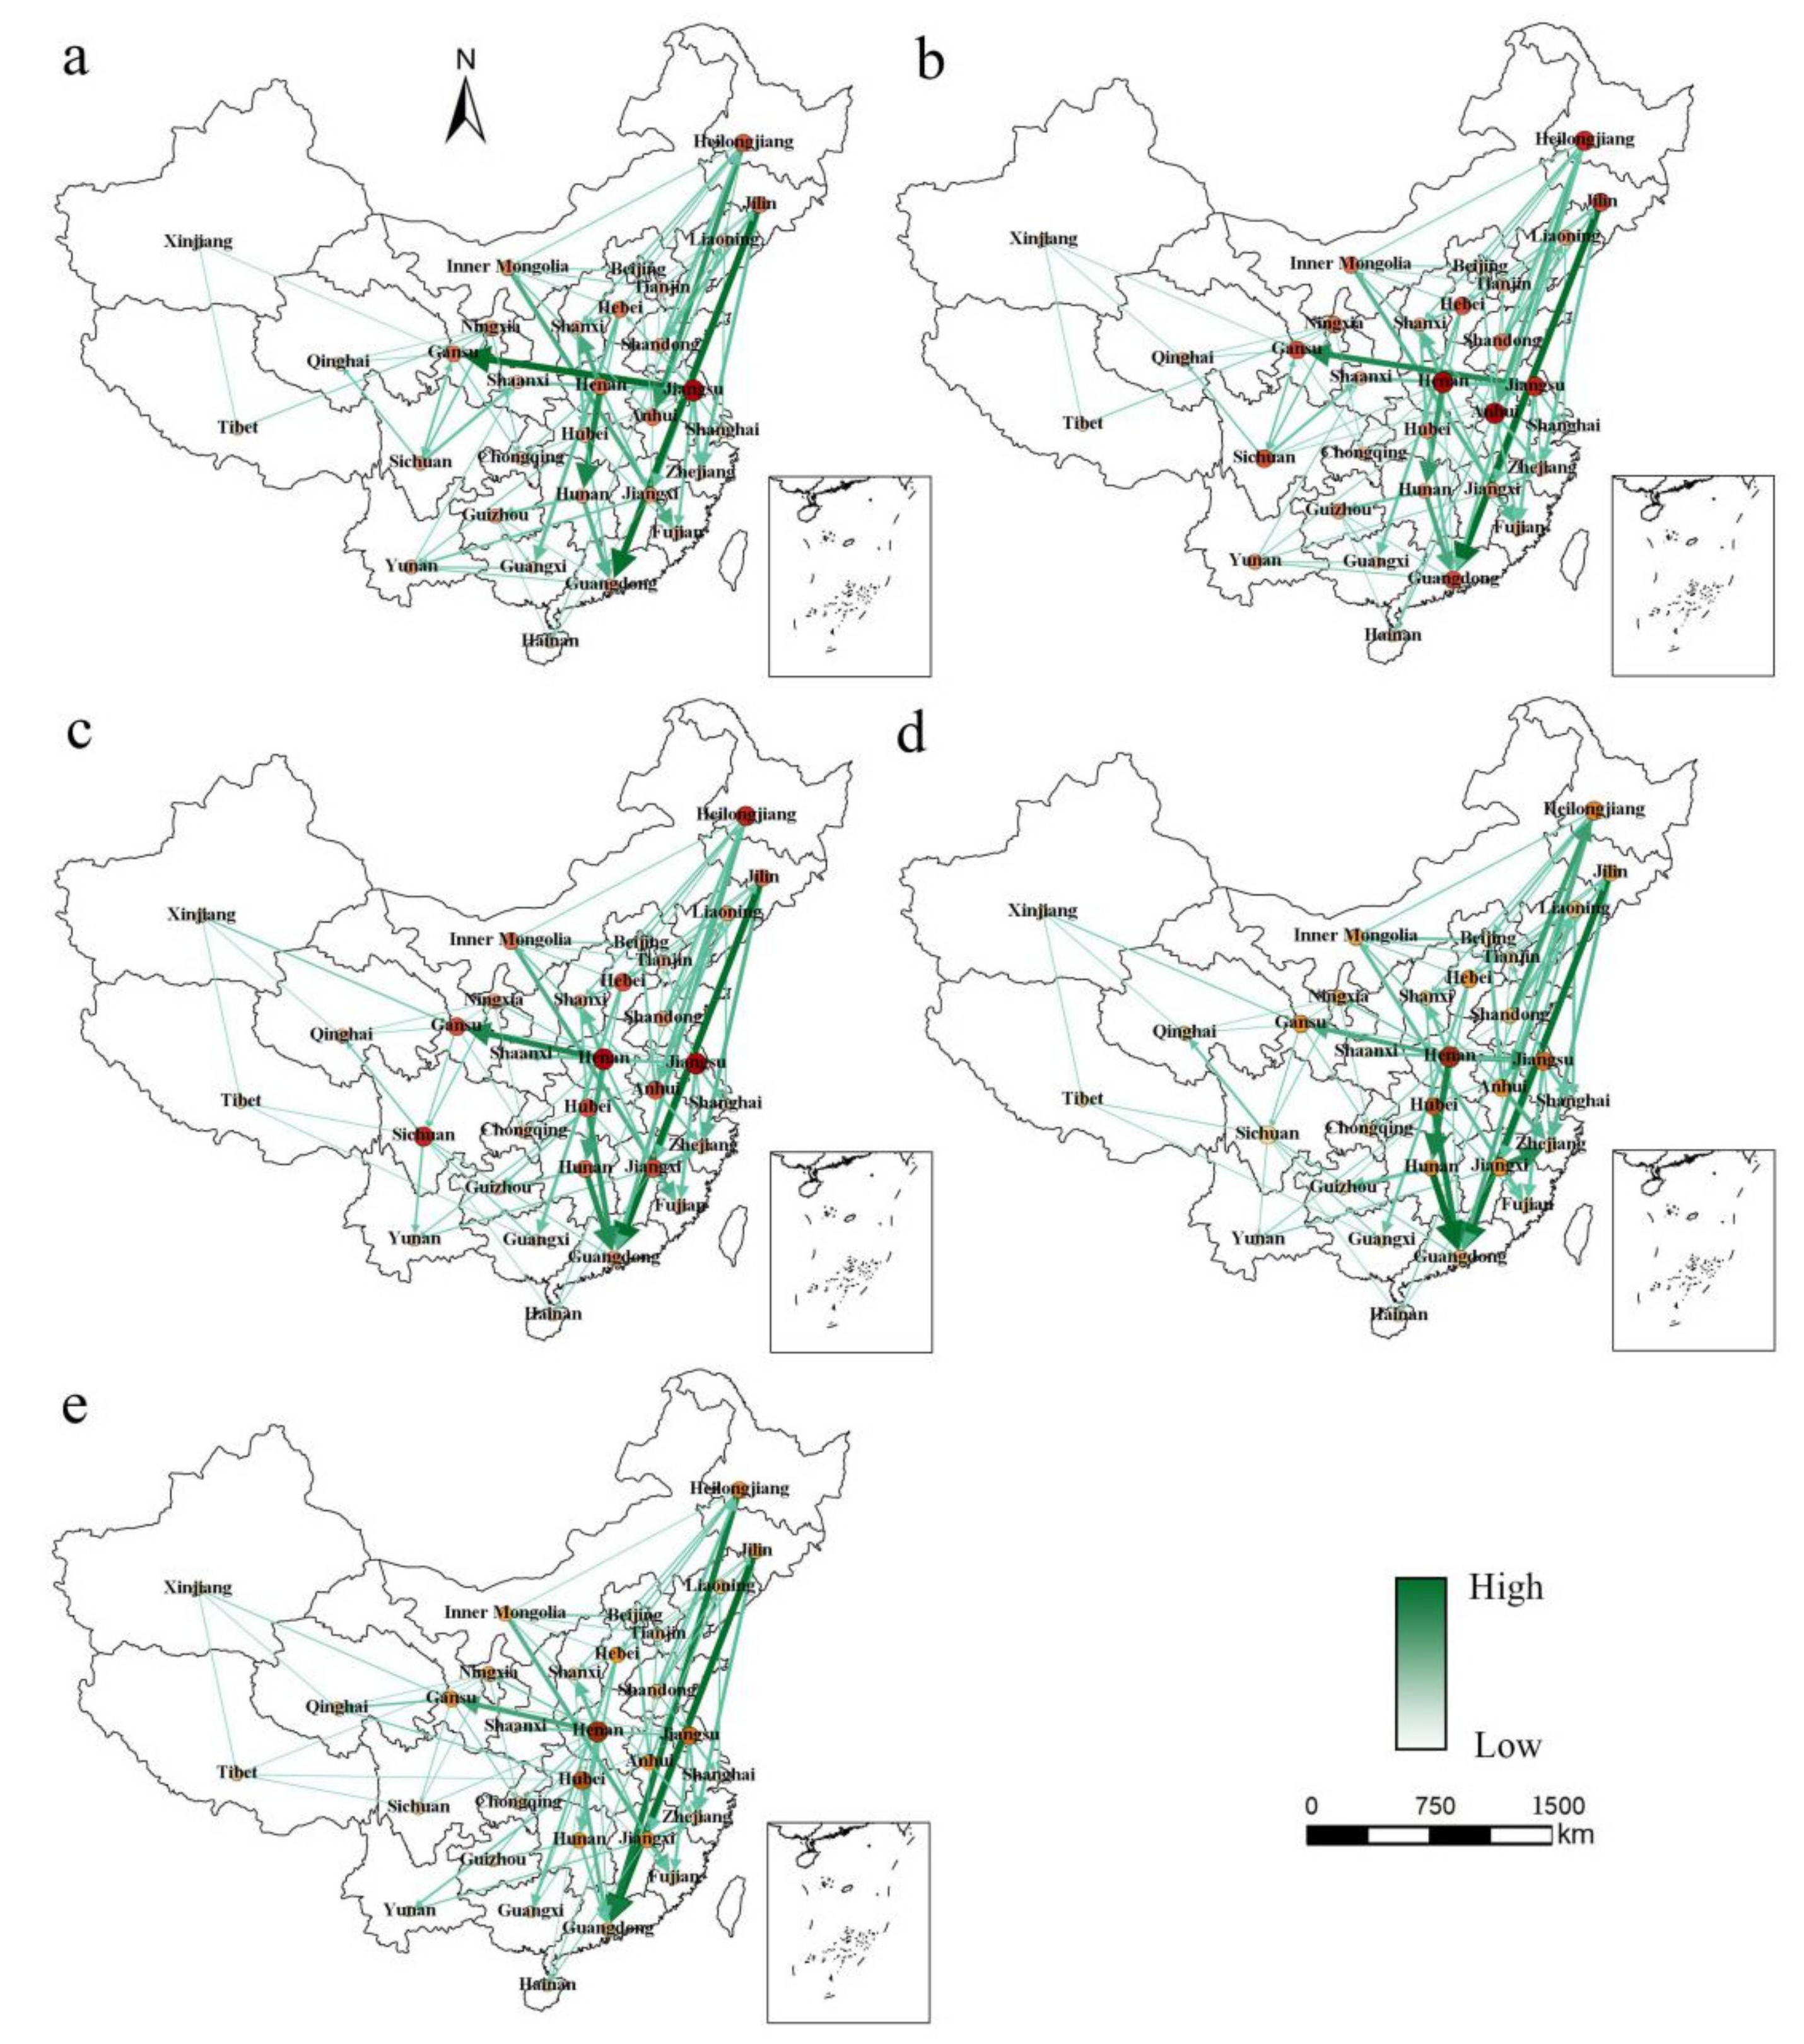
Based on the network construction method and calculation results of China’s major crops VWT content between regions, we draw network maps involving 31 provinces by using the network tool of Gephi (Figure 1) and chose five years (2000, 2005, 2010, 2015, and 2017) to compare changes in time scales. The total VWT content of the major crops in China increased by ~23.6%, from 716.517 × 10⁸ m3 in 2000 to 885.289 × 10⁸ m3 in 2017, due to an increase in food supply and consumption. Undoubtedly, the total content was huge for a country that supported the largest population in the world. Note that the appearance and extinction of the VWT links on the network coexisted, e.g., the VWT link appeared from Xinjiang to Qinghai (0.16 × 10⁸ m3 in Figure 1b) and Guangxi to Yunnan (3.95 × 10⁸ m3 in Figure 1b) but disappeared from Jiangsu to Shandong. As a whole, the change in network structure was small (Figure 2), and the trade relationship among most regions had been stable for a long time, e.g., Tianjin, Shanghai, Fujian, and Guangdong were the main input areas, while Heilongjiang, Henan, Sichuan, Jilin, and others were the main output areas. The differences and the change in the virtual water trade content in the links were obvious. The maximum difference in trade content was approximately 51.670 × 10⁸ m3, and the trade content from Jiangsu to Gansu reduced from 41.017 × 10⁸ m3 in 2000 to 1.978 × 10⁸ m3 in 2017. The maximum VWT on the VWTN was 45 × 108 m3 yearly from Jilin to Guangdong.
Some regions that played essential roles have changed from 2000 to 2017. The largest output region of VW content changed from Jiangsu to Henan in 2001. The province with the largest out-node degree changed from Jiangsu (9) to Henan (10) in 2002, and Henan has remained the largest one for 16 years since then. Since 2005 (Figure 1b), Jiangsu (located in Southeast China) has not been the largest virtual water output area, which is related to its transformation of economic development strategy. With the changes in China’s economic pattern, the food self-sufficiency in the northern regions had increased, while the southern regions had declined, and the direction of crop trade changed from the north to the south. The VWT of China’s major crops was flowing from the water-scarce northern region to the water-rich southern region, contrary to China’s spatial distribution of water resources. The local food shortage was alleviated for the input area, while the output areas lost local invisible water resource benefits.
3.2. Node Degree and Cumulative Degree Distribution
Node degree is the basic attribute and reflects its importance on the topology network. In/out-node degree reflects the heterogeneity of the network connection. The VWTN nodes in 31 Chinese provinces had input node values between 0 and 7 and output node values between 0 and 12. Note that the areas with a sizeable in-node degree are mainly concentrated in the comparatively developed southeast or the southwest with poor natural conditions. The areas with sizeable out-node degrees are mainly located in China’s famous commodity grain places, e.g., the plains of Huanghe-Huaihe-Hai Rivers, Sanjiang, and the middle and lower Yangtze River. Node degree is the basic attribute and simply reflects its importance on the topology network. In/out-node degree reflects the heterogeneity of the network connection. The VWTN nodes in 31 Chinese provinces had the input node values between 0 and 7 and the output node values between 0 and 12. Note that the areas with a large in-node degree are mainly concentrated in the comparatively developed southeast or the southwest with poor natural conditions. The areas with large out-node degrees are mainly located in the famous commodity grain places of China, e.g., the plains of Huanghe-Huaihe-Hai Rivers, Sanjiang, and the middle and lower Yangtze River.
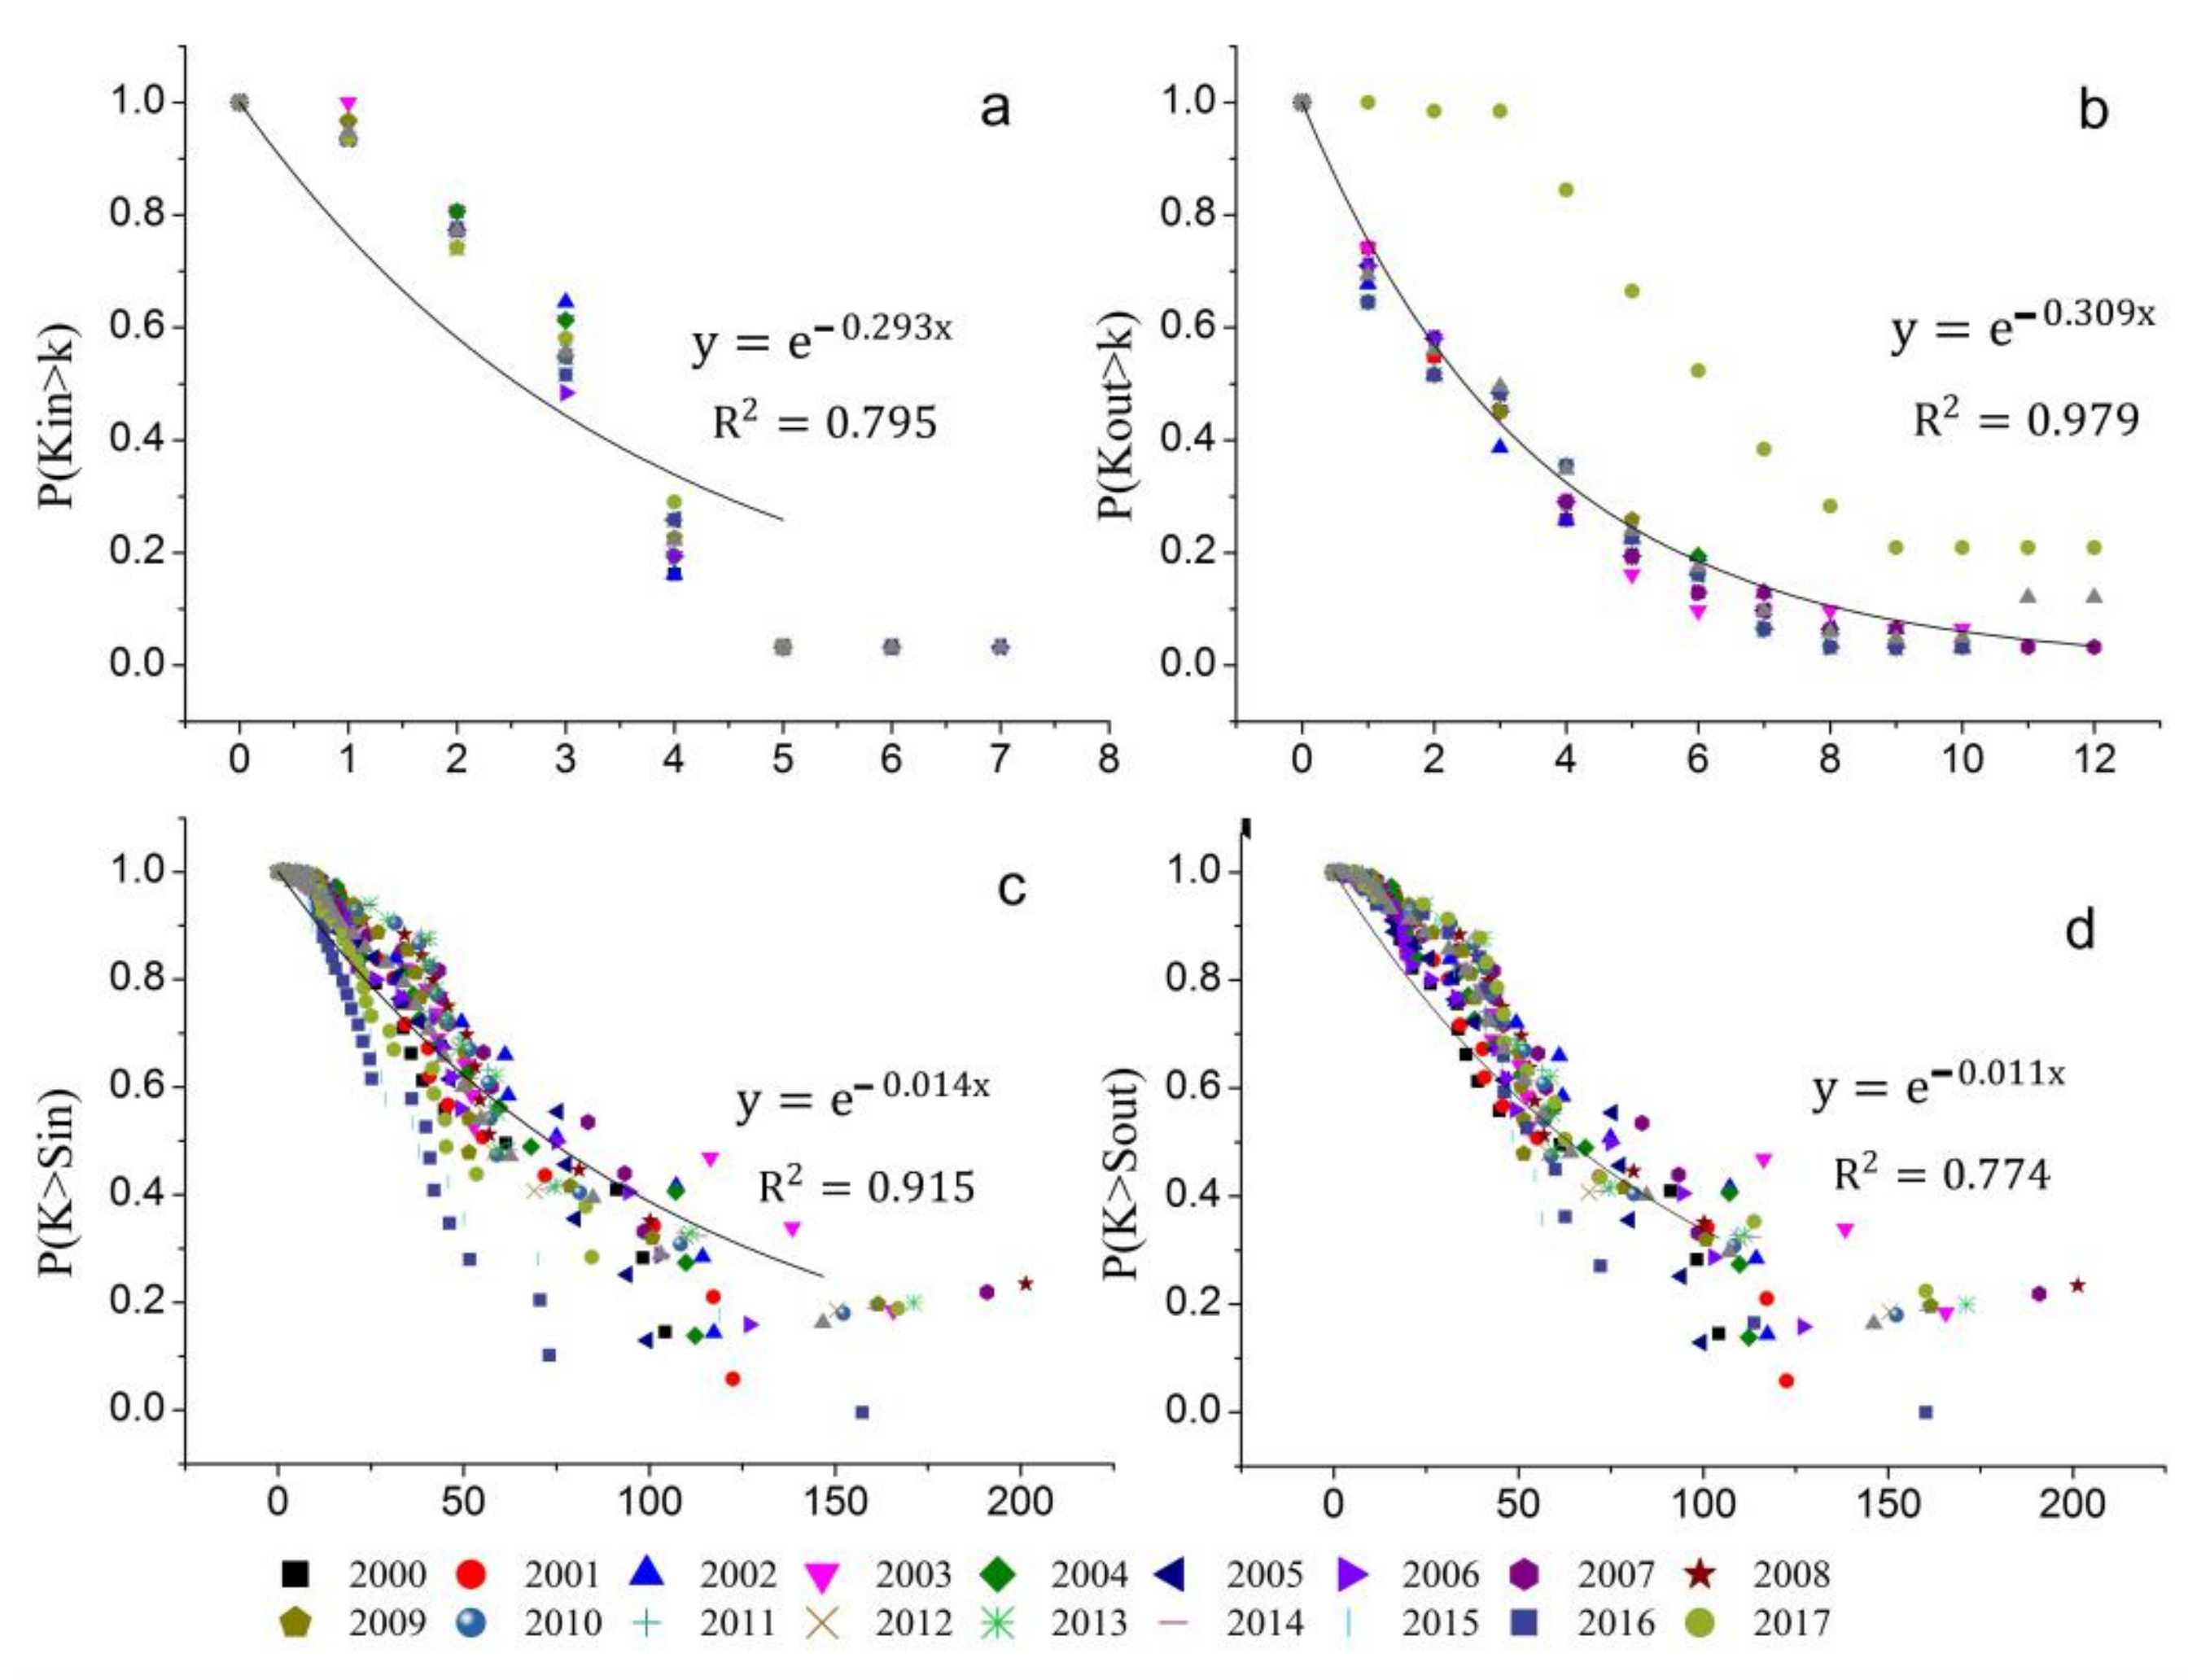
The cumulative distribution of the input/output-node degree of the VWTN in China fit with the index () = ), i.e., it basically conformed to the power–law distribution (Figure 2a,b). The node degrees were more diverse, and their tails were “heavy-tailed.” The heavy-tailed flow had a tendency to converge into a steady state at a slow rate and into a high variability at a steady state [37]. The tail of is more “fat” compared with the tail of , which converges into a steady state at a slower speed and exhibits high variability, while the in-node degree distribution of the VWTN is more diverse. A certain area of the network often exports virtual water to many areas but only imports from a few areas. The change in the number of links in the output areas will greatly affect the stability of the virtual water trade in the input areas.
3.3. Node Strength and Cumulative Strength Distribution
In the weighted network, the node was weighted by the virtual water content and had a quality meaning. The data were fitted to the index () = ) (Figure 2c,d). The in-node strength was between 0 and 162 × 108 m3, and the out-node strength was between 0 and 172 × 109 m3. The maximum link strength in 31 provinces was from Jilin to Guangdong, and the annual average was approximately 50 × 108 m3 during 2000–2017, indicating that the VTW pattern of China was inconsistent with the distribution of water resources. Comparing the cumulative distribution of the strength degree with that of the node degree, we find that the network heterogeneity increased after the network was empowered, and that the cumulative distribution changed significantly. The tail of the weighted network cumulative distribution and was much ‘fatter’ than the unweighted and , implying that the amount of virtual water flow among the regions was very different. In addition, was also much ‘fatter’ than , indicating that the export areas had a robust abrupt change in the trade content. The population, land resources, and traffic conditions affected the virtual water flow among regions [15]. Thus, if the trade content of the export areas changes drastically, the stability of the entire network will be affected. As an input area, the usual social and economic activities will be disturbed because of the change in the water supply.
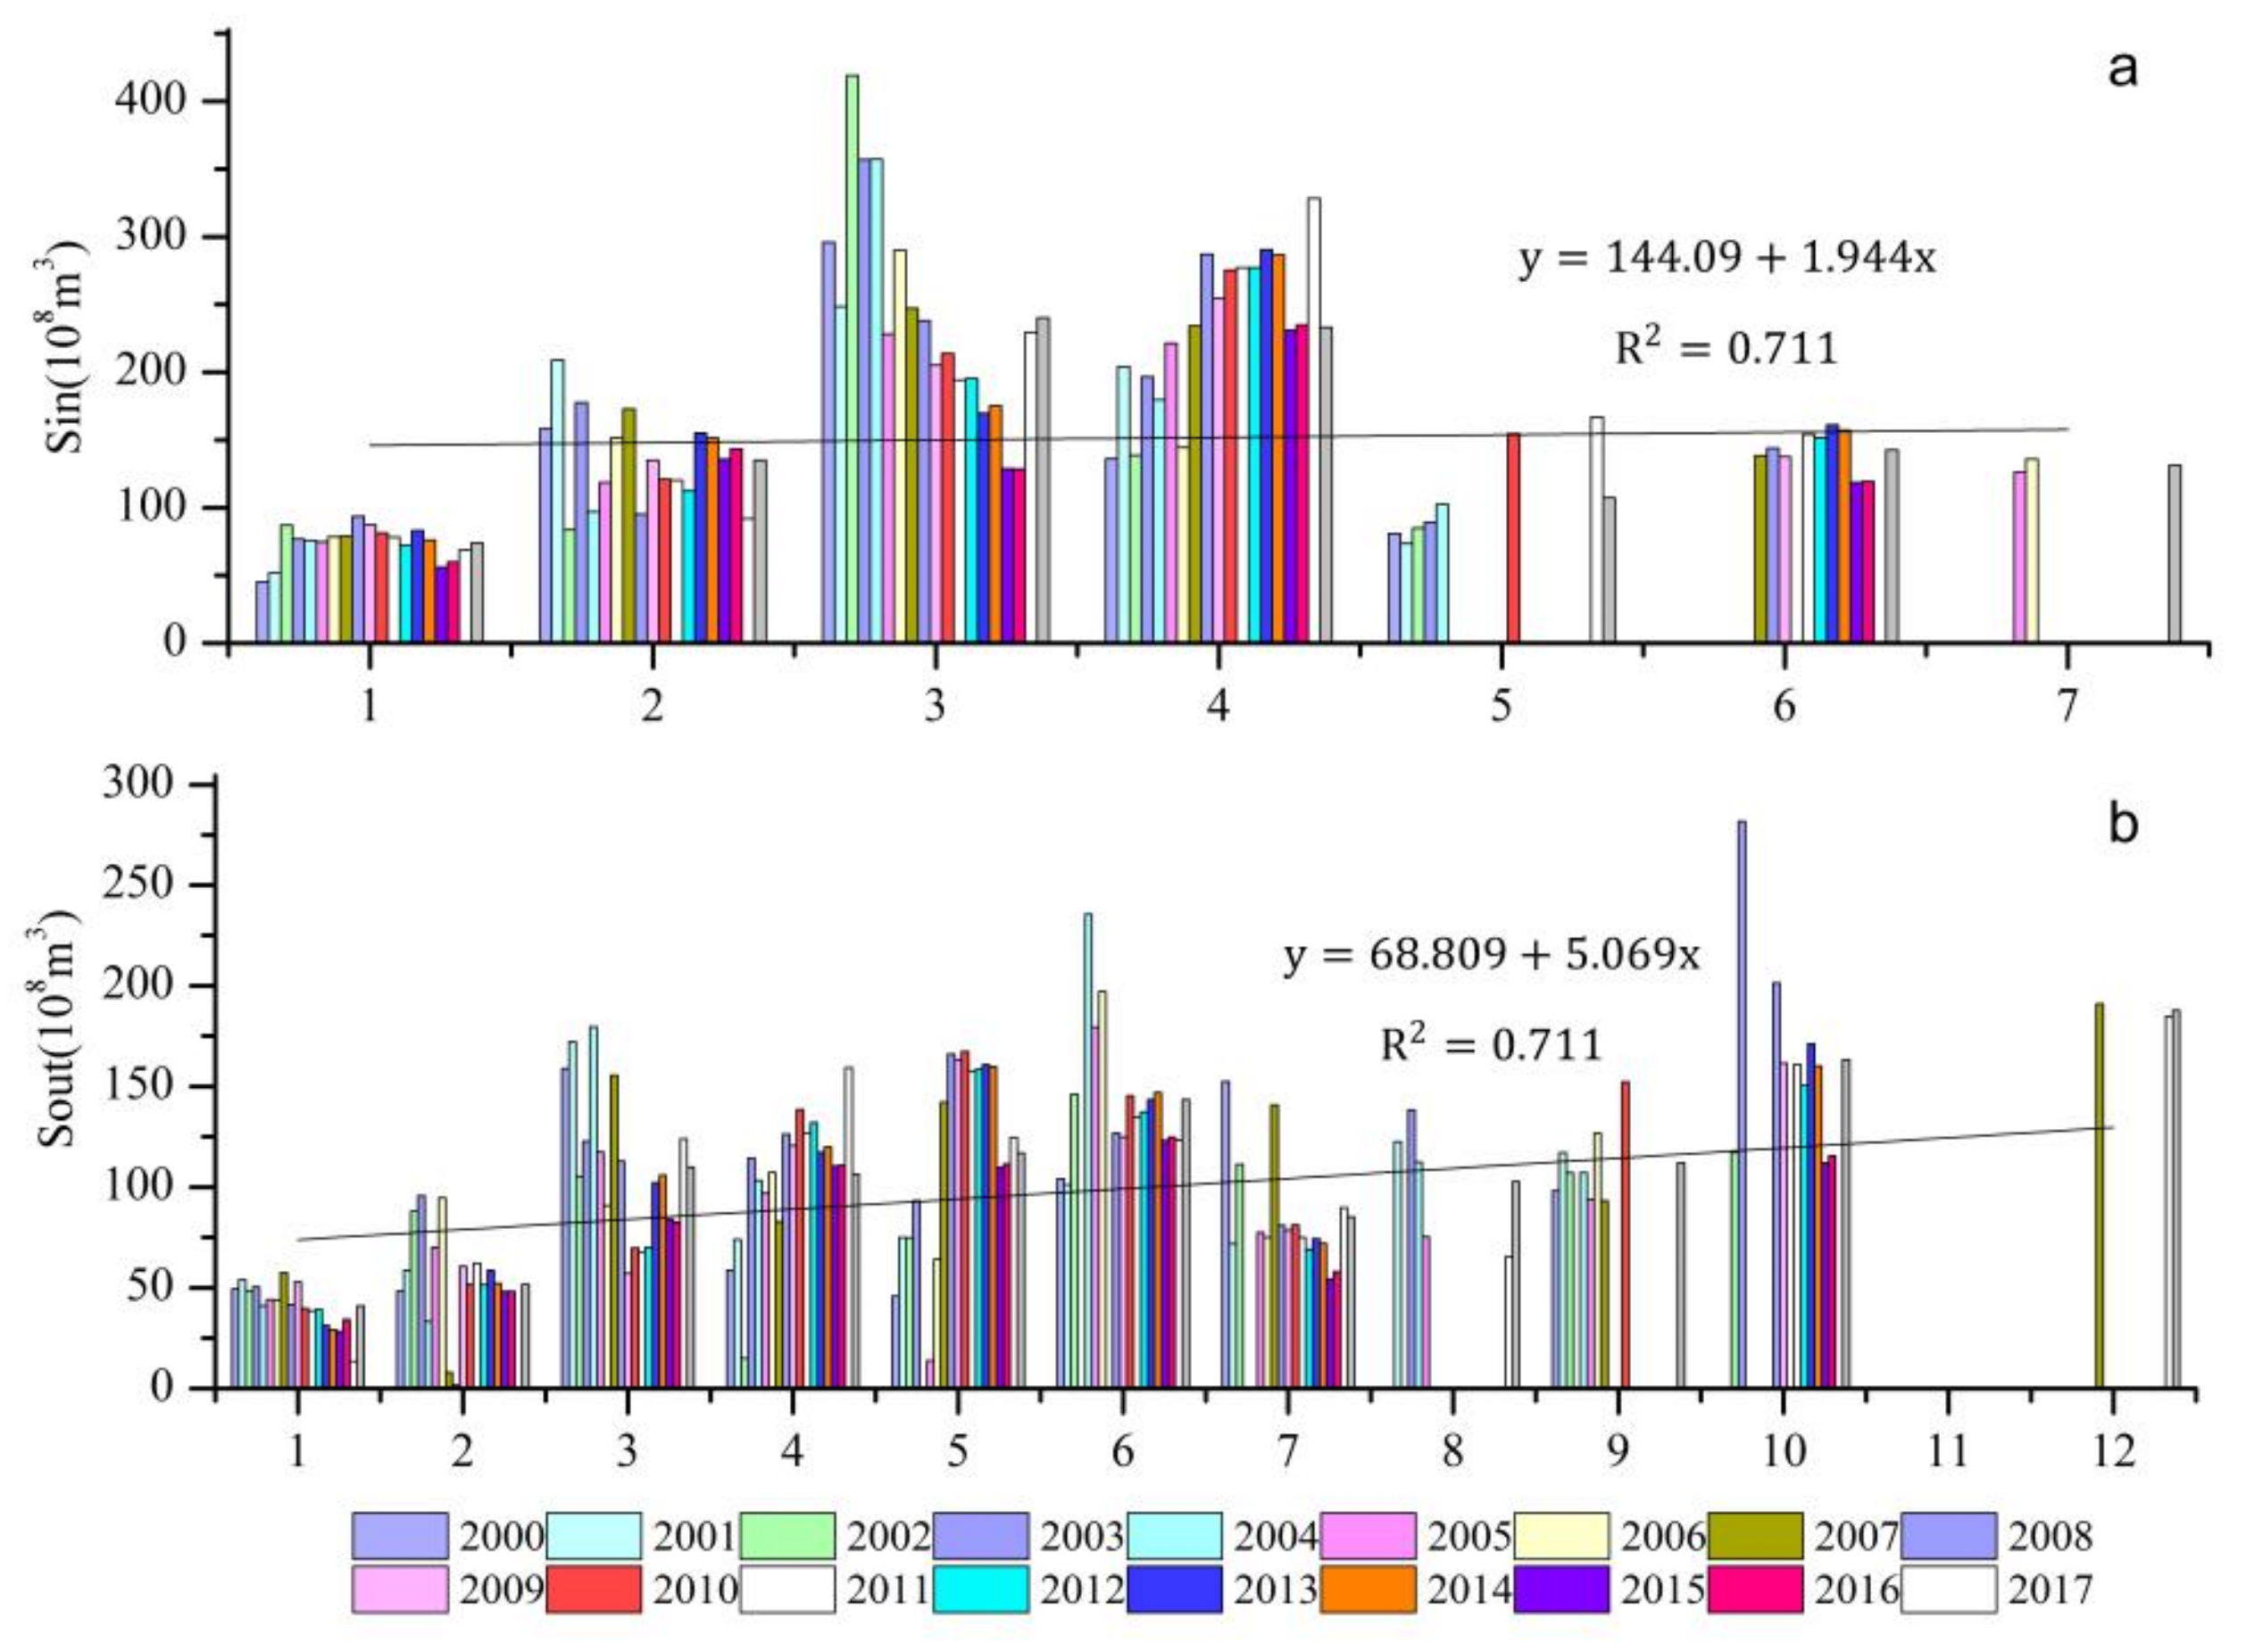
Node degree is the first approximation of the centrality of the network topology, and its relationship with node strength is also worth exploring. The node strength had a tendency to increase with the increased node degree, and it followed the relationship of (Figure 3a) and (Figure 3b). On the VWTN of China’s major crops, the parameter was ~1.27, and was ~3.20. On the one hand, the value of was positive, indicating that when the network was weighted, there was a clear proportional relationship between the amount of virtual water flow and the number of trade neighbors, i.e., the higher the number of trade neighbors, the greater the amount of the virtual water flow content. Therefore, for the input areas of the virtual water, the more the import areas have, the more the virtual water content involved, which indicated that the local water shortage and the imbalance of food supply were compensated by trade. This theory has a strong guiding significance for the real world. For example, the Middle East and North Africa regions have alleviated domestic water shortages in the form of a virtual water flow [10]. For the output areas, the virtual water export can be expanded by appropriately increasing the number of trade neighbors to earn the local economic benefits through trade. However, due to the uneven distribution of water resources in China, the flow direction of virtual water is contrary to the distribution of water resources. Long-term trade relations may lead to losses in the interests of the exporting regions. Therefore, whether the current trade pattern and grain prices are reasonable or not is the key issue facing China. On the other hand, being greater than indicates that the virtual water content of the output areas changed greatly owing to the growth and extinction of links. The changes in the trade content directly affected the supply of the virtual water in the input areas. Consequently, this increased the instability of the supply of virtual water resources in the input areas and thus affected the local industrial structure and economic development.
3.4. Correlation Degree of Node Degree and Node Strength
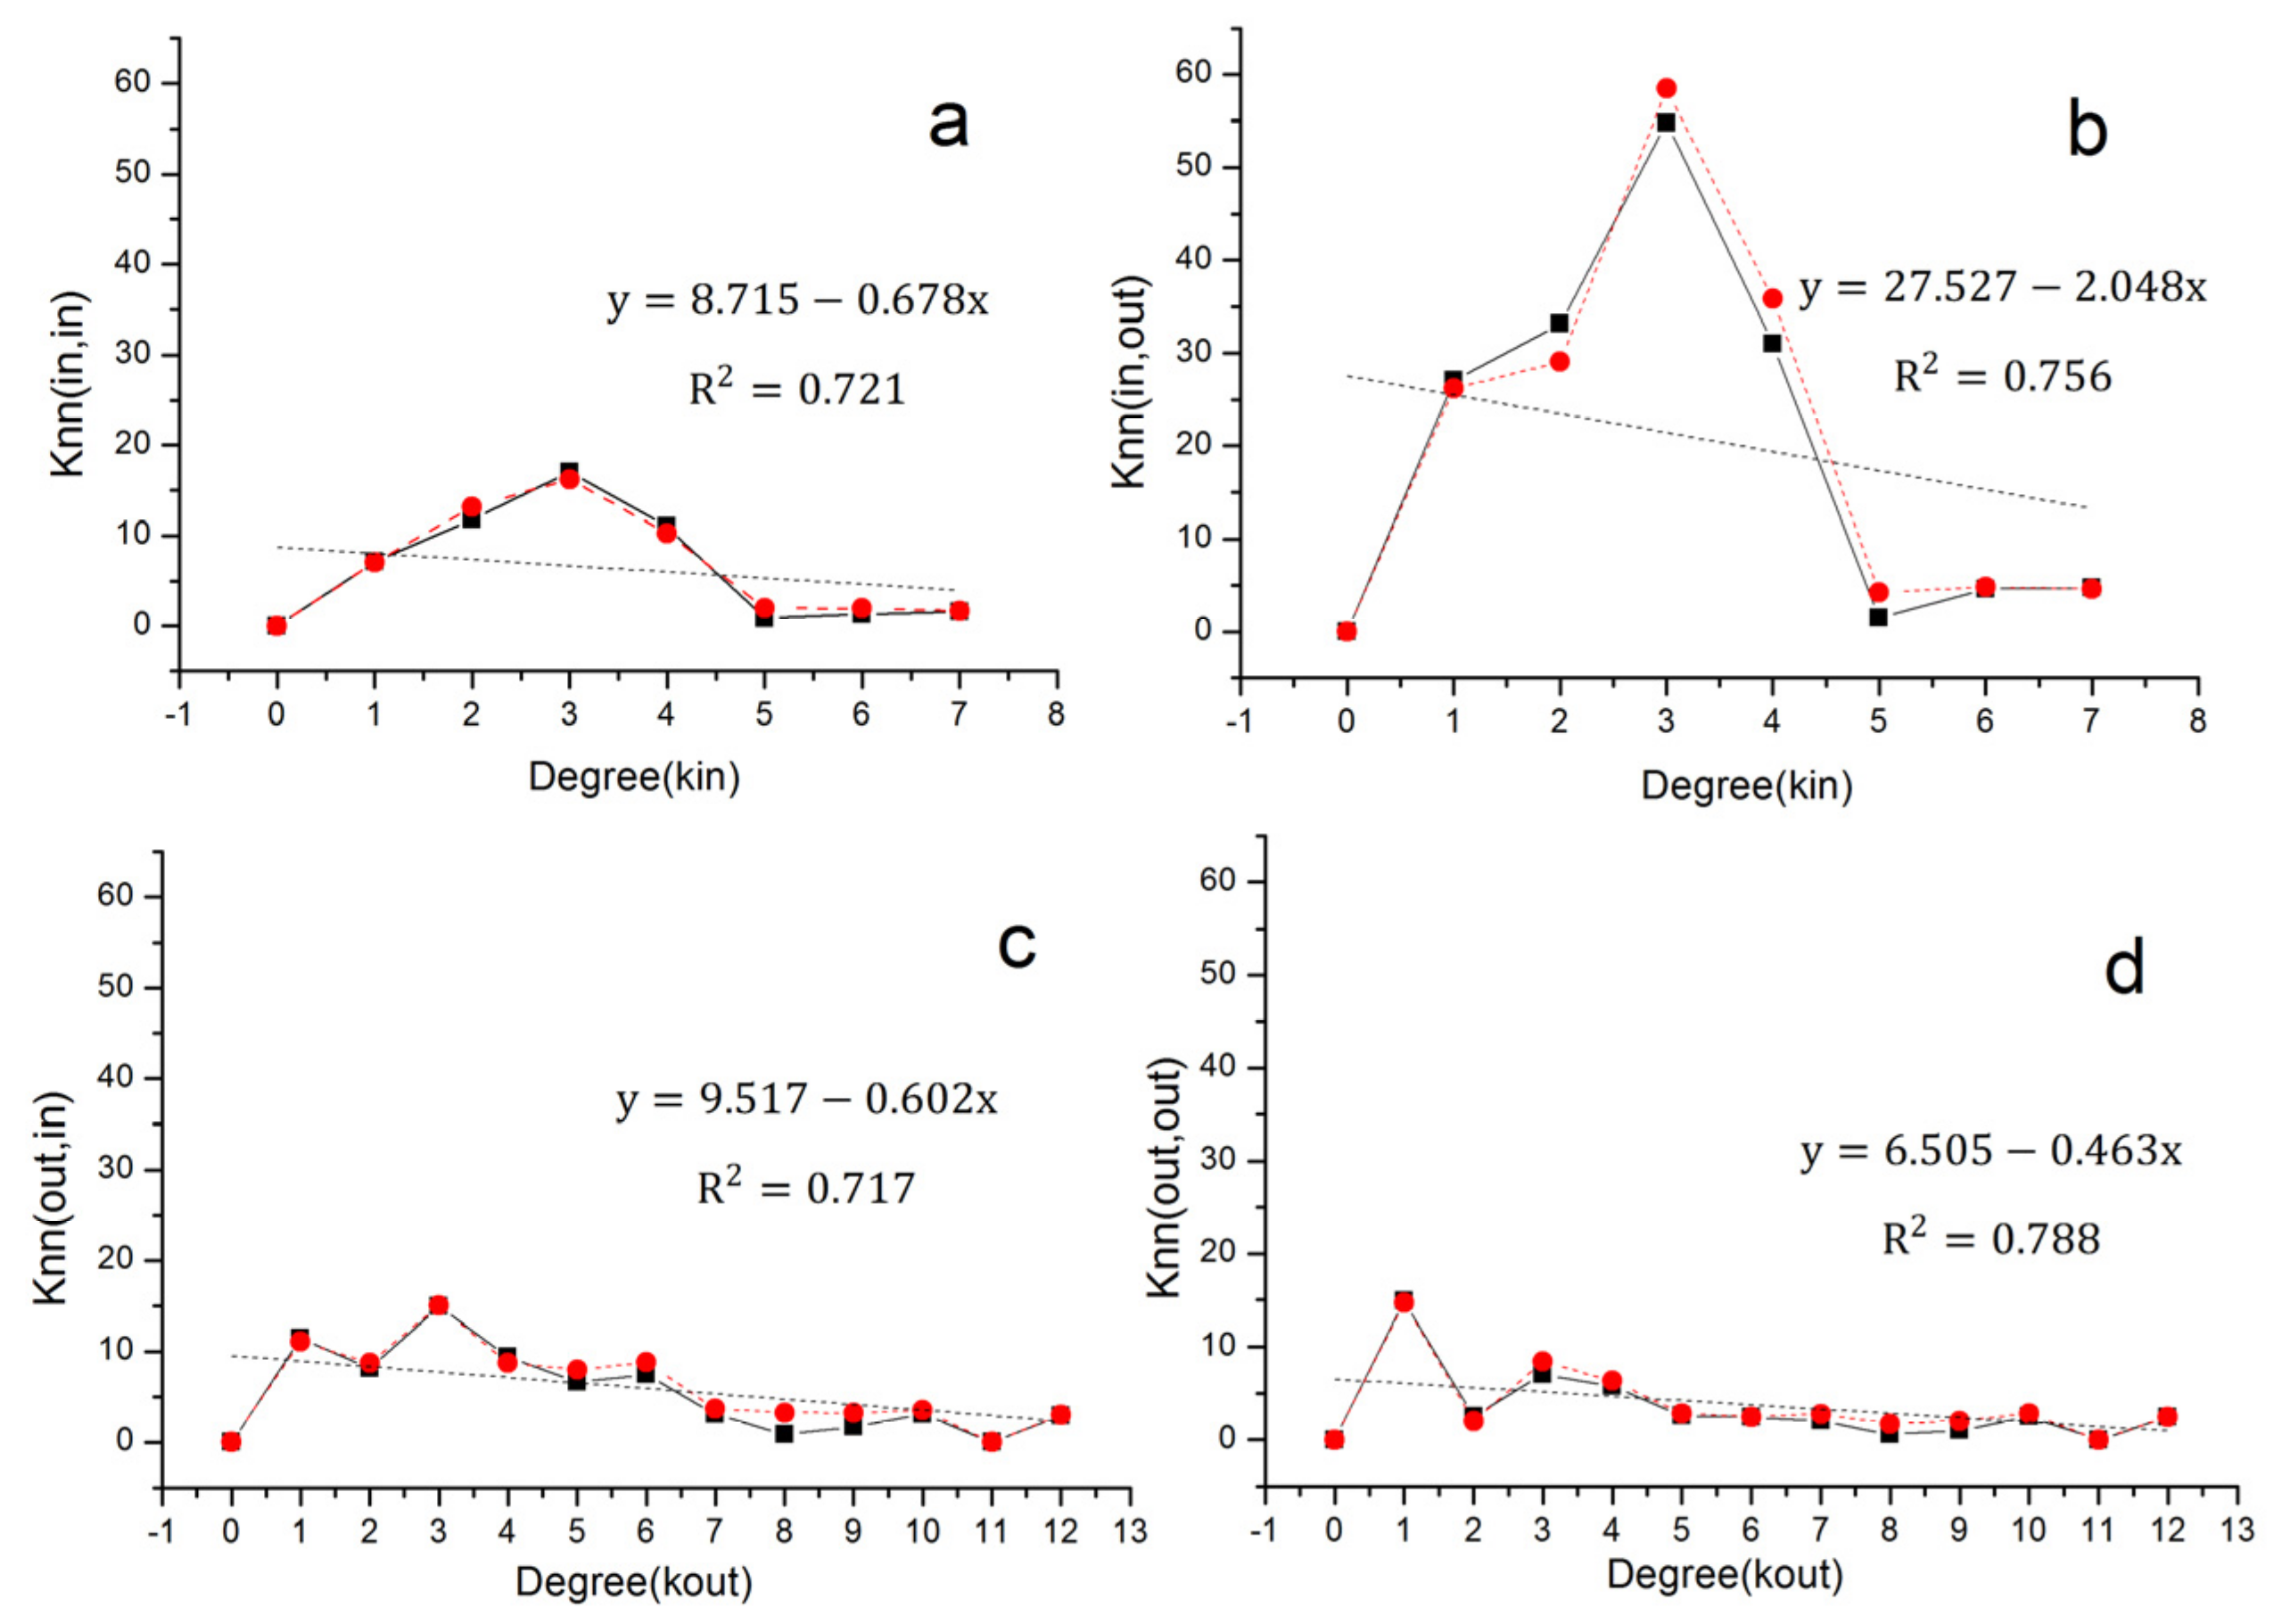
If does not have a monotonicity, the relationship between the nodes is not close. If is an increasing function, the network is an assortative network, indicating that the node tends to contact with a node with a similar degree. If is a decreasing function, the network is a heterogeneous network, indicating that the node with a high degree tends to contact with a node with a low degree. Both in the unweighted () and weighted network () (Figure 4), the correlation degree was a decreasing function. The weighted attribute of the node did not destroy the heterogeneous structure, i.e., areas with a large node degree more likely link with areas with a small node degree. For example, in 2010, Guangdong had an in-node degree of 5 and it imported virtual water of ~155.000 × 10⁸ m3 from Jilin, Heilongjiang, and Hubei, while the three provinces had a small in-node degree. The VWTN of China showed a trend of interprovincial connectivity and a multiregional national structure. Areas with a large node degree provided connectivity with the surrounding areas with a small node degree. It is worth noting that the connectivity of the network made various regions bundled together. Thus, the small changes will affect the agricultural production and resource supply and restrict the stable development of food security and social economy.
When , areas with a larger node strength tend to connect areas with a higher node degree; if not, areas with a larger node strength tend to connect nodes with a lower degree [14]. From Figure 4, is greater than , i.e., areas with a large virtual water content were associated with areas with more trade partners. For example, the virtual water input content of Guangdong in 2010 was approximately 154.69 × 10⁸ m3, and its input areas included Jilin, Heilongjiang, Hubei, Hunan, and Sichuan. These five provinces had a maximum of five, seven, five, two, and six trade partners, respectively. While the VWTN of China presented a nationwide structure, it had a certain “agglomeration effect”, i.e., regions with more active trade activities had a close trade relation. The VWTN of China, based on grain trade, has become more extensive with the progress of social development.
4. Discussion
Previous studies into China’s VWTN have unveiled the mismatch between the VW trade direction and the regional distribution of water resources [5,12]. Similar findings were shown in this paper. In China’s VWTN of major crops, the primary input areas are located in the comparatively developed southeast (water-rich). In contrast, the main output areas are located in the commodity grain places with relatively weak economy (water-poor). A similar situation was mentioned on the global VWTN in 2000 [14]. The main input areas on the global VWTN were located in developed countries or regions, such as Japan, the United States, the Netherlands, etc. In contrast, the main output areas were Brazil, Argentina, and other developing countries. Many developing regions with harsh climates increased the export of VW [38]. This long-term supply relationship would aggravate the water shortage and food security in China, even globally, which deserves our attention under the rational utilization of water resources. Nodes were weighted by the trade content, which made the position of some nodes more prominent. The cumulative distributions of node degree and node strength of China’s VWTN followed the power–law exponential distribution, especially since the latter had a heavier-tailed distribution (Figure 2). This was also comparable to the global VWTN. The “heavy tail distribution” revealed that the index converges to a steady state at a slower speed and exhibits high network variability. The VWTN may quickly be destroyed because of sudden, natural, or artificial damage, especially in the main areas. Therefore, how to protect virtual nodes became the focus of our future work.
Comparing this paper with our previous work [15,16], we used ecological network theory to explore the stability of the VWTN. However, it needs to reflect the importance of each network area and other additional information. The application of complex network theory analyzed the characteristics of networks from both a holistic and local perspective. It revealed the importance of each region on the network. It analyzed the counterbalance and relevance of the VWT among various regions, which made up for the lack of ecological network theory. Thus, we can combine both theories to create a standard to assess network optimization and provide a valuable reference for the research of global VWTN. There may be some limitations in this study. More than 90% of soybean consumption in China has depended on imports since 2003 [39]. We only selected rice, wheat, and corn as the primary crops’ representatives, which limited the research objects. In addition, this paper included data from 2000 to 2017 for 31 regions in China. The number of nodes involved is low compared to other large networks (social, power, transportation, etc.).
Crops are typical water-intensive products [3], and the main crop-producing areas shoulder the critical food security task. The original intention of VWT is to help water-scarce areas dominated by export crops to adjust crops’ trade structure to alleviate the water shortage problem [9]. Therefore, adding VWT to government management is necessary. Countries with scarce water resources should strengthen the exploration of water resources management and application, strengthen the regional water supply capacity prediction, and estimate food production under climate change. The deepening of international trade will create opportunities for water cooperation and formulate rules for international water cooperation [40,41]. The VW content of food is not static and changes accordingly with climate change. Through the combination of network methods and food prediction models [42], typical virtual water export areas can be used as experimental subjects to simulate regional water resources management under the control of multiple factors, optimizing crop patterns under climate change, minimizing water use, and maximizing crop revenue while enforcing food security and regional water security constraints.
5. Conclusions
Rational distribution of virtual water is the key to alleviating inter-regional water and food security. This paper uses complex network theory to characterize the structure of the virtual water trade network of China’s major crops. In terms of time scale, the virtual water trade in China increased by ~23.6% between 2000 and 2017. Jilin, Henan, and Heilongjiang played an essential role in the output network, while Guangdong, Shanghai, Fujian, etc., were stable input regions. The trade relations among most regions had been stable for a long time, whereas a few areas in the output network changed. With the gradual decline of Jiangsu’s status, Henan and Jilin became more prominent. In terms of spatial scale, complex network theory was applied to analyze the roles of a single area and the characteristics of the whole network. Distribution of in/output nodes reflected the VWT from North China (water-poor) to South China (water-rich), which is contrary to the distribution of water resources. The cumulative distribution of degrees consistent with the power–law relationship indicated the high variability and vulnerability of the network structure. Since the correlation degree was decreasing, the network showed that areas with more trade partners/content provided connectivity to areas with fewer trade partners/content. The connectivity of the network made regions bundled together. Small changes in central export regions would affect the food supply and economic security. It is essential to highlight that exported area was mainly contained in relatively backward regions (either in China or the global world). This long-term supply relationship would aggravate the shortage of water resources or food security, especially under the rational utilization of water resources. Therefore, we propose to add VWT into government management and deepen international water cooperation and adjust the trade structure of crops to alleviate the problem of water shortage. This funding supports the belief that the combination of the network method and VWT may lay the foundation for studying the invulnerability of VWTN and the optimal regulation for grain trade.
Supplementary Materials
The following supporting information can be downloaded at: https://www.mdpi.com/article/10.3390/w14244083/s1, Data processing.
Author Contributions
Conceptualization, A.L. and X.L.; methodology, X.L.; software, X.L.; validation, A.L.; formal analysis, X.L. and J.Y.; resources, A.L.; data curation, X.L.; writing—original draft preparation, X.L. and J.Y.; writing—review and editing, A.L. and J.Y.; visualization, X.L. and J.Y.; supervision, J.Y. and A.L.; project administration, A.L.; funding acquisition, A.L. All authors have read and agreed to the published version of the manuscript.
Funding
This work was funded by the Ministry of Science and Technology of the People’s Republic of China (2021xjkk0406).
Data Availability Statement
The data set or custom code used or analyzed in the current research can be obtained from the corresponding author upon reasonable request.
Acknowledgments
The authors express their gratitude to the Chinese National Bureau of Statistics for the open data. The authors would like to thank the Ministry of Science and Technology of the People’s Republic of China for financial support.
Conflicts of Interest
The authors declare no conflict of interest.
References
- Vorosmarty, C.; Green, P.; Salisbury, J.; Lammers, R. Global water resources: Vulnerability from climate change and population growth. Science 2000, 289, 284–288. [Google Scholar] [CrossRef] [PubMed] [Green Version]
- Gleick, P.H. Global freshwater resources: Soft-path solutions for the 21st century. Science 2003, 302, 1524–1528. [Google Scholar] [CrossRef] [PubMed] [Green Version]
- Xu, L.; Chen, J.; Liu, C. Comparison of irrigation efficiency of smallholder farmers and new agricultural operators and influencing factors. Resour. Sci. 2021, 43, 1821–1833. [Google Scholar] [CrossRef]
- Allan, J.A. Fortunately there are substitutes for water: Otherwise our hydropolitical futures would be impossible. Priorities Water Resour. Alloc. Manag. 1993, 13, 26. [Google Scholar]
- Cheng, G.D. Virtual water—A strategic instrument to achieve water security. Bull. Chin. Acad. Sci. 2003, 4, 260–265. [Google Scholar] [CrossRef]
- Dalin, C.; Suweis, S.; Konar, M.; Hanasaki, N.; Rodriguez-Iturbe, I. Modeling past and future structure of the global virtual water trade network. Geophys. Res. Lett. 2012, 39, L24402. [Google Scholar] [CrossRef] [Green Version]
- Faramarzi, M.; Yang, H.; Mousavi, J.; Schulin, R.; Binder, C.R.; Abbaspour, K.C. Analysis of intra-country virtual water trade strategy to alleviate water scarcity in iran. Hydrol. Earth Syst. Sci. 2010, 14, 1417–1433. [Google Scholar] [CrossRef] [Green Version]
- Mekonnen, M.M.; Hoekstra, A.Y. Sustainability of the blue water footprint of crops. Adv. Water Resour. 2020, 143, 103679. [Google Scholar] [CrossRef]
- Hoekstra, A.Y.; Hung, P.Q. Virtual Water Trade: A Quantification of Virtual Water Flows between Nations in Relation to International Crop Trade; Hoekstra, A.Y., Ed.; Value of Water Research Report Series No.11; UNESCO-IHE Institute for Water Education: Delft, The Netherlands, 2002; pp. 13–15. [Google Scholar]
- Chapagain, A.K.; Hoekstra, A.Y. Virtual Water Trade: A Quantification of Virtual Water Flows between Nations in Relation to International Trade of Livestock and Livestock Products. In Proceedings of the International Expert Meeting on Virtual Water Trade 2003; Hoekstra, A.Y., Ed.; UNESCO-IHE: Delft, The Netherlands, 2003; pp. 49–76. [Google Scholar] [CrossRef]
- Mekonnen, M.M.; Hoekstra, A.Y. The Green, Blue and Grey Water Footprint of Crops and Derived Crop Products. Hydrol. Earth Syst. Sci. Discuss. 2011, 8, 1577–1600. [Google Scholar] [CrossRef] [Green Version]
- Ma, J.; Wang, D.X.; Hoekstra, A.Y.; Xia, H.X. Application of the virtual water trade to China’s grain security. Adv. Water Sci. 2006, 17, 102–107. [Google Scholar] [CrossRef]
- Carr, J.A.; D’Odorico, P.; Laio, F.; Ridolfi, L. On the temporal variability of the virtual water network. Geophys. Res. Lett. 2012, 39, 92–104. [Google Scholar] [CrossRef]
- Konar, M.; Dalin, C.; Suweis, S.; Hanasaki, N.; Rinaldo, A.; Rodriguez-Iturbe, I. Water for food: The global virtual water trade network. Water Resour. Res. 2011, 47, W05520.1–W05520.17. [Google Scholar] [CrossRef] [Green Version]
- Han, X.; Sun, C.Z. Virtual water flow patterns embedded in major agticulturals in China. Resour. Sci. 2013, 35, 1567–1576. [Google Scholar]
- Sun, C.Z.; Han, X.; Qin, X.N. Research on pattern stability of virtual water flow embedded in major agticulturals trade among regions in China. Geogr. Res. 2014, 33, 478–489. [Google Scholar] [CrossRef]
- Che, L.L.; Han, X.; Qin, X.N. The analysis of influencing factor of virtual water flow in major agticulturals in China based on the BP-DEMATEL model. J. Glaciol. Geocryol. 2015, 37, 1112–1119. [Google Scholar] [CrossRef]
- Alexi, T.; Christopher, J. Virtual Water and an EKC for Water Pollution. Water Resour. Manag. 2017, 31, 1061–1066. [Google Scholar] [CrossRef]
- Suweis, S.; Konar, M.; Dalin, C.; Hanasaki, N.; Rinaldo, A.; Rodrigueziturbe, I. Structure and controls of the global virtual water trade network. Geophys. Res. Lett. 2012, 38, L10403-1–L10403-5. [Google Scholar] [CrossRef] [Green Version]
- Sartori, M.; Schiavo, S. Connected we stand: A network perspective on trade and global food security. Food Policy 2015, 57, 114–127. [Google Scholar] [CrossRef] [Green Version]
- Duarte, R.; Pinilla, V.; Serrano, A. Long Term Drivers of Global Virtual Water Trade: A Trade Gravity Approach for 1965–2010. Ecol. Econ. 2019, 156, 318–326. [Google Scholar] [CrossRef]
- Wheida, E.; Verhoeven, R. The role of ‘virtual water’ in the water resources management of the Libyan Jamahiriya. Desalination 2007, 205, 312–316. [Google Scholar] [CrossRef]
- Abu-Sharar, T.M.; Al-Karablieh, E.K.; Haddadin, M.J. Role of Virtual Water in Optimizing Water Resources Management in Jordan. Water Resour. Manag. 2012, 26, 3977–3993. [Google Scholar] [CrossRef]
- Liang, M.S.; Wang, Z.Z. Optimal regional agricultural planting structure under virtual water strategy. Trans. CSAE 2010, 26, 130–133. [Google Scholar]
- Long, A.H.; Yu, J.W.; He, X.L.; Deng, X.Y.; Su, S.J.; Zhang, J.; Ren, C.; Zhang, P.; Hai, Y. Linking local water consumption in inland arid regions with imported virtual water: Approaches, application and actuators. Adv. Water Resour. 2021, 151, 103906. [Google Scholar] [CrossRef]
- Han, X.; Liang, X.; Wang, Q. Analysis on the structure characteristics of virtual elements tradeing network in major crops trade of China. Acta Ecol. Sin. 2020, 40, 3851–3865. [Google Scholar] [CrossRef]
- Erdos, P.; Rényi, A. On random graphs. Publ. Math. 1959, 6, 290–297. [Google Scholar] [CrossRef]
- Zhu, H.; Wang, X.R.; Zhu, J.Y. The architecture of networks. Physics 2003, 32, 364–369. [Google Scholar]
- Costa, L.D.F.; Rodrigues, F.A.; Travieso, G.; Boas, P.R.V. Characterization of complex networks: A survey of measurements. Adv. Physic 2005, 56, 167–242. [Google Scholar] [CrossRef] [Green Version]
- Sporns, O. The human connectome: A complex network. Ann. N. Y. Acad. Sci. 2011, 1224, 109–125. [Google Scholar] [CrossRef]
- China Agricultural Sector Development Report. Available online: https://iaed.caas.cn/ (accessed on 5 November 2022).
- China Statistical Yearbook. Available online: http://www.stats.gov.cn/tjsj/tjgb/ndtjgb/ (accessed on 5 November 2022).
- Barrat, A.; Barthelemy, M.; Pastor-Satorras, R.; Vespignani, A. The architecture of complex weighted networks. Proc. Natl. Acad. Sci. USA 2004, 101, 3747–3752. [Google Scholar] [CrossRef] [Green Version]
- Hu, H.B.; Wang, L. A brief history of power law distributions. Physics 2005, 12, 889–896. [Google Scholar] [CrossRef]
- Barthelemy, M. Betweenness centrality in large complex networks. Eur. Phys. J. B 2004, 38, 163–168. [Google Scholar] [CrossRef]
- Newman, M.; Barabasi, A.L.; Watts, D.J. The Structure and Dynamics of Networks; Princeton Univ. Press: Princeton, NJ, USA, 2006; ISBN 0691113572. [Google Scholar]
- Chen, C. Influence of heavy-tailed distribution on network traffic. Comput. Appl. 2009, 29, 1520–1522. [Google Scholar] [CrossRef]
- Jana, S.; Erik, M.; Miet, M. Changing Patterns of Global Agri-Food Trade and the Economic Efficiency of Virtual Water Flows. Sustainability 2015, 7, 5542–5563. [Google Scholar] [CrossRef]
- Wang, W.T.; Wei, L.B.; Wang, Q.Q. The effects of market intervention in the soybean market on the international price of soybeans chinese rural economy. Chin. Rural. Econ. 2018, 9, 47–61. [Google Scholar]
- Ren, J.; Peng, Z.; Pan, X. New transboundary water resources cooperation for Greater Mekong Subregion: The Lancang-Mekong Cooperation. Water Policy 2021, 23, 3. [Google Scholar] [CrossRef]
- Arefinia, A.; Bozorg-Haddad, O.; Ahmadaali, K.; Zolghadr-Asli, B.; Hugo, A.L. Cropping patterns based on virtual water content considering water and food security under climate change conditions. Nat. Hazards 2022, 114, 1709–1721. [Google Scholar] [CrossRef]
- Valis, D.; Hasilova, K.; Forbelska, M.; Pietrucha-Urbanik, K. Modelling water distribution network failures and deterioration. In Proceedings of the IEEE International Conference on Industrial Engineering and Engineering Management, Singapore, 10–13 December 2017; pp. 924–928. [Google Scholar] [CrossRef]
Figure 1.
Virtual water trade network (VWTN) of China’s major crops. (a–e) represent virtual water trade networks in 2000, 2005, 2010, 2015, and 2017, respectively. The thicker the line, the larger the content of VWT.
Figure 1.
Virtual water trade network (VWTN) of China’s major crops. (a–e) represent virtual water trade networks in 2000, 2005, 2010, 2015, and 2017, respectively. The thicker the line, the larger the content of VWT.

Figure 2.
Cumulative distribution of virtual water trade network of China’s major crops in 2000–2017. (a) The cumulative distributions of in-node degree. (b) The cumulative distributions of out-node degree. (c) The cumulative distributions of in-node strength. (d) The cumulative distributions of out-node strength.

Figure 3.
Node strength of virtual water trade network of China’s major crops in 2000–2017. (a) In-node strength. (b) Out-node strength.
Figure 3.
Node strength of virtual water trade network of China’s major crops in 2000–2017. (a) In-node strength. (b) Out-node strength.

Figure 4.
Correlation degree of virtual water trade network of China’s major crops. (a) Correlation degree of in-in node. (b) Correlation degree of in-out node. (c) Correlation degree of out-in node. (d) Correlation degree of out-out node. The solid line represents the correlation degree of the unweighted network, and the dotted line represents the weighted network correlation degree.

Publisher’s Note: MDPI stays neutral with regard to jurisdictional claims in published maps and institutional affiliations. |
© 2022 by the authors. Licensee MDPI, Basel, Switzerland. This article is an open access article distributed under the terms and conditions of the Creative Commons Attribution (CC BY) license (https://creativecommons.org/licenses/by/4.0/).
Share and Cite
MDPI and ACS Style
Liang, X.; Long, A.; Yu, J. The Structural Characteristics of the Virtual Water Trade Network of the China’s Major Crops. Water 2022, 14, 4083. https://doi.org/10.3390/w14244083
AMA Style
Liang X, Long A, Yu J. The Structural Characteristics of the Virtual Water Trade Network of the China’s Major Crops. Water. 2022; 14(24):4083. https://doi.org/10.3390/w14244083
Chicago/Turabian StyleLiang, Xuan, Aihua Long, and Jiawen Yu. 2022. "The Structural Characteristics of the Virtual Water Trade Network of the China’s Major Crops" Water 14, no. 24: 4083. https://doi.org/10.3390/w14244083
Note that from the first issue of 2016, this journal uses article numbers instead of page numbers. See further details here.