
Potential of Adsorption of Diverse Environmental Contaminants onto Microplastics


Department of Environmental and Energy Engineering, Yonsei University, Wonju 26493, Republic of Korea
*
Author to whom correspondence should be addressed.
Water 2022, 14(24), 4086; https://doi.org/10.3390/w14244086
Submission received: 22 November 2022
/
Revised: 12 December 2022
/
Accepted: 12 December 2022
/
Published: 14 December 2022
(This article belongs to the Special Issue Advanced Wastewater Treatment from Decontamination to Energy Production)
Abstract
:Microplastics are regarded as vectors of hazardous contaminants due to their ability to adsorb xenobiotic chemicals. This has led to increased interest in the risk of previously neglected microplastic contaminants in the aquatic environment. Here, we assessed the possibility of transferring chemical contaminants to microplastics by evaluating the adsorption performance of (in)organic pollutants on various types of microplastics (polystyrene, PS; polyethylene terephthalate, PET; high-density polyethylene, HDPE; and low-density polyethylene, LDPE;). Considering the toxicity and polarity of each pollutant, dyes (BB9 and RR120) and heavy metals (Cd(II), Pb(II), As(III), and As(V)) were selected for the adsorption experiments. Dye was found to be adsorbed through physical adsorption. The adsorption capacity of microplastics for RR120 and BB9 was the highest for HDPE-1 and LDPE-1, respectively. Additionally, the smaller the size of the microplastics, the higher the adsorbed amounts. The main adsorption mechanism of heavy metals was found to be through physical and chemical adsorption. And adsorption mechanism of dye depends on physical adsorption. Thus, the adsorption of microplastic contaminants was affected more by the condition than by the type of microplastics.
1. Introduction
With the development of industries, plastics have become an indespensible part of modern society due to their adaptability, durability, lightweight nature, and strength. The global production of plastic has increased exponentially since the 1950s to an estimated 367 million tons in 2020 [1]. As the production of plastics increases, the amount of plastic waste also naturally increases. The generation of plastic waste more than doubled to 353 million tonnes from 2000 to 2019. The widespread use and poor disposal management of plastic items has resulted in worldwide pollution of terrestrial and aquatic environments [2]. Commercial plastics are mostly comprised of synthetic polymers derived from fossil-based sources, such as polyethylene (PE), polyethylene terephthalate (PET), polystyrene (PS), high-density polyethylene (HDPE), low-density polyethylene (LDPE) and others. These fossil-based plastics degrade slowly over hundreds to thousands of years after being discarded. The breakdown of large discarded plastic items by weathering results in the formation of microplastics (MPs). MPs have recently been defined as plastic materials with microscopic sizes ranging less than 5 mm by the National Oceanic and Atmospheric Administration. The MPs produced in this way are classified as secondary MPs, while primary MPs are miniscule particles designed for commercial use, such as cosmetics, textiles, and fishing nets. MPs are, therefore, found everywhere in the environment and potentially persist for extended periods in marine, terrestrial and agricultural environments [3,4].
Due to the ubiquitous presence of MPs, its uptake has been reported in various organisms such as zooplankton, mollusks, fish, marine mammals, and birds [5,6]. The negative effects on organisms may be divided into physical and chemical effects. Physical negative effects occur when animals directly ingest MPs. Once ingested by animals, it may be fatal or may obstruct the digestive tract [7]. Earlier, when the seriousness of MP contamination was established, attention was initially paid only to cases of physical damage caused by MPs. However, with continued research, there is now an increased focus on not only the physical but also the chemical damage caused by MP pollution [2,8].
MPs are known to interact with a variety of chemicals including inorganic and organic pollutants [9,10,11]. Several of these contaminants may be adsorbed to MPs owing to one or more adsorption mechanisms such as hydrophobic interactions, hydrogen bonding, or electrostatic interactions, between the sorbent and sorbate. MPs are, therefore, regarded as vectors of hazardous contaminants due to their ability to adsorb xenobiotic chemicals. Several field investigations have proved that the interaction between MPs and these contaminants is universal in the freshwater system. However, most of the studies focus only on the adsorption potential of MPs while ignoring the characteristics of plastics and hazardous contaminants. Plastic waste in the aquatic environment goes through aging and weathering by different mechanisms such as waves, UV irradiation, and sand abrasion, resulting in micro, nano-sized cracks and fractures on the surface of the plastic [12]. Aging by UV irradiation indicated oxygen functional groups such as hydroxyl groups (–OH), and carbonyl groups (C=O), make hydrophile [13]. MP characteristics such as surface area, and hydrophile meet the conditions of adsorption, and they can act as carriers of contaminants [14]. However, most studies have been conducted with one or two types of plastics, and contaminants in cationic and anionic have not been conducted simultaneously. In addition, there were few studies for adsorption effects in various sizes. Therefore, further studies on the adsorption of MPs and dyes are still required.
The experiment conducted in this study aimed to compare the adsorption performance of the following: (1) four different MPs (PS, PET, HDPE, and LDPE), (2) three different size classifications (MP-1, MP-2, and MP-3), (3) various hazardous (in)organic contaminants (dyes and heavy metals), (4) interaction of different ionic polarity contaminants (cationic and anionic), and (5) pH effect. Organic contaminants dyes were selected as representatives. Dyes may be classified as cationic, anionic, and nonionic dyes are released in these forms [15]. The adsorption potential of different types of MPs was therefore, evaluated using cationic and anionic dyes in this study. Inorganic contaminants were additionally studied by selecting cadmium, lead, and arsenic with a high degree of contamination and different polarities. This study is the first to evaluate the adsorption performance of different types of MPs of the same size. Additionally, this is the first study to evaluate the possibility of adsorption of inorganic and organic pollutants by MPs under the same conditions.
2. Materials and Methods
2.1. Materials and Chemicals
Dye solutions were prepared by dissolving analytical grade Basic Blue 9 (BB9, Acros organics, Morris Plains, NJ, USA) and Reactive Red 120 (RR120, Sigma-Aldrich, St. Louis, MO, USA) for the adsorption experiments. Metal solutions were prepared by dissolving analytical grade Cd(II) (Cd(NO3)2·4H2O, Samchun, Republic of Korea), Pb(II) (Pb(NO3)2, (Kanto, Tokyo, Japan), As(III) (NaAsO2, Sigma-Aldrich, St. Louis, MO, USA) and As(V) (Na2HAsO4·7H2O, Sigma-Aldrich, St. Louis, MO, USA). pH was adjusted using diluted HCl (Duksan, Ansan, Republic of Korea), and NaOH (Duksan, Ansan, Republic of Korea) solutions. All the reagents were of analytical purity grade and did not require further purification.
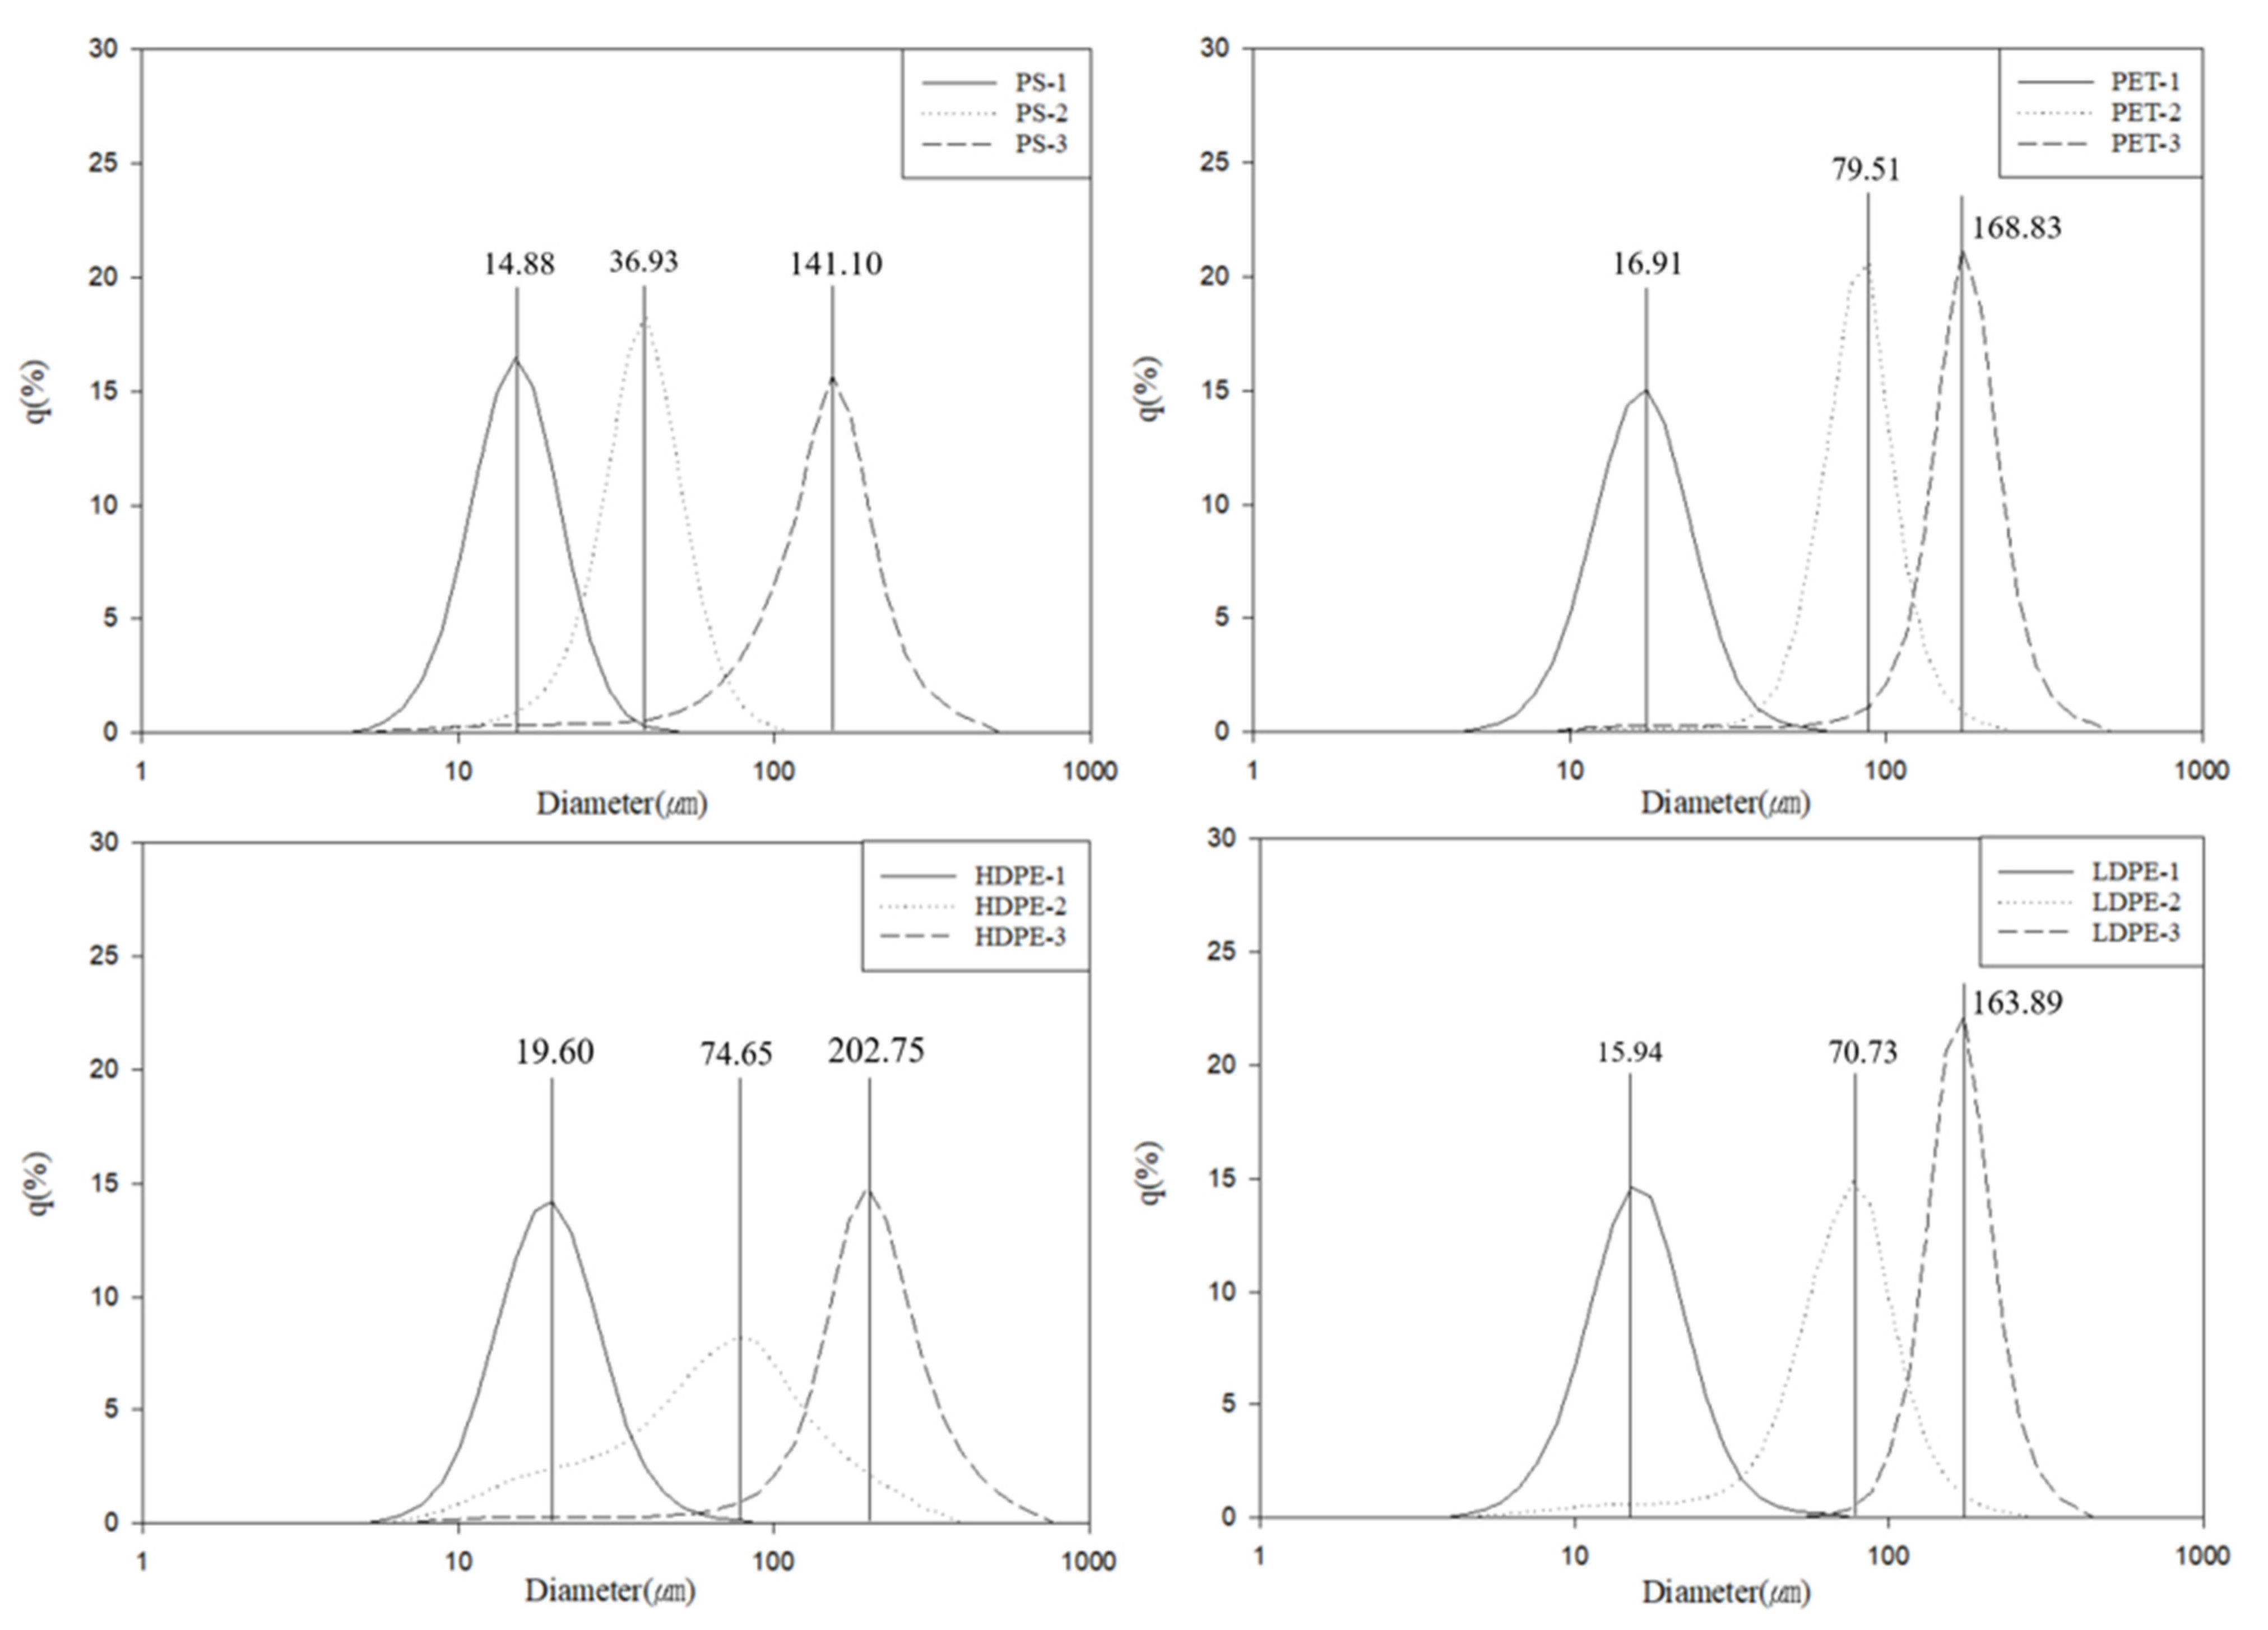
Four types of MPs PS, PET, HDPE, LDPE get support from Korea Testing & Research Institute (KTR). All the MPs were crushed into micro-sized particles using an ultra-micro pulverizer. To delimit the particle size ranges, size separation carried out using multiple size range sieves. A particle size analyzer (PSA) was used to measure the size distribution of MPs in the three different size claasifications finally obtained. Figure 1 shows the three particle size ranges of the four types of MP and the mean size of each. (MP-1; PS-1 = 14.88 µm, PET-1 = 16.97 µm, HDPE-1 = 19.60 µm, and LDPE-1 = 15.94 µm, MP-2; PS-2 = 36.93 µm, PET-2 = 79.51 µm, HDPE-2 = 74.65 µm, and LDPE-2 = 70.73 µm, MP-3; PS-3 = 141.10 µm, PET-3 = 168.83 µm, HDPE-3 = 202.75 µm, and LDPE-3 = 163.89 µm from Table S1).
2.2. Adsorption Experiments
Adsorption experiments were conducted to study the adsorption characteristics of the particle surfaces of the MPs in terms of heavy metals and dye solutions. The four types of MPs were used with 0.5 g/L in this experiment respectively. The experiments were conducted at pH 3 and 10. In the case of the adsorption experiment using cationic dye BB5, the pH of the solution was 10, and that of the dye solution was 3 in the anionic dye RR120 adsorption experiment. Cd(II) and Pb(II) were used as cationic heavy metals, and As(III) and As(V) were used as anionic heavy metals for the evaluation of the heavy metal adsorption performance of MPs. Cationic heavy metals were conducted at pH 3, while anionic metals were conducted at pH 3 and 10. Each batch experiment was performed by bringing 0.025 g of MP samples in contact with 60 mL of metal or dye solutions of known concentration in a 60 mL brown glass vial. This adsorption experiment was performed in a temperature-controlled shaking incubator at a fixed speed of 200 rpm and a temperature of 298 K. The reactions were performed at 1, 7, and 30 days.
The adsorption capacities of the heavy metals and dyes were calculated using the following equation.
where, qe is adsorption capacity of each type of MPs, C0 (mg/L) and Ce (mg/L) are the initial and equilibrium concentrations of solution, m (g) is the mass of the adsorbent and V (L) is the volume of the solution. It was confirmed from three independent replicates that the batch experiments were producible within at most 5% error in this study.
2.3. Analysis and Characterization
All the samples were filtered through a 0.20 µm membrane before analysis. The residual concentrations of BB9 (664 nm) and RR120 (534 nm) were analyzed on a UV-Vis spectrophotometer (Cary50, Varian Medical Systems Inc., Palo Alto, CA, USA). The concentration of heavy metals was detected using an inductively coupled plasma-optical emission spectrometer (ICP-OES, Thermo Jarrell Ash Co., Waltham, MA, USA). The surface morphology and characteristics of MPs were examined using a scanning electron microscope (SEM, JSM-7001F, JEOL, Tokyo, Japan). The surface charge of MPs was determined by using a zeta potential analyzer (Zeta ELS-1000ZS, Otsuka electronics, Osaka, Japan) under different pH conditions. The measurement principle was based on the electrophoretic light scattering method (laser doppler method). A stock solution of MPs was prepared in 1 mM KCl. The pH was set at 3–10, which was adjusted with 0.1 M HCl and 0.1 M KOH. Air contact of the sample was minimized during the analysis of the zeta potential. This is because contact with carbon dioxide in the air can cause pH changes. The functional groups of MPs were compared before and after adsorption using Fourier-transform infrared spectroscopy (FT-IR, PerkinElmer Inc., Waltham, MA, USA). The adsorbed sample was prepared by filtering through a filter of 1 μm size and freeze-drying.
3. Results and Discussion
3.1. Characteristics of MPs
Figure 2a demonstrates the surface morphologies of PS-1, PET-1, HDPE-1, and LDPE-1. Considering the sample was prepared using an ultra-micro pulverizer, the surface morphology has an irregular shape. While comparing the four types of MPs, the SEM image confirmed that there were some cracks on all the particle surfaces. It was also confirmed that it was distributed in diverse size-range microplastics.
Zeta potential analysis was performed to confirm the surface charge of MPs according to the pH. Figure 2b demonstrates the surface charge of PS, PET, HDPE, and LDPE. The order of zeta potential value at pH3 was PET > PS > HDPE > LDPE, while that at pH10 was confirmed to be HDPE > PS > LDPE > PET. The surface charge of MPs may be indicated as a point of zero charge (pHpzc). A gradual decrease of zeta potential was observed with increased in pH. On average, a pHpzc of MPs is pH 4. Acidic pH values of 3.0 and 4.0 represents a positive charge on the MP surface, while pH values of 5.0 to 10.0 represents a negative charge. In the case of pH > pHpzc, adsorption of cationic dye is favored due to the presence of OH- group. On the contrary, adsorption of anionic dye is favored in pH < pHpzc due to the H+ group [16]. This, therefore, demonstrates that pH is an important factor in determining the surface charge of MPs.
Functional groups of MPs are an important factor in confirming the mechanism before and after adsorption. Figure 2c demonstrates the functional groups of pristine MPs. For PS, the peak observed at 3070 cm−1, 3025 cm−1, and 2923 cm−1 belonged to the C–H aromatic stretch, that at 1610 cm−1, 1496 cm−1 to the C–C aromatic ring stretch, 1448 cm−1 to CH2 bending and that at 759 cm−1, 701 cm−1 to the C–H aromatic ring stretch. For PET, the peak at 1728 cm−1 corresponded to the C=O ester carbonyl stretch, that at 1572 cm−1, 1501 cm−1 to the C–C aromatic ring stretch, 1368 cm−1, 1340 cm−1 to CH2 wagging, 1094 cm−1 to the C–O bending and 715 cm−1 to the C–H aromatic stretch. For HDPE, the peak at 2926 cm−1 and 2811 cm−1 were assigned to the C–H stretch, 1472 cm−1 to CH2 bending, and 728 cm−1 to CH2 rocking. For LDPE, the peak at 2925 cm−1 and 2815 cm−1 was assigned to the C–H stretch, that at 1478 cm−1 to CH2 bending, 1377 cm−1 to CH3 bending, and 728 cm−1 to CH2 rocking. All peaks are characteristic of MPs that are typically found.
3.2. Dye Adsorption
Dye wastewater discharged from various industries contain several contaminants, including anion/cation synthetic dyes [17]. This experiment aimed to study the interaction of MPs for the adsorption of the widely used cationic dye BB9 and anionic dye RR120.
Table 1 shows the results of a study on the adsorption of dyes to various MPs. Most of MPs dye adsorption studies have never conducted studies adsorbing both cations and anions, and there is no study on MPs size by size as in the present study. And small-sized MPs that have recently become an issue due to their potential for harm to organisms’ body were used in the study. Therefore, in this study, cations and anions were adsorbed for each MPs size. According to Figure 2b, the surface charge of MPs are affected by the pH. The adsorption capacity of MPs with anion dyes is therefore expected to increase at pH 3, while that with cationic dyes is expected to increase at pH 10.
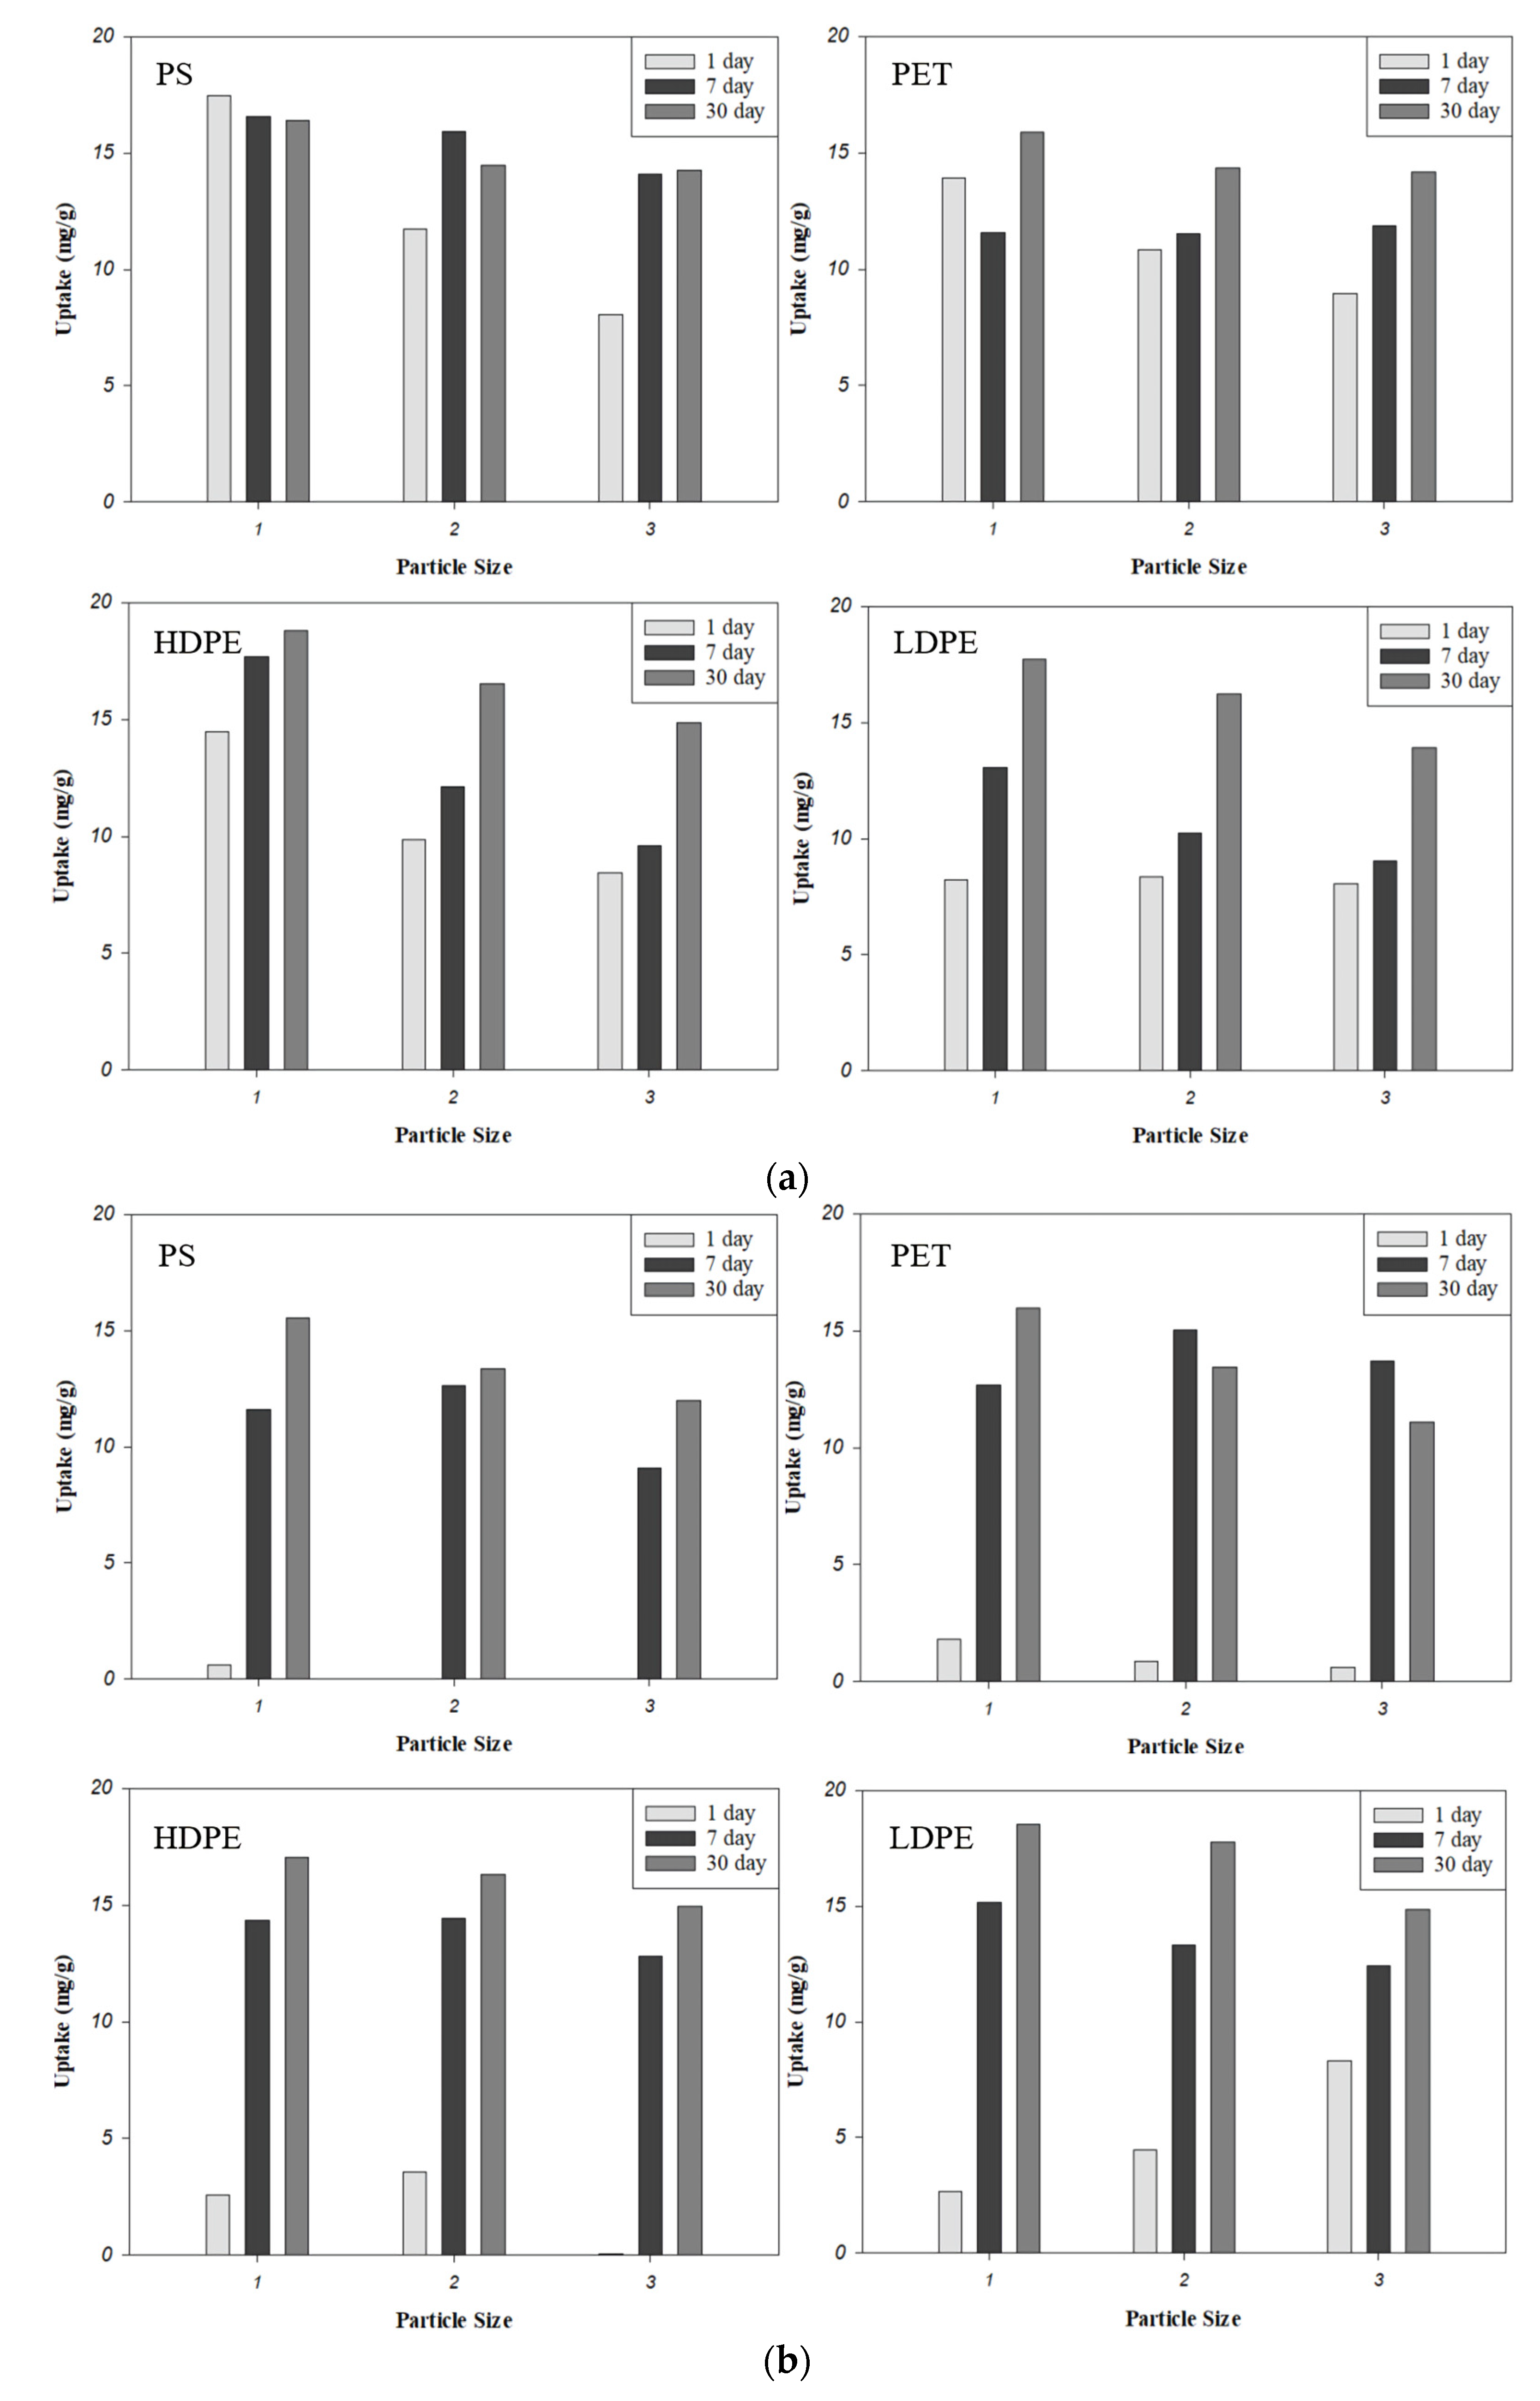
Figure 3 demonstrates the adsorption of RR120 and BB9 by MPs. In the case of RR120, the adsorption demonstrated a rapid increase on day 1 and reached adsorption equilibrium between day 1 and 7. The BB9 was observed not to reach enough adsorption equilibrium for one day. The adsorption capacity rapidly increased between day 1 and 7 and demonstrated adsorption equilibrium by day 30. The adsorption capacity of MPs with RR120 was as observed to be as follows: HDPE-1 (18.797 mg/g) > LDPE-1 (17.736 mg/g) > PS-1 (16.585 mg/g) > PET-1 (15.900 mg/g) and the adsorption capacity of MPs with BV10 was observed to be as follows: LDPE-1 (18.541 mg/g) > HDPE-1 (17.035mg/g) > PET-1 (15.974 mg/g) > PS-1 (15.553 mg/g). Since the adsorption experiment of RR120 was conducted at pH 3, which is a low pH region, the surface of the MPs was positively charged by H+ and adsorbed by electrostatic interaction to the SO3− of RR120. BB9 also receives OH− on the surface of MPs at pH 10, has a negative charge, and is adsorbed by electrostatic interaction with the N+ of BB9.
A comparison of the MPs by size demonstrated higher adsorption capacity for the dyes, following the order of MP-1 > MP-2 > MP-3, thereby proving that the smaller the particle size, the higher the adsorption capacity.
FTIR was used to compare the functional groups of MPs before and after dye adsorption. Figure 4 demonstrates the differences in the peaks before and after adsorption. The FTIR data after adsorption demonstrated slightly new peaks. However, this is inconsequential considering the peak is due to residual dye. The chemisorption of RR120 and BB9 on the MP surface is the only available functional group with C=O ester carbonyl stretch on the surface of PET. The C=O ester carbonyl stretch at 1728 cm in PET is not converted. It was observed that chemisorption hardly occurs and only physisorption occurs with Van der Waals force, Pi-Pi bond interaction, and electrostatic interaction [23].
3.3. Heavy Metal Adsorption
As shown in Table 2, most of the heavy metal adsorption studies of MPs are mainly adsorption information of cationic heavy metals. In addition, no experiments have been conducted in an optimal environment in which each adsorption can occur well. As with the dyes mentioned in the previous chapter, heavy metals exist as cations and anions in an aqueous system depending on the environment. Cadmium and lead were selected as the representative cationic heavy metals considering they are frequently used in the manufacture of plastics [24]. As an anionic heavy metal, arsenic, which is frequently exposed in nature as well as in the metallurgical industry, was selected for this study.
In general, it was reported that the performance of cationic metal adsorption increases with an add up in pH. To accurately evaluate the adsorption potential, the experiment should be conducted in a lower range than the pH range where the precipitation of hydroxide occurs. For this reason, an experiment was conducted to evaluate the adsorption potential of plastics to cationic heavy metals at a pH of 3. Both Cd(II) and Pb(II) were studied with all MPs with high adsorption amount at the smallest size and 30 days(Figure 5). According to previous studies, the influence of the polymer type primarily depends on the MPs and experiment conditions. For example, Guo et al. selected four MPs to adsorb Cd(II) and where the order of adsorption was found to be PE < PP < PS. In this study, a high adsorption capacity was determined in the order of PS < LDPE < HDPE < PET [30]. There was observed a strong correlation between the adsorption capacity of MPs and their specific surface area.
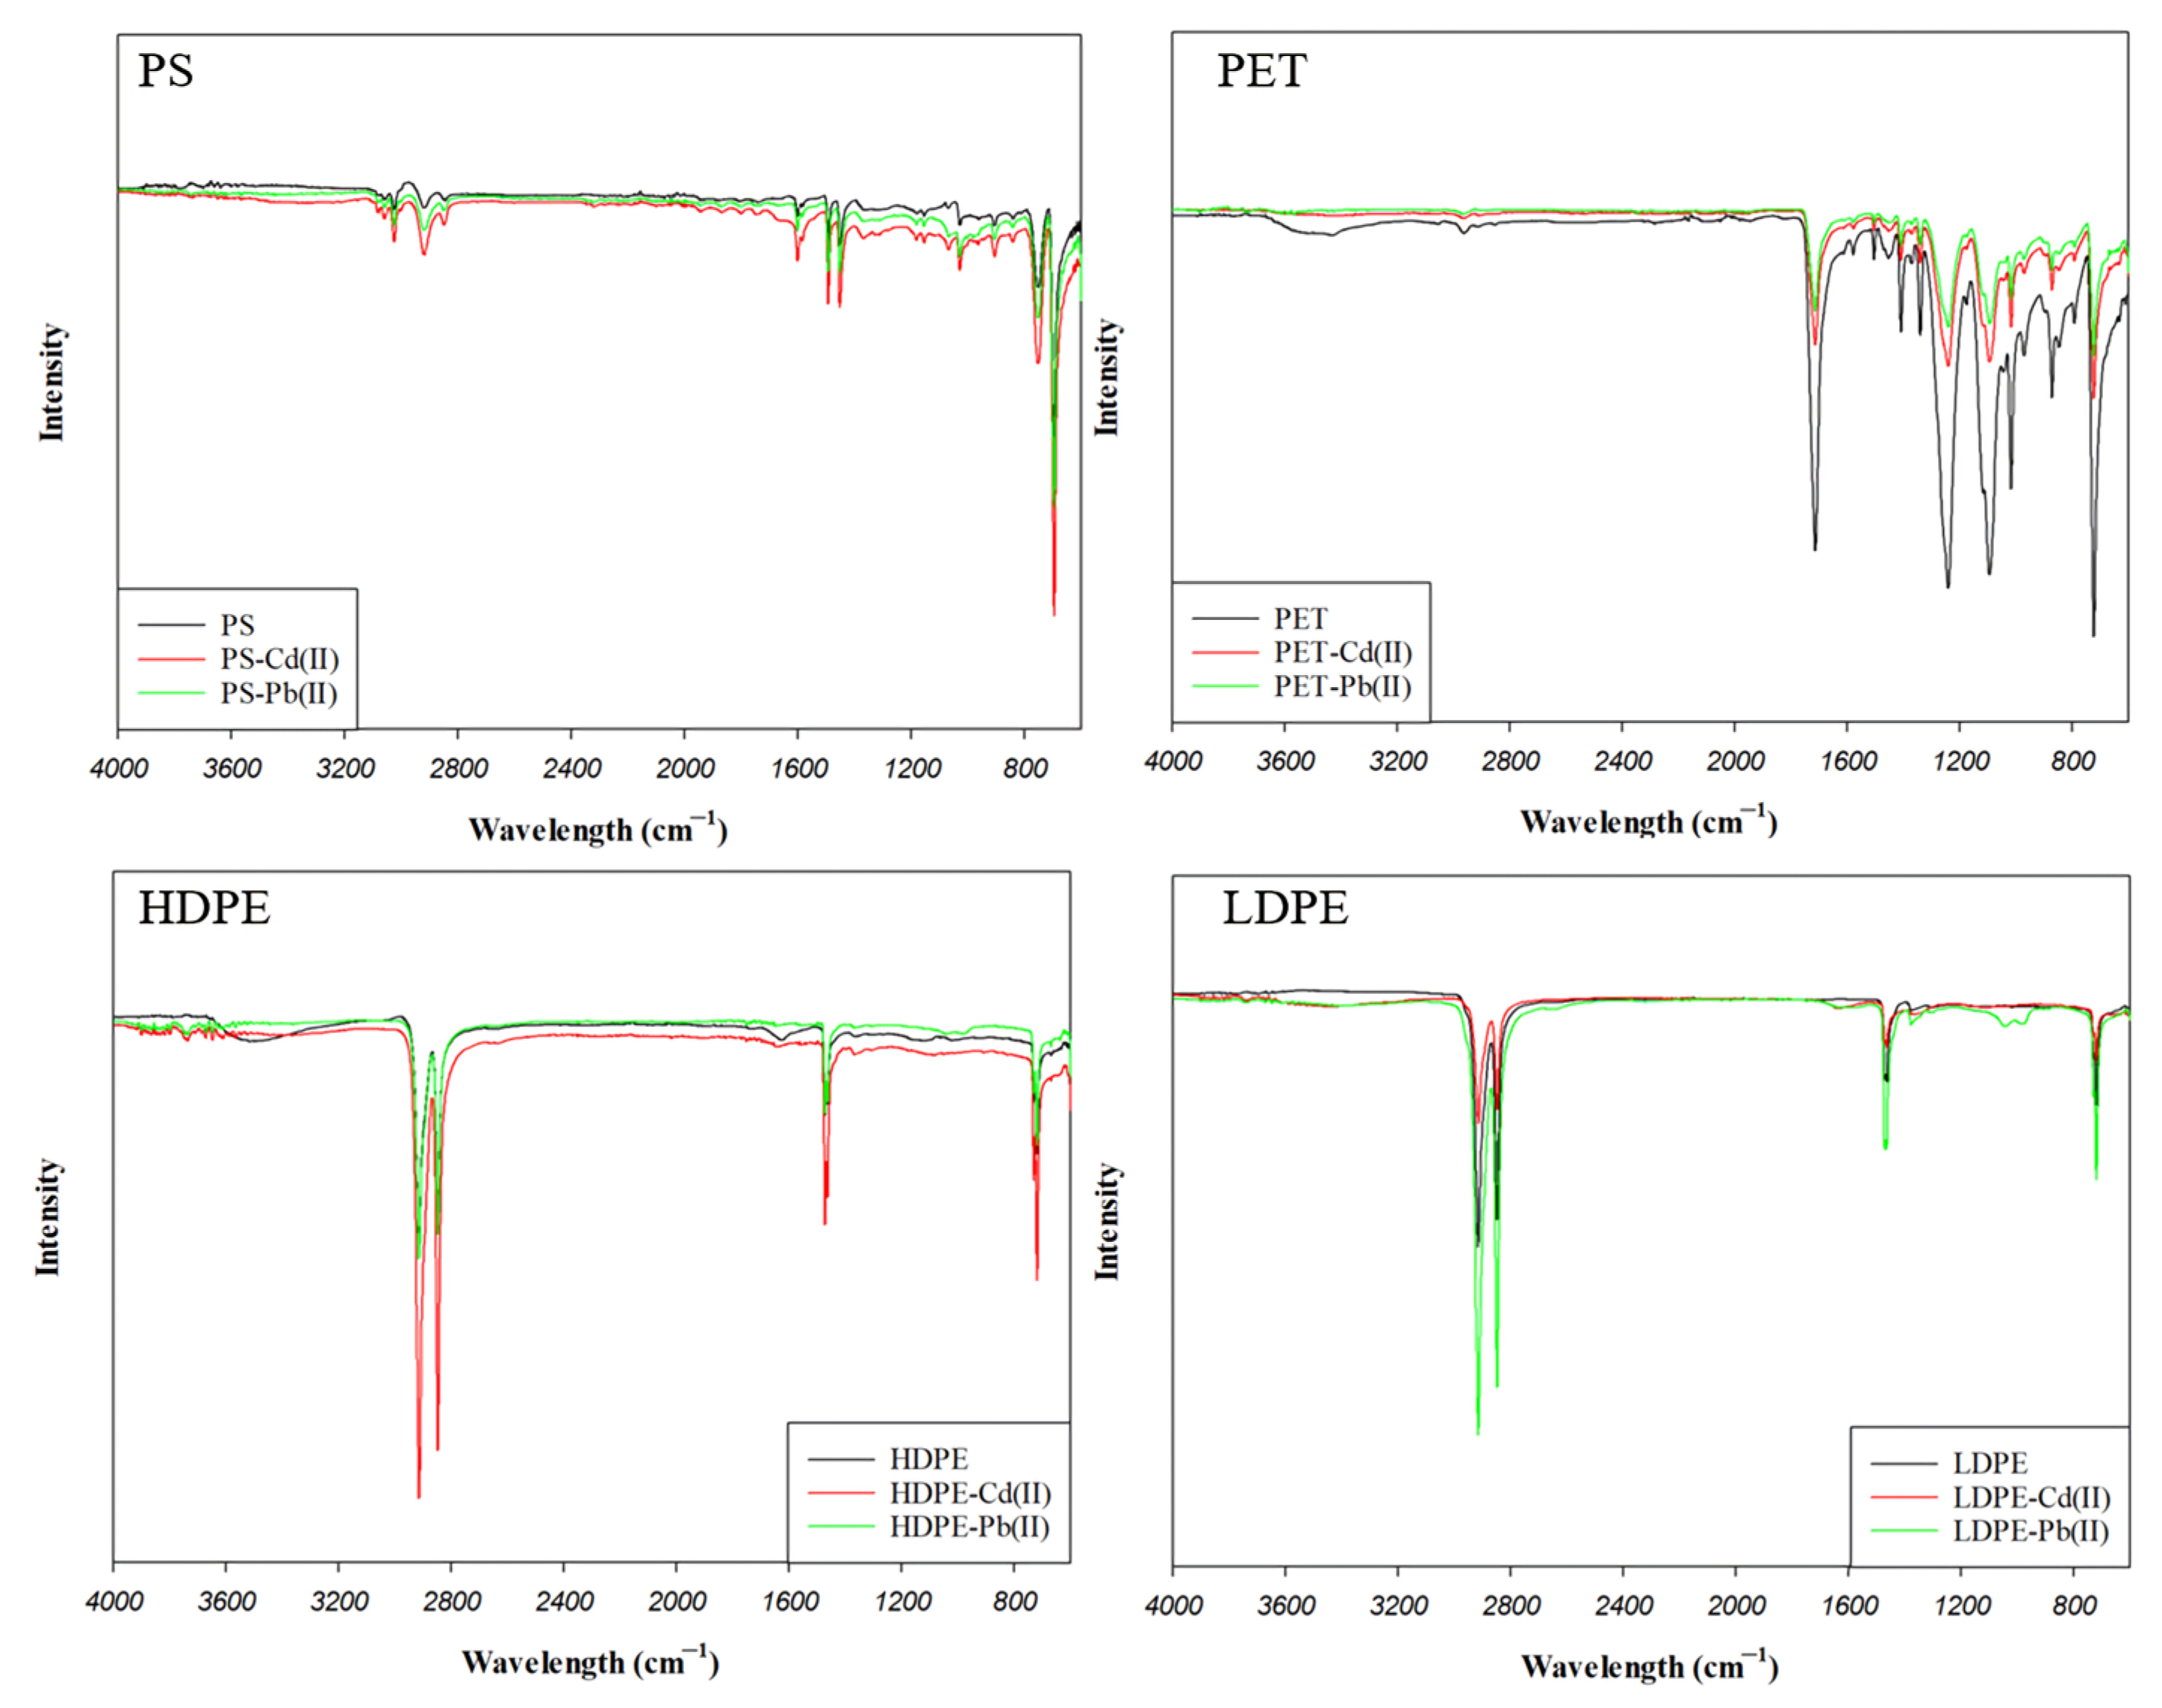
Figure 6 demonstrates the results of the FTIR characterization of four MPs before and after the adsorption of Cd(II) and Pb(II). The FTIR analysis demonstrated that no new functional groups were generated after the adsorption of Cd(II) and Pb(II), indicating that the physical interaction which depends on the forces between the adsorbate and adsorbent molecules was dominant during the adsorption process. The dominant mechanism of Cd(II) and Pb(II) adsorption on MPs is suggested as a physical interaction in other studies [25,31].
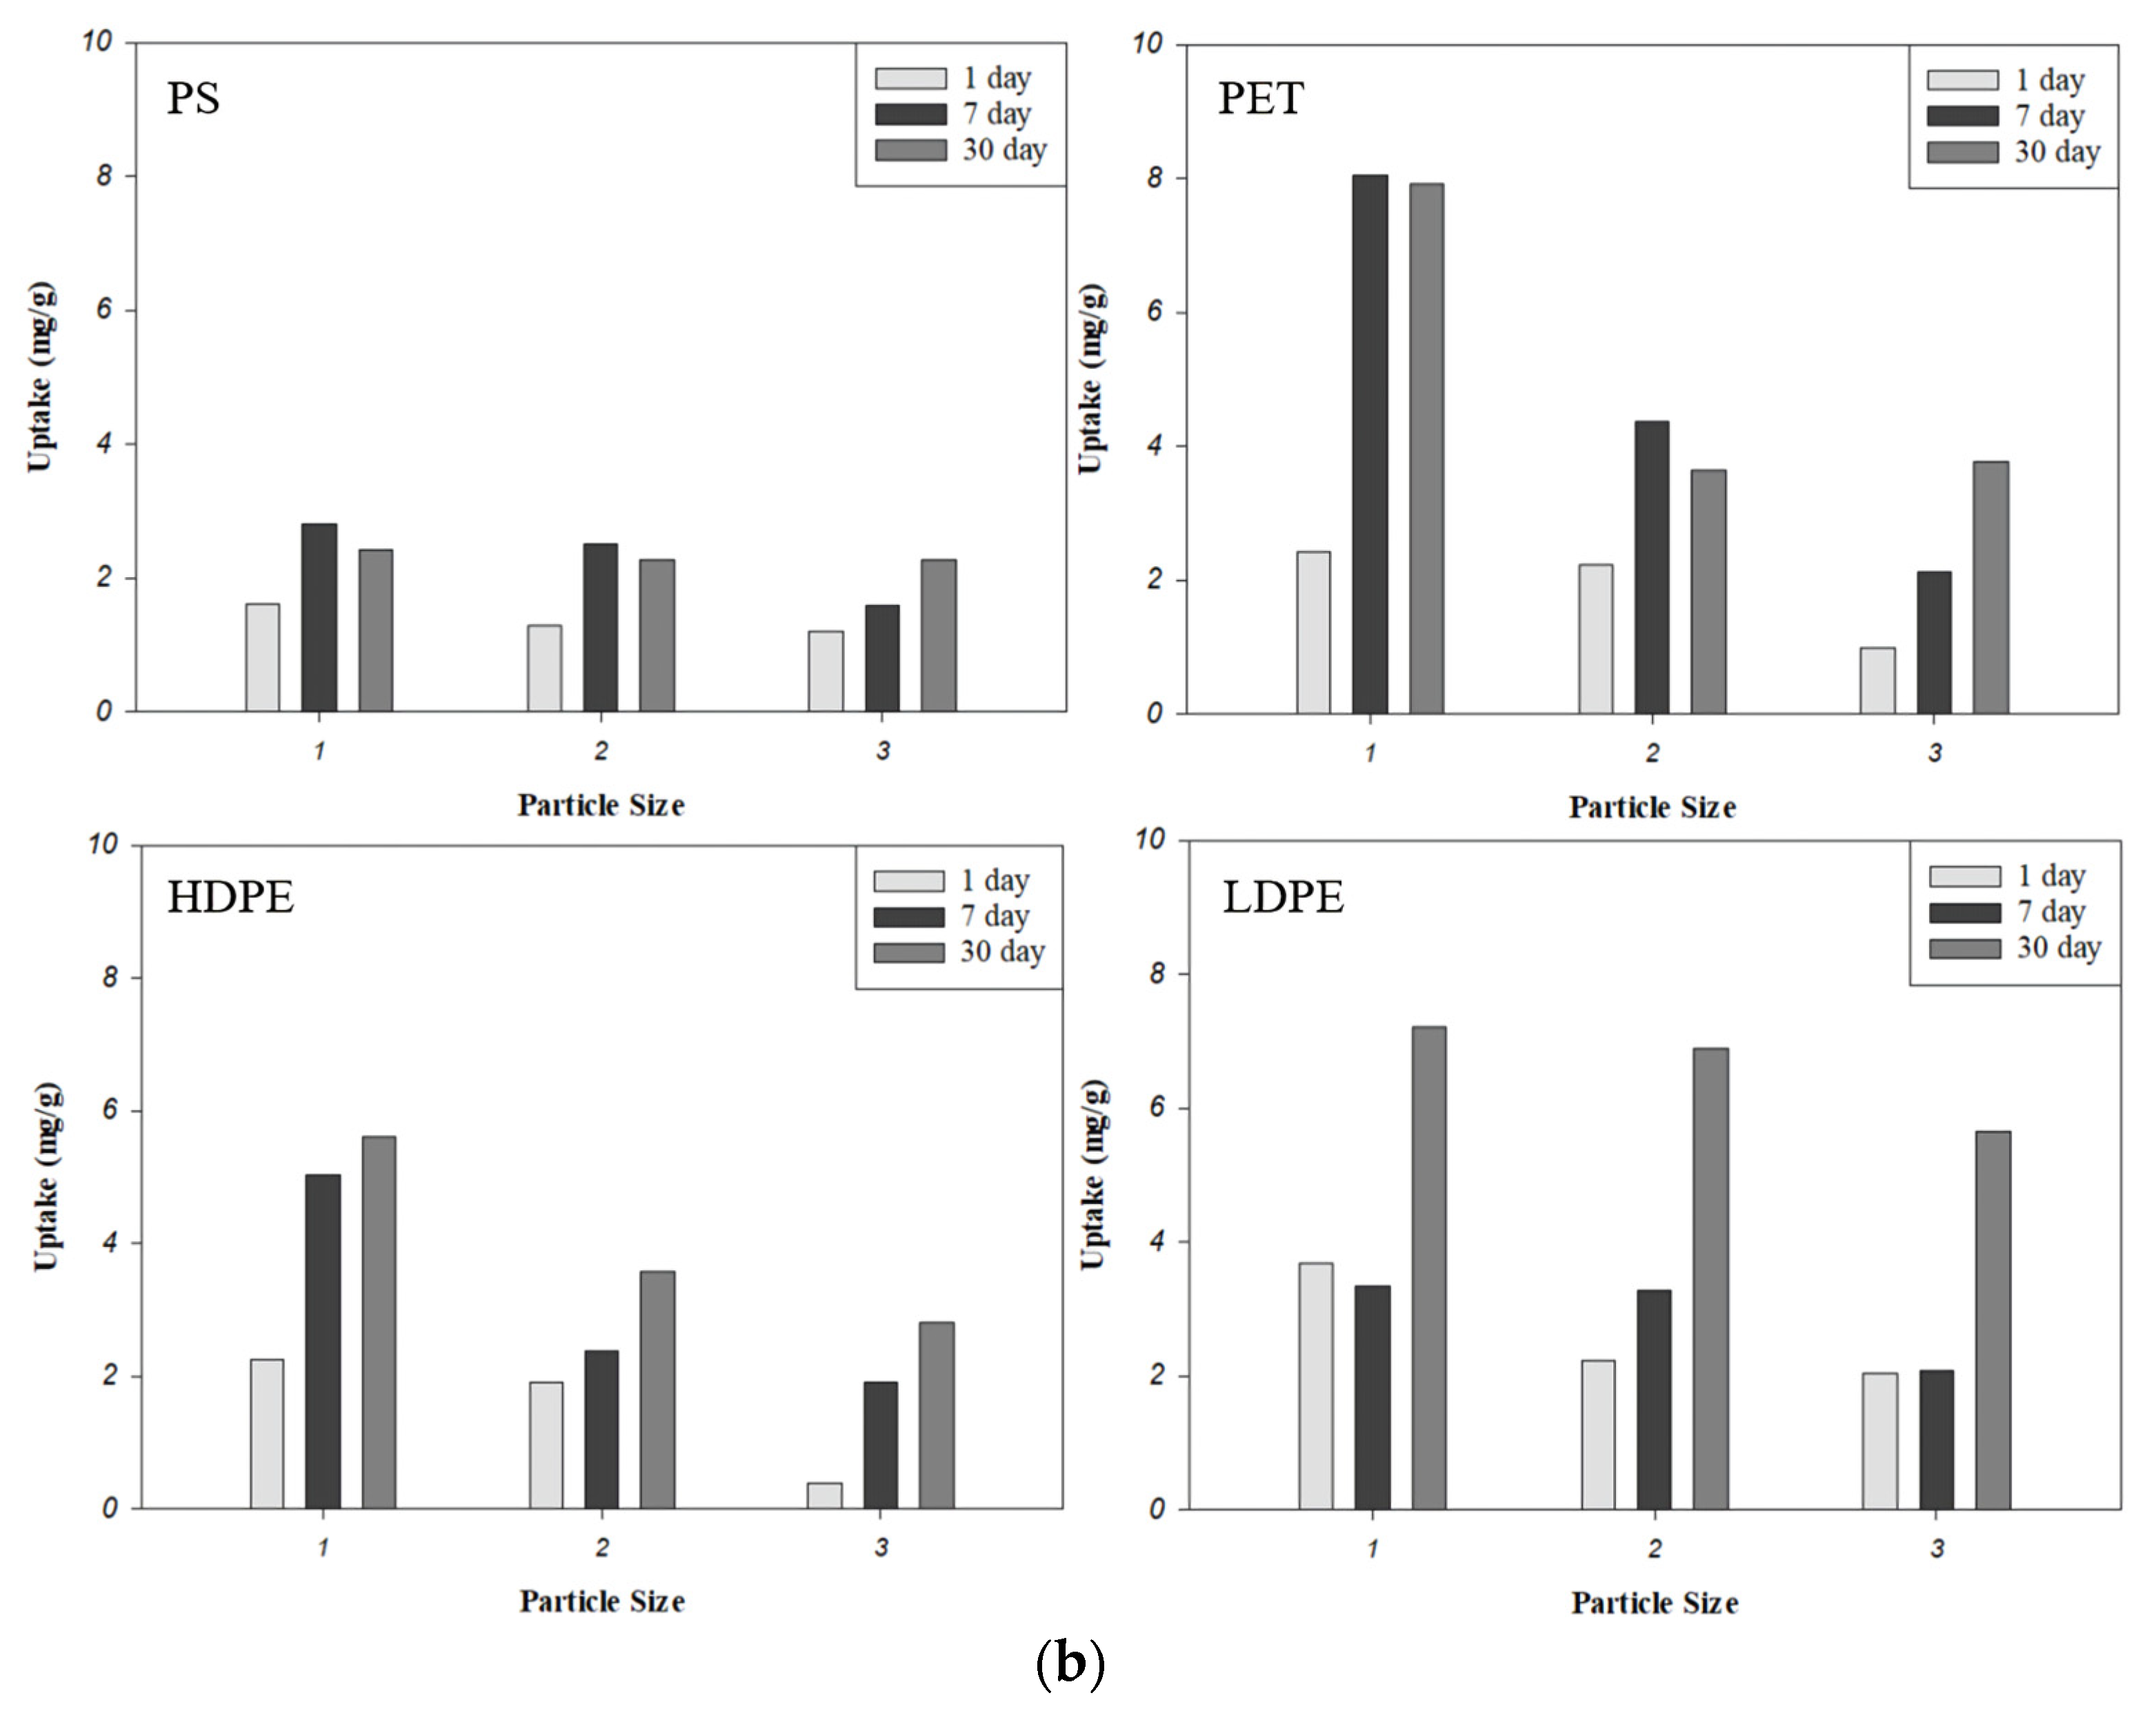
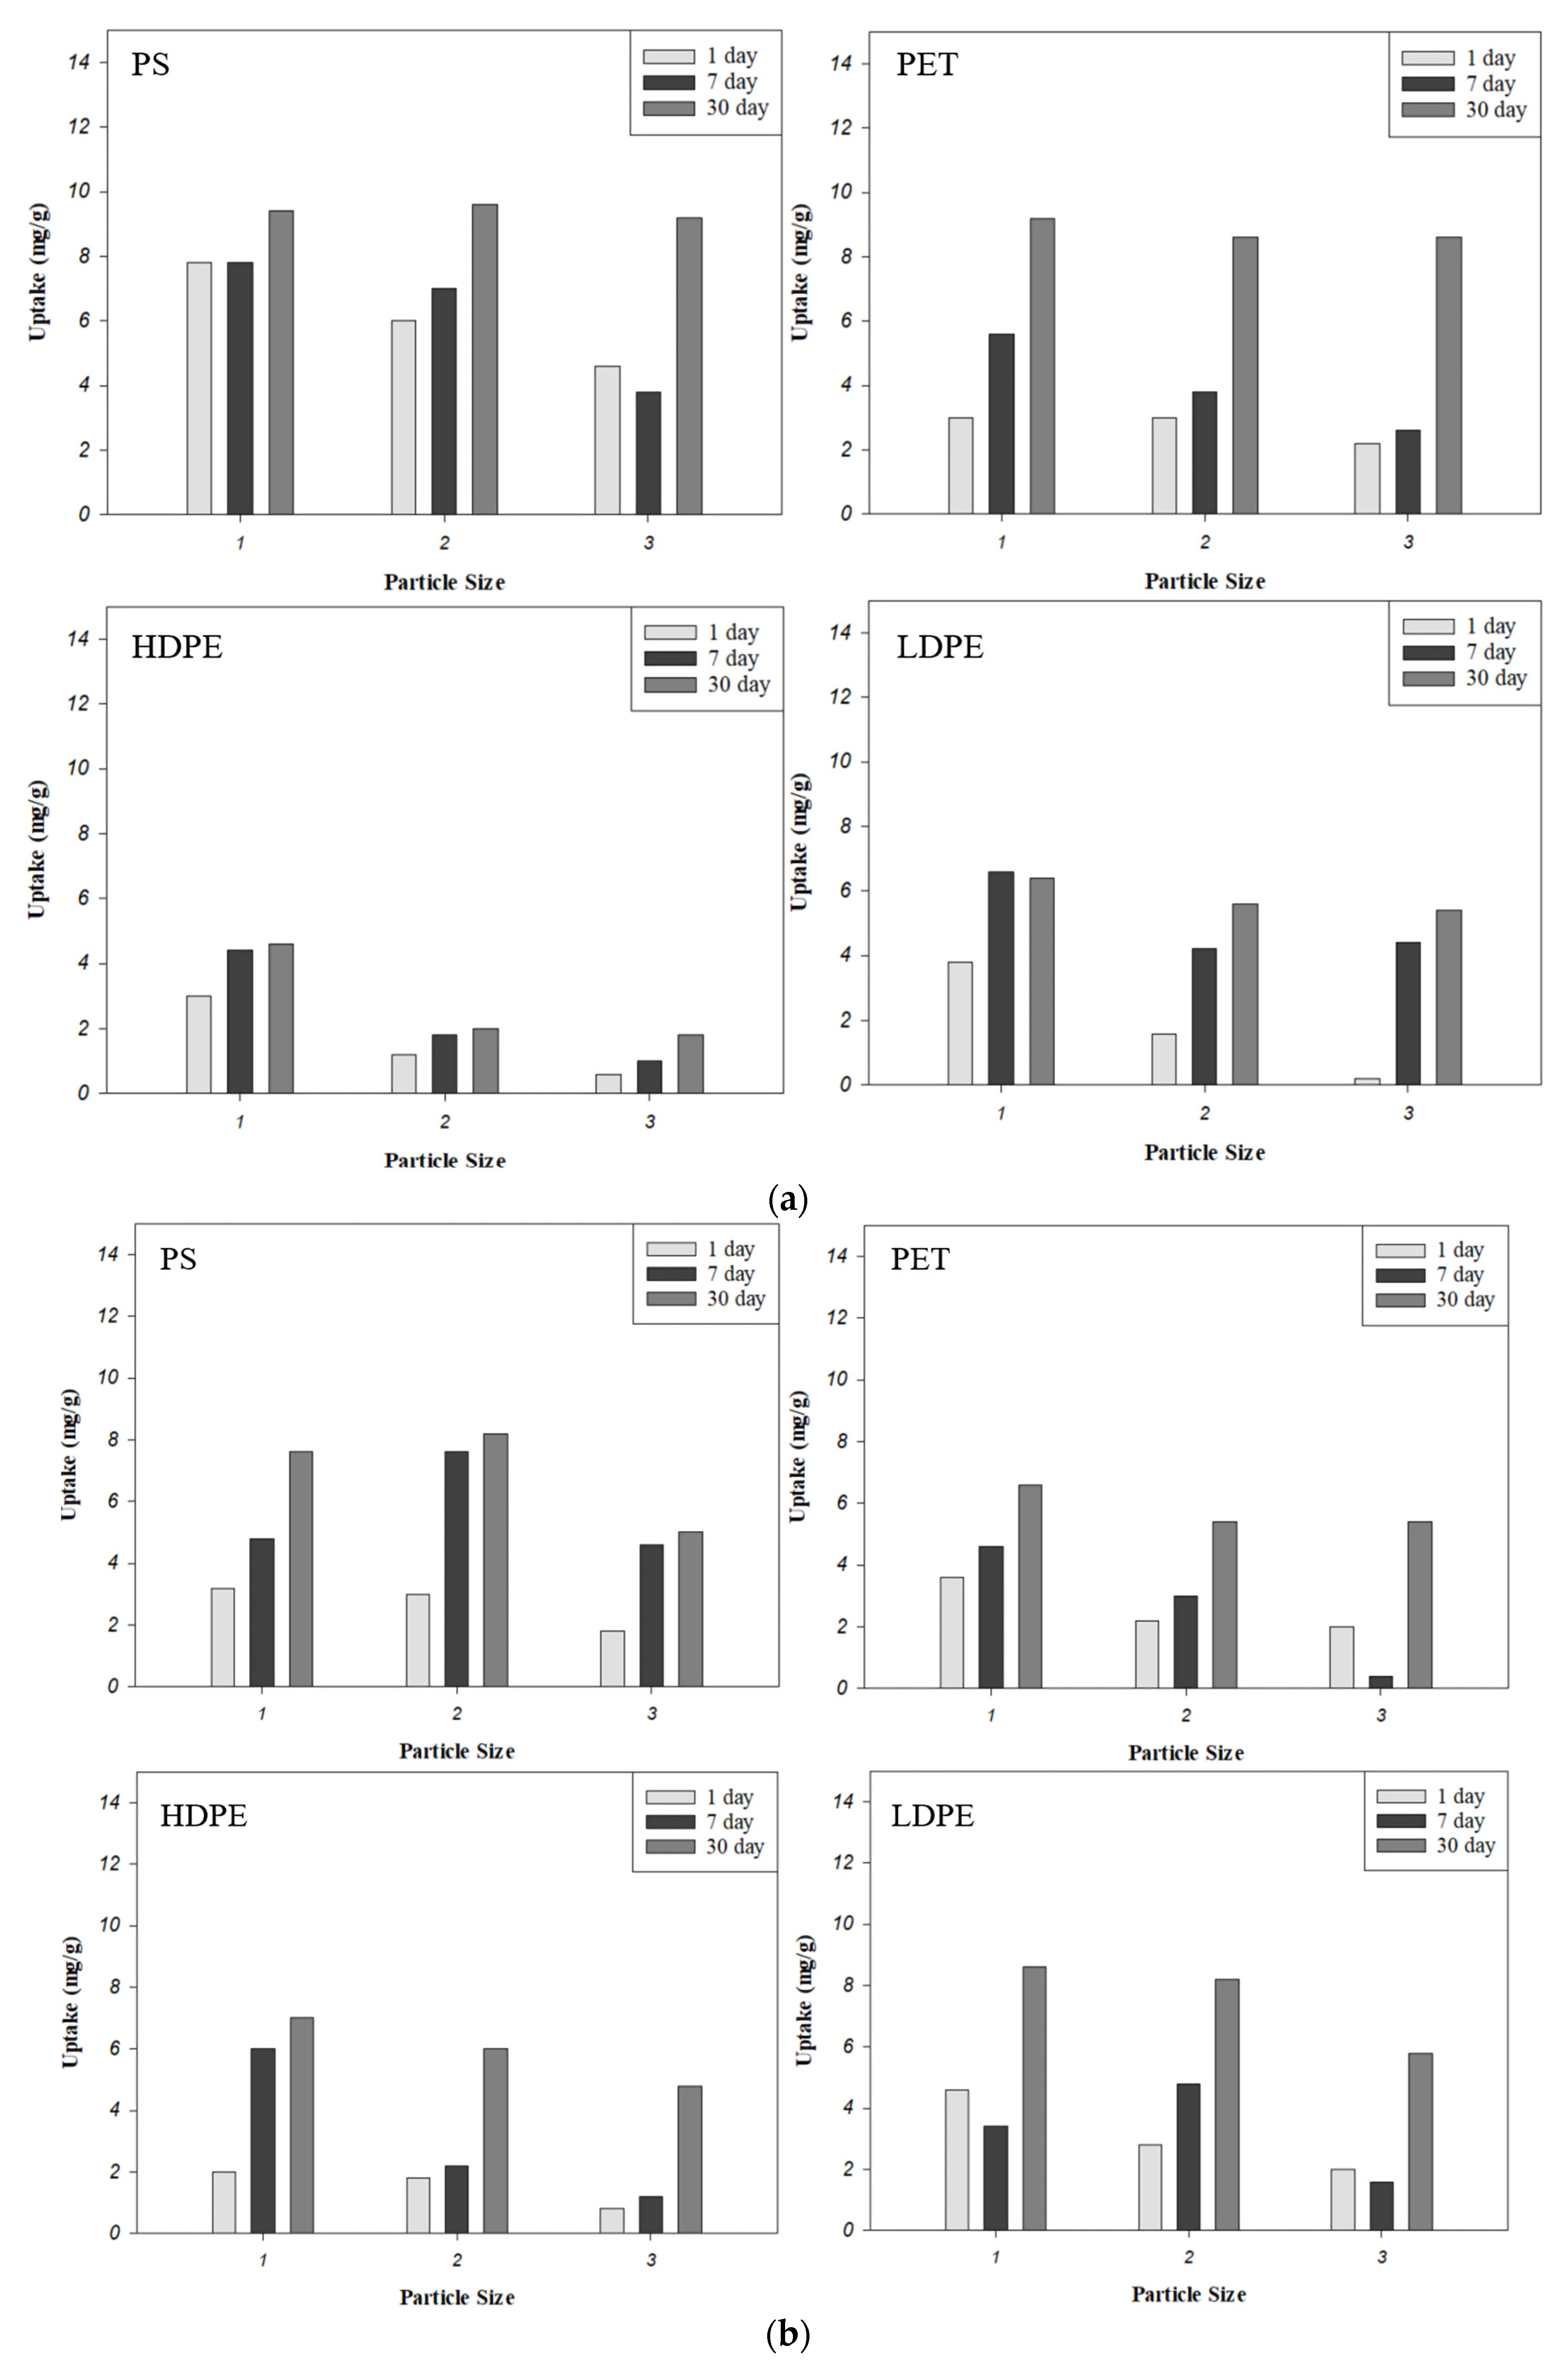
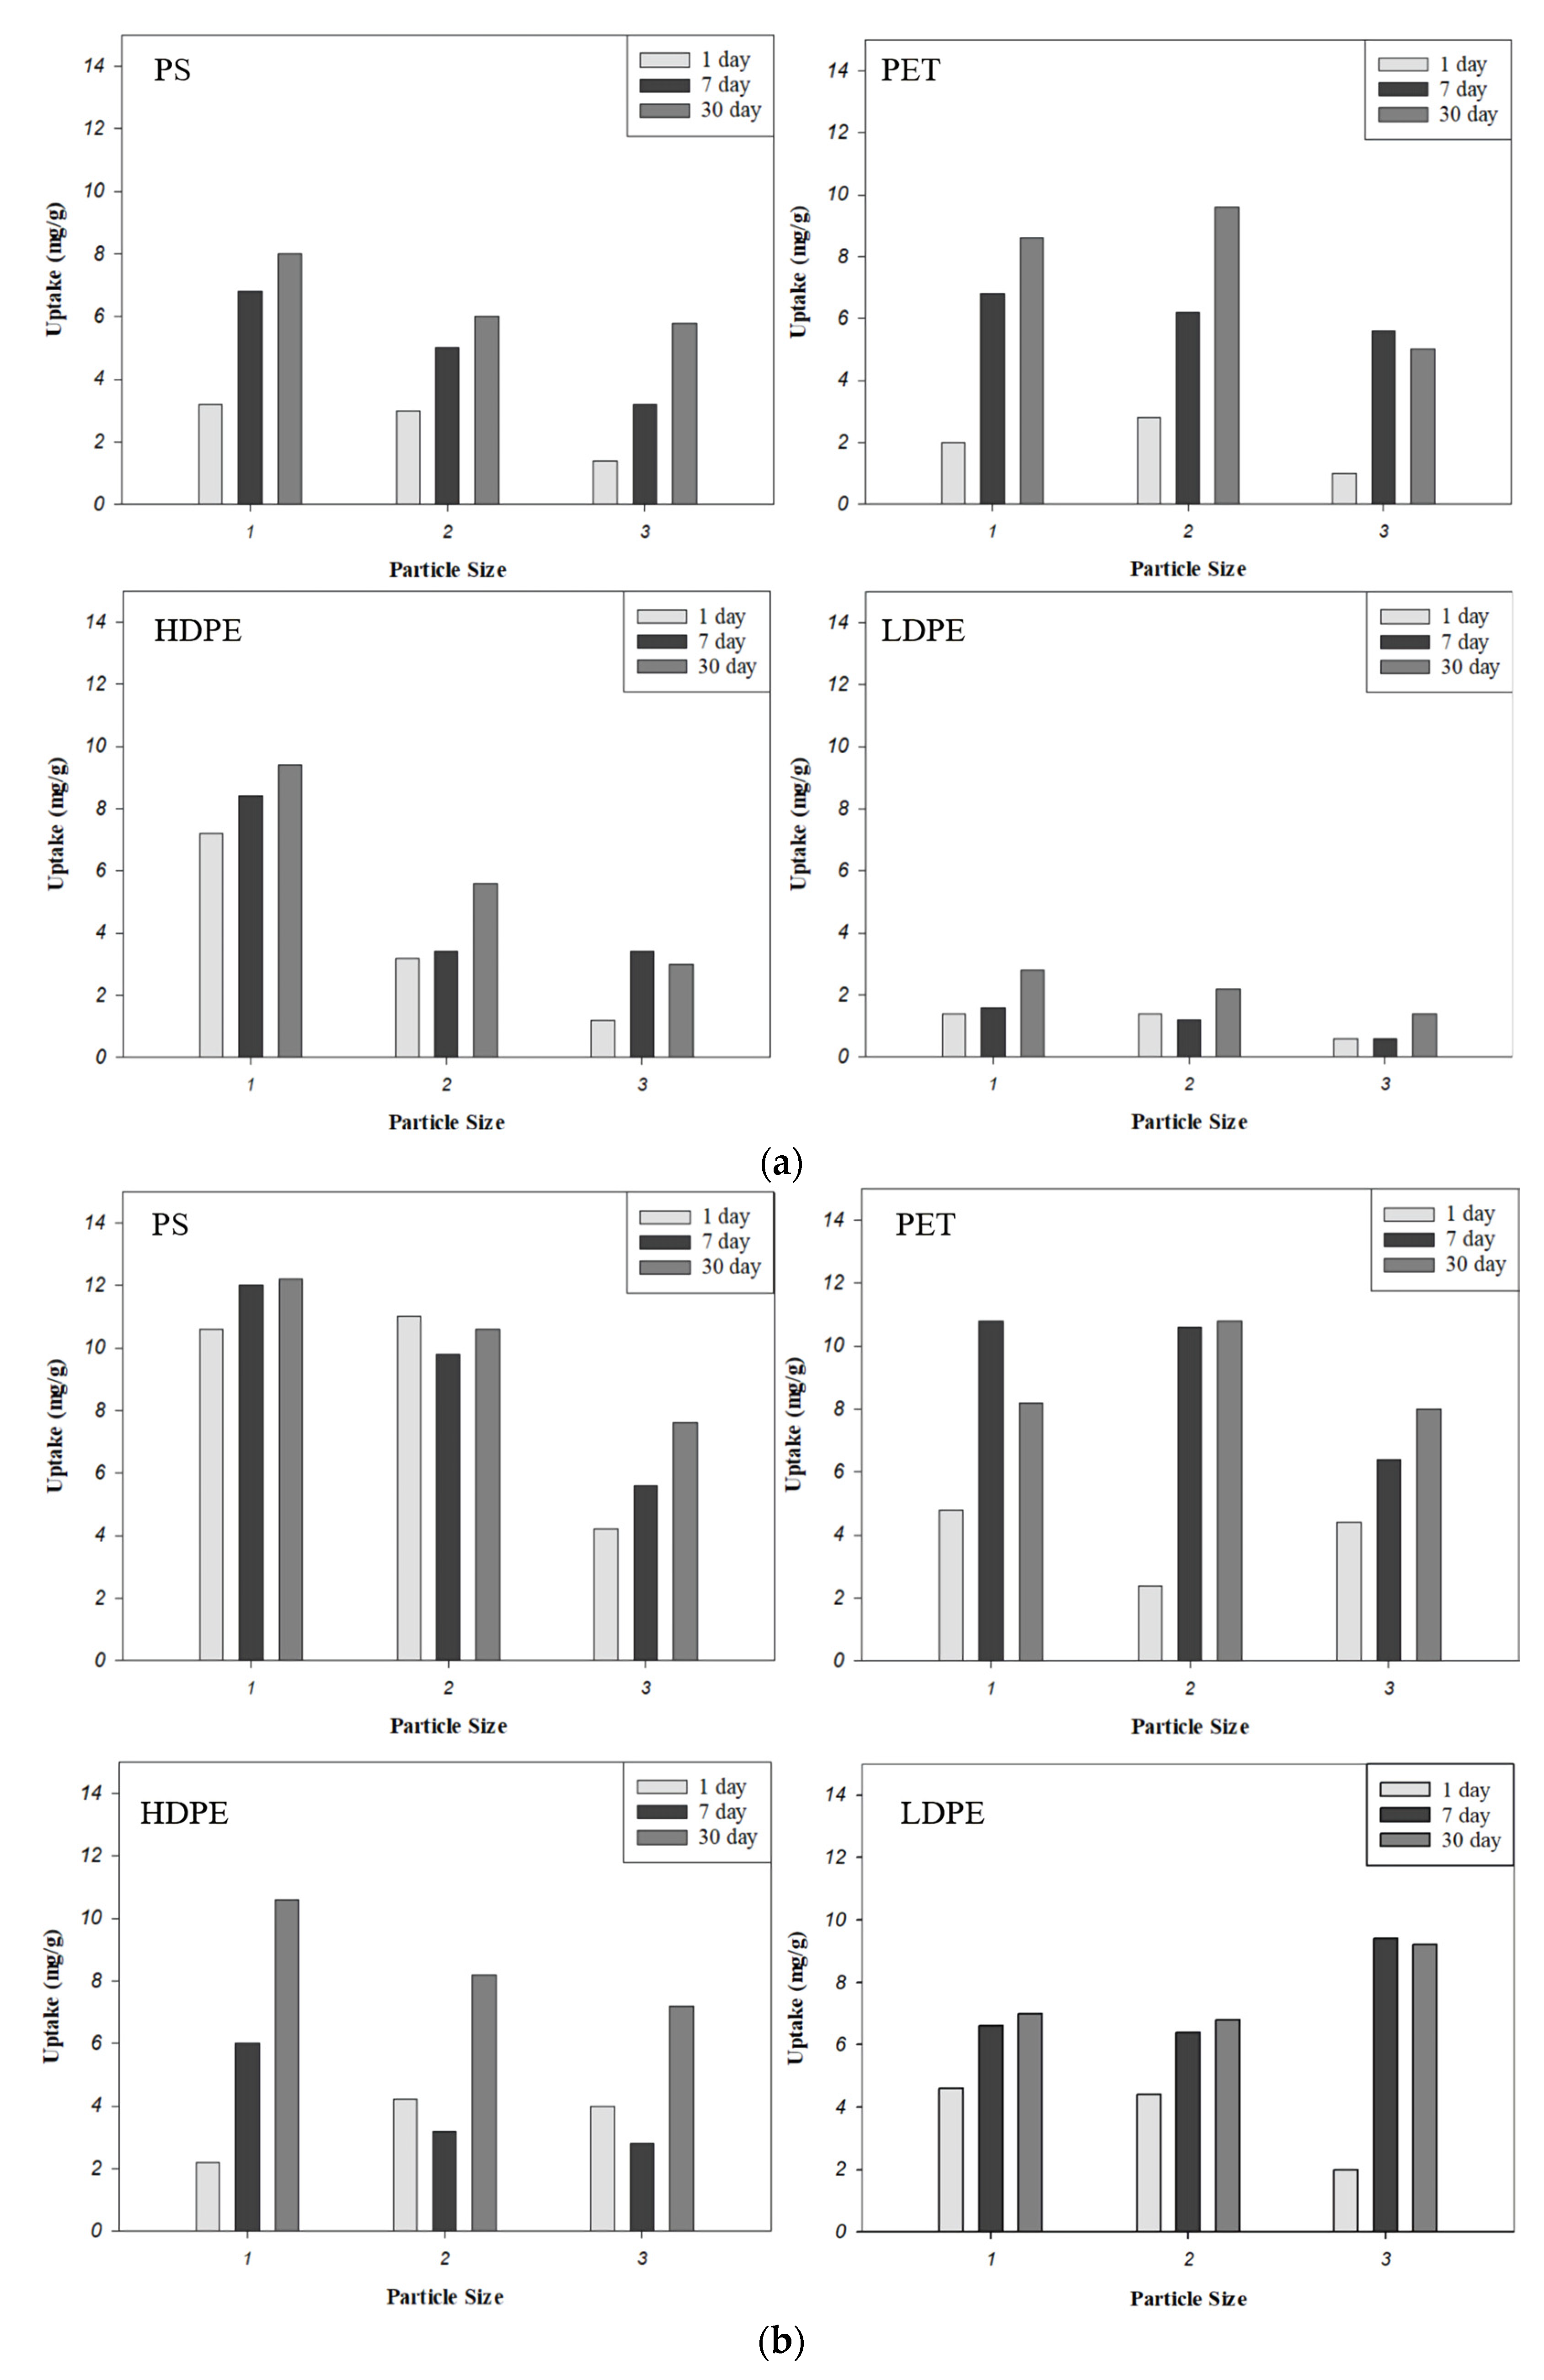
Among the heavy metals present as anions in the aqueous system, As, which has a high degree of pollution and strong toxicity, exists as two oxidation-state species (As(III) and As(V)). The mobility and toxicity of As are determined by its oxidation state. As(III) predominates in immoderately reducing anaerobic environments such as groundwater, whereas As(V) generally predominates in oxidizing conditions typical of seawater, lakes, and rivers. The pH value and the oxidizing or reducing conditions are sensitive factors for the forming elements of As. For instance, the As(III) species exists as H3AsO3 (pH < 9.2), H2AsO3− (9.2 < pH < 13.4) and HAsO32− (pH > 13.4) in aqueous environments while As(V) species exist as H3AsO4 (pH < 2.2), H2AsO4− (2.2 < pH < 6.9), HAsO42− (6.9 < pH < 11.5) and AsO43− (pH > 11.5). The observed effects of pH on arsenic sorption are governed by the arsenic species in the solution [32]. For this reason, an experiment was conducted to evaluate the adsorption potential of plastics to As(III) and As(V) at pH 3 and 10. In the case of the adsorption of arsenic, unlike other cationic heavy metals, the adsorption amount continued to increase as the contact time increased. (Figure 7 and Figure 8).
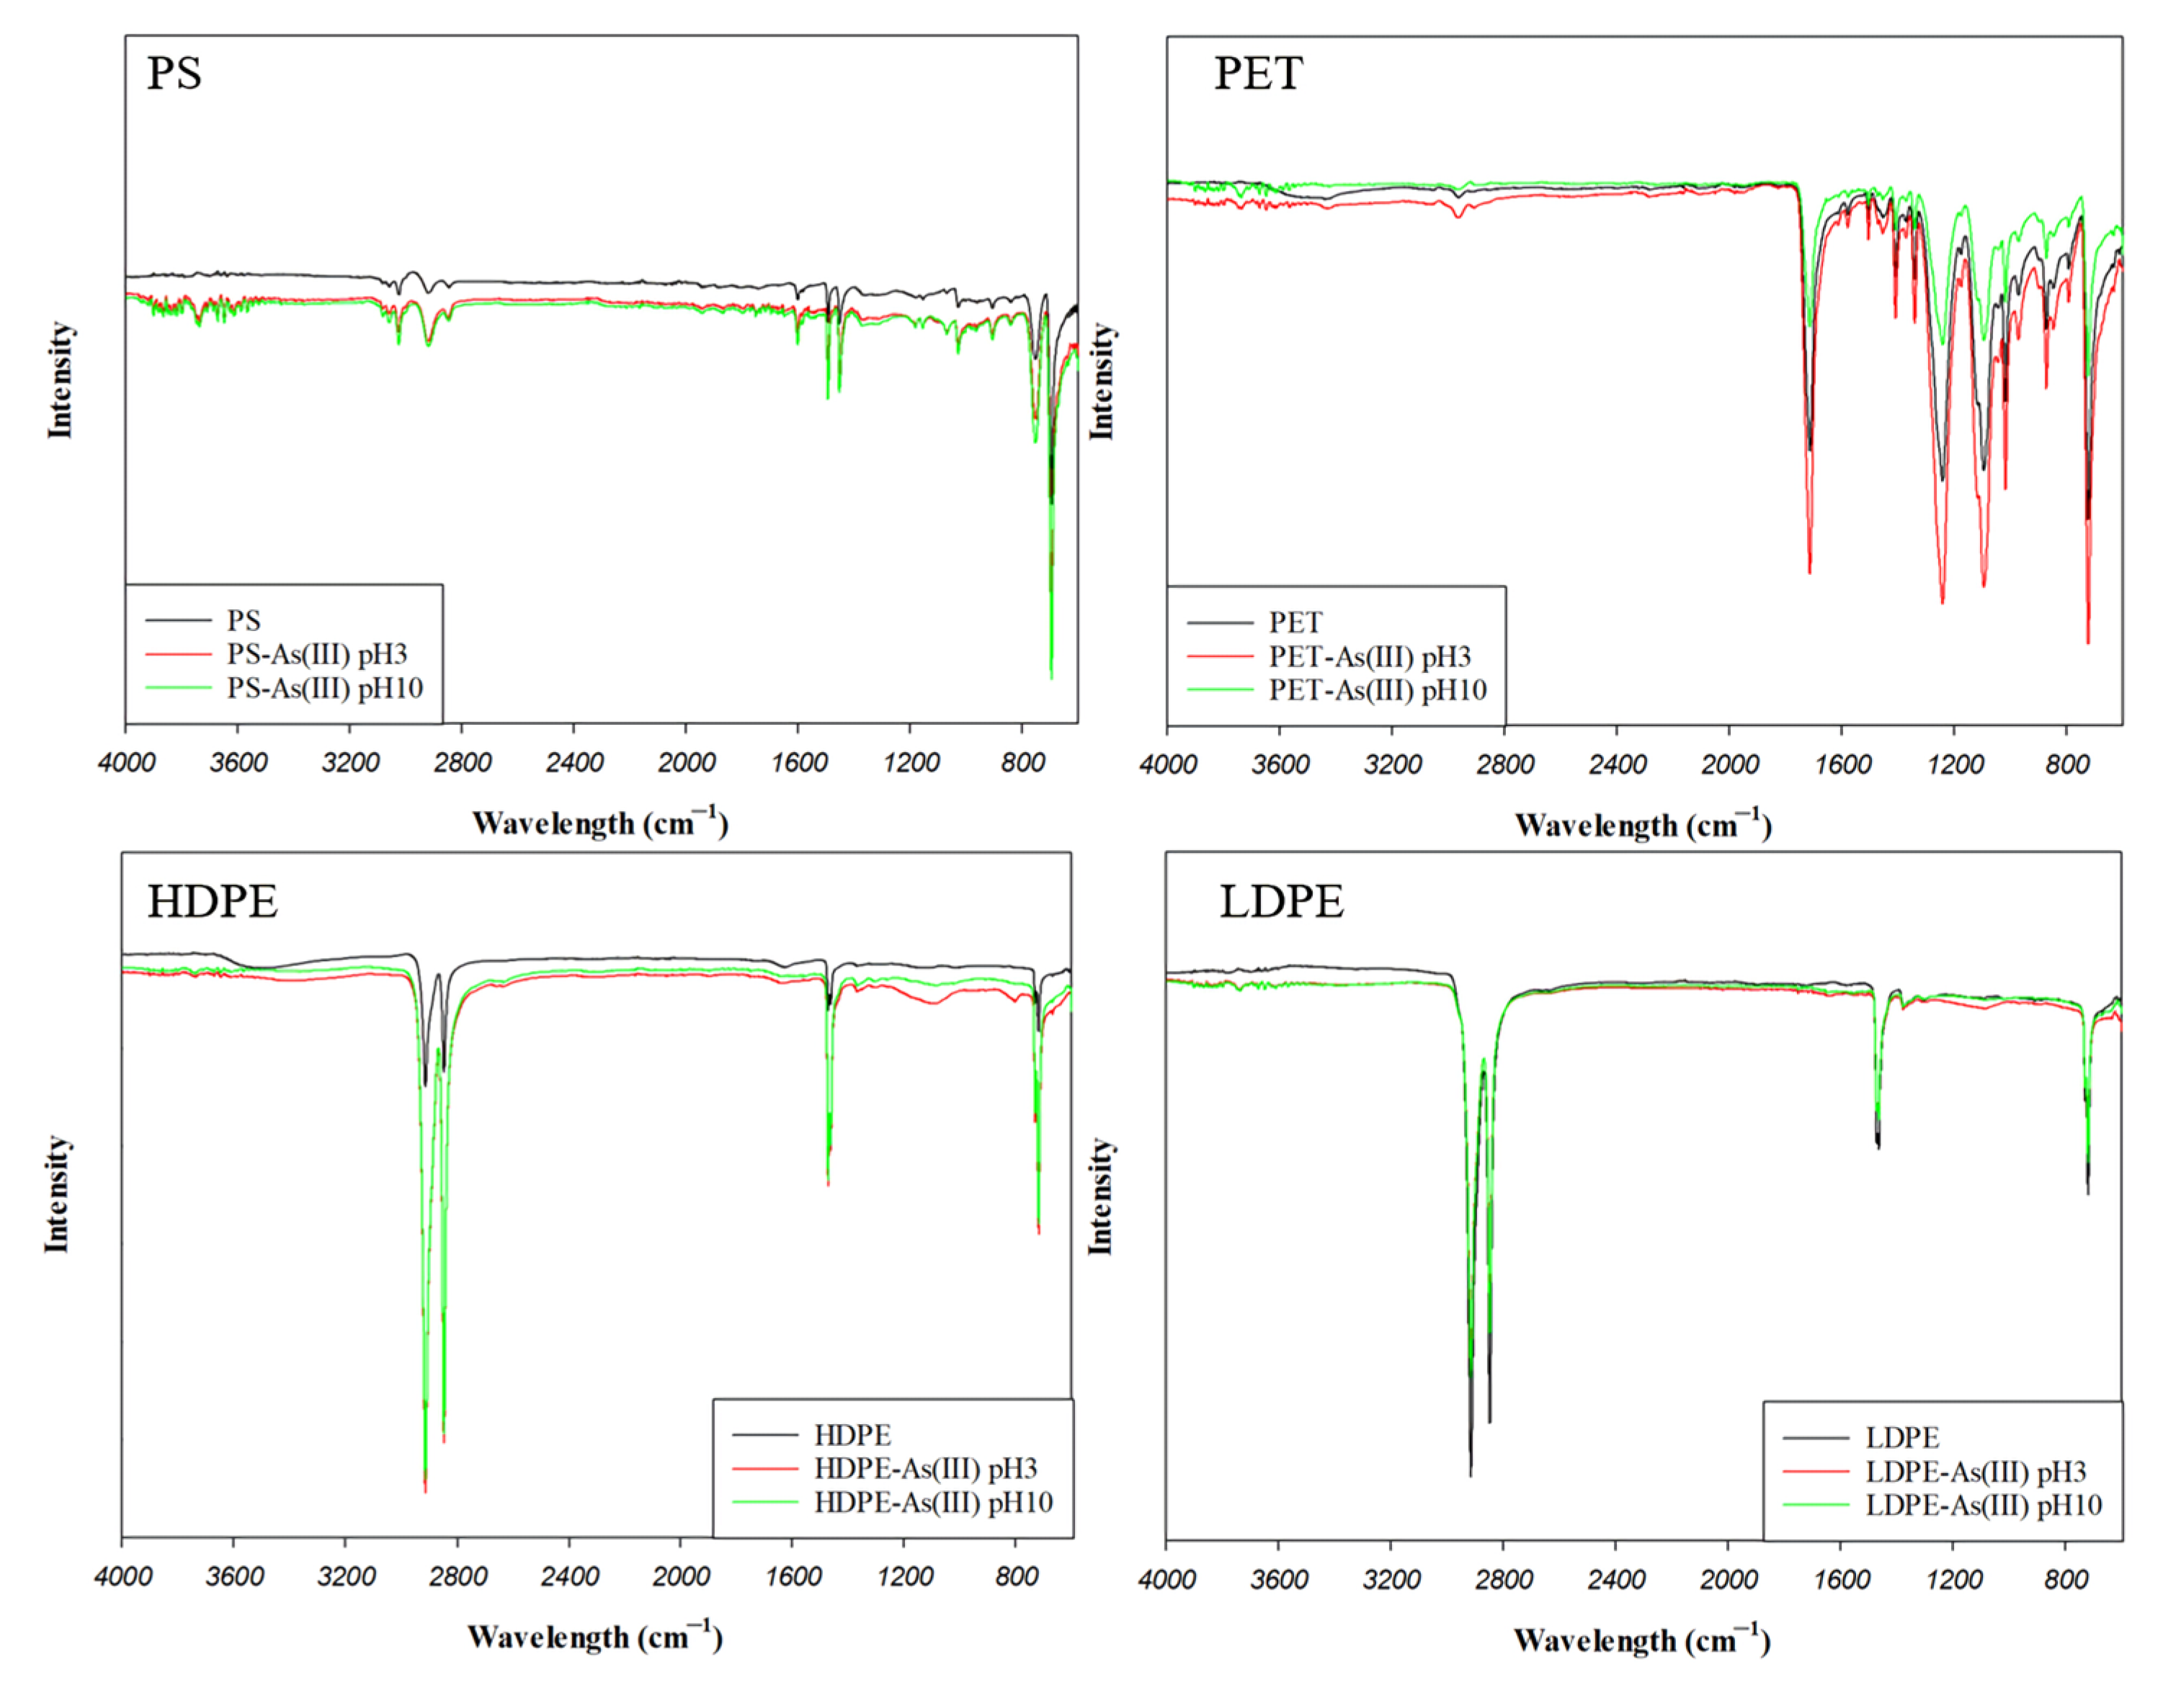
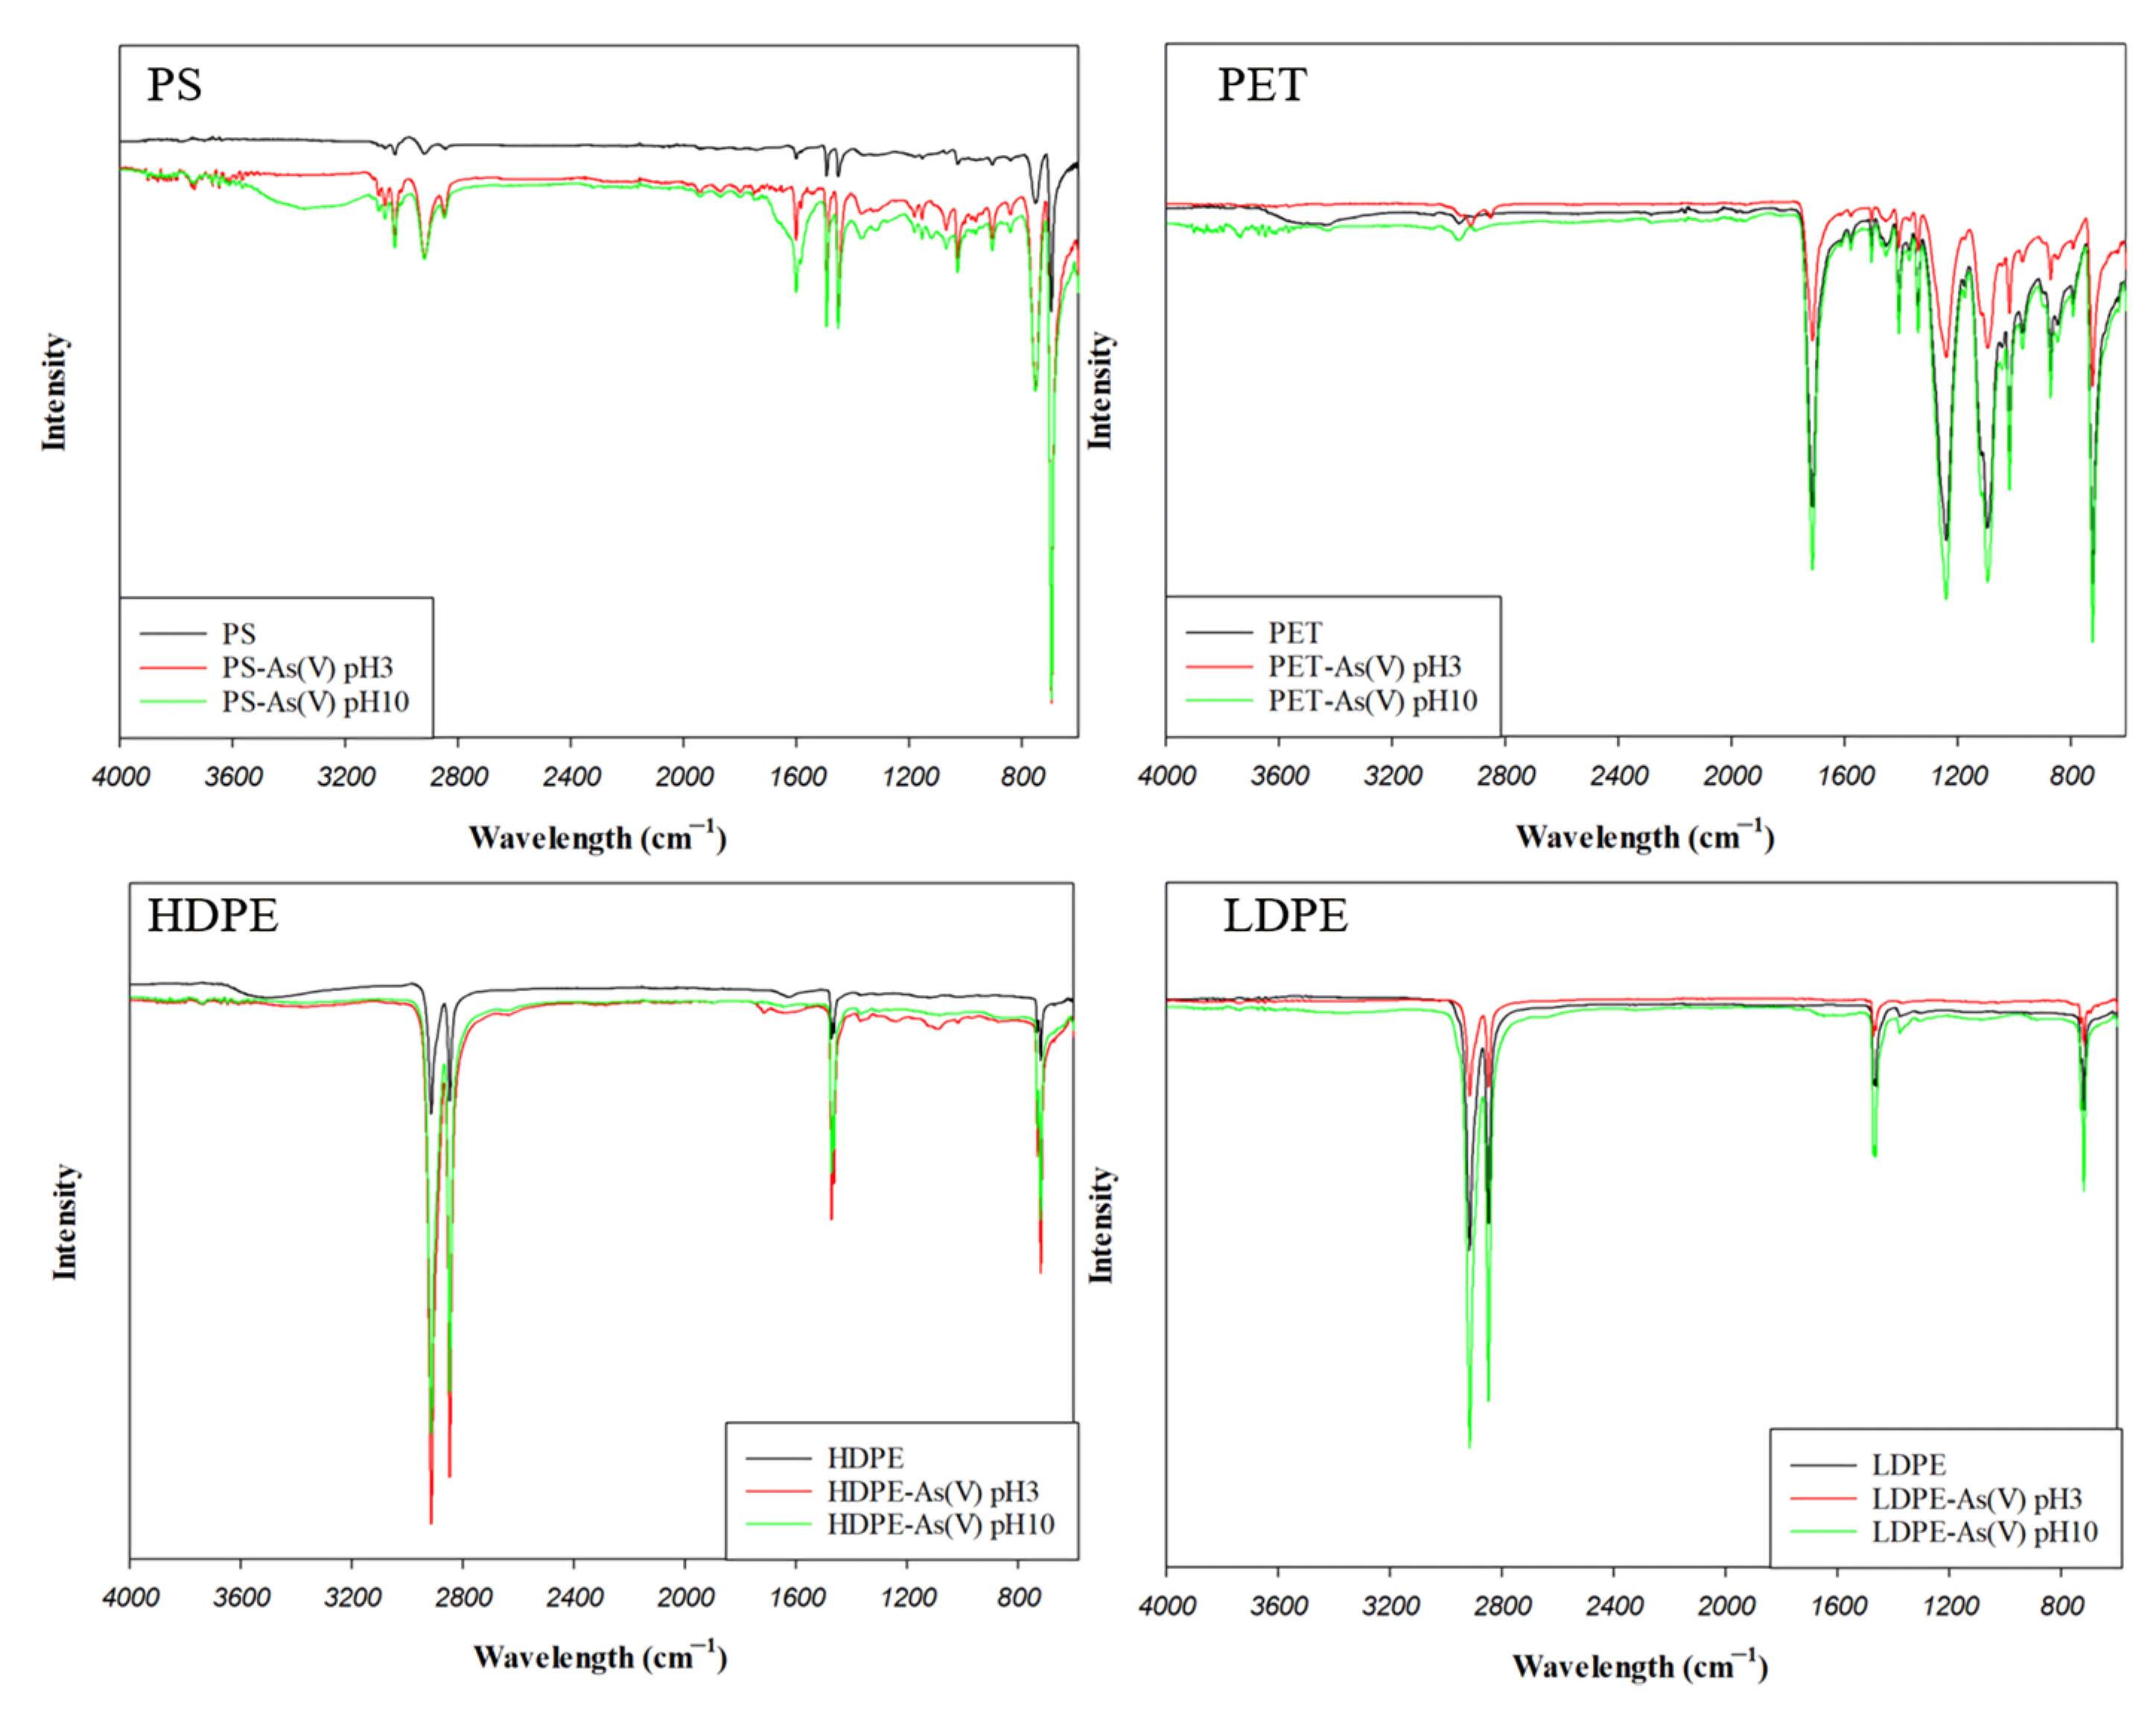
In particular, in the case of As(III), since it is an uncharged As(III) species (H3AsO3) at pH 3, adsorption by chemical bonding did not occur. It is also reported that adsorption by thiol groups is also possible [33]. However, thiol groups were not present in the MPs used in this study. In addition, the adsorption amount increased as the size of the MPs decreased. In the case of conditions under pH 10, the chemical species of As(III) is an anion (H2AsO3−). However, chemical bonding is not possible considering the pHpzc of all MPs used in the experiment was lower than pH10. For these reasons, it may be proved that the As(III) adsorption mechanism is governed by physical interaction on the MP surface. This was also confirmed through the FTIR analysis. Before adsorption, the MPs peaks at 3433, 2851–3080, 1710–1950, 1615, and 1440–1589 cm−1 represented the OH tensile vibration, CH stretching vibration, structural single-substitution, C=O structures, and aromatic ring skeleton vibration, respectively. In the FTIR images of each MP before and after As(III) adsorption, there was no change where functional groups were created or shifted (Figure 9). In general, when the pH < pHpzc, protons are adsorbed onto the adsorption layer, and the MP is positively charged (Figure 2). For this reason, the chemical species of As(V) is H2AsO4−. The physical interaction and chemical bonding with related functional groups, therefore, act as an adsorption mechanism at the same time at pH 3. At pH 10, when pH > pHpzc, protons are released from the –OH group and the MP is negatively charged. The main mechanism of As(V) at pH 10 may thus be suggested as physical adsorption on the MP surface.
Through the analysis of all the results of the experiments on heavy metal adsorption, the adsorption performance more consistent results were obtained as per the size and time of the MPs rather than the type of MPs. As a result, it was determined that the amount of heavy metal adsorption is determined by the state of the MPs such as the size, surface area, and surface roughness of the MPs rather than the type.
Table 1 and Table 2 show the results of a study on the adsorption of dyes and heavy metals to various MPs. Comparing the amount of adsorbed onto MPs in the literatures, the adsorption capacity of this study is relatively high. The particle size, pH are key factors affecting adsorption capacity. we adjusted the pH to observe the mechanism under better adsorption conditions. Because the adsorption amount changes due to MP and electrostatic repulsion according to the ion polarity of the pollutant. And smaller size MPs were used in the study compared to the literatures. The smaller size of MP improved the adsorption site and adsorption capacity [34]. Therefore, high adsorption capacity by particle size and pH was confirmed.
4. Conclusions
Adsorption of pollutants will imply higher concentrations of plastic particles, which can be ingested by marine biota leading to the additional potential for toxicity. A study was conducted on the possibility of chemical damage to MPs by evaluating the adsorption performance of (in)organic pollutants for various types of MPs (LDPE, HDPE, PS, and PET). As a result of the dye (BB9 and RR120) and heavy metal (Cd(II), Pb(II), As(III), and As(V)) adsorption experiments, the small size MPs demonstrated the highest adsorption amount regardless of the type of MPs, where the adsorption continued without reaching an adsorption equilibrium until completion of 30 days. In the case of dyes, the main adsorption mechanism was determined to be that of physical adsorption, while in the case of heavy metals, physical and chemical bonding occurred simultaneously, depending on the conditions. This study demonstrated that the adsorption of MP contaminants was affected more by the condition than by the type of MPs. Such efforts would aid in the identification of potential accumulated chemical contamination for each type of plastic and in the formulation of a manual that identifies environments where contact with plastics should be avoided.
Supplementary Materials
The following supporting information can be downloaded at: https://www.mdpi.com/article/10.3390/w14244086/s1, Table S1: Particle size distribution analyzer data of MPs used in this study.
Author Contributions
C.L.: Sample collection, the data analyses and wrote the manuscript, N.K.: the data analyses and wrote the manuscript, J.L.: sample collection and data analyses, Y.Y.: supervision, editing and review. All authors have read and agreed to the published version of the manuscript.
Funding
This research was funded by the Korea Environment Industry & Technology Institute (KEITI) through the Measurement and Risk Assessment Program for Management of Microplastics Program, funded by the Korea Ministry of Environment (MOE) (2020003110005). This research was funded by Basic Science Research Program through the National Research Foundation of Korea (NRF) funded by the Ministry of Education (No. 2021R1I1A1A01050092).
Institutional Review Board Statement
Not applicable.
Informed Consent Statement
Not applicable.
Data Availability Statement
The datasets used and analyzed during the current study are available from the corresponding author on reasonable request.
Conflicts of Interest
The authors declare no competing interests.
References
- Plastics Europe. Plastics—The Facts 2021. An Analysis of European Latest Plastics Production, Demand and Waste Data. 2021. Available online: https://plasticseurope.org/wp-content/uploads/2021/12/Plastics-the-Facts-2021-web-final.pdf (accessed on 11 December 2022).
- Borrelle, S.B.; Ringma, J.; Law, K.L.; Monnahan, C.C.; Lebreton, L.; McGivern, A.; Murphy, E.; Jambeck, J.; Leonard, G.H.; Hilleary, M.A.; et al. Predicted growth in plastic waste exceeds efforts to mitigate plastic pollution. Science 2020, 369, 1515–1518. [Google Scholar] [CrossRef] [PubMed]
- Allen, S.; Allen, D.; Phoenix, V.R.; Le Roux, G.; Durántez Jiménez, P.; Simonneau, A.; Binet, S.; Galop, D. Atmospheric transport and deposition of microplastics in a remote mountain catchment. Nat. Geosci. 2019, 12, 339–344. [Google Scholar] [CrossRef] [Green Version]
- El Hayany, B.; Rumpel, C.; Hafidi, M.; El Fels, L. Occurrence, analysis of microplastics in sewage sludge and their fate during composting: A literature review. J. Environ. Manag. 2022, 317, 115364. [Google Scholar] [CrossRef] [PubMed]
- Batista, D.; Pradhan, A.; Pascoal, C.; Cássio, F. Evidence of micro and macroplastic toxicity along a stream detrital food-chain. J. Hazard. Mater. 2022, 436, 129064. [Google Scholar] [CrossRef]
- Parsai, T.; Figueiredo, N.; Dalvi, V.; Martins, M.; Malik, A.; Kumar, A. Implication of microplastic toxicity on functioning of microalgae in aquatic system. Environ. Pollut. 2022, 308, 119626. [Google Scholar] [CrossRef]
- Erni-Cassola, G.; Zadjelovic, V.; Gibson, M.I.; Christie-Oleza, J.A. Distribution of plastic polymer types in the marine environment; A meta-analysis. J. Hazard. Mater. 2019, 369, 691–698. [Google Scholar] [CrossRef]
- Prata, J.C.; da Costa, J.P.; Lopes, I.; Duarte, A.C.; Rocha-Santos, T. Environmental exposure to microplastics: An overview on possible human health effects. Sci. Total. Environ. 2020, 702, 134455. [Google Scholar] [CrossRef]
- Bakir, A.; Rowland, S.J.; Thompson, R.C. Enhanced desorption of persistent organic pollutants from microplastics under simulated physiological conditions. Environ. Pollut. 2014, 185, 16–23. [Google Scholar] [CrossRef]
- Brennecke, D.; Duarte, B.; Paiva, F.; Caçador, I.; Canning-Clode, J. Microplastics as vector for heavy metal contamination from the marine environment. Estuar. Coast. Shelf Sci. 2016, 178, 189–195. [Google Scholar] [CrossRef]
- Liu, G.; Zhu, Z.; Yang, Y.; Sun, Y.; Yu, F.; Ma, J. Sorption behavior and mechanism of hydrophilic organic chemicals to virgin and aged microplastics in freshwater and seawater. Environ. Pollut. 2019, 246, 26–33. [Google Scholar] [CrossRef]
- Enfrin, M.; Dumée, L.F.; Lee, J. Nano/microplastics in water and wastewater treatment processes—Origin, impact and potential solutions. Water Res. 2019, 161, 621–638. [Google Scholar] [CrossRef] [PubMed]
- Cai, L.; Wang, J.; Peng, J.; Wu, Z.; Tan, X. Observation of the degradation of three types of plastic pellets exposed to UV irradiation in three different environments. Sci. Total. Environ. 2018, 628–629, 740–747. [Google Scholar] [CrossRef] [PubMed]
- Godoy, V.; Blázquez, G.; Calero, M.; Quesada, L.; Martín-Lara, M.A. The potential of microplastics as carriers of metals. Environ. Pollut. 2019, 255, 113363. [Google Scholar] [CrossRef] [PubMed]
- Salleh, M.A.M.; Mahmoud, D.K.; Karim, W.A.W.A.; Idris, A. Cationic and anionic dye adsorption by agricultural solid wastes: A comprehensive review. Desalination 2011, 280, 1–13. [Google Scholar] [CrossRef]
- Yagub, M.T.; Sen, T.K.; Afroze, S.; Ang, H.M. Dye and its removal from aqueous solution by adsorption: A review. Adv. Colloid Interface Sci. 2014, 209, 172–184. [Google Scholar] [CrossRef]
- Yaseen, D.A.; Scholz, M. Textile dye wastewater characteristics and constituents of synthetic effluents: A critical review. Int. J. Environ. Sci. Technol. 2019, 16, 1193–1226. [Google Scholar] [CrossRef] [Green Version]
- Du, H.; Ma, H.; Xing, B. Identification of naturally weathering microplastics and their interactions with ion dyes in aquatic environments. Mar. Pollut. Bull. 2022, 174, 113186. [Google Scholar] [CrossRef]
- You, H.; Huang, B.; Cao, C.; Liu, X.; Sun, X.; Xiao, L.; Qiu, J.; Luo, Y.; Qian, Q.; Chen, Q. Adsorption–desorption behavior of methylene blue onto aged polyethylene microplastics in aqueous environments. Mar. Pollut. Bull. 2021, 167, 112287. [Google Scholar] [CrossRef]
- Lin, L.; Tang, S.; Wang, X.; Sun, X.; Yu, A. Hexabromocyclododecane alters malachite green and lead(II) adsorption behaviors onto polystyrene microplastics: Interaction mechanism and competitive effect. Chemosphere 2021, 265, 129079. [Google Scholar] [CrossRef]
- Lin, L.; Tang, S.; Wang, X.; Sun, X.; Yu, A. Adsorption of malachite green from aqueous solution by nylon microplastics: Reaction mechanism and the optimum conditions by response surface methodology. Process Saf. Environ. Prot. 2020, 140, 339–347. [Google Scholar] [CrossRef]
- Du, H.; Zhang, Y.; Jiang, H.; Wang, H. Adsorption of rhodamine B on polyvinyl chloride, polystyrene, and polyethylene terephthalate microplastics in aqueous environments. Environ. Technol. Innov. 2022, 27, 102495. [Google Scholar] [CrossRef]
- Agboola Omowumi, D.; Benson Nsikak, U. Physisorption and Chemisorption Mechanisms Influencing Micro (Nano) Plastics-Organic Chemical Contaminants Interactions: A Review. Front. Environ. Sci 2021, 9, 678574. [Google Scholar] [CrossRef]
- Fahrenfeld, N.; Arbuckle-Keil, G.; Beni, N.N.; Bartelt-Hunt, S.L. Source tracking microplastics in the freshwater environment. TrAC Trends Anal. Chem. 2019, 112, 248–254. [Google Scholar] [CrossRef]
- Jiang, Y.; Qin, Z.; Fei, J.; Ding, D.; Sun, H.; Wang, J.; Yin, X. Surfactant-induced adsorption of Pb(II) on the cracked structure of microplastics. J. Colloid Interface Sci. 2022, 621, 91–100. [Google Scholar] [CrossRef] [PubMed]
- Liu, S.; Huang, J.; Zhang, W.; Shi, L.; Yi, K.; Zhang, C.; Pang, H.; Li, J.; Li, S. Investigation of the adsorption behavior of Pb(II) onto natural-aged microplastics as affected by salt ions. J. Hazard. Mater. 2022, 431, 128643. [Google Scholar] [CrossRef]
- Zhou, J.; Liu, X.; Jiang, H.; Li, X.; Li, W.; Cao, Y. Antidote or Trojan horse for submerged macrophytes: Role of microplastics in copper toxicity in aquatic environments. Water Res. 2022, 216, 118354. [Google Scholar] [CrossRef]
- Chen, C.; Wei, F.; Ye, L.; Wang, Y.; Long, L.; Xu, C.; Xiao, Y.; Wu, J.; Xu, M.; He, J.; et al. Adsorption of Cu2+ by UV aged polystyrene in aqueous solution. Ecotoxicol. Environ. Saf. 2022, 232, 113292. [Google Scholar] [CrossRef]
- Wang, X.; Zhang, R.; Li, Z.; Yan, B. Adsorption properties and influencing factors of Cu(II) on polystyrene and polyethylene terephthalate microplastics in seawater. Sci. Total. Environ. 2021, 812, 152573. [Google Scholar] [CrossRef]
- Guo, X.; Chen, C.; Wang, J. Sorption of sulfamethoxazole onto six types of microplastics. Chemosphere 2019, 228, 300–308. [Google Scholar] [CrossRef]
- Wang, F.; Yang, W.; Cheng, P.; Zhang, S.; Zhang, S.; Jiao, W.; Sun, Y. Adsorption characteristics of cadmium onto microplastics from aqueous solutions. Chemosphere 2019, 235, 1073–1080. [Google Scholar] [CrossRef]
- Syafiuddin, A.; Boopathy, R.; Hadibarata, T. Challenges and Solutions for Sustainable Groundwater Usage: Pollution Control and Integrated Management. Curr. Pollut. Rep. 2020, 6, 310–327. [Google Scholar] [CrossRef]
- Catrouillet, C.; Davranche, M.; Dia, A.; Bouhnik-Le Coz, M.; Pédrot, M.; Marsac, R.; Gruau, G. Thiol groups controls on arsenite binding by organic matter: New experimental and modeling evidence. J. Colloid Interface Sci. 2015, 460, 310–320. [Google Scholar] [CrossRef] [PubMed] [Green Version]
- Fu, L.; Li, J.; Wang, G.; Luan, Y. Adsorption behavior of organic pollutants on microplastics. Ecotoxicol. Environ. Saf. 2021, 217, 112207. [Google Scholar] [CrossRef] [PubMed]
Figure 1.
Size distribution of MPs (Numbers on the straight line for each peak indicate mean size).

Figure 2.
Characterization of MPs. (a) SEM image of PS, PET, HDPE and LDPE. (b) Zeta potential of PS, PET, HDPE and LDPE. (c) FTIR spectra of PS, PET, HDPE and LDPE.
Figure 2.
Characterization of MPs. (a) SEM image of PS, PET, HDPE and LDPE. (b) Zeta potential of PS, PET, HDPE and LDPE. (c) FTIR spectra of PS, PET, HDPE and LDPE.


Figure 3.
Effects of size on the adsorption of organic contaminants ((a) RR120 and (b) BB9) by types of MPs.
Figure 3.
Effects of size on the adsorption of organic contaminants ((a) RR120 and (b) BB9) by types of MPs.

Figure 4.
FTIR spectra of MPs before and after RR120 and BB9 adsorption.

Figure 5.
Effects of size on the adsorption of cationic heavy metals ((a) Cd(II) and (b) Pb(II)) by types of MPs.
Figure 5.
Effects of size on the adsorption of cationic heavy metals ((a) Cd(II) and (b) Pb(II)) by types of MPs.


Figure 6.
FTIR spectra of MPs before and after Cd(II) and Pb(II) adsorption.

Figure 7.
Effects of size on the adsorption of arsenic ((a) As(III) and (b) As(V)) by types of MPs at pH 3.
Figure 7.
Effects of size on the adsorption of arsenic ((a) As(III) and (b) As(V)) by types of MPs at pH 3.

Figure 8.
Effects of size on the adsorption of arsenic ((a) As(III) and (b) As(V)) by types of MPs at pH 10.
Figure 8.
Effects of size on the adsorption of arsenic ((a) As(III) and (b) As(V)) by types of MPs at pH 10.

Figure 9.
FTIR spectra of MPs before and after As(III) and As(V) adsorption.


Table 1.
Study of dye adsorbed on several plastics in lab conditions.
| Plastic Type | Size | Contaminants | Uptake (mg/g) | Reference |
|---|---|---|---|---|
| PE, PP | - | Crystal violet | PE: 0.58 PP: 2.38 | [18] |
| PE | 75–150 μm | Methylene blue | 9.36 | [19] |
| PS | - | Malachite green | 0.164 × 10⁻⁶ | [20] |
| Nylon | 1000 μm | Malachite green | aged nylon: 33.94 virgin nylon: 2.67 | [21] |
| PS, PVC, PET | 43–74 μm 74–125 μm 125–425 μm 425–1000 μm | Rhodamine B | PS: 2.5 PVC: 4.6 PET: 1.8 | [22] |
Table 2.
Study of heavy metals adsorbed on several plastics in lab conditions.
| Plastic Type | Size | Contaminants | Uptake (mg/g) | Reference |
|---|---|---|---|---|
| PE, PP | 1000 μm | Pb | PE: 1.0 PP: 1.5 | [25] |
| PE | 600–840 μm | Pb | Virgin: 1.87 Aging: 10.3 | [26] |
| PE | 50–200 μm, 2–10 μm | Cu | 1.8 × 10⁻⁶ 3.5 × 10⁻⁶ | [27] |
| PS | 70–250 μm | Cu | 0.3 | [28] |
| PS, PET | 25 μm, 180 μm | Cu | PS_25: 0.137 PS_180: 0.126 PET_25: 0.134 PET_180: 0.120 | [29] |
Publisher’s Note: MDPI stays neutral with regard to jurisdictional claims in published maps and institutional affiliations. |
© 2022 by the authors. Licensee MDPI, Basel, Switzerland. This article is an open access article distributed under the terms and conditions of the Creative Commons Attribution (CC BY) license (https://creativecommons.org/licenses/by/4.0/).
Share and Cite
MDPI and ACS Style
Lim, C.; Kim, N.; Lee, J.; Yoon, Y. Potential of Adsorption of Diverse Environmental Contaminants onto Microplastics. Water 2022, 14, 4086. https://doi.org/10.3390/w14244086
AMA Style
Lim C, Kim N, Lee J, Yoon Y. Potential of Adsorption of Diverse Environmental Contaminants onto Microplastics. Water. 2022; 14(24):4086. https://doi.org/10.3390/w14244086
Chicago/Turabian StyleLim, Chaehwi, Namgyu Kim, Junho Lee, and Yeojoon Yoon. 2022. "Potential of Adsorption of Diverse Environmental Contaminants onto Microplastics" Water 14, no. 24: 4086. https://doi.org/10.3390/w14244086
Note that from the first issue of 2016, this journal uses article numbers instead of page numbers. See further details here.