
Chemometric Approach to Pesticide Residue Analysis in Surface Water
by
 , , , , , and
Ljiljana Ćurčić
1,
Biljana Lončar
2,* ,
,
Lato Pezo
3,
Nataša Stojić
1,
Dunja Prokić
1,
Vladimir Filipović
2 and
and
Mira Pucarević
1 1
Faculty of Environmental Protection, Educons University, Vojvode Putnika 85-87, 21208 Sremska Kamenica, Serbia
2
Faculty of Technology Novi Sad, University of Novi Sad, Bul. Cara Lazara 1, 21000 Novi Sad, Serbia
3
Institute of General and Physical Chemistry, University of Belgrade, Studentski trg 12, 11000 Belgrade, Serbia
*
Author to whom correspondence should be addressed.
Water 2022, 14(24), 4089; https://doi.org/10.3390/w14244089
Submission received: 25 November 2022
/
Revised: 8 December 2022
/
Accepted: 12 December 2022
/
Published: 14 December 2022
(This article belongs to the Section Water Quality and Contamination)
Abstract
:Dimethachlor is an herbicide used for oilseed rape protection. Previous studies have demonstrated its high mobility in the soil, which could lead to water contamination. This research aimed to determine the occurrence of dimethachlor and its metabolites (dimethachlor ethanesulfonic acid ESA and dimethachlor oxalamic acid OA) in surface water using a recently developed analytical method. This article is one of the first to document dimethachlor and its metabolites’ presence in surface water samples. The samples were collected from the Danube river and Tisza river. The quantitative determination of dimethachlor and its metabolites in the obtained extracts was done by high-performance liquid chromatography. Descriptive statistical methods, including correlation analysis, cluster analysis, and principal component analyses, were utilized to analyze method validation experimental results. In addition, the artificial neural network (ANN) model was applied as an optimization tool. The developed ANN model adequately predicted observed variables, suggesting the optimum results were obtained at a pH value 7, spike value 1, and injection volume equal to 0.5 μL. The average concentrations in Danube River samples were 1.51 µg/L for OA 0.01 µg/L for ESA, and 0.63 µg/L for DMC, while the average concentrations of chloroacetanilide herbicides detected in Tisza River samples were 1.43 µg/L for OA, 0.08 µg/L for ESA and 1.82 µg/L for DMC.
1. Introduction
The available resources reduce as a consequence of the intense energy consumption, and the significant issues caused by global climate change substantially impact the environment and pose a hazard to human health and safety; therefore, proper sustainable energy development management to strengthen the usage of renewable energy sources is needed [1,2,3,4].
Biomass may recreate an essential role in achieving these goals (especially as biogas, bioethanol, and biodiesel) since it is an alternative, renewable, and ecologically benign energy source and can replace energy and heat production from burning fossil fuels [5,6,7]. The latest branch of agriculture, named energy agriculture, is dynamically developing with the scope of using agricultural products for biofuel production [8]. Diverse consumable oils, including sunflower, palm, and soybean oil, delivered about 95 % of biodiesel globally, while oilseed rape is mostly used (82.8%) for biodiesel production in Europe, due to cool, temperate conditions [9]. The European Union’s most significant producers of pure biodiesel are Germany, France, Spain, and Italy. One hectare of oilseed rape provides sufficient grain to deliver 1090 biodiesel fuel liters [10]. To produce a desirable amount of oilseed rape, adequate treatment is required, including applying herbicides and pesticides to improve crop yields; however, the expansion in their application is highly correlated to adverse impacts on the environment and, as a consequence, on human health [11,12].
In the Danube and Tisza Basin countries, agricultural fields are treated with chloroacetanilide herbicide dimethachlor, leading to soil and water contamination due to agricultural runoff [13,14]. Herbicide dimethachlor is widely used in oilseed rape protection, with approximately 1.5 kg per hectare once every three years [15,16]. Dimethachlor belongs in is a group of medium-toxic pesticides with an average lethal dose (LD50) of 1.600 mg/kg; it is also very harmful to algae and fish, causing long-term adverse effects in the aquatic environment [17,18]. In the Republic of Serbia and its bordering countries, plant protection products containing dimethachlor are utilized [19]. Because of its high solubility in water and low adsorption coefficient in soil, as it is shown in the survey conducted within the project “Mobility of herbicides in Vojvodina soils”, it would be easily leaked to the surface water and groundwater, which could be harmful to humans and to the environment [20].
Chloroacetanilide herbicides have been shown to degrade more rapidly in soil than other herbicides, with half-lives from 15 to 30 days [21]. Considerable studies [22,23,24,25] have reported the occurrence of chloroacetanilide metabolites in surface and groundwater, often in similar or even higher concentrations than the parent compounds. Additionally, chloroacetanilide herbicide degradates may be more stable than the parent compounds, and may be present in the water and soil for a longer period of time [26]. Ethane sulfonic acid (ESA) and oxalic acid (OA) derivatives of dimethachlor have been frequently detected as the major transformation products of dimethachlor in surface and groundwater at the same or even higher levels than their parent compound [24]. However, despite the widespread use of dimethachlor, very little information is available about its concentrations in surface water.
The objective of this study, therefore, was to determine dimethachlor residues (DMC) and its metabolites: dimethachlor oxalamic acid (OA), dimethachlor ethane sulfonic acid (ESA) in river water samples using a recently developed analytical method. The method was optimized using a full factorial experimental plan (27 samples, with three parameters: pH, spike, and injection volume and three levels). Descriptive statistical methods such as: correlation analysis, cluster analysis, and principal component analysis were utilized to analyze method validation experimental results. The artificial neural network (ANN) model was applied as an optimization tool, while the sensitivity analysis was used to examine the relative influence of the pH, spike, and injection volume on DMC, OA, and ESA content. Furthermore, statistical methods were utilized to discriminate twenty water samples, ten from the Tisza and ten from the Danube rivers. The geographical distributions of OA, ESA, and DMC concentrations obtained from sampling sites were used to evaluate the concentration of observed pesticides throughout the river’s stream using a partial differential equation.
2. Materials and Methods
2.1. Standards
Analytical standard dimethachlor (99.4% purity) was purchased from Syngenta, Germany. Analytical standards dimethachlor oxalic acid (99% purity, Cat.No CA12670400) and dimethachlor ethanesulfonic acid (99% purity, Cat.No CA12670200) were purchased from Dr. Ehrenstorfer (Augsburg, Germany). Ammonium acetate (p.a. > 97%) and formic acid (p.a. ≥ 98%, Cat.No 64197) were purchased from Centrohem, Serbia. Acetonitrile (HPLC grade, Cat.No 34851) and methanol (pure p.a., Cat.No 34966) were purchased from Sigma-Aldrich, Germany.
HLB Solid phase columns-Oasis HLB Cartridge (3 cc, 60 mg) Cat No WAT094226 were purchased from Waters Corporation, and Solid Phase Columns-Supelclean™ EN-VI-Carb™ SPE Tube Cat No 57088 (bed wt. 250 mg, volume 3 mL) were purchased from Supelco (Bellefonte, PA, USA).
2.2. Sampling
Ten sampling sites were selected in the Tisza River, and ten sampling sites were also selected in the Danube River. Locations of sampling sites in Tisza River were: Novi Bečej, Bečej, Bačko Petrovo Selo, Mol, Ada, Senta, Sanad, Novi Kneževac, Kanjiža, and Martonoš, and in Danube River were: Sremska Kamenica, Novi Sad, Futog, Begeč, Čelarevo, Bačka Palanka, Bačko Novo Selo, Bogojevo, Apatin, and Bezdan. Samples were taken from the Danube River and Tisza River, while both rivers pass through agricultural areas where dimethachlor is used for plant protection.
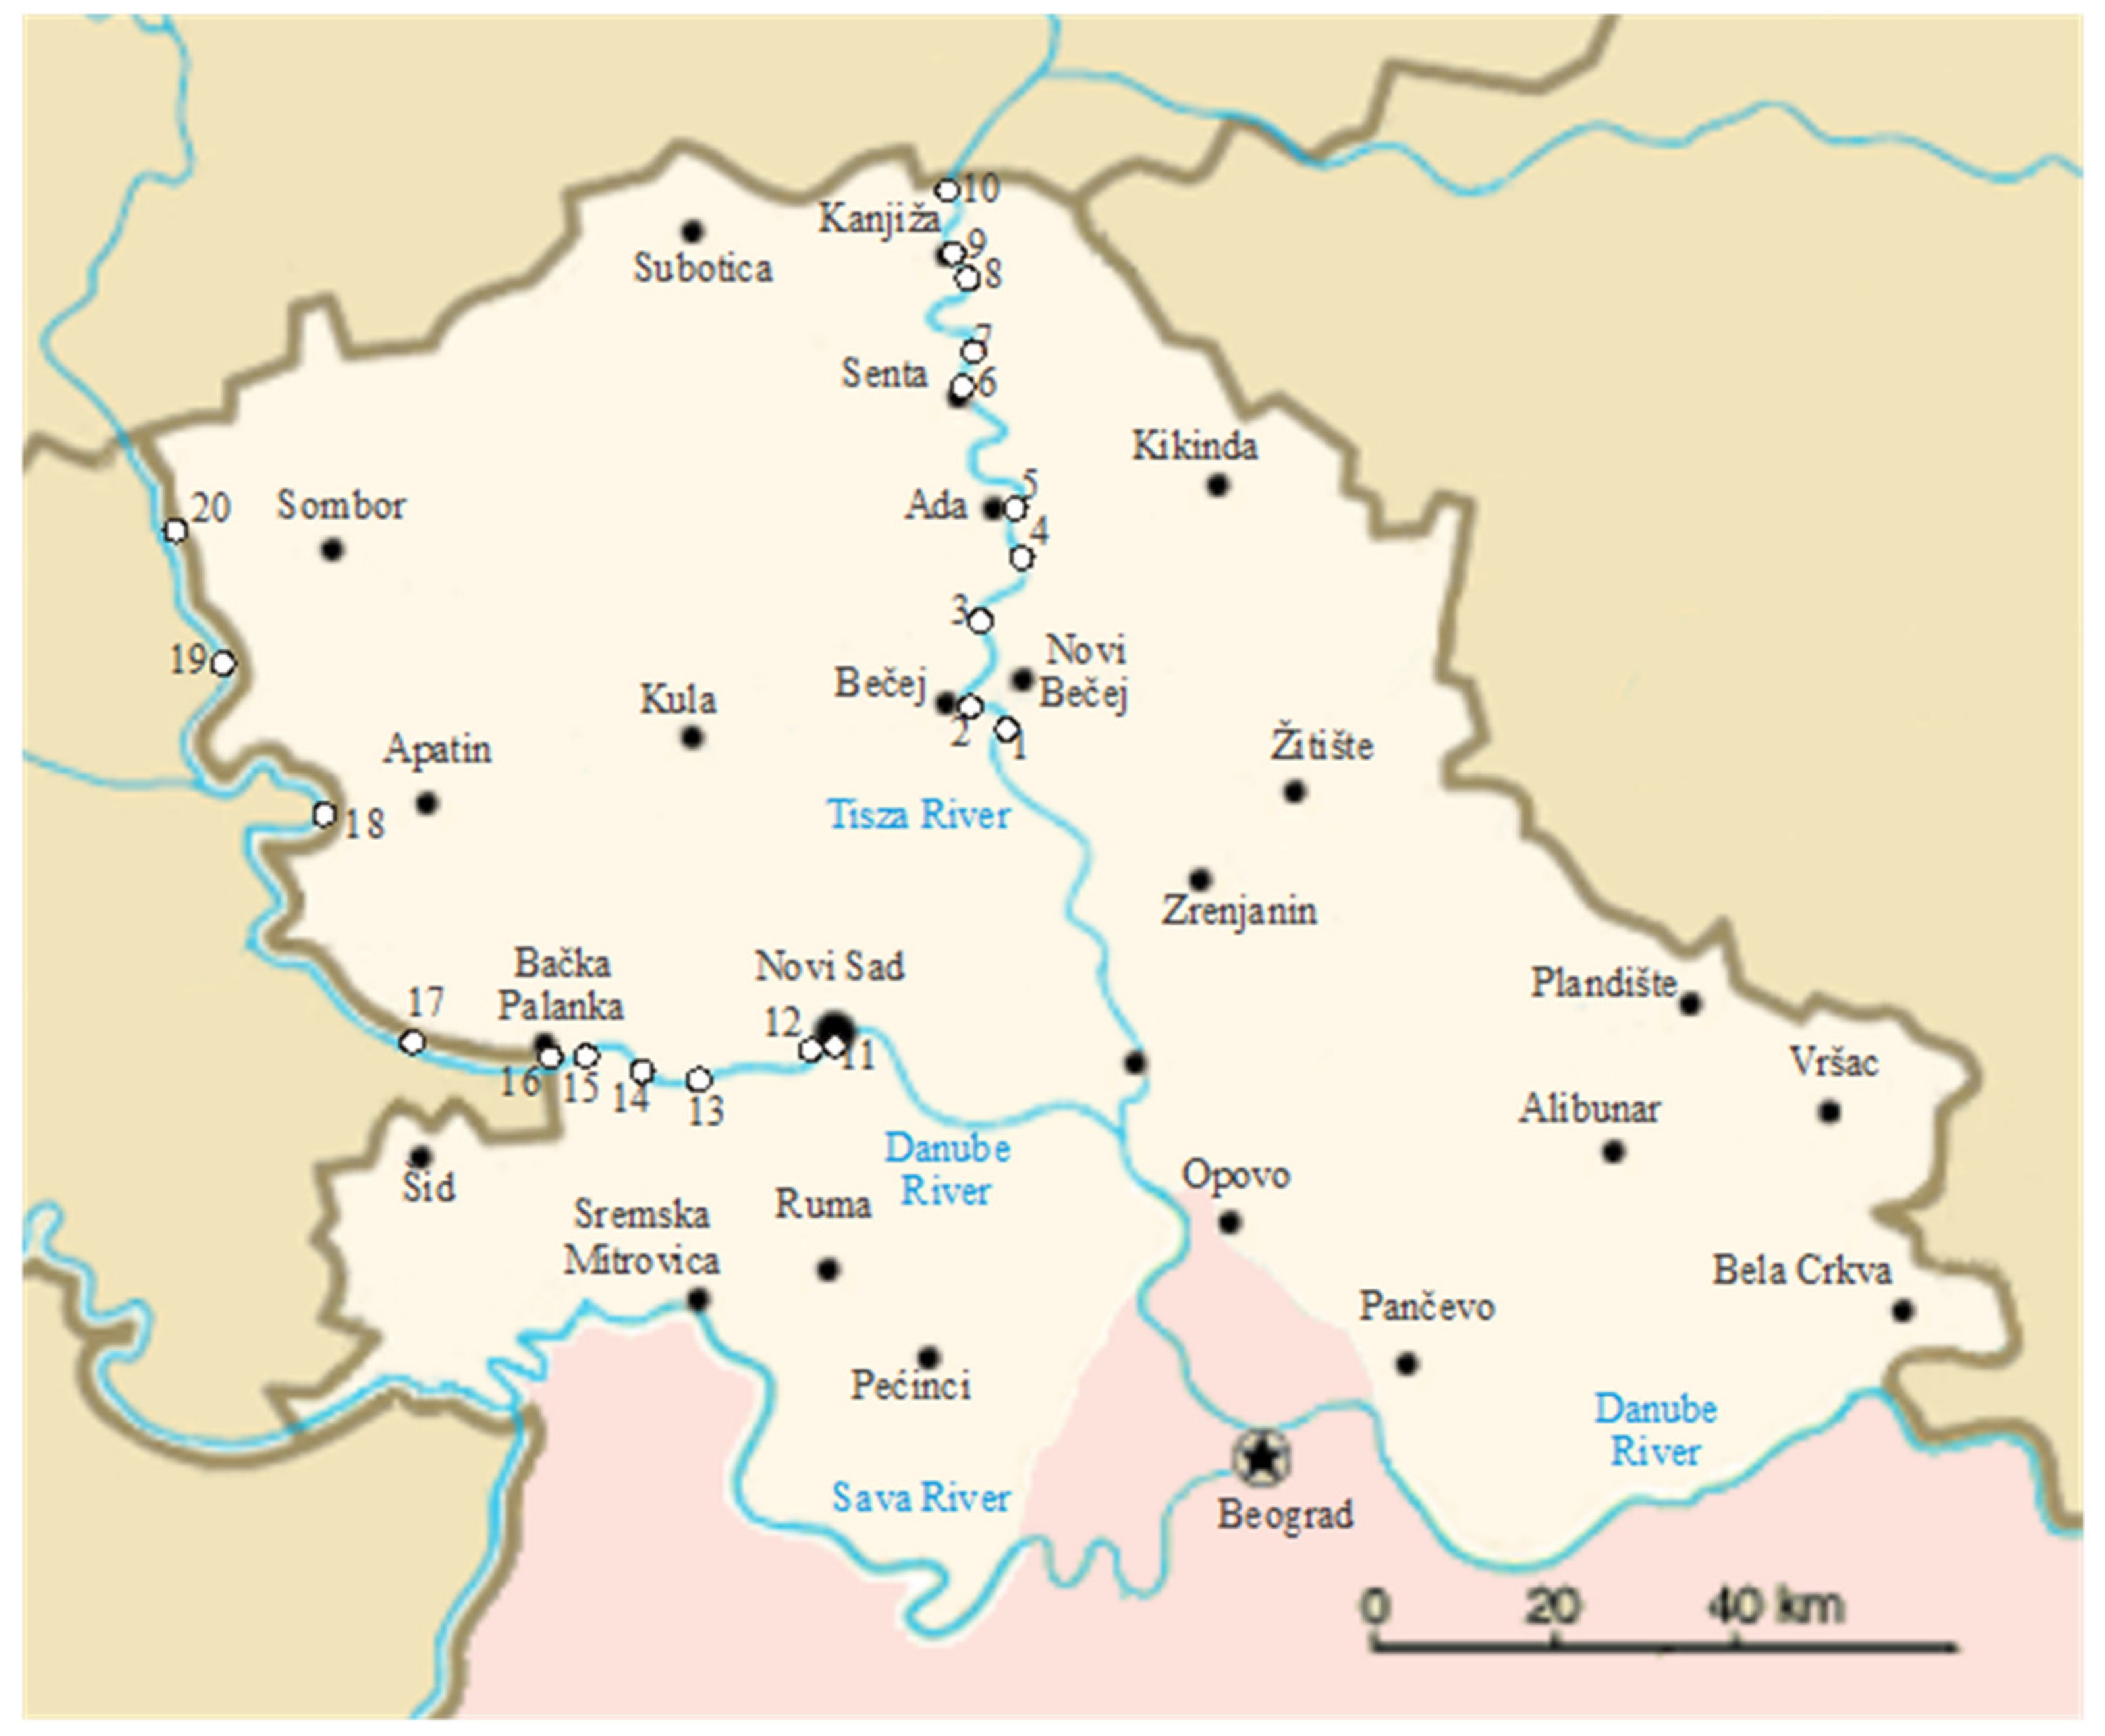
The volumes of 250 mL water were collected in glass bottles from each sampling site with three replications. After filling with water, the bottles were sealed with PTFE-lined screw caps. During method development, 25 to 30 mg of ammonium chloride was added to each 250-mL sample bottle. All samples were stored at 6 °C prior to analysis. Figure 1 and Table 1 show the sampling sites’ locations and GPS coordinates.
2.3. Analytical Techniques
The analytical procedure for DMC, OA, and ESA uses solid phase extraction combining OASIS HLB and EnviCarb SPE columns and the analysis is complete with high-performance liquid chromatography-diode array detection. The collected samples from rivers were prefiltered on filters to eliminate particulate matter and acidified with sulfuric acid to pH 2.
Prior to the extraction, columns had been conditioned with 20 mL of 10 mM ammonium acetate/methanol under vacuum, followed by rinsing with 30 mL of deionized water. The sample was mixed well and allowed to percolate through columns at a flow rate of 10 mL/min under a vacuum.
After the samples were passed through the columns, they were rinsed with 5 mL of deionized water and then dried with air for 3 min.
The analytes were eluted from the columns with 10 mL of 10 mM ammonium acetate/methanol at a low vacuum (5 mL/min). The extracts were evaporated to dryness under a gentle stream of nitrogen in a heated water bath (60–70 °C) to remove all the ammonium acetate/methanol. The mobile phase (mixture of acetonitrile/water + 1 mL of methane acid in the ratio of 70/30 vol %) was added to the collection vial to bring the volume to 1 mL. After that, extracts were transferred to an autosampler vial [27].
2.4. High-Performance Liquid Chromatographic Conditions
Analysis of the final fraction was accomplished using Agilent HPLC 1220 Infinity LC with an autosampler, a vacuum degasser, a dual gradient pump, and a diode array detector (DAD). Separation was carried out isothermally at room temperature of 25 °C in Aqua C18 125A column (250 × 2.0 mm internal diameter, 5 µm particle size) from Phenomenex (Cat.No 00G-4299-B0). The mobile phase was the mixture of acetonitrile/water + 1 mL of formic acid in the ratio of 70/30 vol %. The flow rate was 0.3 mL/min, and the average system pressure was 600 bar. The chromatographic conditions were as follows: the injection volume was 20 μL, the detection was performed at 200 nm and the time of analysis was 7 min. The average retention times were: 4.159 min for DMC, 3.565 min for ESA and 3.011 min for OA. The limit of detection (LOD) is based on three times the standard deviation of the baseline noise.
2.5. Statistical Analysis
The experimental data were statistically analyzed with the multi-variable mathematical methods: descriptive statistics (descriptive statistics), principal component analysis (principal components analysis—PCA), cluster analysis, Artificial Neural Network modeling-ANN, and global sensitivity analysis by applying StatSoft Statistica 10.0® software. The color plot diagram was designed with R software v.4.0.3 (64-bit version) with the “circle” method, upper type.
2.5.1. ANN Modeling
The ANN model with a high potential for nonlinear function estimation was designed using a multi-layer perceptron model (MLP), with input, hidden, and output layers [28]. Prior to the ANN model building, input and output data need to be normalized to improve the result of the ANN [29]. Throughout the ANN building, input data are frequently inserted in the network [30,31]. The training process of the network was performed as previously described by Vojnov et al. [32].
In the designed ANN model, the weight coefficients and biases connected to the hidden and output layers are displayed in the form of matrices and vectors W1 and B1, and W2 and B2, each. The following formula reveals the neural network model:
where Y is the outputs matrix, f1 and f2 are the hidden and output layers transfer functions, accordingly, and X is the matrix of inputs [33].
The weight coefficients W1 and W2 were calculated throughout the learning cycle, while continuously introducing the elements, using an optimization method to minimize the deviation between the data and the model [34,35]. The ANN model was developed to foresee and optimize the parameters: DMC, ESA, and OA content, according to: pH, spike, and injection volume.
2.5.2. Global Sensitivity Analysis
Yoon’s global sensitivity equation for the obtained ANN model was exploited to estimate the relative impact of the input parameters (pH, spike, and injection volume) on output variables (DMC, ESA, and OA), depending on the designed ANN model weight coefficients [36]:
where: w—weight coefficient in ANN model, i—input variable, j—output variable, k—hidden neuron, n—number of hidden neurons, m—number of inputs.
2.5.3. Error Analysis
The developed ANN model was validated by using the coefficient of determination (r2), reduced chi-square (χ2), mean bias error (MBE), root mean square error (RMSE), and mean percentage error (MPE), using the following equations [37]:
where xexp,i marks the experimental values and xpre,i presents value obtained by the model, N and n are the number of observations and constants, respectively.
3. Results and Discussion
3.1. Method Validation
Prior detection of the pesticide residues in the Danube and the Tisza river samples, the analytical method was optimized using a full factorial experimental plan (27 samples, with three parameters: pH, spike, and injection volume and three levels), Table 2.
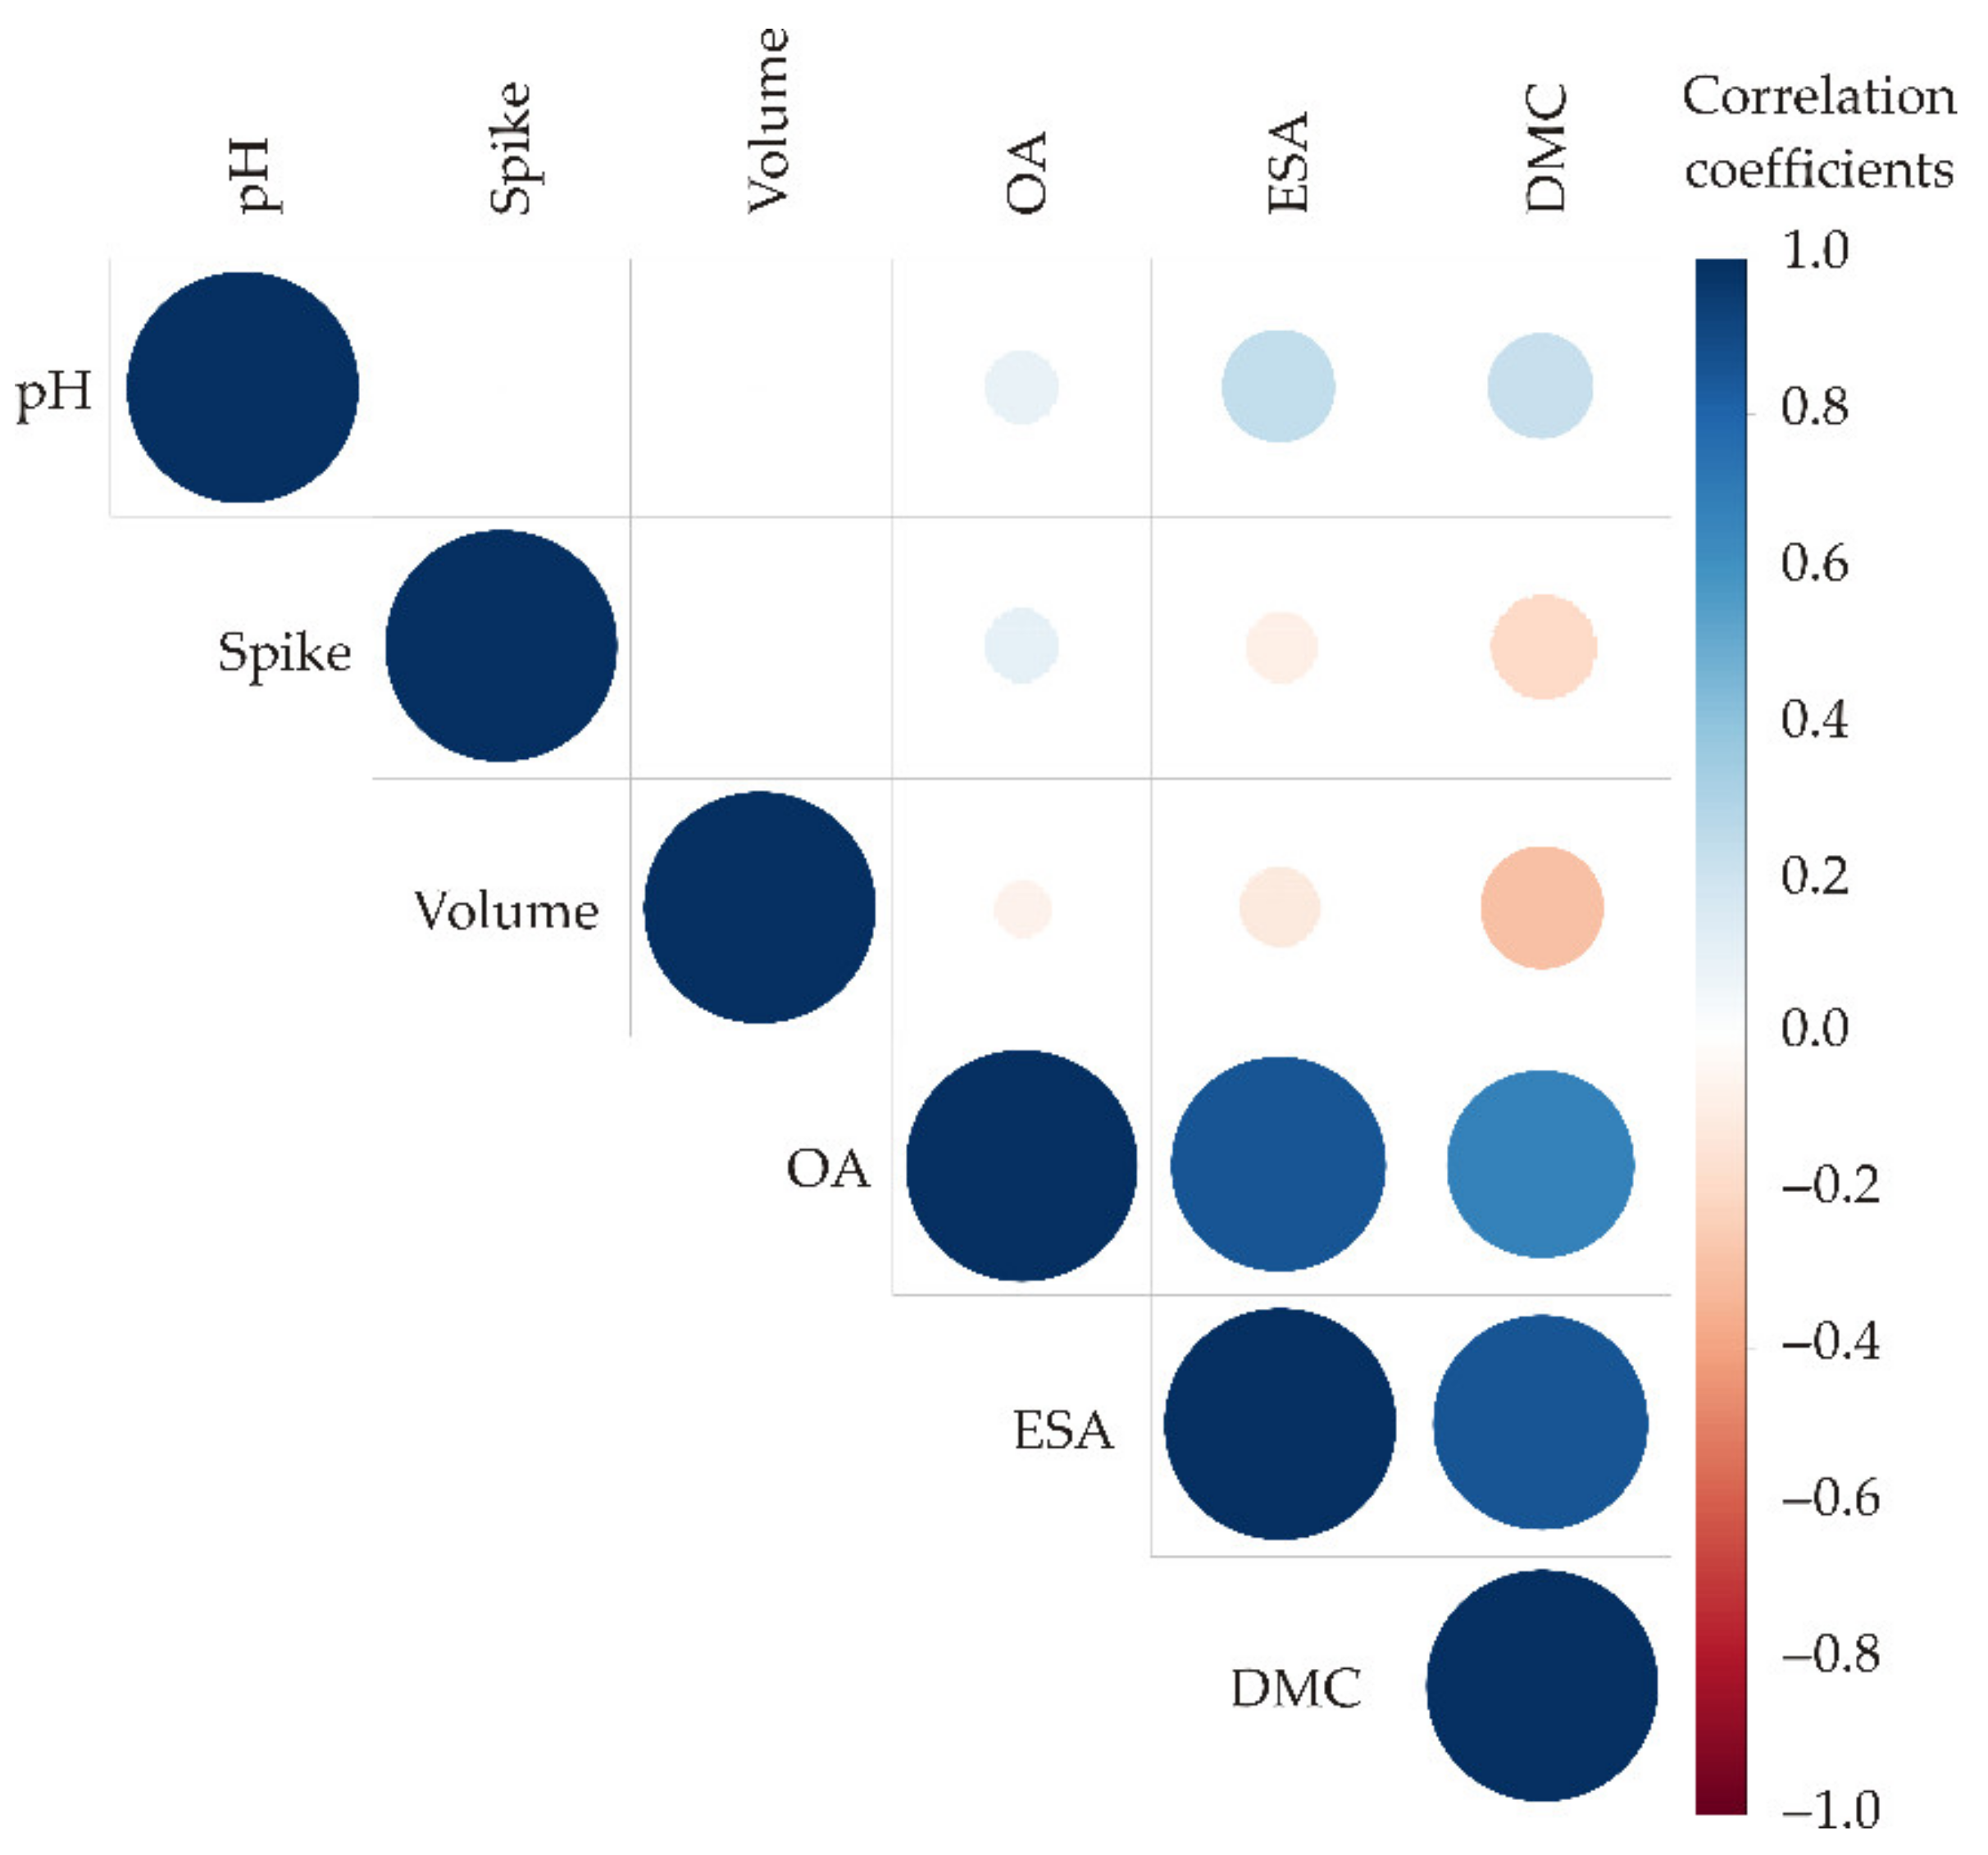
Figure 2 shows a color correlation diagram between all observed responses of tested water samples. In Figure 2, the correlation coefficients between the two observed responses are given by color and the size of the circle. The highest positive correlations were found between OA and ESA, OA, and DMC responses, and also between ESA and DMC. The pH value showed a slight positive correlation with OA, ESA, and DMC responses.
The cluster analysis dendrogram showed three main clusters, Figure 3. The first cluster contained samples 1, 2, 27, 8, 12, 11, 16, 26, 17, 7, and 21. The second cluster included samples 3, 10, 18, 9, 4, 24, 20, 5, 14, 15, 25, 13 and 23. Finally the third cluster contained only samples 6, 19 and 22. The linkage distance (illustrated on the abscissa axis) between the main clusters was evident (nearly 240).
Based on the measured concentration shown in Table 2, PCA analysis was also performed, Figure 4. The PCA biplot of the relationships among OA, ESA, and DMC content and method characteristic parameters including spike, injection volume, and pH, revealed that the first two principal components explained 97.37% of the total variance in the observed parameters. According to the results of the PCA, the content of OA (which contributed 48.85% of the total variance, based on correlations) showed a positive influence on PC2. The content of DMC (50.15%) exerted a positive effect on the PC2 coordinate. On the other hand, the content of ESA (36.49%) positively influenced the calculation of PC1, (Figure 4).
3.1.1. ANN Model
The influence of analytical method parameters (pH, spike, and injection volume) on the OA, ESA, and DMC content was investigated using the ANN model. The acquired optimal neural network model demonstrated a good generalization capability for the testing data and could accurately predict the output parameters of the water samples for the observed input parameters. Based on ANN performance, the optimal number of neurons in the hidden layer for the OA, ESA and DMC content was 9 (network MLP 3-9-3), with a focus on achieving the high value of the coefficient of determination. r2 (overall 0.999 for ANN throughout the training period) and lower values of SOS (Table 3).
The ANN performance defined as the goodness of fit among experimentally measured and model-computed outputs (sum of r2 between measured and calculated OA, ESA, and DMC parameters) throughout training steps, testing, and validation steps is given in Table 4.
The obtained weights and biases obtained during ANN modeling are shown in Table 5 and Table 6, calculated according to Equation 1.
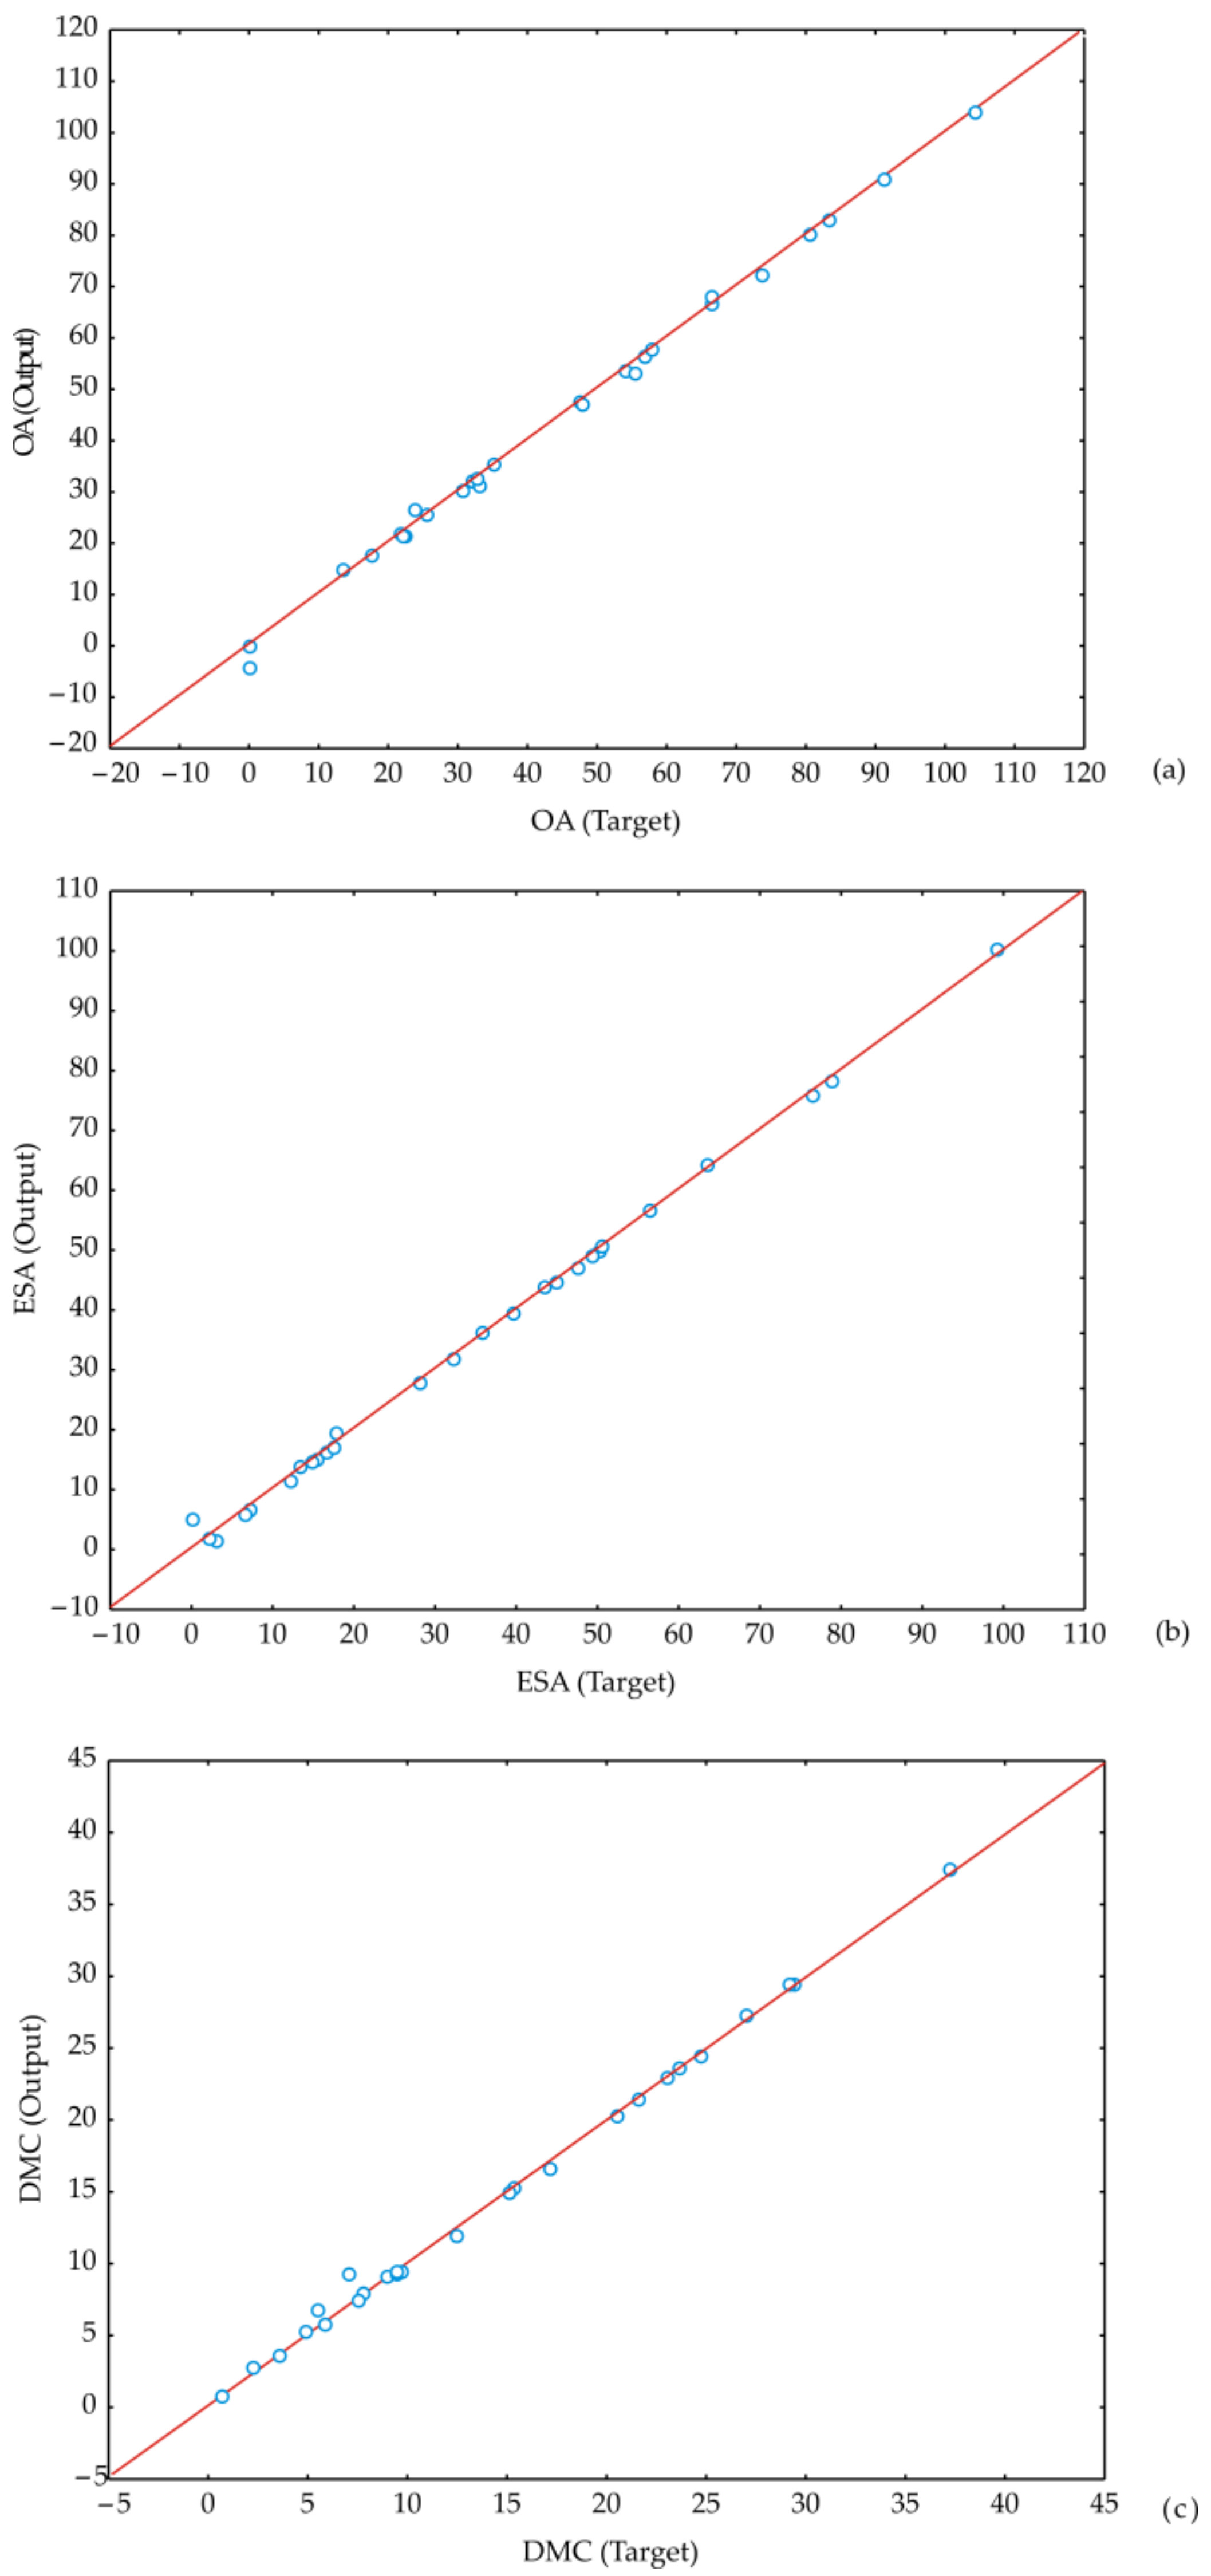
ANN model was employed to predict experimental variables, quite satisfactorily, for a wide range of the process parameters (as observed in Figure 5. where the experimentally estimated and ANN model predicted values are displayed).
Figure 5 shows the experimentally estimated and ANN model predicted values, indicating that the ANN model adequately predicted observed variables. Furthermore, SOS conducted by the ANN model is of the exact order of magnitude as experimental errors, while the predicted values were approaching the preferred values concerning the ANN model r2 value.
The Accuracy of the Models and the Residual Analysis
To numerically verify the displayed model accuracy coefficient of determination (r2), reduced chi-square (χ2), mean bias error (MBE), root mean square error (RMSE), and mean percentage error (MPE) were calculated, as shown in Table 7. In addition, the model feature fit was examined, and the residual analysis results are presented in Table 8. The results show that the ANN model had a minor lack of fit tests, which implies that the model satisfactorily predicted the values of the analyzed parameters.
Multi-Objective ANN Optimization
Optimization of the ANN results was performed analyzing the model presented in Equation (1). One of the main aims of this research was to maximize the method performance in the detection of OA, ESA, and DMC content using ANN model while changing pH, spike and injection volume values. The required parameter range for the optimization was used within the experimental variables domain. The calculated maximum values for OA, ESA, and DMC were: 100.534 µg/dm3, 99.423 µg/dm3, and 37.131 µg/dm3, respectively. The optimum results were obtained at a pH value 7, spike value 1, and injection volume equal to 0.5 μL.
Global Sensitivity Analysis—Yoon’s Interpretation Method
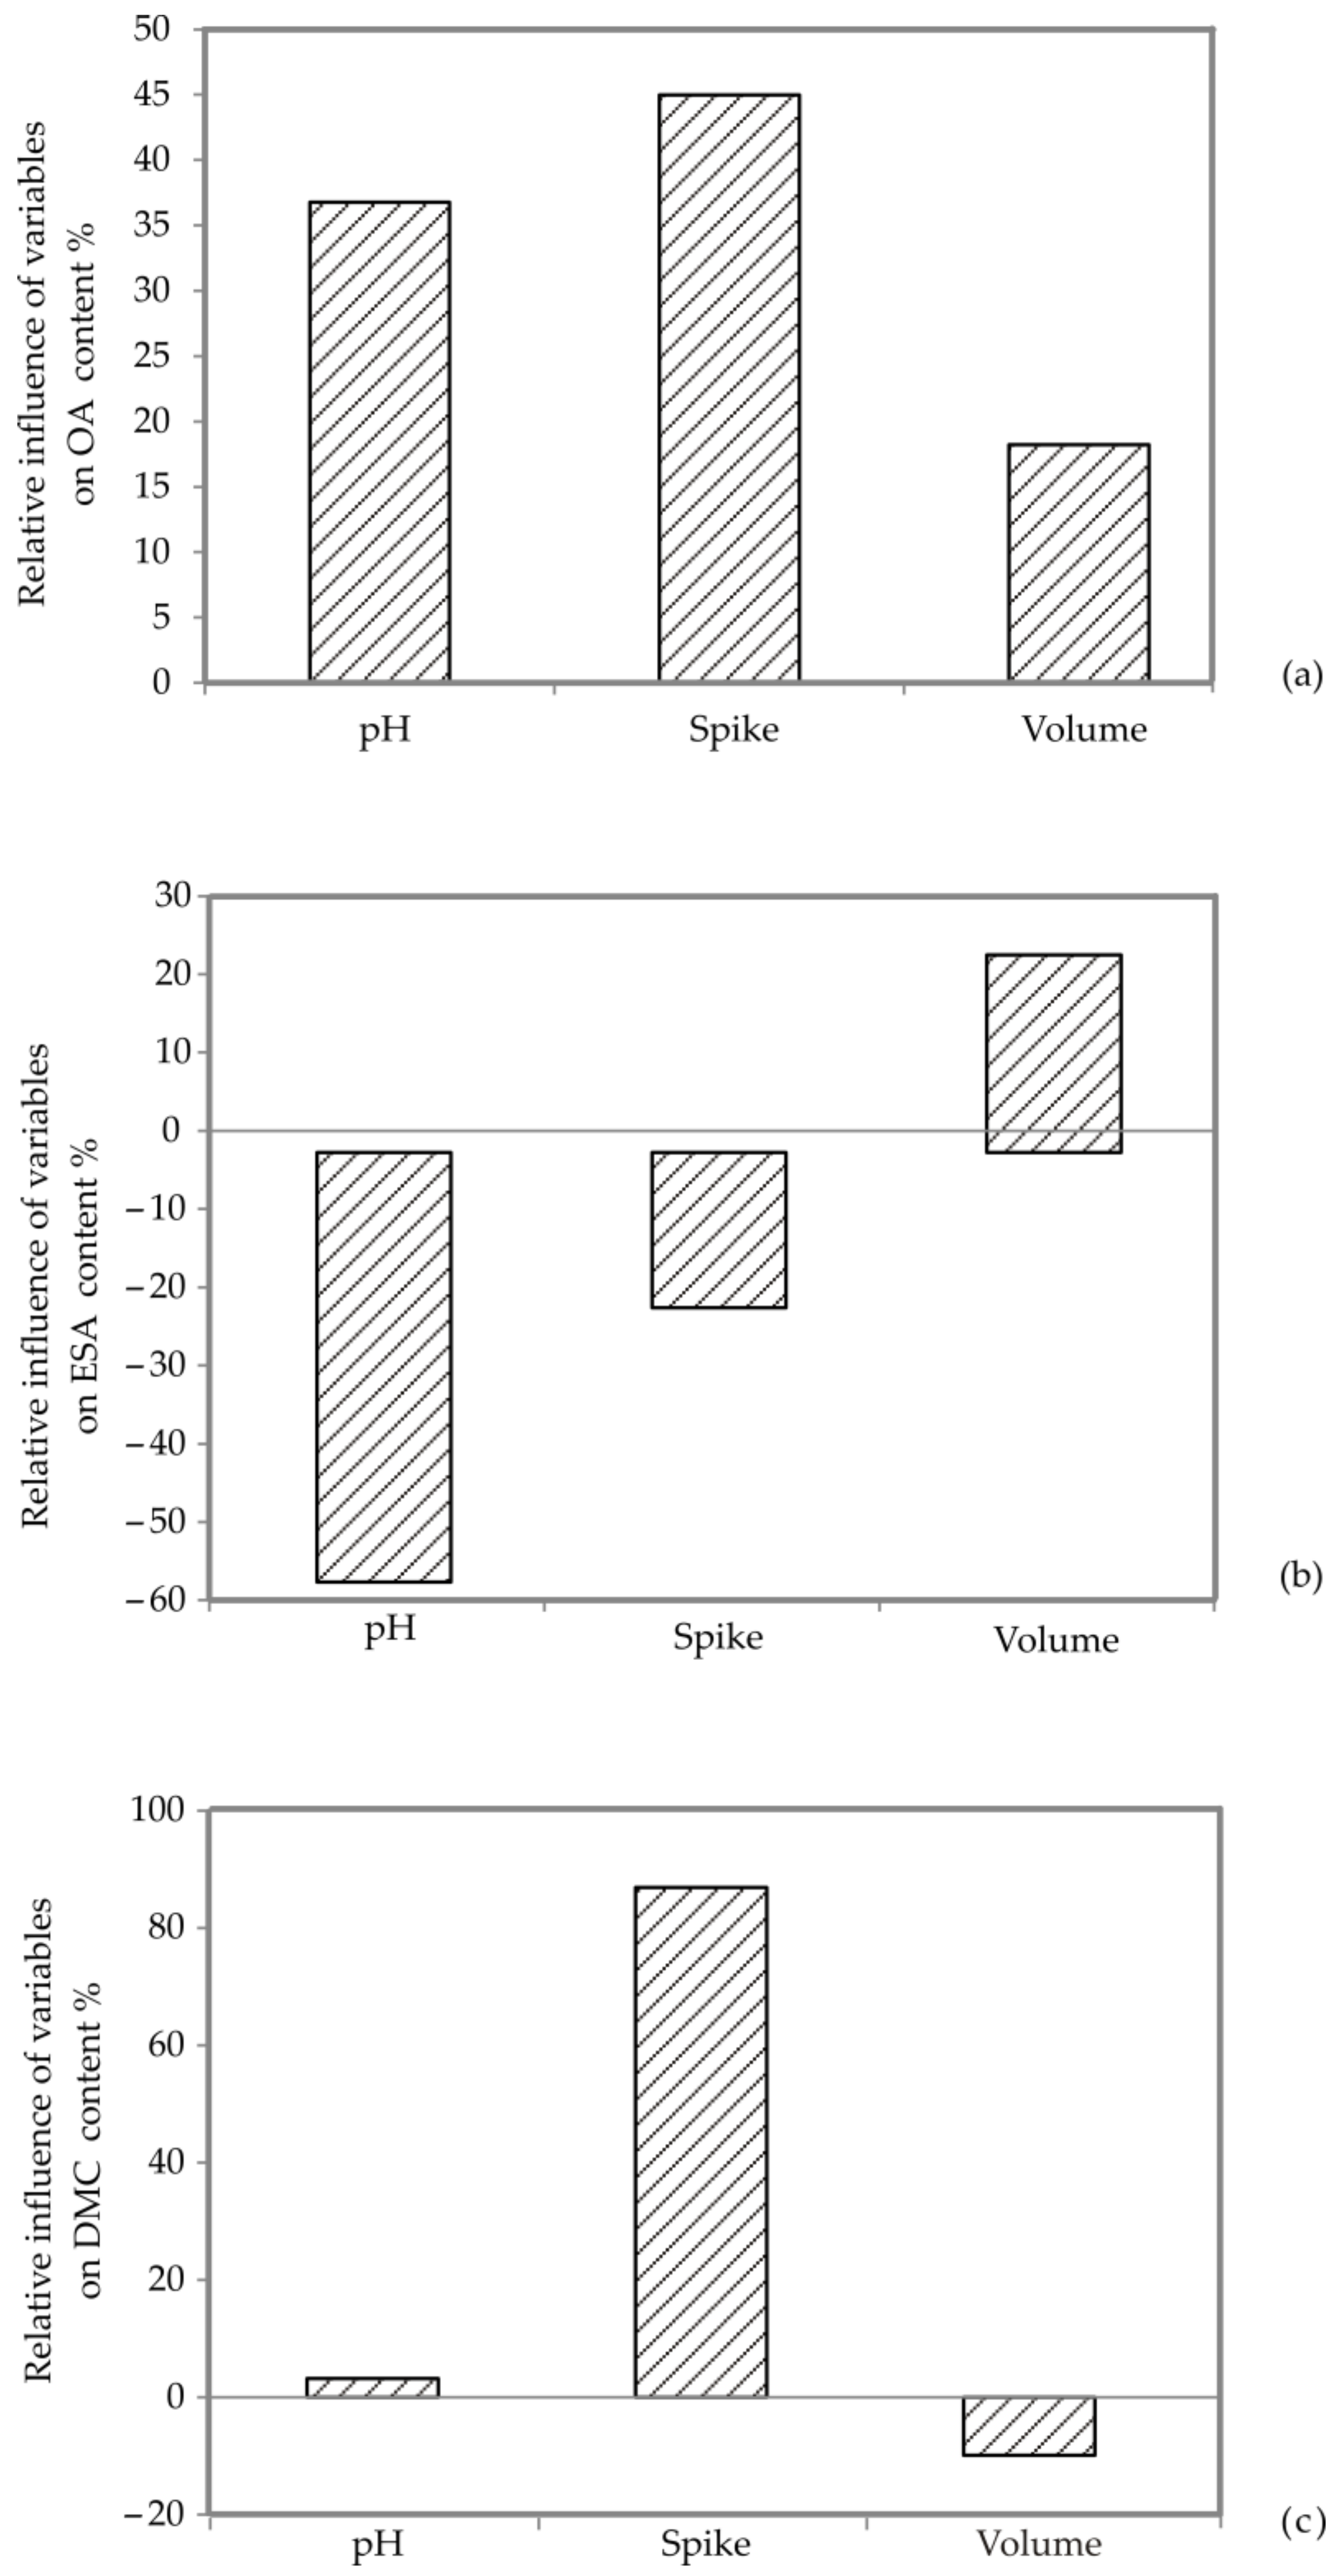
The effects of analytical method parameters (pH, spike, injection volume) on the OA, ESA, and DMC content determination were analyzed employing Yoon’s global sensitivity equation corresponding to the weight coefficients of the obtained ANN model [35]. Following the global sensitivity analysis of a displayed ANN model, the graphical illustration of Yoon’s interpretation method results was shown in Figure 6; based on Figure 6a–c, pH positively influenced the content of OA (36.78%) and DMC (3.24), while the impact on ESA was negative with an approximately relative importance of −54.89%. The spike was the most influential parameter positively influencing OA and DMC content, with an approximately relative importance of 86.88% and 44.98%, respectively. On the other hand, the spike influence on ESA content was quite the opposite −19.84%. The positive influence on the injection volume was observed for OA (18.23%) and ESA (25.26%) content, Figure 6a,b, while at the same time negative influence was noticed for DMC (−10.10%) content, Figure 6c.
3.2. Detection of DMC, ESA and OA in Water from Sampling Sites in the Danube River and the Tisza River
Table 9 contains a summary of the occurrence and concentrations of dimethachlor and its metabolites OA and ESA in samples collected at ten sample sites in the Tisza River and ten sample sites in the Danube River.
Dimethachlor was detected in 100 percent of the samples collected from the Danube River and the Tisza River. Dimethachlor oxalic acid was detected in 80% of the samples while dimethachlor ethanesulfonic acid was detected in only 20% of the samples. These findings indicate that dimethachlor is extensively used in the Danube and Tisza Basin regions. The ratio of metabolite concentrations to the parent compound concentration determines the time of dimethachlor application. The maximum concentrations of chloroacetanilide herbicides detected in Tisza River samples were at sampling site Novi Kneževac for OA (4.59 µg/L), at sampling site Mol for ESA (0.3 µg/L), at sampling sites Ada (3.61 µg/L) and Sanad (3.69 µg/L) for DMC. Dimethachlor OA was not detected at sampling sites Kanjiža and Martonoš, and dimethachlor ESA was not detected at sampling site Martonoš. The average concentrations of chloroacetanilide herbicides detected in Tisza River samples were 1.43 µg/L for OA. 0.08 µg/L for ESA and 1.82 µg/L for DMC.
The maximum detectable concentrations in Danube River samples were at sampling site Bačka Palanka (3.23 µg/L) for OA and sampling site Sremska Kamenica (1.12 µg/L) for DMC, while ESA was only detected at sampling site Bezdan (0.01 µg/L). Dimethachlor OA was not detected in Sremska Kamenica and Novi Sad, while dimethachlor ranged from 0.20 to 1.12 µg/L at all sampling sites in the Danube River. The average concentrations in Danube River samples were 1.51 µg/L for OA 0.01 µg/L for ESA and 0.63 µg/L for DMC. Detected dimethachlor concentrations were increased in the Danube from Bezdan (0.46 µg/L) to Sremska Kamenica (1.12 µg/L), which could be explained by using dimethachlor on agricultural fields in Vojvodina and neighboring countries, primarily Austria and Hungary [38]. Usually, the most frequently detected compounds in ricers are atrazine, simazine, alachlor, metolachlor, and trifluralin of the herbicides, diazinon, parathion methyl of the insecticides and lindane, endosulfan and aldrin of the organochlorine pesticides [39].
Pesticide pollution of surface waters is a global concern [40,41]. The Regulation on Limit Values of Priority and Priority Hazardous Substances Polluting Surface Water and Deadlines for Their Achievement (OG of RS. No. 24/2014) has not been applied to dimethachlor and its metabolites but only on certain pesticides (Table 10).
The comparison of DMC, OA, and ESA average concentrations with the atrazine concentration shown in Table 9 (comparison with atrazine was made considering the fact that atrazine is a herbicide with high mobility in soil) has indicated that the DMC, OA, and ESA average concentrations in Tisza River and Danube River samples did not exceed the atrazine maximum permissible concentration (2.0 µg/L). Meanwhile, the DMC and OA average concentrations in Tisza River and Danube River samples were above the atrazine average annual concentration (0.6 µg/L).
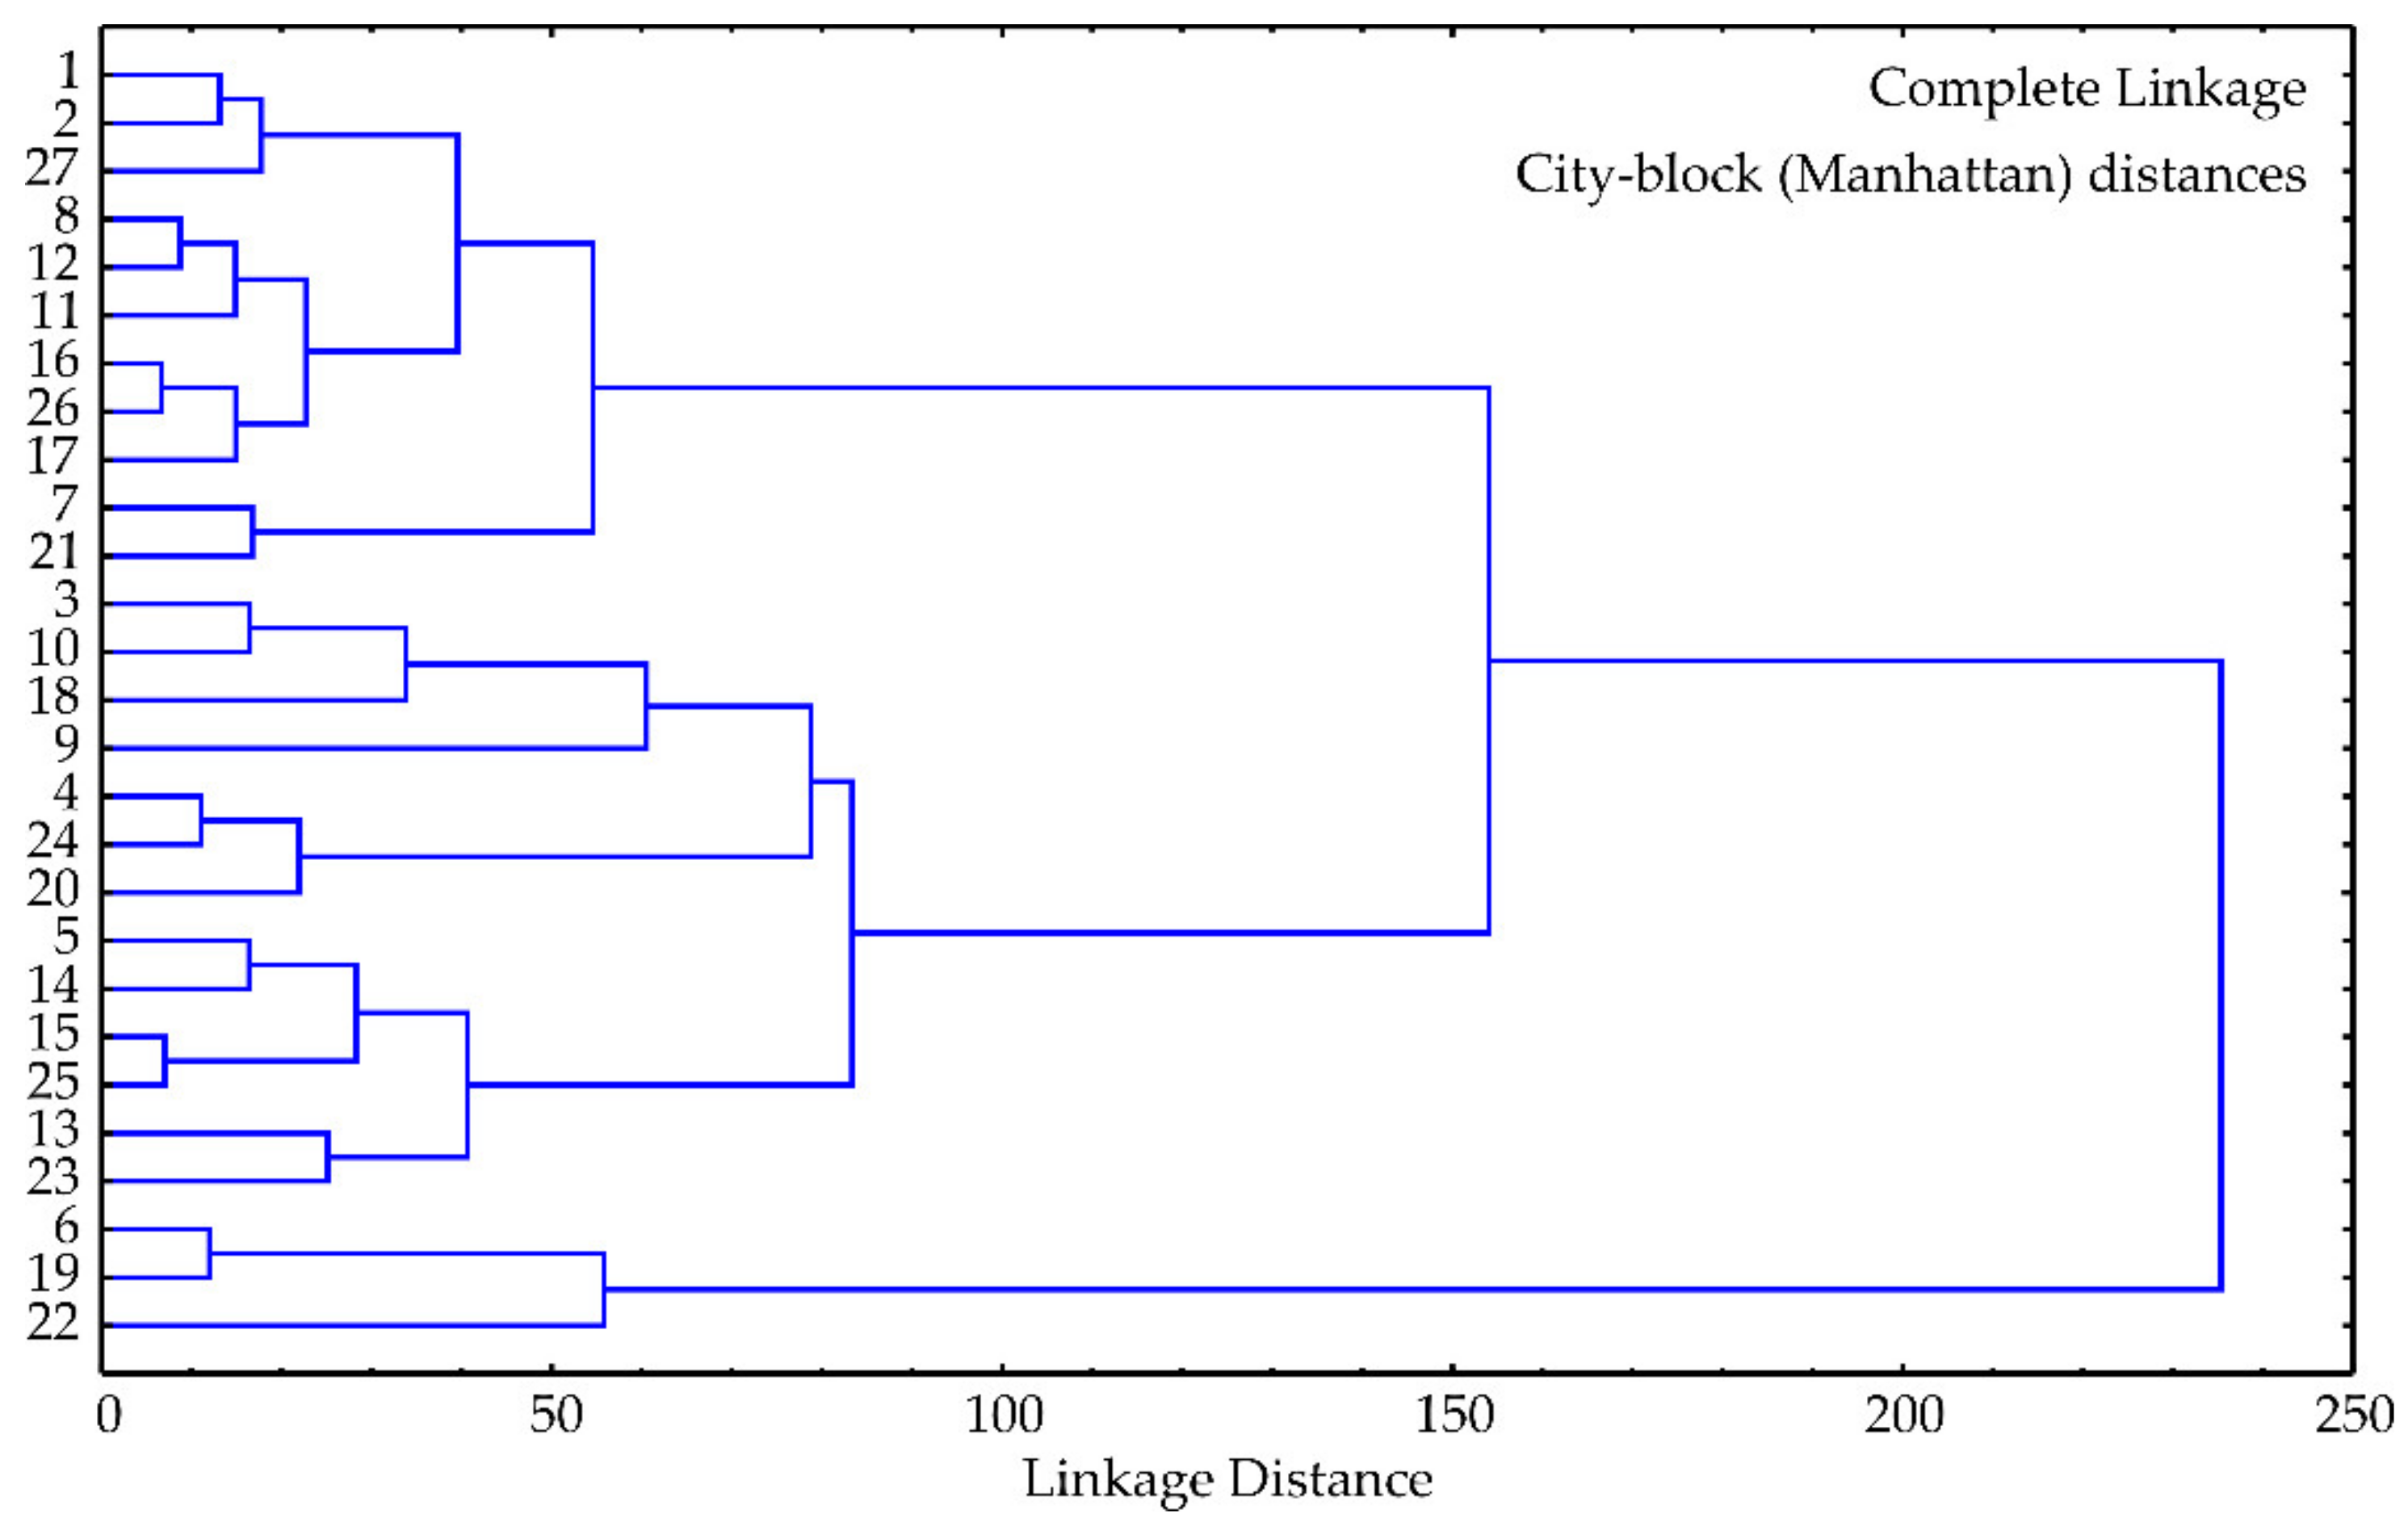
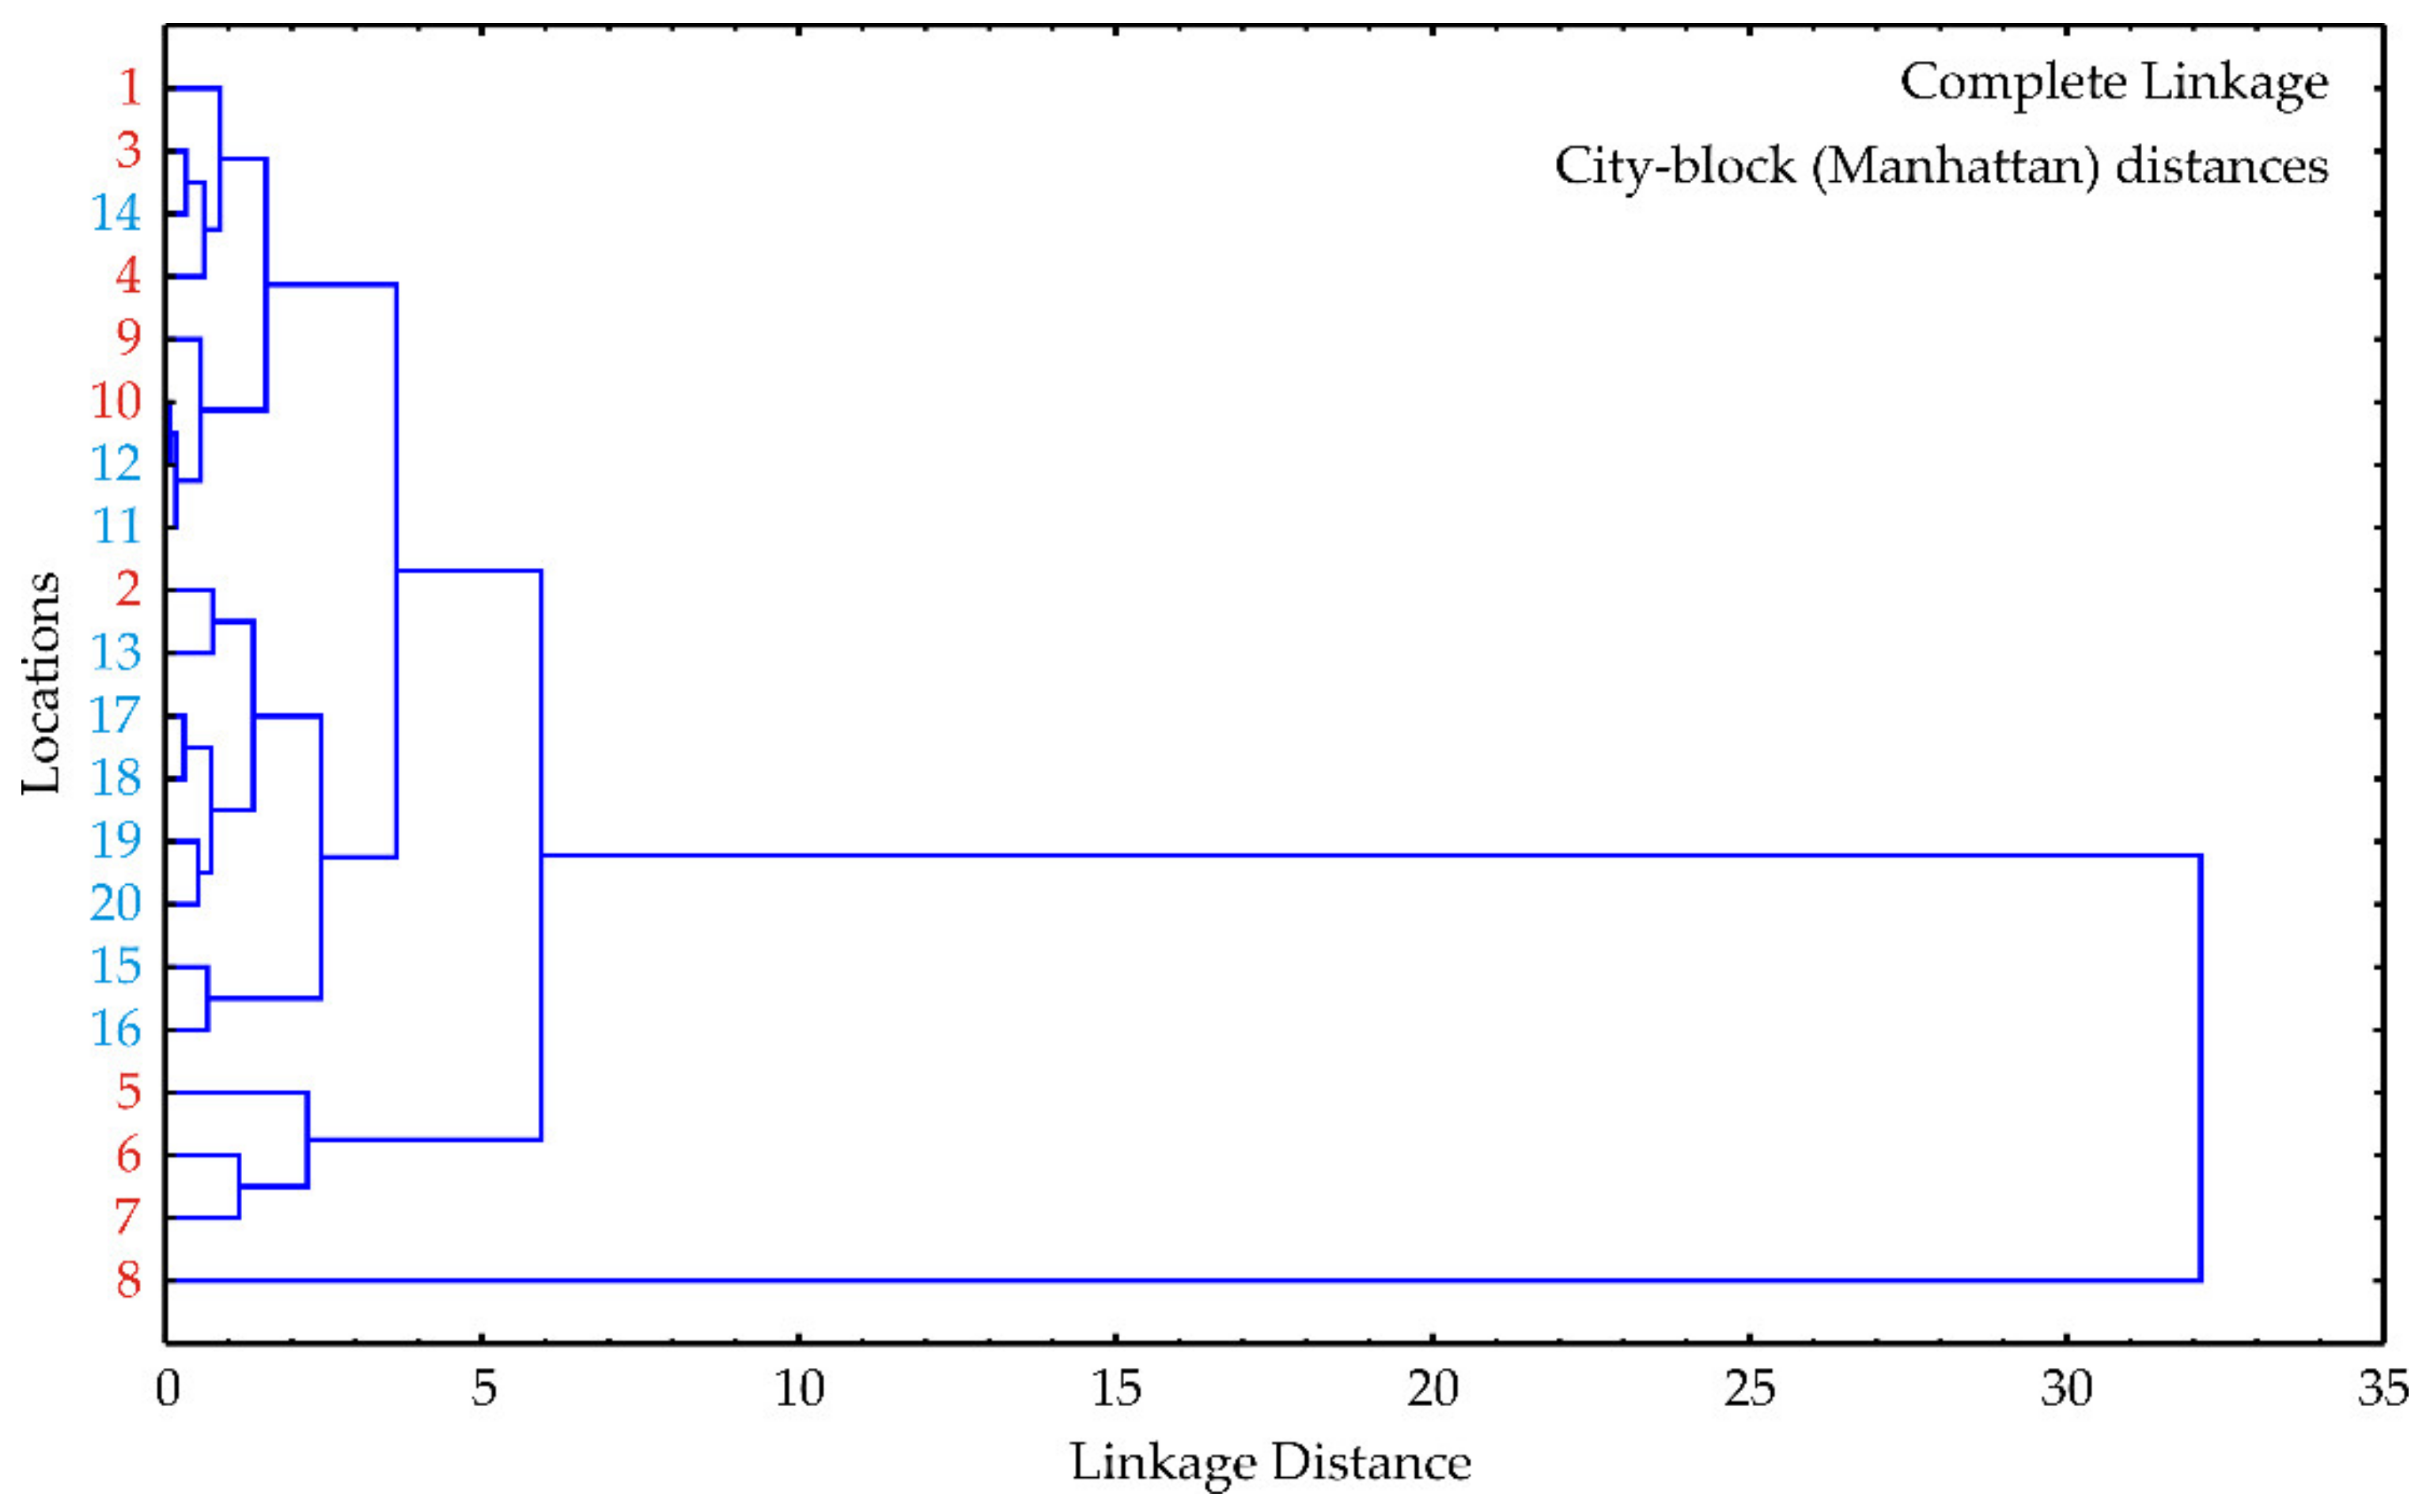
Figure 7 shows dendrograms of cluster analysis for the tested water samples from the Danube River and Tisza River sampling sites. The cluster analysis as the complete linkage algorithm and City block (Manhattan) distances was used to measure proximity among the water samples. City block distances (illustrated on the abscissa axis) are measured as the average difference across the dimensions of the tested samples [43]. The linkage distance (illustrated on the abscissa axis) between the main clusters was evident (nearly 32).
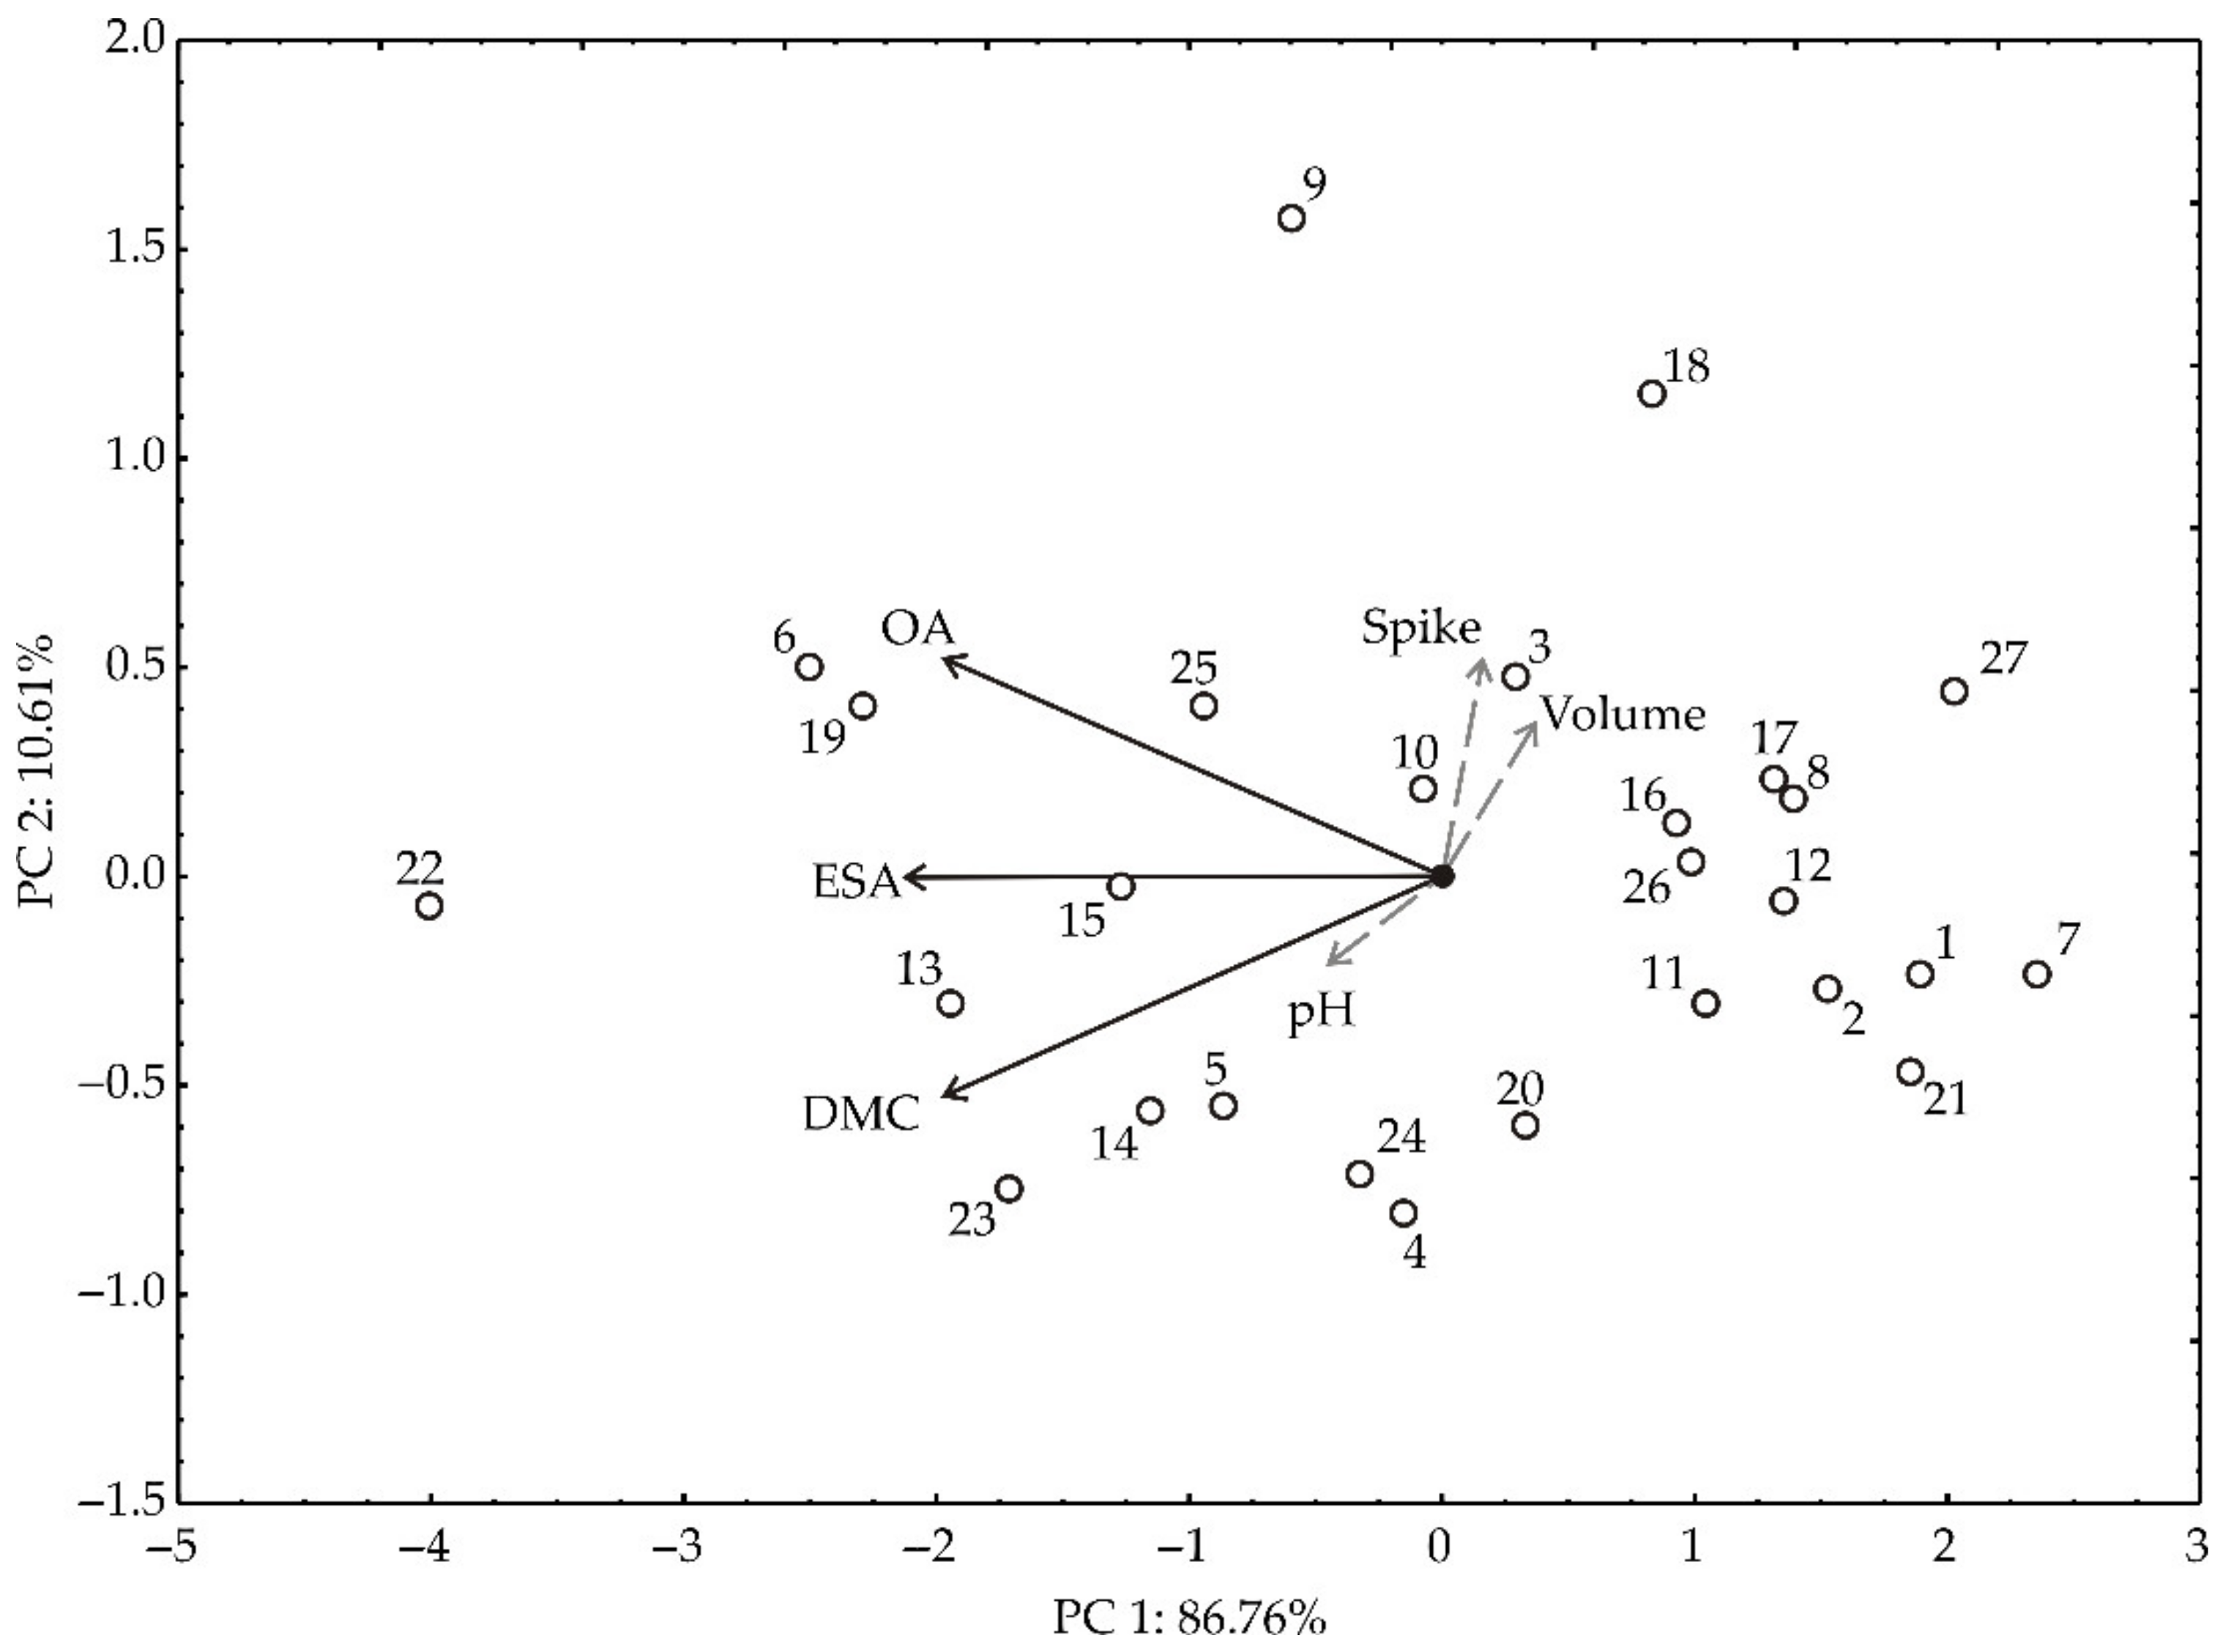
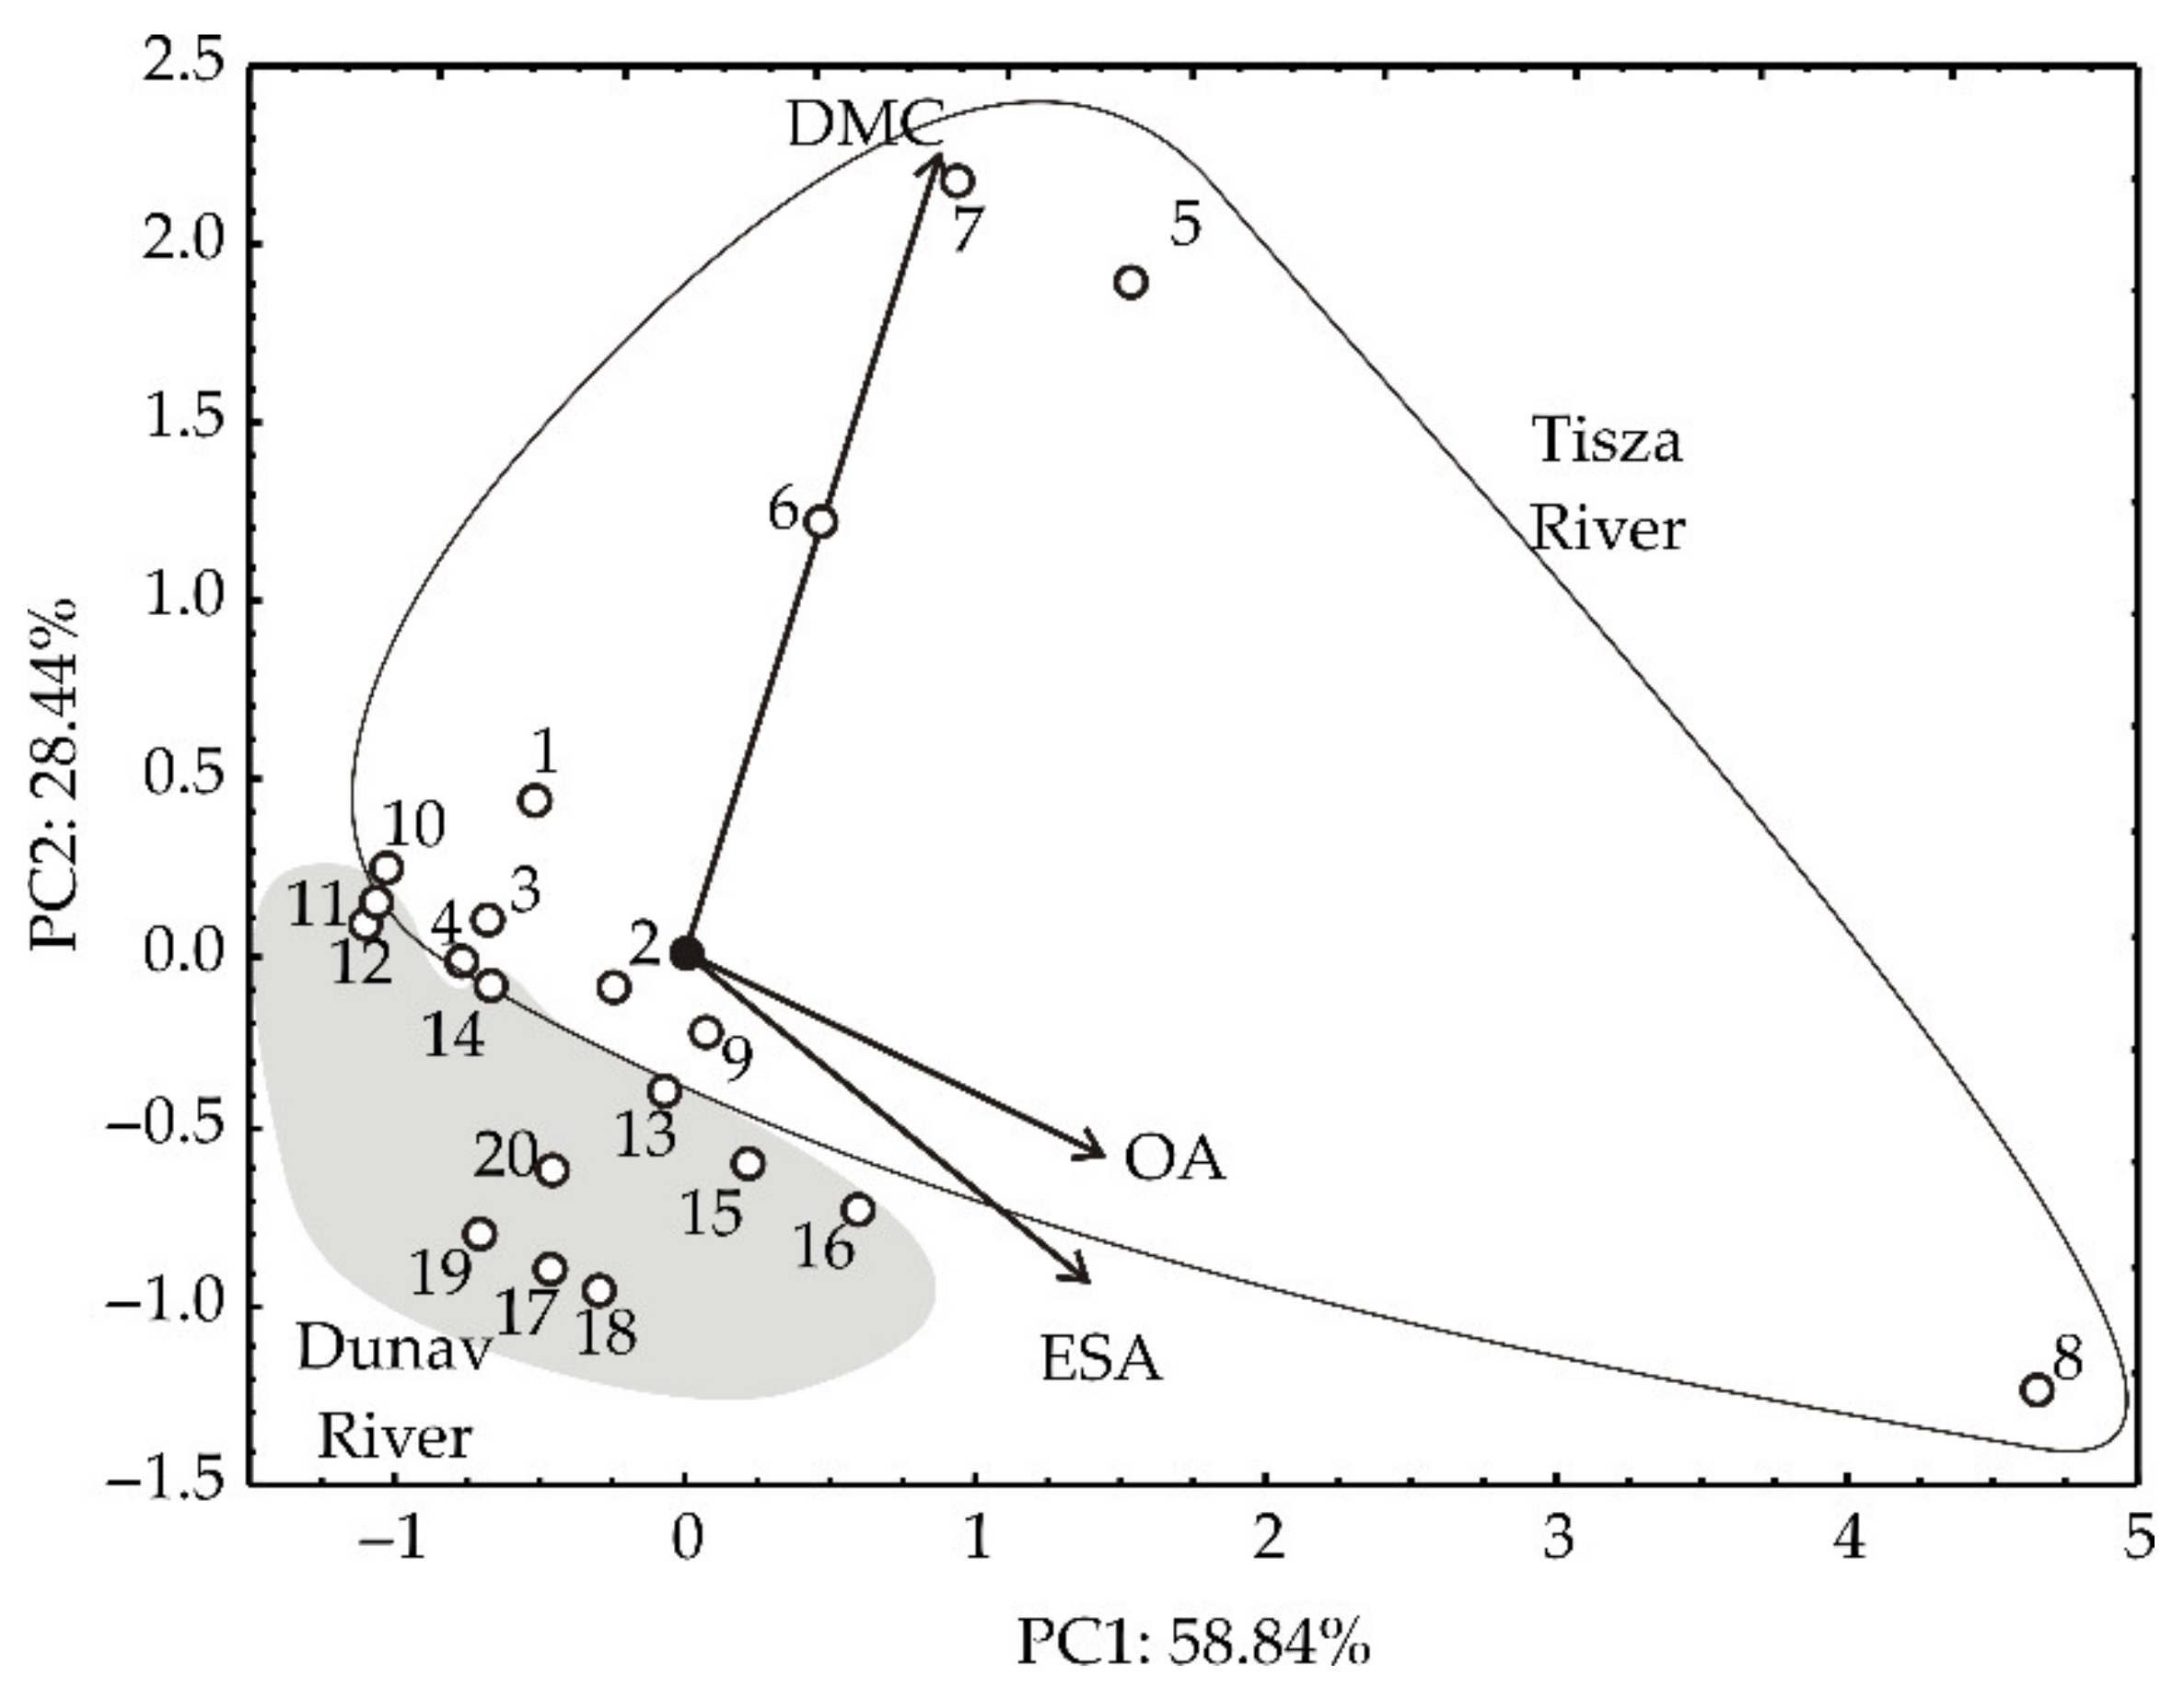
Based on the measured concentration shown in Table 9, PCA analysis was performed, Figure 8. The first two principal components explained 87.28% of the total variance in the observed parameters. PCA analysis has shown a good grouping of water samples from sampling sites in the Danube River and the Tisza River. The higher concentrations of these compounds were observed in the Tisza River, rather than in the Danube River. Additionally, a biplot graph of OA, ESA, and DMC concentrations was plotted for the locations shown in Figure 8.
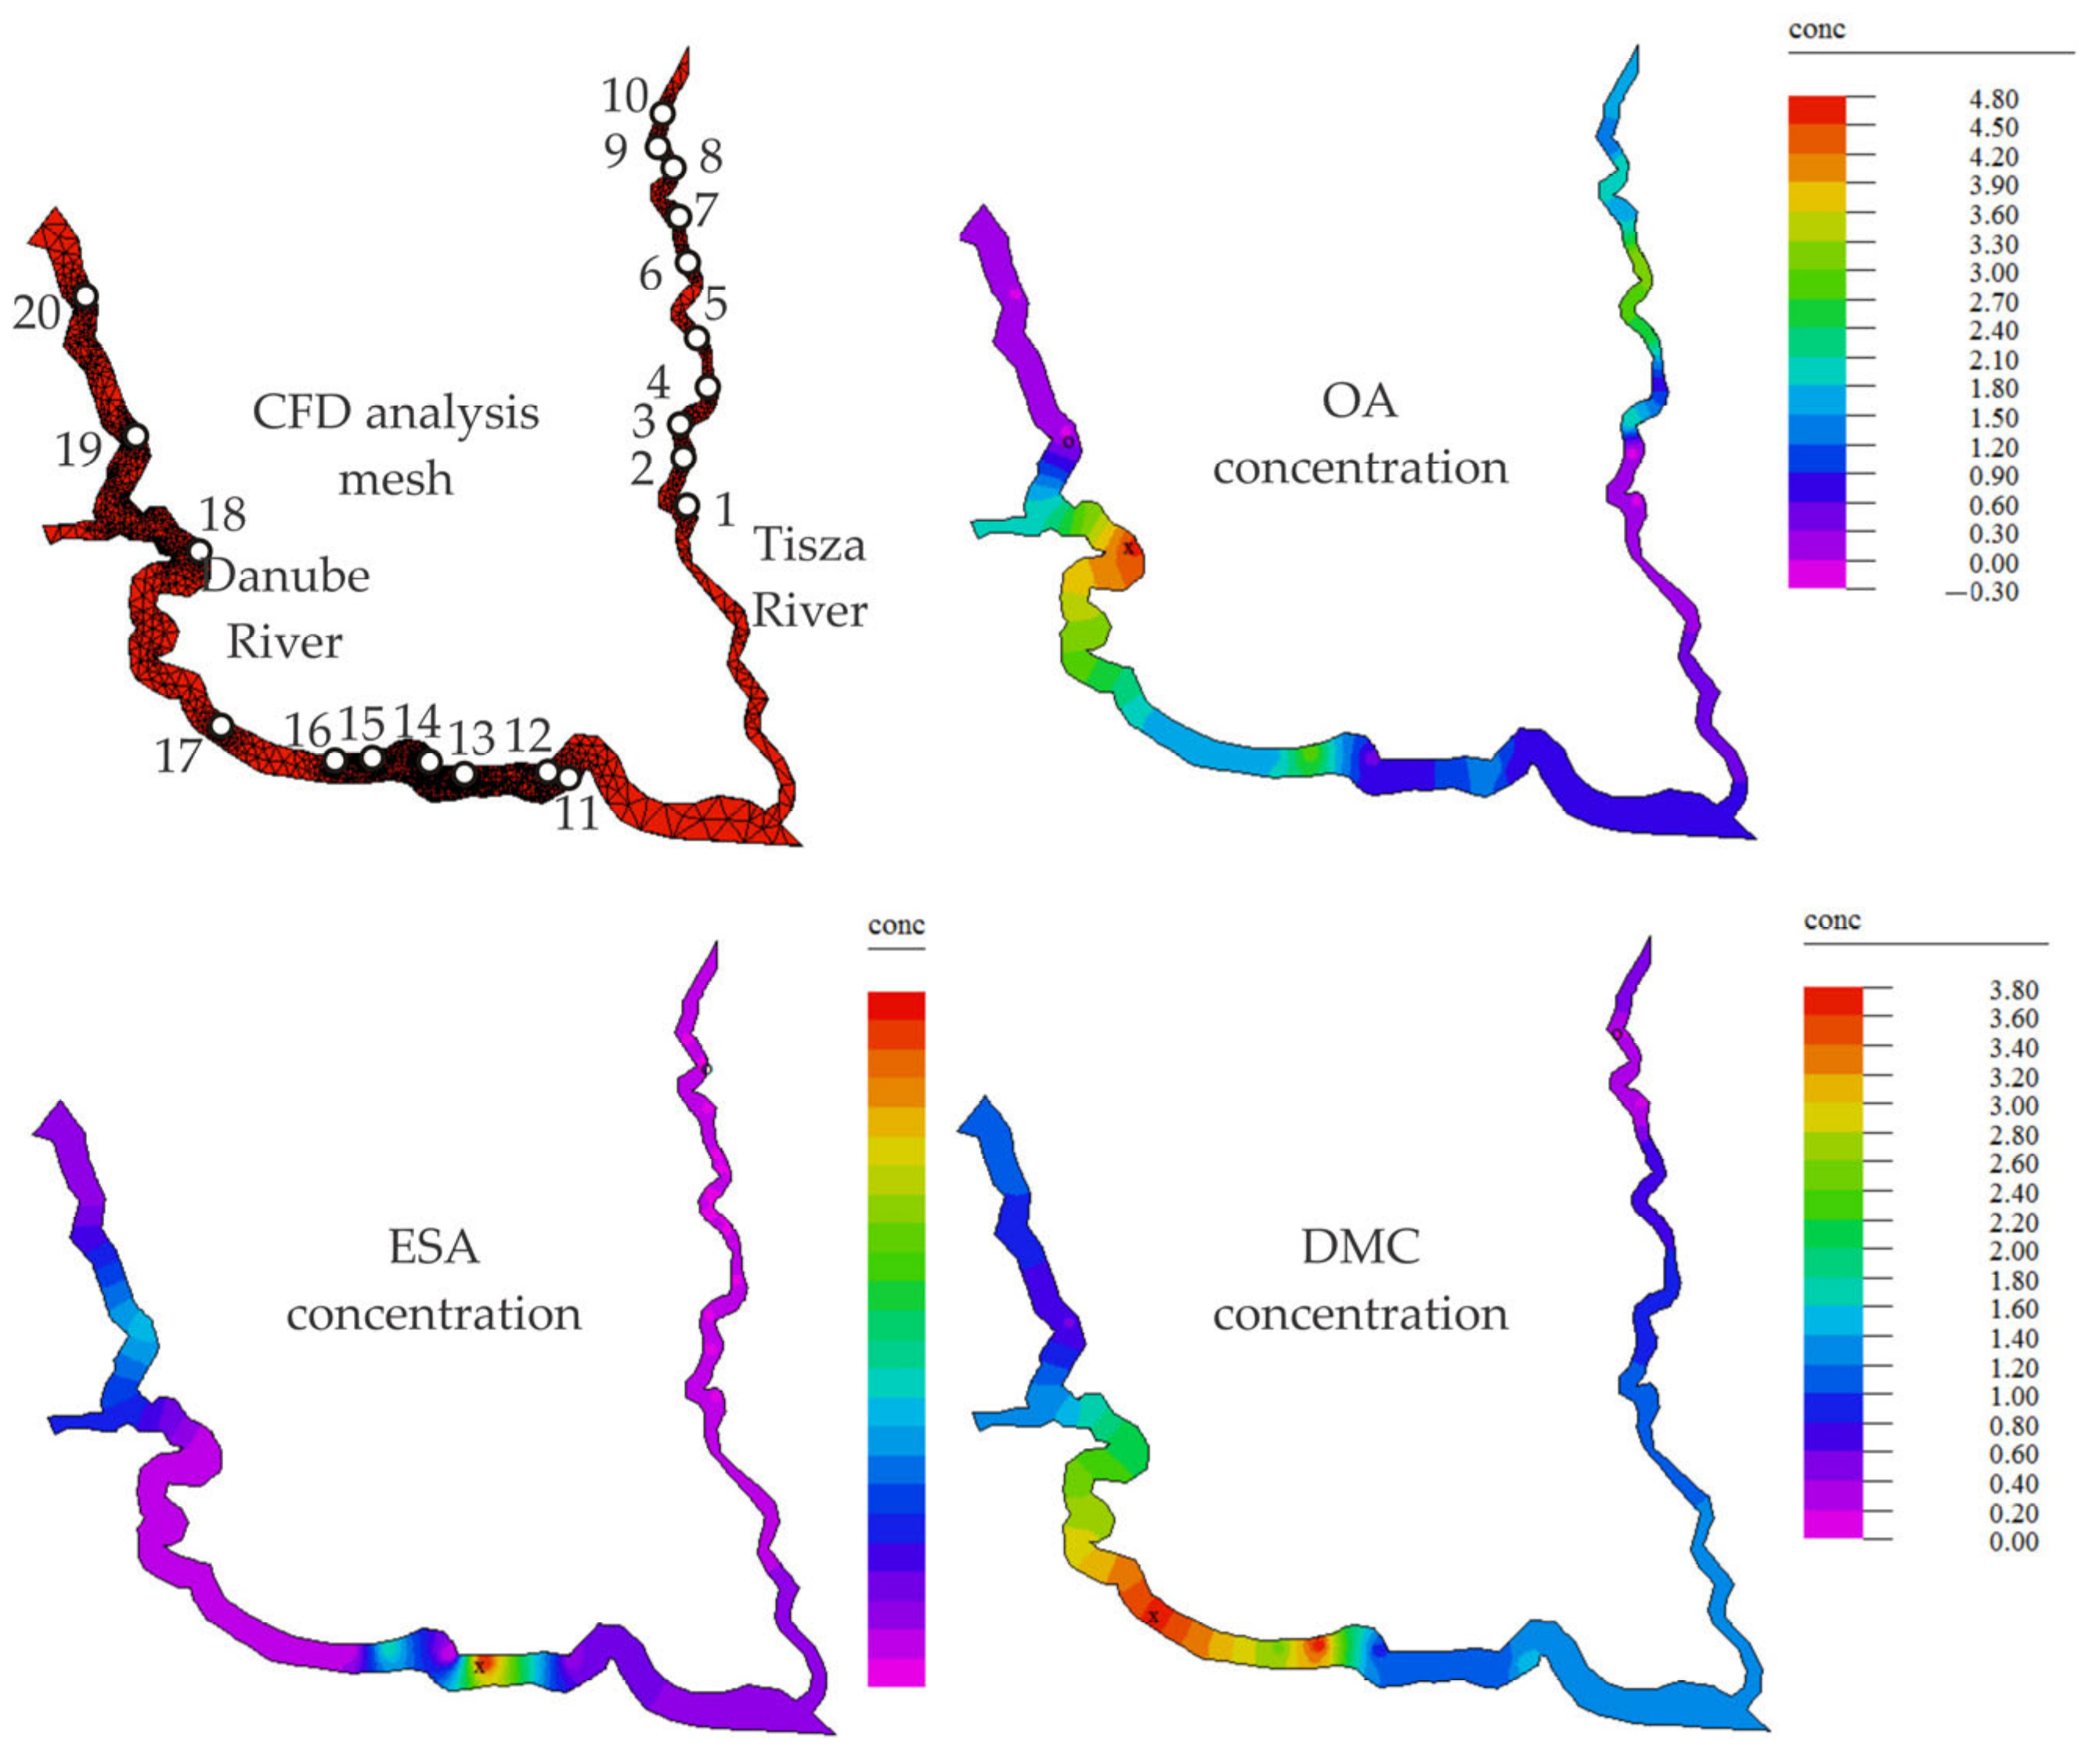
Based on data shown in Table 9, a computational fluid dynamics (CFD) analysis [44] was conducted to show the geographical distribution of OA, ESA, and DMC concentrations detected in water samples from sampling sites (Figure 9). This analysis was performed using in-home developed software and river geographic profiles were drawn in the FreeCAD program. The mesh for computational fluid dynamics (CFD) is also shown in Figure 9 and was used as an analysis tool.
Dimethachlor was found in all samples collected from the Danube River and Tisza River showing that this herbicide is used on agricultural fields. The higher concentrations of dimethachlor in the Tisza River indicate that this herbicide was applied in the year of the study.
Degradates (OA) were present in higher concentrations in the Danube River than the parent compounds. This indicates that dimethachlor was also probably used in earlier years, while chloroacetanilide herbicide degradates may be more stable than the parent compounds and present in the water and soil for a longer period of time.
The presence of ESA in lower concentrations than OA (0.08 µg/L in Tisza River and 0.01 µg/L in Danube River) may be explained by better stability of OA in the aquatic medium than ESA (data on the stability of dimethachlor metabolites were not found in the available literature).
4. Conclusions
The presented results reviled that the analytical method described in this article is a valid and accurate procedure for determining dimetachlor and their corresponding ESA and OA degrades in water, and this article is one of the first to document dimethachlor and its metabolites’ presence in surface water samples. The developed ANN model adequately predicted observed variables. According to the developed artificial neural network model, the optimum results were obtained at a pH value 7, spike value 1, and injection volume equal to 0.5 μL.
Chemometric analysis have shown differences in concentrations of dimethachlor and its metabolites between samples from the Danube River and Tisza River. These findings indicate that the presence of metabolites depends on environmental conditions in which degradation takes place. The results of this study revealed that the samples with higher concentrations of dimetachlor were detected in the Tisza River (average value of 1.82 µg/L). In comparison, the average concentration of dimetachlor in the Danube River was 0.63 µg/L. The results showed that degradates (OA) were present in higher concentrations in the Danube River than they were in the parent compounds. Additionally, results indicate that DMC and OA average concentrations in the Tisza River and Danube River samples were above the atrazine average annual concentration. Therefore, it is necessary to harmonize dimethachlor application dose so that dimethachlor and its metabolites concentrations in water do not exceed limit values.
The obtained data highlight the importance of analyzing both parent pesticide compounds and metabolites to understand their environmental fate and transport in the hydrological system; this is undoubtedly essential in the case of herbicides when applied in high doses.
Author Contributions
Conceptualization, M.P. and L.Ć.; methodology, N.S. and D.P.; software, L.P. and B.L.; validation, M.P., L.P. and V.F.; formal analysis, L.Ć. and N.S.; investigation, L.Ć. and D.P.; resources, M.P.; data curation, L.P. and B.L.; writing—original draft preparation, L.Ć.; writing—review and editing, L.Ć., L.P. and B.L.; visualization, D.P. and V.F.; supervision, V.F. and M.P.; project administration, M.P.; funding acquisition, B.L. All authors have read and agreed to the published version of the manuscript.
Funding
This research was funded by The Ministry of Science, Technological Development and Inovations of The Republic of Serbia, grant numbers: 451-03-68/2022-14 200032, 451-03-68/2022-14/200134, and 451-03-68/2022-14/200051.
Institutional Review Board Statement
Not applicable.
Informed Consent Statement
Not applicable.
Data Availability Statement
Not applicable.
Conflicts of Interest
The authors declare no conflict of interest.
References
- Rehman, A.; Ma, H.; Ozturk, I.; Ulucak, R. Sustainable development and pollution: The effects of CO2 emission on population growth, food production, economic development, and energy consumption in Pakistan. Environ. Sci. Pollut. Res. 2022, 29, 17319–17330. [Google Scholar] [CrossRef] [PubMed]
- Hoffmann, R.; Muttarak, R.; Peisker, J.; Stanig, P. Climate change experiences raise environmental concerns and promote Green voting. Nat. Clim. Change 2022, 12, 148–155. [Google Scholar] [CrossRef]
- Dincer, I. Renewable energy and sustainable development: A crucial review. Renew. Sustain. Energy Rev. 2000, 4, 157–175. [Google Scholar] [CrossRef]
- Ponce, P.; Álvarez-García, J.; Medina, J.; del Río-Rama, M.D.L.C. Financial development, clean energy, and human capital: Roadmap towards sustainable growth in América Latina. Energies 2021, 14, 3763. [Google Scholar] [CrossRef]
- Amjith, L.R.; Bavanish, B. A review on biomass and wind as renewable energy for sustainable environment. Chemosphere 2022, 293, 133579. [Google Scholar] [CrossRef] [PubMed]
- Ogunkunle, O.; Ahmed, N.A. Exhaust emissions and engine performance analysis of a marine diesel engine fuelled with Parinari polyandra biodiesel–diesel blends. Energy Rep. 2020, 6, 2999–3007. [Google Scholar] [CrossRef]
- Ogunkunle, O.; Ahmed, N.A. Overview of biodiesel combustion in mitigating the adverse impacts of engine emissions on the sustainable human–environment scenario. Sustainability 2021, 13, 5465. [Google Scholar] [CrossRef]
- Bielski, S.; Marks-Bielska, R.; Zielińska-Chmielewska, A.; Romaneckas, K.; Šarauskis, E. Importance of agriculture in creating energy security—A case study of Poland. Energies 2021, 14, 2465. [Google Scholar] [CrossRef]
- Nayab, R.; Imran, M.; Ramzan, M.; Tariq, M.; Taj, M.B.; Akhtar, M.N.; Iqbal, H.M. Sustainable biodiesel production via catalytic and non-catalytic transesterification of feedstock materials—A review. Fuel 2022, 328, 125254. [Google Scholar] [CrossRef]
- Bełdycka-Bórawska, A.; Bórawski, P.; Holden, L.; Rokicki, T.; Klepacki, B. Factors Shaping Performance of Polish Biodiesel Producers Participating in the Farm Accountancy Data Network in the Context of the Common Agricultural Policy of the European Union. Energies 2022, 15, 7400. [Google Scholar] [CrossRef]
- Lykogianni, M.; Bempelou, E.; Karamaouna, F.; Aliferis, K.A. Do pesticides promote or hinder sustainability in agriculture? The challenge of sustainable use of pesticides in modern agriculture. Sci. Total Environ. 2021, 795, 148625. [Google Scholar] [CrossRef] [PubMed]
- Obermeier, C.; Mason, A.S.; Meiners, T.; Petschenka, G.; Rostás, M.; Will, T.; Wittkop, B.; Austel, N. Perspectives for integrated insect pest protection in oilseed rape breeding. Theor. Appl. Genet. 2022, 135, 3917–3946. [Google Scholar] [CrossRef] [PubMed]
- Mănoiu, V.M.; Crăciun, A.I. Danube river water quality trends: A qualitative review based on the open access web of science database. Ecohydrol. Hydrobiol. 2021, 21, 613–628. [Google Scholar] [CrossRef]
- Soprani, M.; Ponzoni, A.; Sberveglieri, V.; Carmona, E.N.; Bhandari, M.P.; Betto, G.; Sberveglieri, G. Real-time chemical gas sensing of pathogenic microorganisms pollution in wastewater. In Proceedings of the 2017 ISOCS/IEEE International Symposium on Olfaction and Electronic Nose (ISOEN), Montréal, QC, Canada, 28–31 May 2017; pp. 1–3. [Google Scholar]
- Wijewardene, L.; Wu, N.; Qu, Y.; Guo, K.; Messyasz, B.; Lorenz, S.; Riis, T.; Ulrich, U.; Fohrer, N. Influences of pesticides, nutrients, and local environmental variables on phytoplankton communities in lentic small water bodies in a German lowland agricultural area. Sci. Total Environ. 2021, 780, 146481. [Google Scholar] [CrossRef] [PubMed]
- Pelosi, C.; Bertrand, C.; Daniele, G.; Coeurdassier, M.; Benoit, P.; Nélieu, S.; Lafay, F.; Bretagnolle, V.; Gaba, S.; Vulliet, E.; et al. Residues of currently used pesticides in soils and earthworms: A silent threat? Agric. Ecosyst. Environ. 2021, 305, 107167. [Google Scholar] [CrossRef]
- Székács, A. Herbicide mode of action. In Herbicides Chemistry, Efficacy, Toxicology, and Environmental Impacts—Emerging Issues in Analytical Chemistry; Elsevier: Amsterdam, The Netherlands, 2021; pp. 41–86. [Google Scholar] [CrossRef]
- Ulrich, U.; Lorenz, S.; Hörmann, G.; Stähler, M.; Neubauer, L.; Fohrer, N. Multiple pesticides in lentic small water bodies: Exposure, ecotoxicological risk, and contamination origin. Sci. Total Environ. 2022, 816, 151504. [Google Scholar] [CrossRef]
- Kovacevik, B.; Mitrev, S.; Boev, B. The Impact of Agriculture Activities on Groundwater Quality. In: Creating Sustainable Transffer of Knowledge for Building Novel Ideas for Critical Environmental Issues of the Western Balkan Countries. Stip. Republic of North Macedonia. 28–30 October 2019. Available online: https://eprints.ugd.edu.mk/id/eprint/23745 (accessed on 3 July 2022).
- Székács, A.; Mörtl, M.; Darvas, B. Monitoring pesticide residues in surface and ground water in Hungary: Surveys in 1990–2015. J. Chem. 2015, 2015, 717948. [Google Scholar] [CrossRef] [Green Version]
- Cheng, Z.; Zhang, C.; Jiang, W.; Zhai, W.; Gao, J.; Wang, P. Effects of the presence of triclocarban on the degradation and migration of co-occurring pesticides in soil. Environ. Pollut. 2022, 310, 119840. [Google Scholar] [CrossRef]
- Mahler, B.J.; Nowell, L.H.; Sandstrom, M.W.; Bradley, P.M.; Romanok, K.M.; Konrad, C.P.; Van Metre, P.C. Inclusion of pesticide transformation products is key to estimating pesticide exposures and effects in small US streams. Environ. Sci. Technol. 2021, 55, 4740–4752. [Google Scholar] [CrossRef]
- Tisler, S.; Tüchsen, P.L.; Christensen, J.H. Non-target screening of micropollutants and transformation products for assessing AOP-BAC treatment in groundwater. Environ. Pollut. 2022, 309, 119758. [Google Scholar] [CrossRef]
- Anagnostopoulou, K.; Nannou, C.; Evgenidou, E.; Lambropoulou, D. Overarching issues on relevant pesticide transformation products in the aquatic environment: A review. Sci. Total Environ. 2022, 815, 152863. [Google Scholar] [CrossRef] [PubMed]
- Ulrich, U.; Pfannerstill, M.; Ostendorp, G.; Fohrer, N. Omnipresent distribution of herbicides and their transformation products in all water body types of an agricultural landscape in the North German Lowland. Environ. Sci. Pollut. Res. 2021, 28, 44183–44199. [Google Scholar] [CrossRef] [PubMed]
- Torrentó, C.; Ponsin, V.; Lihl, C.; Hofstetter, T.B.; Baran, N.; Elsner, M.; Hunkeler, D. Triple-element compound-specific stable isotope analysis (3D-CSIA): Added value of Cl isotope ratios to assess herbicide degradation. Environ. Sci. Technol. 2021, 55, 13891–13901. [Google Scholar] [CrossRef] [PubMed]
- Shoemaker, J.A.; Bassett, M.V. Method 535. Measurement of Chloroacetanilide and Other Acetamide Herbicide Degradates in Drinking Water by Solid Phase Extraction and Liquid Chromatography/Tandem Mass Spectrometry (LC/MS/MS); EPA Document #: EPA/600/R-05/053; National Exposure Research Laboratory Office of Research and Development U.S. Environmental Protection Agency: Cincinnati, OH, USA, 2005. [Google Scholar]
- Rajković, D.; Jeromela, A.M.; Pezo, L.; Lončar, B.; Grahovac, N.; Špika, A.K. Artificial neural network and random forest regression models for modelling fatty acid and tocopherol content in oil of winter rapeseed. J. Food Compost Anal. 2022, 44, 105020. [Google Scholar] [CrossRef]
- Vakula, A.; Pavlić, B.; Pezo, L.; Tepić Horecki, A.; Daničić, T.; Raičević, L.; Ljubojević, M.; Šumić, Z. Vacuum drying of sweet cherry: Artificial neural networks approach in process optimization. J. Food Process. Preserv. 2020, 44, e14863. [Google Scholar] [CrossRef]
- Shariati, M.; Mafipour, M.S.; Mehrabi, P.; Bahadori, A.; Zandi, Y.; Salih, M.N.; Nguyen, H.; Dou, J.; Song, X.; Poi-Ngian, S. Application of a hybrid artificial neural network-particle swarm optimization (ANN-PSO) model in behavior prediction of channel shear connectors embedded in normal and high-strength concrete. Appl. Sci. 2019, 9, 5534. [Google Scholar] [CrossRef] [Green Version]
- Mohandes, S.R.; Zhang, X.; Mahdiyar, A. A comprehensive review on the application of artificial neural networks in building energy analysis. Neurocomputing 2019, 340, 55–75. [Google Scholar] [CrossRef]
- Vojnov, B.; Jaćimović, G.; Šeremešić, S.; Pezo, L.; Lončar, B.; Krstić, Đ.; Vujić, S.; Ćupina, B. The Effects of Winter Cover Crops on Maize Yield and Crop Performance in Semiarid Conditions—Artificial Neural Network Approach. Agronomy 2022, 12, 2670. [Google Scholar] [CrossRef]
- Pezo, L.; Lončar, B.; Šovljanski, O.; Tomić, A.; Travičić, V.; Pezo, M.; Aćimović, M. Agricultural Parameters and Essential Oil Content Composition Prediction of Aniseed. Based on Growing Year. Locality and Fertilization Type—An Artificial Neural Network Approach. Life 2022, 12, 1722. [Google Scholar] [CrossRef]
- Jawad, J.; Hawari, A.H.; Zaidi, S.J. Artificial neural network modeling of wastewater treatment and desalination using membrane processes: A review. J. Chem. Eng. 2021, 419, 129540. [Google Scholar] [CrossRef]
- Puntarić, E.; Pezo, L.; Zgorelec, Ž.; Gunjača, J.; Kučić, G.; Voća, N. Prediction of the Production of Separated Municipal Solid Waste by Artificial Neural Networks in Croatia and the European Union. Sustainability 2022, 14, 10133. [Google Scholar] [CrossRef]
- Yoon, Y.; Swales, G.; Margavio, T.M. A comparison of discriminant analysis versus artificial neural networks. J. Oper. Res. Soc. 2017, 44, 51–60. [Google Scholar] [CrossRef]
- Ruškić, N.; Mirović, V.; Marić, M.; Pezo, L.; Lončar, B.; Nićetin, M.; Ćurčić, L. Model for Determining Noise Level Depending on Traffic Volume at Intersections. Sustainability 2022, 14, 12443. [Google Scholar] [CrossRef]
- The list of approved substances. In Official Gazette of Republic of Serbia No. 47/22; Ministry of Agriculture and Environment: Belgrade, Serbia, 2022.
- Konstantinou, I.K.; Hela, D.G. Albanis TAThe status of pesticide pollution in surface waters (rivers lakes) of Greece Part, I. Review on occurrence and levels. Environ. Pollut. 2006, 141, 555–570. [Google Scholar] [CrossRef] [PubMed]
- Karlsson, A.S.; Lesch, M.; Weihermüller, L.; Thiele, B.; Disko, U.; Hofmann, D.; Vereecken, H.; Spielvogel, S. Pesticide contamination of the upper Elbe River and an adjacent floodplain area. J. Soils Sediments 2020, 20, 2067–2081. [Google Scholar] [CrossRef] [Green Version]
- Sonrani, M.; Abbatangelo, M.; Carmona, E.; Duina, G.; Malgaretti, M.; Comini, E.; Sberveglieri, V.; Bhandari, M.P.; Bolpagni, D.; Sberveglieri, G. Array of semiconductor nanowires gas sensor for IoT in wastewater management. In Proceedings of the 2018 Workshop on Metrology for Industry 4.0 and IoT, Brescia, Italy, 16–18 April 2018; pp. 68–71. [Google Scholar]
- The Regulation on Limit Values of Priority and Priority Hazardous Substances Polluting Surface Water and Deadlines for Their Achievement. In Official Gazette of Republic Serbia No. 24/2014; Ministry of Agriculture and Environment: Belgrade, Serbia, 2014.
- Aćimović, M.; Lončar, B.; Jeliazkov, V.; Pezo, L.; Ljujić, J.; Miljković, A.; Vujisić, L. Comparison of Volatile Compounds from Clary Sage (Salvia sclareaL.) Verticillasters Essential Oil and Hydrolate. J. Essent. Oil-Bear. Plants 2022, 25, 555–570. [Google Scholar] [CrossRef]
- Kojić, P.S.; Popović, S.S.; Tokić, M.S.; Šijački, I.M.; Lukić, N.L.; Jovičević, D.Z.; Petrović, D.L. Hydrodynamics of an external-loop airlift reactor with inserted membrane. Braz. J. Chem. Eng. 2017, 34, 493–505. [Google Scholar] [CrossRef]
Figure 1.
Location of sampling sites in the Tisza River (samples 1–10) and Danube River (samples 11–20).
Figure 1.
Location of sampling sites in the Tisza River (samples 1–10) and Danube River (samples 11–20).

Figure 2.
Color correlation diagram between all tested responses. OA—dimethachlor oxalic acid, ESA- dimethachlor ethanesulfonic acid and DMC- dimethachlor.
Figure 2.
Color correlation diagram between all tested responses. OA—dimethachlor oxalic acid, ESA- dimethachlor ethanesulfonic acid and DMC- dimethachlor.

Figure 3.
Cluster analysis of the observed samples. OA—dimethachlor oxalic acid, ESA—dimethachlor ethanesulfonic acid and DMC—dimethachlor.
Figure 3.
Cluster analysis of the observed samples. OA—dimethachlor oxalic acid, ESA—dimethachlor ethanesulfonic acid and DMC—dimethachlor.

Figure 4.
The PCA biplot diagram of the relationships among OA, ESA, and DMC content and spike, injection volume, and pH. OA—dimethachlor oxalic acid, ESA—dimethachlor ethanesulfonic acid and DMC—dimethachlor.
Figure 4.
The PCA biplot diagram of the relationships among OA, ESA, and DMC content and spike, injection volume, and pH. OA—dimethachlor oxalic acid, ESA—dimethachlor ethanesulfonic acid and DMC—dimethachlor.

Figure 5.
Comparison between experimentally obtained and ANN model predicted values of: (a) OA, (b) ESA, and (c) DMC. OA—dimethachlor oxalic acid, ESA—dimethachlor ethanesulfonic acid and DMC—dimethachlor.
Figure 5.
Comparison between experimentally obtained and ANN model predicted values of: (a) OA, (b) ESA, and (c) DMC. OA—dimethachlor oxalic acid, ESA—dimethachlor ethanesulfonic acid and DMC—dimethachlor.

Figure 6.
The relative importance of the content of pH, spike and volume on: (a) OA, (b) ESA, and (c) DMC.
Figure 6.
The relative importance of the content of pH, spike and volume on: (a) OA, (b) ESA, and (c) DMC.

Figure 7.
Cluster analysis of DMC, ESA, and OA concentrations detected in water samples from sampling sites in the Danube River and Tisza River.
Figure 7.
Cluster analysis of DMC, ESA, and OA concentrations detected in water samples from sampling sites in the Danube River and Tisza River.

Figure 8.
Biplot graph of DMC, ESA, and OA concentrations detected in water samples from sampling sites the Danube River and the Tisza River. OA—dimethachlor oxalic acid, ESA—dimethachlor ethanesulfonic acid and DMC—dimethachlor.
Figure 8.
Biplot graph of DMC, ESA, and OA concentrations detected in water samples from sampling sites the Danube River and the Tisza River. OA—dimethachlor oxalic acid, ESA—dimethachlor ethanesulfonic acid and DMC—dimethachlor.

Figure 9.
The geographical distribution of OA, ESA, and DMC concentrations detected in water samples from sampling sites in Daunbe River and Tisza River. OA—dimethachlor oxalic acid, ESA—dimethachlor ethanesulfonic acid and DMC—dimethachlor.
Figure 9.
The geographical distribution of OA, ESA, and DMC concentrations detected in water samples from sampling sites in Daunbe River and Tisza River. OA—dimethachlor oxalic acid, ESA—dimethachlor ethanesulfonic acid and DMC—dimethachlor.


Table 1.
GPS Coordinates of sampling sites.
| Tisza River | Danube River | ||||
|---|---|---|---|---|---|
| No. | Sample Site Locations | Coordinates | No. | Sample Site Locations | Coordinates |
| 1 | Novi Bečej | 45° 35′56″ N 20° 07′ 95″ E | 11 | Sremska Kamenica | 45° 13′ 47″ N 19° 5′ 21″ E |
| 2 | Bečej | 45° 36′ 4″ N 20° 03′ 319″ E | 12 | Novi Sad | 45° 14′ 68″ N 19° 51′ 38″ E |
| 3 | Bačko Petrovo Selo | 45° 42′ 78″ N 20° 5′ 55″ E | 13 | Futog | 45° 13′ 94″ N 19° 41′ 91″ E |
| 4 | Mol | 45° 45′ 78″ N 20° 8′ 74″ E | 14 | Begeč | 45° 13′ 22″ N 19° 37′ 02″ E |
| 5 | Ada | 45° 47′ 62″ N 20° 8′ 72″ E | 15 | Čelarevo | 45° 15′ 35″ N 19° 31′ 854″ E |
| 6 | Senta | 45° 55′ 63″ N 20° 5′ 88″ E | 16 | Bačka Palanka | 45° 14′ 05″ N 19° 22′ 98″ E |
| 7 | Sanad | 45° 58′ 321″ N 20° 5′ 708″ E | 17 | Bačko Novo Selo | 45° 17′ 139″ N 19° 08′ 25″ E |
| 8 | Novi Kneževac | 46° 2′ 926″ N 20° 5′ 304″ E | 18 | Bogojevo | 45° 31′ 81″ N 19° 4′ 72″ E |
| 9 | Kanjiža | 46° 4′ 173″ N 20° 3′ 94″ E | 19 | Apatin | 45° 40′ 501″ N 18° 58’ 15″ E |
| 10 | Martonoš | 46° 7′ 08″ N 20° 4′ 62″ E | 20 | Bezdan | 45° 50′ 97″ N 18° 51′ 57″ E |
Table 2.
The full factorial experimental design used for model optimization.
| No | pH | Spike | Injection Volume | OA | ESA | DMC |
|---|---|---|---|---|---|---|
| 1 | 2 | 0.5 | 0.5 | 13.466 | 0.000 | 6.796 |
| 2 | 2 | 0.5 | 1 | 17.036 | 7.289 | 8.760 |
| 3 | 2 | 0.5 | 1.5 | 47.373 | 32.294 | 9.077 |
| 4 | 2 | 1 | 0.5 | 31.838 | 35.448 | 21.454 |
| 5 | 2 | 1 | 1 | 47.789 | 47.034 | 24.372 |
| 6 | 2 | 1 | 1.5 | 92.682 | 75.841 | 25.254 |
| 7 | 2 | 1.5 | 0.5 | 0.000 | 2.918 | 2.198 |
| 8 | 2 | 1.5 | 1 | 23.386 | 17.694 | 4.866 |
| 9 | 2 | 1.5 | 1.5 | 80.327 | 49.917 | 5.825 |
| 10 | 4.5 | 0.5 | 0.5 | 54.191 | 27.038 | 15.012 |
| 11 | 4.5 | 0.5 | 1 | 25.058 | 11.761 | 12.456 |
| 12 | 4.5 | 0.5 | 1.5 | 22.084 | 13.555 | 7.587 |
| 13 | 4.5 | 1 | 0.5 | 71.137 | 56.358 | 30.079 |
| 14 | 4.5 | 1 | 1 | 57.161 | 43.878 | 26.995 |
| 15 | 4.5 | 1 | 1.5 | 67.904 | 49.604 | 23.196 |
| 16 | 4.5 | 1.5 | 0.5 | 34.317 | 14.978 | 9.712 |
| 17 | 4.5 | 1.5 | 1 | 32.775 | 6.361 | 7.397 |
| 18 | 4.5 | 1.5 | 1.5 | 57.629 | 14.994 | 3.562 |
| 19 | 7 | 0.5 | 0.5 | 81.937 | 78.524 | 23.114 |
| 20 | 7 | 0.5 | 1 | 22.043 | 38.353 | 15.094 |
| 21 | 7 | 0.5 | 1.5 | 0.000 | 16.891 | 5.358 |
| 22 | 7 | 1 | 0.5 | 100.534 | 99.423 | 37.131 |
| 23 | 7 | 1 | 1 | 55.350 | 61.722 | 29.203 |
| 24 | 7 | 1 | 1.5 | 31.913 | 43.630 | 20.046 |
| 25 | 7 | 1.5 | 0.5 | 65.080 | 49.581 | 16.987 |
| 26 | 7 | 1.5 | 1 | 30.102 | 17.057 | 9.589 |
| 27 | 7 | 1.5 | 1.5 | 22.479 | 2.152 | 0.679 |
OA—dimethachlor oxalic acid, ESA—dimethachlor ethanesulfonic acid and DMC—dimethachlor.
Table 3.
Artificial neural network model summary (performance and errors).
| Network Name | * Performance | Error | Training Algorithm | Error Function | Hidden Activation | Output Activation | ||||
|---|---|---|---|---|---|---|---|---|---|---|
| Train. | Test. | Valid. | Train. | Test. | Valid. | |||||
| MLP 3-9-3 | 0.999 | 0.999 | 0.996 | 0.000 | 0.000 | 0.001 | BFGS 109 | SOS | Tanh | Identity |
* Performance term describes the coefficients of determination, while error terms show a lack of data for the ANN model.
Table 4.
Coefficients of determination (r2) between experimentally measured and ANN outputs, during training, testing, and validation steps.
Table 4.
Coefficients of determination (r2) between experimentally measured and ANN outputs, during training, testing, and validation steps.
| Cycle | ANN | ||
|---|---|---|---|
| OA | ESA | DMC | |
| Train | 0.9998 | 0.9998 | 0.9998 |
| Test | 0.9982 | 0.9996 | 0.9992 |
| Validation | 0.9986 | 0.9952 | 0.9953 |
OA—dimethachlor oxalic acid, ESA—dimethachlor ethanesulfonic acid and DMC—dimethachlor.
Table 5.
The weight coefficients and biases W1 and B1.
| Parameter | 1 | 2 | 3 | 4 | 5 | 6 | 7 | 8 | 9 |
|---|---|---|---|---|---|---|---|---|---|
| pH | −1.068 | −0.323 | −0.083 | 0.230 | −2.201 | 0.032 | −0.884 | 0.167 | 1.270 |
| Spike | −1.149 | 0.633 | −0.772 | 0.726 | 0.839 | 0.427 | −1.067 | 0.395 | 1.346 |
| Injection volume | −0.238 | −0.263 | −1.160 | 0.327 | −0.076 | 0.410 | 0.021 | 1.377 | −0.234 |
| Bias | −0.004 | 1.774 | 1.308 | 1.461 | −0.355 | −1.575 | 1.942 | 1.776 | 0.123 |
Table 6.
The weight coefficients and biases W2 and B2.
| Outputs | 1 | 2 | 3 | 4 | 5 | 6 | 7 | 8 | 9 | Bias |
|---|---|---|---|---|---|---|---|---|---|---|
| OA | −0.859 | 0.895 | −0.261 | 0.306 | −0.398 | 0.943 | 0.315 | 0.263 | 0.541 | 0.706 |
| ESA | 0.812 | 0.215 | 0.202 | 0.866 | 0.509 | 0.889 | 1.207 | 0.976 | −0.651 | 0.041 |
| DMC | −1.444 | 1.071 | 0.435 | −1.391 | 1.047 | 1.060 | −0.442 | 0.216 | 0.910 | −0.174 |
OA—dimethachlor oxalamic acid, ESA—dimethachlor ethanesulfonic acid and DMC—dimethachlor.
Table 7.
The “goodness of fit” tests for the developed ANN model.
| χ2 | RMSE | MBE | MPE | SSE | AARD | r2 | |
|---|---|---|---|---|---|---|---|
| OA | 1.601 | 1.242 | 0.029 | 1.996 | 41.615 | 20.436 | 0.998 |
| ESA | 1.505 | 1.204 | −0.311 | 4.397 | 36.509 | 25.356 | 0.998 |
| DMC | 0.348 | 0.579 | −0.212 | 5.429 | 7.829 | 10.814 | 0.997 |
OA—dimethachlor oxalic acid, ESA—dimethachlor ethanesulfonic acid, and DMC—dimethachlor.
Table 8.
The residual analysis for the developed ANN model.
| Skew | Kurt | Mean | StDev | Var |
|---|---|---|---|---|
| 0.654 | 3.548 | 0.029 | 1.265 | 1.601 |
| −2.648 | 10.016 | −0.311 | 1.185 | 1.404 |
| −2.798 | 9.483 | −0.212 | 0.549 | 0.301 |
Table 9.
Summary of DMC, ESA and OA concentrations detected in water samples from sampling sites in the Danube River and the Tisza River.
Table 9.
Summary of DMC, ESA and OA concentrations detected in water samples from sampling sites in the Danube River and the Tisza River.
| LOD OA = 0.036 µg/dm3 | LOD ESA = 0.042 µg/dm3 | LOD DMC = 0.045 µg/dm3 | ||||||||
|---|---|---|---|---|---|---|---|---|---|---|
| µg/dm3 | rsd. % | µg/dm3 | rsd. % | µg/dm3 | rsd. % | |||||
| Tisza | 1 | 0.680 ± 1.178 a | 0.96 | >LOD | 0.074 ± 0.078 a | 0.063 | >LOD | 1.477 ± 0.666 abc | 0.54 | >LOD |
| 2 | 1.485 ± 1.432 ab | 1.17 | >LOD | 0.047 ± 0.052 a | 0.043 | >LOD | 1.050 ± 0.677 ab | 0.55 | >LOD | |
| 3 | 0.662 ± 1.146 a | 0.94 | >LOD | 0.009 ± 0.015 a | 0.012 | <LOD | 1.081 ± 0.800 abc | 0.65 | >LOD | |
| 4 | 0.546 ± 0.946 a | 0.77 | >LOD | 0.298 ± 0.320 a | 0.261 | >LOD | 0.963 ± 0.774 a | 0.63 | >LOD | |
| 5 | 2.900 ± 1.238 ab | 1.01 | >LOD | 0.012 ± 0.011 a | 0.009 | <LOD | 3.605 ± 1.950 bc | 1.59 | >LOD | |
| 6 | 1.687 ± 0.432 ab | 0.35 | >LOD | 0.004 ± 0.007 a | 0.006 | <LOD | 2.578 ± 1.034 abc | 0.84 | >LOD | |
| 7 | 1.739 ± 1.506 ab | 1.23 | >LOD | 0.007 ± 0.006 a | 0.005 | <LOD | 3.691 ± 2.239 c | 1.83 | >LOD | |
| 8 | 4.592 ± 2.579 b | 2.11 | >LOD | 26.027 ± 11.884 b | 9.703 | >LOD | 2.135 ± 1.001 abc | 0.82 | >LOD | |
| 9 | Bdl | Bdl | <LOD | 0.043 ± 0.075 a | 0.06 | <LOD | 0.599 ± 0.175 a | 0.14 | >LOD | |
| 10 | Bdl | Bdl | <LOD | Bdl | Bdl | <LOD | 1.020 ± 0.311 ab | 0.25 | >LOD | |
| Minimum concentration | 0.55 µg/dm3 | 0.004 µg/dm3 | 0.60 µg/dm3 | |||||||
| Maximum concentration | 4.59 µg/dm3 | 0.3 µg/dm3 | 3.69 µg/dm3 | |||||||
| Average value | 1.43 µg/dm3 | 0.08 µg/dm3 | 1.82 µg/dm3 | |||||||
| Danube | 11 | Bdl | Bdl | <LOD | Bdl | Bdl | <LOD | 1.120 ± 0.090 abc | 0.07 | >LOD |
| 12 | Bdl | Bdl | <LOD | Bdl | Bdl | <LOD | 0.947 ± 0.245 a | 0.20 | >LOD | |
| 13 | 1.966 ± 0.302 ab | 0.25 | >LOD | Bdl | Bdl | <LOD | 0.823 ± 0.431 a | 0.35 | >LOD | |
| 14 | 0.818 ± 1.417 a | 1.16 | >LOD | Bdl | Bdl | <LOD | 0.915 ± 0.596 a | 0.49 | >LOD | |
| 15 | 2.562 ± 0.999 ab | 0.82 | >LOD | Bdl | Bdl | <LOD | 0.704 ± 0.223 a | 0.18 | >LOD | |
| 16 | 3.230 ± 1.713 ab | 1.40 | >LOD | Bdl | Bdl | <LOD | 0.702 ± 0.363 a | 0.30 | >LOD | |
| 17 | 1.705 ± 1.479 ab | 1.21 | >LOD | Bdl | Bdl | <LOD | 0.198 ± 0.103 a | 0.08 | >LOD | |
| 18 | 1.993 ± 0.729 ab | 0.60 | >LOD | Bdl | Bdl | <LOD | 0.213 ± 0.068 a | 0.06 | >LOD | |
| 19 | 1.272 ± 1.119 ab | 0.91 | >LOD | Bdl | Bdl | <LOD | 0.202 ± 0.134 a | 0.11 | >LOD | |
| 20 | 1.527 ± 1.593 ab | 1.30 | >LOD | 0.005 ± 0.009 a | 0.008 | <LOD | 0.461 ± 0.484 a | 0.40 | >LOD | |
| Minimum concentration | 0.82 µg/dm3 | 0.01 µg/dm3 | 0.20 µg/dm3 | |||||||
| Maximum concentration | 3.23 µg/dm3 | 0.01 µg/dm3 | 1.12 µg/dm3 | |||||||
| Average value | 1.51 µg/dm3 | 0.01 µg/dm3 | 0.63 µg/dm3 | |||||||
Different letters (a,b,c) printed the same column show significantly different means of observed data (p ≤ 0.05), according to post hoc Tukey’s HSD test. According to correlation analysis. positive statistically significant correlation was obtained between OA and ESA content. r = 0.603; p ≤ 0.0. Bdl—below detection limit, rsd—relative standard deviation.
Table 10.
Limit values for individual pesticides in surface water [42].
Table 10.
Limit values for individual pesticides in surface water [42].
| Priority Hazardous Substance | Numeric Identification (CAS No.) | Average Annual Concentration (µg/L) | Maximum Permissible Concentration (µg/L) |
|---|---|---|---|
| Atrazine | 1912-24-9 | 0.6 | 2.0 |
| Cyclodiene pesticides: Aldrin Dieldrin Endrin Isodrin | 309-00-02 60-57-1 72-20-8 465-73-6 | Sum 0.01 | / |
| Total DDT | / | 0.025 | / |
| Para-para DDT | 50-29-3 | 0.01 | / |
| Endosulfan | 115-29-7 | 0.005 | 0.01 |
| Simazine | 122-34-9 | 1 | 4 |
| Trifluralin | 1582-09-8 | 0.03 | / |
Publisher’s Note: MDPI stays neutral with regard to jurisdictional claims in published maps and institutional affiliations. |
© 2022 by the authors. Licensee MDPI, Basel, Switzerland. This article is an open access article distributed under the terms and conditions of the Creative Commons Attribution (CC BY) license (https://creativecommons.org/licenses/by/4.0/).
Share and Cite
MDPI and ACS Style
Ćurčić, L.; Lončar, B.; Pezo, L.; Stojić, N.; Prokić, D.; Filipović, V.; Pucarević, M. Chemometric Approach to Pesticide Residue Analysis in Surface Water. Water 2022, 14, 4089. https://doi.org/10.3390/w14244089
AMA Style
Ćurčić L, Lončar B, Pezo L, Stojić N, Prokić D, Filipović V, Pucarević M. Chemometric Approach to Pesticide Residue Analysis in Surface Water. Water. 2022; 14(24):4089. https://doi.org/10.3390/w14244089
Chicago/Turabian StyleĆurčić, Ljiljana, Biljana Lončar, Lato Pezo, Nataša Stojić, Dunja Prokić, Vladimir Filipović, and Mira Pucarević. 2022. "Chemometric Approach to Pesticide Residue Analysis in Surface Water" Water 14, no. 24: 4089. https://doi.org/10.3390/w14244089
Note that from the first issue of 2016, this journal uses article numbers instead of page numbers. See further details here.