
Impacts of Climate Change Induced Sea Level Rise, Flow Increase and Vegetation Encroachment on Flood Hazard in the Biobío River, Chile

Abstract
:1. Introduction
2. Data and Methods
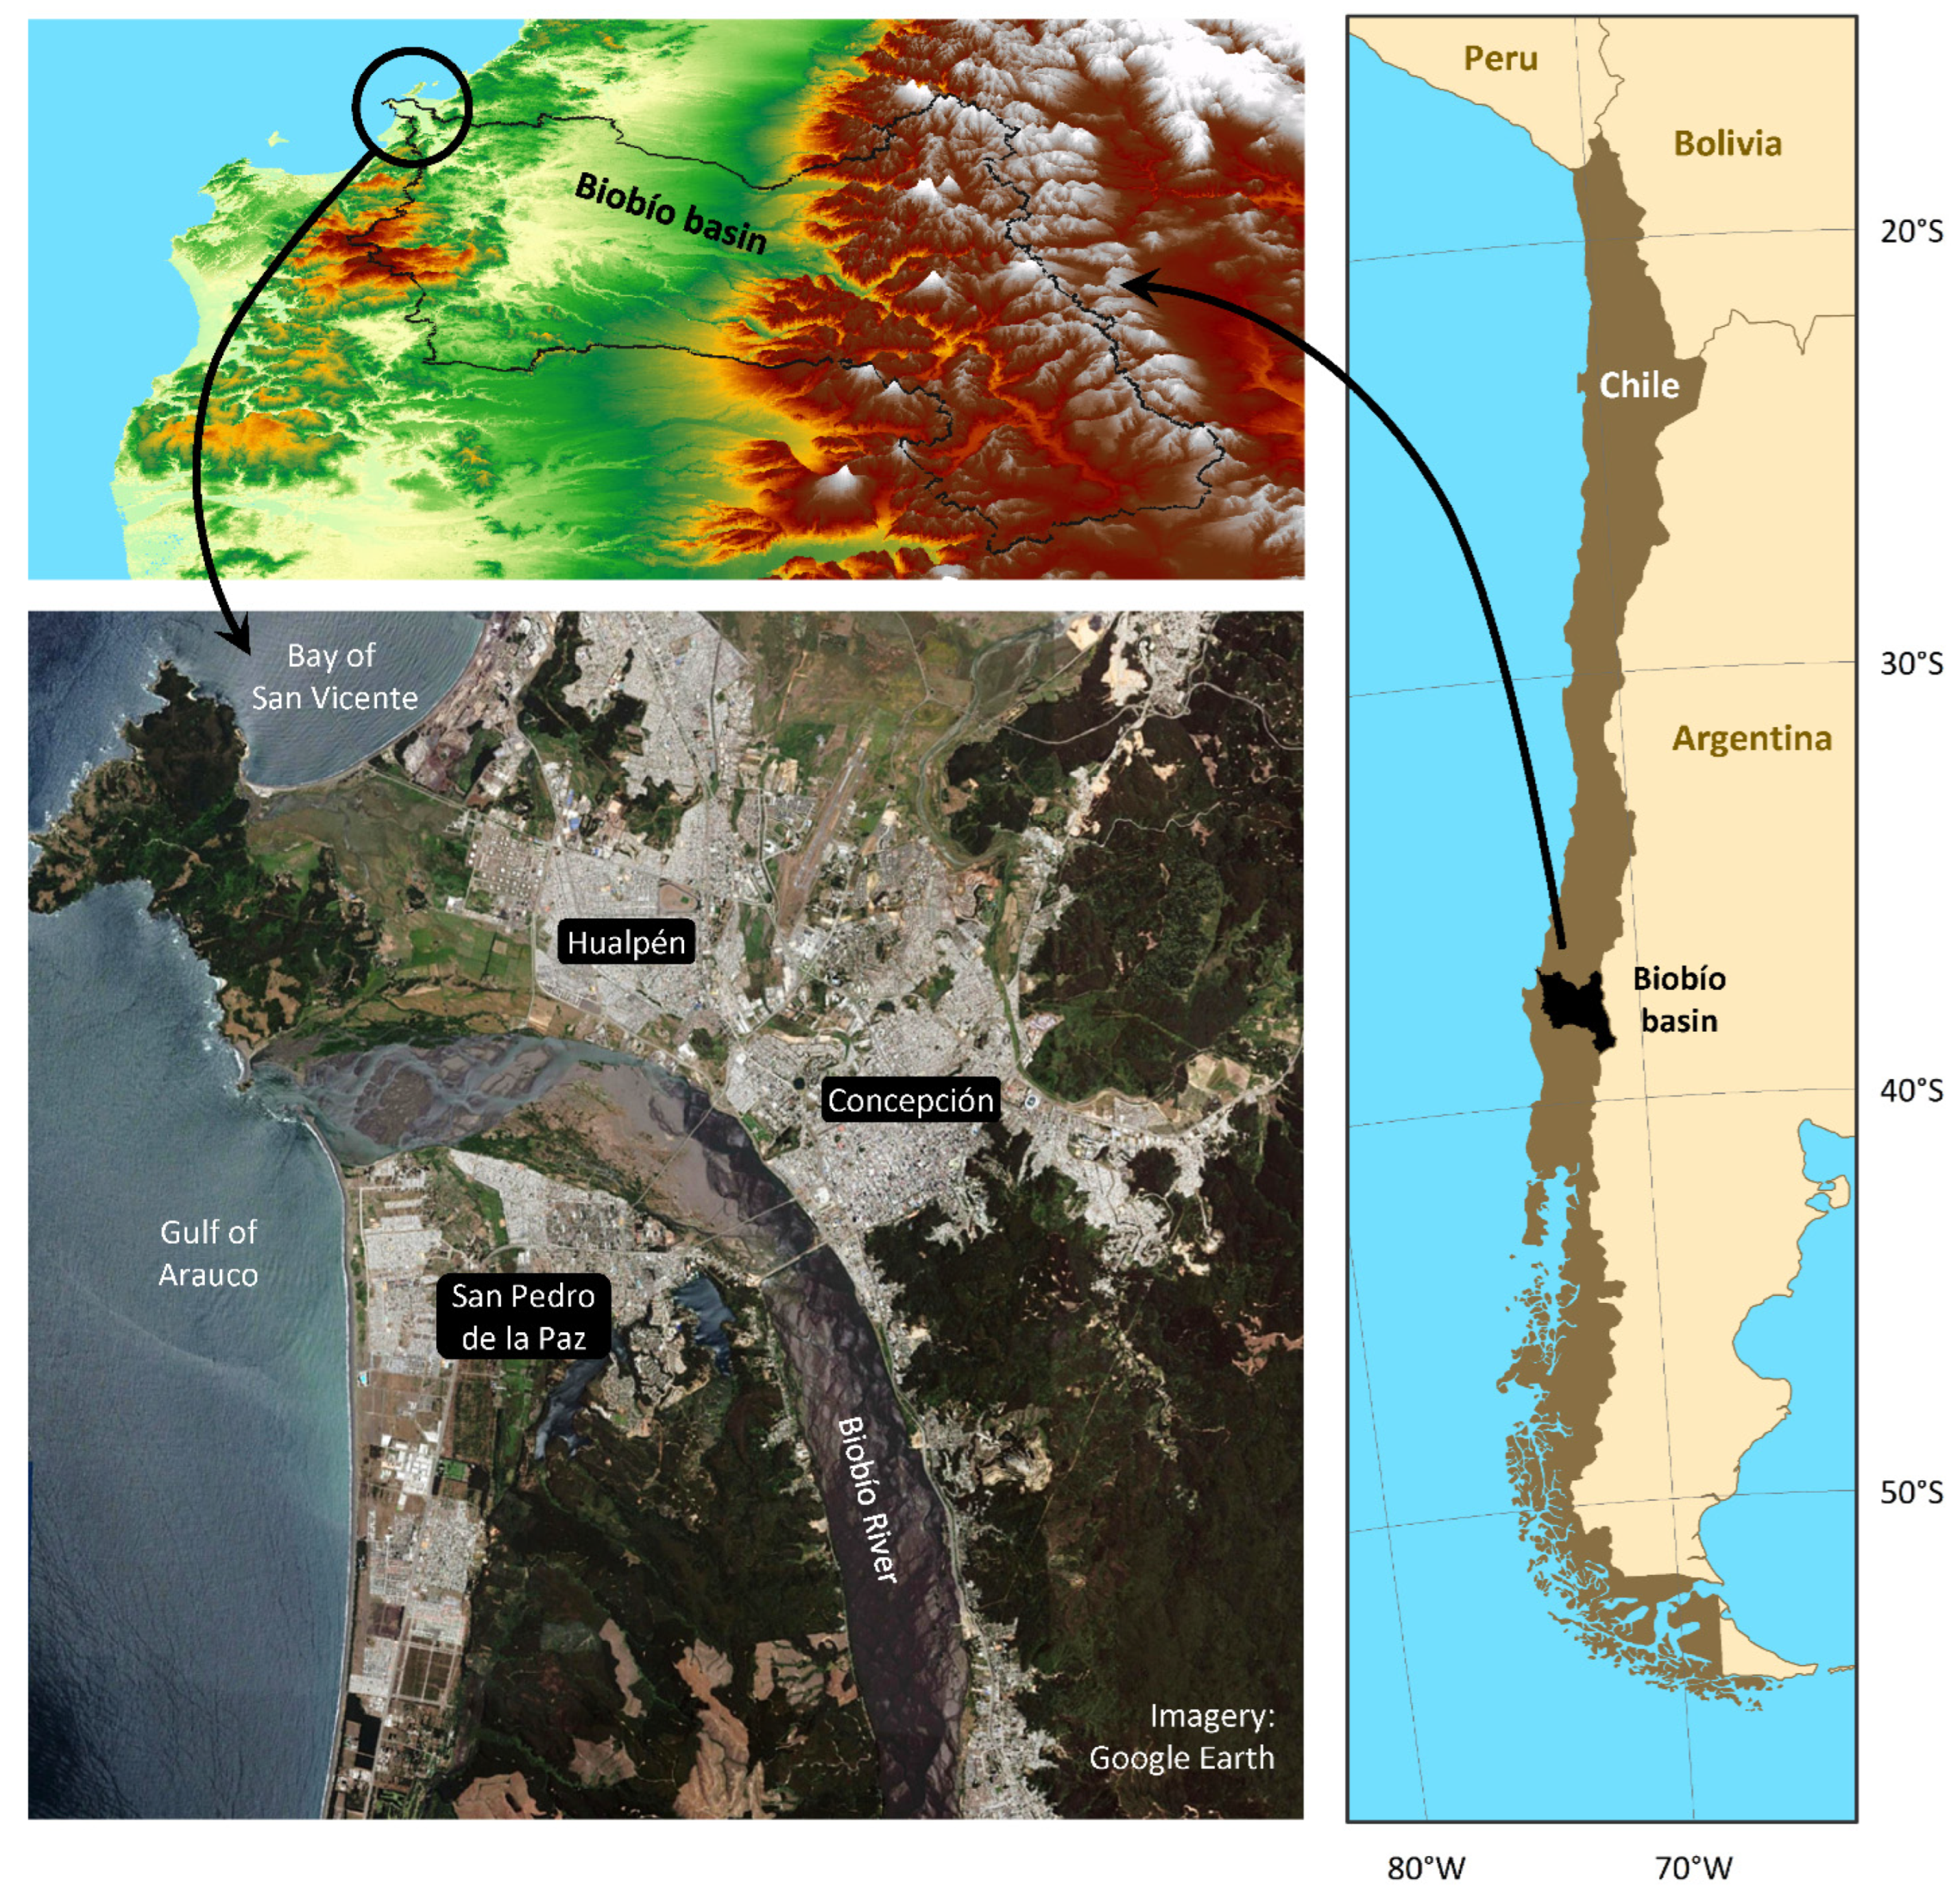
2.1. Study Area
2.2. Hydrodynamic Model
2.3. Model Boundary Conditions
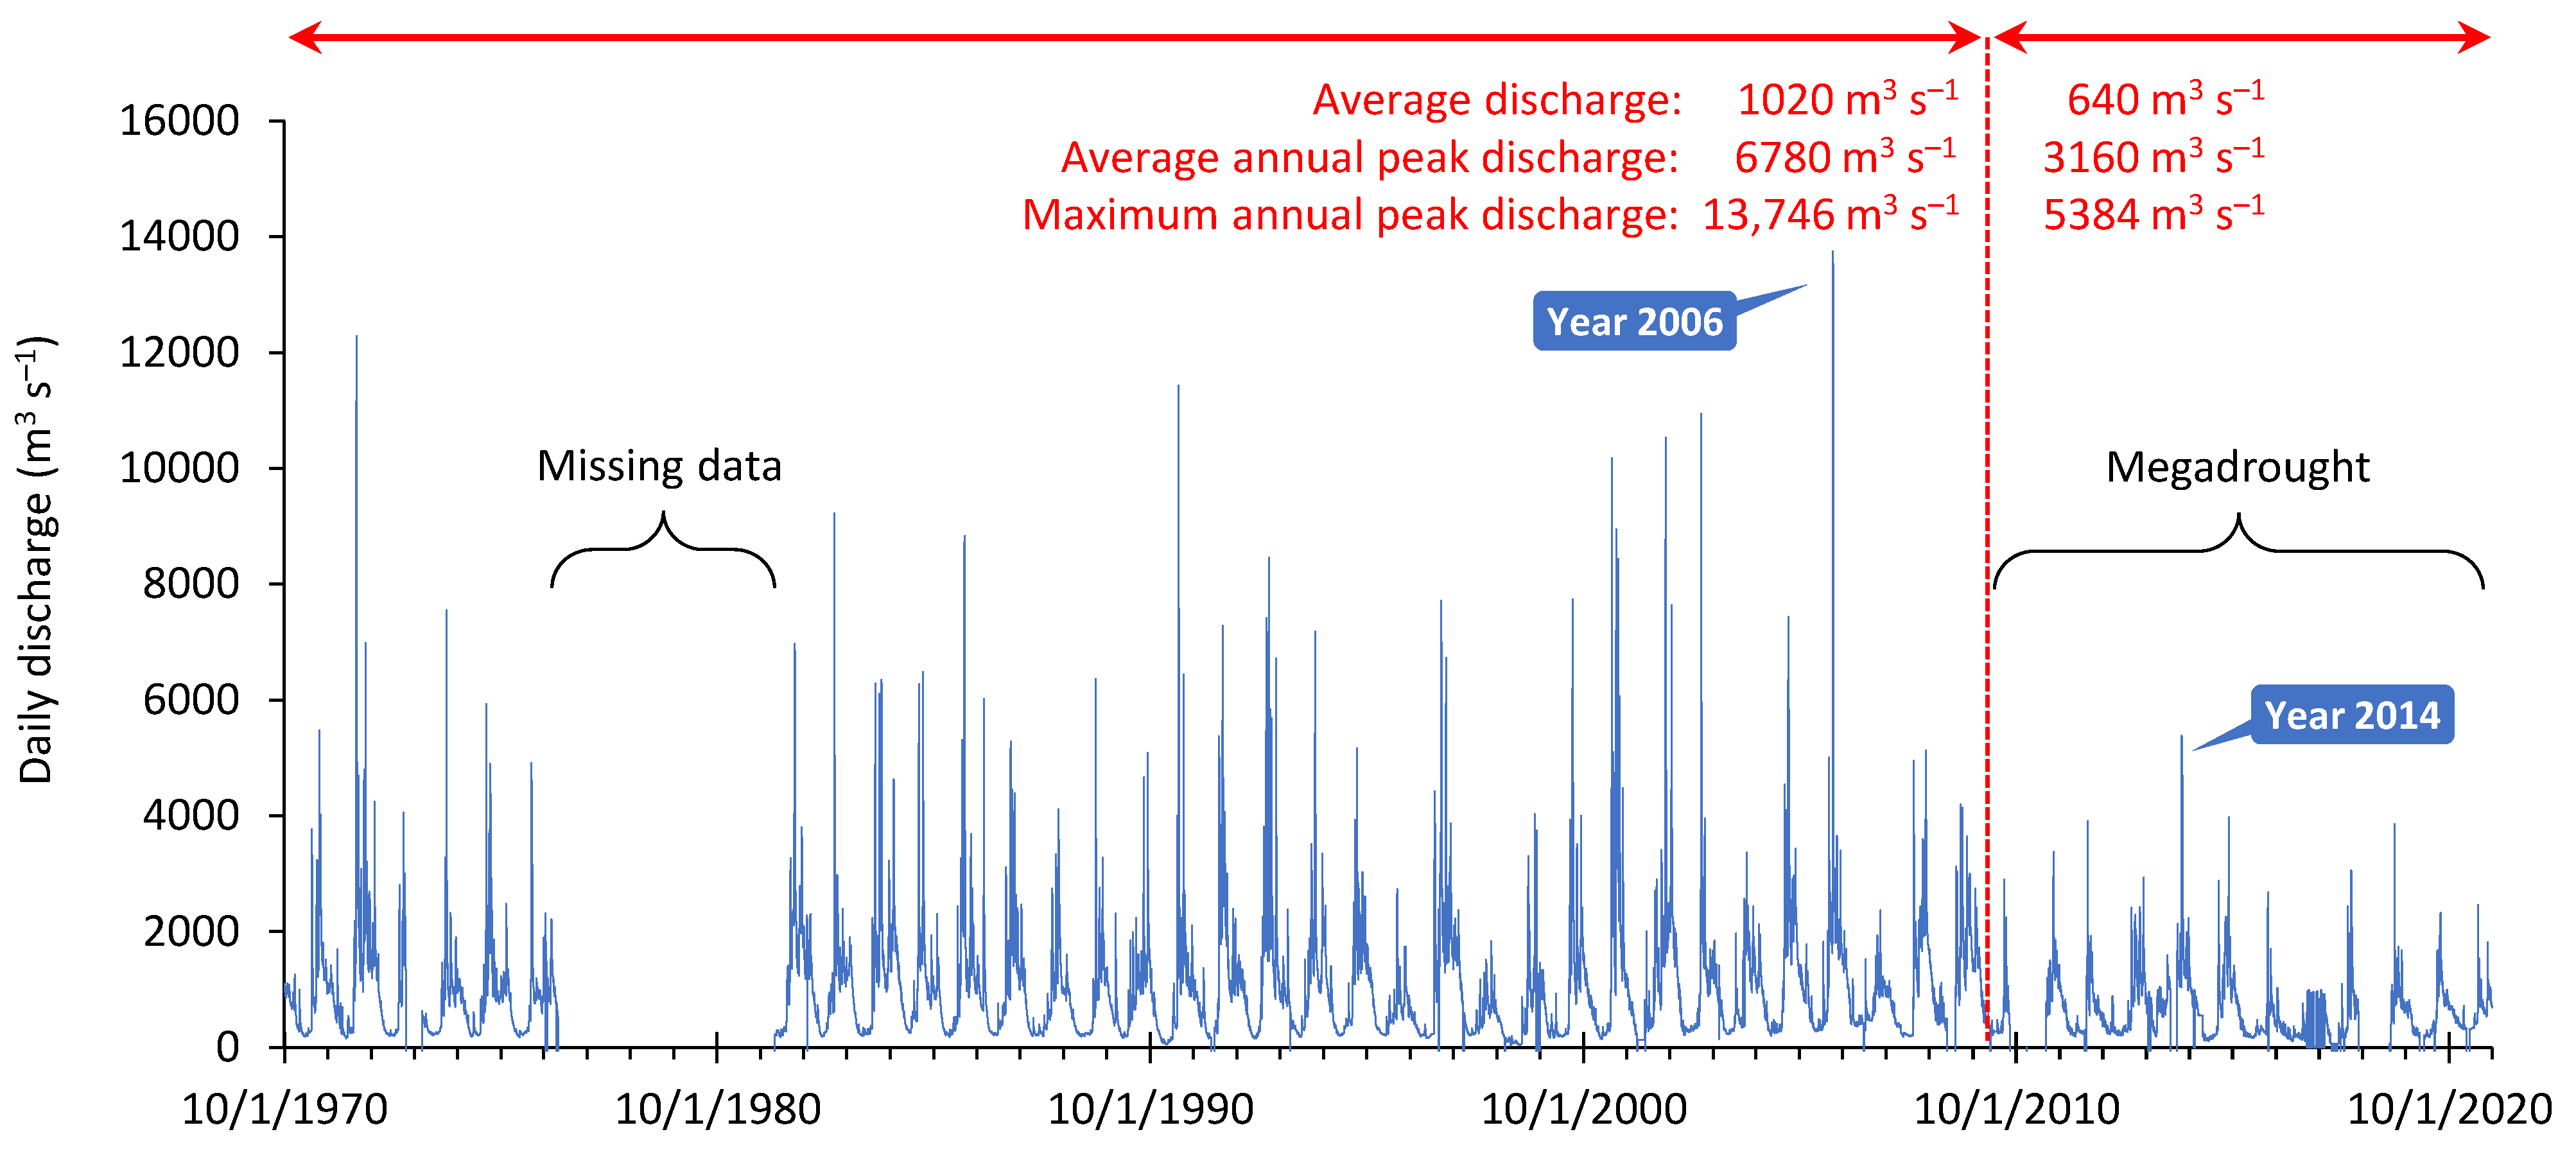
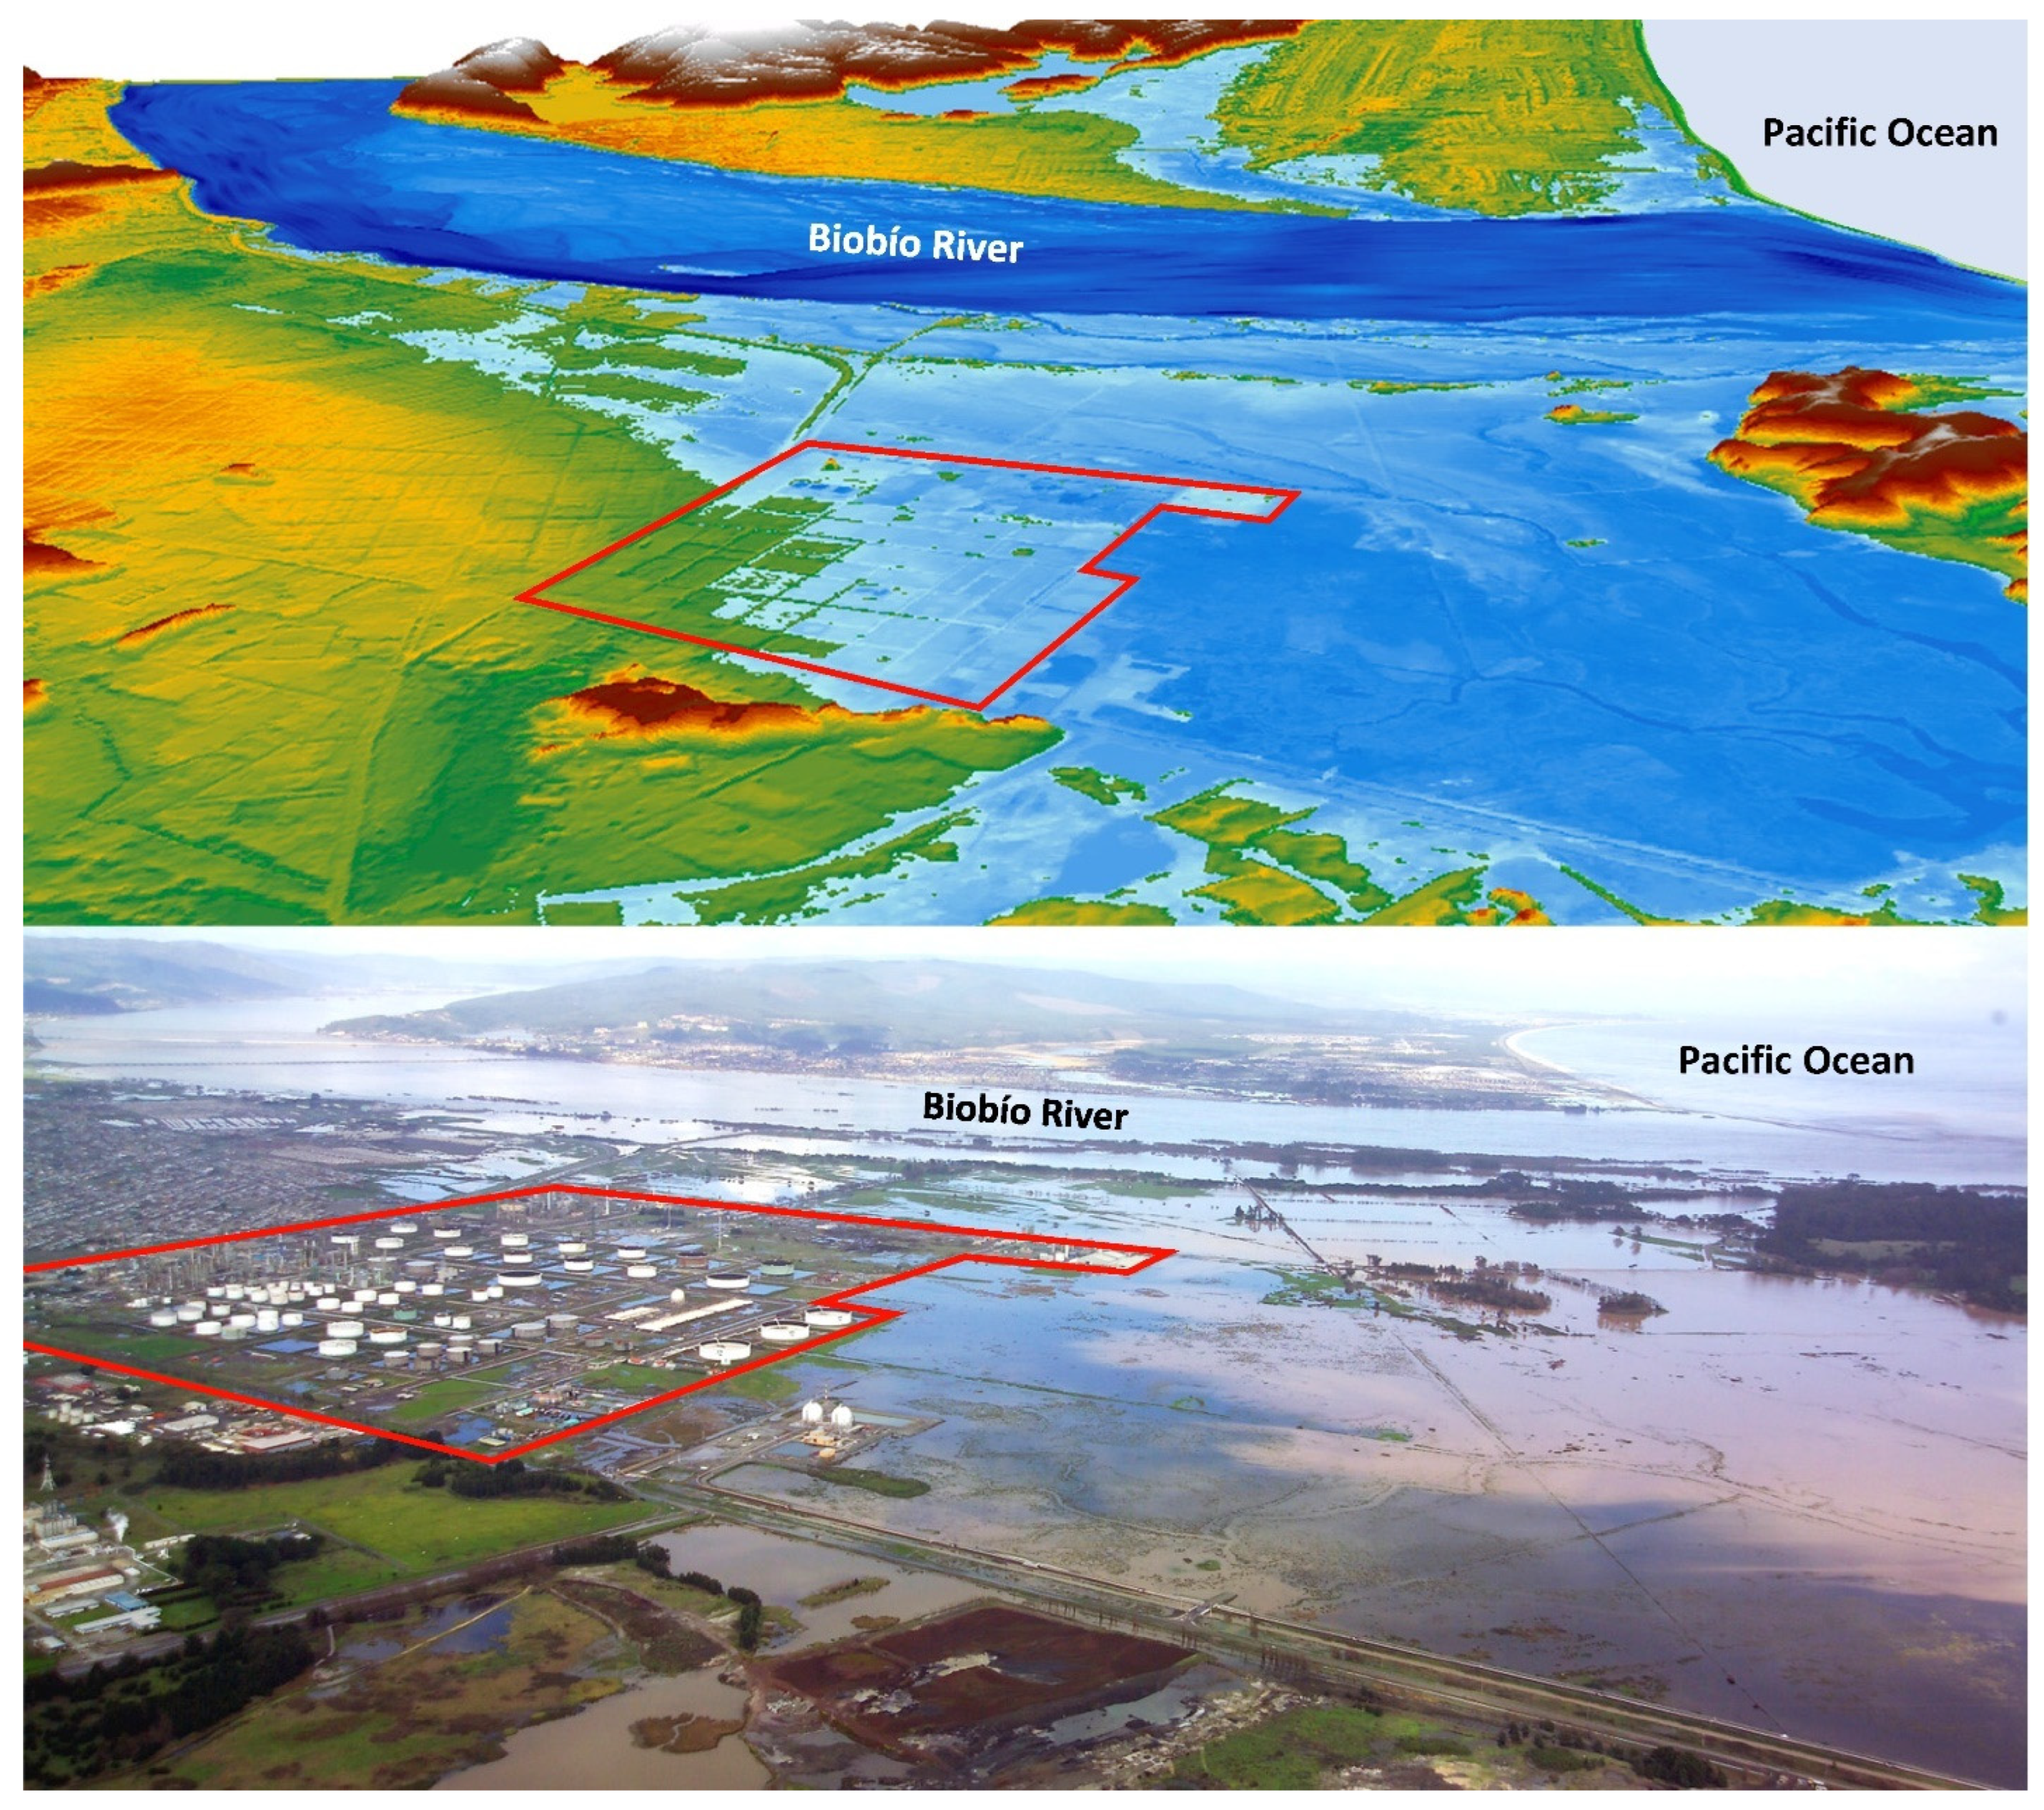
2.4. Comparison of Simulated and Observed Flood Extent for the July 2006 Flood
3. Model Scenarios
3.1. Sea Level Rise
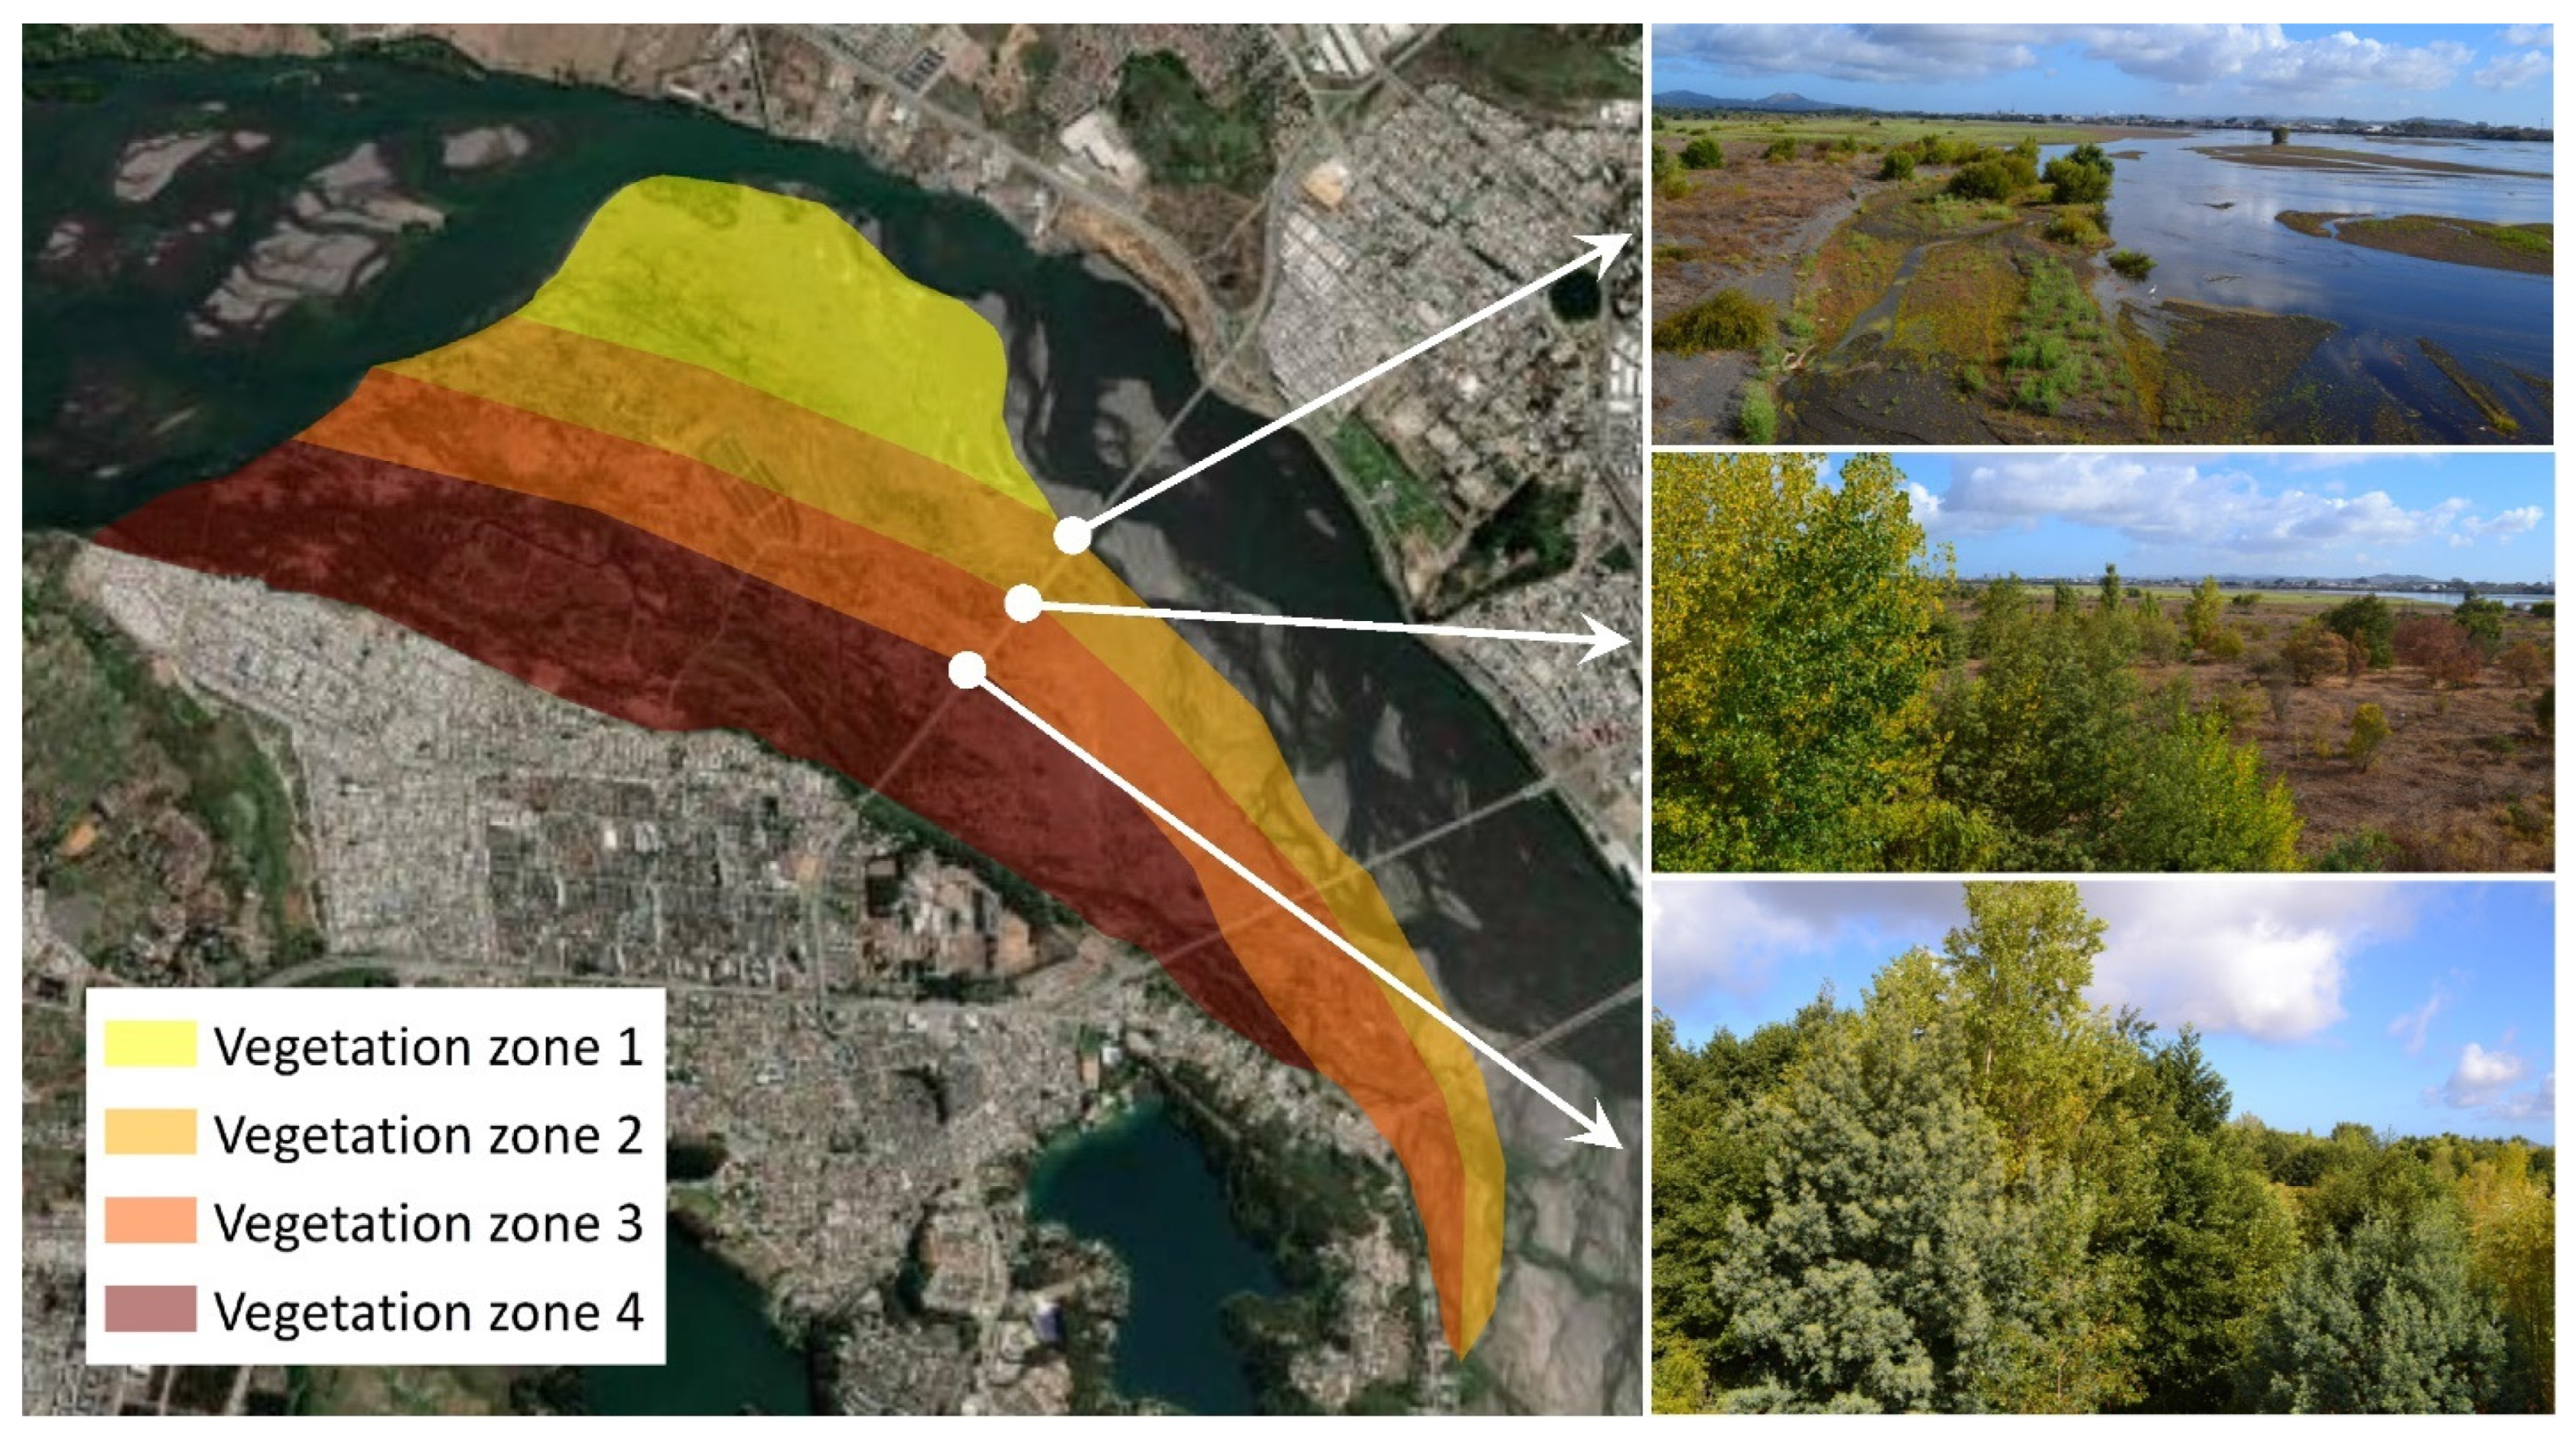
3.2. Change in Riparian Vegetation
3.3. Increase in Discharge
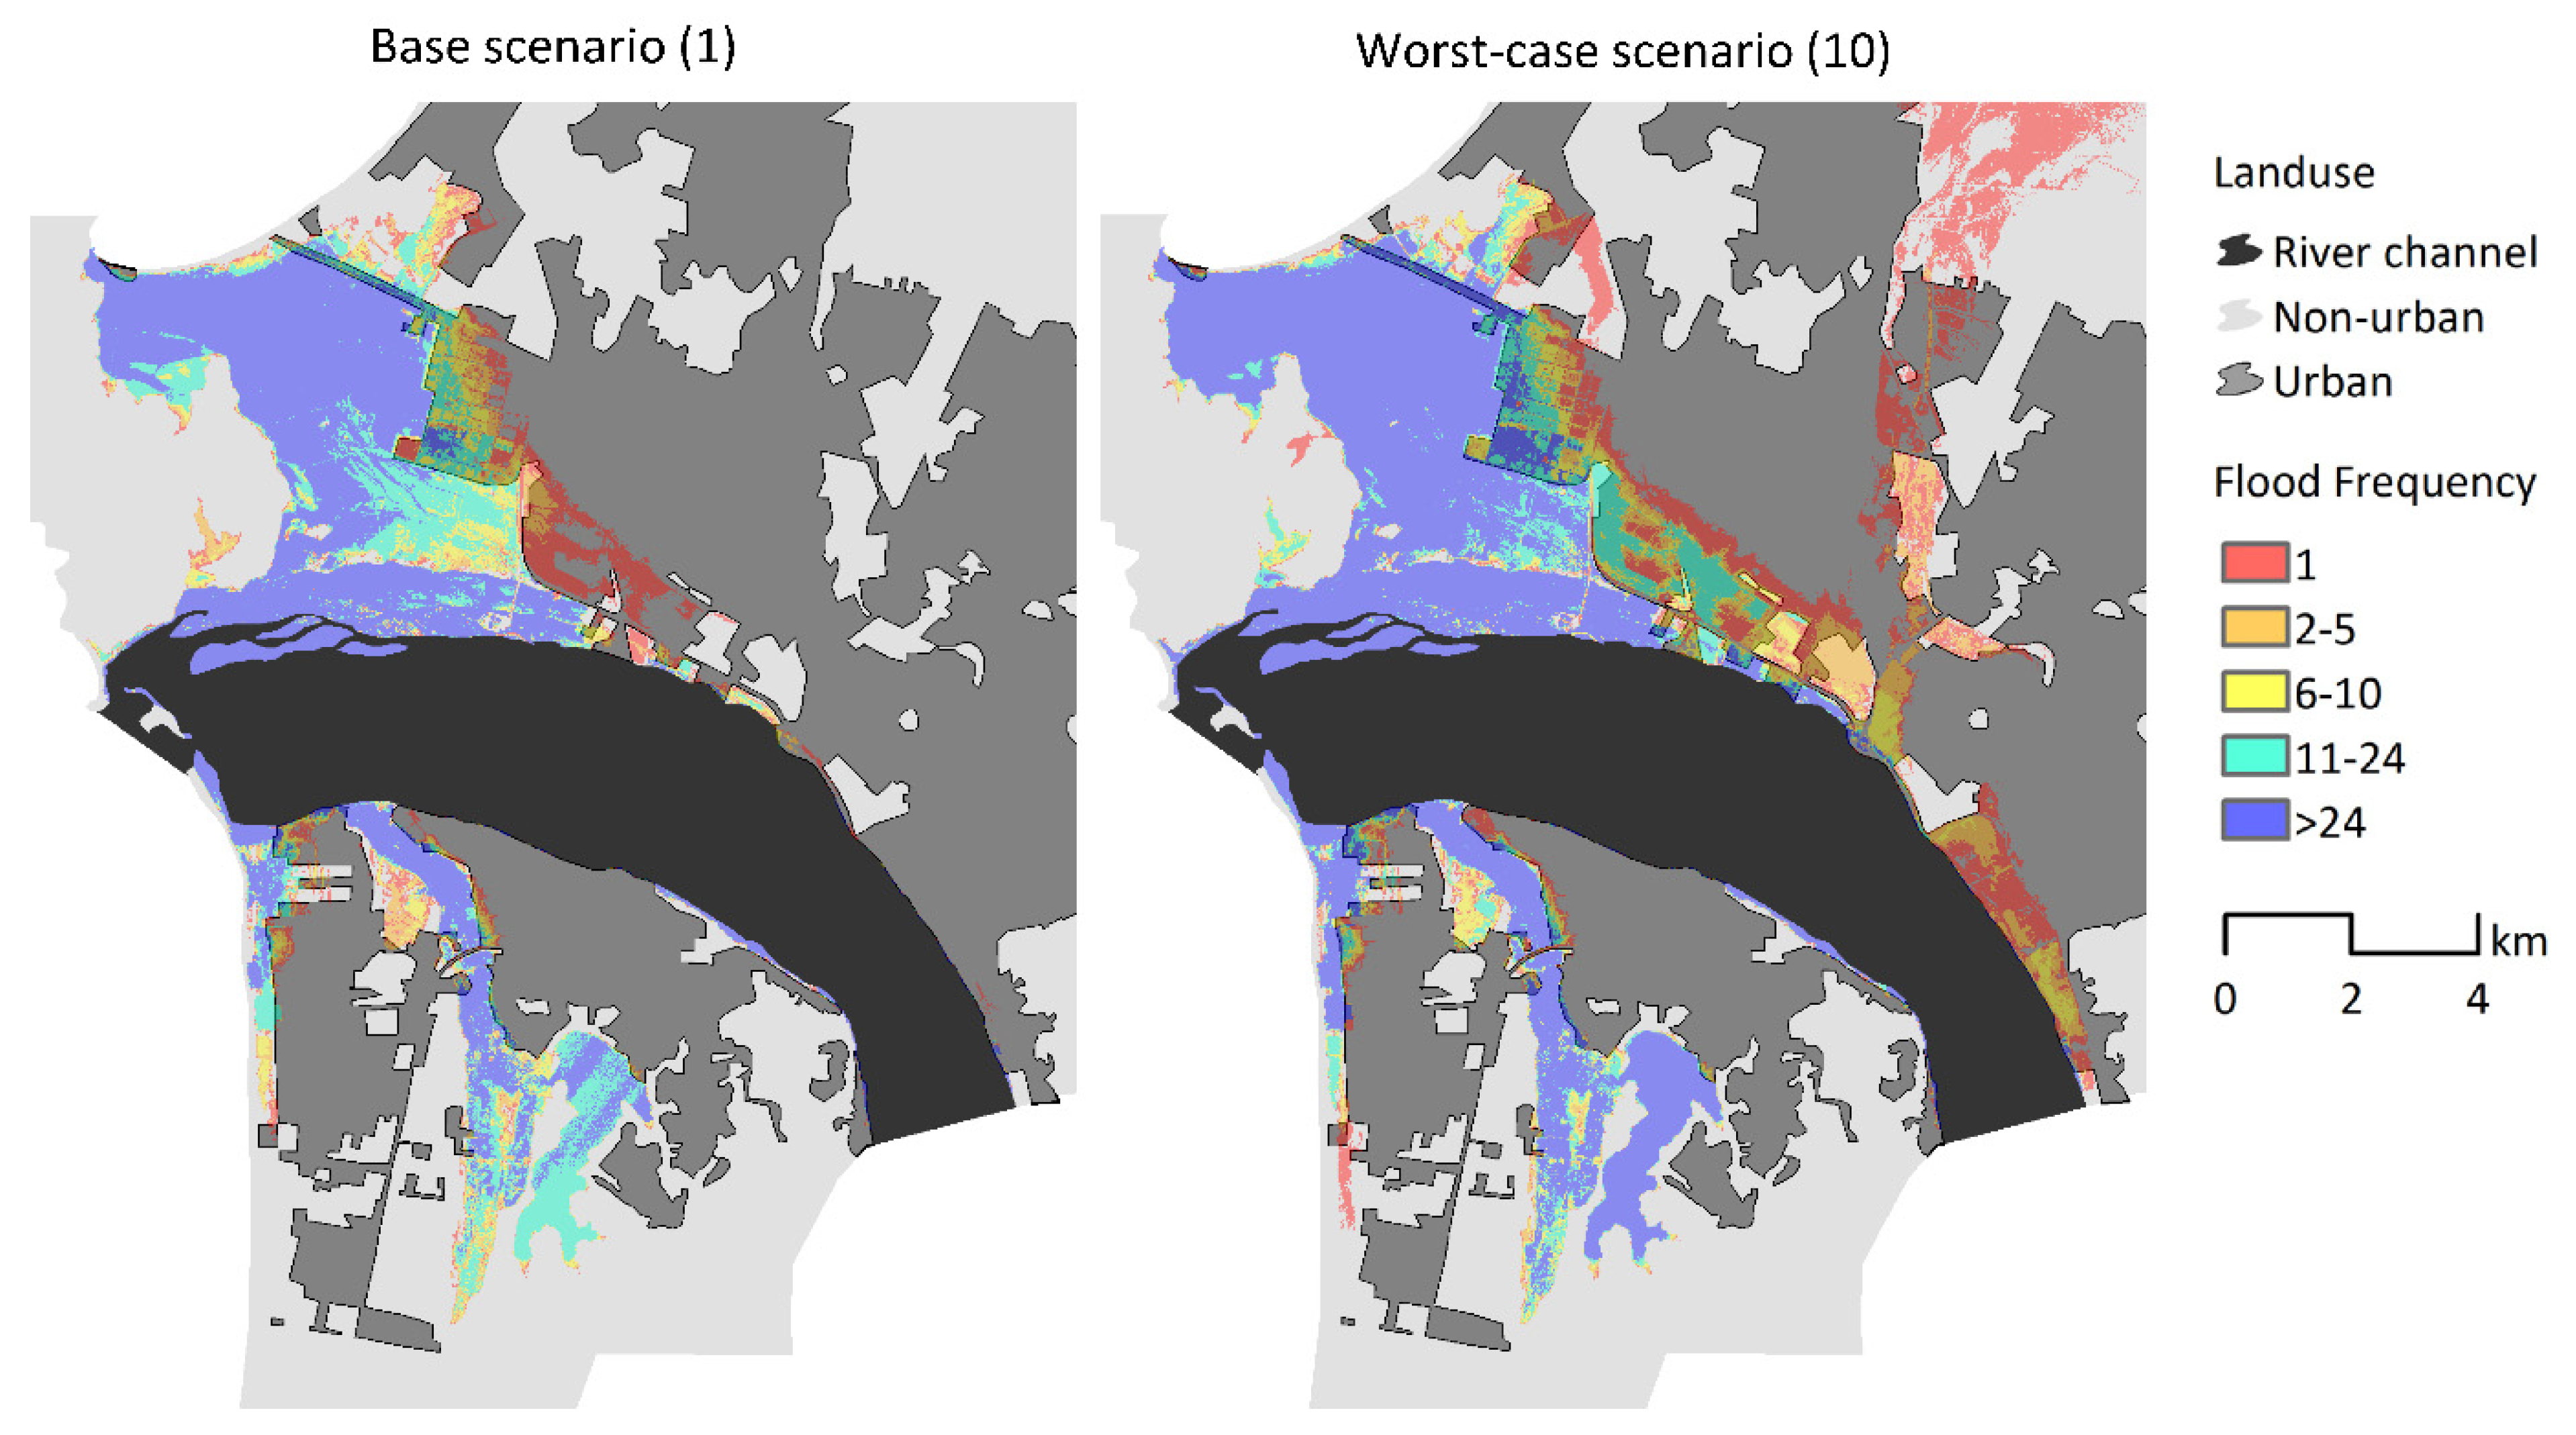
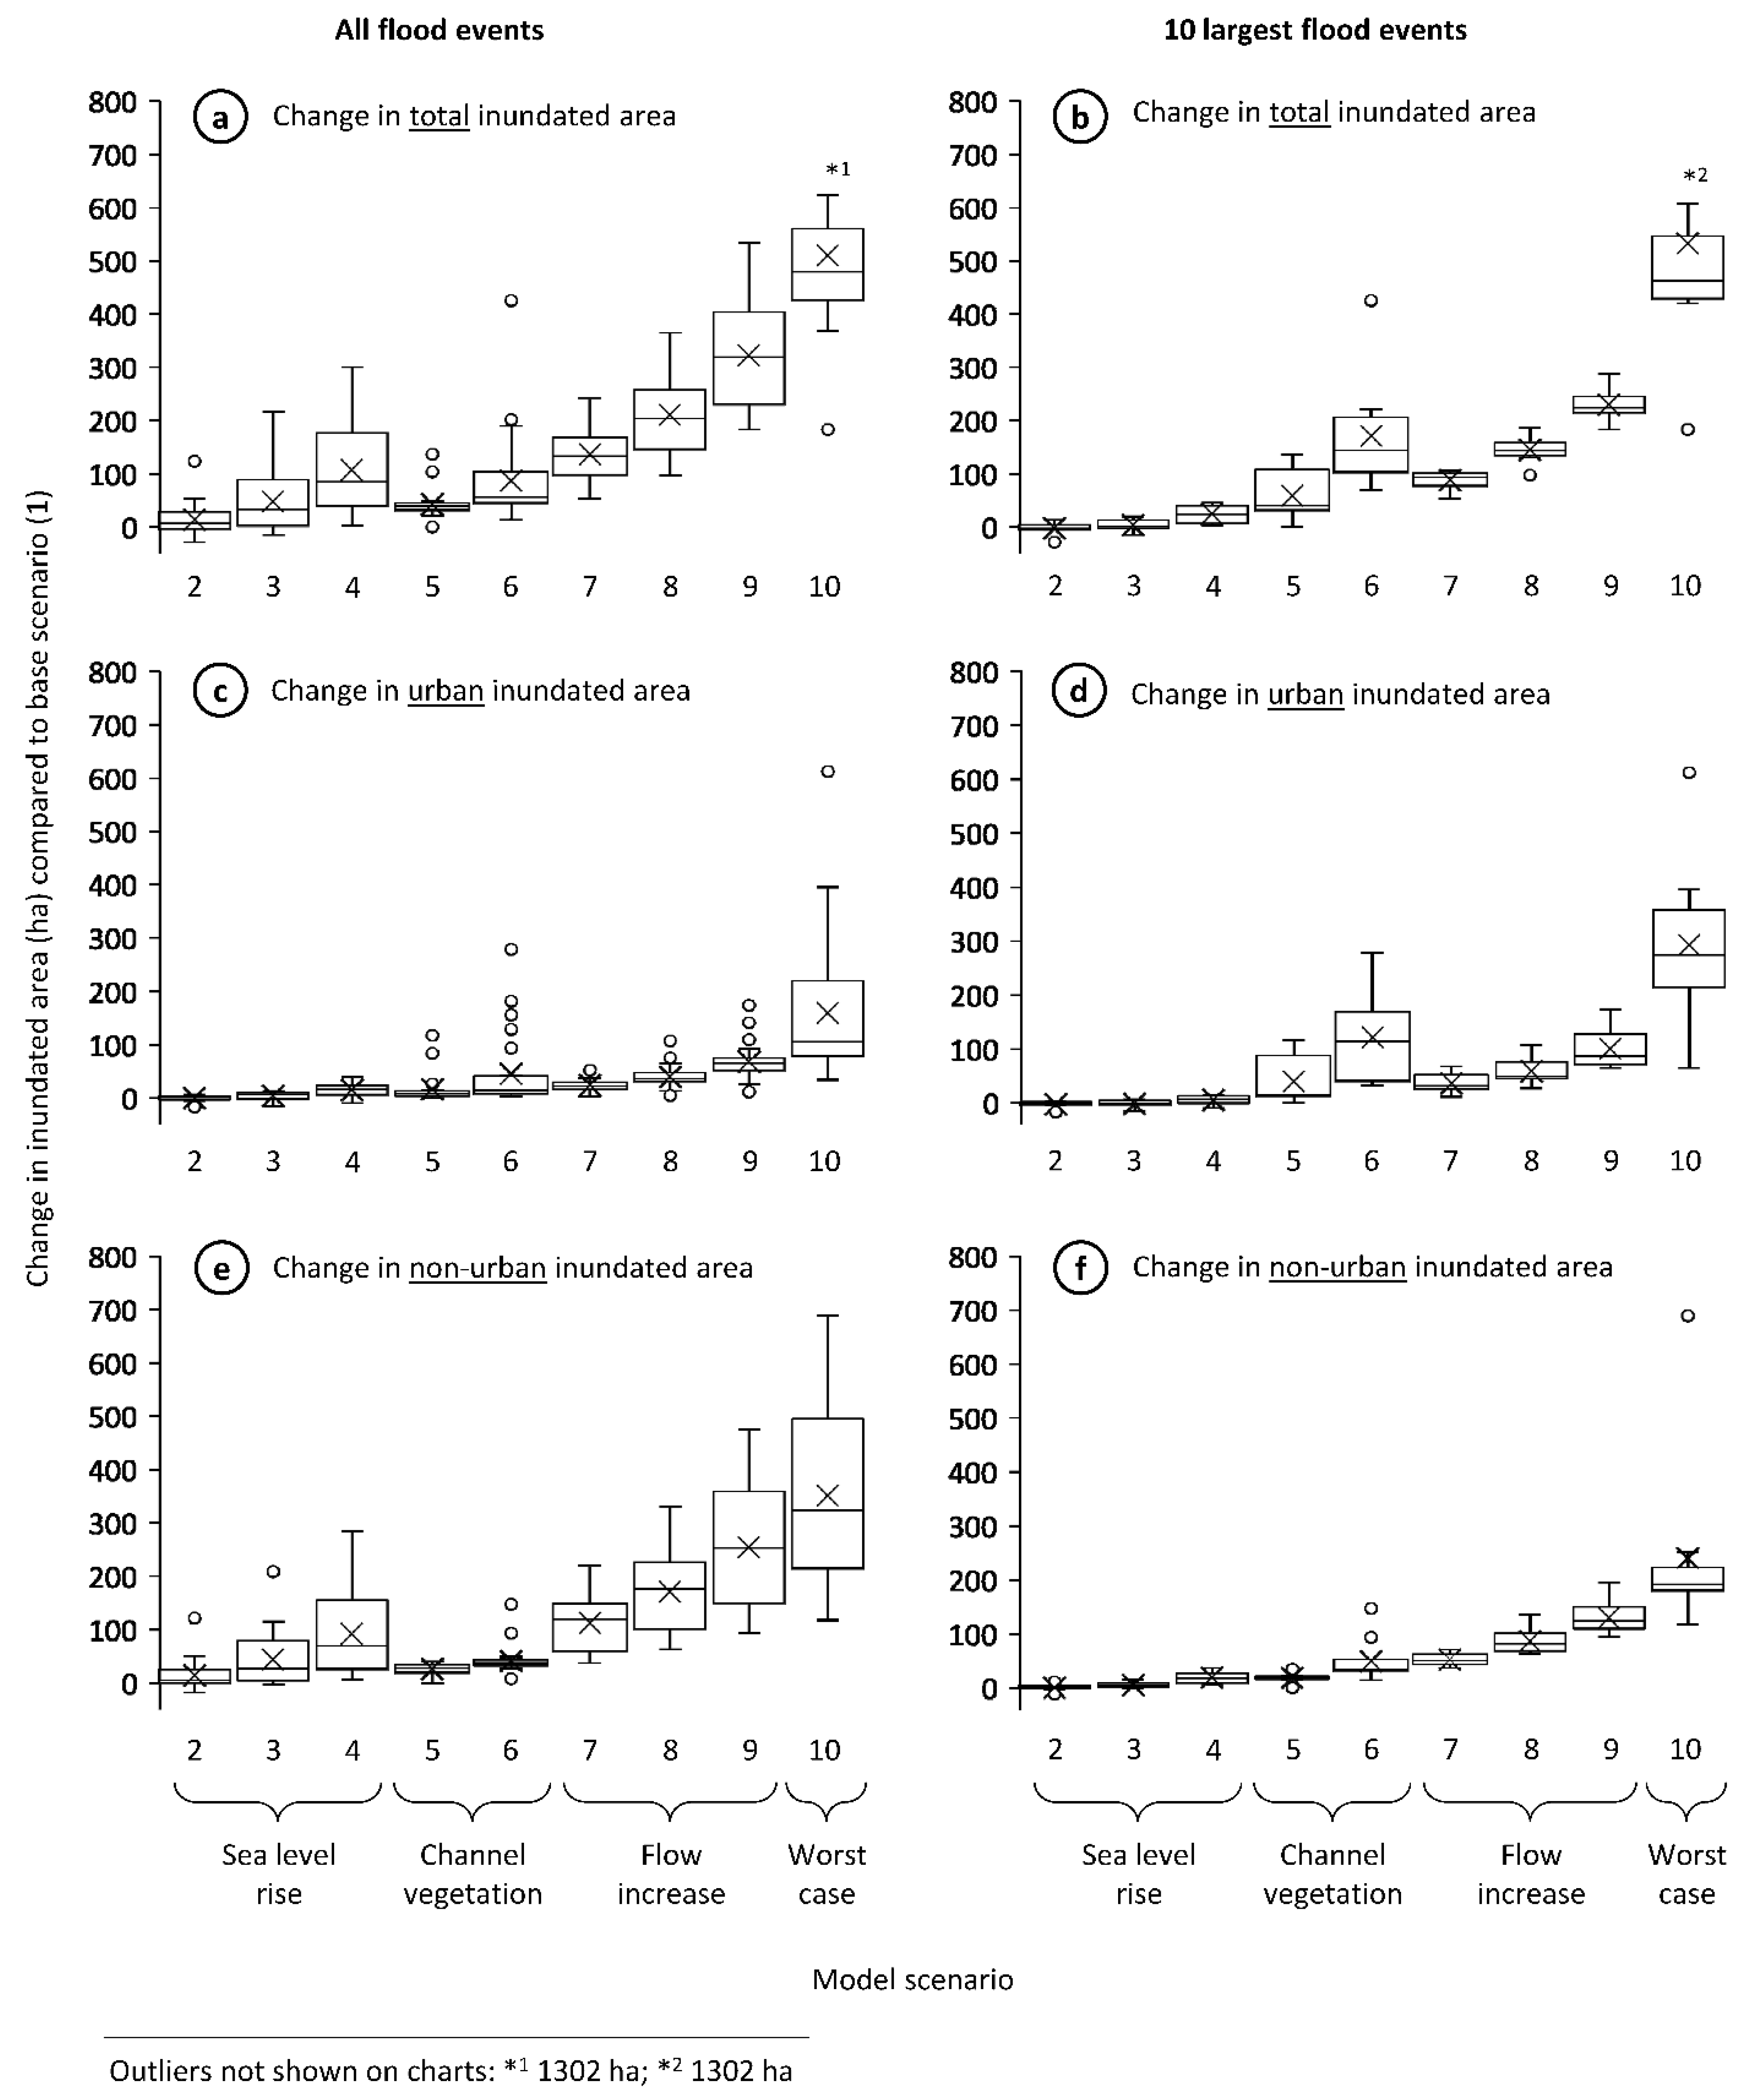
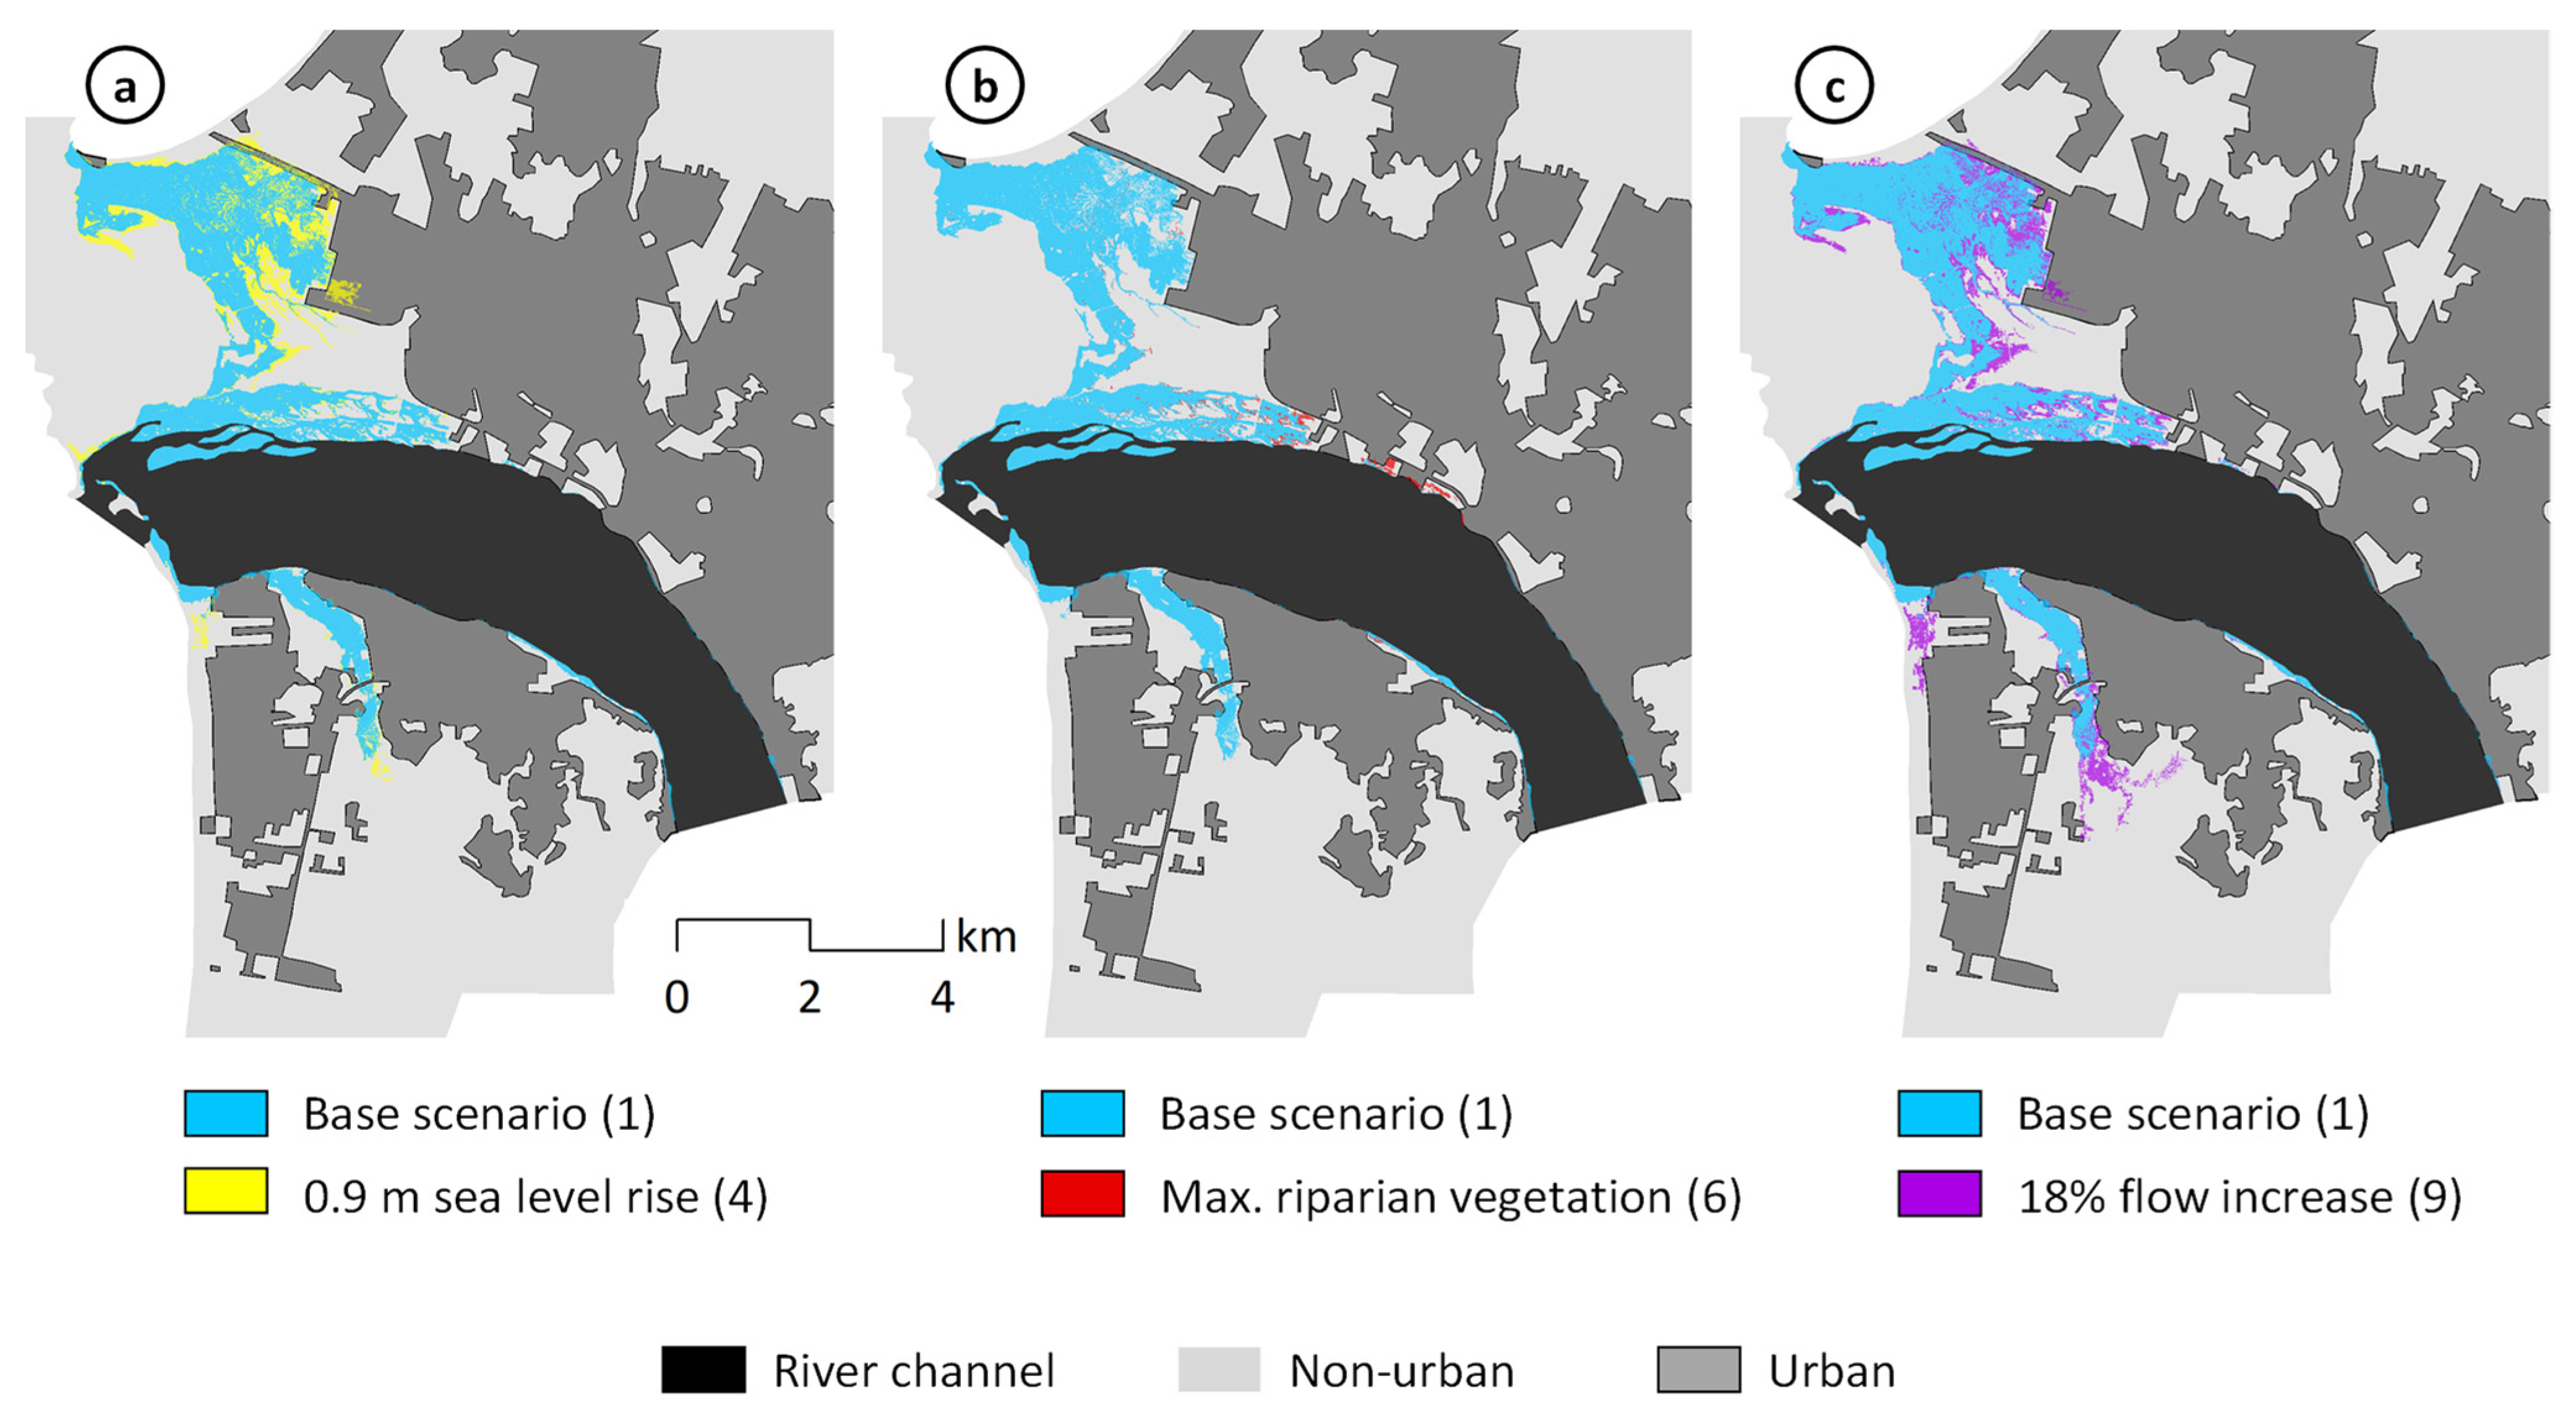
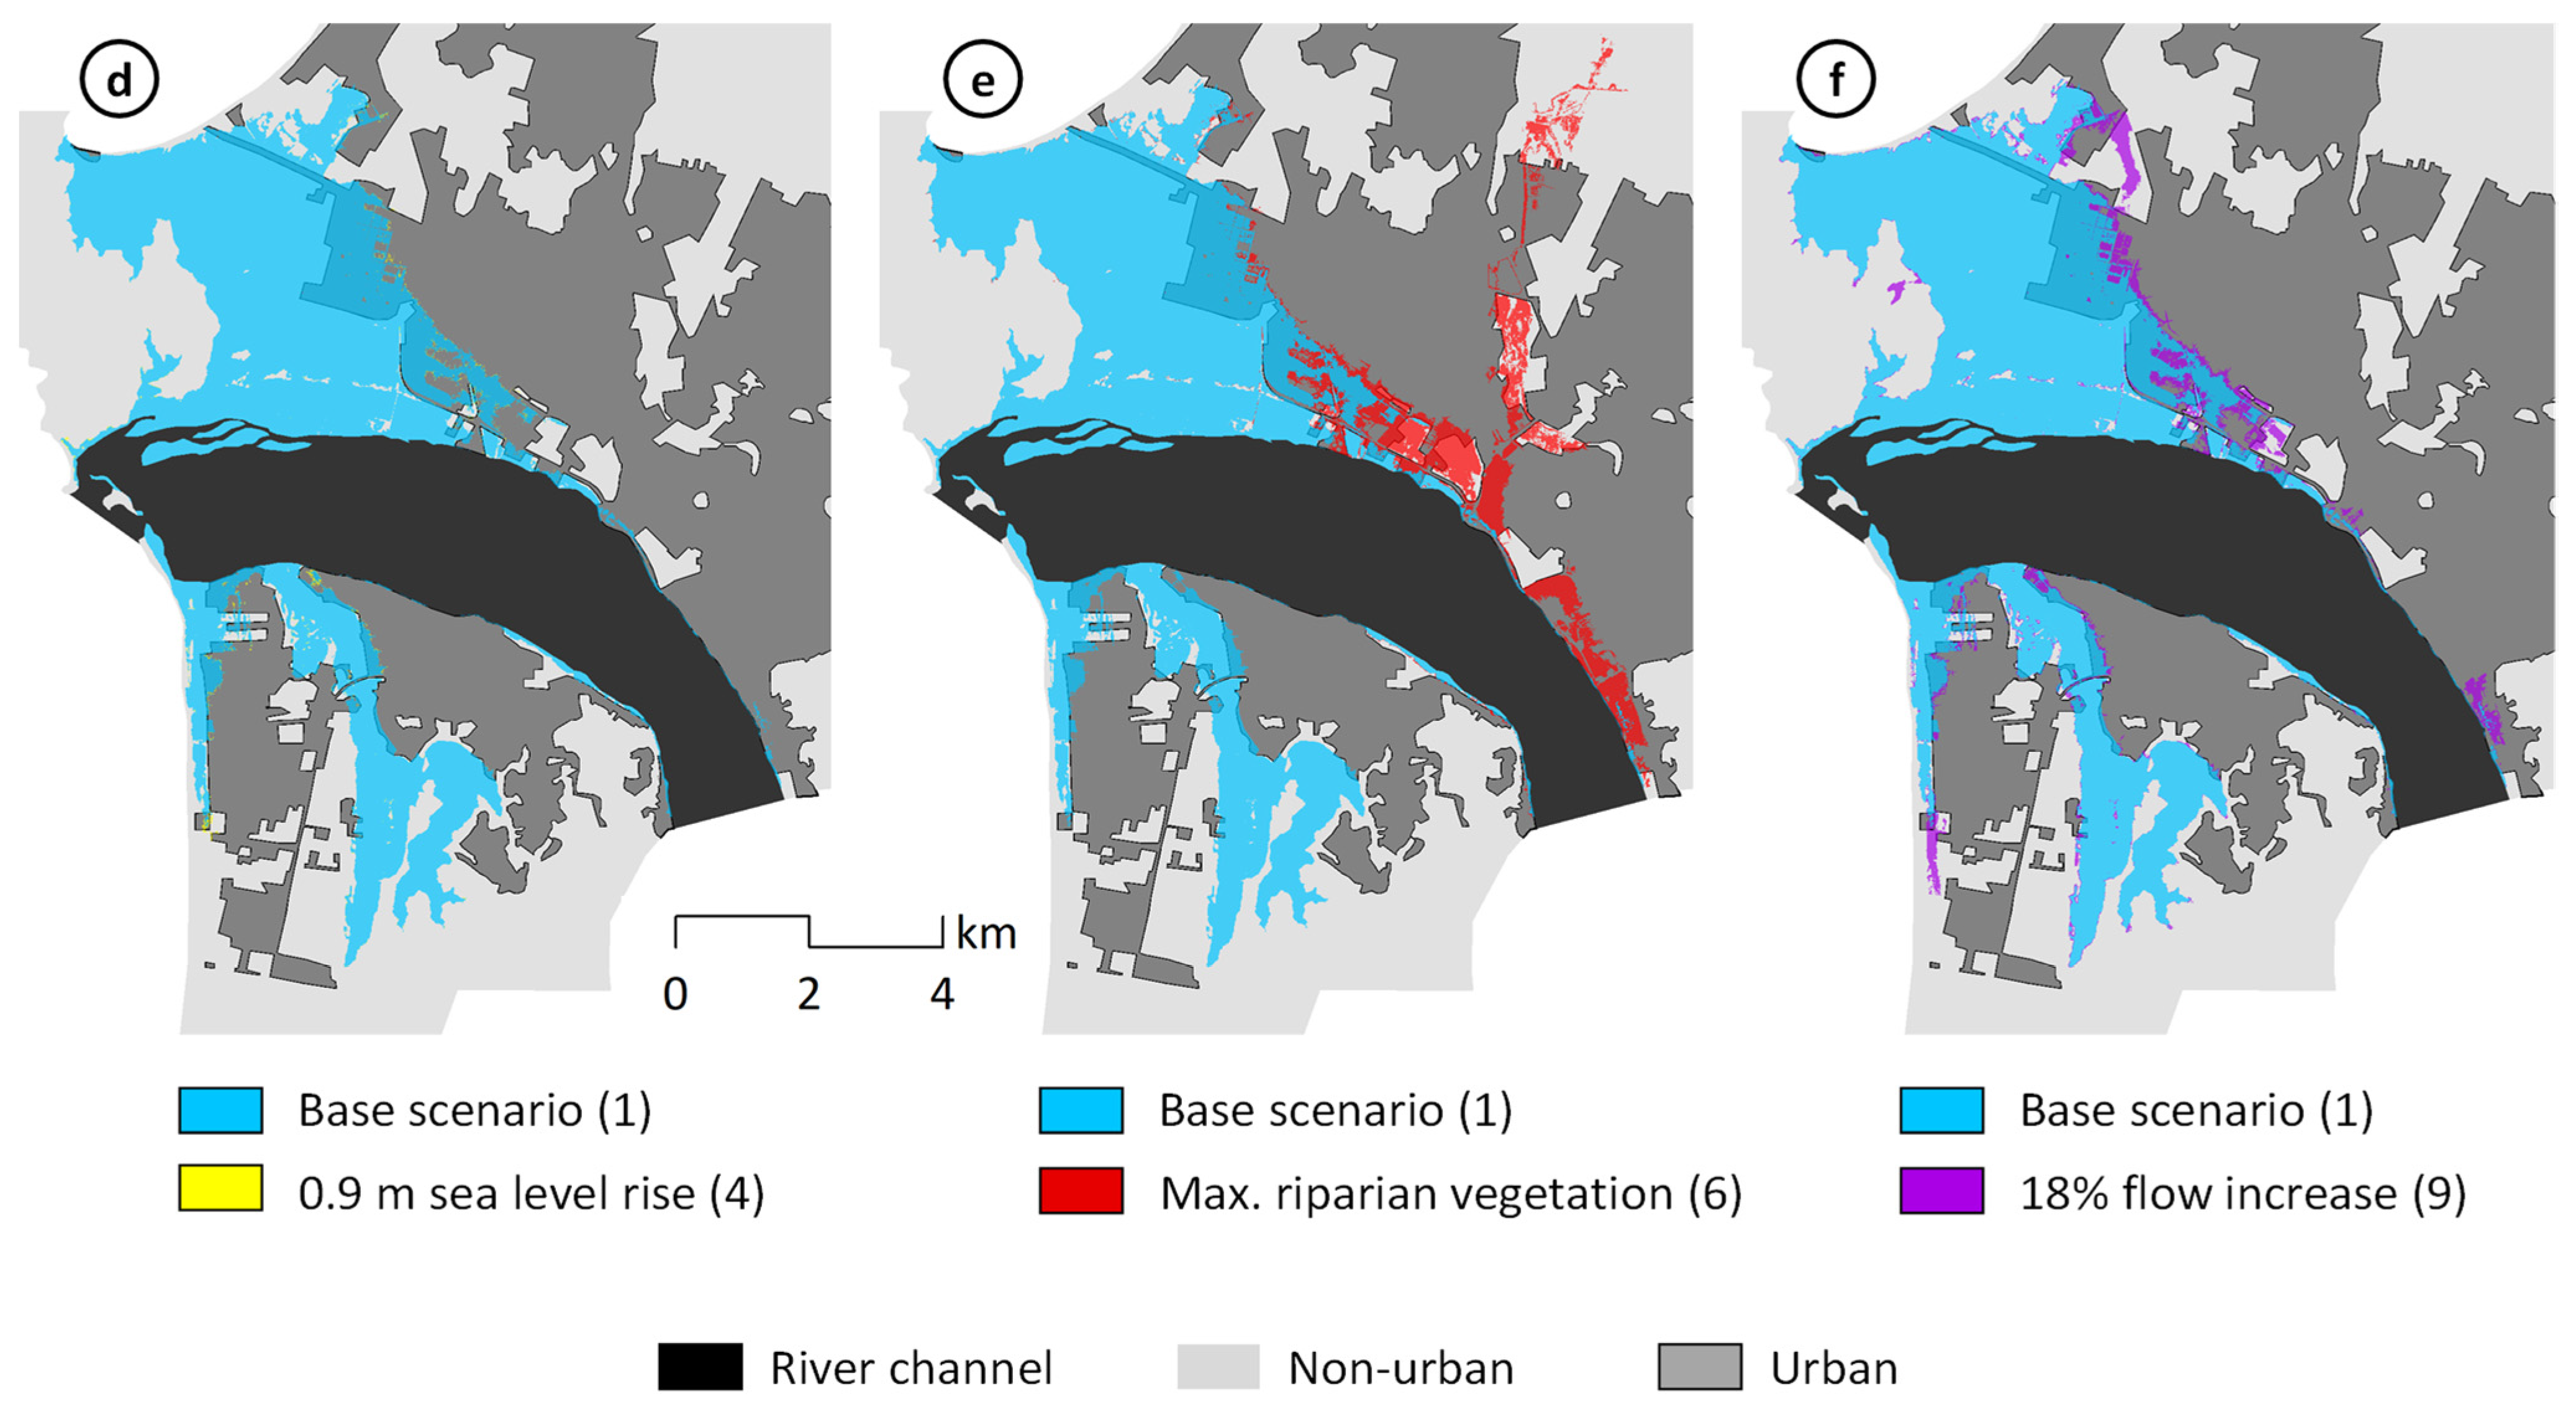
4. Results
5. Discussion
6. Conclusions
Supplementary Materials
Author Contributions
Funding
Institutional Review Board Statement
Informed Consent Statement
Data Availability Statement
Acknowledgments
Conflicts of Interest
References
- CRED. Centre for Research on the Epidemiology of Disasters (CRED). EM-DAT: The International Disaster Database. Université Catholique de Louvain, Brussels, Belgium. 2022. Available online: https://www.emdat.be/ (accessed on 13 April 2022).
- United Nations Office for Disaster Risk Reduction (UNDRR). The Human Cost of Disasters: An Overview of the Last 20 Years (2000–2019); UNDRR: Geneva, Switzerland, 2020. [Google Scholar]
- Kundzewicz, Z.W.; Su, B.; Wang, Y.; Wang, G.; Wang, G.; Huang, J.; Jiang, T. Flood risk in a range of spatial perspectives—from global to local scales. Nat. Hazards Earth Syst. Sci. 2019, 19, 1319–1328. [Google Scholar] [CrossRef] [Green Version]
- Tanoue, M.; Hirabayashi, Y.; Ikeuchi, H. Global-scale river flood vulnerability in the last 50 years. Sci. Rep. 2016, 6, 36021. [Google Scholar] [CrossRef] [Green Version]
- Bermúdez, M.; Farfán, J.F.; Willems, P.; Cea, L. Assessing the Effects of Climate Change on Compound Flooding in Coastal River Areas. Water Resour. Res. 2021, 57, e2020WR029321. [Google Scholar] [CrossRef]
- Bevacqua, E.; Maraun, D.; Vousdoukas, M.I.; Voukouvalas, E.; Vrac, M.; Mentaschi, L.; Widmann, M. Higher probability of compound flooding from precipitation and storm surge in Europe under anthropogenic climate change. Sci. Adv. 2019, 5, eaaw5531. [Google Scholar] [CrossRef] [Green Version]
- Koks, E.E.; Jongman, B.; Husby, T.G.; Botzen, W.J. Combining hazard, exposure and social vulnerability to provide lessons for flood risk management. Environ. Sci. Policy 2015, 47, 42–52. [Google Scholar] [CrossRef]
- Barnard, P.L.; Erikson, L.H.; Foxgrover, A.C.; Hart, J.A.F.; Limber, P.; O’Neill, A.C.; Van Ormondt, M.; Vitousek, S.; Wood, N.; Hayden, M.K.; et al. Dynamic flood modeling essential to assess the coastal impacts of climate change. Sci. Rep. 2019, 9, 4309. [Google Scholar] [CrossRef] [Green Version]
- Kumbier, K.; Carvalho, R.C.; Vafeidis, A.T.; Woodroffe, C.D. Investigating compound flooding in an estuary using hydrodynamic modelling: A case study from the Shoalhaven River, Australia. Nat. Hazards Earth Syst. Sci. 2018, 18, 463–477. [Google Scholar] [CrossRef] [Green Version]
- Solari, L.; Van Oorschot, M.; Belletti, B.; Hendriks, D.; Rinaldi, M.; Vargas-Luna, A. Advances on modelling riparian vegetation—hydromorphology interactions. River Res. Appl. 2016, 32, 164–178. [Google Scholar] [CrossRef]
- Diehl, R.M.; Wilcox, A.C.; Stella, J.C. Evaluation of the integrated riparian ecosystem response to future flow regimes on semiarid rivers in Colorado, USA. J. Environ. Manag. 2020, 271, 111037. [Google Scholar] [CrossRef]
- Diehl, R.M.; Wilcox, A.C.; Merritt, D.M.; Perkins, D.W.; Scott, J.A. Development of an eco-geomorphic modeling framework to evaluate riparian ecosystem response to flow-regime changes. Ecol. Eng. 2018, 123, 112–126. [Google Scholar] [CrossRef]
- Durning, L.E.; Sankey, J.B.; Yackulic, C.B.; Grams, P.E.; Butterfield, B.J.; Sankey, T.T. Hydrologic and geomorphic effects on riparian plant species occurrence and encroachment: Remote sensing of 360 km of the Colorado River in Grand Canyon. Ecohydrology 2021, 14, e2344. [Google Scholar] [CrossRef]
- Webb, R.H.; Leake, S.A.; Turner, R.M. The Ribbon of Green: Change in Riparian Vegetation in the South-Western United States; University of Arizona Press: Tucson, AZ, USA, 2007. [Google Scholar]
- Darby, S.E. Effect of Riparian Vegetation on Flow Resistance and Flood Potential. J. Hydraul. Eng. 1999, 125, 443–454. [Google Scholar] [CrossRef]
- Wang, C.; Zheng, S.-S.; Wang, P.-F.; Hou, J. Interactions between vegetation, water flow and sediment transport: A review. J. Hydrodyn. 2015, 27, 24–37. [Google Scholar] [CrossRef]
- Kiss, T.; Nagy, J.; Fehérváry, I.; Vaszkó, C. (Mis) management of floodplain vegetation: The effect of invasive species on vegetation roughness and flood levels. Sci. Total Environ. 2019, 686, 931–945. [Google Scholar] [CrossRef]
- Link, O.; Brox-Escudero, L.M.; González, J.; Aguayo, M.; Torrejón, F.; Montalva, G.; Eguibar-Galán, M.Á. A paleo-hydro-geomorphological perspective on urban flood risk assessment. Hydrol. Process. 2019, 33, 3169–3183. [Google Scholar] [CrossRef]
- Garreaud, R. Warm Winter Storms in Central Chile. J. Hydrometeorol. 2013, 14, 1515–1534. [Google Scholar] [CrossRef]
- Lara, A.; Garcia, X.; Bucci, F.; Ribas, A. What do people think about the flood risk? An experience with the residents of Talcahuano city, Chile. Nat. Hazards 2016, 85, 1557–1575. [Google Scholar] [CrossRef] [Green Version]
- Rojas, O.; Mardones, M.; Arumí, J.L.; Aguayo, M. Una revisión de inundaciones fluviales en Chile, período 1574–2012: Causas, recurrencia y efectos geográficos. Rev. Geogr. Norte Gd. 2014, 57, 177–192. [Google Scholar] [CrossRef] [Green Version]
- Rojas, O.; Mardones, M.; Rojas, C.; Martínez, C.; Flores, L. Urban Growth and Flood Disasters in the Coastal River Basin of South-Central Chile (1943–2011). Sustainability 2017, 9, 195. [Google Scholar] [CrossRef] [Green Version]
- Garreaud, R.D.; Boisier, J.P.; Rondanelli, R.; Montecinos, A.; Sepúlveda, H.H.; Veloso-Aguila, D. The Central Chile Mega Drought (2010–2018): A climate dynamics perspective. Int. J. Clim. 2019, 40, 421–439. [Google Scholar] [CrossRef]
- Farooq, M.; Shafique, M.; Khattak, M.S. Flood hazard assessment and mapping of River Swat using HEC-RAS 2D model and high-resolution 12-m TanDEM-X DEM (WorldDEM). Nat. Hazards 2019, 97, 477–492. [Google Scholar] [CrossRef]
- Ghimire, E.; Sharma, S. Flood Damage Assessment in HAZUS Using Various Resolution of Data and One-Dimensional and Two-Dimensional HEC-RAS Depth Grids. Nat. Hazards Rev. 2021, 22, 04020054. [Google Scholar] [CrossRef]
- Rangari, V.A.; Umamahesh, N.V.; Bhatt, C.M. Assessment of inundation risk in urban floods using HEC RAS 2D. Model. Earth Syst. Environ. 2019, 5, 1839–1851. [Google Scholar] [CrossRef]
- Universidad del Biobío. Estudio de Riesgos de Sismos y Maremoto para Comunas Costeras de la Región del Biobío; Subsecretaria de Desarrollo Regional y Administrativo del Ministerio del Interior, Gobierno de Chile/Departamento de Planificación y Diseño Urbano, Laboratorio de Estudios Urbanos, Facultad de Arquitectura, Construcción y Diseño, Universidad del Bío-Bío: Concepción, Chile, 2010. [Google Scholar]
- Ministerio de Obras Públicas (MOP). Reposición Puente Sobre el Río Biobío; Ministerio de Obras Públicas (MOP): San Pedro de la Paz, Chile, 2011.
- Van Heemst, C.; Willems, J.; Weller, A.; Van Verseveld, H.; Caamaño, D.; Aránguiz, R. Flood defense alternatives for the lower Bío Bío River, Chile. Obras Proyectos 2013, 14, 22–33. [Google Scholar] [CrossRef] [Green Version]
- US Army Corps of Engineers (USACE). HEC-RAS River Analysis System 2D Modeling User’s Manual Version 6.0; Davis, C.A., Ed.; USACE: Washington, DC, USA, 2021.
- IPCC. Climate Change. Impacts, Adaptation, and Vulnerability. In Contribution of Working Group II to the Sixth Assessment Report of the Intergovernmental Panel on Climate Change; Pörtner, H.-O., Roberts, D.C., Tignor, M., Poloczanska, E.S., Mintenbeck, K., Alegría, A., Craig, M., Langsdorf, S., Löschke, S., Möller, V., et al., Eds.; Cambridge University Press: Cambridge, UK, 2022. [Google Scholar]
- England, J.F., Jr.; Cohn, T.A.; Faber, B.A.; Stedinger, J.R.; Thomas, W.O., Jr.; Veilleux, A.G.; Kiang, J.E.; Mason, R.R., Jr. Guidelines for Determining Flood Flow Frequency—Bulletin 17C (No. 4-B5); US Geological Survey: Reston, VA, USA, 2018.
- Rojas, C.; Munizaga, J.; Rojas, O.; Martínez, C.; Pino, J. Urban development versus wetland loss in a coastal Latin American city: Lessons for sustainable land use planning. Land Use Policy 2018, 80, 47–56. [Google Scholar] [CrossRef]
- Kron, W. Flood risk= hazard ∙ values ∙ vulnerability. Water Int. 2005, 30, 58–68. [Google Scholar] [CrossRef]
- Farías, M.; Vargas, G.; Tassara, A.; Carretier, S.; Baize, S.; Melnick, D.; Bataille, K. Land-level changes produced by the M w 8.8 2010 Chilean earthquake. Science 2010, 329, 916—916. [Google Scholar] [CrossRef]
- Gedan, K.B.; Kirwan, M.L.; Wolanski, E.; Barbier, E.B.; Silliman, B. The present and future role of coastal wetland vegetation in protecting shorelines: Answering recent challenges to the paradigm. Clim. Chang. 2010, 106, 7–29. [Google Scholar] [CrossRef]
- Bywater-Reyes, S.; Diehl, R.M.; Wilcox, A.C. The influence of a vegetated bar on channel-bend flow dynamics. Earth Surf. Dyn. 2018, 6, 487–503. [Google Scholar] [CrossRef] [Green Version]
- Bertoldi, W.; Drake, N.A.; Gurnell, A.M. Interactions between river flows and colonizing vegetation on a braided river: Exploring spatial and temporal dynamics in riparian vegetation cover using satellite data. Earth Surf. Process. Landf. 2011, 36, 1474–1486. [Google Scholar] [CrossRef]
- Merritt, D.M.; Cooper, D.J. Riparian vegetation and channel change in response to river regulation: A comparative study of regulated and unregulated streams in the Green River Basin, USA. Regul. Rivers Res. Manag. 2000, 16, 543–564. [Google Scholar] [CrossRef]
- Miller, K.A.; Webb, J.A.; de Little, S.C.; Stewardson, M.J. Environmental flows can reduce the encroachment of terrestrial vegetation into river channels: A systematic literature review. Environ. Manag. 2013, 52, 1202–1212. [Google Scholar] [CrossRef] [PubMed] [Green Version]
- Shafroth, P.B.; Wilcox, A.C.; Lytle, D.A.; Hickey, J.T.; Andersen, D.C.; Beauchamp, V.B.; Hautzinger, A.; McMullen, L.E.; Warner, A. Ecosystem effects of environmental flows: Modelling and experimental floods in a dryland river. Freshw. Biol. 2010, 55, 68–85. [Google Scholar] [CrossRef]
- Grams, P.E.; Schmidt, J.C.; Topping, D.J. The rate and pattern of bed incision and bank adjustment on the Colorado River in Glen Canyon downstream from Glen Canyon Dam, 1956–2000. GSA Bull. 2007, 119, 556–575. [Google Scholar] [CrossRef] [Green Version]
- Manners, R.B.; Schmidt, J.C.; Scott, M.L. Mechanisms of vegetation-induced channel narrowing of an unregulated canyon river: Results from a natural field-scale experiment. Geomorphology 2014, 211, 100–115. [Google Scholar] [CrossRef]
- Pacheco, F.; Rojas, O.; Hernández, E.; Caamaño, D. Effects on Fluvial Geomorphology and Vegetation Cover following Hydroelectric Power Plant Operation: A Case Study in the Maule River (Chile). Water 2022, 14, 1673. [Google Scholar] [CrossRef]
- Batalla, R.J.; Iroumé, A.; Hernández, M.; Llena, M.; Mazzorana, B.; Vericat, D. Recent geomorphological evolution of a natural river channel in a Mediterranean Chilean basin. Geomorphology 2018, 303, 322–337. [Google Scholar] [CrossRef]
- Tabari, H.; Hosseinzadehtalaei, P.; Thiery, W.; Willems, P. Amplified Drought and Flood Risk Under Future Socioeconomic and Climatic Change. Earth’s Future. 2021, 9, e2021EF002295. [Google Scholar] [CrossRef]
- Martínez-Fernández, V.; Van Oorschot, M.; De Smit, J.; González del Tánago, M.; Buijse, A.D. Modelling feedbacks between geomorphological and riparian vegetation responses under climate change in a Mediterranean context. Earth Surf. Process. Landf. 2018, 43, 1825–1835. [Google Scholar] [CrossRef]


| Number | Date | Peak Flow (m3 s−1) | Rank |
|---|---|---|---|
| 1 | 5/29/1972 | 13,110 | 2 |
| 2 | 8/15/1972 | 7452 | 24 |
| 3 | 6/28/1974 | 9210 | 10 |
| 4 | 8/18/1982 | 7083 | 26 |
| 5 | 6/18/1983 | 11,082 | 6 |
| 6 | 5/26/1984 | 6476 | 31 |
| 7 | 7/2/1984 | 6636 | 30 |
| 8 | 7/18/1984 | 7040 | 27 |
| 9 | 5/28/1985 | 5968 | 32 |
| 10 | 7/3/1985 | 8271 | 20 |
| 11 | 6/18/1986 | 10,393 | 8 |
| 12 | 11/27/1986 | 6938 | 28 |
| 13 | 6/29/1989 | 8070 | 21 |
| 14 | 5/29/1991 | 12,391 | 3 |
| 15 | 7/9/1991 | 7743 | 23 |
| 16 | 6/6/1992 | 8412 | 18 |
| 17 | 6/6/1993 | 8568 | 15 |
| 18 | 6/27/1993 | 8874 | 12 |
| 19 | 8/28/1993 | 8433 | 17 |
| 20 | 7/25/1994 | 8465 | 16 |
| 21 | 6/20/1997 | 8774 | 13 |
| 22 | 7/30/1997 | 7158 | 25 |
| 23 | 8/2/2000 | 9058 | 11 |
| 24 | 5/29/2001 | 10,661 | 7 |
| 25 | 7/4/2001 | 10,192 | 9 |
| 26 | 7/20/2001 | 8660 | 14 |
| 27 | 8/2/2001 | 6756 | 29 |
| 28 | 8/25/2002 | 11,124 | 5 |
| 29 | 10/14/2002 | 7981 | 22 |
| 30 | 6/21/2003 | 12,041 | 4 |
| 31 | 7/3/2005 | 8336 | 19 |
| 32 | 7/12/2006 | 16,261 | 1 |
| Description | Model Scenario | Sea Level | Discharge | Riparian Vegetation |
|---|---|---|---|---|
| Calibration | 0 | measured sea levels | measured discharge | 2006 conditions |
| Base scenario | 1 | measured sea levels | measured discharge | channel n = 0.032 |
| Impact of sea level rise | 2 | sea levels +0.3 m | measured discharge | channel n = 0.032 |
| 3 | sea levels +0.6 m | measured discharge | channel n = 0.032 | |
| 4 | sea levels +0.9 m | measured discharge | channel n = 0.032 | |
| Impact of channel vegetation | 5 | measured sea levels | measured discharge | sand bar n = 0.032–0.140 |
| 6 | measured sea levels | measured discharge | sand bar n = 0.070–0.160 | |
| Impact of discharge increase | 7 | measured sea levels | discharge + 7% | channel n = 0.032 |
| 8 | measured sea levels | discharge + 11% | channel n = 0.032 | |
| 9 | measured sea levels | discharge + 18% | channel n = 0.032 | |
| Worst case scenario | 10 | sea levels +0.9 m | discharge + 18% | sand bar n = 0.070–0.160 |
Publisher’s Note: MDPI stays neutral with regard to jurisdictional claims in published maps and institutional affiliations. |
© 2022 by the authors. Licensee MDPI, Basel, Switzerland. This article is an open access article distributed under the terms and conditions of the Creative Commons Attribution (CC BY) license (https://creativecommons.org/licenses/by/4.0/).
Share and Cite
Schoener, G.; Muñoz, E.; Arumí, J.L.; Stone, M.C. Impacts of Climate Change Induced Sea Level Rise, Flow Increase and Vegetation Encroachment on Flood Hazard in the Biobío River, Chile. Water 2022, 14, 4098. https://doi.org/10.3390/w14244098
Schoener G, Muñoz E, Arumí JL, Stone MC. Impacts of Climate Change Induced Sea Level Rise, Flow Increase and Vegetation Encroachment on Flood Hazard in the Biobío River, Chile. Water. 2022; 14(24):4098. https://doi.org/10.3390/w14244098
Chicago/Turabian StyleSchoener, Gerhard, Enrique Muñoz, José Luis Arumí, and Mark C. Stone. 2022. "Impacts of Climate Change Induced Sea Level Rise, Flow Increase and Vegetation Encroachment on Flood Hazard in the Biobío River, Chile" Water 14, no. 24: 4098. https://doi.org/10.3390/w14244098