
An Estimation of Virtual Trades of Embedded Water and Land through Sri Lankan Seasonal Crops’ Trades to Improve the Cropping Preferences


1
Institute for Sustainable Industries & Livable Cities, Victoria University, Melbourne 8001, Australia
2
College of Engineering and Science, Victoria University, Melbourne 8001, Australia
3
Centre of Excellence in Water Resources Engineering, University of Engineering and Technology, Lahore 54890, Pakistan
4
College of Engineering, IT & Environment, Charles Darwin University, Darwin 0810, Australia
*
Author to whom correspondence should be addressed.
Water 2022, 14(24), 4101; https://doi.org/10.3390/w14244101
Submission received: 31 October 2022
/
Revised: 7 December 2022
/
Accepted: 12 December 2022
/
Published: 15 December 2022
(This article belongs to the Section Water Use and Scarcity)
Abstract
:Due to the increase in population, growing urbanization, and higher demands for processed and unprocessed foods, resources related to food production have become scarce. Water and land can be considered as the primary resources to determine the crop production potential of a country. Ideally, countries that lack water and land resources can import these in virtual form. Sri Lanka is a country rich in water resources that faced bankruptcy recently. This study analyzes and explores the potential for use of land–water resources in Sri Lanka. A comprehensive framework is generated to identify the virtual land–water trade by considering ten major imports and nine major export crops in Sri Lanka. Consequently, the top ten imports/exports and top ten import/export trade partners are identified. The analysis reveals that Sri Lanka is a heavily import-dominant country, having seven times higher imports compared to exports. The country imports wheat, which is 82% of its import crops, and the same crop is the largest export (85% of crop export). Compared to its trade partners, Sri Lanka has sufficient water resources, but availability of arable land is limited. Banana is the largest export of the country, which involves higher embedded water and less land, matching the resource availability to Sri Lanka, whereas the trade partners are expected to continue importing the crop due to their water and land stress conditions. Finalization of the long-awaited agriculture policy of the country is strongly recommended.
1. Introduction
Rapid population growth puts restraints on food, water, and energy resources and challenges the sustainable management of natural resources [1,2,3]. China has experienced a vast loss in agricultural land and a tremendous increase in food imports in the last three decades [4]. About 800 million people in the developing world are suffering from malnutrition. The world’s population is expected to increase to 9.3 billion by 2050 [5]. This rapid change can aggravate negative impacts, including food scarcity. Due to population growth and lifestyle improvements, food production should be increased 66% regarding crops and 76% in terms of livestock production [6]. This requires an increase in agricultural production efficiency in both developing and developed countries. Research demonstrates the necessity of sub-Saharan Africa to generate twice the production to meet the demand in 2050 [7,8].
Agricultural trades help to address national scarcity of food by spatial redistribution of food from the food generators. Agricultural exports are a significant source of revenue for some countries, and imports are crucial for food security in others. Agricultural trade helps to mitigate the shortage in land and water resources for many island countries [3]. For various reasons, there have long been concerns about how international trade might improve or hinder society’s ability to balance different social and economic goals [9].
At the same time, the primal resources related to agriculture, such as water and land, have also become limited. These resources are under stress due to expansion in urban and pre-urban areas [10,11]. In addition, the water and land resources are becoming polluted due to industrialization, and the availability of those resources has been further reduced consequently. With expanding economies, efficient land use has increasingly become a pressing issue [3]. Maximizing land use paves the way to growing economies [11,12]. An annual increment rate of 5.73% of virtual land flow is observed from 1986 to 2016 at the worldwide level, which shows further dependency of regions on international trade to meet their agricultural requirements [11].
It has been widely believed that nations that rely on irrigation water to grow low-value food crops are misguided. Around 70% of blue water is used for food production [13]. The water used to irrigate these crops could be more valuable than the products themselves. Countries with severe water shortages should instead grow food with cheap water by sourcing it from regions with surplus water [14]. When a country exports a water-intensive commodity to another country, they actually export water, and the other country saves that amount of water [15].
Water content that involves the full cycle of production is ‘embedded’, meaning the water contained can no longer be used for other purposes. As per many reasons, some countries import and export those products as virtual water trades. Virtual water is the amount of freshwater consumed by the commodity from the start to end of the process [16], while virtual land is the area of land consumed by the production chain of a commodity. In the same way, limitations in land availability and international trade aid the land scarcity of island countries as water and land have been virtually transferred with goods [17,18]. The concept of virtual flows of water and land helps to understand the amount of land and water moving not just throughout the world but also between the regions within a country [19]. Virtual water flows are an integral part of sustainable water management. They can also be utilized in integrated water resources management (IWRM) to address the issue of food security [20]. Countries with either or both resources being crippled can still sustain by importing products that embed significant quantities of water and/or land [3,13].
- The concept can even be used by countries with ample land and water resources to increase the resource values further.
- The concept of virtual water and land trade helps in agricultural intensification and agricultural land expansion.
- The concept develops and interlinks between the physical quantities of agricultural products to sociological, economic, and anthropogenic domains [3].
According to an FAO report, agricultural trade across the world has grown quickly, and international imports/exports range from 0 to 20% [7]. Furthermore, the USA, Argentina, and Australia export 50% of their domestic food supply, and northeast Africa, South Asia, including Sri Lanka, and China are known as net importers.
1.1. Land and Water Resources of Sri Lanka
Sri Lanka is an island with an area of 65,610 located in the Indian Ocean. The country has limited area for agriculture production of 42% (27,556 km2) but is rich in water resources [23]. Sri Lanka depends on rain for its freshwater resources’ requirements. The mean rainfall varies between 2500 and 5000 mm in the wet zone of the country, and the dry areas receive a mean rainfall of 1250 mm annually [24]. The country has two major cultivation seasons: Yala and Maha. Maha is considered as the main season, which immediately starts in October, and, usually, Yala season starts in April, which has less harvest. However, Sri Lankan agriculture is particularly susceptible to climate change [14].
The Sri Lankan economy is profoundly influenced by agriculture; a momentous amount of gross domestic product is contributed by this sector. Most of the people in the country, about 80% of the population, depend on agriculture [25], mainly importing wheat, potatoes, maize, and peas, in addition to exporting wheat, bananas, peppers, pineapples, lemon, and limes. The Sri Lankan population’s livelihood is heavily intertwined with agriculture. About 23.5% of jobs are provided by the agricultural sector, and 72% of the total population livelihood is indirectly connected to the agricultural sector [26]. Accordingly, the population of Sri Lanka is expected to grow by 2.4 million by 2050.
Being a country rich in water resources, Sri Lanka has the potential to contribute towards the global food market. With efficient utilization of water and land resources, Sri Lanka can increase the market value of its agricultural products to support the country’s economy. It is essential, at the same time, to analyze the potential environmental impacts of virtual water flows and how they can be utilized. For instance, in Sri Lanka, they have not been utilized to improve the water quality [27]. Sri Lanka requires fixing the issues related to agriculture and water management to gain the maximum out of the available water resources. The water resource managers are struggling to communicate with the policymakers about the latest approaches related to water efficiencies [14]. Efficiencies of virtual waters and lands are closely related to the policies and strategies of a country [4]. The country needs major legislative and policy changes to not just avoid the negative impacts of climate change but to take advantage of its water resources [28].
1.2. Problem Statement
Figure 1 illustrates the ratio of total water withdrawal to available renewable water supplies. The scale is in a range of 0 to 1, with 1 being greater exposure to water stress. Nearly 1.8 billion of the world’s population is in 17 countries colored in dark blue that have the potential to have severe shortages in the future. Sri Lanka has a score of 3.66, which is higher than average. From the content of water they use, 80% is blue and green water, which is drying up day by day due to climate change, so agriculture and production of goods are threatened [29]. Water stress or scarcity can be found in two different meanings as physical and economic scarcity [30]. With the increase in water demand, one-third of the world population is suffering from physical water scarcity.
Sri Lanka is a country that has an annual rainfall of 2200 mm, while neighboring India is 1100 mm and Australia is 455 mm [31]. The concern is how Sri Lanka became a victim of water scarcity despite high rainfalls. As of now, Sri Lanka has become one of the water-scarce countries and is financially bankrupt. On the other hand, Sri Lanka uses 85% of the available water for agriculture [31]. According to Figure 2, an economic perspective/analysis is required to promote efficient methods of agricultural practices.
1.3. Research Objectives
The aim of this research is to analyze the Sri Lankan circumstances to produce high-value agricultural products considering their trade potential and land and water resources involvement.
The task is accomplished by analyzing the factors impacting water scarcity and economic rent of land use while considering economic, water, and land scarcity in Sri Lanka.
A deep understanding of water and land scarcity in Sri Lanka is required to develop its correlation to trade and to identify critical trade partners for the future. This, in return, may help in identifying suitable agricultural practices and resource-conserving practices to improve agricultural productivity and sustainability within Sri Lanka.
The scope of this research includes:
- An overview of land and water resources in Sri Lanka
- Trade balance of virtual water and land
- Identification of efficient crops
- Evaluation of major trade partners in terms of net flows
2. Literature Review
As agriculture covers a major part of a country’s economy, it acts as a medium that assists virtual water transfer through the world. In the last few decades, there has been cumulative growth in global agriculture trade [7]. The merchandise volume has become three times faster than the cumulative economic output growth. Largely, developed countries have become unresponsive to the demand, and the products that are high in demand have been affected by those limitations in demand. However, developing countries respond insufficiently towards reducing the net exports of agricultural products.
Several factors determine the extent of virtual water trade, such as climate change, an increase in population, and economic growth. Climate change is a major challenge for agriculture and other products. Certain crops consume a massive amount of water throughout their lifecycle. It is a challenge to the country’s water security. Climate change can directly or indirectly influence agriculture, including the economy, employment, etc. [32,33]. Climate change is expected to worsen the food production capabilities of many countries [34]. According to Intergovernmental Panel on Climate Change (IPCC), temperatures will increase by 30% over the next 100 years [33]. As the temperature on Earth increases, the effect of climate change becomes more apparent; sea levels rise, weather patterns change, the frequency of disasters increases, and dry areas grow drier. The ability of different countries to cope and adapt to change varies according to their economic and environmental status [35]. In a worst-case scenario, up to 170 million additional people can be at risk of hunger by 2080 [36].
Rapid emergence and growth in global trade in agricultural products have led to a significant increase in the number of studies about the virtual water trade of these products. Due to the large amount of water used for food production, there is a growing need for more research on this subject [37]. In the global context, Hoekstra and Hung explored the effects of virtual water trade on the water resources of different countries [38]. In a study conducted by Chapagain and colleagues, they analyzed the effects of virtual water trade on the budgets of different countries, including Sri Lanka [39]. They then used a spatial-explicit method to calculate the water footprint of different agricultural products from 1996 to 2005. They found that trade in crop products accounts for 76% of the total international virtual water flows, while trade in industrial and animal products contributes 12% [39,40,41]. In 2004, Chen and Chen performed a multi-region study to investigate the effects of virtual water trade on the world’s water profile [37,42]. It was also concluded that the global trade in agricultural products has evolved along with the food trade [15].
There has been much research on the virtual water flows in agricultural products, such as in Egypt. This research investigates the current water and food security situation in Egypt and explores the various policies and measures that have been implemented to address the challenges. The paper shows how virtual water can be used within a broader framework [43,44,45], the European Union. The United Kingdom is a net importer of virtual water. It relies on the European Union for a sizable portion of its water supply. During the 2000 to 2012 period, the country imported a significant amount of virtual water from the EU. The economic effects of the trade between the two countries were positive, while the intensity of the virtual water flows was negatively affected. The findings of this study suggest that the UK’s post-Brexit trade position can provide useful recommendations [46]. Further studies analyzed Iran’s virtual water flows using a multiregional input–output framework, also considering the external and internal water footprint of each region. The results indicated that the country’s northern region is a net importer of virtual water, while the severely water-scarce regions are net exporters [47,48,49,50]. Another paper analyzed the relationship between the development and population of Africa and the virtual water trade. It found that the increasing number of virtual water imports does not lead to a reduction in the country’s human welfare or increase its population growth. It also established a new index that measures the openness of the virtual water trade [51]. Further studies analyzed China’s virtual water flows from its agricultural products trade from 2001 to 2013. It found that the country was in a trade surplus concerning its virtual water trade. The country’s total virtual water export was 29.94 billion m3 per year, while its total virtual water import was 155.55 billion m3. The trend in China’s export of virtual water per year was declining, while its import was increasing [42,52,53]. A study on India’s virtual water trade was conducted for the first time to consider the specific contents of livestock and crop products from its partner countries, finding that the country’s average virtual water export is 59 billion cubic meters per year and its import is 32.6 billion cubic meters per year. The net value of its virtual water import is 26.4 billion cubic meters [54] and more.
Some investigations regarding the water trade balance of agricultural products for many countries have been conducted in recent years [48,55]. The virtual water trade within a country or across the states/regions has also been conducted in some countries [19]. Gkatsikos and Mattas conducted a study to investigate the virtual flow of water within the dry and water-scarce region of the Mediterranean considering agricultural products [18]. Sustainable economics for agricultural practices are strongly linked to water pricing, although a sensitive political topic [13]. Zhang et al. [52] conducted a comprehensive study of China’s international virtual water flows from agricultural products trade and provided a diachronic analysis from 2001 to 2013.
Zhang et al. [52] classified trade partners in terms of the ratio of virtual water being imported and exported. Qiang et al. identified countries at the global level as land importers, exporters, or balanced ones [11]. At present, China is running short by 30.8% of agricultural land to meet its food requirements and must import from other countries [56]. Qiang et al. concluded that income growth and changes in diet structure are the main factors driving increases in virtual land trade [11]. Wu et al. [57] estimated the virtual flow of water, land, and carbon emissions for staple crops at the interprovincial level in China. Ma and Ma used CROPWAT to estimate the water footprints of agricultural products [19]. Yawson [58] used the projected population estimates and expected land use changes for the United Kingdom (UK) to estimate the barley needs in the 2050s.
An analysis of the natural resources used by agricultural businesses is important for assessing the effects of trade on the environment. The term virtual water refers to the volume of water that is used in production and consumption of food crops [59,60]. According to Zehnder and Yang, food imports are virtual water users, which means that they are transferring water between countries. In 2001, Wichelns defined virtual land as the productive areas that are hidden within the products that are exported or imported from agricultural businesses. This concept can be applied to the various natural resources that are used by agricultural businesses [21,61]. From a national perspective, the increase in domestic land area due to the production of fibers and food is being caused by the virtual land outside the national borders.
The term virtual land refers to the collection of resources that are used in international trade. This makes it easier to interpret and communicate to policymakers and the public. The concept of ecological footprint analysis was developed by John Rees in 1992. It aims to estimate the bio-productive area that a society needs to maintain its resource consumption and waste assimilation [62]. Various methods and concepts have been used to explain the relationship between the hidden resource use in agricultural trade and the production of food. In 1965, Borgstrom presented the concept of ghost acreage to illustrate the invisible use of cropland in trade of agricultural products [63].
In 2006, Wrtenberger and colleagues defined virtual land as the areas that are hidden in the products that are imported or exported. This study aims to provide a comprehensive analysis of the various land resources that are used in international trade [21]. Various reports have been presented regarding use of land area and agricultural products in international trade. In 2004, Erb used country-specific yields to determine Austria’s actual land demand and found that, during the 1926 to 2000 period, the country was a net importer of arable land [64]. In 2010, Nonhebel and Kastner noted that the Philippines’ virtual use of land for food production increased significantly. From 1980 to 2010, the share of land used for food production increased from 15% to 30% [65]. In 2010, Kissinger and Rees analyzed the productive land that the US imported from 1995 to 2005. They found that even countries that can meet most of their food needs have increasing concerns about their external terrestrial ecosystems [66].
In 2011, Fader and colleagues analyzed the virtual land balance in international trade [22]. They found that the US, Australia, Argentina, and Canada were net exporters of virtual land. On the other hand, some Mediterranean and Asian countries were net importers [67]. The framework has been further enhanced by considering the numerous factors that affect production and consumption of agricultural products. For instance, the level of local productivity can be used to estimate the ecological footprint of a country [62,66,68,69,70,71].
Water-rich countries such as Sri Lanka have been criticized for their dependence on water [72]. According to the data collected from 1995 to 1999, central and southern Asian regions have the highest gross virtual water imports and Sri Lanka has a net virtual water import of 85,693 (106 m3/yr) [73] (refer to Figure 3).
3. Methodology
Based on extensive literature review in Section 2, the analysis will cover the climatic conditions of Sri Lanka, trade balance of the country over a decade, and estimation of virtual water being traded as well as the land.
3.1. Climatic Conditions
The climate of Sri Lanka is composed of various atmospheric elements, such as temperature, humidity, and precipitation. It can also vary due to the country’s location. For instance, within the tropics, the climate of Sri Lanka is tropical [74]. The southern half of Sri Lanka is characterized by its mountainous terrain. The central highlands region features numerous topographical features, such as peaks, valleys, and ridges; the rest of the country is flat [75]. However, some areas are characterized by small hills that rise abruptly from the lowlands. These topographical features affect the development and intensity of various climate elements, such as rainfall, temperature, and humidity, as shown in Figure 4. They can also influence the spatial patterns of wind and precipitation [76,77].
The annual rainfall in Sri Lanka is mainly attributed to the country’s multiple natural phenomena, such as the monsoonal, depressional, and convectional rain [78]. The mean annual rainfall in the country varies from around 900 mm in the southern and northwestern regions to over 5000 mm in the western highlands [79,80,81].
The air temperature in Sri Lanka is different from that of other countries due to the country’s altitude. According to Figure 5, The monthly temperatures are also influenced by the seasonal movement of the sun. On the other hand, the annual temperature varies widely across the country. In the lowlands, the annual temperature ranges from 26.5 degrees Celsius to 28.5 degrees Celsius. In the highlands, the temperature drops quickly as the elevation increases. In Nuwaraeliya, the annual temperature is 15.9 degrees Celsius. The warmest month of the year is in April and August. On the other hand, the lowest monthly temperature is in January. The annual temperature in the coastal lowlands ranges from 27 degrees Celsius to 16 degrees Celsius. In the central highlands, it is around 16 degrees Celsius [80]. This unique feature, which can be seen in the presence of rainforests and sunny beaches, is a popular tourist destination [51,82,83].
3.2. Trade Balance of Sri Lanka
Sri Lanka’s trade deficit fell to USD 404 million in May 2022 from USD 716 million a year earlier as imports declined, and exports grew. The trade gap was the smallest since August 2020 as the rupee depreciated against the dollar. Imports dropped 9.7% to USD 1451 million, mainly due to lower purchases of consumer goods, such as vegetables and dairy products [84,85]. Purchases of intermediate goods, such as chemicals, plastics, and articles, decreased by 0.9%. On the other hand, investment goods dropped by 21.7%, mainly due to a decline in purchases of machinery and equipment, building materials, and construction equipment. Exports also grew by 17.5% to reach USD 1047 million, mainly due to sales of industrial products, petroleum products, and textiles [86]. The trade gap decreased to USD 3535 million in May 2022 from USD 3663 million a year earlier. During the first five months of this year, the surplus was also lower, at USD 1047 million [87].
3.3. Virtual Water Trade
Trade is very important for a global economy to keep moving forward. It can help consumers by giving them a variety of options and increasing competition. It can also help businesses produce high-quality goods and cost-efficient products [88]. Through virtual water flows, we can obtain a deeper understanding of the water footprint of Sri Lanka’s production and consumption. Virtual water trading can affect the security and political relations of nations. It can also lead to economic disruption and political conflicts. The per capita consumption of water varies depending on several factors, such as the country’s diet, lifestyle, and economic status [89]. As a result, regions with water deficits can use their limited reserves to conserve their water. The study of virtual water has gradually evolved into a spatial and temporal evolution. It combines the various research content related to virtual water trade, such as the water footprint, economic development, and impact assessment [90]. This makes the study of virtual water more complete. Despite the numerous results of the virtual water trade study, there are still many limitations. These include the lack of reliable data, the complexity of the model, and the data gap. There has been a great deal of research published about the concept of virtual water, but the focus of these studies is mainly on agricultural sectors [91]. Despite the progress that has been made in the field of virtual water research, there are still many steps that need to be taken to improve its accuracy and predict its future. This discipline is an interdisciplinary one that involves the study of various factors, such as socio-economy, ecological environment, and hydrology [37,45,46]. This research is focused on virtual trade of agricultural products. It is generally believed that the water content of a product is equal to its production water footprint. Before calculating the virtual water trade volume, the method used to calculate the virtual water of a crop is the crop water requirement method. The models frequently used in the calculation process include the CROPWAT model. CROPWAT 8.0 [92] was designed by FAO, based on Penman–Monteith model, and the crop water requirement is computed by estimating the accumulated crop evapotranspiration, ETc (mm/ day), which is obtained by multiplying the reference crop evapotranspiration ET0 by the crop coefficient Kc [93]. In this section, a detailed description of the process required for virtual water quantification is provided.
3.3.1. Specific Water Demand
Average specific water demand per crop type could be calculated according to FAO data and crop water requirements and crop yields [38,94]. The following equation will be applied:
Whereas:
SWD is the specific water demand (m3 ton−1) of crop c in Sri Lanka s
CWR is the crop water requirement (m3 ha−1)
CY is the crop yield (ton ha−1)
Correspondingly, the crop water requirement (CWR) (m3 ton−1) could be calculated implementing the following formula: CROPWAT software tool is used for this purpose.
Also,
Whereas:
ETc is accumulated crop evapotranspiration (mm/day) over growing period.
ET0 is reference crop evapotranspiration
And Kc is crop coefficient.
The reference crop evapotranspiration (ET0) can be calculated using Penman–Monteith equation [93,95].
Whereas:
ET0 is the reference crop evapotranspiration [mm day−1]
Rn is net radiation at the crop surface [MJ m−2 day−1]
G is soil heat flux [MJ m−2 day−1]
T is average air temperature [°C]
U2 is wind speed measured at 2 m height [m s−1]
ea is saturation vapors pressure [kPa]
ed is actual vapor pressure [kPa]
ea − ed is vapor pressure deficit [kPa]
∆ is slope of the vapour pressure curve [kPa °C−1]
is psychrometric constant [kPa °C−1]
The graphical explanation of specific water demand is shown in Figure 6.
3.3.2. Virtual Water Estimation
The virtual water trade is calculated using the following formula:
Whereas:
VWT is the virtual water trade (m3 yr−1)
CT represents the crop trade (m3 yr−1)
SWD represents the specific water demand (m3 tonne−1)
ne exporting country
ni importing country
t year
c crop
The gross virtual water imports to a country can be calculated using the following formula:
The gross virtual water exports from a country can be calculated using the following formula:
The virtual trade balance of the country can be calculated using the following formula:
3.4. Virtual Land Trade
The concept of economic rent (ER) helps in assessing land-use efficiency. Economic rent is commonly defined as the net annual income associated with a resource [96]. ER of a land-use may be computed as the average of the annual net returns discounted to their present value. If ‘Rn’ is the annual net return from the unit land area in year ‘n’, assuming a constant discount rate ‘r’, then the economic rent ‘ER’ over the time ‘t’ will be the average of discounted annual net returns. This relationship can be expressed in the following way (Equation (8)):
The net annual return to unit land can also be defined as the gross annual return minus the annual total non-land costs and is synonymous with economic efficiency returns [96].
3.4.1. Estimation of Virtual Land
Land can be saved or lost by importing or exporting. To analyze that, imported virtual land and exported virtual land can be calculated.
, are import and export quantities of crops I, country c, and year y. means the yield of cereal i, country c, and year y.
Exported virtual land could be calculated using the following formula.
Land saving can be calculated as subtracting imported virtual land by exported virtual land, and global total land saving can be calculated by using the following equation.
3.4.2. External Land Dependency
The land is a limiting factor in many countries. Its availability depends on the biodiversity in each country. Therefore, it is practical to import land in the virtual format as above. The countries that import more land from other countries have more dependency [3]. To calculate each country’s external land dependency, following equation can be used.
The area of virtual land flowing between two countries can be calculated using the following equation.
Finally, the net land saving can be calculated as follows.
A positive value of NLS means the country saves land using trade. In this research, the same as saving land using virtual water trade, the amount of water that a particular country can save using virtual water trade can be carried out.
4. Results and Discussion
Information regarding import quantity and export quantity of agriculture crops from 2010 to 2020 has been gathered from FAOSTAT and has been analyzed with the virtual water content data. In this research, total virtual water content has been considered rather than considering the blue, grey, and green water content. The standard units of virtual water content are , and, by multiplying the quantity of exports and imports, the number of liters can be calculated.
4.1. Analysis of Significant Crops
As identified in Section 3.2, ten major imports and nine major exports were identified. The analysis identified major imports and exports as well the water and land resources involved.
4.1.1. Import Crops
An analysis of the data collected between 2015 and 2020 [97,98,99,100] indicates that the main crops imported to Sri Lanka are wheat, potatoes, peas, and maize. However, the quantity of wheat imported is significantly more than other crops. Overall, imports of wheat, peas, and beans are increasing. Imports of onions, potatoes, and grapes are steady. Imports of oranges, maize, tobacco, chilies, and peppers are disturbingly decreasing. The total quantities of the top ten crops imported from 2010 to 2020 are shown in Table 1.
Wheat is the major import of Sri Lanka (82% of crop imports). According to data [101], Canada (521 kilotons (kt)) and Russia (505 kt) alone supply 70% of the total import of wheat to Sri Lanka. The following 30% is covered by countries such as the United States of America, Ukraine, India, etc. Pakistan (1.2 kt) supplies more than 85% of the total import of onions (the second largest import) to Sri Lanka. The remaining top four importers of onions cover less than 10%, which includes India, China, Singapore, and the US. India (38 t) can be considered the sole provider of pepper to Sri Lanka, covering 95% of the total import of this commodity. Indonesia (1.3 kt) supplied 37% of the total import of tobacco in 2020. Sri Lanka imported 138 kilotons (kt) of potatoes in 2020, and 57% was imported from Pakistan (79.4 kt). The most significant importer of peas to Sri Lanka is Ukraine (24.6 kt), which covers 48% of the total import, as shown in Table 2.
Based on the import data (2010–2020), Canada, Pakistan, Russia, USA, Australia, and India are the major contributors, covering 95% of crop imports. These top six exporters to Sri Lanka are shown in Figure 7.
Although 70% of the wheat is being imported from Russia and Canada, the remaining 30% is covered by countries such as the United States of America, Ukraine, India, etc. According to the data collected between 2015 and 2020 [97,98,99,100], the fastest-growing wheat import partners are India, Russia, and the United States. Meanwhile, imports of wheat from countries such as Australia, United Arab Emirates, and Canada are rapidly declining. The remaining top importers of potatoes are China, Netherlands, India, Bangladesh, and more. The fastest growing import countries are United Arab Emirates (+526%), Netherlands, and China. Imports of potatoes from India have decreased by 22% from 2015 to 2020. Other significant importers of peas include Australia, Canada, Russia, and United States. Overall imports from major partners are growing rapidly. Overall imports of peas have increased by 30.7 kt since 2000. In 2016, the total import of maize was 59.8 kt, but this value increased by 125. 2 kt in one year. Ever since, the total import is rapidly decreasing. The total weight of maize imported to Sri Lanka in 2020 was 38.7 kt. The top five importers of maize are India (8 kt), Pakistan (6 kt), Ukraine (5.8 kt), Romania (5.5 kt), and Myanmar (4.9 kt). The import of maize has increased by 83% from Turkey in 5 years, and the fastest declining import partner is Spain (−60%). Sri Lanka imported a total of 4.9 kt of fresh grapes in 2020. The top importers include China (2.4 kt), India (1.1 kt), South Africa (0.529 kt), Australia (0.361 kt), and Italy (0.293 kt). From data collected from 2015 to 2020, the fastest declining import partner is the United States (−24%). The total imports of beans to Sri Lanka halved from 2019 (8.4) to 2020 (4.1 kt), and 46% of the total import is supported by Myanmar. The remaining top importers include India, Madagascar, Brazil, and Nigeria. Imports from Brazil have decreased by 37% since 2015, alarming since Brazil is one of the top five trade partners. The total import of oranges to Sri Lanka has decreased significantly since 2018. Sri Lanka imported 9.4 kt of oranges in 2018 and reduced to 3.7 kt in 2020. South Africa (1.8 kt) supplies 50% of the total import, and the remaining is supported by Egypt, Australia, China, and Singapore. Imports from Egypt have decreased by 18% since 2015. After a significant increase in import of tobacco to Sri Lanka in 2016, the import of this commodity has decreased by 27%. Indonesia (1.3 kt) supplied 37% of the total imports of tobacco in 2020. Countries such as India, Italy, Belgium, and the United States of America remain the top importers, covering 50% of the total imports. The fastest growing import partners are India and Germany. Since 2015, we have witnessed a continuous decline in imports from Netherlands, Ecuador, Indonesia, Italy, and United States of America. The fastest growing import partners for onions are India and Singapore. Vietnam and China equally share the remaining imports of pepper. According to data collected from 2015 to 2020, the fastest declining importer of pepper is United Arab Emirates (−53%). The detailed analysis for 2020 is shown Figure 8.
In terms of quantity, Sri Lankan imports are almost seven times of the imports when the top ten commodities are compared. Considering net flow, wheat is the largest import despite being the main export as well. Other than wheat, onions and peppers are crops that are imported and exported at the same time. About 212 kt of wheat was exported in 2020. The second largest export is banana, with 17.7 kt. Other main exports include pepper, tobacco, onions, pineapples, peas, lemon and limes, and beans. These commodities are exported to Vietnam, Japan, Singapore, Malaysia, Saudi Arabia, and United Arab Emirates. The overall trend in imports shows an increasing trend, which will further extend the trade deficit for crop trade.
4.1.2. Export Crops
Data collected between 2015 and 2020 [97,98,99,100] show that the top export is wheat. For a longer period, wheat is imported and exported at the same time. However, the import of wheat is much larger compared to export (17% of wheat import in 2020). Similar behavior is observed with pepper and onions. However, other main exports are banana, pineapple, lemon and limes, peas, beans, and tobacco (refer to Table 3).
Vietnam (739 kt) and Japan (500 kt) are the largest partners importing crops from Sri Lanka in last eleven years, yet their imports are increasing. These countries are followed by Malaysia, Saudi Arabia, and Singapore. All these countries, except Saudi Arabia, are importing wheat from Sri Lanka. Saudi Arabia’s main import is banana from Sri Lanka. Other Middle Eastern countries (United Arab Emirates, Kuwait, Qatar, and Bahrain) also import mainly banana in addition to onions. A list of the top ten exporters based on the last eleven years is provided in Table 4.
It is worth noting that the top crop exports of Sri Lanka remain within Asia. Figure 9 shows the geographical locations of the top importers of Sri Lankan crops.
In 2020, Sri Lanka exported a total of 212 kt of wheat (refer to Figure 10). According to the data collected between 2015 and 2020 [97,98,99,100], more than 60% of total export goes to Vietnam (64.8 kt) and Japan (63.5 kt). Sri Lanka’s remaining top export partners are Malaysia, Singapore, and Maldives. The export of wheat to India (+37%) increased rapidly from 2015 to 2020, and the fastest decline is United Arab Emirates at a rate of −59%. In 2020, Sri Lanka exported 17.7 kt of banana to Saudi Arabia and Qatar mainly, covering 75% of the total export of banana. The remaining 18% was exported to United Arab Emirates, Kuwait, and Bahrain. Export of banana to Kuwait increased at a rate of +26% from 2015 to 2020, while export to United Arab Emirates decreased by −29%. This causes concerns since United Arab Emirates is the third-largest export partner of Sri Lanka for bananas. From 2015 to 2020 (8.2 kt), the total export of pepper deceased by almost 50%. Sri Lankas’s main export partner for pepper is India, covering more than 80% of total export. The remaining 20% is exported to Germany, United States, Spain, China, and more. One of the export partners of Sri Lanka is Saudi Arabia, but exports to this country have decreased by 80% in the last 5 years. After a peak in 2013 (11.5 kt), the export of tobacco reduced significantly by 2020; Sri Lanka exported 1.8 kt of tobacco. The top export partners of tobacco from Sri Lanka are Hungary, Belgium, Italy, United States, and Germany. The fastest growing export partners are Belgium (+22%) and Hungary (+14%). Export of onion from Sri Lanka has increased by 1000 t, and 33% of total export of onions goes to Kuwait (402 t). Remaining top export partners for this product are: United Arab Emirates, India, and Qatar, which covers more than 47% of total export of onion. Export of onion to Bahrain, Canada, and United Arab Emirates has increased at the minimum rate of +130% (2015–2020). The fastest declining export partner is Germany at a rate of −30%. The export of pineapple from Sri Lanka has decreased by 12% since 2013. The main export partners of pineapple from Sri Lanka are United Arab Emirates and Germany, at 41% of total export of pineapple, and 34% of total export of pineapple from Sri Lanka goes to countries such as Germany, Netherlands, Austria, and Maldives. Export of pineapple from Sri Lanka to Japan is rapidly increasing at a rate of +33%, and export to Bahrain and Maldives is rapidly decreasing at a minimum of −48%. Export of beans decreased from 863 t (2012) to 85 t (2020), and 53% of total export of beans goes to Turkey. The remaining 47% is covered by India, United Kingdom, Maldives, and Cyprus. Export of beans to Cyprus has increased +73% from 2015 to 2020. In 2020, Sri Lanka exported a total of 241 t of lemon and lime. This product is mainly exported to Saudi Arabia and United Arab Emirates, covering 85% of total export. Qatar, Maldives, and Germany are covering 13.3% of total export. From 2015 to 2020, export of lemon and lime has increased by +18%, and export to Kuwait and Maldives has increased at a minimum rate of −43%.
Remarkably, wheat is one of the top exports as well, which is an indication of a double manner of trade in Sri Lanka. Through analysis, it was detected that the main crops exported are wheat, bananas, and peppers. Overall, exports of onions and peas are increasing. Exports of pepper, wheat, and bananas are steady. Exports of tobacco, pineapples, beans, olives, lemon, and limes are disturbingly decreasing. The exports of the top ten crops are decreasing compared to the imports.
4.2. Analysis of Virtual Trade Balances
As defined in the framework described in Section 3.3 and Section 3.4, the quantities along with virtual water and lands are analyzed for each top crop and top trading partner.
4.2.1. Major Virtual Imports
As wheat is the largest import, the crop covers 82% of imports but even higher virtual water (86%) and virtual land (85%) (refer to Figure 11). More interesting is with the second largest import (potato), which is 10% of import quantities but carries exceptionally low imports of water (4%) as well as land (5%). A similar trend occurs with grapes. Contrarily, inverse differences can be observed with maize, which is 4% in quantity but 5% in virtual water and the same in virtual land. Peas and oranges show similar behavior.
Canada is the largest supplier of wheat, followed by Russia (combined 70% of wheat imports). As wheat carries relatively higher virtual quantities, the virtual quantities are higher for Canada. All other countries are supplying virtual quantities closely matched to the quantities of crops except Pakistan, as shown in Figure 12. Pakistan is a major supplier of wheat, onions, potatoes, and maize. These crops contain lower virtual quantities. Therefore, despite having 14% imports from Pakistan, virtual water is only 12% and virtual land only 11%.
In short, Sri Lanka has imported a total of 11,693 kt of wheat, which is equivalent to importing 9,114,256 thousand m3 of water and 24,633 km2 of land. Similarly, a total of 1414 kt of potatoes were imported, which is equivalent to 491,936 thousand m3 of water and 1109 km2 of land, and a total of 416 kt of peas, which is equivalent to 447,178 thousand m3 of virtual water and 1223 km2 of land.
4.2.2. Major Virtual Export
Although wheat is the largest export of the country, its impact on water and land resources has no connection due to seven times higher imports of the same commodity. However, it is worth noting that the other exports are 12% in quantities export, 16% of virtual waters, and only 8% of virtual land. This fluctuation is basically driven by banana exports. Banana being the second largest export (7%) transfers 10% of virtual water but only 4% of virtual land (refer to Figure 13).
As far as exports to countries are concerned, there are no major differences in terms of export quantities and virtual water and land outflows (refer to Figure 14). The only exception is India, which imports 4% (primarily pepper), which takes 2% each of water and land.
The water and land use data correspond with the quantity of the crops imported. The quantity of wheat exported is significantly larger than other commodities, even compared to the top ten exported crops. From 2010 to 2020, a total of 1272 kt of wheat was exported, which is equivalent to exporting 991,862 thousand m3 of water and 2680 km2 of virtual land. Likewise, a total of 165 kt of banana was exported, which is equivalent to 120,124 thousand m3 of water and 127 km2 of virtual land. Further, 79 kt of pepper was exported from 2010 to 2020. This is equal to exporting 16,466 thousand m3 of virtual water and 39 km2 of virtual land.
4.3. Trends in Water and Land Trade
In 2018, Sri Lanka’s imports and exports contributed over 50% of the country’s GDP [102]. The country’s exports were affected by the disruptions in the global supply chain and the collapse of the demand for its goods and services. The share of the agriculture sector in the country’s total exports increased to 23.3 percent in 2020 from 20.6 percent in 2019. However, the export revenue of the sector decreased by about USD 125 million due to the decline in non-agricultural products. The average value of Sri Lanka’s agriculture exports during the period 2006 to 2018 was approximately USD 2652 million, while the imports were at about USD 2193 million. The country’s net agriculture trade was reported at about USD 458 million in 2018. In 2013, the highest recorded net agriculture trade value was at over USD 794 million, while, in 2018, the lowest was at about 140 million. The overall trends in imports and exports show that Sri Lanka has been experiencing higher imports compared to exports during the last decade (refer to Figure 15). Except for 2013 and 2018, the trade deficit is on an increasing trend. The annual change in agricultural exports is unpredictable. In 2018, the export value of agricultural food products declined by −26.27 percent. In 2012, the agri-food imports dropped by −21.5 percent. The share of agricultural exports in Sri Lanka’s total exports has fluctuated over time and has progressively increased.
A further investigation is carried out to identify the trends in virtual quantities ratios with trade. It is observed that, overall, crop trade has evolved in a way that crops containing higher quantities are being screened out and the trend is consistently decreasing (refer to Figure 16).
4.4. Critical Crops and Trade Parners
Further investigation is carried out to identify the critical crops and trade partners to develop a better understanding of flow dynamics of virtual quantities. For this purpose, the trade partners are ranked using the normalized value against their water stress index developed by Bloomberg and arable land per capita from the World Bank [29,103]. The ranking shows that Sri Lanka is less water-stressed compared to all importers except Malaysia and Vietnam (refer to Figure 17). However, except Pakistan, India, Australia, and China, the imports are from countries that are more water-stressed. In terms of arable land availability per capita, Sri Lanka is quite stressed compared to its trade partners. All the imports are from countries that are less stressed, whereas the exports are significantly more to land-stressed countries (refer to Figure 17).
The crop water requirements and land utilized to produce a unit crop are also displayed graphically to visualize the embodied water and land (refer to Figure 18). Figure 19 shows the water and land involvement for crops as well as for trade partners.
Figure 19 shows that Sri Lanka is in an advantageous position in terms of water availability. However, land resources are scarce compared to other trade partners. Two of the exports, lemons/limes and beans (fifth and eighth in export rank), involve higher embodied quantities, but the export volume is not significant. On the other hand, the imports are consisting of crops that have low embodied quantities.
5. Conclusions and Recommendations
Despite Sri Lanka having suitable climatic conditions for crop production, the crop trade overall is import-dominant, which is not sustainable. About 4.9 million people (22% of the country’s population) are experiencing food insecurity. Depreciation of the local currency and reduction in the country’s agricultural production have caused food shortages and raised the cost of living [104,105]. Researchers have identified the main reason as excessive costs of crop production [106,107]. The crop production has become uneconomical in some areas of the island due to a lack of water resources infrastructure, excessive costs involved, and an absence of supporting agricultural policies.
The primary import is wheat, which covers 82% of the crop imports. Wheat carries relatively higher embedded virtual quantities. The crop is a basic need of daily food, and the suppliers (Canada, Russia, and Ukraine) are stable in terms of export capacity and have lower stress of land and water. The supply is most probably stable in the near future and no main concern is detected. Potatoes are the imports that contain lower embedded water and land. Potatoes can be avoided and can be produced locally if the climatic and soil conditions permit.
Banana is the primary export (without being imported). Banana needs higher water and less land, which perfectly matches the existing conditions of Sri Lanka. On the other hand, the importers of this crop (Saudi Arabia, Qatar, United Arab Emirates, Kuwait, and Bahrain) have no expected capacity in the near future to reduce the imports. However, other high-ranking banana-producing countries, India and China, are more highly stressed in water. This expected gap between demand and supply can help Sir Lanka to maintain a balance between crop imports and exports. The second largest export is pepper to India. This crop also fits lower embedded water and even lower land. Both crops have higher prospects.
Lemons/limes and beans are water- and land-intensive crops. These crops are not the best crops to be exported. Although the importers for these crops are the same as those for banana, high much-embedded quantities of water and land make this export not feasible in the long term, although the quantities are low.
The most important fact for sustainable agricultural growth is the more effective use of land, labor, and other inputs through technological progress, social innovation, and new business models. Development of agriculture policy is strongly needed as the process has been initiated since 1995 [72]. To maintain its competitive position in the export agriculture market, Sri Lanka needs to develop effective strategies to address the various challenges that the industry faces.
Due to sufficiency in water resources, the export potential of the country can be untapped, supported with supporting policies and further development of water resources infrastructure. To overcome the higher imports of wheat crop, diversification of export products can be remarkably effective, and divergence from the traditional crops is strongly recommended.
Author Contributions
Conceptualization, M.A.U.R.T.; Methodology, Z.R. and M.A.U.R.T.; Software, Z.R. and M.A.U.R.T.; Validation, M.A.U.R.T.; Formal analysis, Z.R. and M.A.U.R.T.; Investigation, N.M. and M.A.U.R.T.; Resources, M.A.U.R.T.; Writing—original draft, M.A.U.R.T.; Writing—review and editing, M.A.U.R.T.; Visualization, M.A.U.R.T.; Supervision, N.M. and M.A.U.R.T.; Project administration, Z.R. and N.M.; Funding acquisition, Z.R. All authors have read and agreed to the published version of the manuscript.
Funding
This research received no external funding.
Data Availability Statement
Data available in a publicly accessible repository.
Conflicts of Interest
The authors declare no conflict of interest.
References
- FAO. Country Programming Framework for Sri Lanka. 2018. Available online: https://www.fao.org/3/i8778en/I8778EN.pdf (accessed on 4 January 2022).
- De Silva, C.; Weatherhead, E.; Knox, J.; Rodriguez-Diaz, J. Predicting the impacts of climate change—A case study of paddy irrigation water requirements in Sri Lanka. Agric. Water Manag. 2007, 93, 19–29. [Google Scholar] [CrossRef]
- Zhang, J.; Zhao, N.; Liu, X.; Liu, Y. Global virtual-land flow and saving through international cereal trade. J. Geogr. Sci. 2016, 26, 619–639. [Google Scholar] [CrossRef] [Green Version]
- Xu, Z.; Zhong, T.; Scott, S.; Tang, Y.; Xu, G.; He, Q. Links between China’s “virtual land use” and farmland loss. Can. J. Dev. Stud. 2018, 40, 29–47. [Google Scholar] [CrossRef]
- United Nations. World Population Policies, New York, 2013. Available online: https://www.un.org/en/development/desa/population/publications/pdf/policy/WPP2011/wpp2011.pdf (accessed on 4 January 2022).
- The Economics of Climate Change Mitigation: Policies and Options for Global Action Beyond 2012 OECD. Available online: https://www.oecd.org/env/cc/theeconomicsofclimatechangemitigationpoliciesandoptionsforglobalactionbeyond2012.htm (accessed on 10 January 2022).
- FAO. Agricultural Trade, Trade Policies and the Global Food System. 2000, pp. 232–264. Available online: https://www.fao.org/3/y4252e/y4252e09.pdf (accessed on 20 February 2022).
- Saji, S.; Umemoto, T.; Kida, H.; Sakata, K. Antitumor effect in peritoneal carcinomatosis of intraperitoneal administration of a streptococcal preparation, OK-432: I. Experimental study in the rat. J. Surg. Oncol. 1985, 30, 46–51. [Google Scholar] [CrossRef] [PubMed]
- Booth, K. National security and international relations. Int. Aff. 1991, 67, 319. [Google Scholar] [CrossRef]
- Lucertini, G.; Di Giustino, G. Urban and Peri-Urban Agriculture as a Tool for Food Security and Climate Change Mitigation and Adaptation: The Case of Mestre. Sustainability 2021, 13, 5999. [Google Scholar] [CrossRef]
- Qiang, W.; Niu, S.; Liu, A.; Kastner, T.; Bie, Q.; Wang, X.; Cheng, S. Trends in global virtual land trade in relation to agricultural products. Land Use Policy 2020, 92, 104439. [Google Scholar] [CrossRef]
- Konar, M.; Dalin, C.; Suweis, S.; Hanasaki, N.; Rinaldo, A.; Rodriguez-Iturbe, I. Water for food: The global virtual water trade network. Water Resour. Res. 2011, 47, 4–11. [Google Scholar] [CrossRef] [Green Version]
- Ray, C.; McInnes, D.; Sanderson, M. Virtual water: Its implications on agriculture and trade. Water Int. 2018, 43, 717–730. [Google Scholar] [CrossRef] [Green Version]
- Gunatilaka, A. Water security and related issues in Sri Lanka: The need for integrated water resource management (IWRM). J. Natl. Sci. Found. Sri Lanka 2008, 36, 3. [Google Scholar] [CrossRef]
- Dalin, C.; Konar, M.; Hanasaki, N.; Rinaldo, A.; Rodriguez-Iturbe, I. Evolution of the global virtual water trade network. Proc. Natl. Acad. Sci. USA 2012, 109, 5989–5994. [Google Scholar] [CrossRef] [PubMed] [Green Version]
- Hoekstra, A.Y.; Chapagain, A.K. Water footprints of nations: Water use by people as a function of their consumption pattern. Water Resour. Manag. 2006, 21, 35–48. [Google Scholar] [CrossRef]
- Huang, H.; von Lampe, M.; van Tongeren, F. Climate change and trade in agriculture. Food Policy 2011, 36, S9–S13. [Google Scholar] [CrossRef]
- Gkatsikos, A.; Mattas, K. The Paradox of the Virtual Water Trade Balance in the Mediterranean Region. Sustainability 2021, 13, 2978. [Google Scholar] [CrossRef]
- Ma, X.; Ma, Y. The spatiotemporal variation analysis of virtual water for agriculture and livestock husbandry: A study for Jilin Province in China. Sci. Total Environ. 2017, 586, 1150–1161. [Google Scholar] [CrossRef]
- Candido, L.A.; Coêlho, G.A.G.; de Moraes, M.M.G.A.; Florêncio, L. Review of Decision Support Systems and Allocation Models for Integrated Water Resources Management Focusing on Joint Water Quantity-Quality. J. Water Resour. Plan. Manag. 2022, 148, 03121001. [Google Scholar] [CrossRef]
- Würtenberger, L.; Koellner, T.; Binder, C.R. Virtual land use and agricultural trade: Estimating environmental and socio-economic impacts. Ecol. Econ. 2006, 57, 679–697. [Google Scholar] [CrossRef]
- Fader, M.; Gerten, D.; Thammer, M.; Heinke, J.; Lotze-Campen, H.; Lucht, W.; Cramer, W. Internal and external green-blue agricultural water footprints of nations, and related water and land savings through trade. Hydrol. Earth Syst. Sci. 2011, 15, 1641–1660. [Google Scholar] [CrossRef] [Green Version]
- Jayasiri, M.M.J.G.C.; Yadav, S.; Dayawansa, N.D.K.; Ingold, K. Managing agricultural water resources: Addressing the complexity of innovation, social perspectives, and water governance in Sri Lanka. Irrig. Drain. 2022, 71, 71–85. [Google Scholar] [CrossRef]
- Pawar, U.; Karunathilaka, P.; Rathnayake, U. Spatio-Temporal Rainfall Variability and Concentration over Sri Lanka. Adv. Meteorol. 2022, 2022, 6456761. [Google Scholar] [CrossRef]
- FAO; WFP. Special Report: FAO/WFP Crop and Food Security Assessment Mission to Sri Lanka, June 2017. Available online: https://www.fao.org/3/i7450e/i7450e.pdf (accessed on 3 March 2022).
- De Costa, W.J. Adaptation of agricultural crop production to climate change: A policy framework for Sri Lanka. J. Natl. Sci. Found. Sri Lanka 2010, 38, 79. [Google Scholar] [CrossRef]
- Evans, A.; Varma, S. Practicalities of participation in urban IWRM: Perspectives of wastewater management in two cities in Sri Lanka and Bangladesh. Nat. Resour. Forum 2009, 33, 19–28. [Google Scholar] [CrossRef]
- Gunaratne, M.S.; Firdaus, R.B.R.; Rathnasooriya, S.I. Climate change and food security in Sri Lanka: Towards food sovereignty. Humanit. Soc. Sci. Commun. 2021, 8, 229. [Google Scholar] [CrossRef]
- Tiseo, I. Water Stress Levels Globally by Country 2020. Statista, 5 September 2022. Available online: https://www.statista.com/statistics/1097524/water-stress-levels-by-country/#statisticContainer (accessed on 1 September 2022).
- Rijsberman, F.R. Water scarcity: Fact or fiction? Agric. Water Manag. 2006, 80, 5–22. [Google Scholar] [CrossRef] [Green Version]
- Abayawardana, S. Water Scarcity in Sri Lanka: Fact or Fiction? 2007. Available online: https://www.iwmi.cgiar.org/News_Room/Newsletters/Water_Matters/PDFs/Water%20Matters_Issue2-Final.pdf (accessed on 11 October 2022).
- Amarasingha, R.; Punyawardena, R.; Herath, R.; Jayawardena, S.; Jayakody, P.; Vuolo, M.R.; Fujisawa, M.; Heureux, A.; Kanamaru, H.; Manzanas, R.; et al. Climate Change Impacts on Crops in Sri Lanka; FAO: Rome, Italy, 2021. [Google Scholar] [CrossRef]
- Yamane, A. Climate Change and Hazardscape of Sri Lanka. Environ. Plan. A Econ. Space 2009, 41, 2396–2416. [Google Scholar] [CrossRef]
- EL Bilali, H.; Bassole, I.H.N.; Dambo, L.; Berjan, S. Climate change and food security. J. Agric. For. 2020, 66, 197–210. [Google Scholar] [CrossRef]
- Barnett, J. Dangerous climate change in the Pacific Islands: Food production and food security. Reg. Environ. Change 2010, 11, 229–237. [Google Scholar] [CrossRef]
- Schmidhuber, J.; Tubiello, F.N. Global food security under climate change. Proc. Natl. Acad. Sci. USA 2007, 104, 19703–19708. [Google Scholar] [CrossRef] [Green Version]
- Chen, Z.-M.; Chen, G. Virtual water accounting for the globalized world economy: National water footprint and international virtual water trade. Ecol. Indic. 2012, 28, 142–149. [Google Scholar] [CrossRef]
- Hoekstra, A.; Hung, P. Globalisation of water resources: International virtual water flows in relation to crop trade. Glob. Environ. Change 2005, 15, 45–56. [Google Scholar] [CrossRef]
- Chapagain, A.K.; Hoekstra, A.Y.; Savenije, H.H.G. Water saving through international trade of agricultural products. Hydrol. Earth Syst. Sci. 2006, 10, 455–468. [Google Scholar] [CrossRef] [Green Version]
- Mekonnen, M.; Hoekstra, A. National Water Footprint Accounts: The Green, Blue and Grey Water Footprint of Production and Consumption. Volume 1: Main Report. Daugherty Water for Food Global Institute: Faculty Publications, May 2011. Available online: https://digitalcommons.unl.edu/wffdocs/85 (accessed on 4 January 2022).
- Mekonnen, M.M.; Hoekstra, A.Y. The green, blue and grey water footprint of crops and derived crop products. Hydrol. Earth Syst. Sci. 2011, 15, 1577–1600. [Google Scholar] [CrossRef] [Green Version]
- Zhang, Y.; Zhang, J.-H.; Tian, Q.; Liu, Z.-H.; Zhang, H.-L. Virtual water trade of agricultural products: A new perspective to explore the Belt and Road. Sci. Total. Environ. 2018, 622–623, 988–996. [Google Scholar] [CrossRef]
- Zeitoun, M.; Allan, J.; Mohieldeen, Y. Virtual water ‘flows’ of the Nile Basin, 1998–2004: A first approximation and implications for water security. Glob. Environ. Change 2010, 20, 229–242. [Google Scholar] [CrossRef]
- Selim, K.S.; Abdalbaki, S.M. On the relationship between virtual water network and crops intra-trade among Nile basin countries. Water Policy 2019, 21, 481–495. [Google Scholar] [CrossRef]
- El-Sadek, A. Virtual Water Trade as a Solution for Water Scarcity in Egypt. Water Resour. Manag. 2009, 24, 2437–2448. [Google Scholar] [CrossRef]
- Fu, T.; Xu, C.; Huang, X. Analysis of Virtual Water Trade Flow and Driving Factors in the European Union. Water 2021, 13, 1771. [Google Scholar] [CrossRef]
- Mohammadi-Kanigolzar, F.; Ameri, J.D.; Motee, N. Virtual Water Trade as a Strategy to Water Resource Management in Iran. J. Water Resour. Prot. 2014, 6, 141–148. [Google Scholar] [CrossRef] [Green Version]
- Brindha, K. Virtual water flows, water footprint and water savings from the trade of crop and livestock products of Germany. Water Environ. J. 2020, 34, 656–668. [Google Scholar] [CrossRef]
- Qasemipour, E.; Tarahomi, F.; Pahlow, M.; Sadati, S.S.M.; Abbasi, A. Assessment of Virtual Water Flows in Iran Using a Multi-Regional Input-Output Analysis. Sustainability 2020, 12, 7424. [Google Scholar] [CrossRef]
- Faramarzi, M.; Yang, H.; Mousavi, J.; Schulin, R.; Binder, C.R.; Abbaspour, K.C. Analysis of intra-country virtual water trade strategy to alleviate water scarcity in Iran. Hydrol. Earth Syst. Sci. 2010, 14, 1417–1433. [Google Scholar] [CrossRef] [Green Version]
- Konar, M.; Caylor, K.K. Virtual water trade and development in Africa. Hydrol. Earth Syst. Sci. 2013, 17, 3969–3982. [Google Scholar] [CrossRef] [Green Version]
- Zhang, Y.; Zhang, J.; Tang, G.; Chen, M.; Wang, L. Virtual water flows in the international trade of agricultural products of China. Sci. Total Environ. 2016, 557–558, 1–11. [Google Scholar] [CrossRef]
- Guan, D.; Hubacek, K. Assessment of regional trade and virtual water flows in China. Ecol. Econ. 2007, 61, 159–170. [Google Scholar] [CrossRef] [Green Version]
- Brindha, K. International virtual water flows from agricultural and livestock products of India. J. Clean. Prod. 2017, 161, 922–930. [Google Scholar] [CrossRef]
- Chouchane, H.; Hoekstra, A.Y.; Krol, M.S.; Mekonnen, M.M. The water footprint of Tunisia from an economic perspective. Ecol. Indic. 2015, 52, 311–319. [Google Scholar] [CrossRef] [Green Version]
- Tian, X.; Bruckner, M.; Geng, Y.; Bleischwitz, R. Trends and driving forces of China’s virtual land consumption and trade. Land Use Policy 2019, 89, 104194. [Google Scholar] [CrossRef]
- Wu, S.; Ben, P.; Chen, D.; Chen, J.; Tong, G.; Yuan, Y.; Xu, B. Virtual land, water, and carbon flow in the inter-province trade of staple crops in China. Resour. Conserv. Recycl. 2018, 136, 179–186. [Google Scholar] [CrossRef]
- Yawson, D.O. Estimating virtual land use under future conditions: Application of a food balance approach using the UK. Land Use Policy 2020, 101, 105132. [Google Scholar] [CrossRef]
- Allan, J.A. Global Systems Ameliorate Local Droughts: Water, Food and Trade. In Drought and Drought Mitigation in Europe; Springer: Berlin/Heidelberg, Germany, 2000; Volume 14, pp. 265–277. [Google Scholar] [CrossRef]
- Yang, H.; Zehnder, A.J. Water Scarcity and Food Import: A Case Study for Southern Mediterranean Countries. World Dev. 2002, 30, 1413–1430. [Google Scholar] [CrossRef]
- Wichelns, D. The role of ‘virtual water’ in efforts to achieve food security and other national goals, with an example from Egypt. Agric. Water Manag. 2001, 49, 131–151. [Google Scholar] [CrossRef]
- Rees, W.E. Ecological Footprints and Appropriated Carrying Capacity: What Urban Economics Leaves Out. Earthscan Read. Rural. Link. 2018, 4, 285–297. [Google Scholar] [CrossRef]
- Bell, E.W.; Borgstrom, G. The Hungry Planet, the Modern World at the Edge of Famine. J. Farm Econ. 1966, 48, 762–764. [Google Scholar] [CrossRef]
- Erb, K.-H. Actual land demand of Austria 1926–2000: A variation on Ecological Footprint assessments. Land Use Policy 2004, 21, 247–259. [Google Scholar] [CrossRef]
- Kastner, T.; Nonhebel, S. Changes in land requirements for food in the Philippines: A historical analysis. Land Use Policy 2010, 27, 853–863. [Google Scholar] [CrossRef]
- Kissinger, M.; Rees, W.E. Importing terrestrial biocapacity: The U.S. case and global implications. Land Use Policy 2010, 27, 589–599. [Google Scholar] [CrossRef]
- Gerten, D.; Heinke, J.; Hoff, H.; Biemans, H.; Fader, M.; Waha, K. Global Water Availability and Requirements for Future Food Production. J. Hydrometeorol. 2011, 12, 885–899. [Google Scholar] [CrossRef]
- Ferng, J.-J. Measuring and locating footprints: A case study of Taiwan's rice and wheat consumption footprint. Ecol. Econ. 2011, 71, 191–201. [Google Scholar] [CrossRef]
- Lo, M.-H.; Famiglietti, J.; Yeh, P.J.-F.; Syed, T. Improving parameter estimation and water table depth simulation in a land surface model using GRACE water storage and estimated base flow data. Water Resour. Res. 2010, 46, 5–11. [Google Scholar] [CrossRef]
- Kissinger, M.; Gottlieb, D. Place oriented ecological footprint analysis—The case of Israel's grain supply. Ecol. Econ. 2010, 69, 1639–1645. [Google Scholar] [CrossRef]
- Moran, D.D.; Wackernagel, M.C.; Kitzes, J.A.; Heumann, B.W.; Phan, D.; Goldfinger, S.H. Trading spaces: Calculating embodied Ecological Footprints in international trade using a Product Land Use Matrix (PLUM). Ecol. Econ. 2009, 68, 1938–1951. [Google Scholar] [CrossRef]
- Villholth, K.G.; Rajasooriyar, L.D. Groundwater Resources and Management Challenges in Sri Lanka—An Overview. Water Resour. Manag. 2009, 24, 1489–1513. [Google Scholar] [CrossRef]
- Hoekstra, A.Y.; Hung, P.Q. Virtual water trade: A quantification of virtual water flows between nations in relation to international crop trade. In Proceedings of the International Expert Meeting on Virtual Water Trade, Delft, The Netherlands, 12–13 December 2002; pp. 25–47. Available online: https://ci.nii.ac.jp/naid/10029232667 (accessed on 5 May 2021).
- Seo, S.-N.N.; Mendelsohn, R.; Munasinghe, M. Climate change and agriculture in Sri Lanka: A Ricardian valuation. Environ. Dev. Econ. 2005, 10, 581–596. [Google Scholar] [CrossRef] [Green Version]
- Nandasena, W.D.K.V.; Brabyn, L.; Serrao-Neumann, S. Using Google Earth Engine to classify unique forest and agroforest classes using a mix of Sentinel 2a spectral data and topographical features: A Sri Lanka case study. Geocarto Int. 2021, 1–16. [Google Scholar] [CrossRef]
- Peiris, H.M.P.; Gunarathne, N. The Changing Landscape of the Plantation Sector in the Central Highlands of Sri Lanka; Springer: Berlin/Heidelberg, Germany, 2021; pp. 539–554. [Google Scholar] [CrossRef]
- Kodikara, A.G.K.S.; Attanayake, C.P.; Vitharana, U.W.A. Spatial Variability of Cadmium and Lead in Surface Soils in-relation to Landuse and Topography. In Proceedings of the International Forestry and Environment Symposium, Negambo, Sri Lanka, 10–12 October 2019. [Google Scholar] [CrossRef]
- Shelton, S.; Pushpawela, B. Observed southwest monsoon rainfall changes in Sri Lanka and possible mechanisms. Model. Earth Syst. Environ. 2022, 8, 4165–4175. [Google Scholar] [CrossRef]
- Abeysingha, N.S. A Review of Recent Changes in Rainfall Trend in Sri Lanka. Trop. Agric. Res. Ext. 2022, 25, 4–8. [Google Scholar] [CrossRef]
- Centre for Climate Change Studies. Climate of Sri Lanka, Department of Meteorology. Available online: https://www.meteo.gov.lk/index.php?option=com_content&view=article&id=94&Itemid=310&lang=en (accessed on 23 June 2022).
- Senanayake, S.; Pradhan, B.; Huete, A.; Brennan, J. Spatial modeling of soil erosion hazards and crop diversity change with rainfall variation in the Central Highlands of Sri Lanka. Sci. Total Environ. 2022, 806, 150405. [Google Scholar] [CrossRef]
- Jayawardena, I.M.S.P.; Darshika, D.W.T.T.; Herath, H.M.R.C. Recent Trends in Climate Extreme Indices over Sri Lanka. Am. J. Clim. Change 2018, 07, 586–599. [Google Scholar] [CrossRef] [Green Version]
- Alexander, L.V.; Zhang, X.; Peterson, T.C.; Caesar, J.; Gleason, B.; Tank, A.M.G.K.; Haylock, M.; Collins, D.; Trewin, B.; Rahimzadeh, F.; et al. Global observed changes in daily climate extremes of temperature and precipitation. J. Geophys. Res. Atmos. 2006, 111, 1042–1063. [Google Scholar] [CrossRef] [Green Version]
- Shelton, S.; Pushpawela, B.; Liyanage, G. The long-term trend in the diurnal temperature range over Sri Lanka from 1985 to 2017 and its association with total cloud cover and rainfall. J. Atmos. Solar-Terr. Phys. 2021, 227, 105810. [Google Scholar] [CrossRef]
- Trading Economics. Sri Lanka Balance of Trade. 2022. Available online: https://tradingeconomics.com/sri-lanka/balance-of-trade (accessed on 22 August 2022).
- Central Bank of Sri Lanka. Monthly Trade Bulletin. 2022. Available online: https://www.cbsl.gov.lk/en/monthly-trade-bulletin (accessed on 22 August 2022).
- FAO. Global Information and Early Warning System. 2022. Available online: https://www.fao.org/giews/countrybrief/country.jsp?code=LKA&lang=en (accessed on 22 August 2022).
- Khan, H.; Weili, L.; Khan, I. Environmental innovation, trade openness and quality institutions: An integrated investigation about environmental sustainability. Environ. Dev. Sustain. 2021, 24, 3832–3862. [Google Scholar] [CrossRef]
- Miglietta, P.P.; Fischer, C.; De Leo, F. Virtual water flows and economic water productivity of Italian fair-trade: The case of bananas, cocoa and coffee. Br. Food J. 2021, 124, 4009–4023. [Google Scholar] [CrossRef]
- Nishad, S.N.; Kumar, N. Virtual water trade and its implications on water sustainability. Water Supply 2021, 22, 1704–1715. [Google Scholar] [CrossRef]
- Sun, J.; Yin, Y.; Sun, S.; Wang, Y.; Yu, X.; Yan, K. Review on research status of virtual water: The perspective of accounting methods, impact assessment and limitations. Agric. Water Manag. 2021, 243, 106407. [Google Scholar] [CrossRef]
- FAO. “CropWat|”, Food ang Agriculture Organization of the United Nations. 2022. Available online: https://www.fao.org/land-water/databases-and-software/cropwat/en/ (accessed on 20 November 2022).
- McNaughton, K.; Jarvis, P. Using the Penman-Monteith equation predictively. Agric. Water Manag. 1984, 8, 263–278. [Google Scholar] [CrossRef]
- Biemans, H.; Siderius, C.; Mishra, A.; Ahmad, B. Crop-specific seasonal estimates of irrigation-water demand in South Asia. Hydrol. Earth Syst. Sci. 2016, 20, 1971–1982. [Google Scholar] [CrossRef]
- Smith, M. Expert Consultation on Revision of FAO Methodologies for Crop Water Requirements; Food and Agriculture Organization: Roma, Italy, 1992. [Google Scholar] [CrossRef]
- Weisz, R.N.; Day, J.C. A regional planning approach to the floodplain management problem. Ann. Reg. Sci. 1975, 9, 80–92. [Google Scholar] [CrossRef]
- EUROSTAT. Eurostat Database. 2021. Available online: https://ec.europa.eu/eurostat/web/main/data/database (accessed on 4 December 2021).
- USDA. Global Agricultural Trade System, United Stares Department of Agriculture. 2022. Available online: https://apps.fas.usda.gov/gats/default.aspx (accessed on 16 November 2022).
- FAOSTAT. Statistical Databases of the Food and Agriculture Organization of the United Nations. 2020. Available online: http://www.fao.org/faostat/en/#home (accessed on 18 November 2022).
- United Nations. International Merchandise Trade. UNCTAD STAT. 2022. Available online: https://unctadstat.unctad.org/wds/ReportFolders/reportFolders.aspx?sCS_ChosenLang=en (accessed on 16 November 2019).
- Chatham House. Resource Trade Earth, The Royal Institute of International Affairs. 2020. Available online: https://resourcetrade.earth/ (accessed on 20 November 2022).
- World Bank International Cooperation on Trade. 2019, pp. 214–237. Available online: https://elibrary.worldbank.org/doi/10.1596/978-1-4648-1457-0_ch9 (accessed on 23 November 2022).
- World Bank. Arable Land (Hectares per Person)|Data. 2022. Available online: https://data.worldbank.org/indicator/AG.LND.ARBL.HA.PC (accessed on 25 November 2022).
- Kaatrud, M.D.; Country, M.B.B. Focal Points: Sri Lanka Country Strategic Plan (2018–2022). World Food Program. 2017. Available online: http://executiveboard.wfp.org (accessed on 9 August 2022).
- Dayananda, N.R. A Contemporary Approach for an Updated Food Safety and Security Strategy for Sri Lanka. Natl. Sci. Technol. Comm. 2022. Available online: https://www.researchgate.net/publication/362303035 (accessed on 9 August 2022).
- Dharmaratne, T.A. Tural Statistics: The Sri Lankan Experiences of Developing Agricultural Marketing Information Service for Small Farmers. In Proceedings of the Fourth International Conference on Agricultural Statistics (ICAS-4): Advancing Statistical Integration and Analysis (ASIA), Beijing, China, 22–24 October 2007. [Google Scholar]
- FAO Publications Catalogue. 2022. Available online: https://www.fao.org/documents/card/en/c/cc2323en (accessed on 25 November 2022).
Figure 1.
Baseline water stress score worldwide in 2020 (data source: Statista [29]).
Figure 1.
Baseline water stress score worldwide in 2020 (data source: Statista [29]).

Figure 2.
Relative change in agricultural area from 1500–2016 (data source: Statista).

Figure 3.
(A) Gross virtual water trade between world regions in the period 1995–1999 (Gm3), (B) net virtual water imports of central and southern Asian countries (106 m3/yr).
Figure 3.
(A) Gross virtual water trade between world regions in the period 1995–1999 (Gm3), (B) net virtual water imports of central and southern Asian countries (106 m3/yr).

Figure 4.
Projection of population increase in Sri Lanka (source: United Nations—World Population Prospects).
Figure 4.
Projection of population increase in Sri Lanka (source: United Nations—World Population Prospects).

Figure 5.
Monthly average precipitation (mm), relative humidity (%), wind speed (km/hr), and maximum/minimum temperature (°C) for Sri Lanka.
Figure 5.
Monthly average precipitation (mm), relative humidity (%), wind speed (km/hr), and maximum/minimum temperature (°C) for Sri Lanka.

Figure 6.
Steps in calculation of virtual water trade.

Figure 7.
Map of countries exporting crops to Sri Lanka. Darker color means higher.

Figure 8.
Imports in 2020 with details of countries for each top import crop.

Figure 9.
Top importers of Sri Lankan crops based on trade data 2010–2020.

Figure 10.
Top nine crops of Sri Lanka and their export details based on trade data 2020.

Figure 11.
Imports of Sri Lanka during 2010–2020: (A) total quantities, (B) virtual water, (C) virtual land for top ten crops.
Figure 11.
Imports of Sri Lanka during 2010–2020: (A) total quantities, (B) virtual water, (C) virtual land for top ten crops.

Figure 12.
Top ten countries exporting crops to Sri Lanka during 2010–2020: (A) total quantities, (B) virtual water, (C) virtual land for top ten crops.
Figure 12.
Top ten countries exporting crops to Sri Lanka during 2010–2020: (A) total quantities, (B) virtual water, (C) virtual land for top ten crops.

Figure 13.
Exports of Sri Lanka during 2010–2020: (A) total quantities, (B) virtual water, (C) virtual land for top nine crops.
Figure 13.
Exports of Sri Lanka during 2010–2020: (A) total quantities, (B) virtual water, (C) virtual land for top nine crops.

Figure 14.
Top ten countries importing from Sri Lanka during 2010–2020: (A) total quantities, (B) virtual water, (C) virtual land for top nine crops.
Figure 14.
Top ten countries importing from Sri Lanka during 2010–2020: (A) total quantities, (B) virtual water, (C) virtual land for top nine crops.

Figure 15.
Sri Lankan imports, exports, and net flow in terms of quantities, virtual water, and virtual land from 2010 to 2020.
Figure 15.
Sri Lankan imports, exports, and net flow in terms of quantities, virtual water, and virtual land from 2010 to 2020.

Figure 16.
Ratios of virtual quantities with annual net trade shows there is a trend of crops that contain lower virtual quantities.
Figure 16.
Ratios of virtual quantities with annual net trade shows there is a trend of crops that contain lower virtual quantities.

Figure 17.
Water stress and arable land stress values normalized for the top trade partners: (A) shows the normalized ranking of water stress ranging from zero to one (bottom to top), whereas (B) shows the arable land stress for the trade partners. The green shading shows the countries supplying crops to Sri Lanka, while the red shows the countries receiving the crops.

Figure 18.
Embodied virtual quantities normalized for the top trade crops: (A) shows the water contents ranging from zero to one (bottom to top), whereas (B) shows the land contents. The green glow shows the imports; the red glow shows exports.
Figure 18.
Embodied virtual quantities normalized for the top trade crops: (A) shows the water contents ranging from zero to one (bottom to top), whereas (B) shows the land contents. The green glow shows the imports; the red glow shows exports.

Figure 19.
Water and land stress for trade partners (on left) and embodied water and land contents for the top crop trades (on right).
Figure 19.
Water and land stress for trade partners (on left) and embodied water and land contents for the top crop trades (on right).


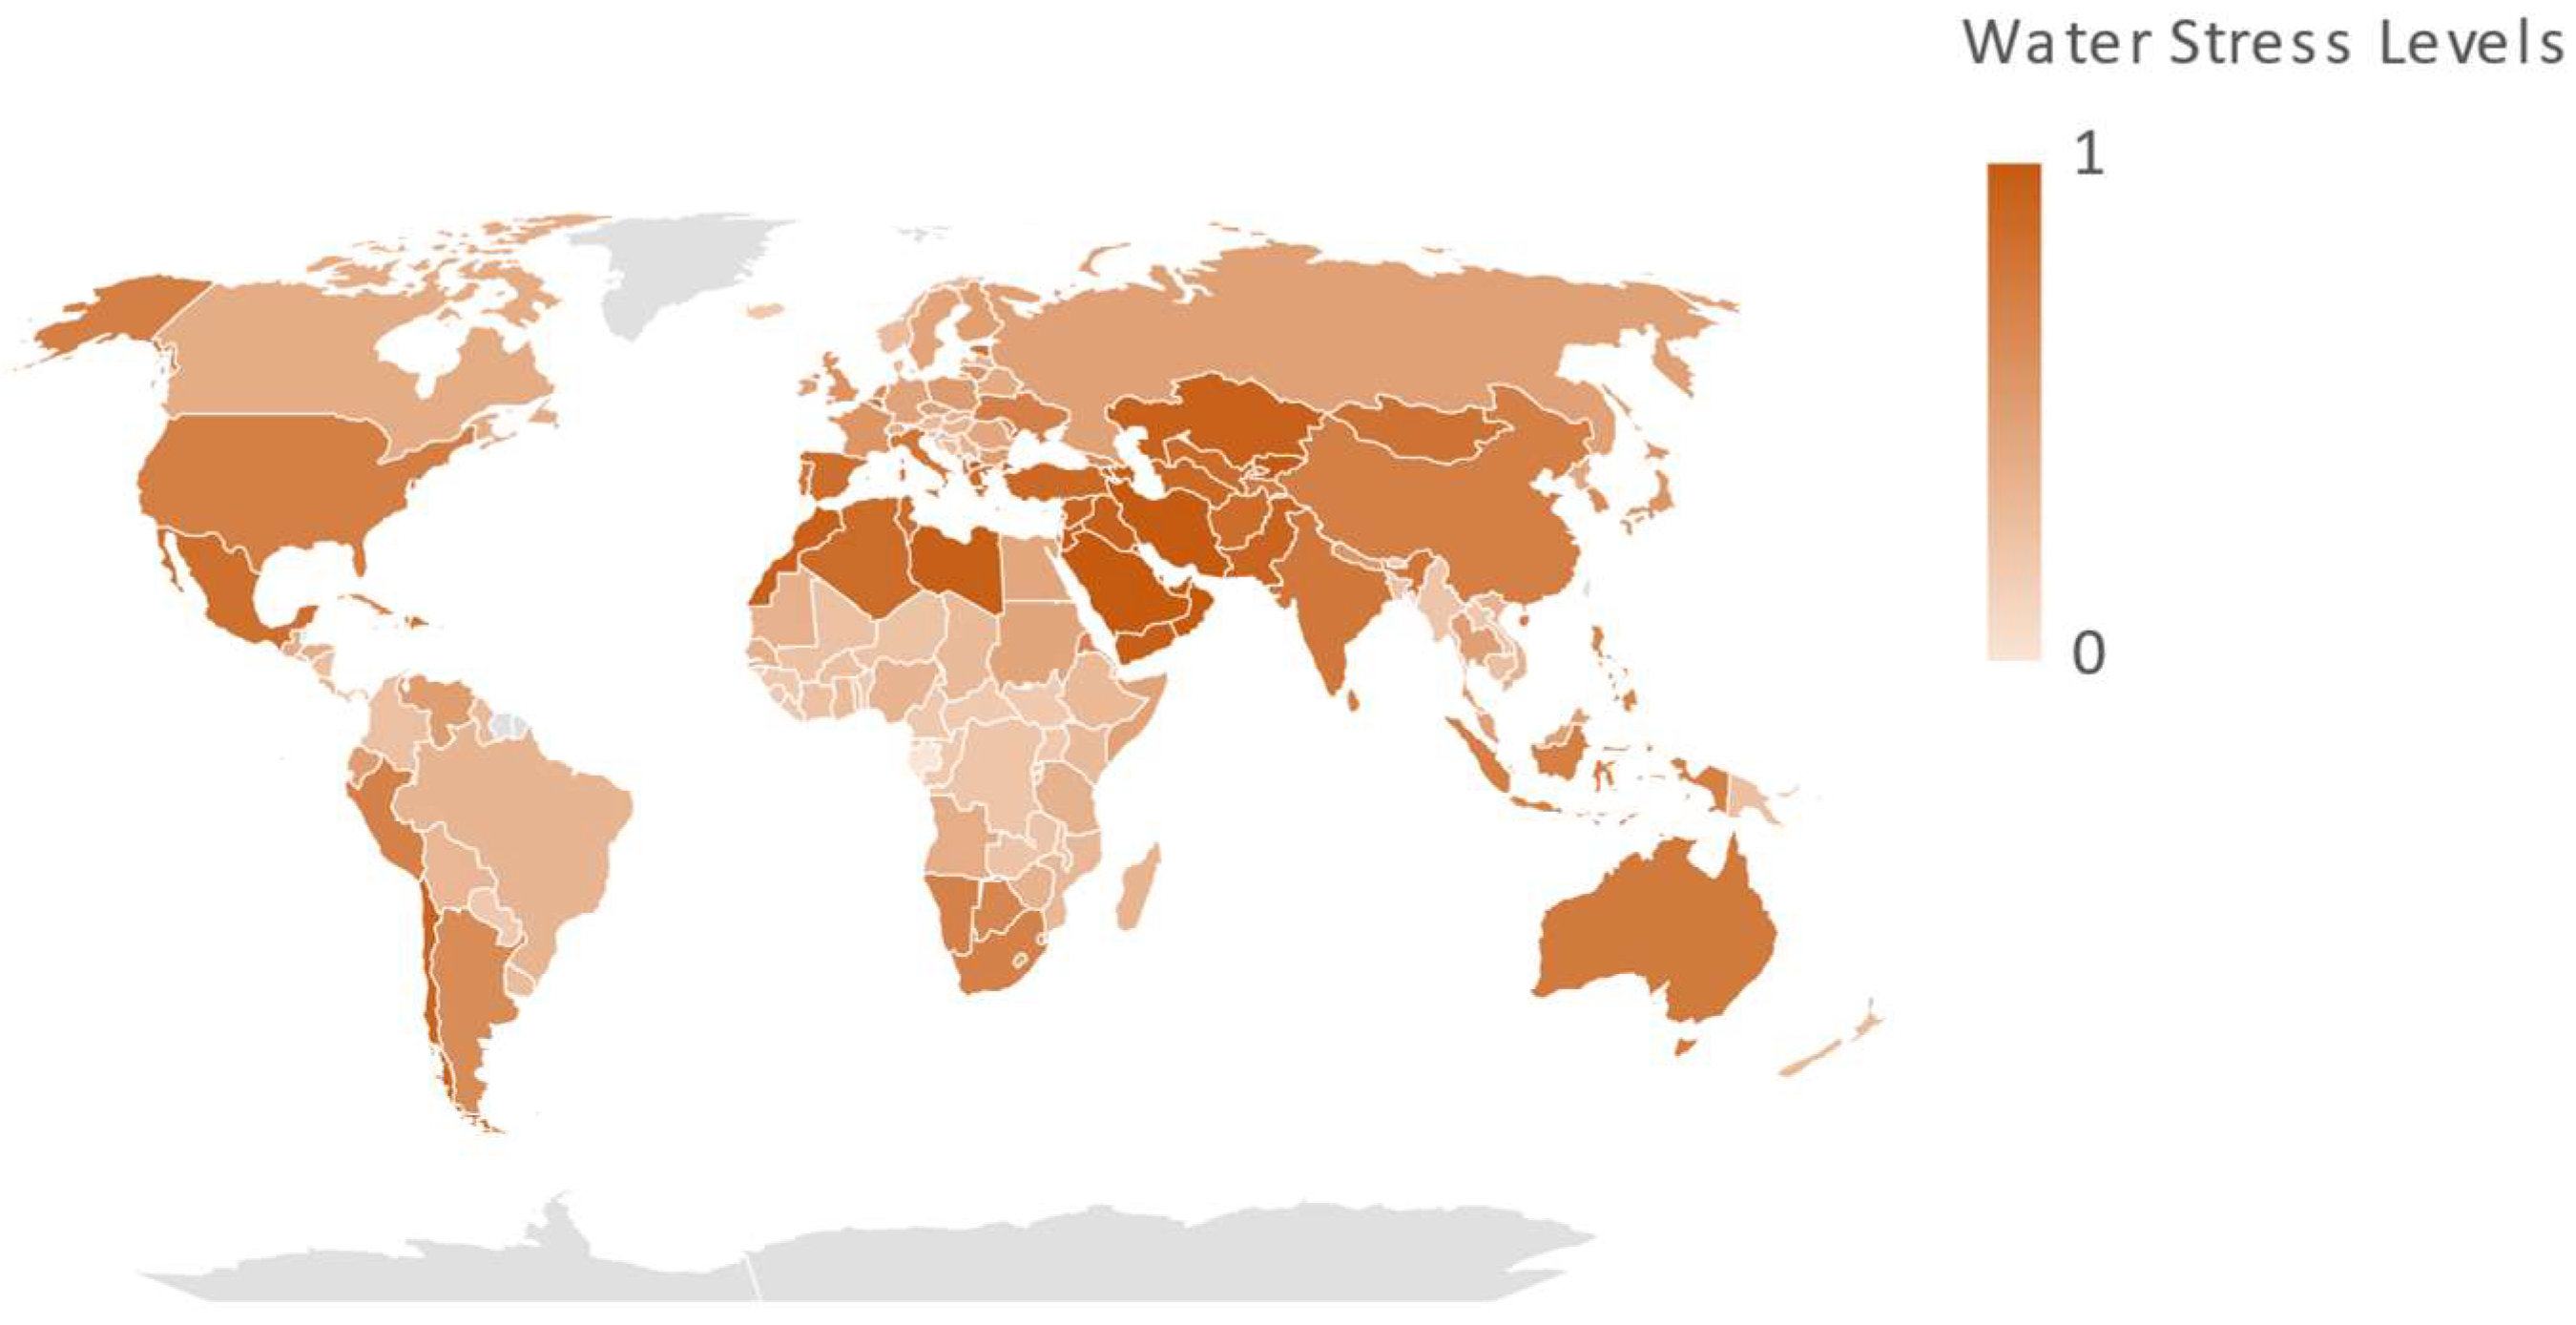
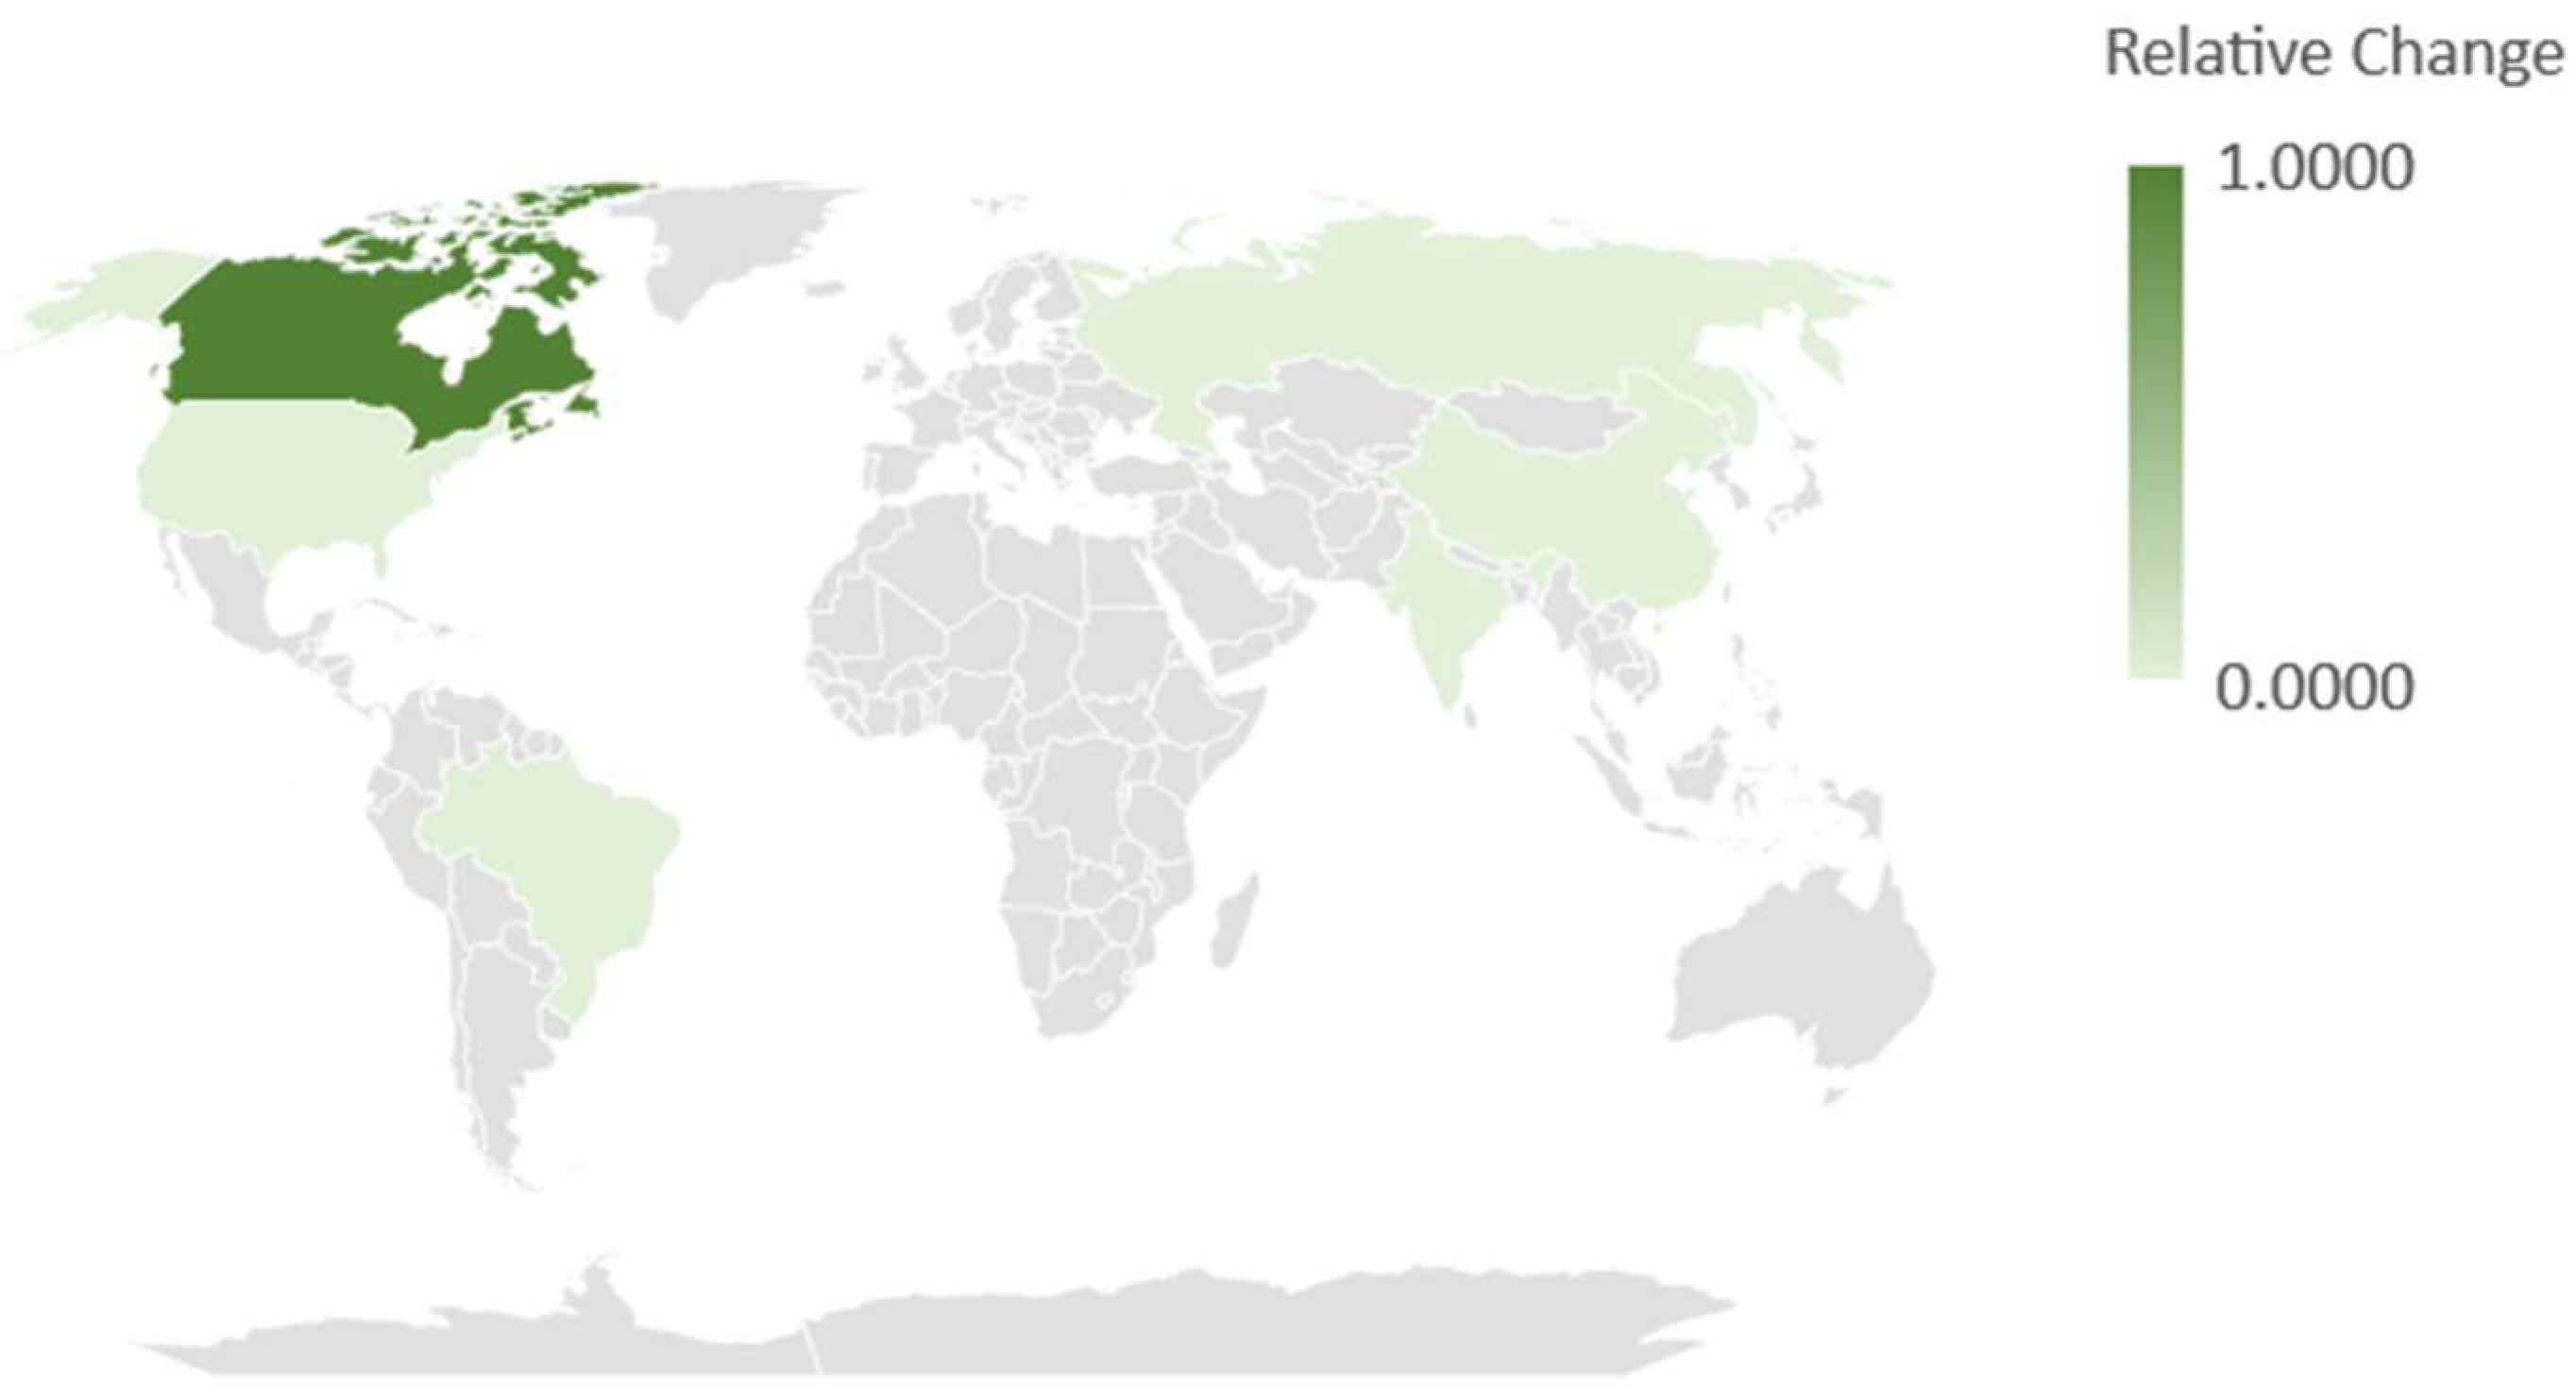
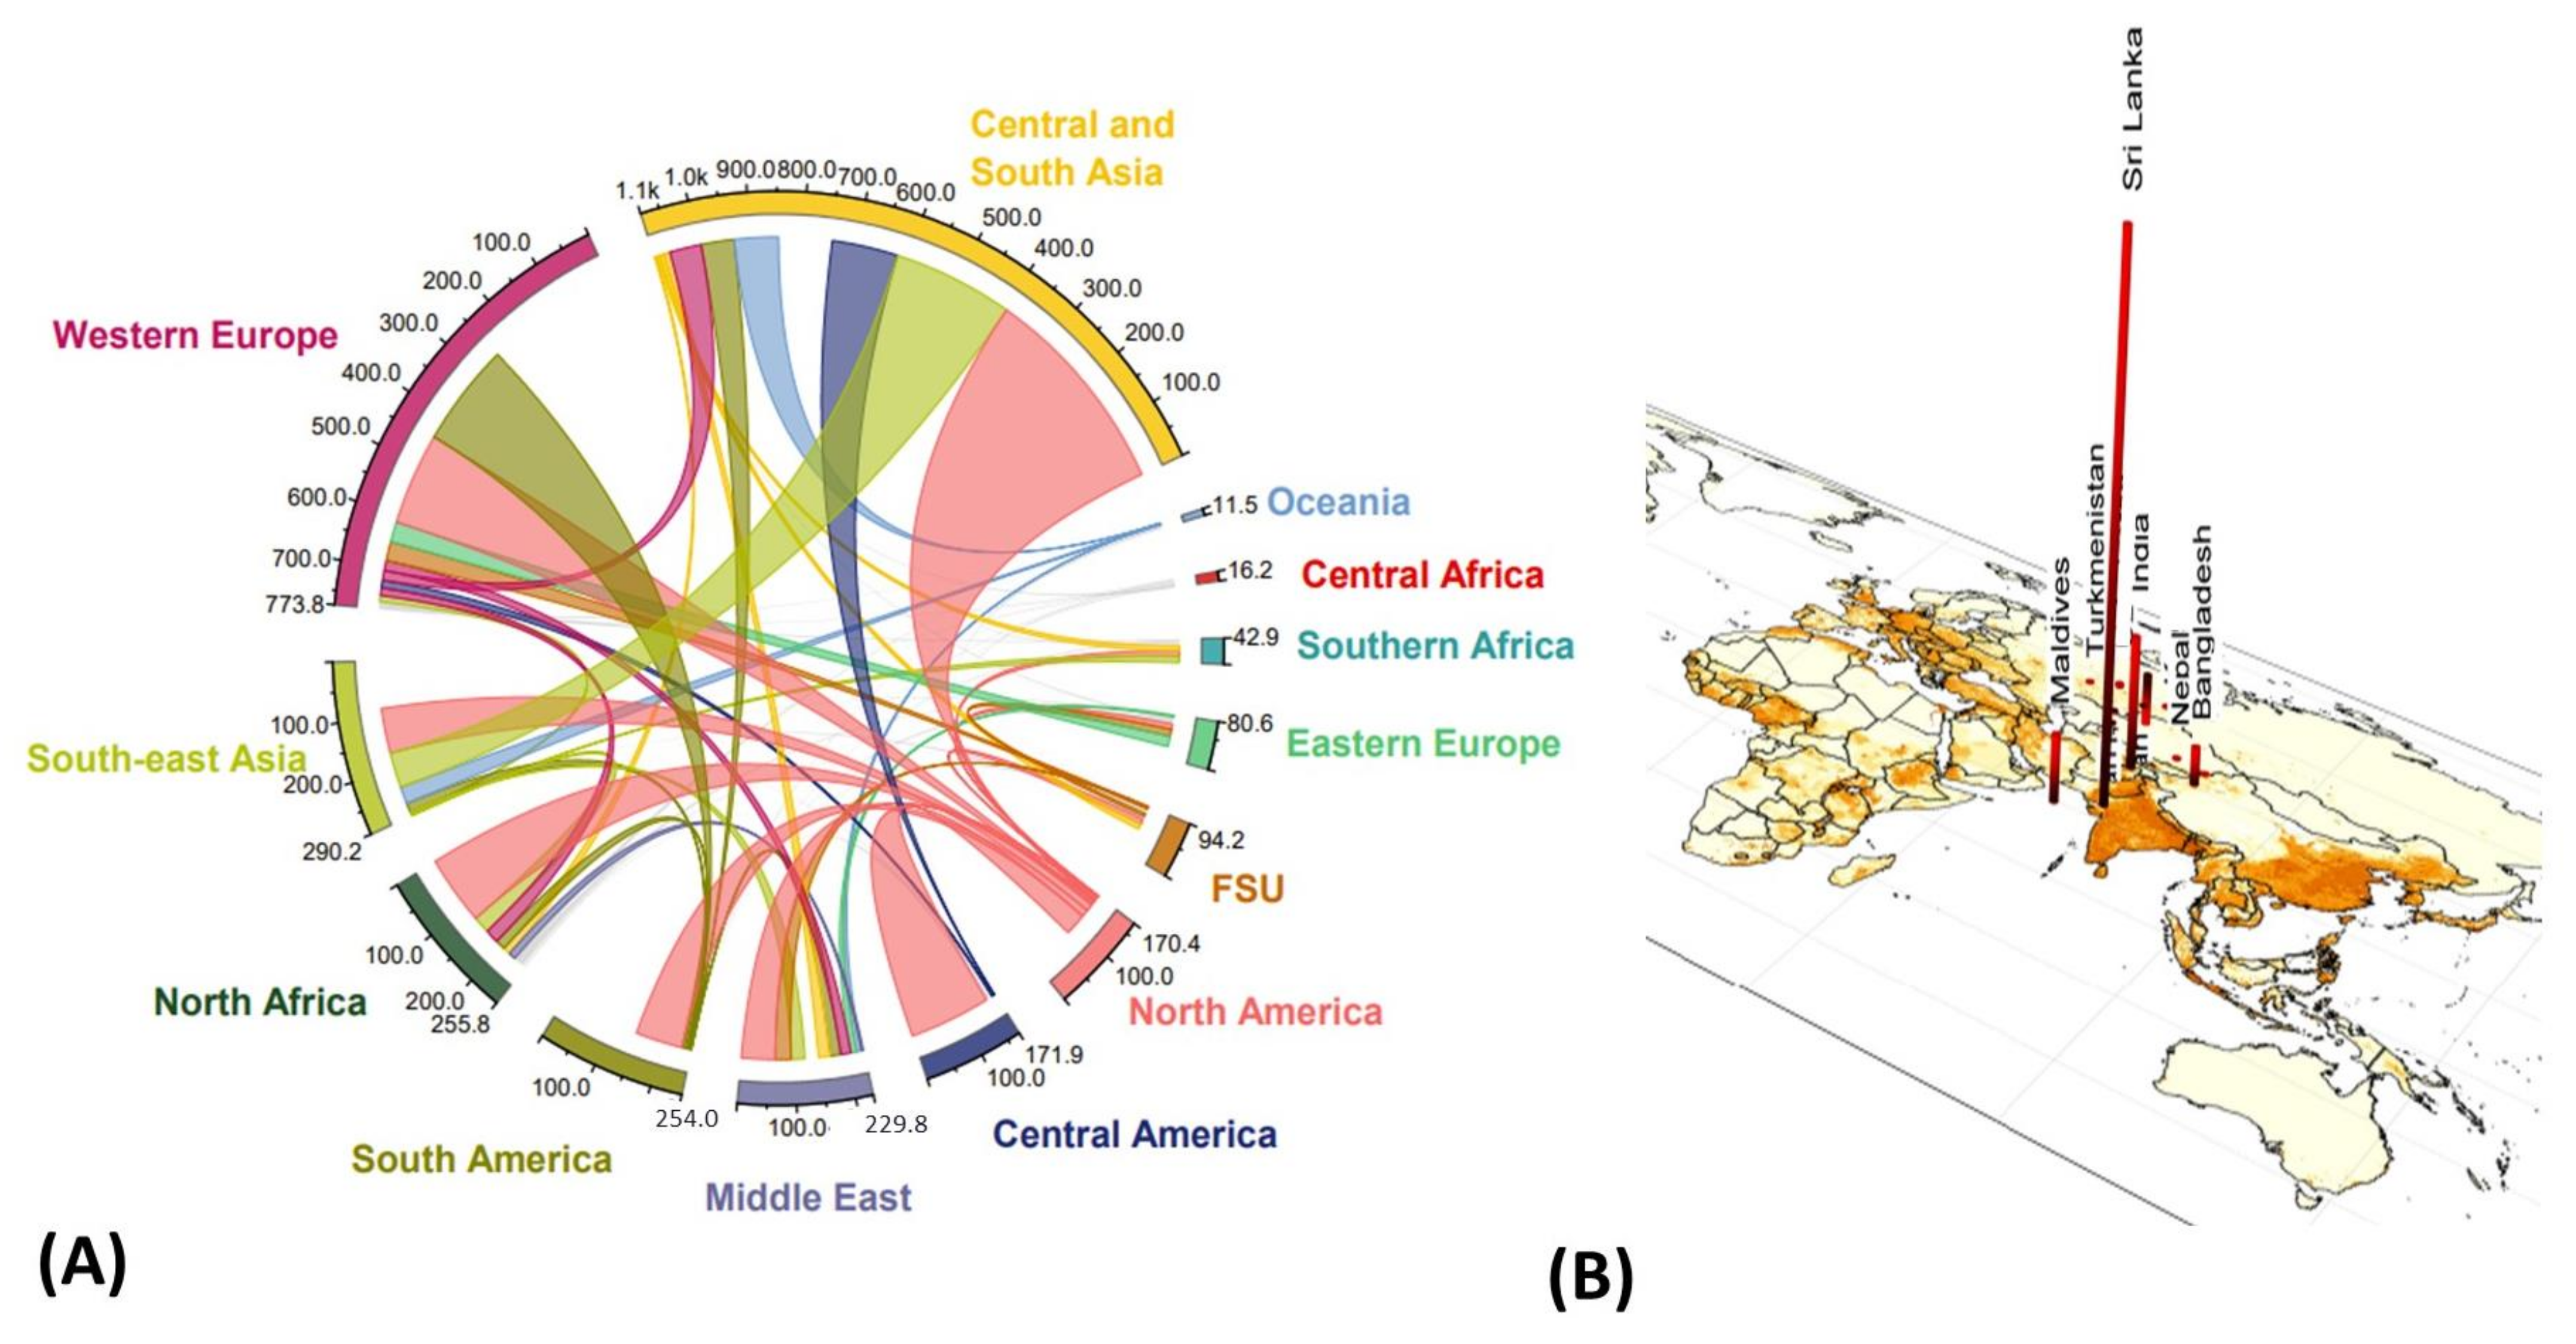
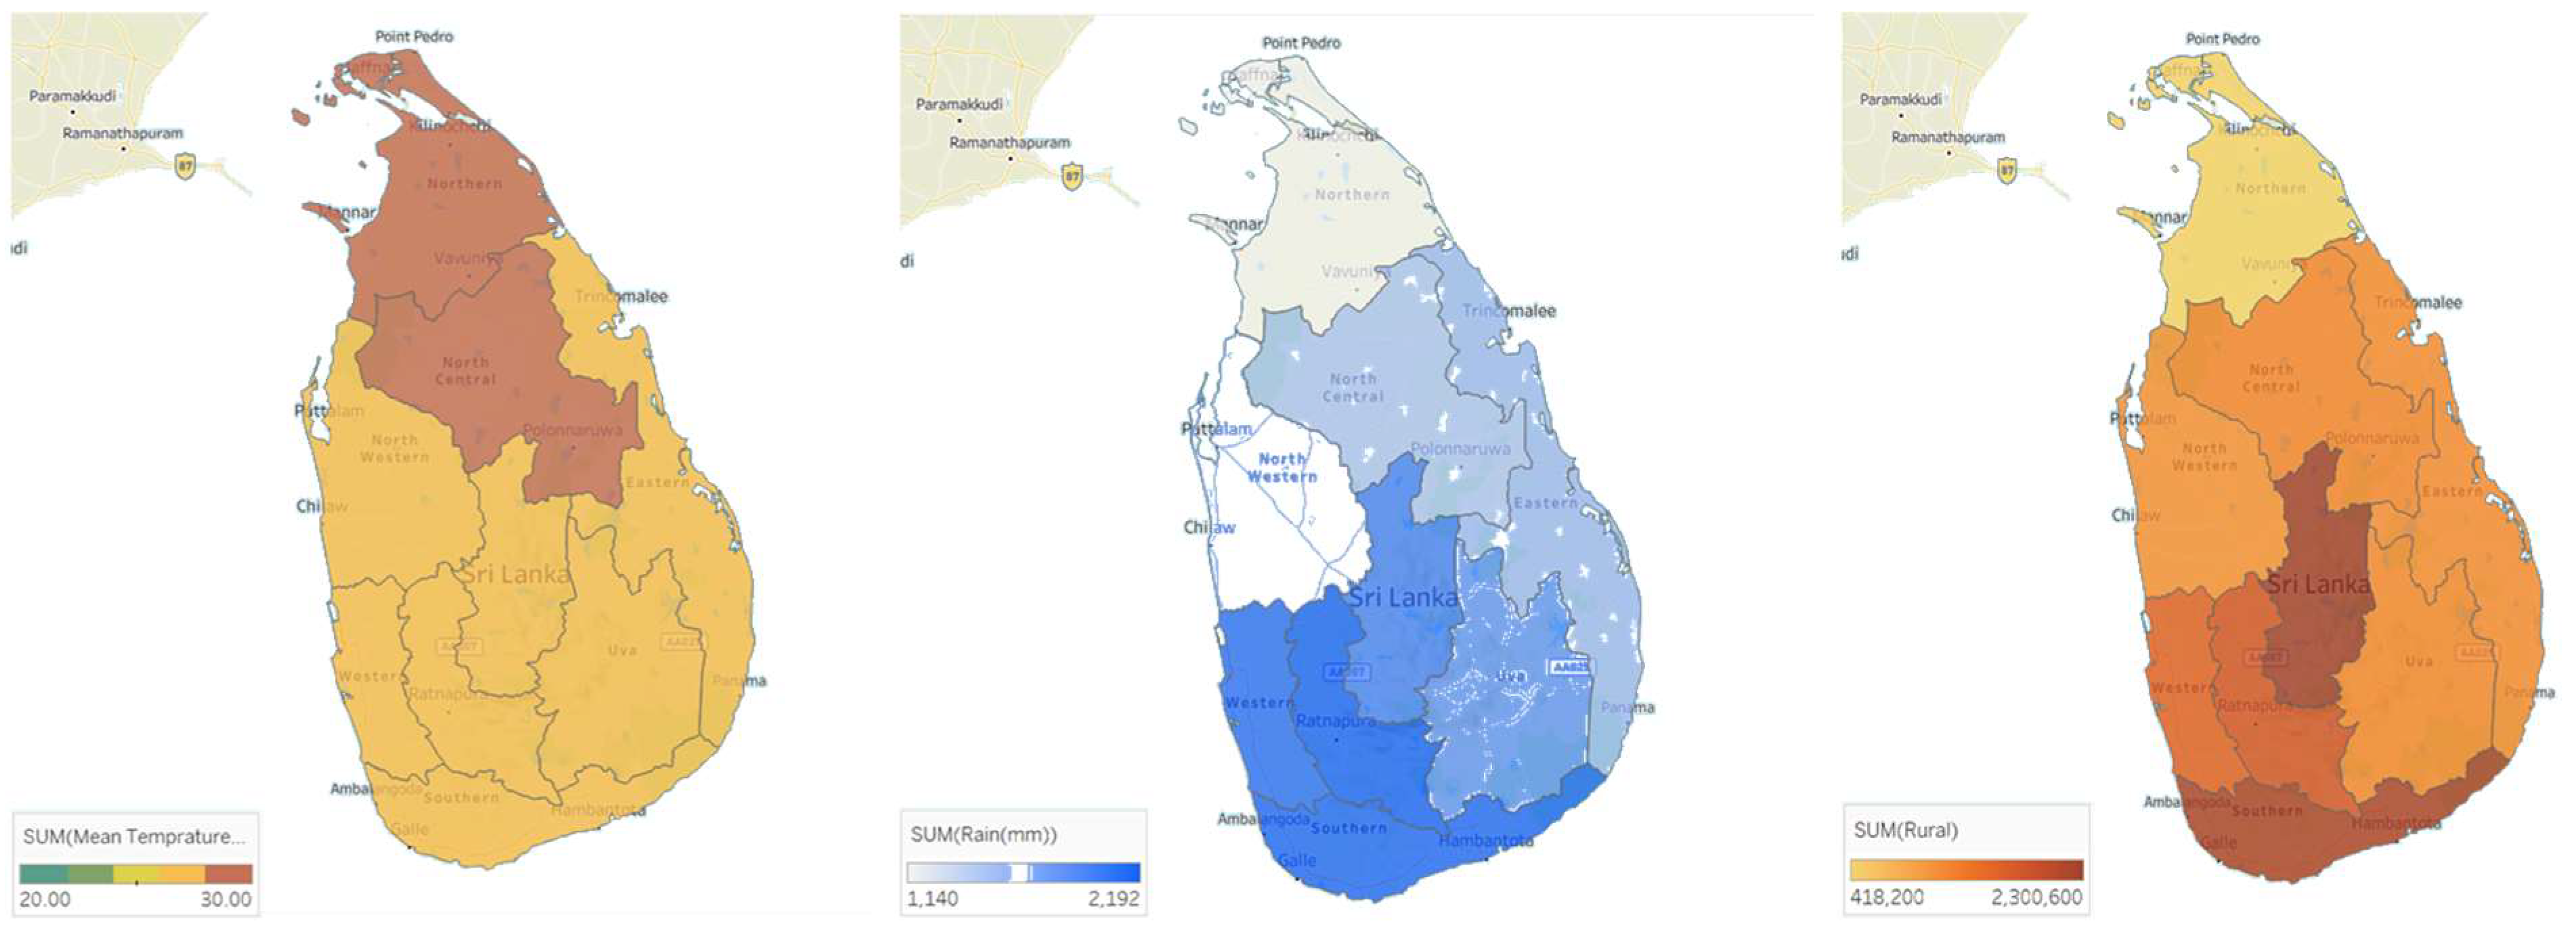
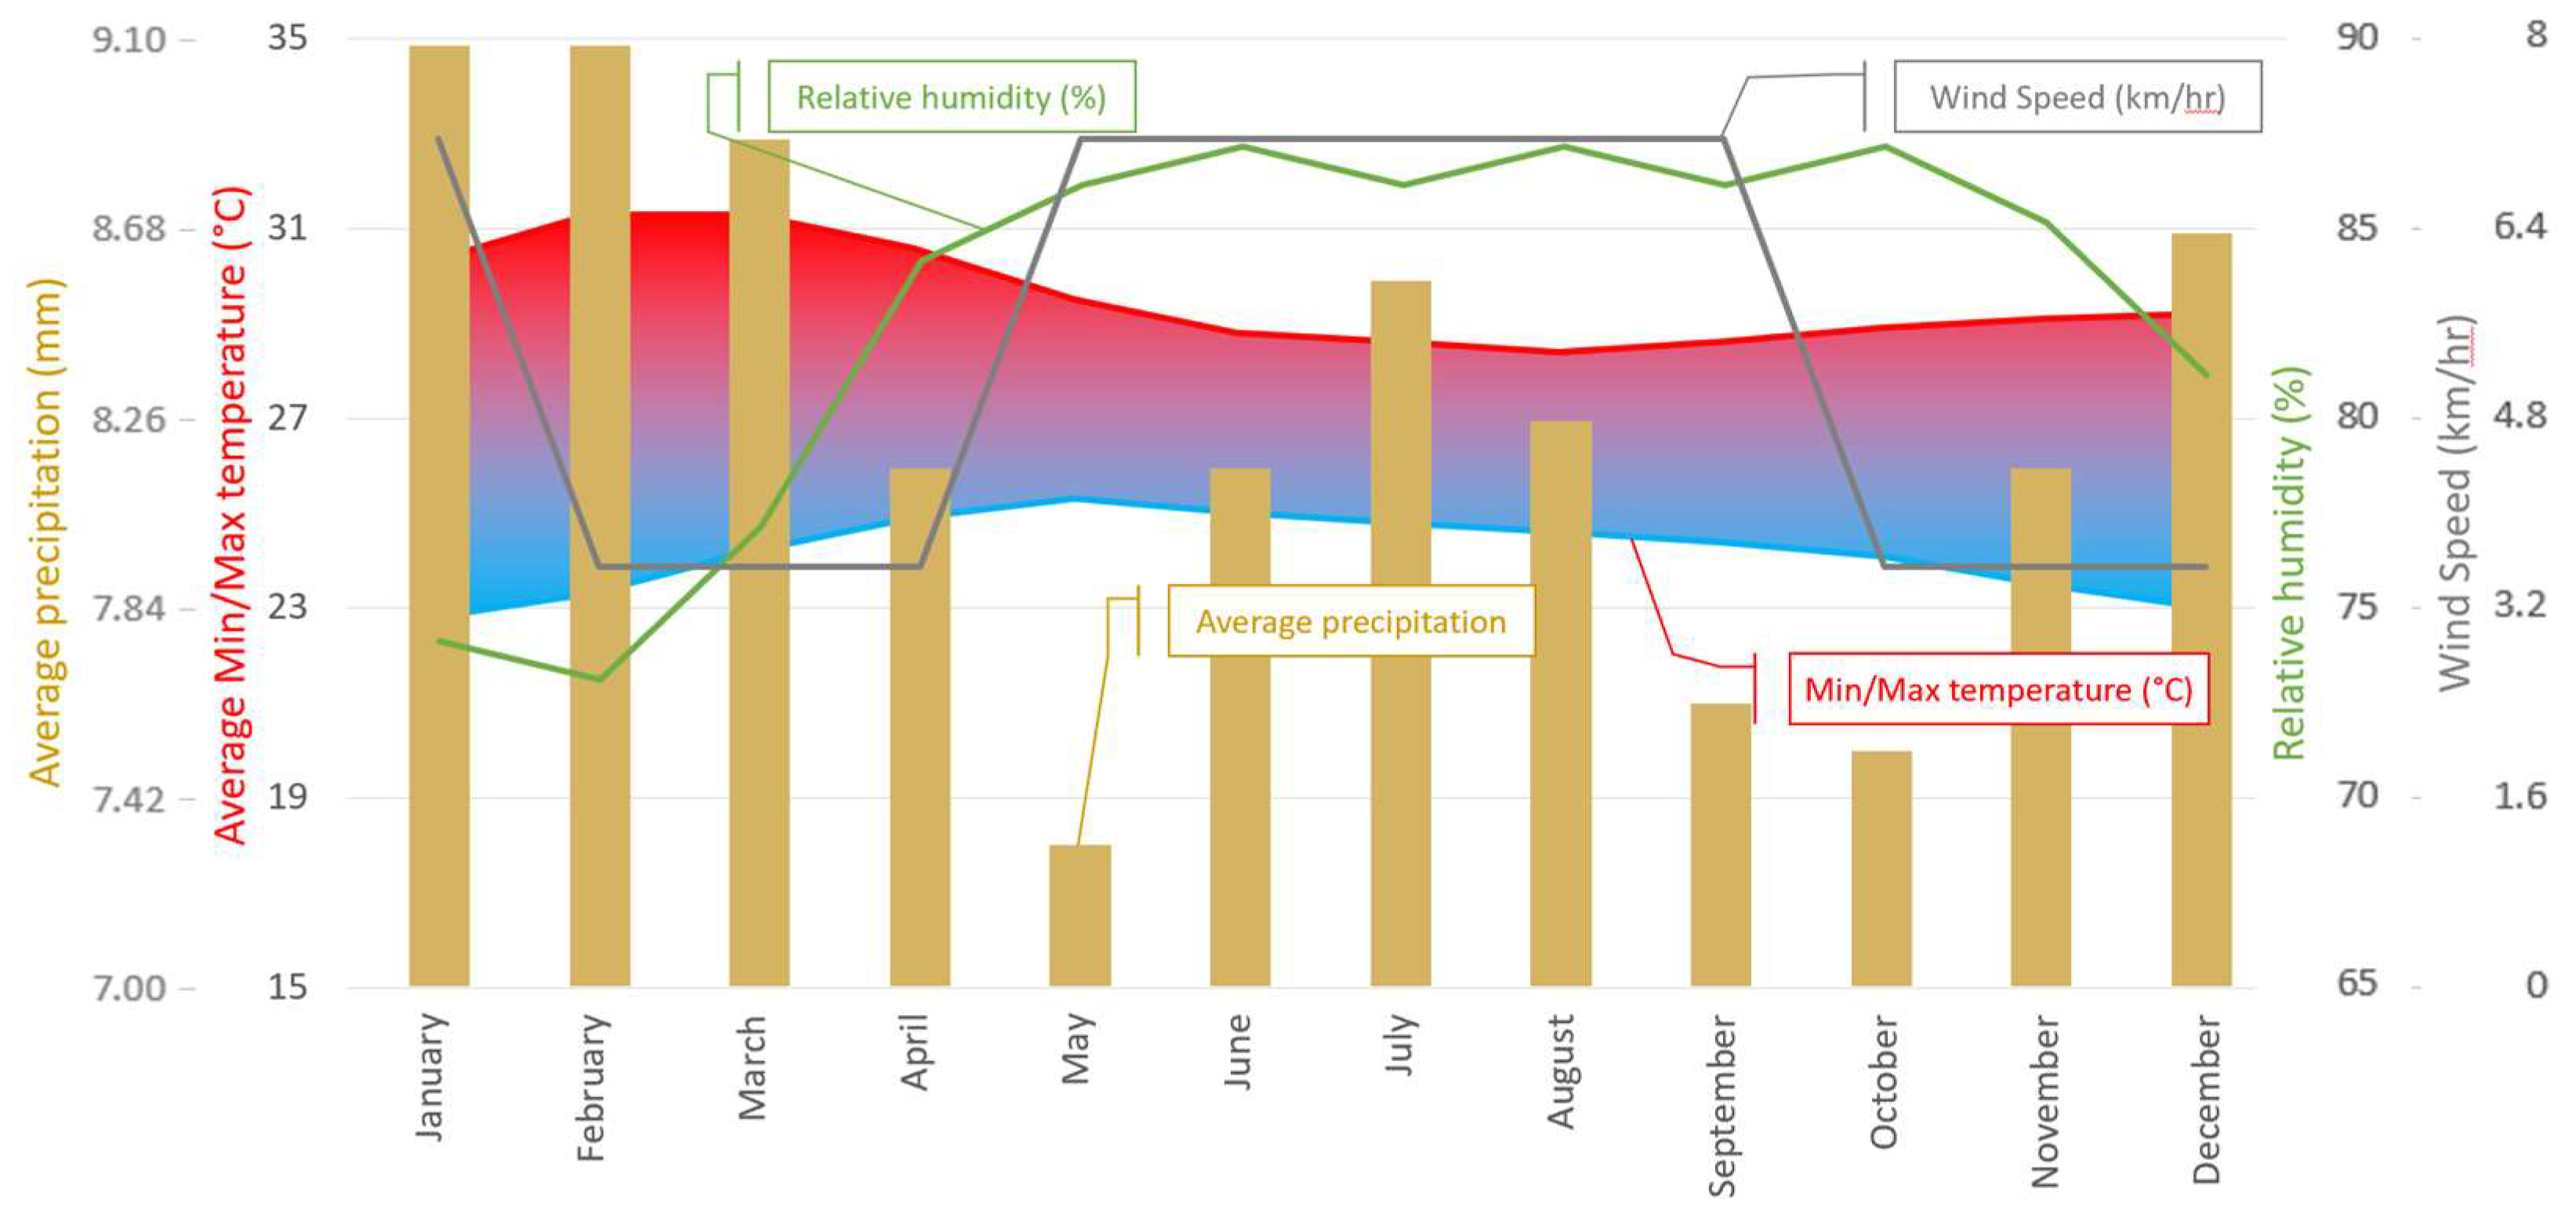
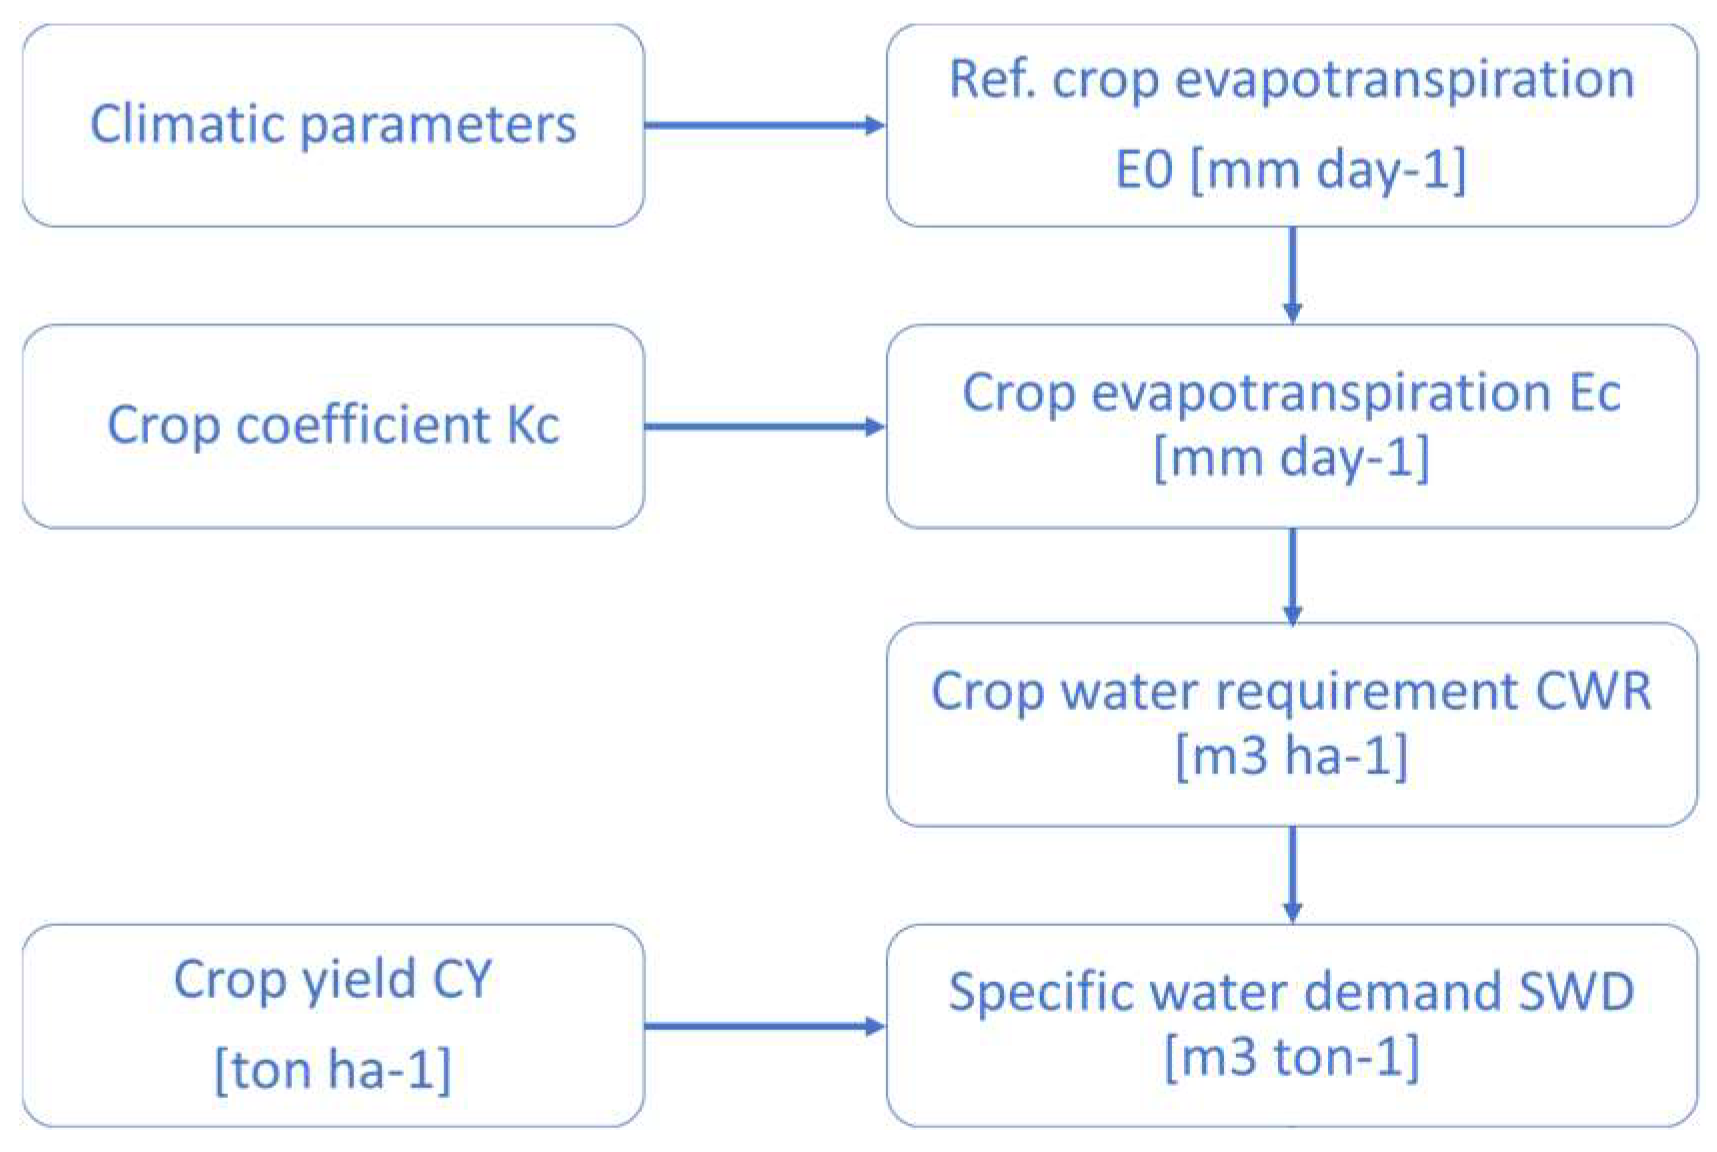
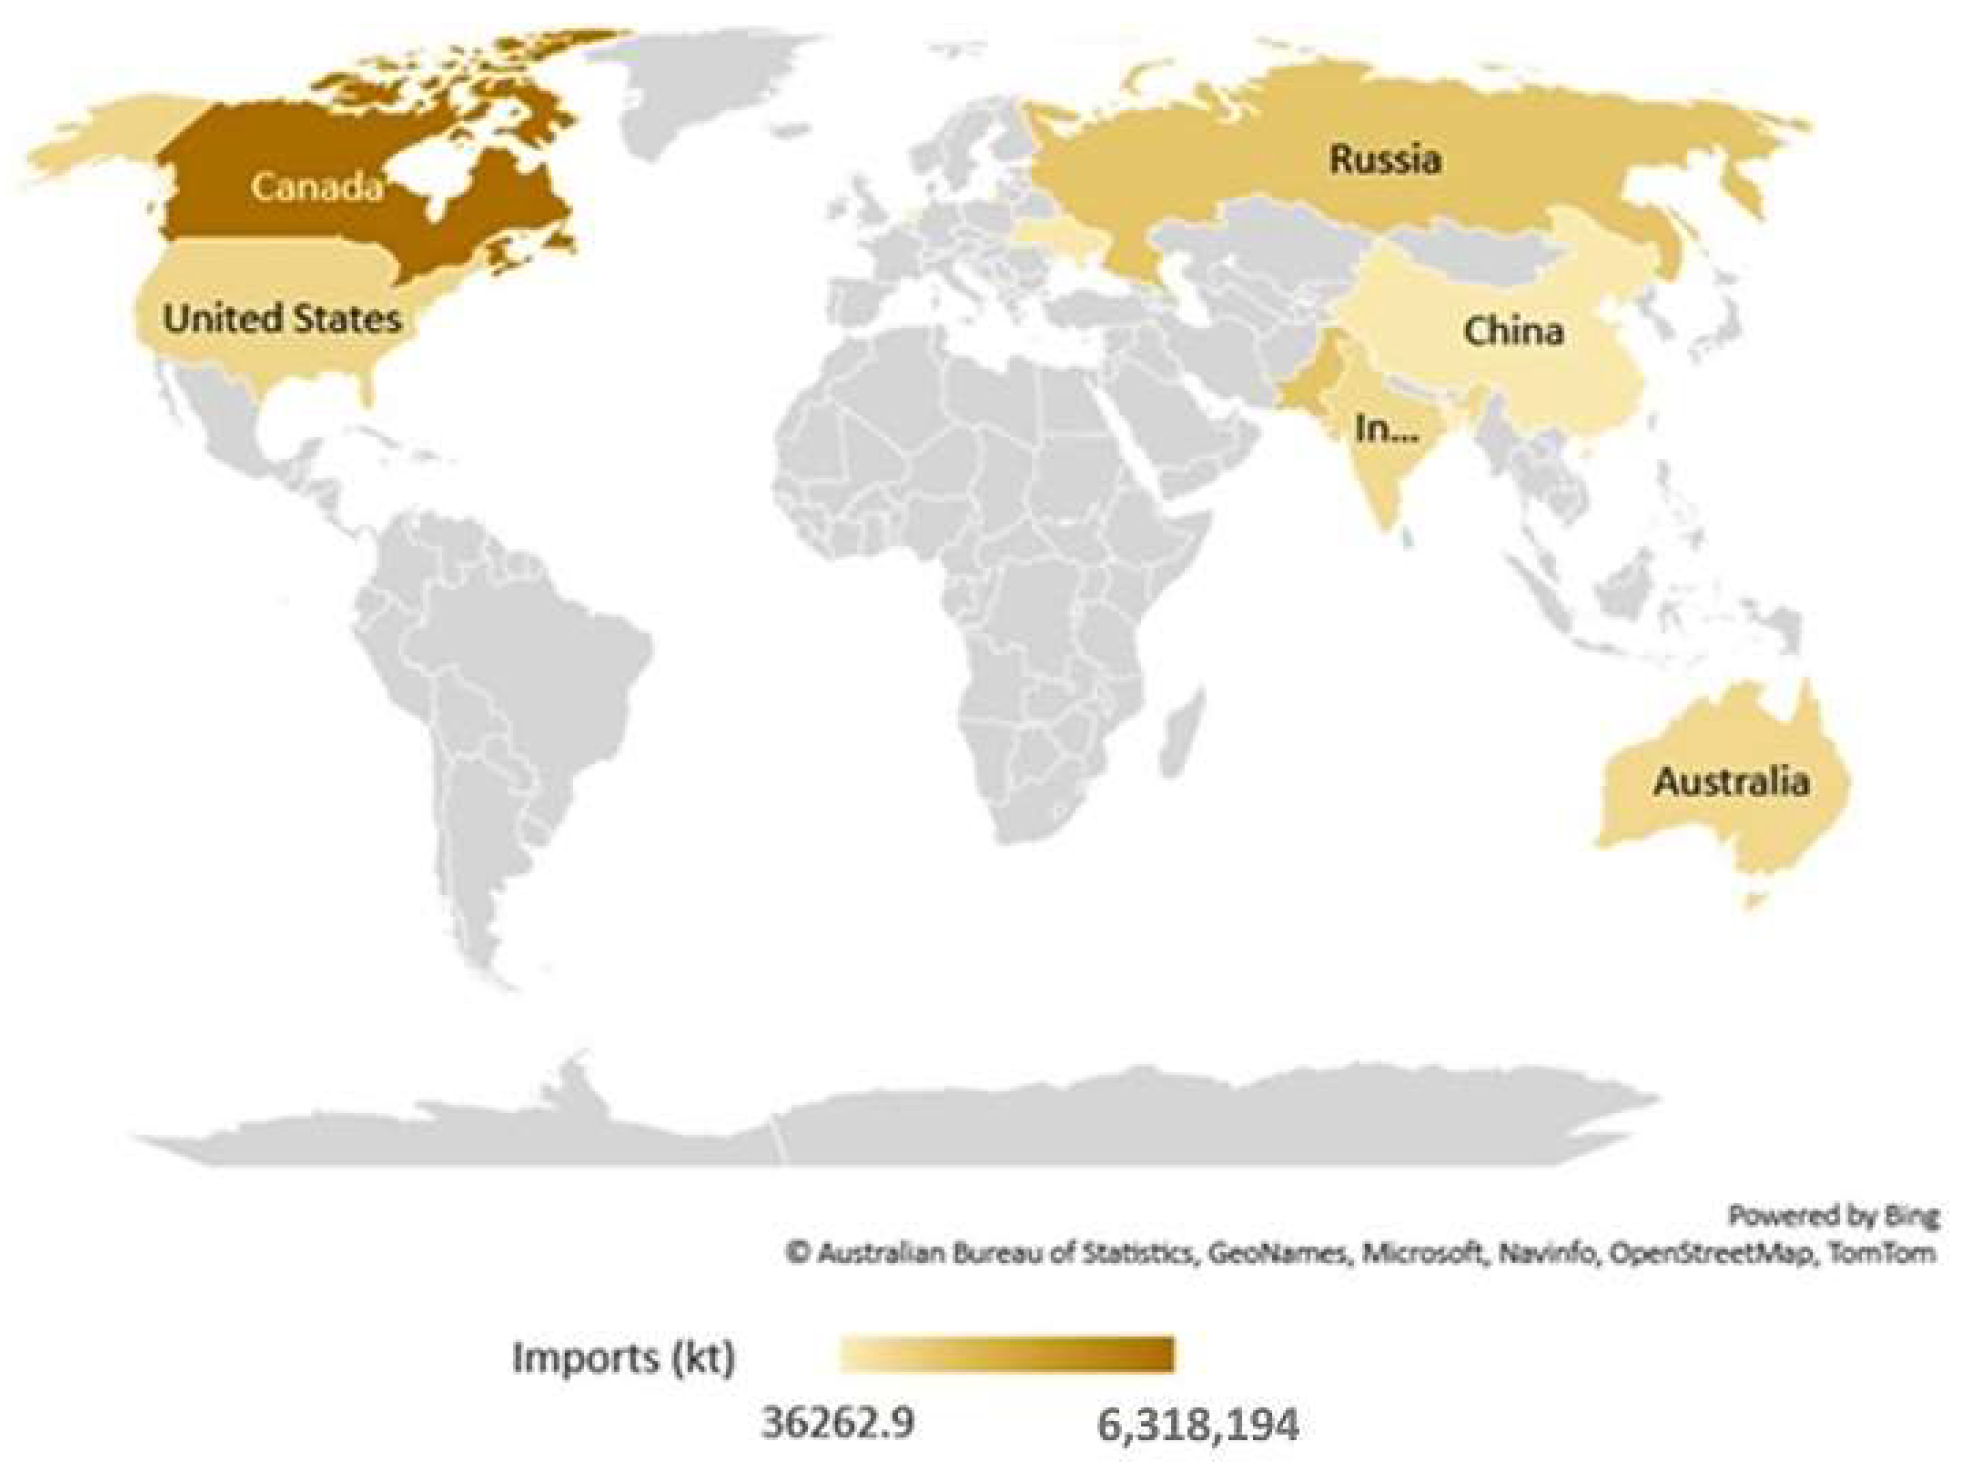
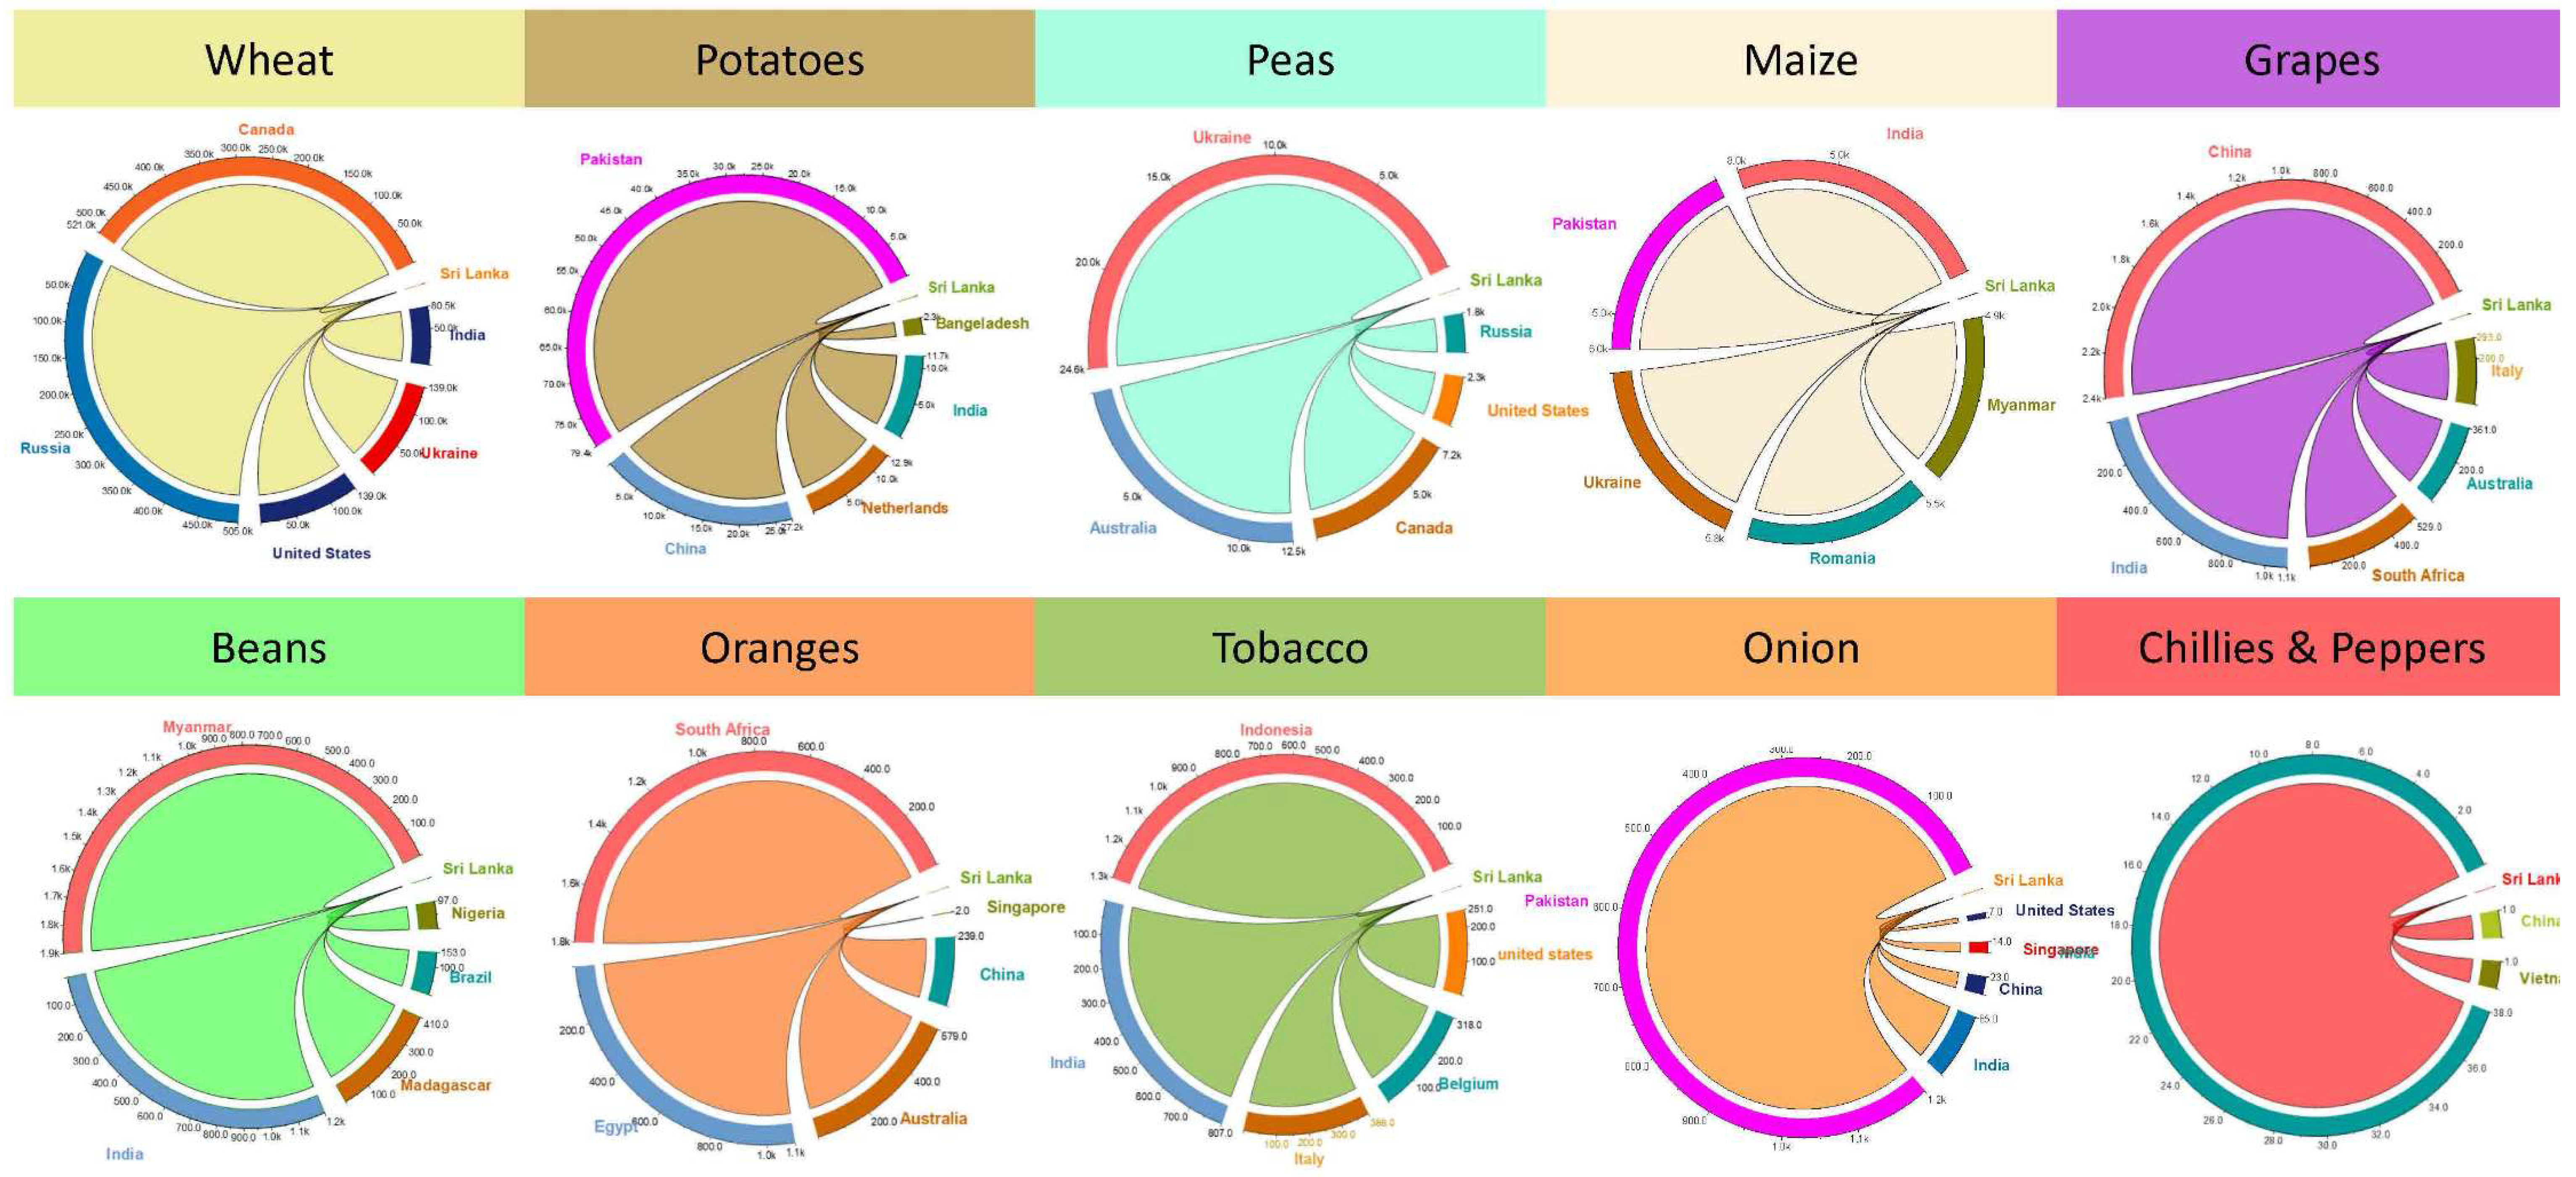
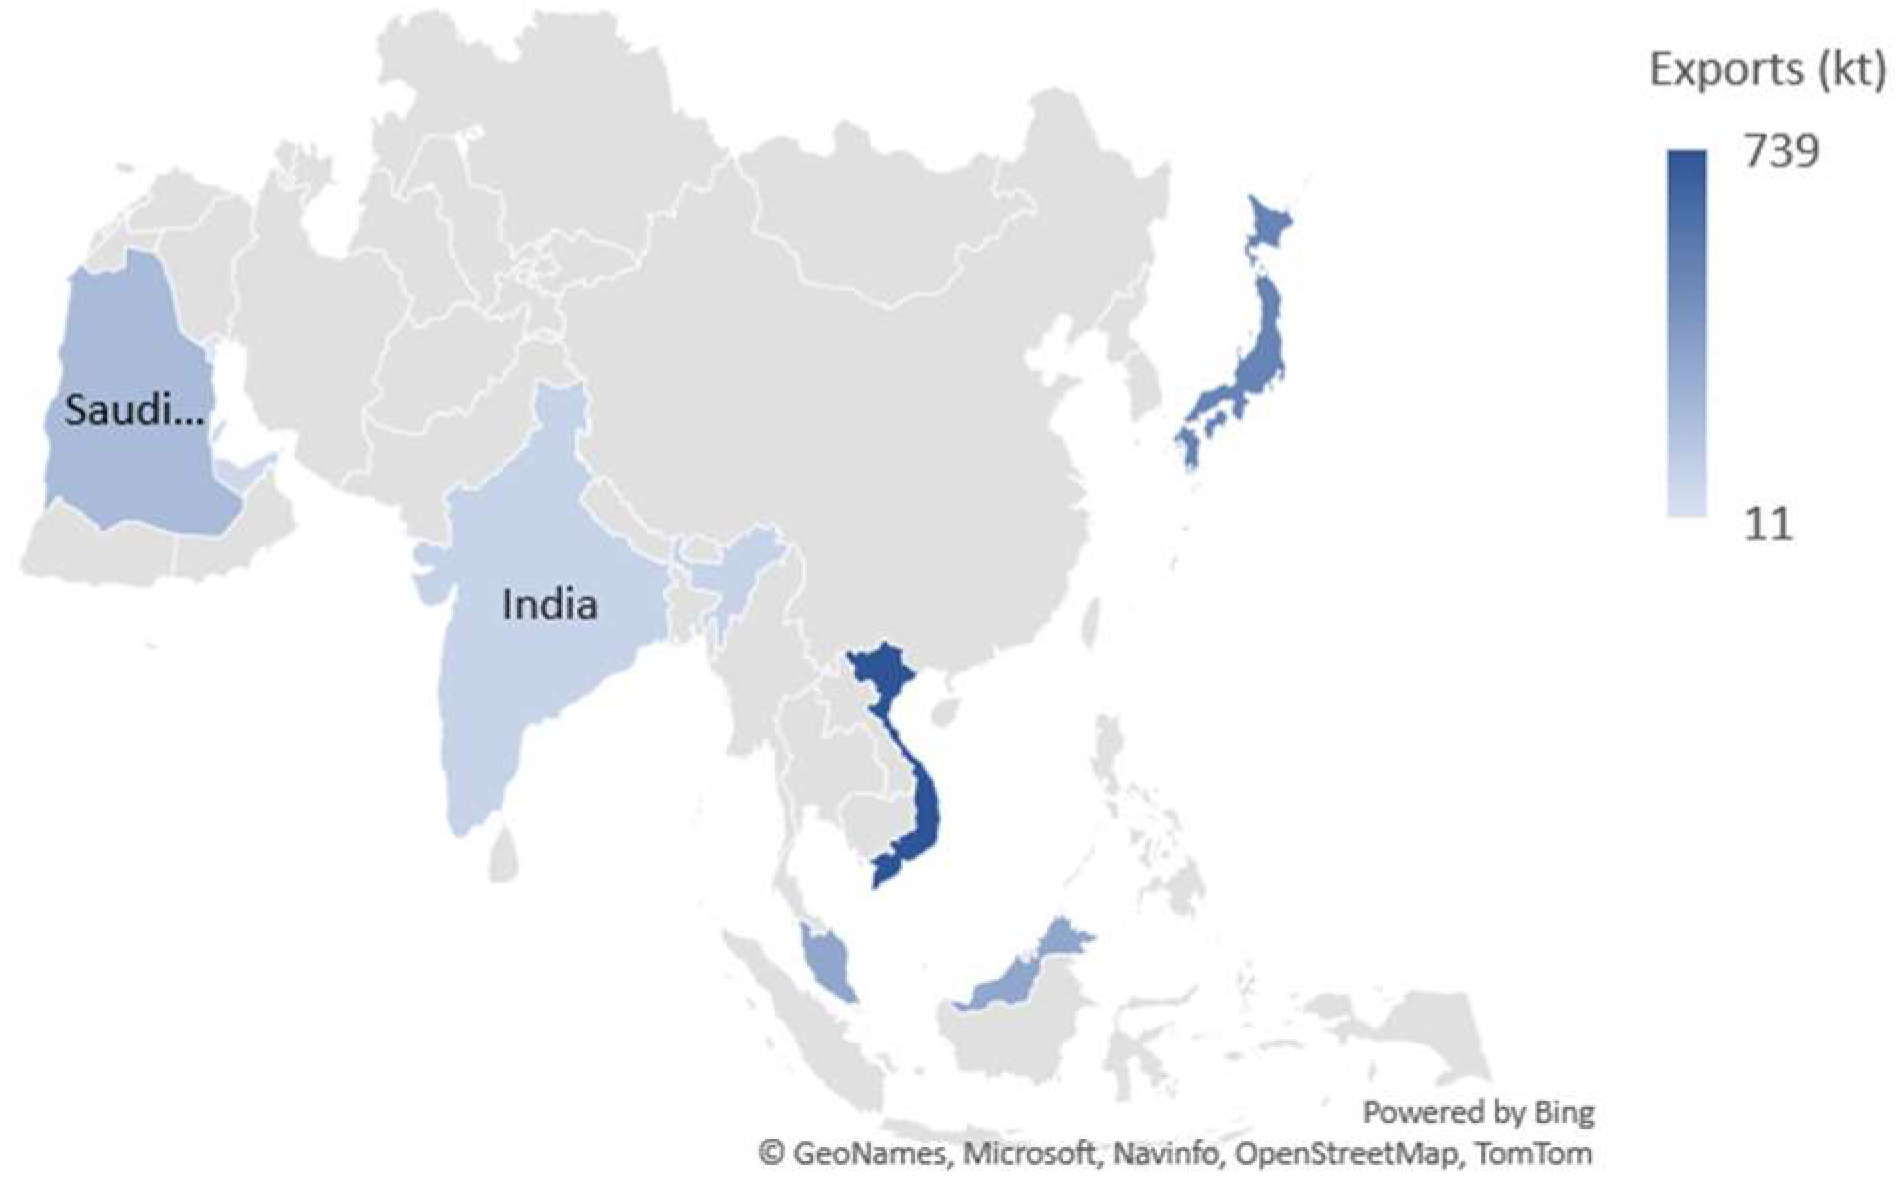
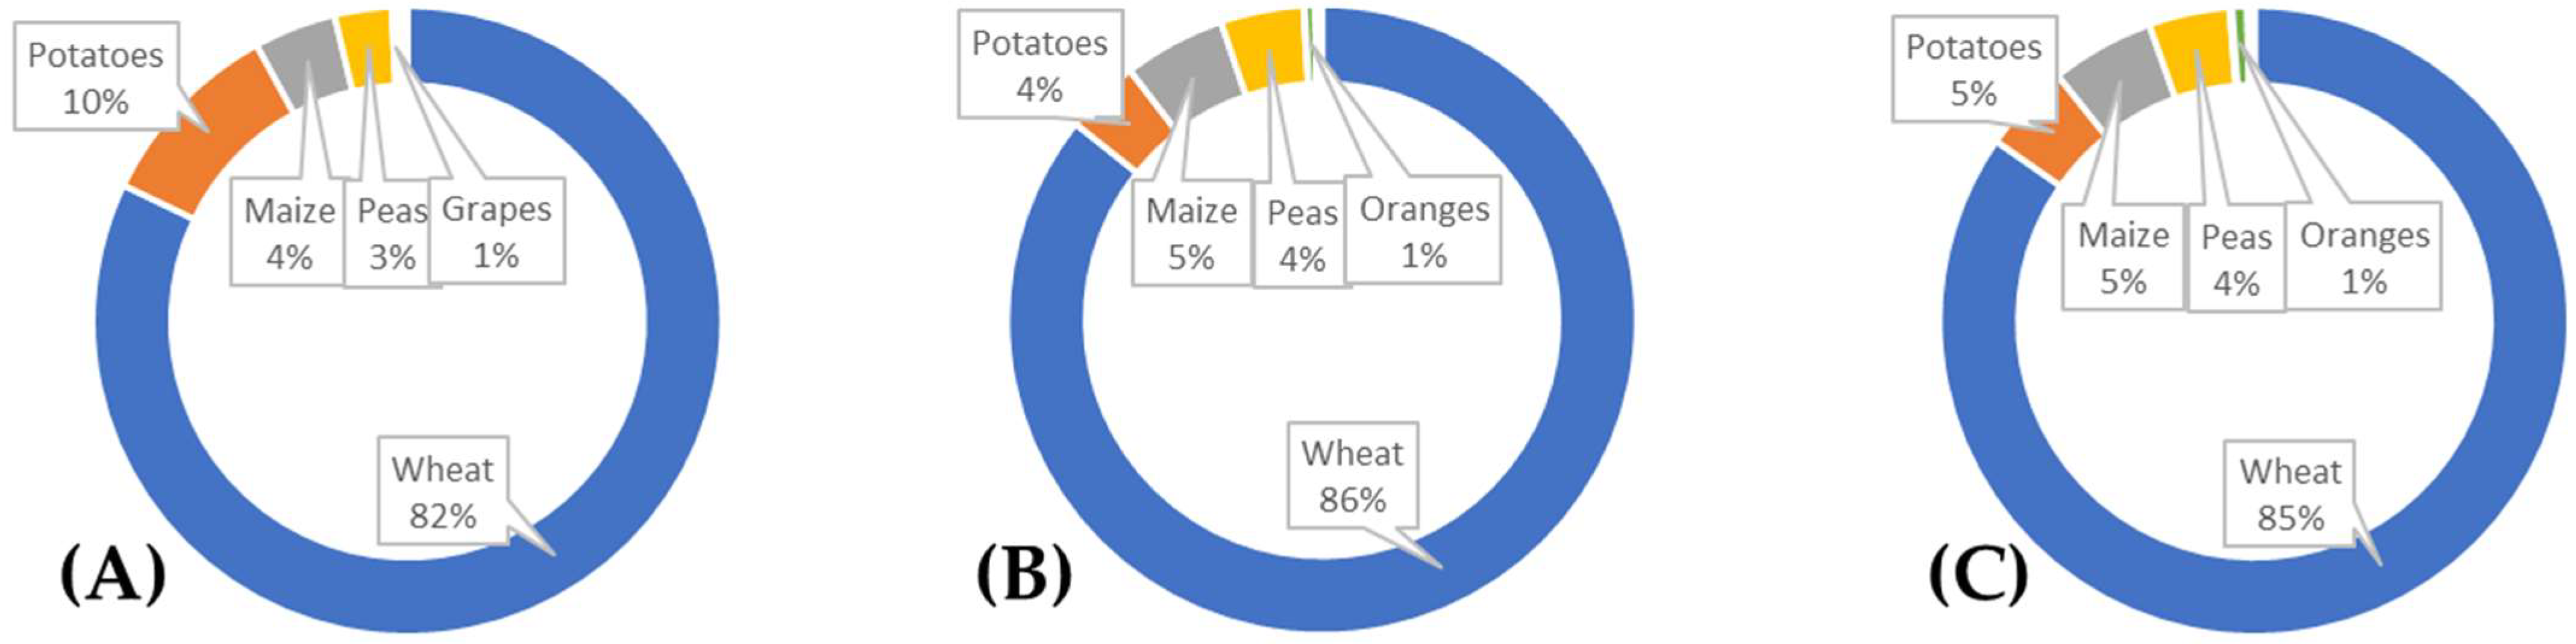
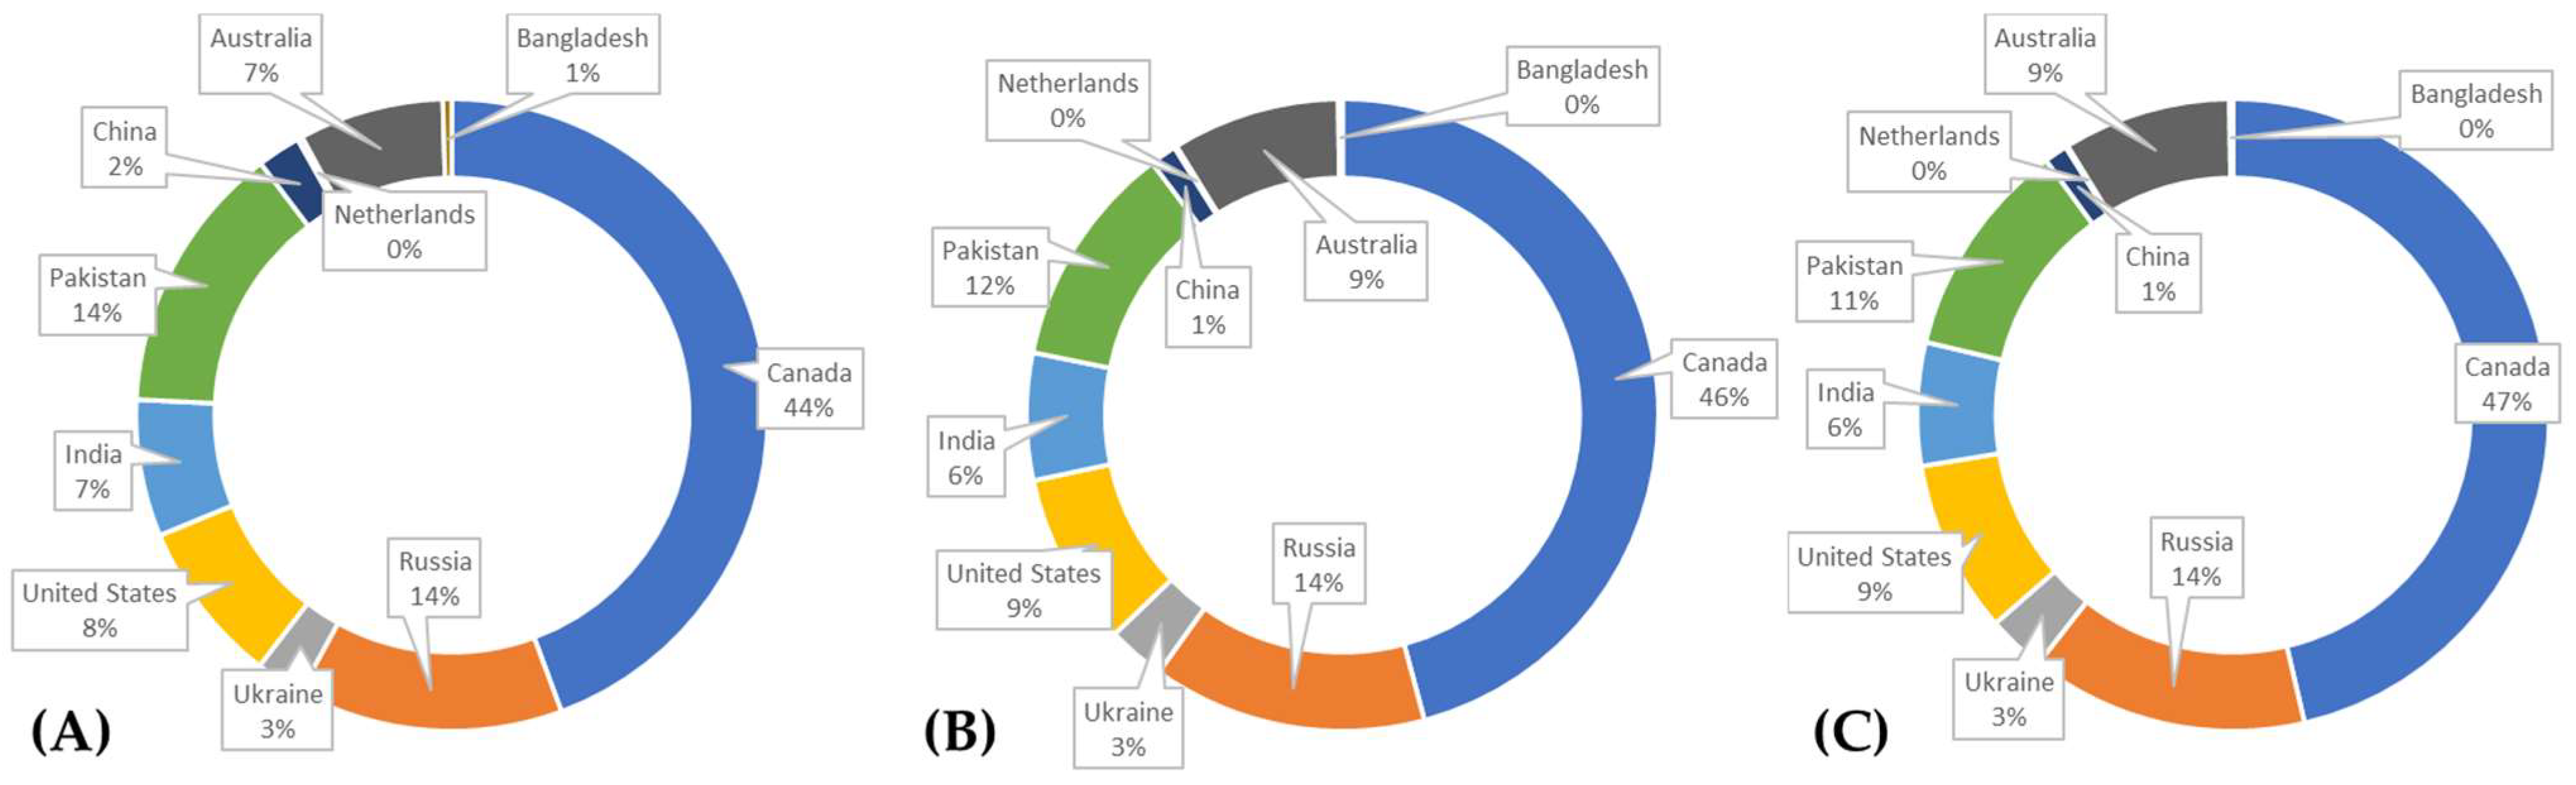
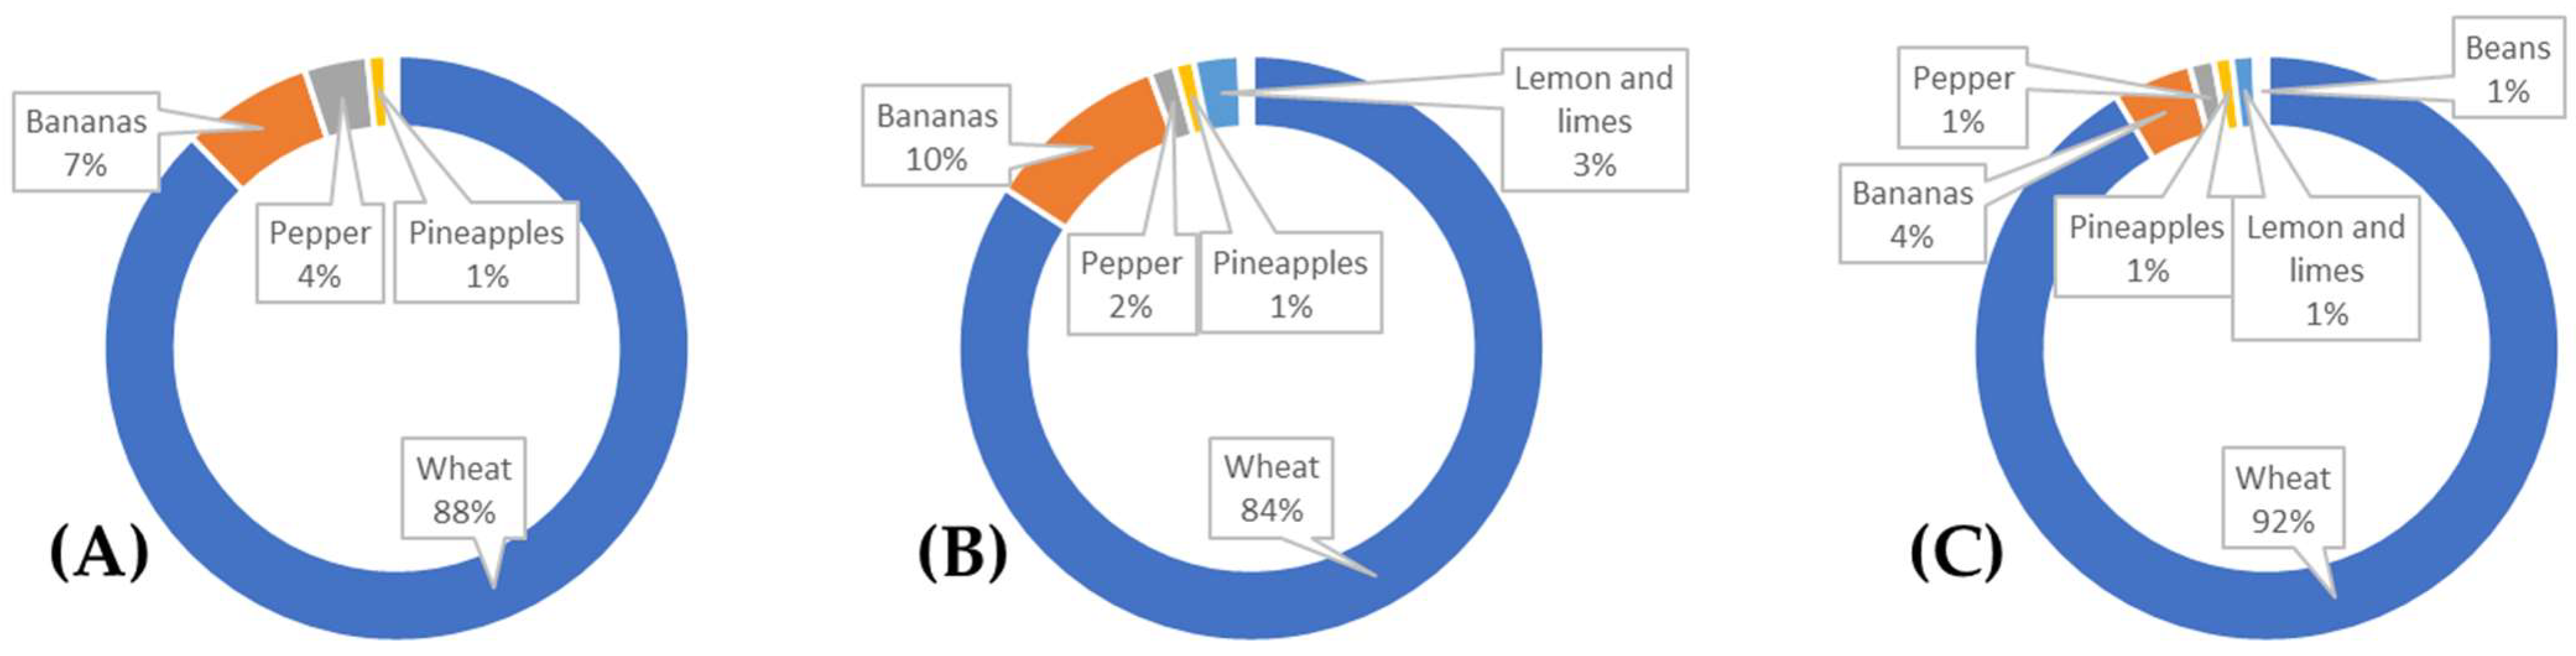
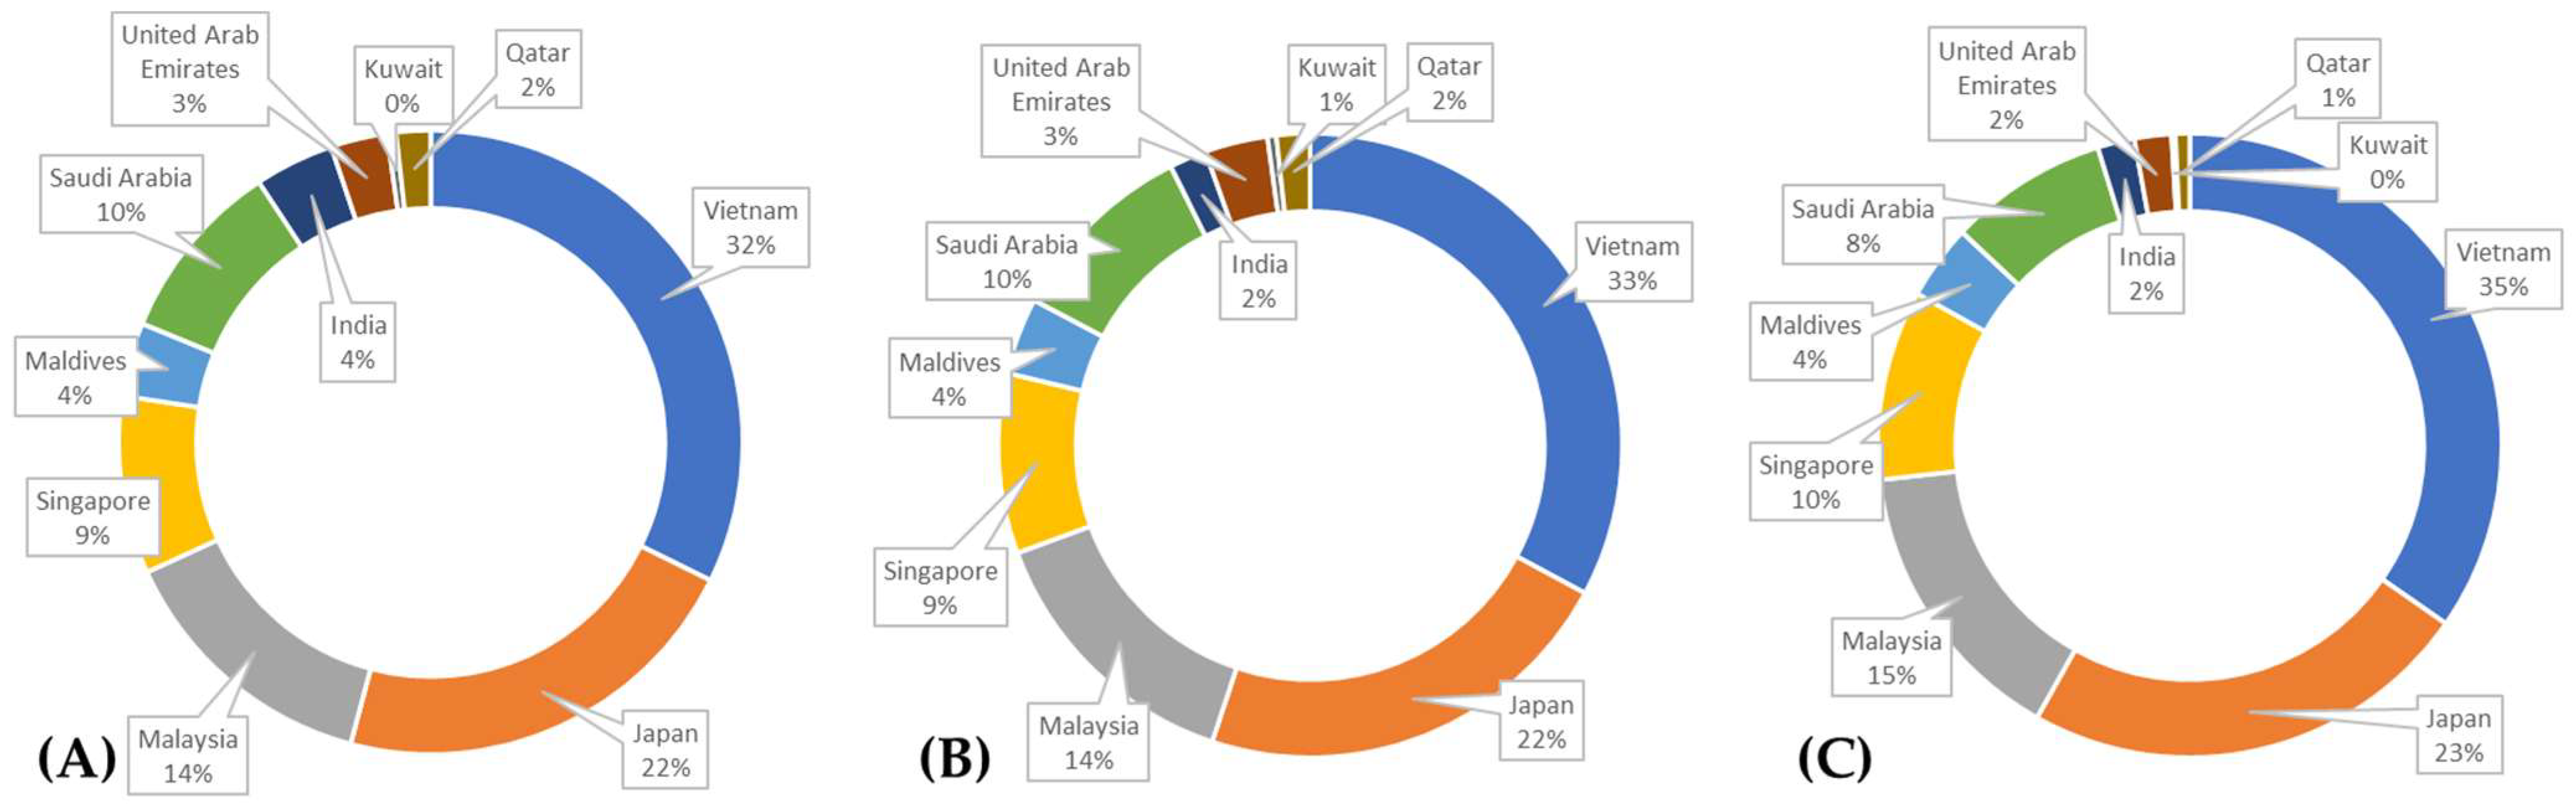
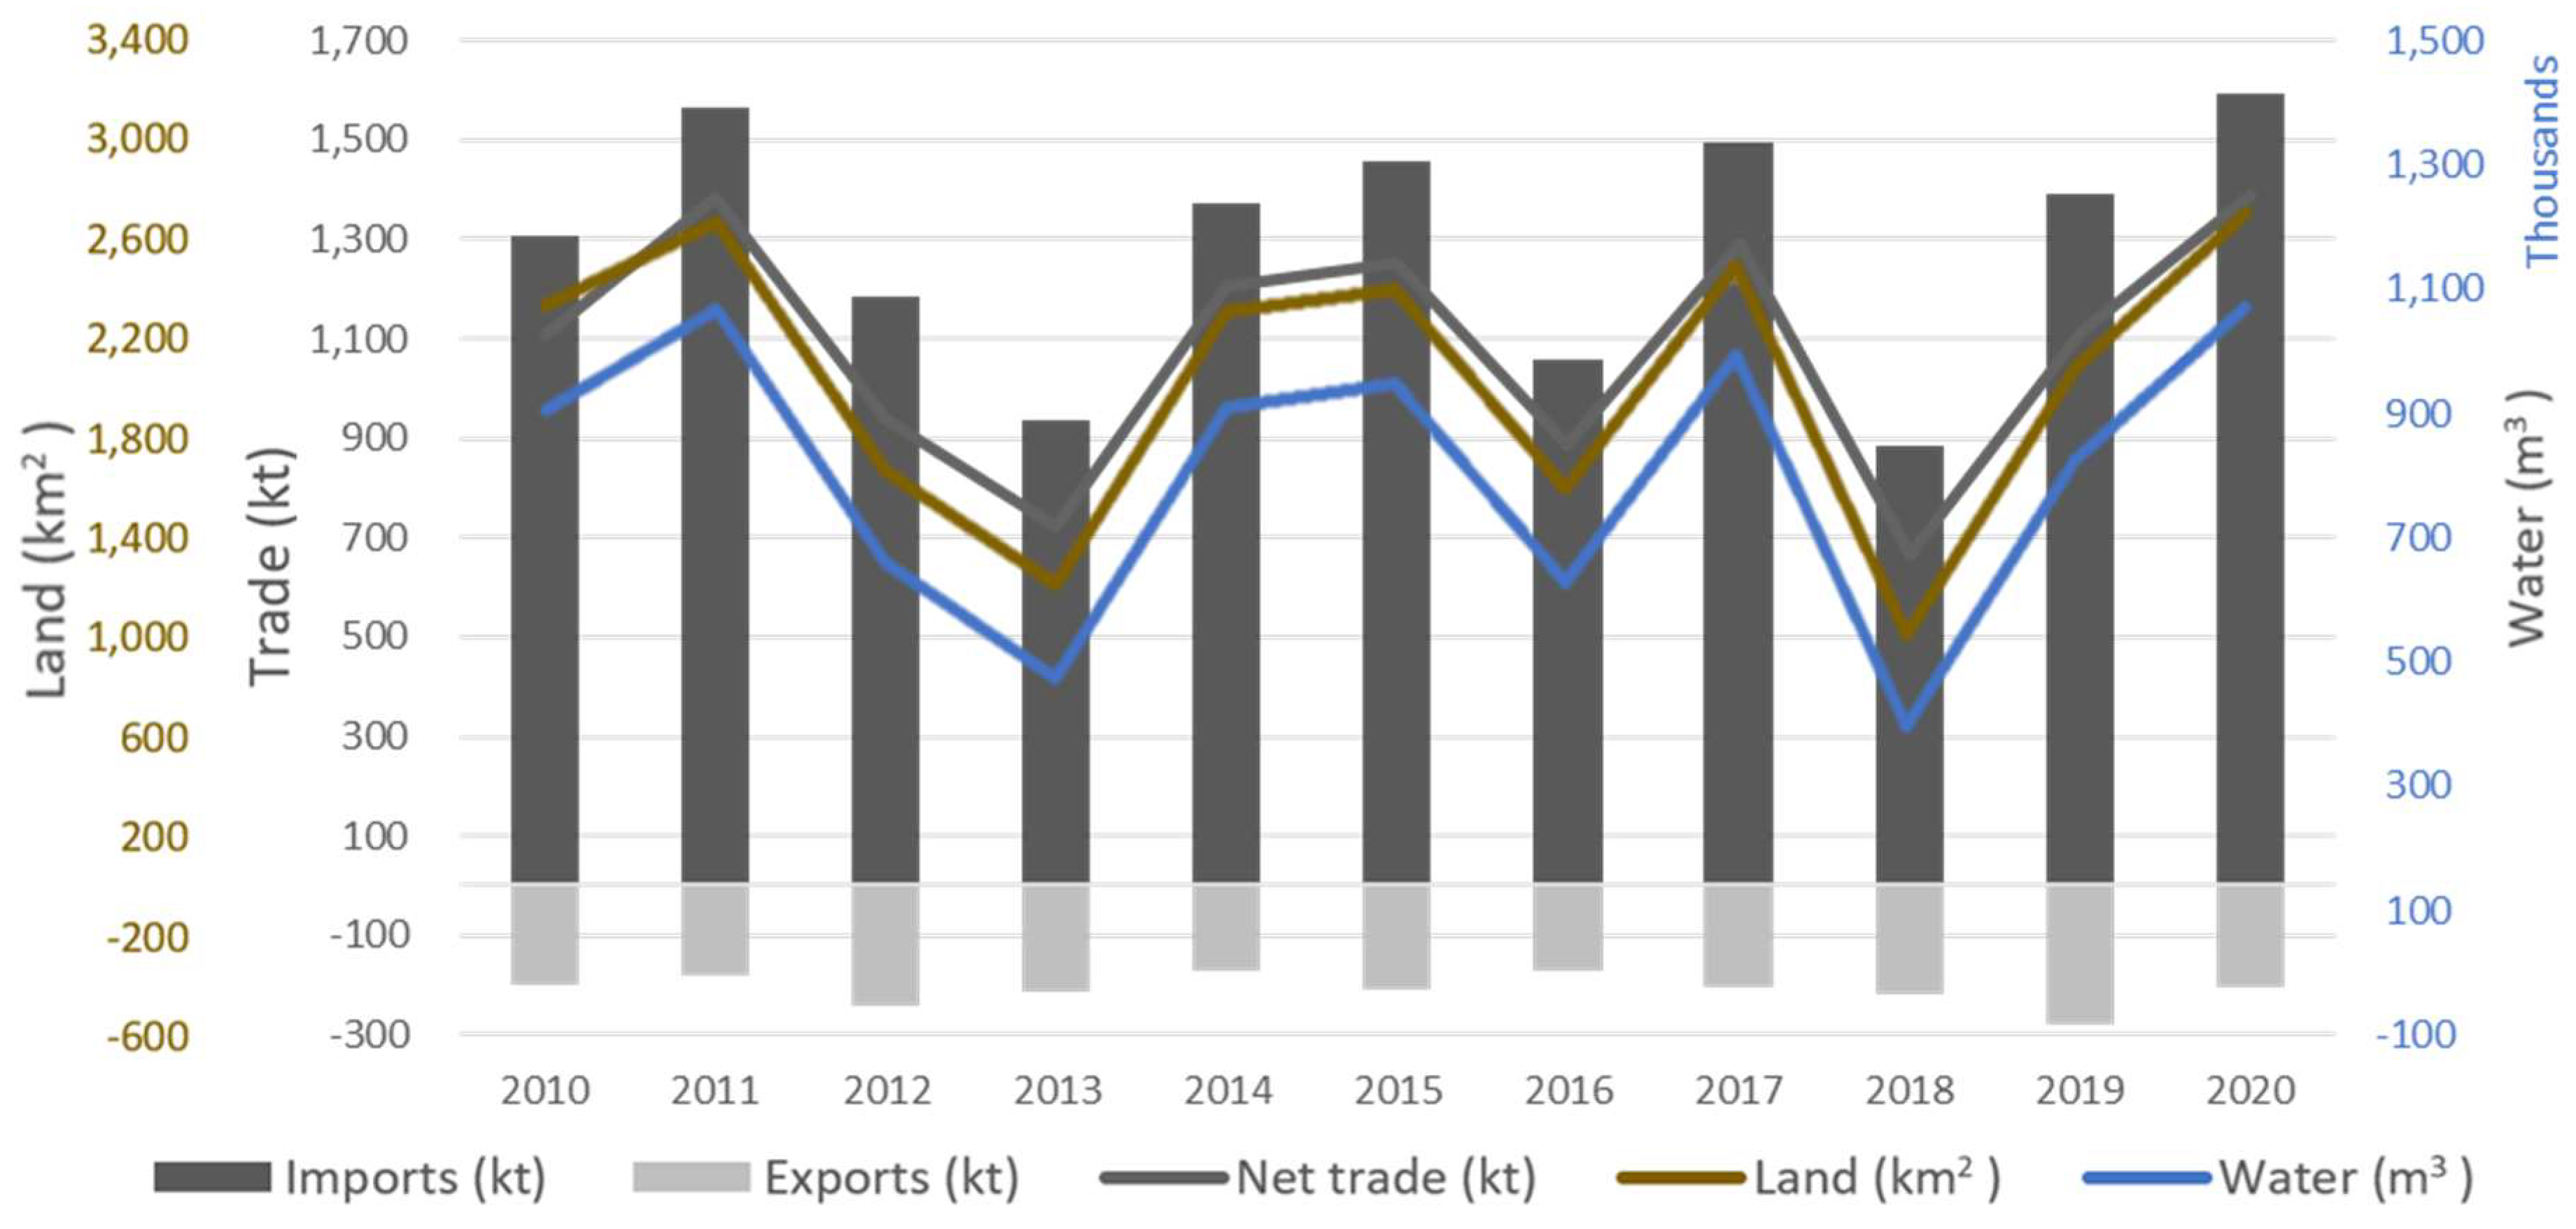
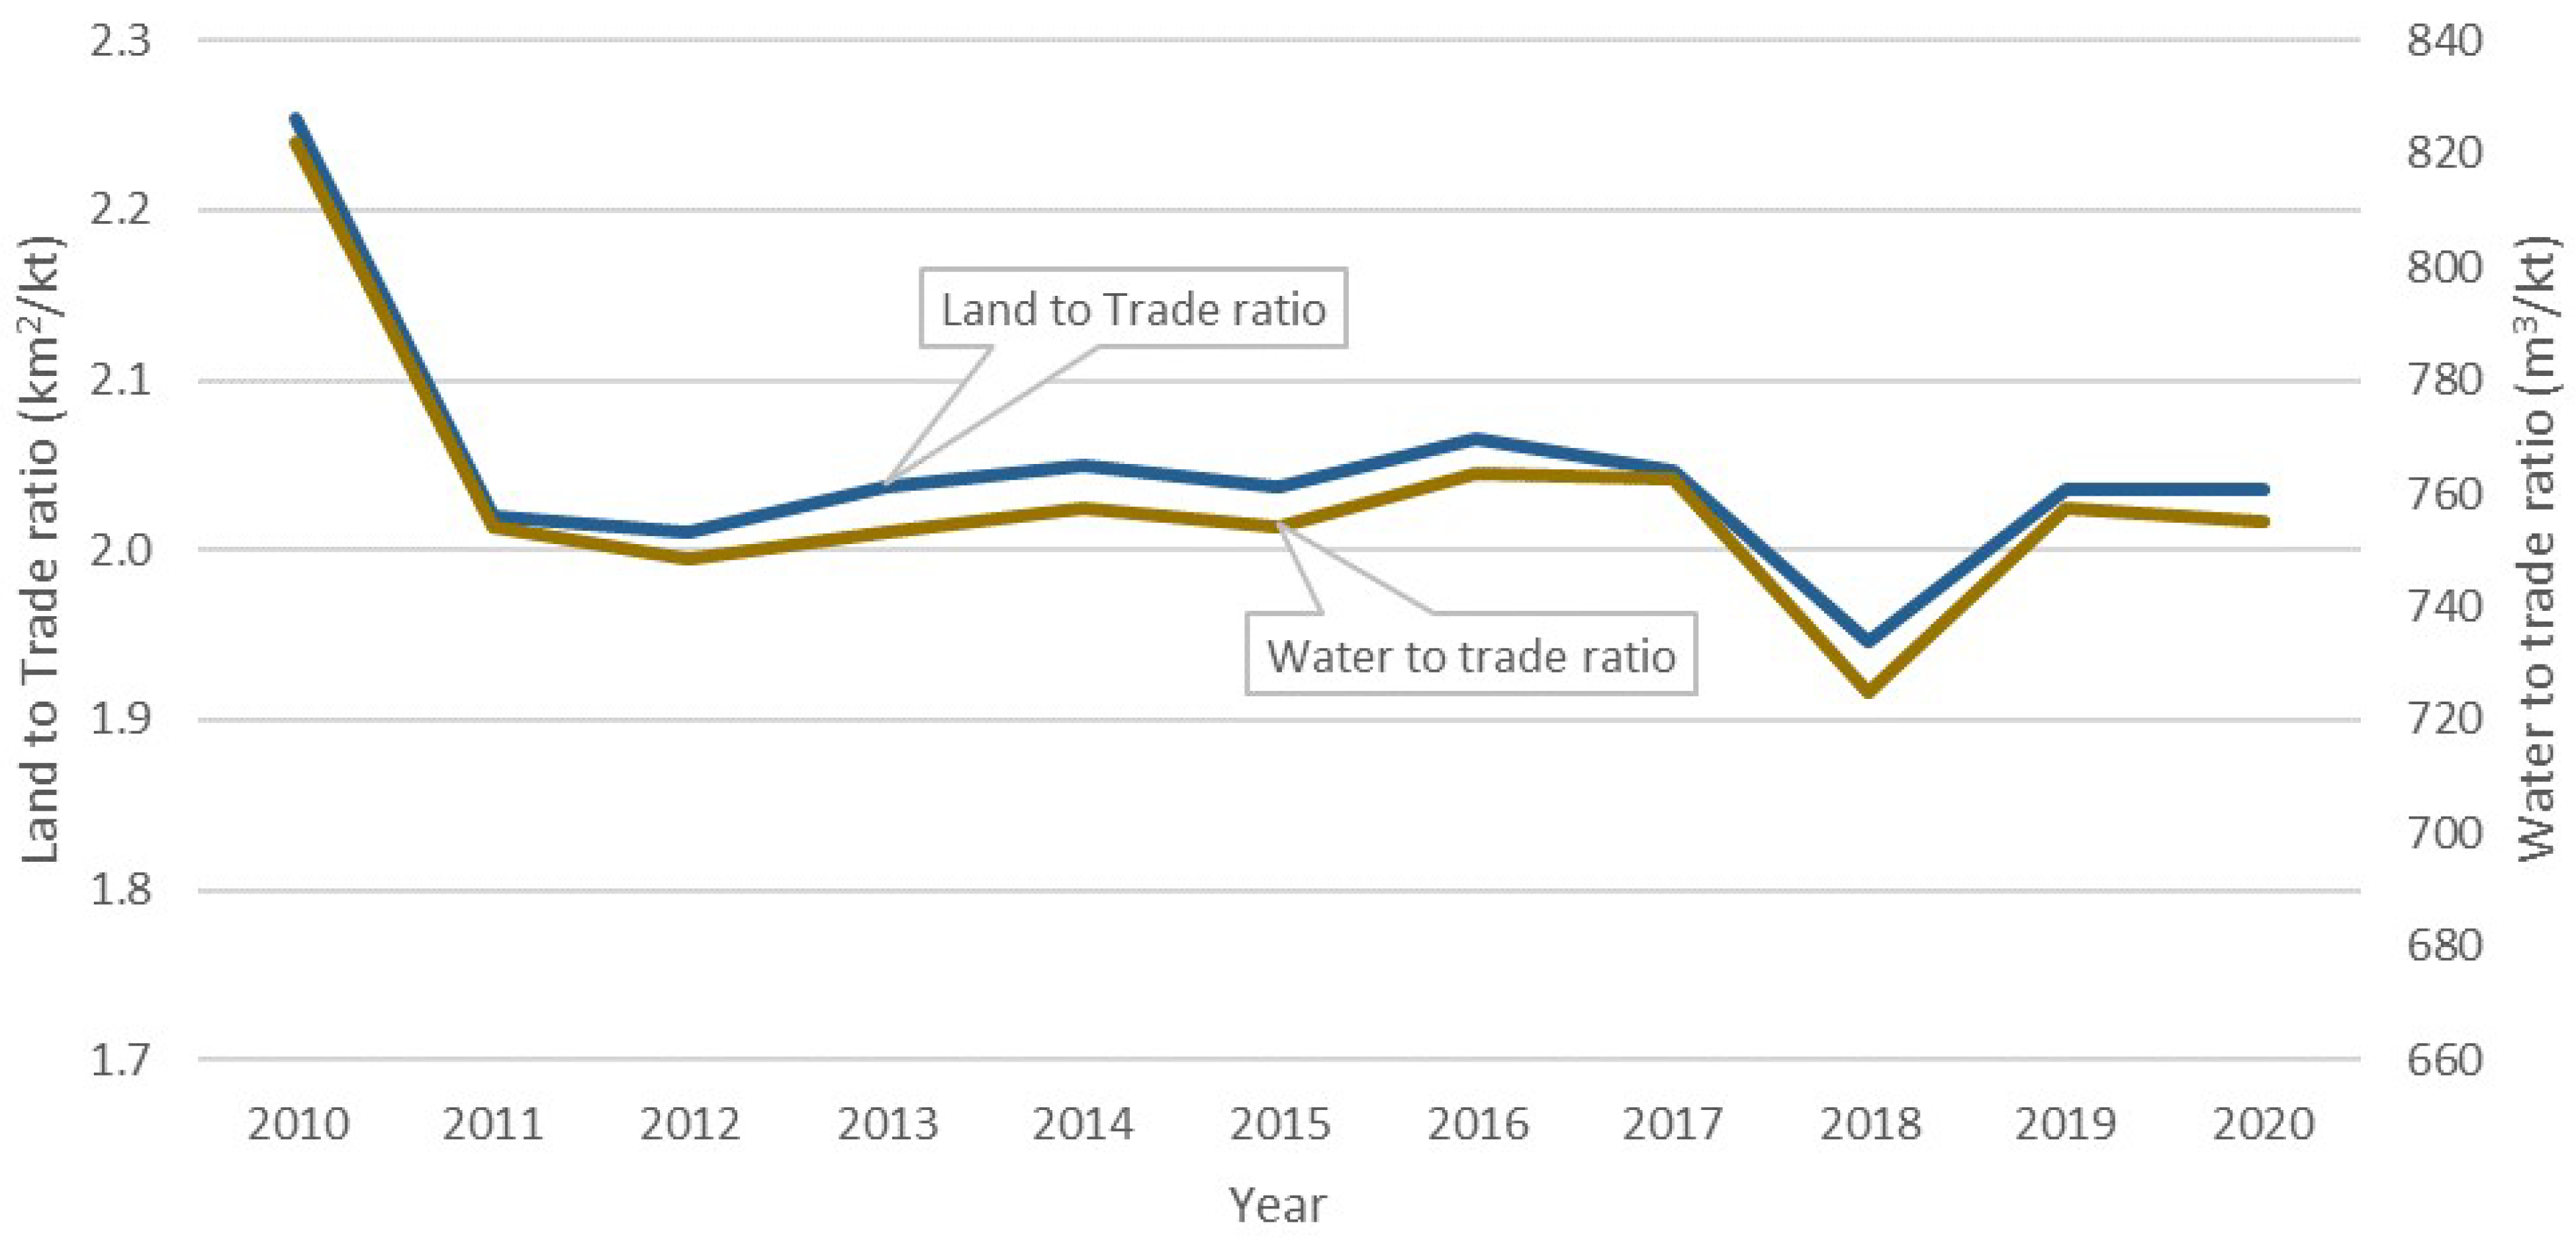
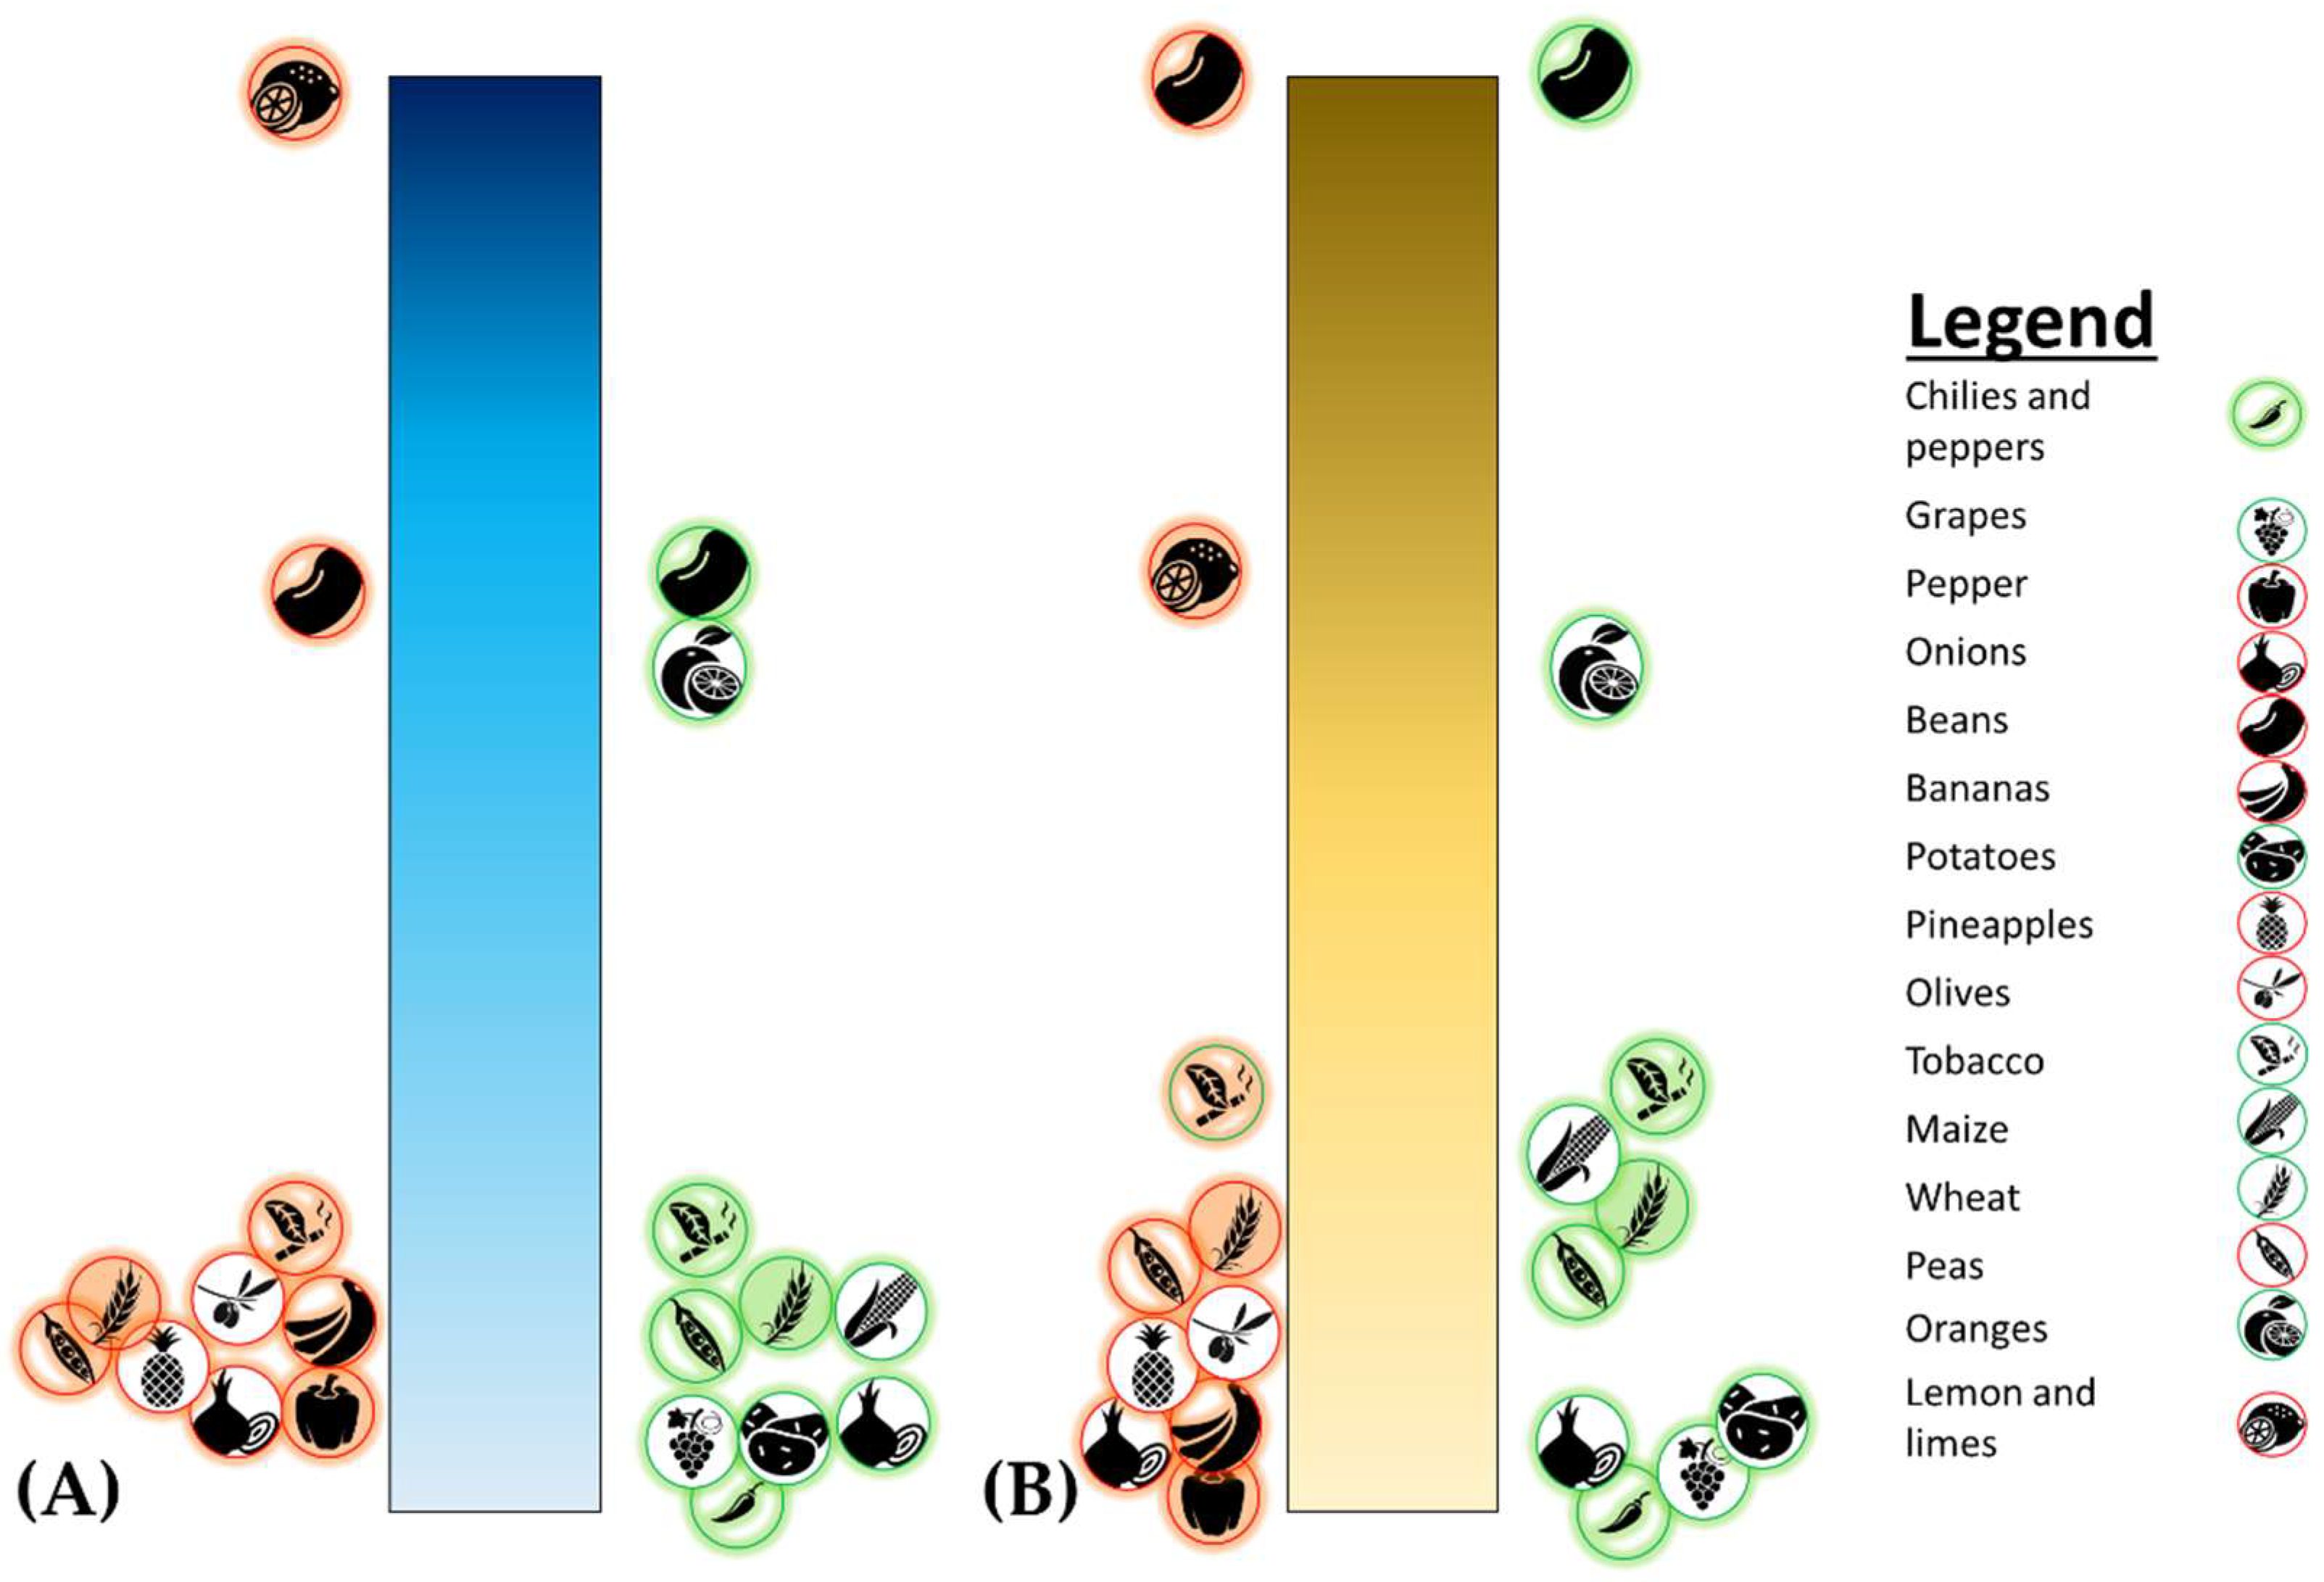
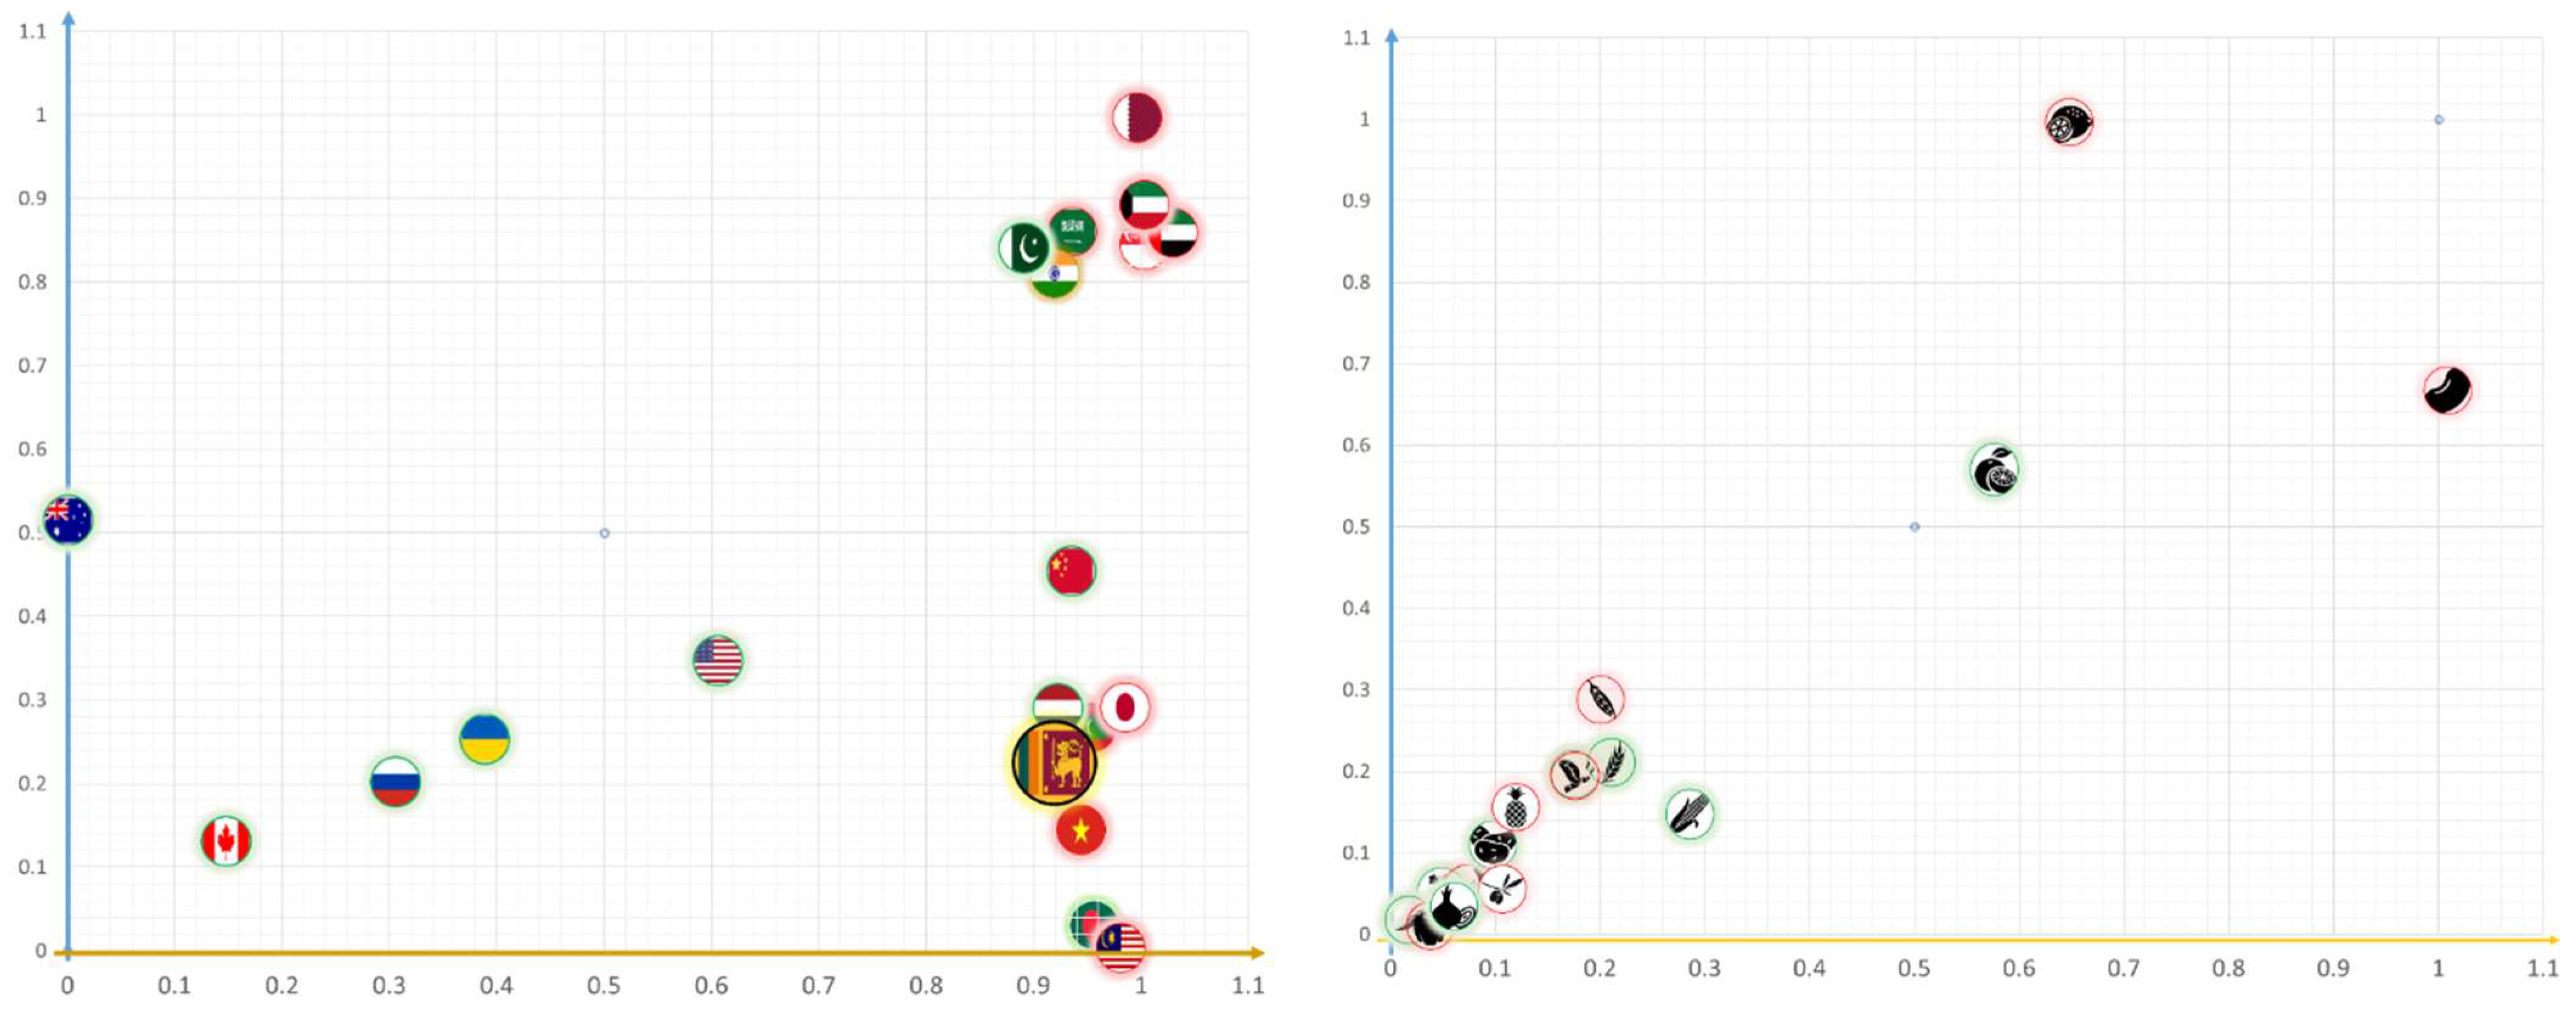
Table 1.
Top ten imports of Sri Lankan crops based on last eleven years (2010–2020), (▲ Positive change in import of crops from 2010–2020, ▼ Negative change in import of crops from 2010–2020).
Table 1.
Top ten imports of Sri Lankan crops based on last eleven years (2010–2020), (▲ Positive change in import of crops from 2010–2020, ▼ Negative change in import of crops from 2010–2020).
| Sr# | Crops | Quantity (kt) | 2010–2020 Fluctuations | Change |
|---|---|---|---|---|
| 1 | Wheat | 11,692.85 |  | ▲17.85% |
| 2 | Potatoes | 1414.57 | ▲9.81% | |
| 3 | Maize | 602.24 | ▲49.27% | |
| 4 | Peas | 415.87 | ▲34.27% | |
| 5 | Grapes | 44.27 | ▲34.42% | |
| 6 | Oranges | 28.06 | ▼261.49% | |
| 7 | Onions | 22.45 | ▲94.75% | |
| 8 | Tobacco | 12.70 | ▲52.36% | |
| 9 | Beans | 7.05 | ▲78.33% | |
| 10 | Chilies and peppers | 0.79 | ▲59.90% |
Table 2.
Top ten importers of Sri Lankan crops based on last ten years (2010–2020). (▲ Positive change in imports from trade partners from 2010 to 2020, ▼ Negative change in imports from trade partners from 2010 to 2020).
Table 2.
Top ten importers of Sri Lankan crops based on last ten years (2010–2020). (▲ Positive change in imports from trade partners from 2010 to 2020, ▼ Negative change in imports from trade partners from 2010 to 2020).
| Sr# | Country | Quantity (kt) | 2010–2020 Fluctuations | Change |
|---|---|---|---|---|
| 1 | Canada | 6318 |  | ▼77.93% |
| 2 | Pakistan | 1976 | ▲10.08% | |
| 3 | Russia | 1937 | ▲99.53% | |
| 4 | United States | 1191 | ▲43.33% | |
| 5 | Australia | 1054 | ▼976.32% | |
| 6 | India | 997 | ▲52.82% | |
| 7 | Ukraine | 349 | ▲97.45% | |
| 8 | China | 317 | ▲80.24% | |
| 9 | Bangladesh | 65 | ▲74.39% | |
| 10 | Netherlands | 36 | ▲90.13% |
Table 3.
Top nine exports of Sri Lankan crops based on last eleven years (2010–2020),(▲ Positive change in import of crops from 2010–2020, ▼ Negative change in import of crops from 2010–2020).
Table 3.
Top nine exports of Sri Lankan crops based on last eleven years (2010–2020),(▲ Positive change in import of crops from 2010–2020, ▼ Negative change in import of crops from 2010–2020).
| Sr# | Crops | Quantity (kt) | 2010–2020 Fluctuations | Change |
|---|---|---|---|---|
| 1 | Wheat | 1337.28 |  | ▼30.21% |
| 2 | Bananas | 164.99 | ▲60.97% | |
| 3 | Pepper | 78.71 | ▲7.39% | |
| 4 | Pineapples | 23.64 | ▼576.80% | |
| 5 | Lemon and limes | 6.01 | ▼139.57% | |
| 6 | Onions | 3.52 | ▲88.75% | |
| 7 | Peas | 2.10 | ▼117.59% | |
| 8 | Beans | 1.18 | ▼84.00% | |
| 9 | Tobacco | 0.16 | ▲25.93% |
Table 4.
Top ten exporters of Sri Lankan crops based on last eleven years (2010–2020), (▲ Positive change in imports from trade partners from 2010 to 2020, ▼ Negative change in imports from trade partners from 2010 to 2020).
Table 4.
Top ten exporters of Sri Lankan crops based on last eleven years (2010–2020), (▲ Positive change in imports from trade partners from 2010 to 2020, ▼ Negative change in imports from trade partners from 2010 to 2020).
| Sr# | Country | Quantity (kt) | 2010–2020 Fluctuations | Change |
|---|---|---|---|---|
| 1 | Vietnam | 739 |  | ▲55.02% |
| 2 | Japan | 500 | ▲65.66% | |
| 3 | Malaysia | 321 | ▼346.62% | |
| 4 | Saudi Arabia | 217 | ▼28.06% | |
| 5 | Singapore | 211 | ▼37.51% | |
| 6 | India | 94 | ▼1.26% | |
| 7 | Maldives | 88 | ▲65.23% | |
| 8 | United Arab Emirates | 67 | ▼23.32% | |
| 9 | Qatar | 41 | ▲77.46% | |
| 10 | Kuwait | 11 | ▲93.78% |
Publisher’s Note: MDPI stays neutral with regard to jurisdictional claims in published maps and institutional affiliations. |
© 2022 by the authors. Licensee MDPI, Basel, Switzerland. This article is an open access article distributed under the terms and conditions of the Creative Commons Attribution (CC BY) license (https://creativecommons.org/licenses/by/4.0/).
Share and Cite
MDPI and ACS Style
Rajabi, Z.; Tariq, M.A.U.R.; Muttil, N. An Estimation of Virtual Trades of Embedded Water and Land through Sri Lankan Seasonal Crops’ Trades to Improve the Cropping Preferences. Water 2022, 14, 4101. https://doi.org/10.3390/w14244101
AMA Style
Rajabi Z, Tariq MAUR, Muttil N. An Estimation of Virtual Trades of Embedded Water and Land through Sri Lankan Seasonal Crops’ Trades to Improve the Cropping Preferences. Water. 2022; 14(24):4101. https://doi.org/10.3390/w14244101
Chicago/Turabian StyleRajabi, Zohreh, Muhammad Atiq Ur Rehman Tariq, and Nitin Muttil. 2022. "An Estimation of Virtual Trades of Embedded Water and Land through Sri Lankan Seasonal Crops’ Trades to Improve the Cropping Preferences" Water 14, no. 24: 4101. https://doi.org/10.3390/w14244101
Note that from the first issue of 2016, this journal uses article numbers instead of page numbers. See further details here.