Article

Environmental and Economic Performance of Sludge Composting Optimization Alternatives: A Case Study for Thermally Hydrolyzed Anaerobically Digested Sludge

by
Irina Kliopova
*,
Edgaras Stunžėnas
*,
Jolita Kruopienė
and
Rimas Pranas Budrys
Institute of Environmental Engineering, Kaunas University of Technology, LT-44249 Kaunas, Lithuania
*
Authors to whom correspondence should be addressed.
Water 2022, 14(24), 4102; https://doi.org/10.3390/w14244102
Submission received: 20 September 2022 / Revised: 7 December 2022 / Accepted: 12 December 2022 / Published: 15 December 2022
(This article belongs to the Special Issue Utilization and Treatment of Sewage Sludge)

Abstract

:
Composting is one of the ways to return sewage sludge nutrients to the soil and thus keep them in the economic cycle. This well-known technique is still being developed in search of more advanced, optimal solutions. This study presents the results of an environmental and economic analysis of the sludge treatment processes used in a municipal wastewater treatment plant. The sludge (up to 4700 m3 per day) is subjected to thermal hydrolysis before anaerobic treatment. The energy produced is lower than consumed, mainly since 59% of the digested sludge is also dried. An even bigger problem is that the treated sludge does not meet the criteria for fertilizing products and can only be used for energy forests. Thus, three alternatives for composting thermally hydrolyzed anaerobically treated dewatered sludge with green waste from public areas were researched. The analysis revealed the environmental and economic benefits of such a decision, especially when using microbial inoculants in open composting and maintaining semi-anaerobic conditions. An increase in humic acids (by 63.4%) and total nitrogen (by 21.8%) concentrations, a minimization of NH3 emissions (by 26.6%), and the lowest cost price (53 EUR tonne−1 of sludge dry matter) are among the benefits.

1. Introduction

Sewage sludge is a widely generated unavoidable waste, the management of which remains the subject of ongoing research. Sludge can be contaminated with heavy metals and pathogens, which complicate its use, but sewage sludge also accumulates a large amount of essential nutrients, which makes its use highly desirable. In fact, compared to other biodegradable waste, the concentrations of total nitrogen and phosphorus in sludge are perhaps the highest, even up to several times higher [1]. In Europe, 8.7 million tons (dry matter) of sewage sludge was generated in 2020 [2]. Although 47.5% of this sludge was diverted to agriculture, significant amounts of sludge were managed in other ways (2.4 Mt incinerated, 0.7 Mt used for land restoration, 0.5 Mt diverted to landfills, and 1 Mt diverted to other destinations [2]), which means that nutrients are often lost and not returned to the economic cycle.
To keep nutrients in the economic cycle, one option is to develop advanced composting techniques instead of other sub-optimal solutions. Since composting is a biological process, special attention must be paid to microorganisms, which are the driving force behind the transformation of organic matter [3]. Recently, research on microbial inoculants for composting optimization has become a direction of interest in both the academic community and business. Multiple benefits have been observed with the addition of microorganisms. For example, inoculants help to destroy antibiotic resistance genes [4]; enhance microbiological biodiversity [5]; accelerate the decomposition of organic matter [6]; reduce compost production costs [7]; significantly increase the enzymatic activities of cellulose (15.0 to 19.8%), urease (2.3 to 71.4%), and polyphenol oxidase (0.3 to 28.4%) [8]; increase the degradation of biopolymers lignin and cellulose (17.1% and 36.7%, respectively) [9]; and minimize malodorous odors (e.g., reduced H2S emission by 35.4%) [10]. Recent studies even discuss the use of inoculants to degrade microplastics in sewage sludge [11] or a multistage inoculation strategy for a prolonged thermophilic stage, increased production of humic substances and reduced emissions [12]. Another interesting use of microbial inoculants is the production of compost with biopesticidal properties [13]. Some studies of bacterial inoculants do not even appear in scientific journals. For example, simultaneous aerobic and anaerobic composting technology is described only in patents and never in the scientific literature, despite data being available for many years [14]. The microbial mixture has strong arguments for its effectiveness. For example, it is preferable that aerobic, anaerobic, and facultative microorganisms coexist during composting because the active use of oxygen by aerobes creates an excellent environment for anaerobes. Moreover, such mutual synergism increases the production of desirable products because anaerobic respiration creates various volatile fatty acids, avoiding direct conversion to carbon dioxide and thus creating a greater possibility to transform carbon to humus [14]. The introduction of the inoculant results in less frequent turning or aeration, leading to a cost-efficient process. Despite the many advantages of a microbial inoculant, researchers agree that finding microorganisms suitable for a given substrate is critical; otherwise, inoculants may be ineffective [7]. For this reason, it is important to continue research with different substrates.
Thermal hydrolysis (TH) is a widely analyzed sewage sludge pretreatment technology that focuses on optimizing the anaerobic digestion process. During TH sewage sludge is pumped into a reactor vessel and treated for 20 to 30 min in a temperature range between 160 and 180 °C at a pressure of about 6 bars [15]. These conditions result in the degradation of algae cell walls and cell rupture, releasing intercellular material and thus making it available for instant anaerobic digestion. The benefits of pretreatment technology are reported to include higher energy recovery, sterilization, significantly higher loading rates, improved dewatering, reduced flocculants dosage, better odor control, etc. [16]. However, to the best of the author’s knowledge, scientific literature investigating further optimization possibilities of dewatered digestate treatment is scarce. Only Han et al. (2020) recently assessed composting thermally hydrolyzed and digested sewage sludge. These authors focused on the health impact of odor generated during various processes of a wastewater treatment plant (WWTP), including composting; however, the study did not present any optimization strategies to mitigate malodors [17]. In general, thermal hydrolysis pretreatment in scientific literature is analyzed solely as a measure to boost anaerobic digestion performance (due to TH large impact) [18]; therefore further treatment of digestion effluents, such as dewatered digestate composting, gains little attention. Since this dewatered digestate contains high dry matter (DM) content, further optimization routes, such as co-composting, should be feasible and economically viable.
Therefore, this study aimed to explore the technical, environmental, and economic performance of a few composting alternatives of dewatered digestate obtained after thermal hydrolysis and subsequent anaerobic treatment. The major focus was on a conventional open aerobic treatment by applying a microorganism mixture as an inoculant. The inoculant was based on simultaneous aerobic and anaerobic composting technology.
Research object: sewage sludge after thermal hydrolysis and fermentation (further in the text, the anaerobically digested sludge (ADS) processing in a Vilnius wastewater treatment plant (VWWTP)).
Problems related to sludge management were identified, and optimization solutions were offered using an integrated waste management approach.
Objectives:
  • Analyze the existing ADS management processes and identify problems and their causes;
  • Experiment on ADS composting to find the optimal mixing ratios of ADS and other biodegradable waste (BDW) and determine the possibilities for optimization using microbial inoculants in the production of a product with a higher added value (compost–soil improver);
  • Propose alternatives for optimizing the composting process and conduct a feasibility analysis.

2. Materials and Methods

The sewage sludge treatment capacity in the Vilnius wastewater treatment plant (VWWTP) is up to 4680 m3 per day (up to 62.1 tonnes sludge in DM). An amount ≈36% of sludge DM is supplied from primary precipitators and ≈54% from final sedimentation tank, while the remaining sludge DM is brought from the suburbs of the city.
The main stages of the research coincide with the above-mentioned objectives.

2.1. Analysis of the Current Situation and Evaluation of Gaseous Emissions

This study started with a quantitative analysis of the main material and energy flows (inputs and outputs) of the existing sludge treatment processes and identification of absolute (EI) and relative (EIr) environmental indicators, which were further used for the comparison of the suggested alternatives during the feasibility analysis.
Equation (1) was used for the evaluation of the relative environmental indicators (EIr) [19]:
EIr = EI/D,
where:
  • EI (environmental indicator)—consumption of a certain input (e.g., sludge or ADS, chemical materials, energy, additional water consumption, etc.) and amount of output (e.g., air emissions, wastewater, waste, etc.), expressed in absolute values, units per year;
  • D (main raw material)—amount of sludge in tonnes of dry matter (DM) per year;
  • EIr—consumption of a certain input and amount of output per unit of processed sludge (D), units per tonne of sludge DM.
For example, EIr for energy flows are presented in Table 1 (see Section 3.1). All inputs and outputs (except greenhouse gases (GHGs)) were obtained from the VWWTP environmental reports and financial documents.
The methodology, presented in Volume 2, “Energy”, of the IPCC Guidelines for National Greenhouse Gas Inventories (2006) was used for the assessment of GHG (hereinafter Methodology 1) [20].
Equation (2) was used for the evaluation of GHGs when burning different types of fuel:
Ep = FCT × EF × 10−3 = FCM × Q × EF × 10−3,
where
  • Ep—GHGs (CO2, CH4, N2O), tonnes CO2e year−1;
  • FCT—the energy value of the fuel used, TJ year−1;
  • FCM—mass of consumed fuel, tonnes year−1;
  • Q—lower heating value of fuel, TJ tonne−1;
  • EF—emission factor, kg TJ−1.
In Lithuania, Q and EF values for calculating CO2e are used in the annually published National Greenhouse Gas Inventory Reports, e.g., in 2020, the following values were applied:
  • In the case of using diesel fuel: EFCO2—72,800 kg CO2e per TJ; Q—0.04286 TJ per tonne of diesel fuel;
  • In the case of using natural gas: EFCO2—55,590 kg CO2e per TJ; Q—0.033696 TJ per thousand m3 of natural gas;
  • In the case of using biogas: EFCO2—58,450 kg CO2e per TJ; Q—0.02 TJ per thousand m3 of biogas.
EF for other GHGs were used from Methodology 1, Table 2.4 [20]: in the case of diesel fuel: EFCH4—10 kg per TJ; EFN2O—0.6 kg per TJ; in the case of natural gas: EFCH4—5.0 kg per TJ; EFN2O—0.1 kg per TJ; in the case of biogas: EFCH4—5.0 kg per TJ; EFN2O—0.1 kg per TJ.
GHGs, which are generated during the composting of biodegradable waste (BDW), were evaluated according to the methodology presented in Volume 4, “Biological treatment of solid waste” of the IPCC guidelines (hereinafter Methodology 2) [20].
Equation (3) was used for the evaluation of GHGs during BDW composting:
Ep = Mi × EF × 10−3 × (1 − η),
where
  • Ep—GHGs, tonnes CO2e year−1;
  • Mi—amount of biologically treated organic waste, tonnes year−1;
  • EF—emission factor, kg per tonne of processed organic waste. For example, according to Maulini-Duran et al., (2013), composting anaerobically digested sludge (ADS) together with green waste (GW) generates only 0.73 to 0.83 kg of CH4 per tonne of compostable BDW and from 0.49 to 0.56 kg of N2O per tonne of BDW [21];
  • η—reduction efficiency, e.g., in the case of a biofilter, CH4 is reduced by a minimum of 50%; N2O—up to 90% [22].
Evaluating the indirect amount of CO2e emissions due to electricity consumption from networks, the pollution factor for projects implemented in Lithuania equals 0.42 t CO2e per 1 MWh.
Equation (4) was used to estimate the global warming potential (GWP):
GWP(CO2e) = CO2 + 25 × CH4 + 298 × N2O
When burning biofuel or biogas, CO2 due to biogenic origin is excluded, and GDW equates to zero.
Equation (3) can also be used to estimate air pollutants during BDW composting. For example, according to Maulini-Duran et al. (2013), composting ADS together with green waste (GW) generates up to 0.16 kg of NH3 per tonne of BDW and from 0.023 to 0.043 kg of NMVOC per tonne of BDW [21]. These pollutants were measured and used to determine EF during conventional composting and composting using microbial inoculants.
To analyze air pollution from existing stationary sources of air pollution in the company (boiler plant, biogas purification, cogeneration heat and power plant (CHP), sludge thickening, liquid sludge, dewatered sludge and ADS storage in tanks (after biofilter), as well as ADS drying (after 3-stage scrubber and biofilter)), air pollutant measurements and annual inventory report of air pollution sources and their emissions were used.
Air pollutants generated by burning diesel fuel were assessed according to the methodology provided in the EMEP/EEA Air Pollutant Inventory Manual (2019) [23] (hereinafter Methodology 3), using Equation (3), and the following emission factors for non-road vehicles: EFCO—10.774 g kg−1 of fuel, EFNOx—32.629 g kg−1, EFPM—2.104 g kg−1, EFNMVOC—3.377 g kg−1, EFSO2—0.01 g kg−1 of fuel.

2.2. Sampling and Laboratory Analysis of Processed Sludge and Produced Compost

The sampling of processed sludge and produced compost, as well as laboratory tests of the obtained samples, were performed to determine the main quality and contamination parameters and the amounts of BDW needed for co-composting. To form one test sample, samples were taken from 20 places according to the requirements in Lithuanian normative documents for sludge treatment [24].
Microbiological contamination assessment was performed in the Microbiological Research Division of the National Public Health Service Laboratory; other tests were performed in the Agrochemical Research Laboratory of the Lithuanian Agricultural and Forestry Center.
The quality indicators under investigation were selected according to the recommendations of Staugaitis et al. (2016) [1] required for fertilization products [25]: pHKCl, pHH2O, amount of material in dry matter (DM), organic carbon (C), total nitrogen (TN), total phosphorus (TP), total potassium (TK) in DM, water-soluble nitrogen (N-NH4+ +N-NO3), phosphorus (P) and potassium (K) content in natural moisture content (NMC), sulfates, chloride content in NMC, calcium (Ca), magnesium (Mg) content in NMC, electrical conductivity, C:N ratio, and biodegradability.
The investigated contamination indicators were selected according to the recommendations of Staugaitis et al. (2016) [1] as well as requirements for fertilization products [25] and treated sludge [24]:
  • Contamination with heavy metals: cadmium (Cd), lead (Pb), mercury (Hg), chromium (Cr), zinc (Zn), copper (Cu), nickel (Ni), arsenic (As), and mg kg−1 (DM);
  • Contamination with organic pollution (Polycyclic Aromatic Hydrocarbons: PAH16 and PCB7), mg kg−1 (DM));
  • Microbiological contamination (Escherichia coli (E. coli)) and intestinal enterococci, CFU g−1; anaerobic Clostridia, CFU g−1; Helminth eggs and larvae, pcs. kg−1; and Salmonella bacteria, pcs. kg−1);
  • Contamination with undesirable impurities (glasses, metals, plastics (>2 mm), % in DM; germinated plant seeds, pcs. L−1; stones (>10 mm), % in DM).
The investigated quality and contamination parameters were compared with the ones provided by Staugaitis et al. (2016) [1] and with the requirements for treated sludge [24,25].

2.3. Composting Experiment and Measurement of Air and Odor Emissions

This experiment’s goals were to produce a soil-improvement material (instead of treated sludge, which is considered a waste in Lithuania) with minimal environmental impact and determine the possibilities of using microbial inoculants when composting dewatered ADS with other BDW. Additionally, our goal was to assess whether high concentrations of heavy metals in the digestate would negatively affect good bacteria and determine the exact amount of other BDW needed to optimize the composting process (to reduce emissions, odors and improve quality indicators).
The research was conducted under natural conditions in the VWWTP area, an open area covered with a non-conductive coating, from which surface rainwater is collected and supplied to the treatment facilities. BACKHUS turner was used to form the piles. Two identical piles were formed (length—8 m, height—1.7 m, and width—3.5 m).
The duration of the primary compost production process was 40 days (from 22 May to 30 June). Weather conditions in Lithuania during the experiment: average air temperature—19.6 °C, maximum temperature—up to 29 °C, minimum temperature at the beginning of the composting process—10.0 °C; average amount of precipitation—125 mm; sunshine duration—270 h.
According to the results of the laboratory analysis of the dewatered digestate (see column 5 of Table 2 (ADSD no. 2) in Section 3.1), it was found that 1 tonne of ADS needs to be mixed with 1 tonne of GW (leaves, grass, and trees) and waste pruning trees and shrubs. An equal amount of BDW was mixed in each pile: 3.7 tonnes of digestate (50%), 2.2 tonnes of GW (leaves, grass) (29.73%), and 1.5 tonnes of shredded tree and shrub pruning waste (20.27%). The amount of compostable materials was determined by weighing them with truck scales.
Conventional composting (classical aerobic composting) was carried out in one pile, with periodic turning over (e.g., up to 12 times during the experiment). In another pile, BDW was composted under semi-anaerobic conditions (simultaneous aerobic and anaerobic composting) using microbial inoculants. This pile was turned over only 4 times per analyzed period (once at the beginning of the experiment, and then once per week).
The microbial agent was produced and tested in this study. It is 100% natural and was made in a natural fermentation process using beneficial microorganisms and yeast cultures. It contains certain proportions of water, Lactobacillus acidophilus, L. bulgaricus, L. casie, L. fermentum, L. plantarum, Streptococcus thermophilus, yeast, Saccharomyces cerevisiae, photosynthetic bacteria, carbohydrates, proteins, etc.
The consumption of these inoculants should be from 0.3 to 0.5 L per 1 tonne of dewatered ADS. For more convenient watering (in the case of the experiment-spraying), the concentrated microbial agent was diluted—approx. 1:50. Water consumption can be higher, depending on the weather conditions and, correspondingly, the humidity of the BDW mixture, which should be about 50–60% at the beginning [26]. Spraying was carried out using a 5 L container. A total of 1.2 L of microbial agent (0.324 L per tonne of dewatered ADS) and 60 L of water was used for the experiment.
Measurements of air emissions and odors were taken for the evaluation of environmental impact. Measurements of odors were carried out by the National Public Health Service Laboratory. Two air samples, 10 L each, were taken from piles and were analyzed in the laboratory using the LST EN 13725:2004 + AC:2006 method.
ADMS 4.2 software (Cambridge Environmental Research Consultants Ltd., Cambridge, UK) was used for the modeling of concentrations of odor emissions. Meteorological data from 2014 to 2018 at the Vilnius Meteorological Station (from the Lithuanian Hydrometeorological Service of the Ministry of the Environment) were used for modeling.
Measurements of air emissions (NH3 and NMVOC) were taken by the licensed laboratory UAB “Ekopaslauga” using spectrophotometric method CHS-SVP-74:2021 (for NH3 in the air) and gas chromatography method (standard procedure for the determination of the total hydrocarbon concentration in pollution sources).

2.4. ADS Composting Alternatives and Their Feasibility Analysis (Environmental and Economic Evaluation)

The feasibility of ADS composting alternatives was analyzed using the methodology of implementation of cleaner production in an industrial company [19] (hereinafter the Cleaner Production methodology). Environmental indicators were compared during the environmental assessment (comparative analysis of inputs and outputs (EI or EIr)) of the sludge treatment process before and after the implementation of the suggested alternatives.
Direct process costs of sludge treatment before and after the implementation of the suggested alternatives (EUR year−1 and EUR tonne−1 of sludge in DM) were compared during economic evaluation (estimation of savings by determining the difference between the direct costs). In addition, investment planning by surveying market suppliers was carried out.
Equation (5) was used to calculate the payback period, one of the main economic indicators [19]:
PBP = I S−1,
where
  • PBP—payback period, years;
  • I—investments, EUR;
  • S—savings due to project implementation, EUR year−1.

3. Results and Discussion

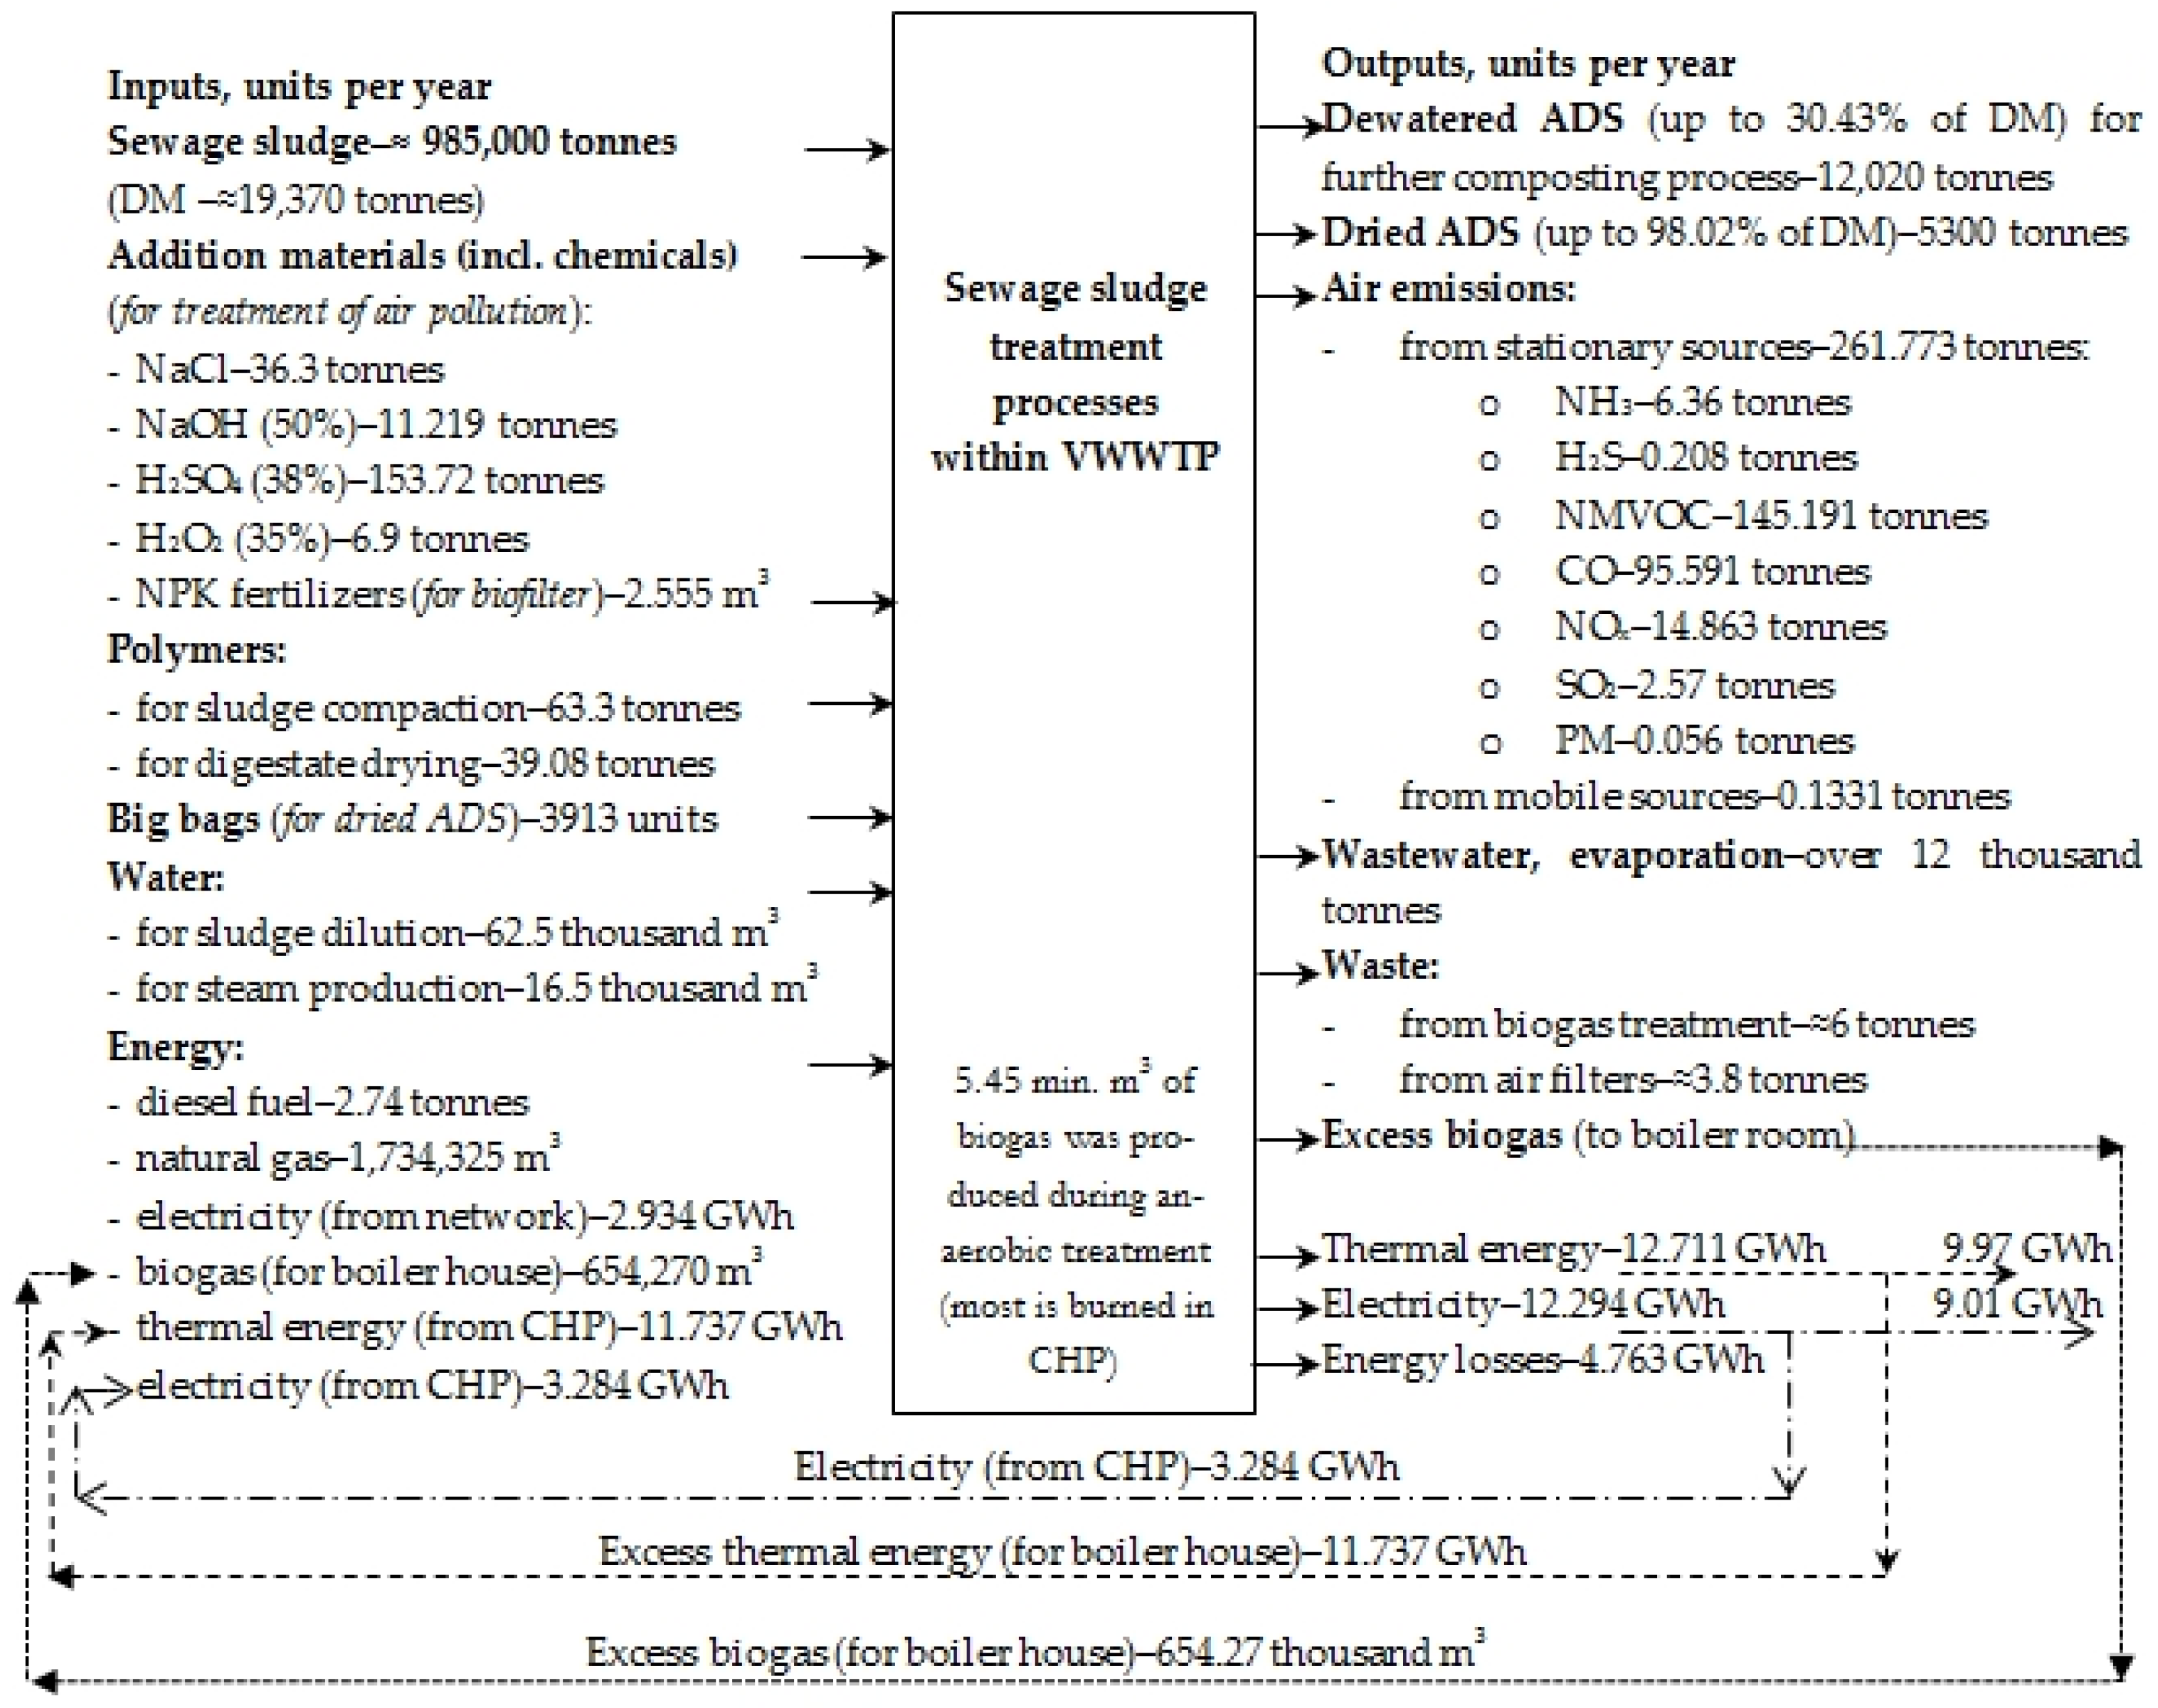
3.1. Results of the Analysis of the Current Situation, and Problem Identification

In the WWTP, sludge is treated using the following technological processes: thickening (up to 14–16% of DM), CAMBI thermal hydrolysis, anaerobic treatment (biogas and ADS production), dewatering of the produced ADS by decanter centrifuge (≥30% of DM), and drying of part of the produced ADS to ≥90% DM; the extracted biogas is cleaned and burned in a 2 MWM cogeneration heat and power (CHP) plant, producing electricity for sludge treatment purposes, and thermal energy (hot water) for ADS drying. Thermal energy is also produced in three natural gas and biogas burned boilers: two steam boilers (SB) producing steam for thermal hydrolysis of sludge, and one water heating boiler (WHB) producing hot water for ADS drying. Excess thermal energy and electricity are directed to wastewater treatment and administration facilities (heating the premises and preparing hot water).
In the analyzed year (2020), 985,000 m3 of sewage sludge was processed in the WWTP, incl. 19.34 tonnes of dry matter, and 5.452 mil. m3 of biogas was produced: 88% of this biogas was burned in the CHP, with 12.294 GWh of electricity and approx. 12.711 GWh of thermal energy produced; the remaining part of the biogas was burned in the boilers. The yield of biogas increases annually; for example, in 2020, it was 282 m3 per tonne of sludge DM.
During ADS processing, 17,320 t of treated sludge was produced according to the requirements for the sewage sludge processing and usage for fertilization and restoration presented in LAND 20-2005 [24]. This treated sludge corresponds to category II according to the concentration of heavy metals, classes A and B according to microbiological–parasitological contamination, i.e., such treated sludge can be used for fertilizing (growing) energy plants and land restoration:
  • Dewatered ADS (on average, up to 30.43% of DM)—12,020 tonnes;
  • Dried ADS (on average, to 98.02% of DM)—5300 tonnes.
The main material and energy flows of the sewage sludge treatment processes (current situation) are shown in the flow diagram in Figure 1.
The results of the initial environmental assessment showed that sludge is currently being processed in the wastewater treatment plant, fully exploiting its energetic and material (nutrients) properties. Due to CAMBI thermal hydrolysis, the yield and calorific value of biogas are increased, the risk of microbiological contamination is minimized, and the dewatering properties of the digestate are improved. Nutrients in the sludge are returned to the soil in either event: in the case of dried ADS, directly for fertilization of energetic plants, and in the case of dewatered ADS, first for composting with green waste (GW), and then for fertilization of energy crops.
The results of a more detailed analysis identified several problems. One of them is high energy consumption for sludge management. As in all sludge-drying companies, the energy produced during the anaerobic treatment of sludge is insufficient to process it. It is necessary to purchase additional energy. The results of the fuel–energy balance are presented in Table 1. A total of 38.06 GWh of energy (up to 1.966 MWh per tonne of sludge in DM) was used for all sludge treatment processes, incl. 48.85%, which was energy produced by burning biogas in CHP or boilers. However, the final energy consumption decreased to 28.08 GWh of energy (1.45 MWh per tonne of sludge in DM) due to the production of excess energy and its usage for other companies’ purposes. ADS drying consumes 18.81 GWh of energy (0.97 MWh per tonne of sludge in DM), e.g., 49.42% of the total energy consumption. Đurđević et al. (2019) reported similar energy demand for sludge drying: from 1.8 to 2.2 kWh kg−1 of sludge in DM [27]. However, Tańczuk and Kostowski (2021) mentioned that depending on technology, energy consumption varies from 0.5 to 1.2 kWh kg−1 of evaporated water, while other authors found that on the laboratory scale, energy demand ranges from 1.2 to 1.75 kWh kg−1 of evaporated water [28,29]. To produce a tonne of sludge DM, 700 kg of water needs to be removed; thus, energy demand should be around 0.35–1.225 MWh per tonne of sludge DM. This total energy consumption increases to 66.99% when analyzing the amount of final energy. It is clear that most of the energy used for drying ADS is produced within the sludge management division, while 22.27% is purchased (diesel fuel for transporting dried sludge in the territory, and up to 1.09 GWh year−1 of electricity) (see Table 1).
Table 1. Energy used for sludge treatment in the sewage treatment plant (current situation).
Energy FlowsEnergy Consumption in the Sludge Treatment Processes, GWh Year−11 Relative Indicators in the Fuel/Energy Balance
EI (Total)EI (for ADS Drying)EI (for Sludge Processing before Drying)EIr, MWh t−1 of Sludge in DM% of Dried ADS
Energy used:
Electricity (from networks)2.931.091.840.15137.26
Electricity (from CHP)3.281.222.060.17037.26
Thermal energy (from CHP)11.7411.7400.606100.00
Exceed biogas (only for boiler)3.571.492.080.18441.76
Natural gas16.513.2413.270.85319.60
Diesel0.030.0300.002100.00
SUM:38.0618.8119.251.96649.42
Excess energy generation in sludge treatment:
Excess electrical energy from CHP9.0109.010.4650
Excess thermal energy from CHP0.9700.970.0500
SUM:9.9809.980.5150
Final energy consumption for sludge treatment:28.0818.819.271.45066.99
Amount of purchased energy in GWh
(% of the cost of the final energy consumption)
19.48
(69.37)
4.36
(23.18)
15.12
(163.11)
1.00422.27
Note: 1 Relative indicators (EIr) were evaluated using Equation (1).
When analyzing the costs of the sludge treatment processes, it was found that dewatered or dried ADS, despite being called “treated sludge”, is still waste, for which the code is 19 08 05 according to the European List of Waste (2000/532/EC). Therefore, the transfer of treated sludge for compost production or direct application to fertilization of energy plants is costly to the company (cost of utilization—up to 36.00 EUR tonne−1). The analysis of the direct costs of the processes has shown that these utilization costs make up only about 10% of the total direct costs since, currently, the utilization of dried ADS for fertilizing energy fields is compensated by the environmental protection fund. Costs would increase to 14.2% without the disposal compensation.
During the analysis of the direct process costs of sludge management, it was found that the cost of purchasing natural gas accounts for more than 35%, whereas electricity from the grid accounts for more than 20%. Without ADS drying, the energy produced by the CHP could be used to heat water prior to steam production for thermal hydrolysis, as well as for other wastewater treatment purposes; also, excess biogas could be used for steam production, thus reducing natural gas consumption.
At the WWTP, samples were taken and formed for testing:
-
Digestate after anaerobic treatment of sewage sludge (before dewatering) (ADS—no. 1) (one sample);
-
Dewatered digestate after anaerobic treatment of sewage sludge (ADSD—no. 2) (three samples);
-
Dewatered and dried digestate after anaerobic treatment of sewage sludge (ADSDR—no. 3) (three samples);
-
Compost produced from dewatered digestate, GW, and peat in another company during the research (C—no. 4) (one sample).
The results of the laboratory analysis of the samples with dewatered and dried ADS (see Table 2 ADSD no. 2 and ADSDR no. 3) showed that this treated sludge had a very high agronomic value according to the main quality indicators. For instance, the amount of organic matter (OM) was above 56% of DM, whereas the sum of total nitrogen (TN), phosphorus pentoxide (P2O5) and potassium oxide (K2O) was 7.85% (significantly more than in requirements for compost (≥2.5% in DM)). Individual amounts of total nitrogen TN and total phosphorus (TP) were >4% and 2.8% DM, respectively. As in other sludge biological treatment facilities in Lithuania, this treated sludge was not contaminated with organic pollution (PAH16, PCB7) and did not contain unwanted impurities (glasses, metals, plastics, when their particle size >2 mm; germinated plant seeds, incl. viable weeds; stones >10 mm) [1]. In treated sludge, the concentrations of heavy metals such as Pb, Hg, Cr, and As do not exceed the limit value (LV) given for fertilizing products [25].
Table 2. The results of laboratory analyzes of anaerobically digested sludge (ADS no1), dewatered anaerobically digested sludge (ADSD no. 2), dried anaerobically digested sludge (ADSDR no. 3), and compost (C no. 4).
Quality and Contamination Parameters1 Values for Quality indication [1,24]2 Requirements for Compost [25]Digestate from Methane TankManufactured Product (Current Situation)Quality Assessment of Produced Ddr and C
ADS
No. 1
ADSD
No. 2
ADSDR
No. 3
C
No. 4
Quality Parameters [1,25]
DM, %<21.00 → >50.00info4.0030.53–33.0093.87–97.0053.61Very high
OM, % DM<16.00 → >45.00>2561.6449.31–56.6857.63–57.9237.87High and very high
C, % DM<5.5 → >50-23.2625.20–26.0022.27–32.2017.60Medium
TN, % DM<0.5 → >2.0TN + P2O5 + K2O > 2.508.714.30–4.594.01–4.332.19Very high
TP, % DM
(P2O5)
<0.21 → >0.8
(0.48 → >1.83)
2.942.36–2.802.58–2.801.03Very high
TK, % SM
(K2O)
<0.6 → >2.5
(0.72 → >3.00)
1.100.36–0.460.22–0.360.26Very low
Conductivity, mS cm−1 <0.6 → >2.0info-137.0077.00-Very high
Water-soluble N, ppm<51.00 → >200.00info-839.00–2660.00380.00–708.001767.00Very high
Water-soluble P, ppm<26.00 → >100.00info-91.50–295.00355.00–1954.0072.00Very high
Water-soluble K, ppm<91.00 → >300.00info-175.00–901.00200.00–746.001147.0Very high
Water-soluble Ca, ppm<101.00 → >500.00--58.0041.00-Very low
Water-soluble Mg, ppm<31.00 → >120.00--28.0039.00-Very low
SO4, ppm<51.00 → >300.00-154.001775.00–9807.00684.00-Very high
Cl, ppm<51.00 → >300.00-77.1022.20–2718.0026.60-Very low
C:N <11.00 → >25.00-2.675.66–5.865.55–7.468.04Very low
pHKCl<5.6 → >8.5info7.907.8–7.96.7-Medium
pHH2O<6.1 → >9.0info8.08.0–8.36.4–7.18.3Medium
Humic acids, % DM---1.943.611.71Medium
DOC, mg kg−1 ≤4000--273.00–5850.0054002580DDR unstable
Contamination parameters [24,25]:
Cd, mg kg−1, DM<1.5–≤5.0≤2.001.832.06–4.441.99–3.852.19Exceeds limit value for a product
Pb, mg kg−1, DM<140.00–≤150.00≤120.0040.9043.00–50.8044.30–60.3041.3meets the requirements
Hg, mg kg−1, DM<1.00–≤1.50≤1.000.0190.052–0.3530.003–0.0170.061meets the requirements
Cr, mg kg−1, DM<140.00–≤170.00≤70.0055.940.10–58.5039.60–57.6037.5meets the requirements
Zn, mg kg−1, DM<800.00–≤2500.00≤800.001387.001580.00–1873.001357.00–1533.001330.00Exceeds limit value for a product
Cu, mg kg−1, DM<300.00–≤1000.00≤300.00256.00270.00–329.00271.00–299.00253.00DD exceeds limit value
Ni, mg kg−1, DM<50.00–≤70.00≤50.0065.9040.00–58.9030.50–66.6028.50DDR exceeds limit value for a product
As, mg kg−1, DM-≤1.000.320.46–0.470.45–0.460.26Meets the requirements
PAH16, mg kg−1, DM<4.00≤6.00--0.4523.08Meets the requirements
PCB7, mg kg−1, DM<0.20≤0.20--0.007–0.030.009Meets the requirements
E. coli, CFU g−1≤1000–≤100,000<1000-330.00–410.0010.00–20.0010.00Meets the requirements
Clostridium perfringens, CFU g−1≤100,000–≤10,000,000--6000–710010.0040.00Meets the requirements
Helminth eggs and larvae, units kg−10.000.00-0.000.000.00Meets the requirements
Salmonella bacteria, units kg−1 in 25 g of sample0.000.00-found in one sample0.000.00DD does not meet the requirements
Glass, metals, and plastic, when their particle size >2 mm, % DM≤0.50≤3.00-0.000.00-Meets the requirements
Germinated plant seeds, incl. viable weeds, units l−1≤2.00≤2.00-0.000.000.30Meets the requirements
Stones >10 mm, % DM≤5.00≤5.00-0.000.00-Meets the requirements
Notes: 1 In the case of quality parameter of treated sludge, the first and second values refer to the lower (very low quality) and upper (very high quality) limits of the parameter [1]. In the case of contamination parameters of treated sludge, first values are limit values for category I and class A according to the concentration of heavy metals and microbiological–parasitological parameters (such treated sludge can be used in agriculture); second values are limit values for category II and class B (such treated sludge can be used only for land restoration and fertilizing energy plants) [24]. 2 Info—means that information about this parameter must be provided [25].
Nevertheless, due to heavy metals (Cd, Zn, Cu, and Ni), the treated sludge cannot be used as a fertilizing product without further composting with carbon-rich organic matter. In addition, when the dewatered sludge is composted by another company that produces compost, the concentrations of Zn and Cd in the compost also exceed the requirements for fertilization products (see Table 2, C no. 4). Additionally, the results of the analysis showed that, despite the thermal hydrolysis and anaerobic process, Salmonella was detected in 25 g of one ADSD sample.
It was concluded that both dried ADS and compost produced in the analyzed year do not meet the requirements for fertilizing products as soil improvers [25]. Additionally, when using dewatered ADS for fertilization, there is a risk of possible microbiological and parasitological contamination that exceeds the LV established in the regulatory documents (although this risk is minimized due to the thermal hydrolysis of sludge at high temperature before anaerobic treatment).

3.2. Results of ADS Composting Experiment

As mentioned in Section 2.3, first of all, the volume of GW to be mixed with the dewatered ADS for the optimal composting process (maintaining the correct C:N ratio—15–30:1 [26]) and forecasting the concentration of heavy metals in the planned compost production) was performed based on results of the laboratory analysis. It was estimated that in the case of composting ADS with GW at a ratio of 1:1 by mass (until now, the most widely used method for composting these BDW), the concentration of Zn in the compost may exceed the limit values. Therefore, we decided to increase the quantity of GW (especially tree and shrub trimmings waste) in the mixture of BDW. The obtained optimal ratio was: 50% ADS dewatered up to 30% of DM, ≈30 ± 0.5% GW (leaves, grass) (with 50% of moisture content), and up to ≈20 ± 0.5% GW (shredded tree and shrub pruning waste) (with 40% moisture content) (see Table 3).
As already described, the production of primary compost took place within 40 days. A microbial agent was sprayed directly on the first composting pile. This pile was turned over only four times during the entire period, so semi-anaerobic conditions were created. The second pile was turned over 12 times (traditionally for open composting in Lithuania—up to 1 or 2 times a week). The main parameters of the composting process are presented in Table 3. The results of the temperature analysis of the composting process showed that the required temperature of ≥55 °C was reached in both piles after approx. 9 days and maintained for over 14 days (in accordance with the requirements provided in LAND 20-2005) [24]. In addition, the temperature of over 60 °C in the first pile was maintained for more than 7 days, which further reduced the risk of microbiological–parasitological contamination of the produced compost. The temperature regime was achieved due to the addition of microbial inoculants. Additionally, Jin et al. (2022) observed that microbial agents increased the temperature up to 67.4 ± 1.5 °C and prolonged the thermophilic stage by 7 days [30]. In a study by Tan et al. (2020), temperatures above 55 °C were detected for 8 days, while in this study the temperatures were maintained for slightly longer [31].
Since the issue of odors during open composting of sludge is relevant in Lithuania, odor measurements were performed on the fifth day of composting: special hoods made of tarpaulin material were placed over the piles (covered surface area (S)—0.5 m2), an intense air flow (30 m3 h−1 per m2) was created, and four air samples were taken (two from each pile). The samples were examined in the National Public Health Service Laboratory. The results obtained were used in the modeling of near-surface odor concentrations. It was determined that the concentration of odor emissions within the boundaries of the plot (the distance from the composting site to the boundaries ≥50 m) did not exceed One European Odor Unit (1 OUE m −3), while the limit value (LV) in the residential environment is 8 OUE m−3. The estimated value of odors in the first pile was lower by more than three times (see Table 3).
Air emission (NH3 and NMVOC) measurements were performed on the seventh day of composting. The measurements were carried out by the licensed laboratory UAB “Ekopaslauga”, which also covered the surfaces with hoods (S—1 m2) for sampling and measurements. The microbial inoculants allowed us to minimize NH3 emissions during the open composting of ADS and GW by 26.6% on average (from 0.214 to 0.157 kg tonne−1 of BDW) and for NMVOC by 12.2% on average (from 0.046 to 0.041 kg tonne−1 of BDW) (see Table 3). Zhou et al. (2019) also stated that microbial agents reduced NH3 emissions by up to 53.11% when laying hen manure composting [32]. Similarly, [33] found that the application of microbial agents for kitchen waste composting reduced NH3 and H2S emissions by 36.57% and 22.30%, respectively. Therefore, the results of the NH3 measurement proves that the composting of thermally hydrolyzed ADS with the addition of a microbial agent delivers good performance and is a perfectly suitable technology to manage thermally hydrolyzed ADS.
Samples (three for each produced primary compost) were taken after 40 days: C1—compost produced using microbial inoculants, and C2—compost produced by a classical method. The results of the laboratory analysis of the main quality and contamination parameters of produced primary composts are shown in Table 4.
The co-composting of ADS with GW, which is nearly heavy-metal-free, reduced heavy metal (Cd, Zn, Cu, and Ni) concentrations to the desirable levels. For example, in comparison to dried digestate (see Table 2; ADSDR no. 3), heavy metal concentrations in the produced compost were reduced (see Table 4: C1 and C2):
-
Cd concertation in DM decreased from an average of 2.92 to 1.36 mg kg−1 (from 1.46 LV to 0.68 LV, where LV = 2 mg kg−1);
-
Zn concertation in DM decreased from an average of 1445 to 699 mg kg−1 (from 1.81 LV to 0.87 LV, where LV = 800 mg kg−1);
-
Cu concertation in DM decreased from an average of 285 to 133.75 mg kg−1 (from 0.95 LV to 0.45 LV, where LV = 300 mg kg−1);
-
Ni concertation in DM decreased from an average of 48.58 to 23.03 mg kg−1 (from 0.97 LV to 0.46 LV, where LV = 50 mg kg−1).
Both produced composts (C1 and C2) were uncontaminated with microbiological–parasitological pollution, incl. Salmonella (see Table 4). Ruiz-Barrera et al. (2018) also found that the addition of yeast to the composting pile helped to eliminate Salmonella [34]. However, Greff et al. (2022) found that the addition of an inoculant did not have an effect on E. coli levels, proving that not only the prolonged thermophilic stage but also the actual microbes play an important role in pathogen control [35]. When comparing the quality parameters of the produced composts (see Table 4: C1 and C2), it was noticed that the concentration of TN in the C1 compost produced using the microbial inoculants increased by 21.84% compared to the concentration in the C2 compost (from an average of 2.06 to 2.51% DM), the P2O5 concentration increased by 33.73% (from an average of 2.49 to an average of 3.33% DM), K2O concentration increased by 52.94% (from an average of 0.34 to an average of 0.52% DM), humic acids increased by 63.37% (from an average of 1.01 to 1.65% DM), fulvic acids increased by 20% (from an average of 0.95 to 1.14% DM), pHKCl increased by 11.97% (from 7.1 to an average of 7.95). Similarly, Zhang et al. (2021) and Manu et al. (2017) found that the addition of ingenious microbes increased the humification rate [36,37]. Fan et al. (2018) observed that commercial microbial agents increased TN from 2.1 to 3.6% DM, while Jin et al. (2022) obtained compost for which the TN concentration was 4.75% DM [30,38]. To conclude, the values of the quality and contamination parameters of the compost produced with the microbial agents were in line with those reported by other authors. A part of the substrate being digested sludge pretreated with thermal hydrolysis does change a performance of inoculants.
It is very important to mention that the increase in N concentration influences the reduction in NH3 emissions to the air (see Table 3).

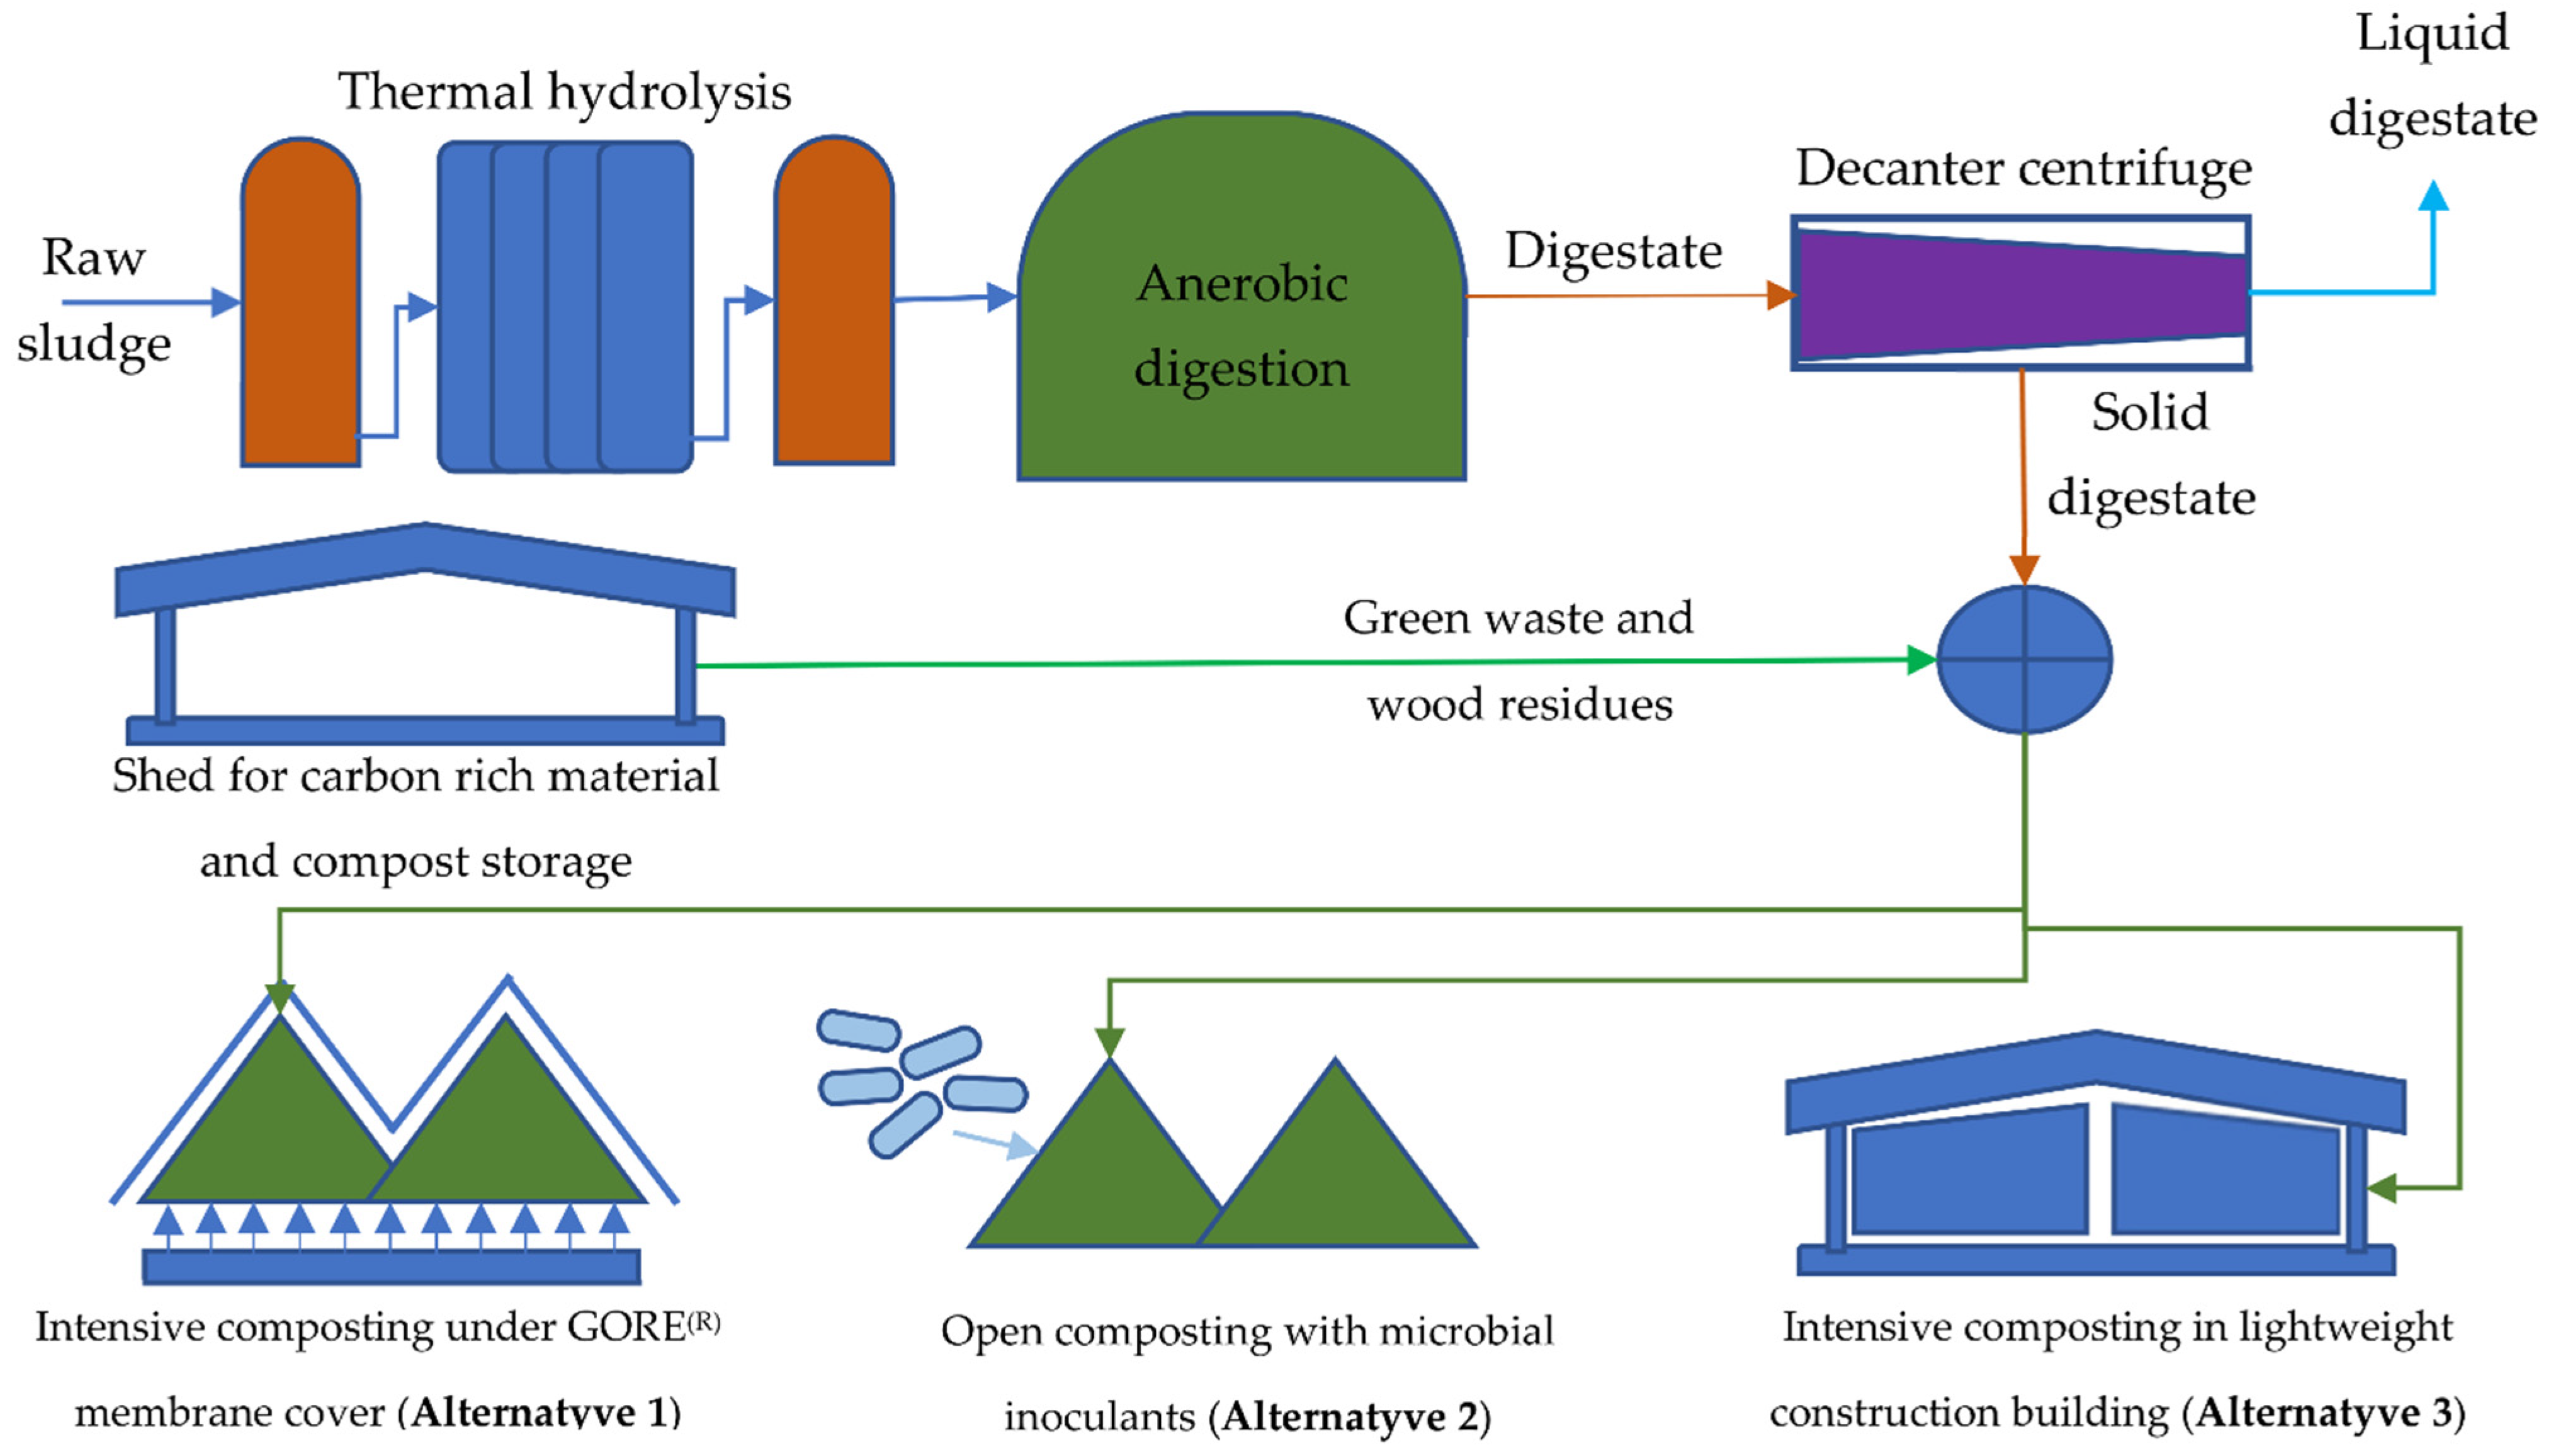
3.3. Suggestion of Alternatives and Results of Their Feasibility Analysis

To further optimize the ADS treatment process, it was proposed that the WWTP should acquire the necessary equipment for composting (a wood waste shredder, compost turner, primary compost screen, and forklift) to produce a higher-value-added fertilization product. The existing site of the plant (an area of 2.2 hectares covered with impermeable pavement, from which the collected surface water is diverted to the treatment plant) can be exploited for this purpose. Up to 29,200 tonnes of dewatered ADS, 17,500 tonnes of GW, and 5800 tonnes of tree and shrub pruning residues, as well as other carbon-rich materials (e.g., waste from the pulp industry), would be composted per year. This project would also solve the problem of GW management in the city and the district (currently, the produced GW composts are of very low and low value according to many quality criteria) [1,39]. A quality product (up to 33,613 tonnes) would be produced annually as a soil improver, for which quality and contamination criteria should be in accordance with the requirements given in [25].
The main part of the produced compost was proposed to be further used for urban and district landscaping (currently over 15,000 tonnes year−1), while the rest was proposed to be sold to farmers. In Lithuania, the demand for composts for fertilizer use is steadily rising, primarily due to the constantly increasing price of chemical fertilizers. During this study, it was assessed that the compost (product) will be subject to periodic testing (min. 12 times a year) by a certified Agrochemical Testing Laboratory and will be sold directly from the site by heavy transport (minimum market price of compost up to 20 EUR tonne−1). In the future, the operator could purchase simple packaging equipment, dispense the compost into packaging, and sell it in supermarkets. In this case, composting costs would increase by a minimum of three times.
The following technical alternatives (see Figure 2) of composting dewatered ADS with other BDW (up to 52,600 tonnes of total BDW per year) were investigated:
(1)
Intensive composting under GORE(R) membrane cover with forced air supply and compost turning; maturation of the primary compost, storage of raw materials (GW, shredded wood waste, etc.); and produced compost under a newly built shed (S is ≈2050 m2) (Alternative 1—intensive composting under GORE(R) membrane).
(2)
Open composting with the use of microbial inoculants (up to 0.324 L per tonne of dewatered ADS, as determined in the experiment) to optimize the process, reduce the environmental impact and increase the value of the product produced (another solution regarding the implementation of a shed corresponds to alternative 1) (Alternative 2—open composting with the use of microbial inoculants).
(3)
Intensive composting in a new lightweight construction building (S is ≈5000 m2) with sliding walls and doors, a forced-air exhaust system, and a biofilter to minimize the concentration of air emissions and odors during the composting process (Alternative 3—intensive composting in new lightweight construction building).
The results of the feasibility analysis of the alternatives are presented in Table 5 and Table 6. The existing sludge management process flows (inputs and outputs) with the planned flows for each of the alternatives are compared in Table 5, analyzing their relative indicators (EIr). The results of the economic evaluation are systematized in Table 6.
In the current situation, when composting of BDW (≈18,030 tonnes year−1, incl. ≈12,020 tonnes of dewatered ADS) is carried out by another legal entity, the estimated emissions of air pollutants (NH3 and NMVOC) were up to 4.69 tonnes and the GWP due to GHGs (CH4 and N2O) were up to 3400 tonnes CO2e per year. This is an indirect impact of the analyzed WWTP on air quality and climate change.
The assessment of air pollutants was carried out using the EFs determined by measurement (see Table 3) (NH3 up to 0.214 kg tonne−1 of BDW and NMVOC up to 0.046 kg tonne−1 of BDW). The current situation was analyzed by estimating the amount of BDW currently composted, which is about 18,000 tonnes year−1, including 12,000 tonnes of dewatered ADS. Up to 52,500 tonnes of BDW is planned to be composted in the proposed alternatives. Using a membrane film reduces NH3 emissions by up to 90% and NMVOC by up to 50%. Using a biofilter, NH3 reductions of up to 95% and NMVOC reductions of up to 50% are achieved [22]. Using the microbial agent, the EFs were determined by measurements: NH3 up to 0.157 tonne−1 of BDW and NMVOC up to 0.041 tonne−1 of BDW (see Table 3).
It is important to note that since the alternatives propose to refuse the drying of ADS and use all the dewatered ADS for the production of compost that meets the requirements of the product (soil improver), the consumption of chemicals (for air pollution treatment in the sludge-drying facility) would be reduced by up to eight times, e.g., the use of sulfuric acid electrolyte (38% solution) and H2O2 (35%), while the use of NaOH (50%) would be reduced by ≈29.4%.
The best and most cost-effective advances are in the field of energy use. Natural gas consumption decreases by 1.8 times, and electricity consumption from the grid decreases by more than 4 times. The increased amount of excess thermal energy from the CHP plant will be used primarily for the company’s needs, with the surplus being fed into the grid, thus implementing the principles of industrial symbiosis.
The introduction of composting of ADS together with the urban GW reduces the total energy consumption of sludge management by practically 50%: from 1.966 MWh tonne−1 of sludge DM (see Table 1) to 0.997–1.002 MWh tonne−1 of sludge DM (see Table 5). Such high energy demand for sludge management in the current situation is due to the sludge-drying process. According to other studies, the sole drying of sludge consumes on average 2.5 MWh tonne−1 of sludge DM [40].
If the compensation measures are analyzed and subtracted from energy consumption, the amount of energy that is generated at the sludge processing department but not used in it (i.e., the energy transferred for other purposes at the treatment plant or sold to the market), then the fuel–energy balance will be positive (volume of excesses energy between 124 and 223 MWh year−1). The lower energy consumption is, consequently, the more surplus energy is generated under alternative 2.
Table 5 shows the total estimated GHGs generated during fuel combustion, the composting of BDW, as well as electricity consumption from the grid (indirect effect). In terms of GHGs as well as air pollutants, the biofilter or membrane alternatives are preferable, but these alternatives will generate more waste (from the exhaust air filters). Regarding air pollutant prevention, alternative 2 is preferable; for example, if BDW open composting with microbial inoculant is compared to conventional open composting, the air pollutant emissions (NH3 and NMVOC) are reduced from 13.685 to 10.421 tonnes year−1 (23.85%), and the emissions of GHGs are reduced from 9.88 to 8.65 thousand tonnes CO2e year−1 (12.45%).
The table shows the GHGs from the combustion of all biogas (both in the CHP plant and in the steam boiler)—up to 16.88 tonnes CO2e year−1 (excluding biogenic CO2). The increase in excess energy will reduce the amount of GHGs that would be generated if this energy were produced by burning fossil fuels.
A Cleaner Production methodology was adopted for the feasibility analysis of the alternatives [19]. The economic evaluation of the alternatives for sludge management showed that alternative two is the most economically viable option (see Table 6). Compared to the others, this option requires between 2.7 and 3.8 times less investment. Alternative two results in direct process costs that are only 4.9% to 5.3% higher compared to alternatives one and three, but more than 2 times lower than the current situation. In any case, the implementation of the composting alternatives would reduce the direct costs of sludge management processes by up 1.7 times, as it would completely eliminate the costs of ADS drying, which are considerably higher than composting. Without assessing revenues, but analyzing the savings from direct cost reductions only, the payback periods of investments in alternatives are the following: up to 1 year for alternative two, up to 2 years for alternative one, and up to 2.5 years for alternative three. In case the incomes are estimated due to processing of the incoming GW (pessimistic assumption—approx. 10 EUR tonne−1, while, on the Lithuanian market, the cost is more than 25 EUR tonne−1), for sales of the compost (approx. 20 EUR tonne−1 as a minimum), as well as for the diversion of the excess energy to the other processes of the WWTP (i.e., only alternative energy from the sludge processing facility would be used for the WWTP and heating of the premises), then the incomes from the sale of the products would fully cover the costs of the sludge treatment. After the implementation of the project, energy costs (for the purchase of grid electricity and natural gas) would still account for the largest part of the sludge management costs, but they would decrease from 55.30% (in the current situation) to 43.9% (in the case of the implementation of alternatives one or three) and 42.1% (in the case of the implementation of alternative two). In the case of alternative two, diesel fuel consumption for the piles turning would be reduced while electricity use would be completely eliminated. The annual cost of the microbial agent would be around 85.3 thousand EUR or 3.41% of the direct costs of the process. At present, more than 30 employees work in sludge management within WWTP. If sludge drying were to be excluded, some workers would be employed in compost production. This would also require recruiting four additional workers to operate composting equipment.
It is very important to note that in the case of the implementation of alternative two, the depreciation costs of new equipment and constructions would be more than two times lower, which affects the cost price of sludge management. The minimum cost price for sludge treatment (52.97 EUR tonne−1 of sludge in DM) is planned in case of the implementation of alternative two (see Table 6).
Although the sludge management cost price in the current situation (175.55 EUR tonne−1 of sludge DM) is in line with those reported by Đurđević et al. (2019) (100–200 EUR tonne−1 of sludge DM), the management costs of the suggested alternatives would be lower than 100 EUR tonne−1 of sludge DM [27]. In addition to this, Capodaglio and Olsson (2020) reported that sludge treatment by composting is the most expensive disposal route accounting for a minimum of 150 EUR tonne−1 of sludge DM, while drying and incineration are the cheapest (80 EUR of sludge DM for both methods) [40]. However, Amann et al. (2021) stated that thermal treatment is the most expensive route, while composting at WWTP could amount to 170–190 EUR tonne−1 of sludge DM [41]. The results of this study show that composting is the most attractive management option, which is significantly less cost intensive compared to those reported. Such difference may be attributed to the presence of thermal hydrolysis, the planned optimization of composting, and sales of the produced compost (as soil improver), for which management cost is up to 52.97 EUR tonne−1 of sludge DM.
The case study proves that open composting under semi-anaerobic conditions of solid digestate produced in WWTP with TH pretreatment is a robust option from a cost and environmental impact reduction perspective. It allows recovering phosphorus, nitrogen, and potassium without significant investments in sophisticated technologies, such as struvite precipitation or ammonium sulfate recovery. In terms of environmental impact reduction, this composting would eliminate the drying of digestate and, therefore, redirect the thermal energy for other uses in plants or district heating. Moreover, the implementation of the suggested management is readily available for WWTP without significant investments.

4. Conclusions

A detailed analysis of the sludge management processes of municipal WWTP was carried out, determining all inputs and outputs, estimating the management costs, and identifying the problems. The researched plant is interesting because the sludge is subjected to thermal hydrolysis before anaerobic treatment. On the one hand, this increases biogas yield in a shorter time; on the other hand, steam and a considerable amount of water are used for thermal hydrolysis. As with other installations of this type, the amount of energy produced is lower compared to the consumption, mainly because part of the ADS is dried (this consumes over 49% of the total energy, including over 22% from purchased sources (natural gas, diesel fuel)). The analysis showed that without drying the ADS, the energy produced by CHP could be used to heat water before steam production, as well as for other purposes of the WWTP (not only for sludge management); surplus biogas, which is not burned in CHP, could be burned for steam production, thus reducing natural gas consumption. The current situation is that starting in 2020, the share of natural gas acquisition costs in the total balance of direct costs increased from 23% to 35%.
A bigger problem is connected with the main product-treated sludge, which does not meet the criteria of a fertilizing product; therefore, after treatment, it is utilized as waste, even though it is used for fertilizing energy forests. In the treated sludge, the concentrations of Cd and Zn exceed those required for the fertilizing product (by 1.47 and 1.81, respectively), while Cu and Ni are dangerously close to the limit value (0.95 and 0.97).
The practical benefit of the research is that sludge management optimization possibilities were identified. It was estimated that composting of all the dewatered ADS together with green waste (leaves, grass, shredded tree, shrub pruning waste) from public areas of the city:
  • Reduces energy costs for sludge treatment from 1.966 to 0.996 MWh tonne−1 sludge DM;
  • Increases the use of excess energy in other technological processes of the WWTP from 0.515 to 1.008 GWh tonne−1 sludge DM;
  • Directs part of the excess thermal energy (about 10 GWh year−1) to city networks, thereby realizing industrial symbiosis (savings due to the realization of excess energy were not evaluated);
  • Reduces the direct costs of sludge treatment by 1.7 times (from 216.75 to 129.27 EUR tonne−1 sludge DM);
  • Produces a product with added value (up to 33,600 tonne year−1), which can be used for fertilization without increasing the impact on the environment due to possible pollution with heavy metals and microbiological−parasitological contamination;
  • Safely returns nutrients to the soil (up to 345 tonnes year−1 of TN, 202 tonnes year−1 of TP, and 60 tonnes year−1 of TK) and thus contributes to the realization of circular economy principles in the country.
It was noted that ADS composting together with GW does not require large investments in infrastructure (the construction of new buildings). The use of microbial inoculants in ADS open composting, while maintaining semi-anaerobic conditions:
  • Reduces the total fuel costs for composting by 1.3 times and simultaneously reduces the direct and indirect costs associated with the operation and wear and tear of the turner;
  • Preventively reduces the impact on ambient air quality: (a) emissions from stationary sources of pollution are reduced: NH3 by 1.37 times (from 0.214 to 0.157 kg tonne−1 BDW), NMVOC by 1.12 times (from 0.046 to 0.041 kg tonne−1 BDW), and (b) emissions from mobile sources decrease since the frequency of turning is reduced 3 times;
  • Does not increase the impact on climate change due to GHG (CH4 and N2O);
  • Does not exceed the limit values of air pollutants and odors that are set by hygiene standards;
  • Produces a product of higher added value, compost, which is characterized by a higher amount of nutrients. Compared to compost produced from identical raw material but without the addition of microbial inoculants, TN increased by over 20%, TP increased by over 30%, TK increased by over 50%, and humic acids increased by 63.37%;
  • When analyzing the costs of all sludge treatment processes, reduces the costs by approx. 13% when comparing the open composting of ADS with the addition of microbial inoculants to intensive composting of ADS under cover or in a building.

Author Contributions

Conceptualization: I.K. and E.S.; methodology: I.K. and R.P.B.; validation: I.K.; investigation: I.K. and R.P.B.; writing—original draft preparation: I.K., E.S. and J.K.; writing—review and editing: J.K. and E.S.; supervision: J.K.; funding acquisition: J.K. All authors have read and agreed to the published version of the manuscript.

Funding

The publication was supported by the project: “Monitoring of water and sewage management in the context of the implementation of the circular economy assumptions” (MonGOS), no. PPI/APM/2019/1/00015/U/00001/ZU/00002 (2020–2022), financed by the Polish National Agency for Academic Exchange (NAWA) under the International Academic Partnerships Program.

Data Availability Statement

Not applicable.

Acknowledgments

This paper and its research behind it would not have been possible without the Vilnius Waste Water treatment plant and permission to share the data with academic society. We are grateful to the plant’s staff with whom we have had the pleasure to work during this investigation.

Conflicts of Interest

The authors declare no conflict of interest.

References

  1. Lithuanian Ministry of Environment. Arrangement of Requirements (Criterions) for Products Made of Biodegradable Waste; Agrochemical Research Laboratory and UAB “EcoIri Solutions”, 2016; p. 131. Available online: https://am.lrv.lt/uploads/am/documents/files/TYRIMAI%20IR%20ANALIZES/0_184367001489675205.pdf (accessed on 10 August 2022). (In Lithuanian).
  2. EurEau. Waste Water Treatment—Sludge Management. Available online: https://www.eureau.org/resources/briefing-notes/5629-briefing-note-on-sludge-management/file (accessed on 10 August 2022).
  3. Wu, S.; Zhang, Z.; Li, J.; Wu, T.; Jiao, X. An Experimental Study of Paddy Drainage Treatment by Zeolite and Effective Microorganisms (EM). Sustainability 2022, 14, 6992. [Google Scholar] [CrossRef]
  4. Zhang, C.; Li, X.; Zhao, X.; Yang, J.; Li, S.; Dang, Q.; Tan, X. Recognize and Assessment of Key Host Humic-Reducing Microorganisms of Antibiotic Resistance Genes in Different Biowastes Composts. Sci. Total Environ. 2022, 806, 150736. [Google Scholar] [CrossRef] [PubMed]
  5. Henry, A.B.; Maung, C.E.H.; Kim, K.Y. Metagenomic Analysis Reveals Enhanced Biodiversity and Composting Efficiency of Lignocellulosic Waste by Thermoacidophilic Effective Microorganism (TEM). J. Environ. Manag. 2020, 276, 111252. [Google Scholar] [CrossRef]
  6. Ansari, K.; Khandeshwar, S.; Waghmare, C.; Mehboob, H.; Gupta, T.; Shrikhande, A.N.; Abbas, M. Experimental Evaluation of Industrial Mushroom Waste Substrate Using Hybrid Mechanism of Vermicomposting and Effective Microorganisms. Materials 2022, 15, 2963. [Google Scholar] [CrossRef]
  7. Zainudin, M.H.; Zulkarnain, A.; Azmi, A.S.; Muniandy, S.; Sakai, K.; Shirai, Y.; Hassan, M.A. Enhancement of Agro-Industrial Waste Composting Process via the Microbial Inoculation: A Brief Review. Agronomy 2022, 12, 198. [Google Scholar] [CrossRef]
  8. Yang, L.; Jie, G.; She-Qi, Z.; Long-Xiang, S.; Wei, S.; Xun, Q.; Man-Li, D.; Ya-Nan, Y.; Xiao-Juan, W. Effects of Adding Compound Microbial Inoculum on Microbial Community Diversity and Enzymatic Activity During Co-Composting. Environ. Eng. Sci. 2018, 35, 270–278. [Google Scholar] [CrossRef]
  9. Niu, J.; Li, X. Effects of Microbial Inoculation with Different Indigenous Bacillus Species on Physicochemical Characteristics and Bacterial Succession during Short-Term Composting. Fermentation 2022, 8, 152. [Google Scholar] [CrossRef]
  10. Wu, D.; Xia, T.; Zhang, Y.; Wei, Z.; Qu, F.; Zheng, G.; Song, C.; Zhao, Y.; Kang, K.; Yang, H. Identifying Driving Factors of Humic Acid Formation during Rice Straw Composting Based on Fenton Pretreatment with Bacterial Inoculation. Bioresour. Technol. 2021, 337, 125403. [Google Scholar] [CrossRef]
  11. El Hayany, B.; Rumpel, C.; Hafidi, M.; El Fels, L. Occurrence, Analysis of Microplastics in Sewage Sludge and Their Fate during Composting: A Literature Review. J. Environ. Manag. 2022, 317, 115364. [Google Scholar] [CrossRef]
  12. Xu, M.; Yang, M.; Sun, H.; Meng, J.; Li, Y.; Gao, M.; Wang, Q.; Wu, C. Role of Multistage Inoculation on the Co-Composting of Food Waste and Biogas Residue. Bioresour. Technol. 2022, 361, 127681. [Google Scholar] [CrossRef]
  13. Ballardo, C.; Vargas-García, M.d.C.; Sánchez, A.; Barrena, R.; Artola, A. Adding Value to Home Compost: Biopesticide Properties through Bacillus Thuringiensis Inoculation. Waste Manag. 2020, 106, 32–43. [Google Scholar] [CrossRef] [PubMed]
  14. Jeffrey, G. Simultaneous Aerobic and Anaerobic Composting Process. U.S. Patent 2,867,521, 6 January 1955. [Google Scholar]
  15. Cambi. How Does Thermal Hydrolysis Work. Available online: https://www.cambi.com/what-we-do/thermal-hydrolysis/how-does-thermal-hydrolysis-work/ (accessed on 10 August 2022).
  16. Barber, W.P.F. Thermal Hydrolysis for Sewage Treatment: A Critical Review. Water Res. 2016, 104, 53–71. [Google Scholar] [CrossRef] [PubMed]
  17. Han, Z.; Qi, F.; Li, R.; Wang, H.; Sun, D. Health Impact of Odor from On-Situ Sewage Sludge Aerobic Composting throughout Different Seasons and during Anaerobic Digestion with Hydrolysis Pretreatment. Chemosphere 2020, 249, 126077. [Google Scholar] [CrossRef] [PubMed]
  18. Ngo, P.L.; Udugama, I.A.; Gernaey, K.V.; Young, B.R.; Baroutian, S. Mechanisms, Status, and Challenges of Thermal Hydrolysis and Advanced Thermal Hydrolysis Processes in Sewage Sludge Treatment. Chemosphere 2021, 281, 130890. [Google Scholar] [CrossRef]
  19. Staniškis, J.K.; Stasiškienė, Ž.; Kliopova, I.; Varžinskas, V. Innovations in Lithuania Industry Development and Implementation; Technologija: Kaunas, Lithuania, 2010; 458p. [Google Scholar]
  20. Eggleston, S.; Buendia, L.; Miwa, K.; Ngara, T.; Tanabe, K. 2006 IPCC Guidelines for National Greenhouse Gas Inventories; Institute for Global Environmental Strategies: Hayama, Japan, 2006; Volume 5. [Google Scholar]
  21. Maulini-Duran, C.; Artola, A.; Font, X.; Sánchez, A. A Systematic Study of the Gaseous Emissions from Biosolids Composting: Raw Sludge versus Anaerobically Digested Sludge. Bioresour. Technol. 2013, 147, 43–51. [Google Scholar] [CrossRef] [Green Version]
  22. Baky, A.; Eriksson, O. Systems Analysis of Organic Waste Management in Denmark: Environmental Project No. 822 2003 Miljøprojekt; Danish Environmental Protection Agency: Odense, Denmark, 2003. [Google Scholar]
  23. EMEP/EEA. EMEP/EEA Air Pollutant Emission Inventory Guidebook 2019. Available online: https://www.eea.europa.eu/publications/emep-eea-guidebook-2019 (accessed on 15 July 2021).
  24. Ministry of Environment of the Republic of Lithuania. Normative Document LAND 20-2005 “Requirements for the Use of Sewage Sludge for Fertilization and Restoration”; Final Revision—2022; Ministry of Environment of the Republic of Lithuania: Vilnius, Lithuania, 2001. [Google Scholar]
  25. Parliament of the Republic of Lithuania. Description of the Procedure for Inclusion and Removal of Fertilizing Products Placed in the Identification List and Supplied in the Market of the Republic of Lithuania; Final Revision—2022; Parliament of the Republic of Lithuania: Vilnius, Lithuania, 2019. [Google Scholar]
  26. Kliopova, I. Integrated Waste Management System for Resort Town. Environ. Res. Eng. Manag. 2016, 72, 31–55. [Google Scholar] [CrossRef] [Green Version]
  27. Đurđević, D.; Blecich, P.; Jurić, Ž. Energy Recovery from Sewage Sludge: The Case Study of Croatia. Energies 2019, 12, 927. [Google Scholar] [CrossRef] [Green Version]
  28. Siedlecka, E.; Siedlecki, J. Influence of Valorization of Sewage Sludge on Energy Consumption in the Drying Process. Energies 2021, 14, 4511. [Google Scholar] [CrossRef]
  29. Tańczuk, M.; Kostowski, W. Technical, Energetic and Economic Optimization Analysis of Selection of Heat Source for Municipal Sewage Sludge Dryer. Energies 2021, 14, 316. [Google Scholar] [CrossRef]
  30. Jin, X.; Ai, W.; Zhang, Y.; Dong, W. Application of Functional Microbial Agent in Aerobic Composting of Wheat Straw for Waste Recycling. Life Sci. Space Res. 2022, 33, 13–20. [Google Scholar] [CrossRef]
  31. Tan, W.; Liu, P.; Zhang, X.; Xi, B. Effect of Matured Compost and Exogenous Microbial Inoculants on the Composting Process of Digestate Eluted from Dry Anaerobic Digestion. In Proceedings of the Third International Workshop on Environment and Geoscience, Chengdu, China, 18–20 July 2020. [Google Scholar] [CrossRef]
  32. Zhou, S.; Zhang, X.; Liao, X.; Wu, Y.; Mi, J.; Wang, Y. Effect of Different Proportions of Three Microbial Agents on Ammonia Mitigation during the Composting of Layer Manure. Molecules 2019, 24, 2513. [Google Scholar] [CrossRef] [PubMed] [Green Version]
  33. Wang, C.; Wu, M.; Peng, C.; Yan, F.; Jia, Y.; Li, X.; Li, M.; Wu, B.; Xu, H.; Qiu, Z. Bacterial Dynamics and Functions Driven by a Novel Microbial Agent to Promote Kitchen Waste Composting and Reduce Environmental Burden. J. Clean. Prod. 2022, 337, 130491. [Google Scholar] [CrossRef]
  34. Ruiz-Barrera, O.; Rivera-Sida, J.; Arzola-Alvarez, C.; Itza-Ortiz, M.; Ontiveros-Magadan, M.; Murillo-Ortiz, M.; Angulo-Montoya, C.; Corral-Luna, A.; Castillo-Castillo, Y. Composting of Laying Hen Manure with the Addition of a Yeast Probiotic. Ital. J. Anim. Sci. 2018, 17, 1054–1058. [Google Scholar] [CrossRef]
  35. Greff, B.; Szigeti, J.; Nagy, Á.; Lakatos, E.; Varga, L. Influence of Microbial Inoculants on Co-Composting of Lignocellulosic Crop Residues with Farm Animal Manure: A Review. J. Environ. Manag. 2022, 302, 114088. [Google Scholar] [CrossRef]
  36. Zhang, T.; Wu, X.; Shaheen, S.M.; Rinklebe, J.; Bolan, N.S.; Ali, E.F.; Li, G.; Tsang, D.C.W. Effects of Microorganism-Mediated Inoculants on Humification Processes and Phosphorus Dynamics during the Aerobic Composting of Swine Manure. J. Hazard. Mater. 2021, 416, 125738. [Google Scholar] [CrossRef]
  37. Manu, M.K.; Kumar, R.; Garg, A. Performance Assessment of Improved Composting System for Food Waste with Varying Aeration and Use of Microbial Inoculum. Bioresour. Technol. 2017, 234, 167–177. [Google Scholar] [CrossRef]
  38. Van Fan, Y.; Lee, C.T.; Klemeš, J.J.; Chua, L.S.; Sarmidi, M.R.; Leow, C.W. Evaluation of Effective Microorganisms on Home Scale Organic Waste Composting. J. Environ. Manag. 2018, 216, 41–48. [Google Scholar] [CrossRef]
  39. Stunžėnas, E.; Kliopova, I.; Kliaugaitė, D.; Budrys, R.P. Industrial Symbiosis for Optimal Bio-Waste Management and Production of a Higher Value-Added Product. Processes 2021, 9, 2228. [Google Scholar] [CrossRef]
  40. Capodaglio, A.G.; Olsson, G. Energy Issues in Sustainable Urban Wastewater Management: Use, Demand Reduction and Recovery in the Urban Water Cycle. Sustainability 2020, 12, 266. [Google Scholar] [CrossRef]
  41. Amann, A.; Weber, N.; Krampe, J.; Rechberger, H.; Zoboli, O.; Zessner, M. Operation and Performance of Austrian Wastewater and Sewage Sludge Treatment as a Basis for Resource Optimization. Water 2021, 13, 2998. [Google Scholar] [CrossRef]
Figure 1. Main material and energy inputs and outputs of sewage sludge treatment processes (current situation).
Water 14 04102 g001
Figure 2. Visual representation of alternatives under consideration.
Water 14 04102 g002
Table 3. Technological parameters of composting processes and results of emission measurement.
No.Analyzed Parameters1st Pile (Composting with Microbial Inoculants)2nd Pile (Composting in the Classic Way)
1Amount of compostable BDW7.4 tonnes7.4 tonnes
1.1dewatered ADS (50% by mass)3.7 tonnes3.7 tonnes
1.2GW (leaves, grass) (29.73% by mass)2.2 tonnes2.2 tonnes
1.3GW (waste pruning trees, shrubs) (20.27% by mass)1.5 tonnes1.5 tonnes
2Amount of used microbial inoculants (0.324 L for 1 tonne of dewatered ADS)1.2 L0
3Amount of used water for dilution (1:50)60 L0
4Duration of primary compost production40 days40 days
5Number of turns during the composting period412
6Maintenance of conditionsSimultaneous aerobic and anaerobic compostingAerobic
7Temperature reached during composting:after 7 days 50 °C 45 °C
after 10 days58 °C55 °C
after 21 days60 °C63 °C
after 30 days63 °C54 °C
after 39 days38 °C35 °C
8Results of odor measurement on the fifth day of composting:
within each m2
in the composting site


0.776 OUE s−1
21.728 OUE s−1


1.840 OUE s−1
51.52 OUE s−1
9Results of odor modeling within the plot boundaries of the composting site0.012 OUE m−30.037 OUE m−3
10NH3 emissions (average of 3 measurements) on the seventh day of composting:
within each m21.20 × 10−5 g s−11.64 × 10⁻⁵ g s−1
in the composting site33.6 × 10−5 g s−145.92 × 10⁻⁵ g s−1
per 1 tonne of BDW0.157 kg tonne−1 0.214 kg tonne−1
11NMVOC (average of 3 measurements) on the seventh day of composting:
within each m23.16 × 10−6 g s−13.54 × 10⁻⁶ g s−1
in the composting site88.48 × 10−6 g s−199.12 × 10⁻⁶ g s−1
per 1 tonne of BDW0.041 kg tonne−1 0.046 kg tonne−1
Table 4. Results of laboratory analysis of the produced primary composts.
Quality and Contamination ParametersValues for Quality Indication and LV for Contamination [1,25,39]Produced Primary CompostsQuality Assessment of Produced C1 and C2
C1 (Produced Using Microbial Inoculants)C2 (Produced by a Classical Method)
1 Analyzed quality parameters
DM, %<21.00 → >50.0038.53–39.9342.00–44.32High and very high
OM, % DM<16.00 → >45.0041.00–45.4939.95–40.39Very high and high
TN, % DM<0.5 → >2.02.45–2.572.03–2.09Very high
TP, % DM
(P2O5)
<0.21 → >0.8
(0.48 → >1.83)

(3.22–3.44)

(2.43–2.55)
Very high
TK, % SM
(K2O)
<0.6 → >2.5
(0.72 → >3.00)

(0.51–0.53)

(0.31–0.37)
Very low
Conductivity, mS/m<60 → >20094.172.6Low
Water-soluble N, ppm <51 → >200433171Very high
Water-soluble P, ppm<26 → >100125104Very high
Cl, ppm<51.00 → >300.00140nMedium
pH KCl<5.6 → >8.57.8–8.17.1High and medium
Humic acids, % DM-1.55–1.750.97–1.05Medium and low
Fulvo acids, % DM-1.10–1.170.90–0.99Medium and low
1 Analyzed contamination parameters
Cd, mg kg−1, DM<2.001.35–1.421.27–1.38Meets the requirements
Zn, mg kg−1, DM<800.00655.00–758.00627.00–756.00Meets the requirements
Cu, mg kg−1, DM<300.00125.00–160.00117.00–133.00Meets the requirements
Ni, mg kg−1, DM<50.0023.00–27.0019.10–23.00Meets the requirements
E. coli, CFU g−1<1000<110<110Meets the requirements
Clostridium perfringens, CFU g−1<100,0000–10.000–10.00Meets the requirements
Salmonella bacteria, units kg−1 in 25 g of sample0.0000Meets the requirements
Note: 1 Pb, Hg, Cr, As, and organic pollutants PAH16 and PCB7 were not investigated, as there was no exceedance of limit values within the digestate from the methane tank (see Table 2, ADS no. 1, ADSD no. 2 and ADSDR no. 3).
Table 5. Comparison of 1 relative environmental indicators (EIr) of sludge management alternatives with the current situation.
Analysis of Key Inputs and OutputsUnits Per Tonne of DMCurrent Situation3 Alternative 13 Alternative 23 Alternative 3
Inputs
2 Sludge (main raw materials)tonne1111
NPK (nitrogen, phosphorus, potassium) fertilizers for biological biogas purificationliters0.1320.1320.1320.132
Flocculants for sludge thickening and dewateringkg5.2875.2875.2875.287
Chemicals (for cleaning air pollutants in biofilters, scrubbers, etc.)kg10.7471.3461.3461.346
Microbial inoculantlitres0.0000.0000.4890.000
Diesel fuelkg0.1411.7001.8672.283
Lubricantsliters0.1290.1300.1300.130
Hydraulic oillitres0.0000.0090.0090.009
Big bags for dried compostunits0.202000
Waterm34.3094.3094.3334.309
Electricity (from grid)kWh151.48334.57931.86231.997
Electricity (from CHP)kWh169.580169.580169.580169.580
Thermal energy (from CHP)kWh606.076113.596113.596113.596
Biogas (from anaerobic digestion)m333.78333.78333.78333.783
Natural gas (from grid)m389.55149.86949.86949.869
GW (leaves, grass, etc.)tonnes0.0000.9060.9060.906
Other carbon-rich BDW (e.g., wood residues)tonnes0.0000.3020.3020.302
Outputs
Dewatered ADS (30.43% DM)tonnes0.6210.0000.0000.000
Dried ADS (98.02% DM)tonnes0.2730.0000.0000.000
Organic fertilizer (compost)tonnes0.0001.7001.7001.700
Excess electricity from CHPkWh465.234465.234465.234465.234
Excess thermal energy from CHPkWh50.257542.737542.737542.737
Wastewater/evaporationm351.23551.55251.55251.552
Air pollution (from stationary sources without analyzing composting)kg13.52412.91412.91412.914
4 Air pollution from composting (NH3; NMVOC)kg4 0.2420.1210.5380.092
4 Air pollution (from mobile sources)kg0.0070.0830.0910.112
4 GHGs from the combustion of natural gas, dieseltonnes of CO2e0.1690.0990.1000.101
4 GHGs from biogas combustiontonnes of CO2e0.0010.0010.0010.001
4 GHGs from composting BDWtonnes of CO2e0.1750.0740.4460.074
4 GHGs due to electricity from grid (indirect impact)tonnes of CO2e0.0640.0150.0130.013
Waste from air treatment plantkg0.5080.1620.1620.777
Notes: 1 Relative indicators (EIr) were evaluated using Equation (1). 2 Total evaluated annual amount of sludge in WWTP: 9850 tonnes or 1.37 tonnes in DM. 3 Amount of BSA planned to be composted annually after the implementation of alternatives: ≈29,200 tonnes of dewatered ADS, ≈17,500 tonnes of GW, and ≈5800 tonnes of tree and shrub pruning residues. 4 Air emissions and GHGs were evaluated using Methodologies 1–3 and the equations presented in Section 2.2.
Table 6. Results of the economic evaluation of suggested alternatives for 1 sludge management.
Analysis of Key Inputs and OutputsUnitsCurrent SituationAlternative 1Alternative 2Alternative 3
Direct costs of sludge management, incl. salary of employees, all related taxesthousand EUR year−14197.712427.652503.562433.67
EUR tonne−1 of sludge DM216.75125.35129.27125.66
2 Savings through reduced direct process costs (S)thousand EUR year−1-1770.061694.141764.04
Investments:thousand EUR-3008.151128.154269.75
Buildings and designthousand EUR-293.15293.153434.75
Composting equipmentthousand EUR-545.00795.00795.00
Automation (instrumentation, control)thousand EUR-0.0040.0040.00
Equipment (for intensive composting)thousand EUR-2170.00 0.00
3 Payback period (PBP)years-1.700.672.42
Income that reduces direct costs:thousand EUR2676.303524.013524.013524.01
Due to GW (e.g., leaves, grass) management servicethousand EUR0175.45175.45175.45
Due to excess electricity from CHPthousand EUR2588.702588.702588.702588.70
Due to excess thermal energy from CHPthousand EUR87.6087.6087.6087.60
Due to compost production and salethousand EUR0672.26672.26672.26
Direct costs, after taking into account reductions due to incomesEUR tonne−1 of sludge DM78.55−56.61−52.69−56.30
Depreciation and amortization (existing equipment) (company’s data)EUR tonne−1 of sludge DM97.0097.0097.0097.00
4 Depreciation and amortization (new equipment and constructions)EUR tonne−1 of sludge DM0.0020.648.6619.48
Cost price of sludge managementEUR tonne−1 of sludge DM175.5561.0352.9760.18
Notes: 1 Main raw material: sludge—19,366.9 tonnes of DM year−1. 2 Savings (S, EUR per year)—the difference between the direct costs of the existing and the suggested sludge treatment processes (see Section 2.4). 3 Payback period (PBP) was evaluated using Formula (5) (see Section 2.4). 4 For depreciation costs assessment, a period of up to 15 years was assumed for constructions, up to 8 years for composting equipment, up to 5 years for machinery (shredder, screen, and compost turner), and up to 5 years for automation equipment (for the measurement of temperature and moisture of the compost, with the remote transmission of readings).
Publisher’s Note: MDPI stays neutral with regard to jurisdictional claims in published maps and institutional affiliations.

