
Current Assessment of Water Quality and Biota Characteristics of the Pelagic Ecosystem of the Atlantic Sector of Antarctica: The Multidisciplinary Studies by the Institute of Biology of the Southern Seas
 , , ,
, , ,  , , , ,
Abstract
:1. Introduction
2. Materials and Methods
2.1. Trace Elements
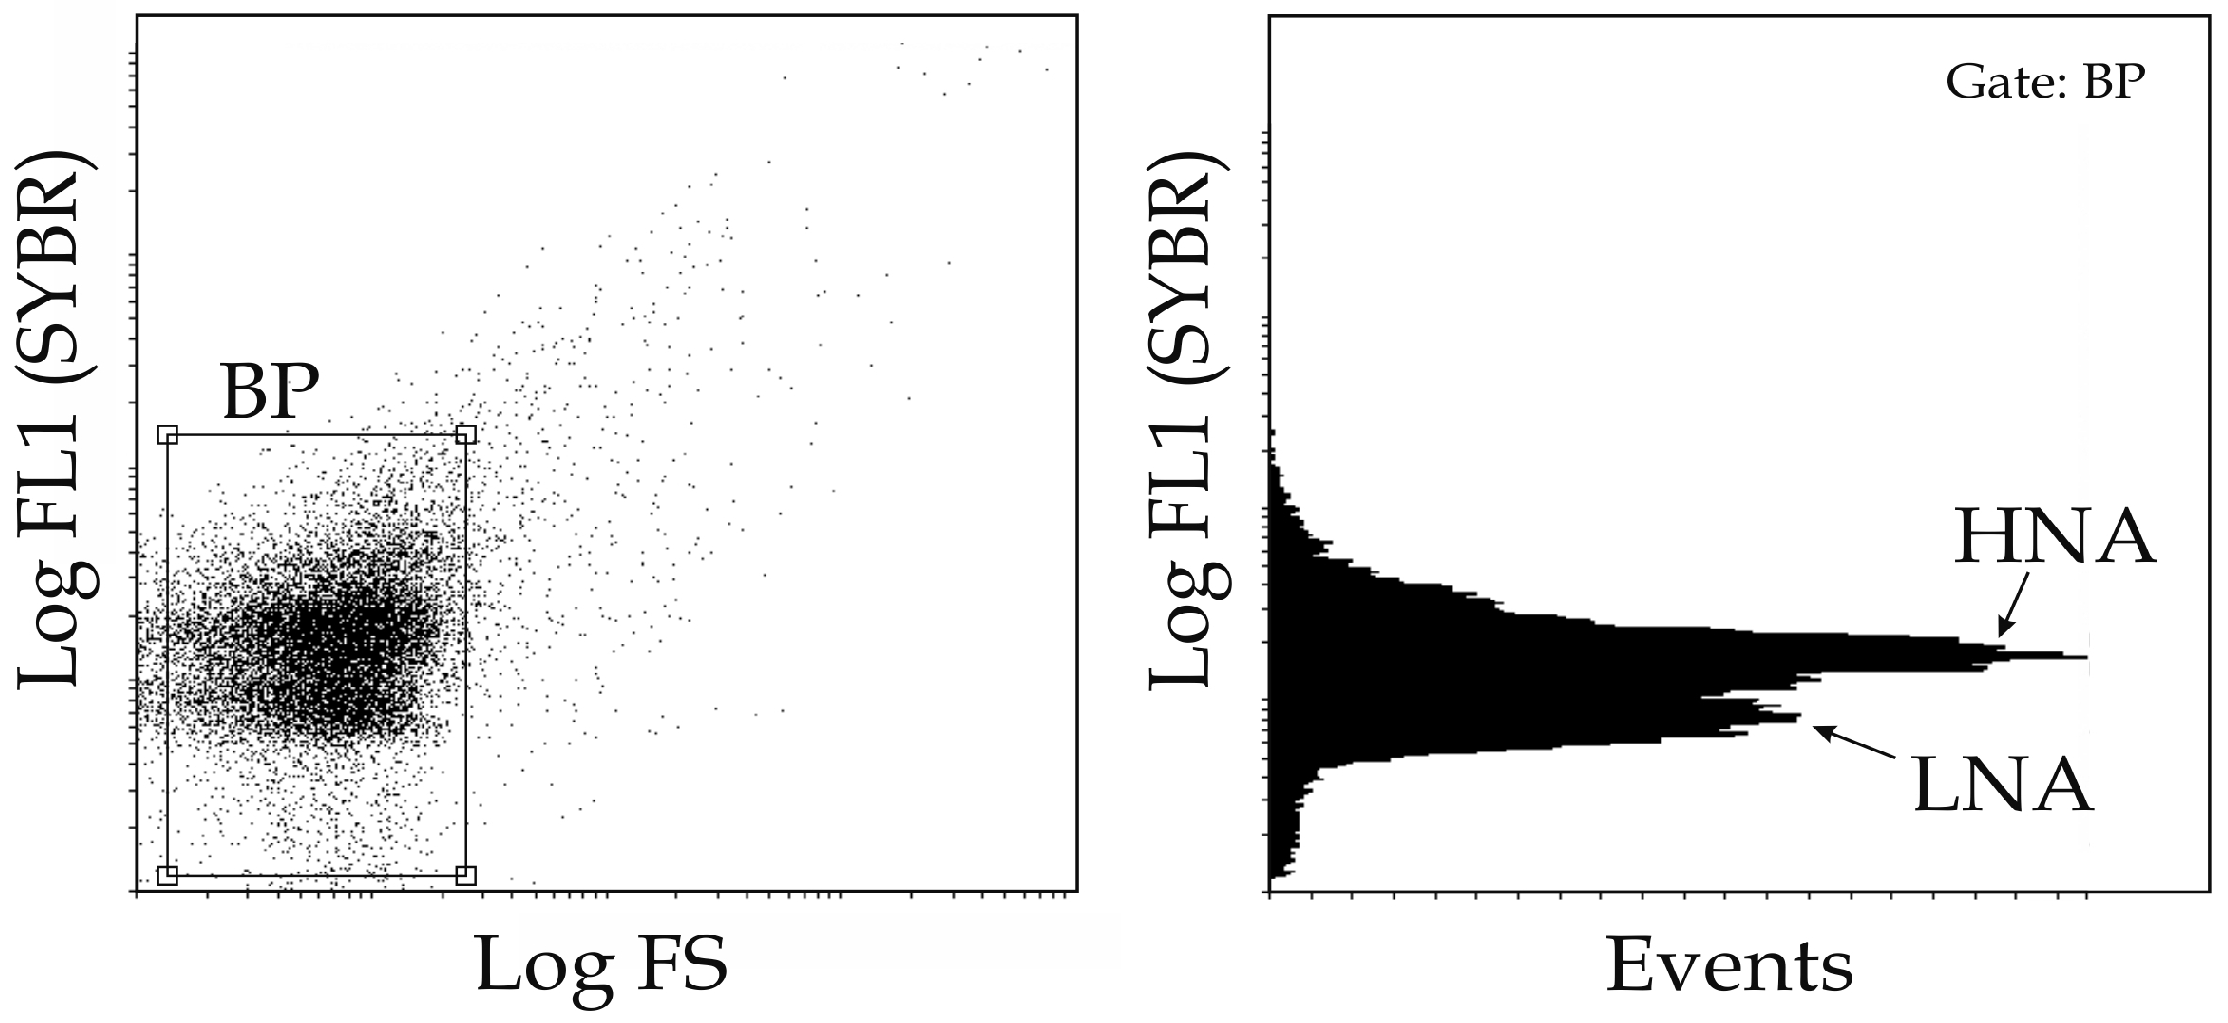
2.2. Bacterioplankton
2.3. Spectral Bio-Optical Properties and Productive Characteristics of Phytoplankton
2.4. Bioluminescence
2.5. Antarctic Plankton
2.6. Parasitological Studies of Antarctic Fish
3. Results
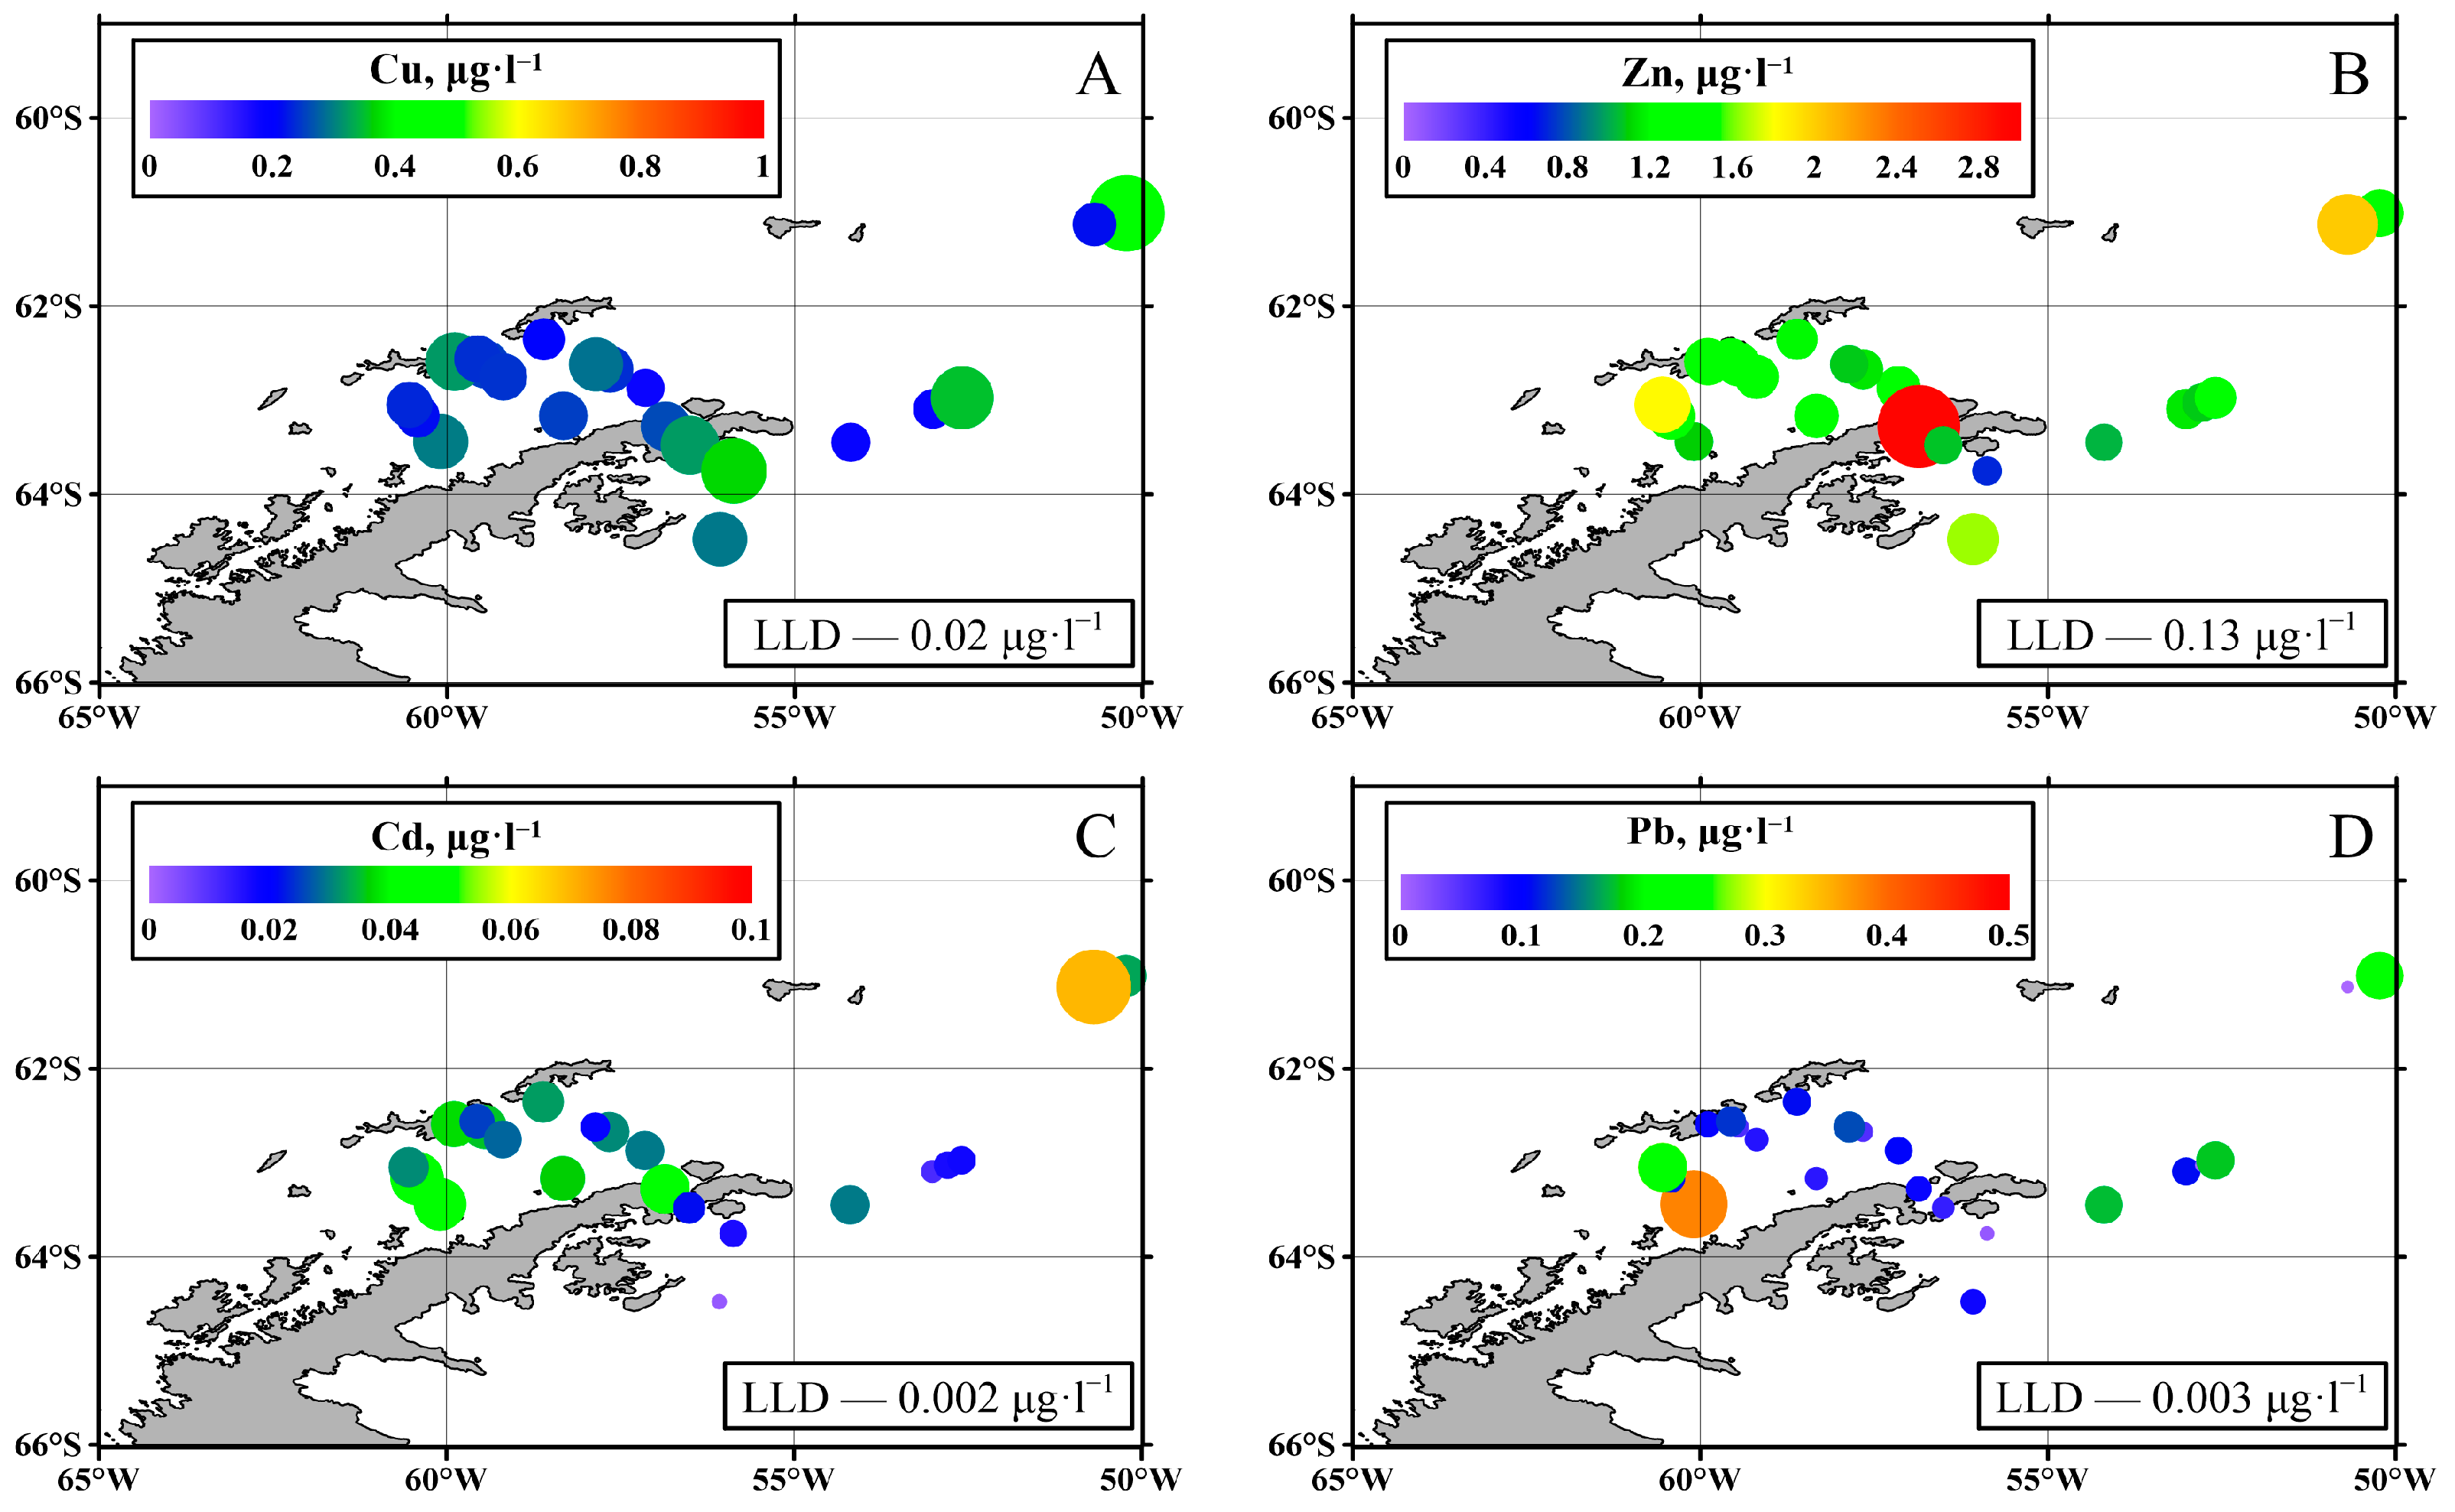
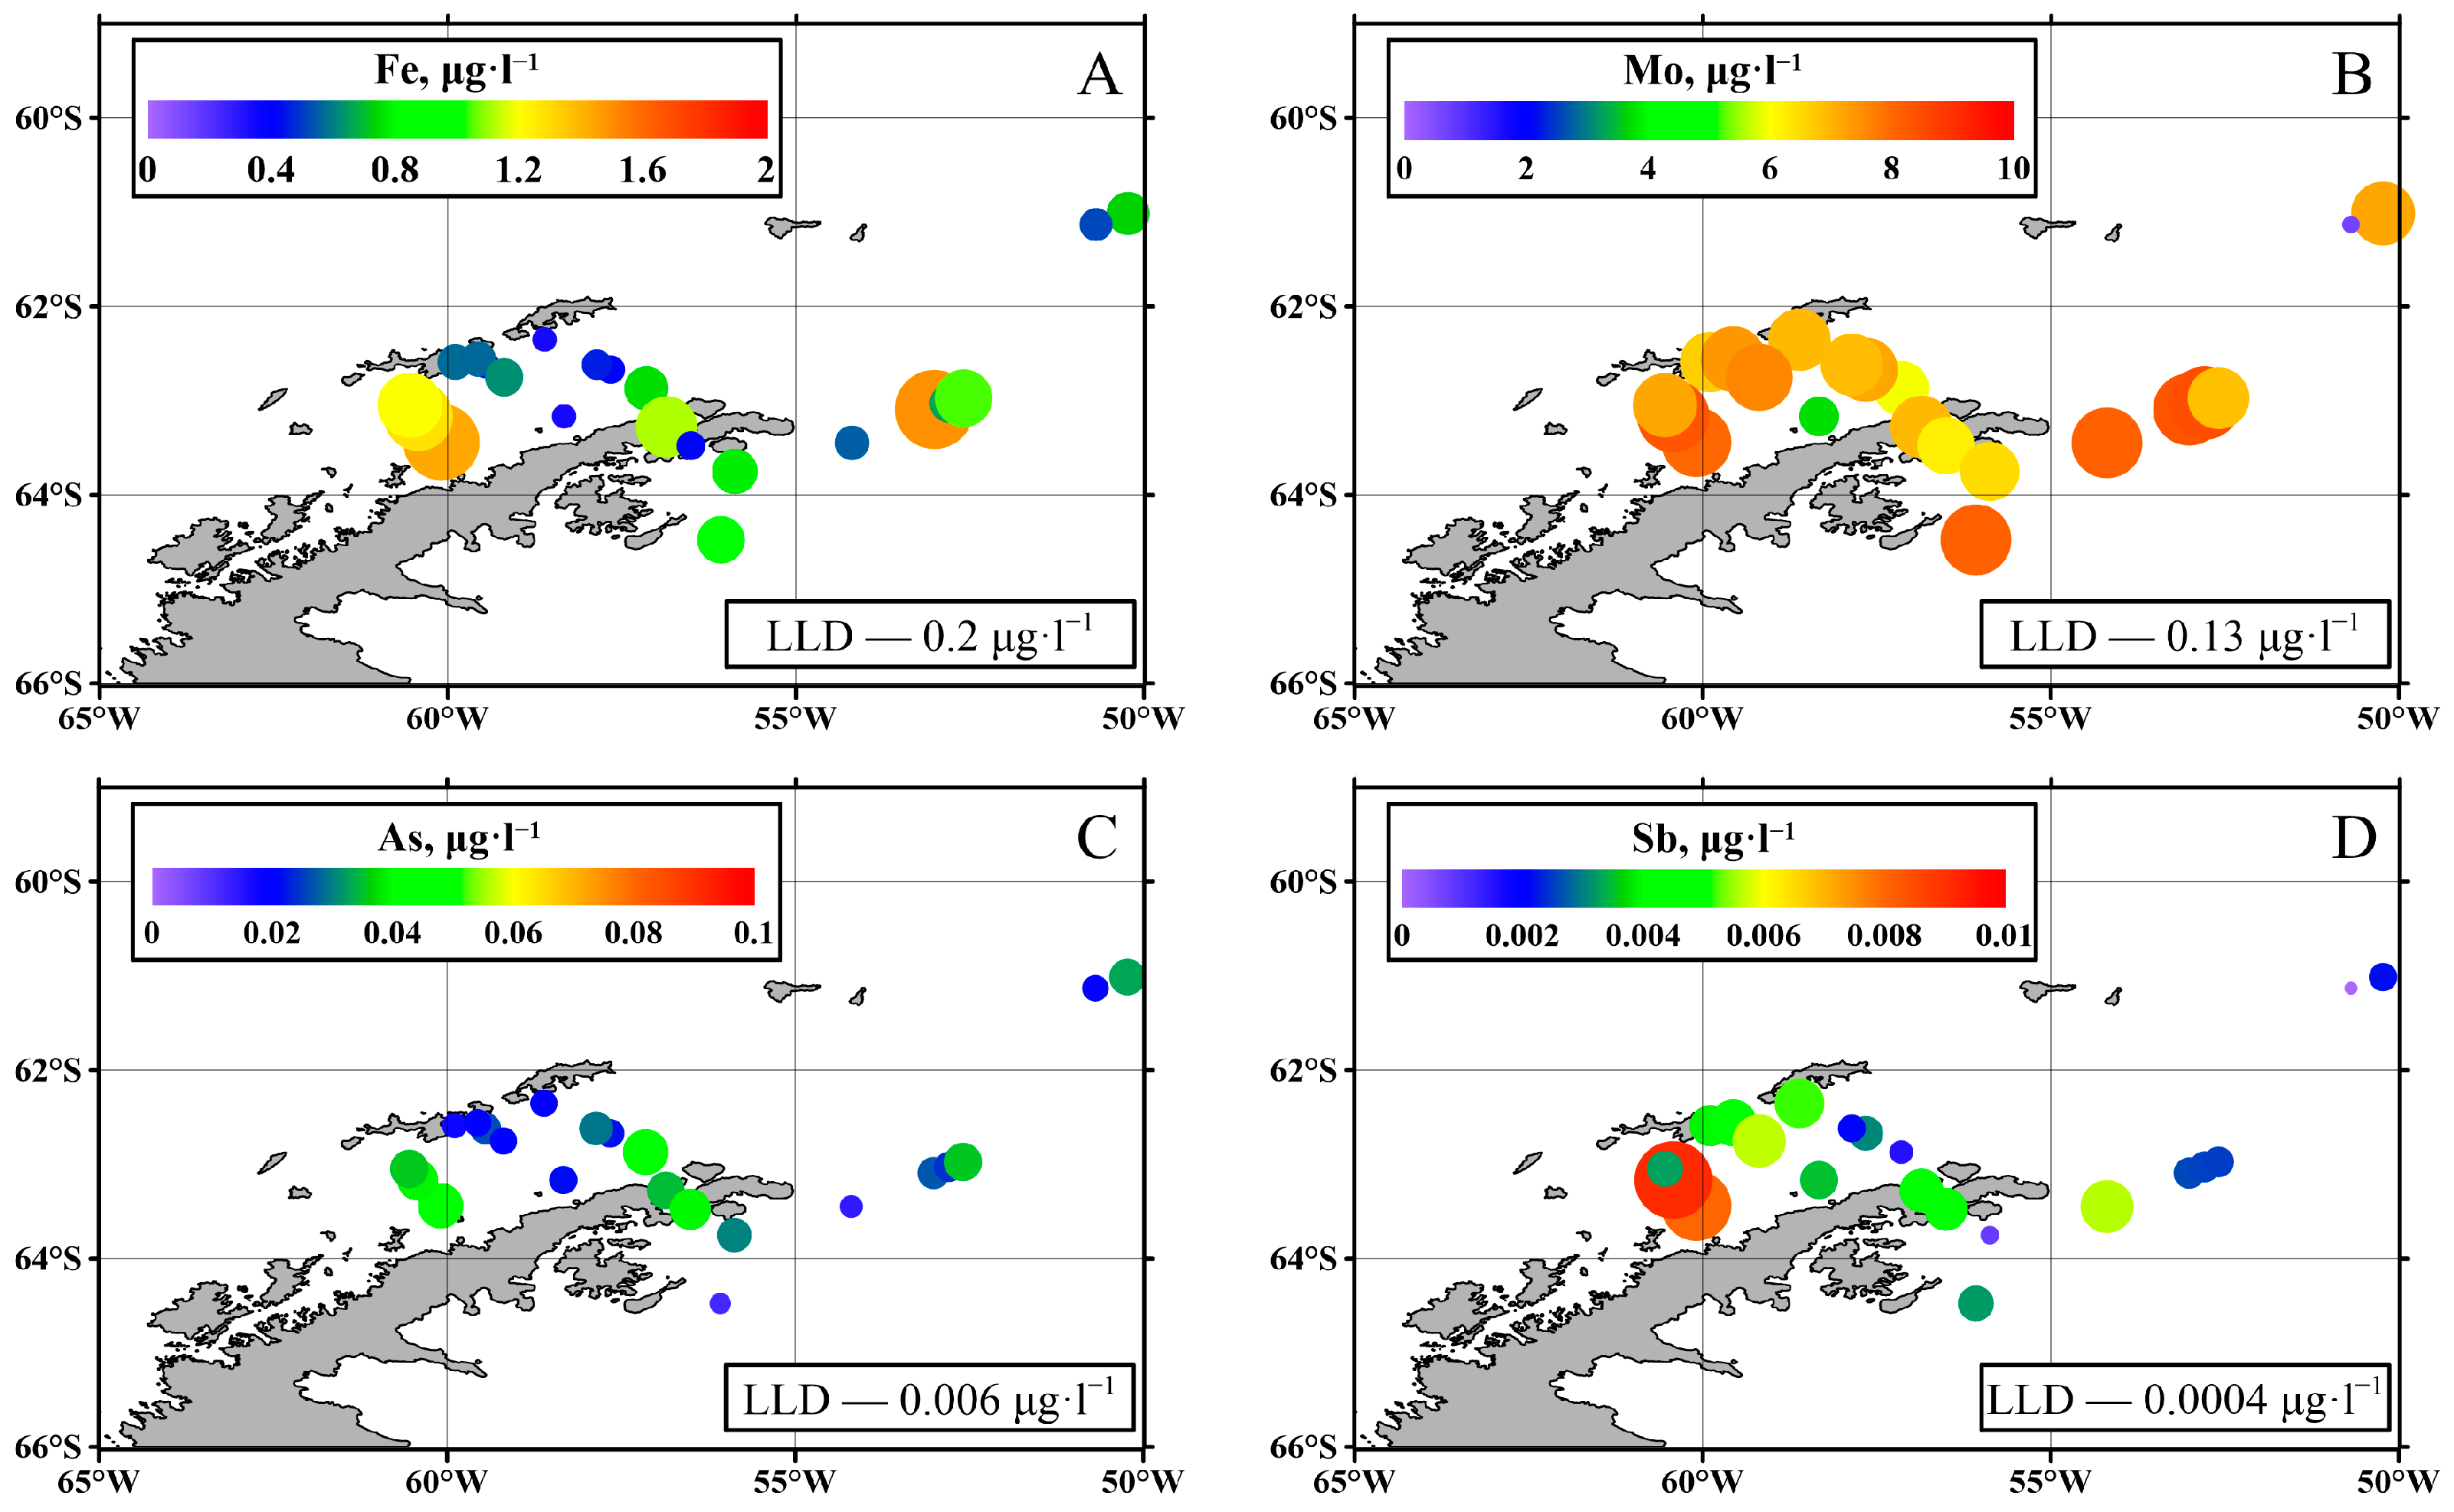
3.1. Trace Elements
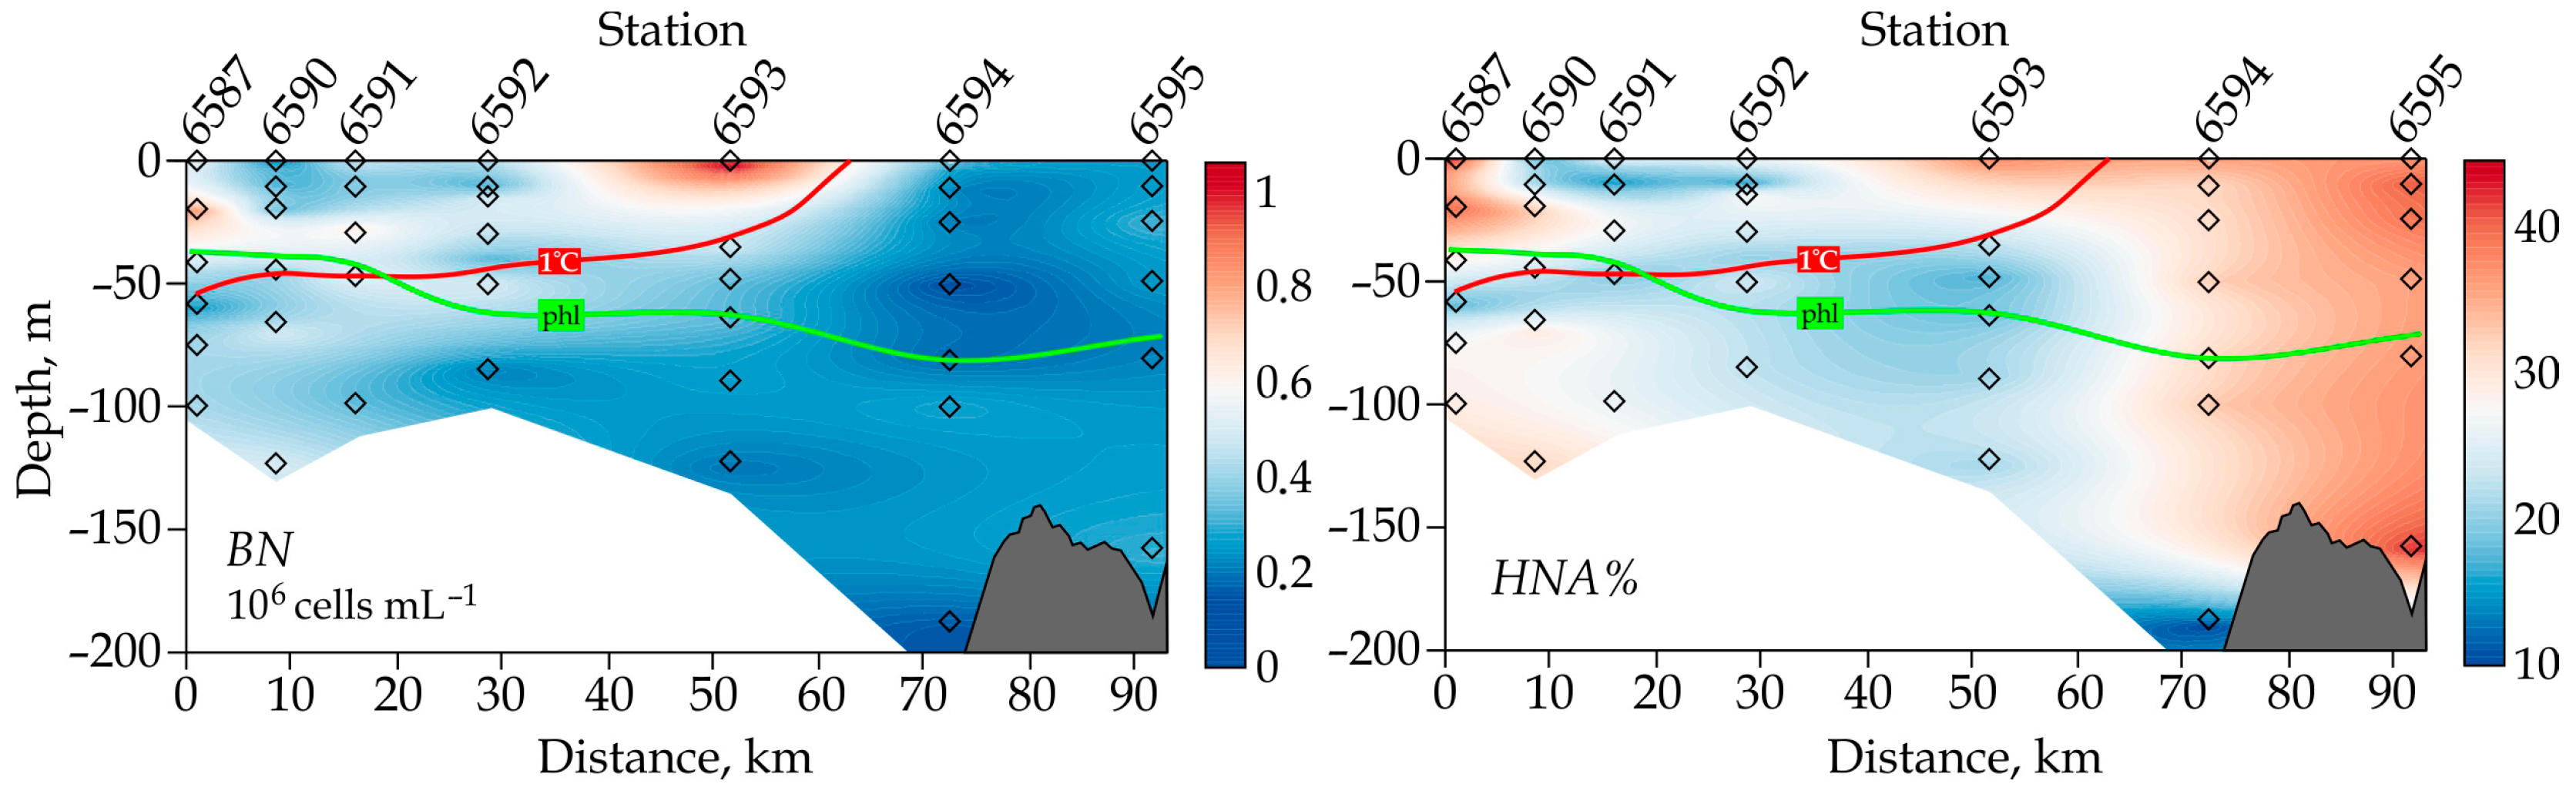
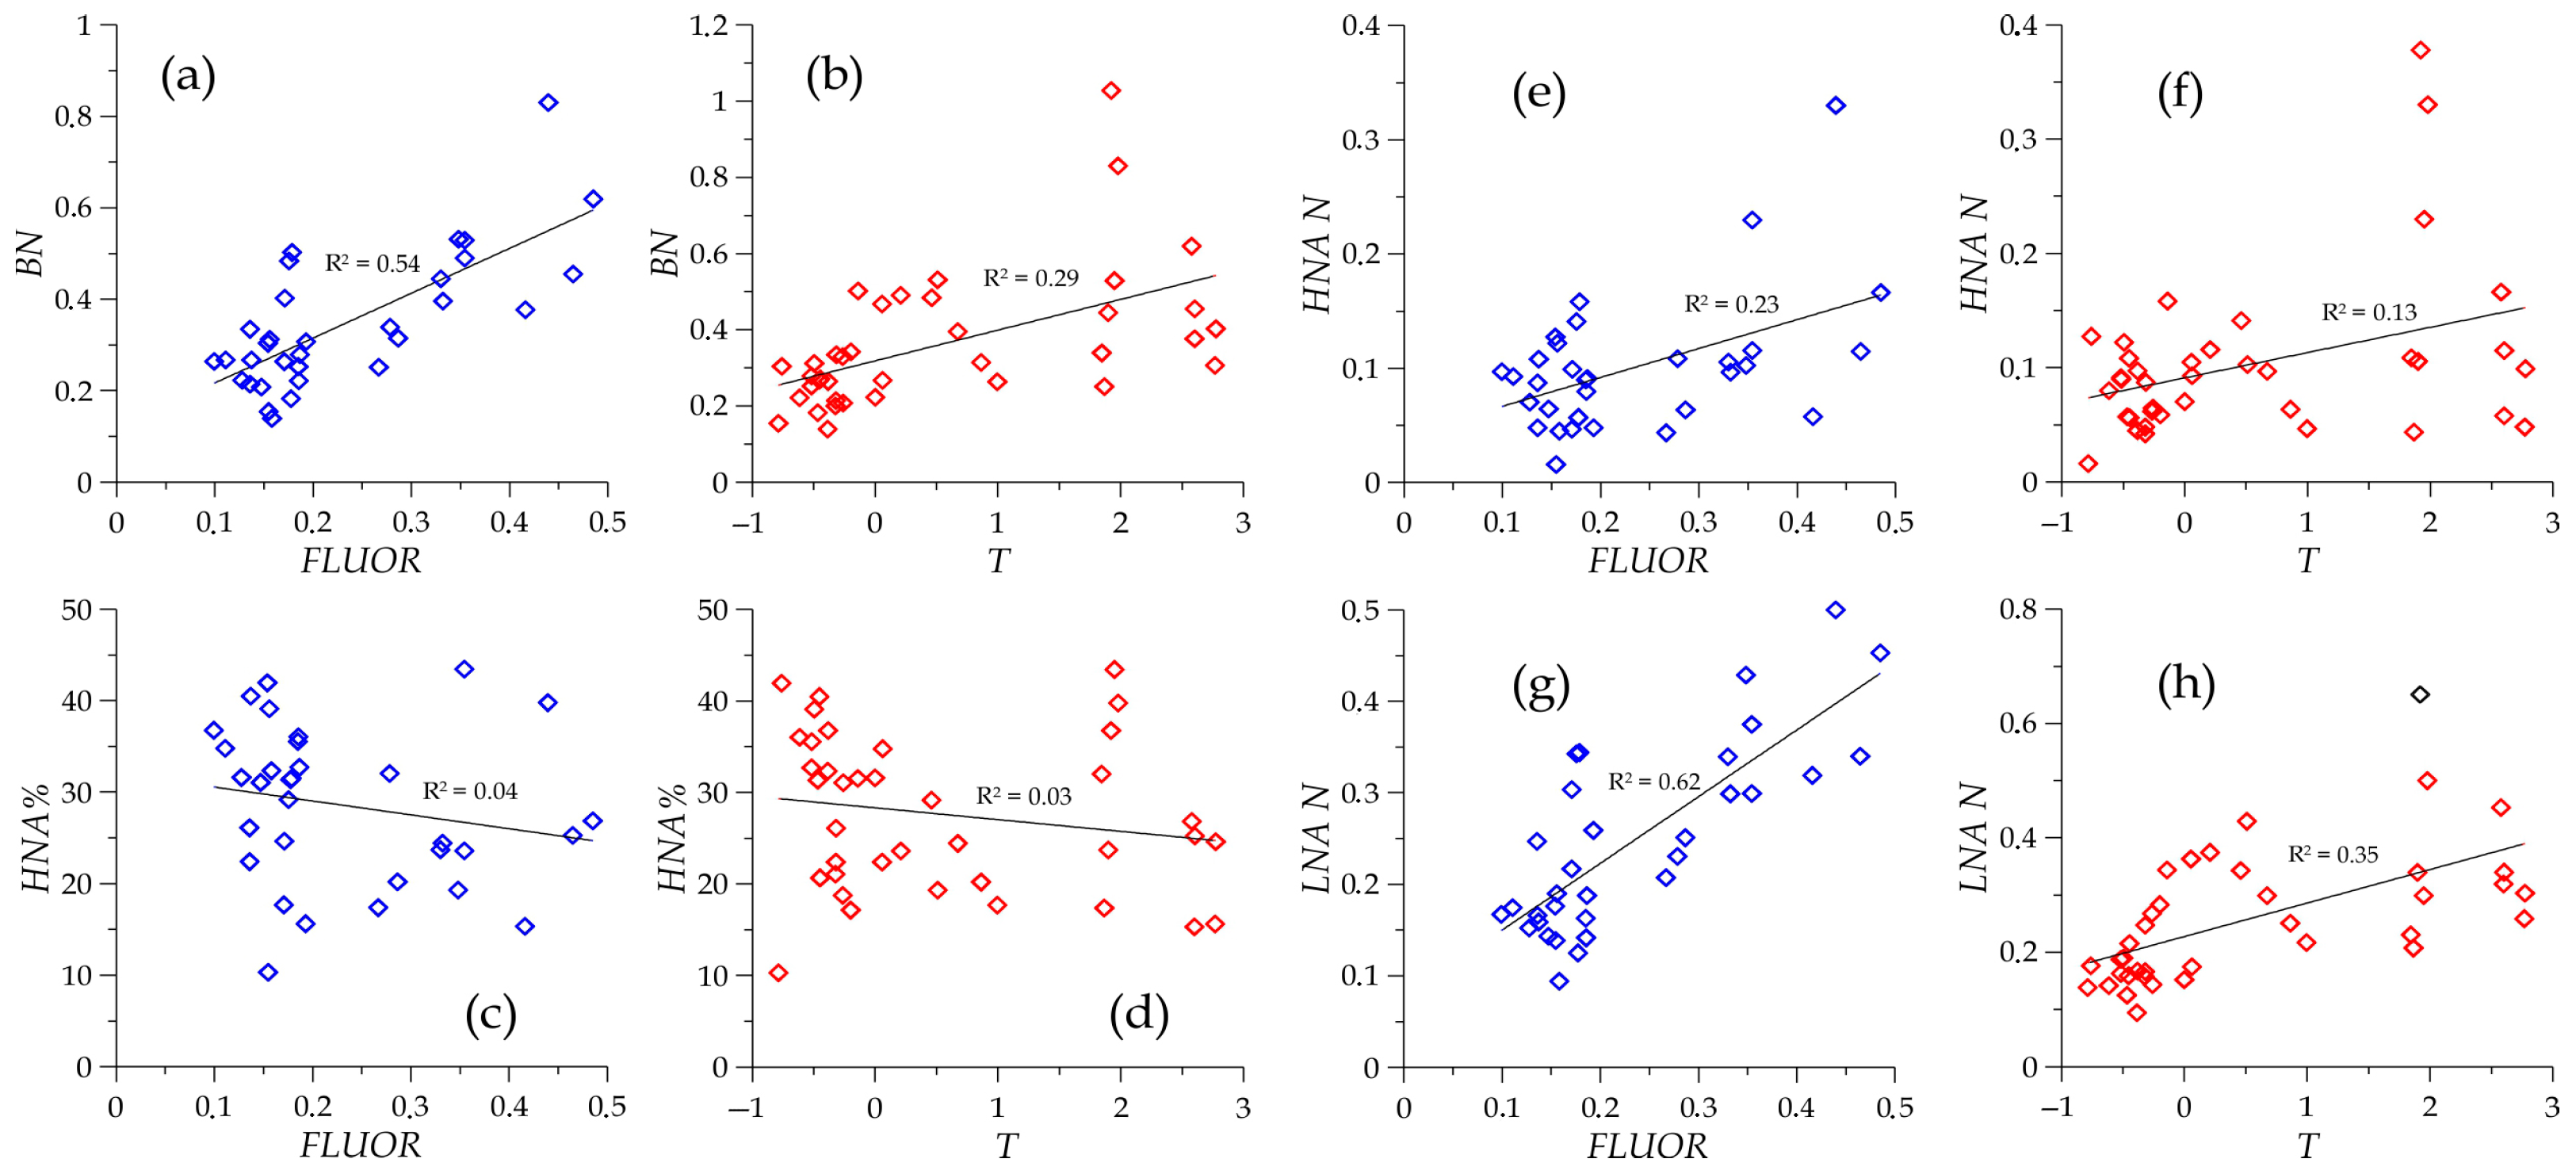
3.2. Bacterioplankton–Phytoplankton Coupling and Bacterial Physiological Activity
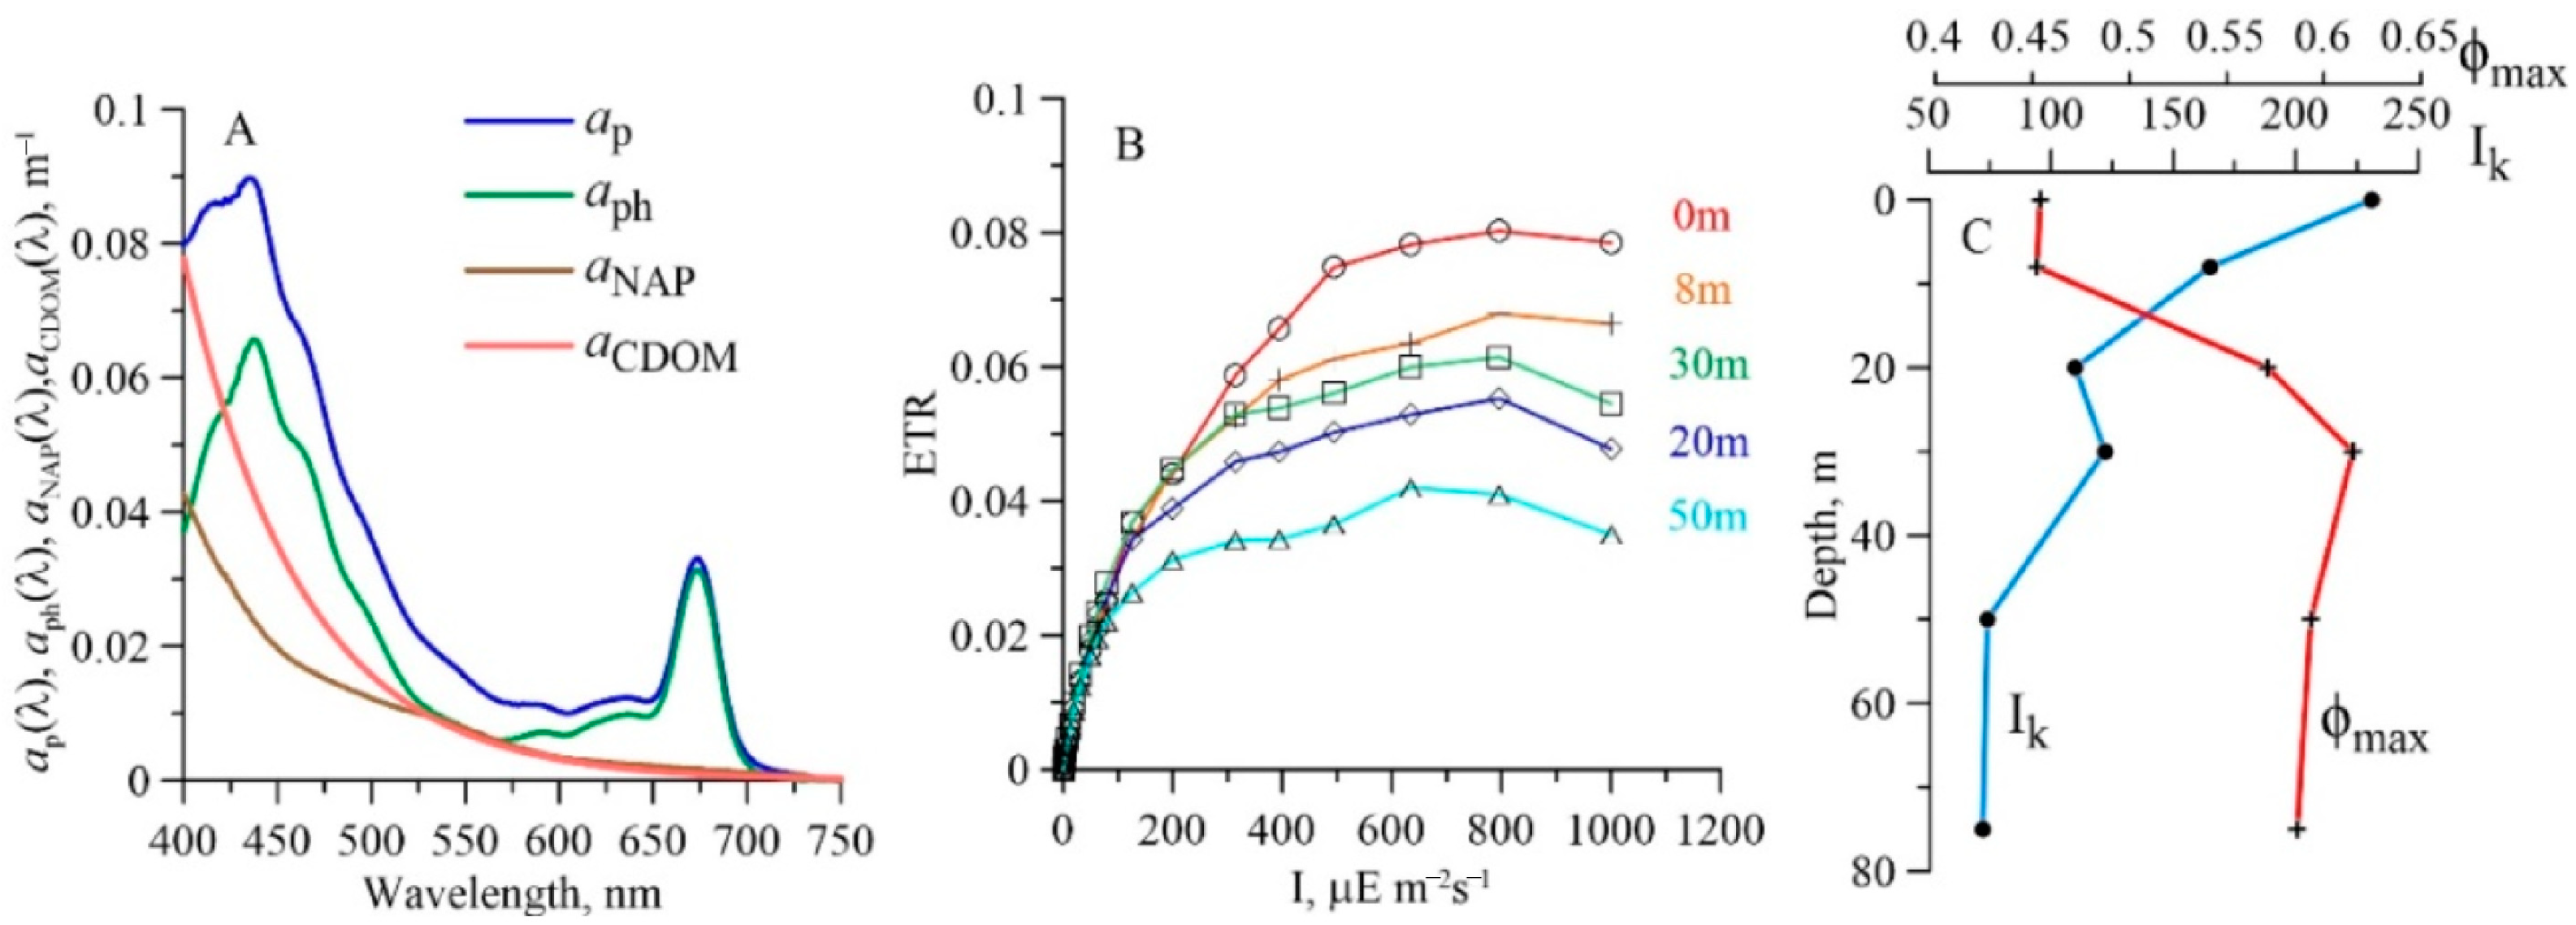
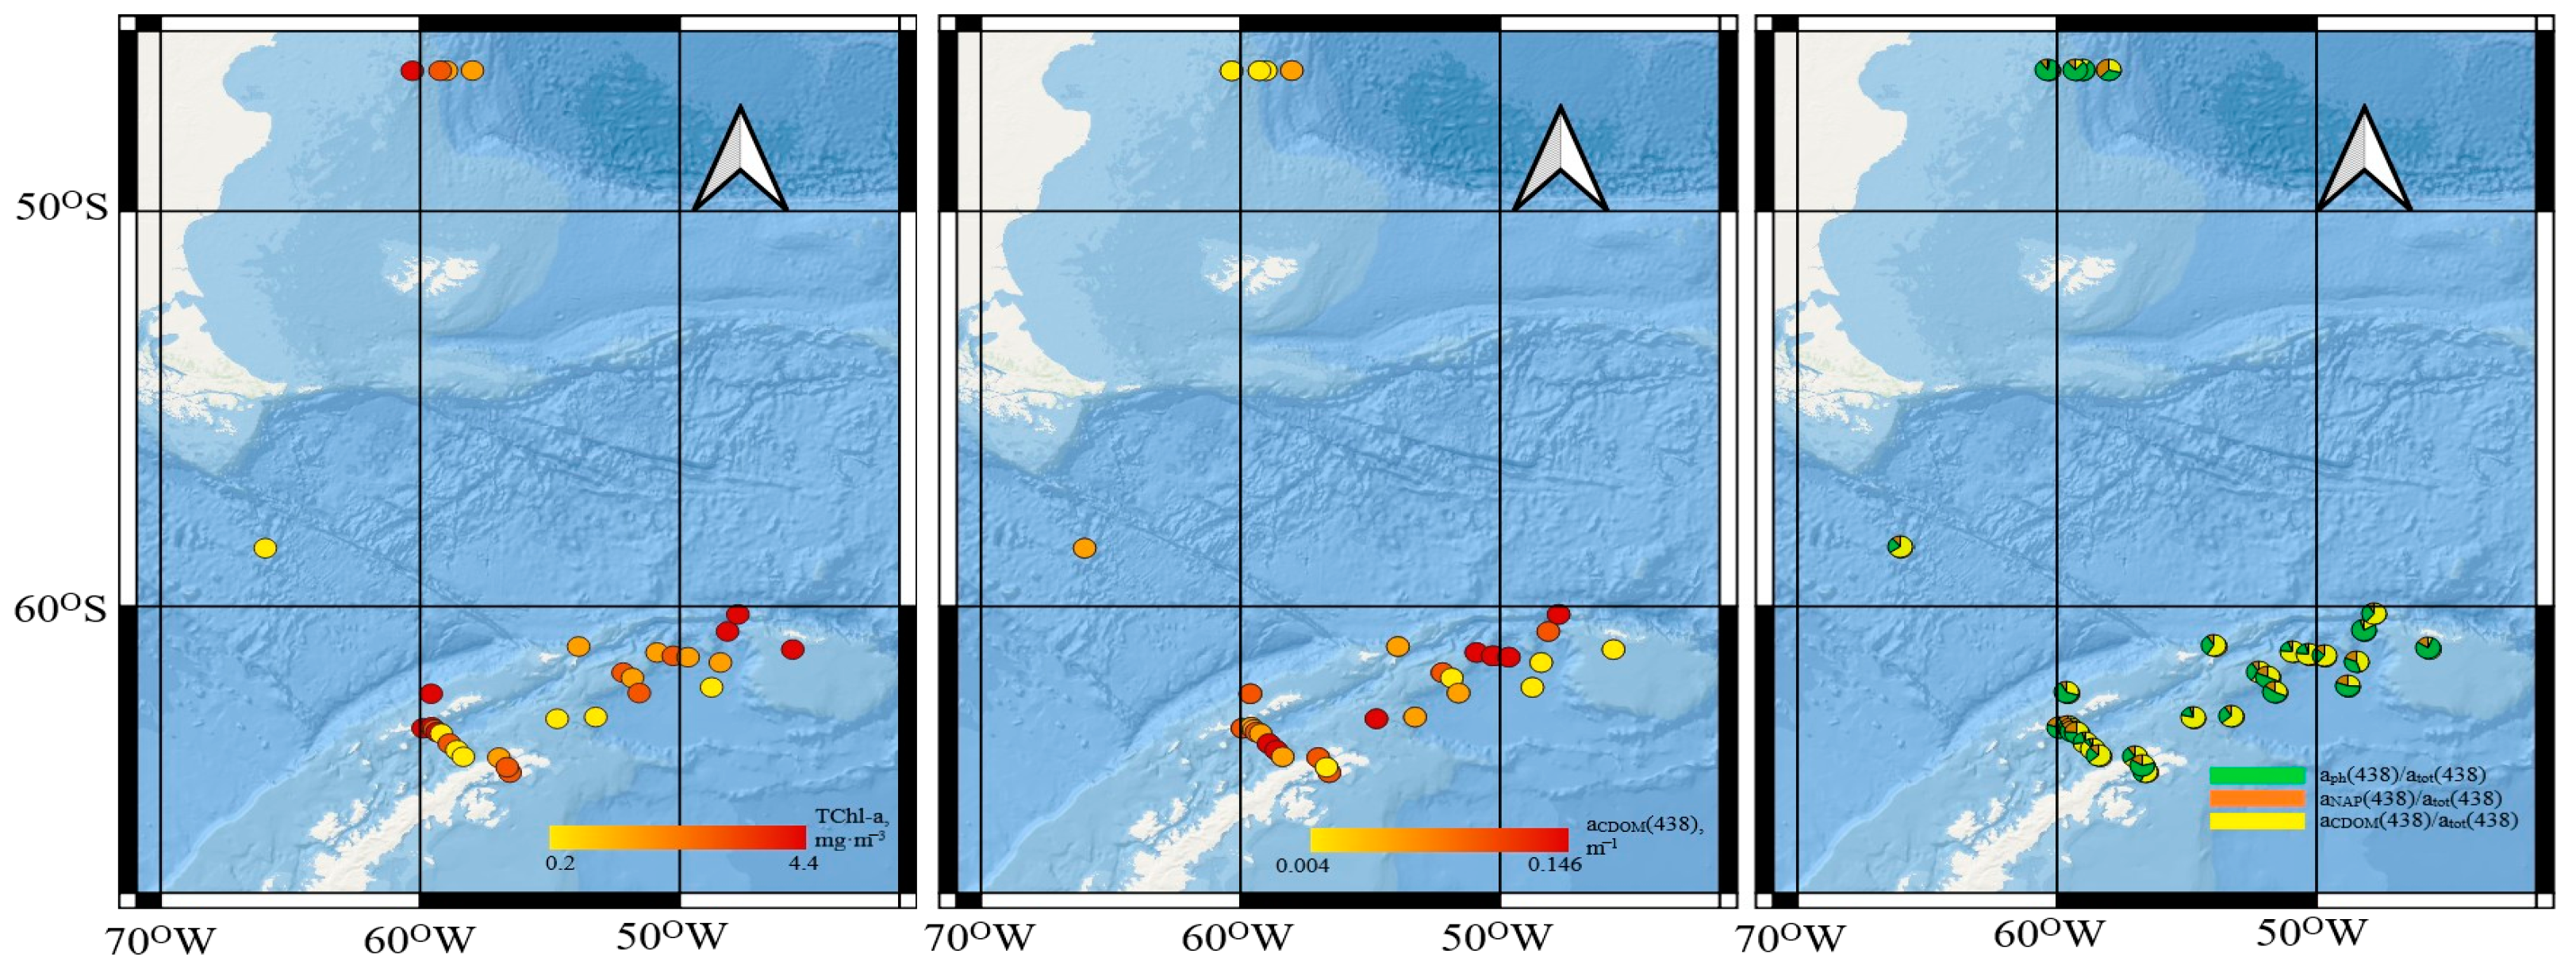
3.3. Spectral Bio-Optical Properties and Phytoplankton Productive Characteristics
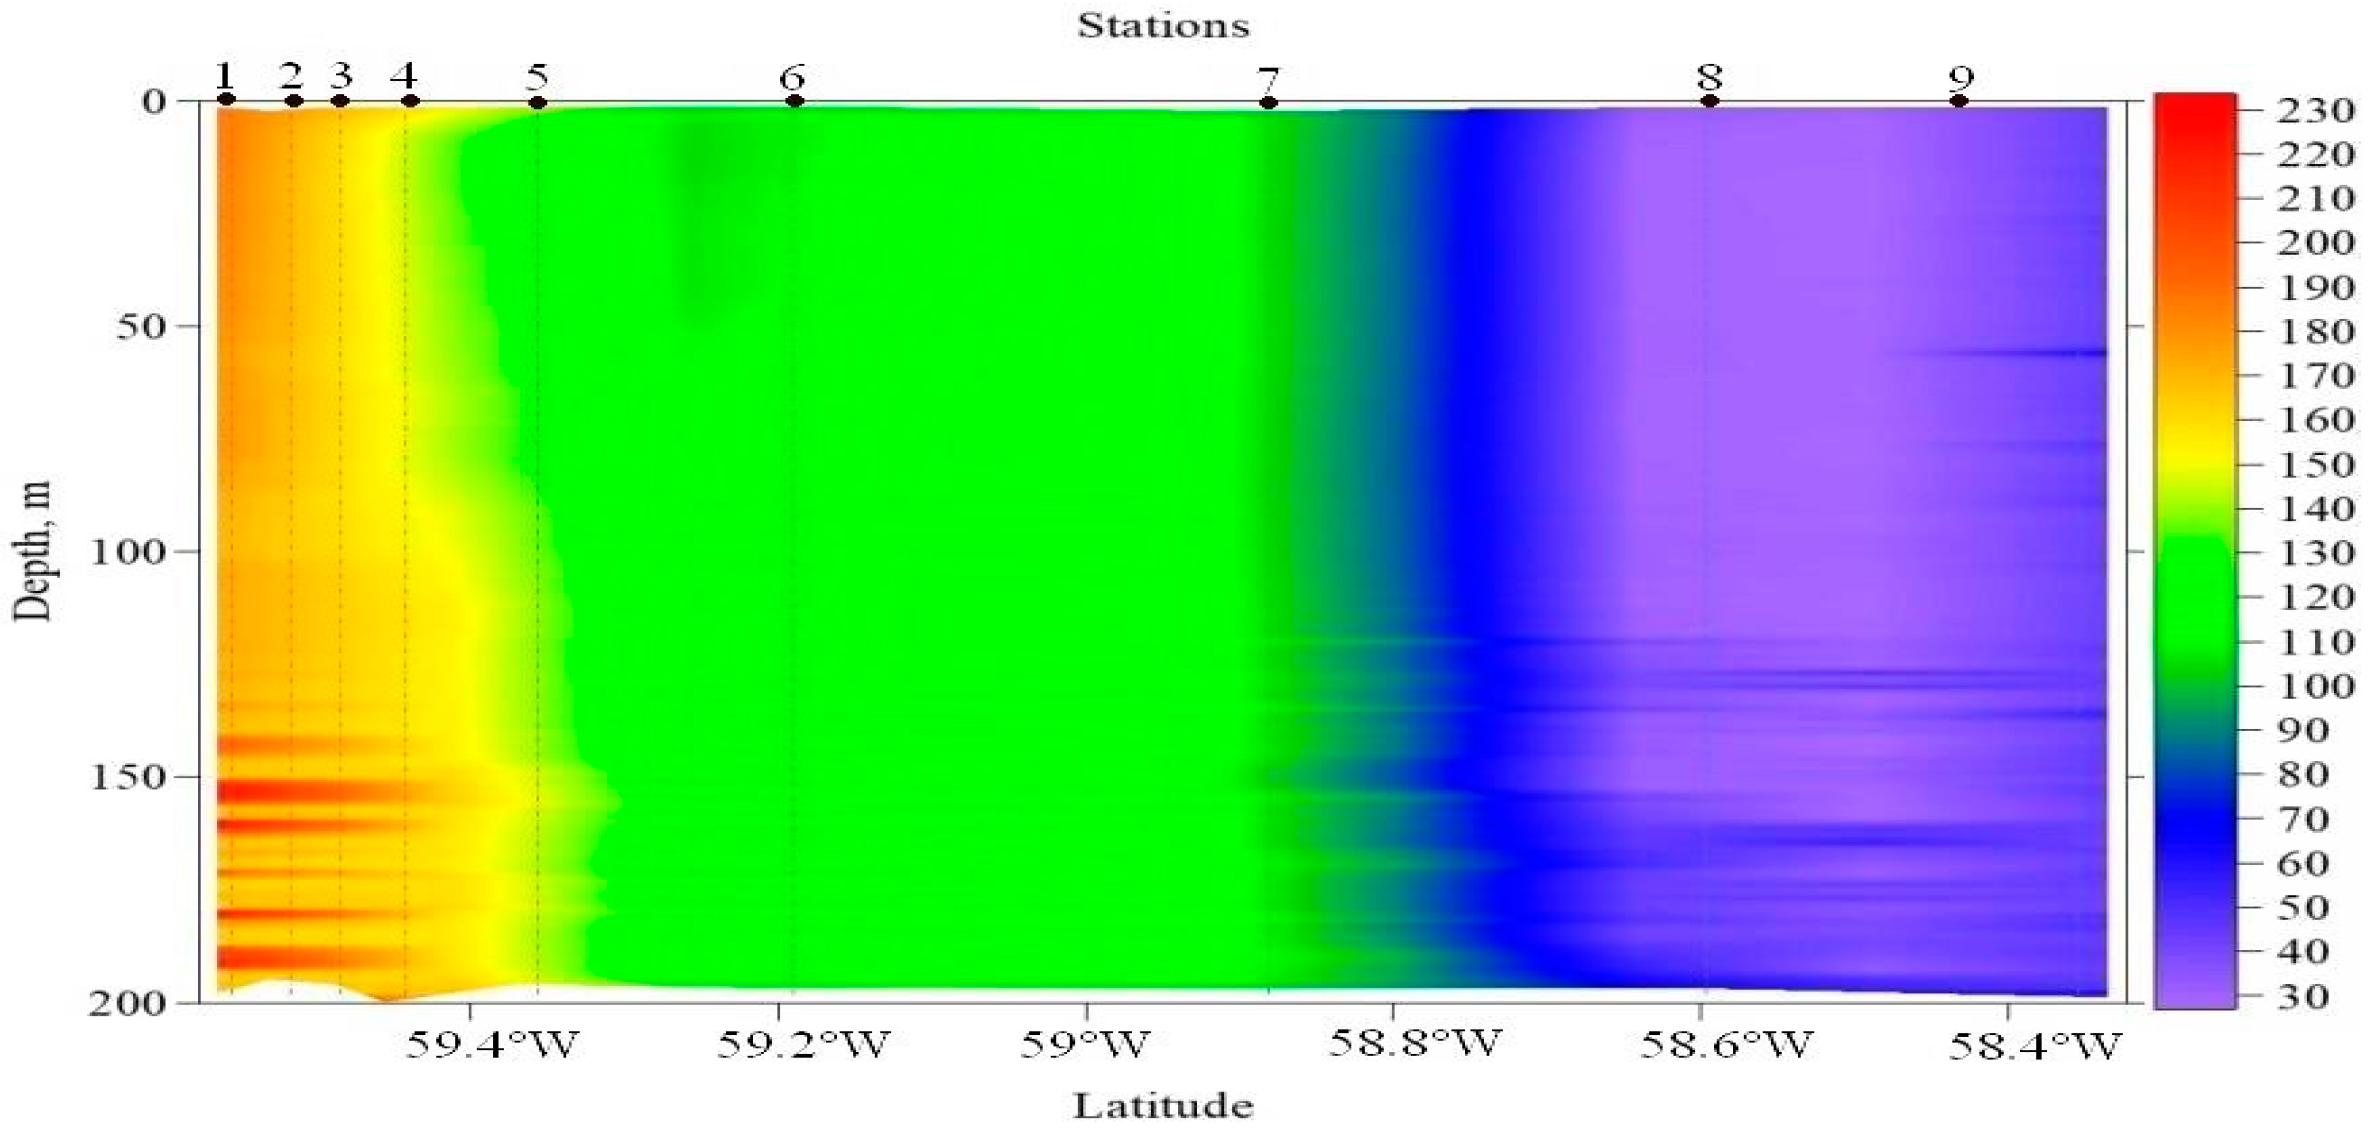
3.4. Bioluminescence
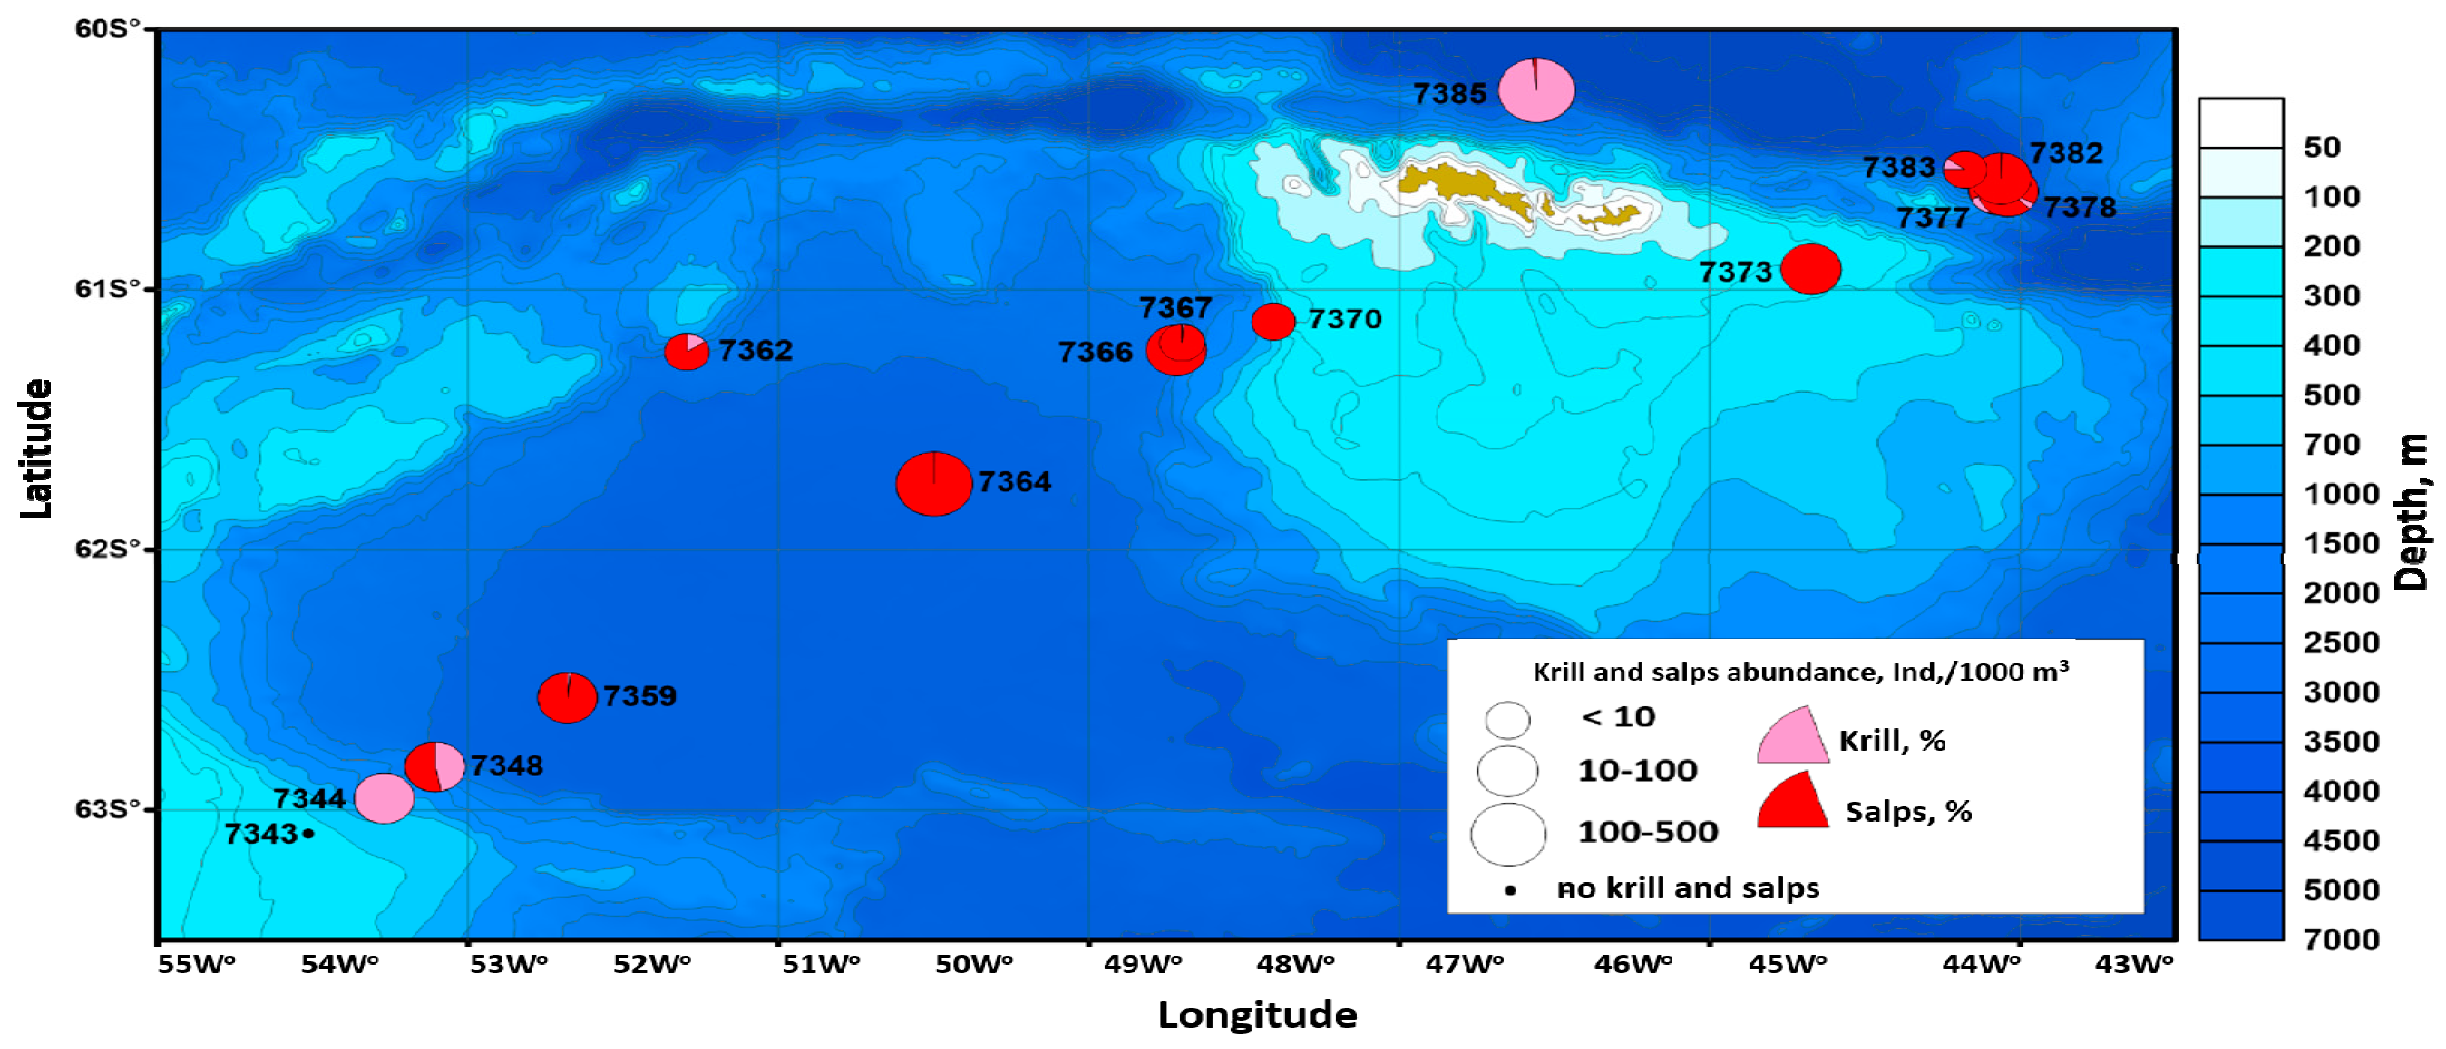
3.5. Antarctic Krill
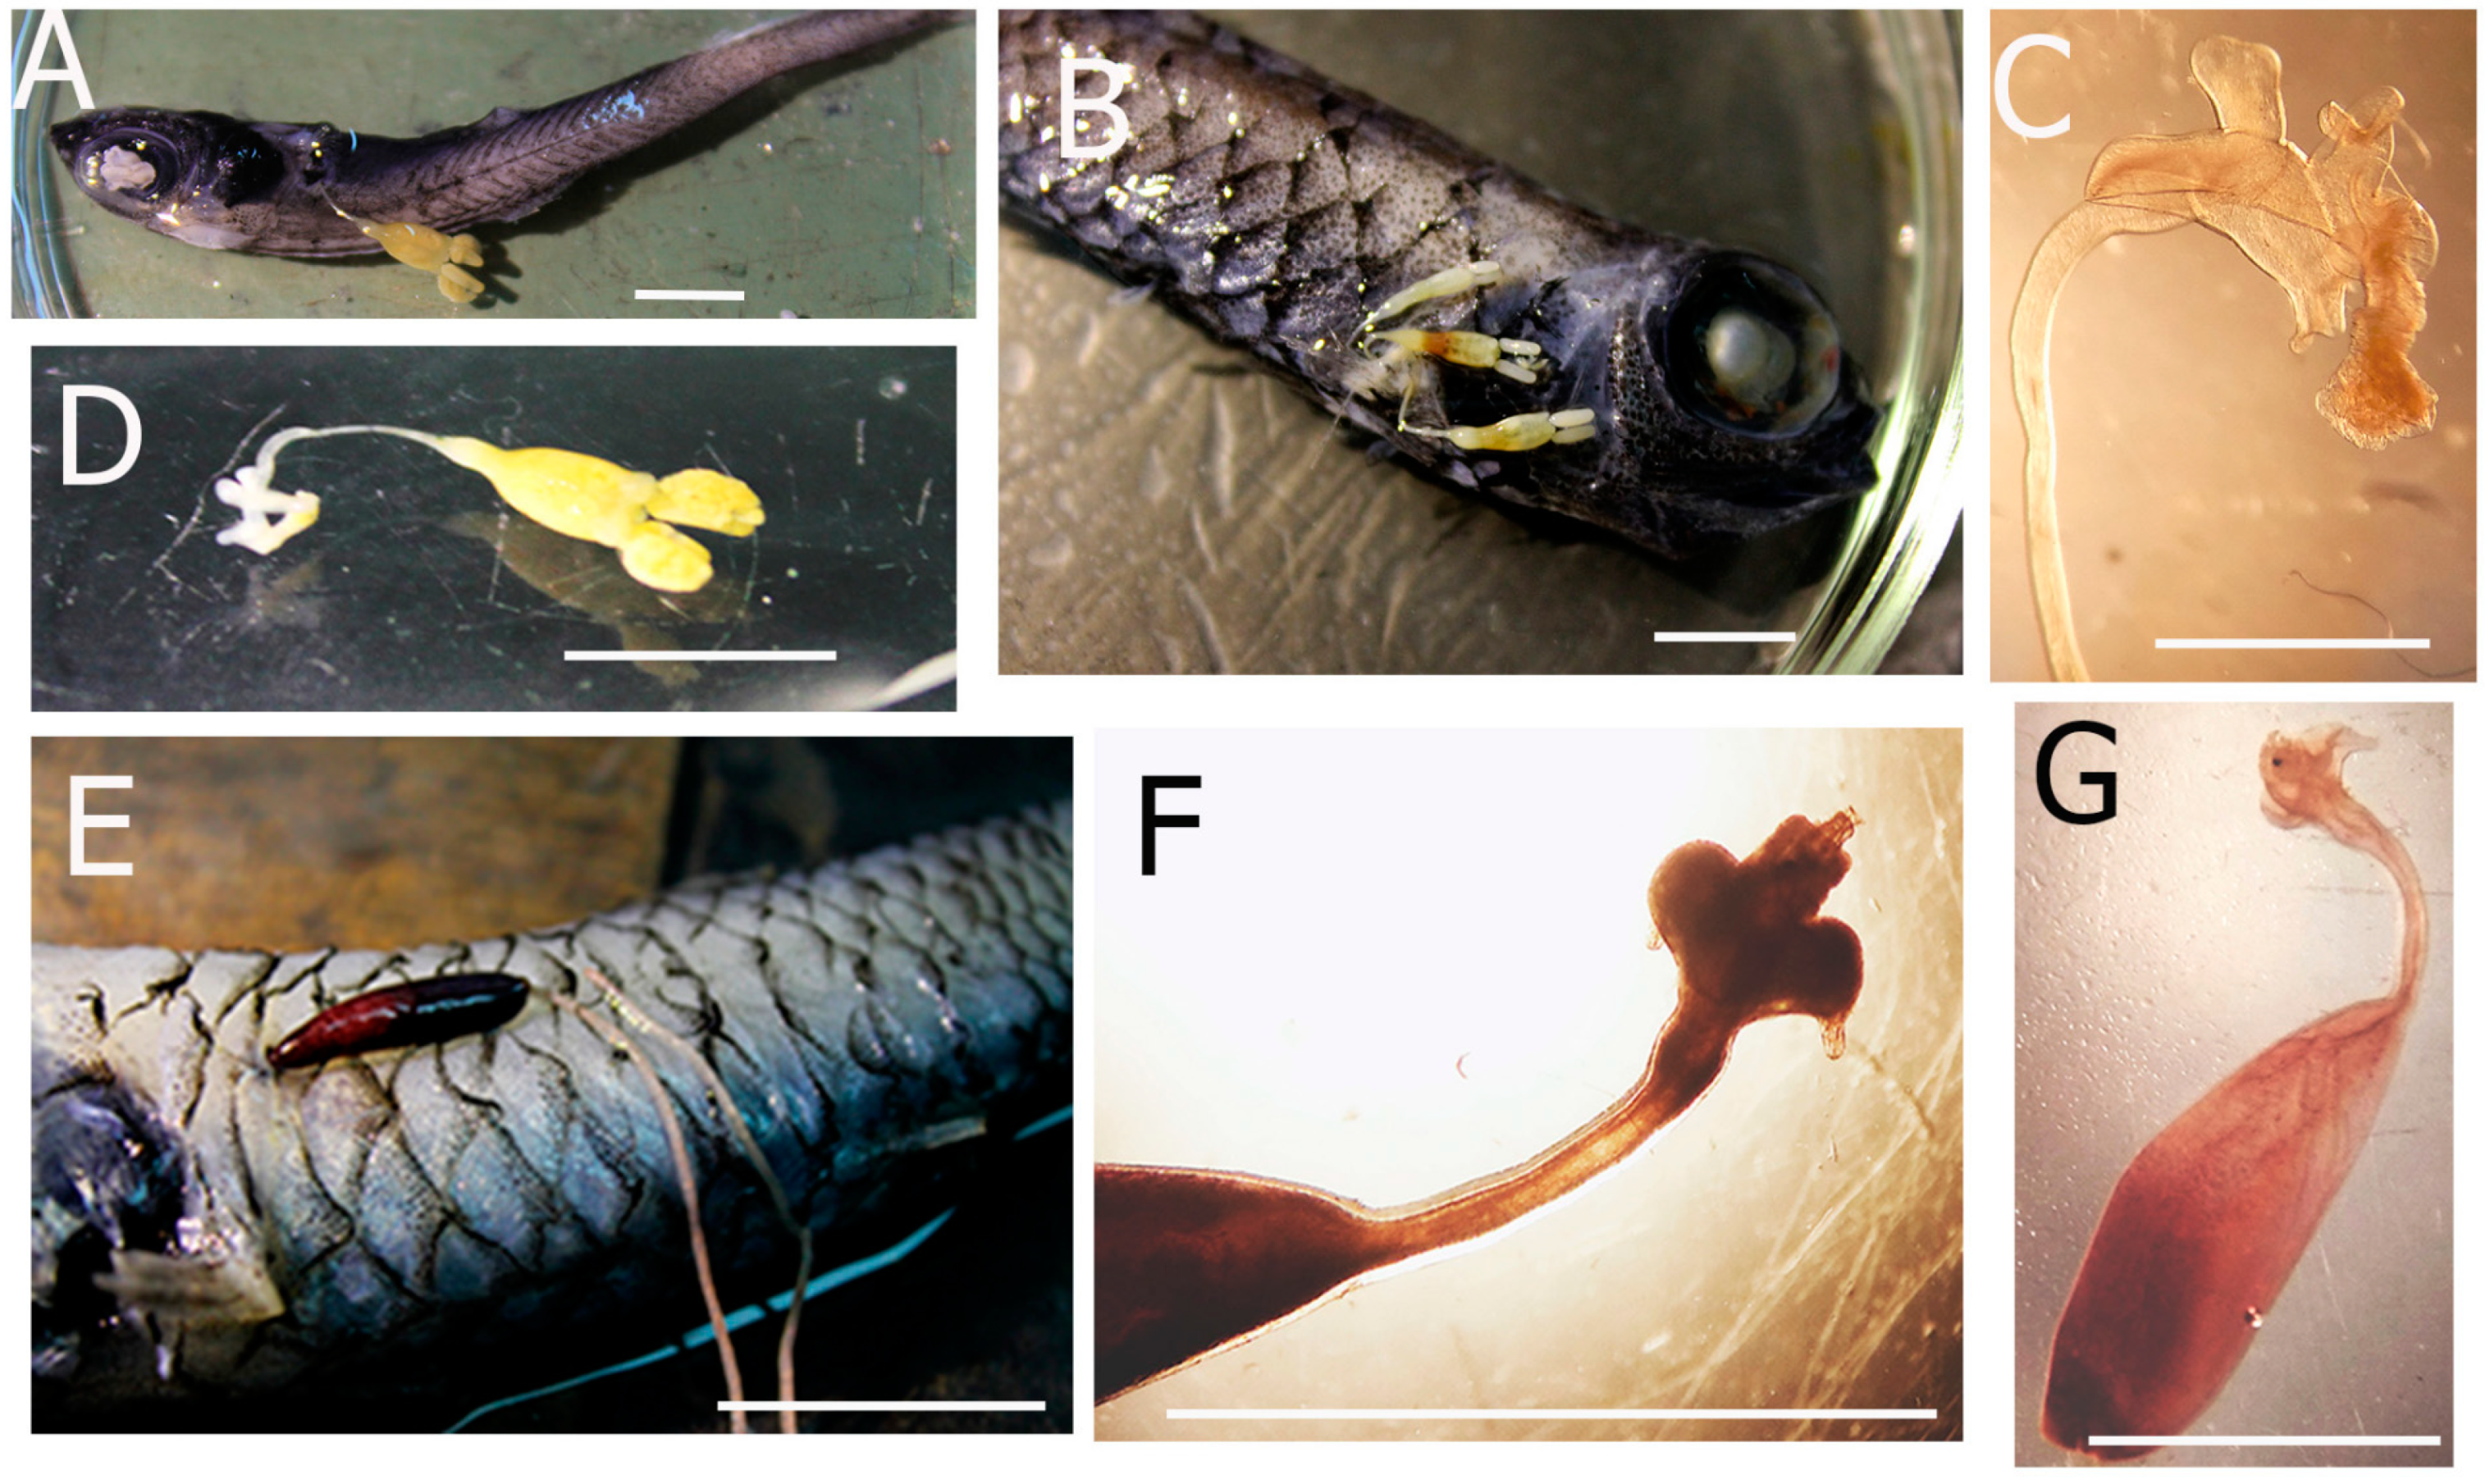
3.6. Parasitological Research
4. Discussion
4.1. Trace Elements
4.2. Bacterioplankton–Phytoplankton Coupling and Bacterial Physiological Activity
4.3. Spectral Bio-Optical Properties and Phytoplankton Productive Characteristics
4.4. Study of Bioluminescence
4.5. Antarctic Krill and Salpa Thompsoni
4.6. Parasitological Research
5. Conclusions
Author Contributions
Funding
Informed Consent Statement
Data Availability Statement
Acknowledgments
Conflicts of Interest
References
- Laws, R.M. Ecology of the Southern Ocean. Am. J. Sci. 1985, 73, 26–40. [Google Scholar]
- Samyshev, E.Z. Antarctic Krill and the Structure of Planktonic Community in Its Distribution Area, 2nd ed.; Nauka: Moscow, Russia, 1991; pp. 1–168. (In Russian) [Google Scholar]
- Samyshev, E.Z. The structure and functioning of Antarctic marine coastal ecosystems in the conditions of natural and anthropogenic contaminations. Mar. Ekol. J. 2011, 10, 3–25. [Google Scholar]
- Everson, I. Role of Krill in Marine Food Webs, the Southern Ocean. In Krill: Biology, Ecology and Fisheries; Everson, I., Ed.; Fisheries and Aquatic Resources, Series 6; Blackwell Science: Oxford, UK; pp. 194–201.
- Bykov, V.P.; Bykova, V.M.; Krivosheina, L.L.; Golovkova, G.N.; Shust, K.V.; Shevtsov, V.V.; Kartintsev, A.V.; Ezhova, E.A. Antarctic Krill: Manual; Bykova, V.M., Ed.; Russian Federal Research Institute for Fisheries and Oceanography (VNIRO): Moscow, Russia, 2001; pp. 1–207. (In Russian) [Google Scholar]
- Atkinson, A.; Siegel, V.; Pakhomov, E.A.; Jessopp, M.J.; Loeb, V. A reappraisal of the total biomass and annual production of Antarctic krill. Deep. Sea Res. Part I Oceanogr. Res. Pap. 2009, 56, 727–740. [Google Scholar] [CrossRef]
- Siege, V. Biology and Ecology of Antarctic Krill; Advances in Polar Ecology Book Series; Springer International Publishing: Cham, Switzerland, 2016; Volume 1, pp. 1–441. [Google Scholar] [CrossRef] [Green Version]
- Milhalev, Y. Whales of the Southern Ocean. Biology, Whaling and Perspectives of Population Recovery; Advances in Polar Ecology Book Series; Book 5; Springer: Cham, Switzerland, 2019; pp. 1–408. [Google Scholar]
- Commission for the Conservation of Antarctic Marine Living Resources (CCAMLR). Available online: https://www.ccamlr.org/ (accessed on 11 August 2021).
- Antarctic Treaty. International Treaty of 1 December 1959 (with an Additional Protocol of 4 October 1991). Available online: http://docs.cntd.ru/document/1901494 (accessed on 11 August 2021). (In Russian).
- Samyshev, E.Z.; Bibik, V.A.; Savich, M.S.; Grishin, A.N.; Okanev, O.A.; Alekseenko, V.R. On the issue of the state of the Antarctic krill population and the pelagic ecosystem in the area of the Scotia Sea. Bull. Ukr. Antarct. Cent. 1997, 1, 132–136. [Google Scholar]
- Duhamel, G.; Hulley, P.-A.; Causse, R.; Koubbi, P.; Vacchi, M.; Pruvost, P.; Vigetta, S.; Irisson, J.-O.; Mormede, S.; Belchier, M.; et al. Chapter 7: Biogeographic patterns of fish. In Biogeographic Atlas of the Southern Ocean; de Broyer, C., Koubbi, P., Raymond, B., d’Udekemd’Acoz, C., van de Putte, A., Griffiths, H.I., David, B., Grant, S., Gutt, J., Held, C., et al., Eds.; Scientific Committee on Antarctic Research: Cambridge, UK, 2014; pp. 328–362. [Google Scholar]
- Kennicutt, M.C.; Chown, S.L.; Cassano, J.J.; Liggett, D.; Peck, L.S.; Massom, R.; Rintoul, S.R.; Storey, J.; Vaughan, D.G.; Wilson, T.J.; et al. A roadmap for Antarctic and Southern Ocean science for the next two decades and beyond. Antarct. Sci. 2015, 27, 3–18. [Google Scholar] [CrossRef] [Green Version]
- Parker, E.; Jones, C.D.; Arana, P.M.; Alegría, N.A.; Sarralde, R.; Gallardo, F.; Phillips, A.J.; Williams, B.W.; Dornburg, A. Infestation dynamics between parasitic Antarctic fish leeches (Piscicolidae) and their crocodile icefish hosts (Channichthyidae). Polar Biol. 2020, 43, 665–677. [Google Scholar] [CrossRef]
- Florindo, F.; Siegert, M.; De Santis, L.; Naish, T.R. Chapter 1: Antarctic climate evolution. In Antarctic Climate Evolution, 2nd ed.; Florindo, F., Siegert, M., De Santis, L., Naish, T.R., Eds.; Elsevier: Amsterdam, The Netherlands, 2022; pp. 1–7. [Google Scholar] [CrossRef]
- Samyshev, E.Z.; Minkina, N.I. Coastal Ecosystem Contamination by Heavy Metals as an Indicator of Climate Change in Antarctica. J. Comput. Theor. Nanosci. 2019, 16, 228–236. [Google Scholar] [CrossRef]
- Morozov, E.G.; Spiridonov, V.A.; Molodtsova, T.N.; Frey, D.I.; Demidova, T.A.; Flint, M.V. Research of the ecosystem of the Atlantic sector of the Antarctic (79th cruise of the research vessel “Akademik Mstislav Keldysh”). Oceanology 2020, 60, 823–825. [Google Scholar] [CrossRef]
- Morozov, E.G. Brief results of the Antarctic expedition 2021–2022—87th cruise of RV “Akademik Mstislav Keldysh”. Oceanol. Res. 2022, 50, 126–128. [Google Scholar] [CrossRef]
- Strategy of Scientific and Technological Development of the Russian Federation. Decree of the President of the Russian Federation No. 642 of 1 December 2016, as Amended and Supplemented on 15 March 2021. Available online: https://www.sudact.ru/law/ukaz-prezidenta-rf-ot-1122016-n-642/ (accessed on 4 November 2022).
- Strategy for the Development of Maritime Activities of the Russian Federation until 2030. Decree of the Government of the Russian Federation of 30 August 2019, No. 1930-r. Available online: https://www.zakonrf.info/rasporiazhenie-pravitelstvo-rf-1930-r-30082019/ (accessed on 4 November 2022).
- Morozov, E.G.; Frey, D.I.; Krechik, V.A.; Polukhin, A.A.; Sapozhnikov, P.V. Water Masses, Currents, and Phytoplankton in the Bransfield Strait in January 2020. In Antarctic Peninsula Region of the Southern Ocean; Morozov, E.G., Flint, M.V., Spiridonov, V.A., Eds.; Advances in Polar Ecology Book Series; Springer: Berlin/Heidelberg, Germany, 2021; Volume 6, pp. 55–64. [Google Scholar] [CrossRef]
- Mirzoeva, N.Y.; Tereshchenko, N.N.; Paraskiv, A.A.; Proskurnin, V.Y.; Morozov, E.G. Heavy metals in surface water of the Atlantic sector of the Antarctic during the 79th cruise of the research vessel “AkademikMstislavKeldysh”. Mar. Biol. J. 2020, 5, 56–68. [Google Scholar] [CrossRef]
- Paraskiv, A.A.; Mirzoeva, N.Y.; Tereshchenko, N.N.; Proskurnin, V.Y.; Sidorov, I.G.; Arkhipova, S.I.; Morozov, E.G. Heavy metals and anthropogenic radionuclides in the region of the Antarctic Peninsula. In Antarctic Peninsula Region of the Southern Ocean; Morozov, E.G., Flint, M.V., Spiridonov, V.A., Eds.; Advances in Polar Ecology Book Series; Springer: Berlin/Heidelberg, Germany, 2021; Volume 6, pp. 433–455. [Google Scholar] [CrossRef]
- Guide to the Chemical Analysis of Sea Waters: Guide Document RD 52.10.243-92; Gidrometeoizdat: Saint Petersburg, Russia, 1993; 264p, Available online: https://meganorm.ru/Data2/1/4293815/4293815261.pdf (accessed on 14 September 2020). (In Russian)
- GOST R 56219-2014; Water. Determination of 62 Elements by Inductively Coupled Plasma Mass Spectrometry (ICP-MS) Method: Data Vvedeniya01.01.2016. Standartinform, Moscow, Russia, 2015. 36p. Available online: https://docs.cntd.ru/document/120011543 (accessed on 5 November 2022). (In Russian).
- Analytik Jena AG. Inductively Coupled Plasma Mass Spectrometers (IPS-MS): PlasmaQuant MS and PlasmaQuant MS Elite. User Manual; Edition 12/2014; Analytik Jena AG: Überlingen, Germany, 2014; 143p. (In Russian) [Google Scholar]
- Gasol, J.M.; Del Giorgio, P.A. Using flow cytometry for counting natural planktonic bacteria and understanding the structure of planktonic bacterial communities. Sci. Mar. 2000, 64, 197–224. [Google Scholar] [CrossRef] [Green Version]
- Servais, P.; Casamayor, E.O.; Courties, C.; Catala, P.; Parthuisot, N.; Lebaron, P. Activity and diversity of bacterial cells with high and low nucleic acid content. Aquat. Microb. Ecol. 2003, 33, 41–51. [Google Scholar] [CrossRef]
- Jeffrey, S.W.; Humphrey, G.F. New spectrophotometric equations for determining chlorophylls a,b,c1 and c2 in higher plants, algae and natural phytoplankton. Biochem. Physiol. Pflanz. 1975, 167, 191–194. [Google Scholar] [CrossRef]
- Lorenzen, C.J. Determination of chlorophyll and pheopigments: Spectrophotometric equations. Limnol. Oceanogr. 1967, 12, 343–346. [Google Scholar] [CrossRef]
- Neeley, A.R.; Mannino, A. Inherent Optical Property Measurements and Protocols: Absorption Coefficient; Dartmouth, N.S., Ed.; International Ocean Colour Coordinating Group (IOCCG): Dartmouth, NS, Canada, 2018. [Google Scholar] [CrossRef]
- Kishino, M.; Takahashi, N.; Okami, N.; Ichimura, S. Estimation of the spectral absorption coefficients of phytoplankton in the sea. Bull. Mar. Sci. 1985, 37, 634–642. [Google Scholar]
- Mitchell, B.G. Algorithms for determining the absorption coefficient for aquatic particulates using the quantitative filter technique. In Proceedings of the 1990 Technical Symposium on Optics, Electro-Optics, and Sensors—Ocean Optics X, Orlando, FL, USA, 16–20 April 1990; Volume 1302, pp. 137–148. [Google Scholar] [CrossRef]
- Babin, M.; Stramski, D.; Ferrari, G.M.; Claustre, H.; Bricaud, A.; Obolensky, G.; Hoepffner, N. Variations in the light absorption coefficients of phytoplankton, nonalgal particles, and dissolved organic matter in coastal waters around Europe. J. Geophys. Res. 2003, 108, 3211. [Google Scholar] [CrossRef]
- Bjorkman, O.; Demmig, B. Photon yield of O2 evolution and chlorophyll fluorescence characteristics at 77K among vascular plants of diverse origins. Planta 1987, 170, 489–504. [Google Scholar] [CrossRef]
- Schreiber, U.; Bilger, W.; Neubauer, C. Chlorophyll fluorescence as a nonintrusive indicator for rapid assessment of in vivo photosynthesis. In Ecophysiology of Photosynthesis; Springer: Berlin/Heidelberg, Germany, 1995; pp. 49–70. [Google Scholar] [CrossRef]
- Ke, B. Photosynthesis: Photobiochemistry and Photobiophysics; Springer Science and Business Media: Berlin, Germany, 2001; pp. 1–792. [Google Scholar]
- Marra, J.; Trees, C.C.; Bidigare, R.R.; Barber, R.T. Pigment absorption and quantum yields in the Arabian Sea. Deep. Sea Res. Part II Top. Stud. Oceanogr. 2000, 47, 1279–1299. [Google Scholar] [CrossRef]
- Gitelson, I.I.; Levin, L.A.; Utyushev, K.N.; Cherepanov, O.A.; Chugunov, Y.N. Ocean Bioluniinescence; Gidrometeoizdat: SaintPetersburg, Russia, 1992; pp. 1–283. (In Russian) [Google Scholar]
- Melnik, A.; Melnik, L.; Mashukova, O.; Melnikov, V. Field studies of bioluminescence in the Antarctic sector of the Atlantic Ocean in 2002 and 2020. Luminescence 2021, 36, 1910–1921. [Google Scholar] [CrossRef]
- Hydrobiological System “Salpa”. Available online: http://ecodevice.com.ru/ecodevice-catalogue/complex-salpa-gbf (accessed on 29 November 2022).
- Bouchard, C.; Mollard, S.; Suzuki, K.; Robert, D.; Fortier, L. Contrasting the Early Life Histories of Sympatric Arctic Gadids Boreogadus Saida and Arctogadus Glacialis in the Canadian Beaufort Sea. Polar Biol. 2016, 39, 1005–1022. [Google Scholar] [CrossRef]
- Kobyliansky, S.G.; Orlov, A.M.; Gordeeva, N.V. Composition of Deepsea Pelagic Ichthyocenes of the Southern Atlantic, from Waters of the Range of the Mid-Atlantic and Walvis Ridges. J. Ichthyol. 2010, 50, 932–50949. [Google Scholar] [CrossRef]
- Dmitrieva, E.V.; Lyakh, A.M.; Kornyychuk, Y.M.; Polyakova, T.A.; Popyuk, M.P. IMBR Collection of Marine Parasites: The Collection of Marine Parasites Maintained by the Institute of Marine Biological Research. 2015. Available online: http://www.marineparasites.org (accessed on 11 March 2022).
- Morris, A.W. Dissolved molybdenum and vanadium in the northeast Atlantic Ocean. Deep. Sea Res. Oceanogr. Abstr. 1975, 22, 49–54. [Google Scholar] [CrossRef]
- Bongo Plankton Net. Available online: https://www.nhbs.com/bongo-plankton-net (accessed on 20 August 2022).
- Kabata, Z.; Gusev, A.V. Parasitic Copepoda of fishes from the collection of the Zoological Institute in Leningrad. J. Linn. Soc. (Zool.) 1966, 46, 155–207. [Google Scholar] [CrossRef]
- Hogans, W.E. Review of Sarcotretes Jungersen, 1911 (Copepoda: Pennellidae) from midwater and demersal fishes in the north Atlantic Ocean. Can. J. Zool. 1988, 66, 1371–1375. [Google Scholar] [CrossRef]
- Morozov, E.G. Currents in Bransfeld Strait. Dokl. Earth Sci. 2007, 415, 984–986. [Google Scholar] [CrossRef]
- Gulin, S.B.; Stokozov, N.A. 137Cs concentrations in Atlantic and Western Antarctic surface waters: Results of the 7th Ukrainian Antarctic Expedition, 2002. J. Environ. Radioact. 2005, 83, 1–7. [Google Scholar] [CrossRef]
- Sanchez, N.; Reiss, C.S.; Holm-Hansen, O.; Hewes, C.D.; Bizsel, K.C.; Ardelan, M.V. Weddell-Scotia confluence effect on the iron distribution in waters surrounding the South Shetland (Antarctic Peninsula) and South Orkney (Scotia Sea) Islands during the Austral summer in 2007 and 2008. Front. Mar. Sci. 2019, 6, 771. [Google Scholar] [CrossRef]
- Collier, R.W. Molybdenum in the Northeast Pacific Ocean. Limnol. Oceanogr. 1985, 30, 1351–1354. [Google Scholar] [CrossRef]
- Emerson, S.R.; Huested, S.S. Ocean anoxia and the concentrations of molybdenum and vanadium in seawater. Mar. Chem. 1991, 34, 177–196. [Google Scholar] [CrossRef]
- Warmer, H.; van Dokkum, R. Water Pollution Control in the Netherlands Policy and Practice2001; RIZA Report 2002.009; Rijksinstituut voor Integraal Zoetwater Beheer en Afvalwater Behandeling: Dordrecht, The Netherlands, 2002; 76р. [Google Scholar]
- Tokarczyk, R. Classification of water masses in the Bransfield Strait and southern part of the Drake Passage using a method of statistical multidimensional analysis. Polar Res. 1987, 8, 333–366. [Google Scholar]
- Polukhin, A.A.; Morozov, E.G.; Tishchenko, P.P.; Frey, D.I.; Artemiev, V.A.; Borisenko, G.V.; Vidnichuk, A.V.; Marina, E.N.; Medvedev, E.V.; Popov, O.S.; et al. Water structure in the Bransfield Strait (Antarctica) in January 2020: Hydrophysical, optical and hydrochemical features. Oceanology 2021, 61, 724–736. [Google Scholar] [CrossRef]
- Holm-Hansen, O.; Mitchell, B.G.; Hewes, C.D.; Karl, D.M. Phytoplankton blooms in the vicinity of Palmer Station, Antarctica. Polar Biol. 1989, 10, 49–57. [Google Scholar] [CrossRef]
- Morán, X.A.G.; Estrada, M.; Gasol, J.M.; Pedrós-Alió, C. Dissolved primary production and the strength of phytoplankton–bacterioplankton coupling in contrasting marine regions. Microb. Ecol. 2002, 44, 217–223. [Google Scholar] [CrossRef]
- Davidson, A.T.; Thomson, P.G.; Westwood, K.; van den Enden, R. Estimation of bacterioplankton activity in Tasmanian coastal waters and between Tasmania and Antarctica using stains. Aquat. Microb. Ecol. 2004, 37, 33–45. [Google Scholar] [CrossRef]
- Pearce, I.; Davidson, A.T.; Bell, E.M.; Wright, S. Seasonal changes in the concentration and metabolic activity of bacteria and viruses at an Antarctic coastal site. Aquat. Microb. Ecol. 2007, 47, 11–23. [Google Scholar] [CrossRef]
- Guixa-Boixereu, N.; Vaqué, D.; Gasol, J.M.; Sanchez-Cámara, J.; Pedrós-Alió, C. Viral distribution and activity in Antarctic waters. Deep. Sea Res. Part II Top. Stud. Oceanogr. 2002, 49, 827–845. [Google Scholar] [CrossRef]
- Vaqué, D.; Guixa-Boixereu, M.; Gasol, J.M.; Pedrós-Alió, C. Distribution of microbial biomass and importance of protists in regulating prokaryotic assemblages in three areas close to the Antarctic Peninsula in spring and summer 1995/96. Deep. Sea Res. Part II Top. Stud. Oceanogr. 2002, 49, 847–867. [Google Scholar] [CrossRef]
- Duarte, C.M.; Agustí, S.; Vaqué, D.; Agawin, N.S.R.; Felipe, J.; Casamayor, E.O.; Gasol, J.M. Experimental test of bacteria–phytoplankton coupling in the Southern Ocean. Limnol. Oceanogr. 2005, 50, 1844–1854. [Google Scholar] [CrossRef]
- Ortega-Retuerta, E.; Reche, I.; Pulido-Villena, E.; Agustí, S.; Duarte, C.M. Exploring the relationship between active bacterioplankton and phytoplankton in the Southern Ocean. Aquat. Microb. Ecol. 2008, 52, 99–106. [Google Scholar] [CrossRef] [Green Version]
- Azaneu, M.; Heywood, K.J.; Queste, B.Y.; Thompson, A.F. Variability of the Antarctic slope current system in the northwestern Weddell Sea. J. Phys. Oceanogr. 2017, 47, 2977–2997. [Google Scholar] [CrossRef]
- Collares, L.; Mata, M.M.; Kerr, R.; Arigony-Neto, J.; Barbat, M.M. Iceberg drift and ocean circulation in the Northwestern Weddell Sea, Antarctica. Deep. Sea Res. Part II Top. Stud. Oceanogr. 2018, 149, 10–24. [Google Scholar] [CrossRef]
- Kerr, R.; Mata, M.M.; Mendes, C.R.B.; Secchi, E.R. Northern Antarctic Peninsula: A marine climate hotspot of rapid changes on ecosystems and ocean dynamic. Deep. Sea Res. Part II Top. Stud. Oceanogr. 2018, 149, 4–9. [Google Scholar] [CrossRef]
- Ducklow, H.W.; Stukel, M.R.; Eveleth, R.; Doney, S.C.; Jickells, T.; Schofield, O.; Baker, A.R.; Brindle, J.; Chance, R.; Cassar, N. Spring–summer net community production, new production, particle export and related water column biogeochemical processes in the marginal sea ice zone of the Western Antarctic Peninsula 2012–2014. Philos. Trans. R. Soc. A 2018, 376, 20170177. [Google Scholar] [CrossRef]
- Ferreira, A.; Ciotti, Á.M.; Mendes, C.R.B.; Uitz, J.; Bricaud, A. Phytoplankton light absorption and the package effect in relation to photosynthetic and photoprotective pigments in the northern tip of Antarctic Peninsula. J. Geophys. Res. Ocean. 2017, 122, 7344–7363. [Google Scholar] [CrossRef]
- Bricaud, A.; Babin, M.; Morel, A.; Claustre, H. Variability in the chlorophyll-specific absorption coefficients of natural phytoplankton: Analysis and parameterization. J. Geophys. Res. 1995, 100, 13321–13332. [Google Scholar] [CrossRef]
- Mendes, C.R.B.; Tavano, V.M.; Leal, M.C.; de Souza, M.S.; Brotas, V.; Garcia, C.A.E. Shifts in the dominance between diatoms and cryptophytes during three late summers in the Bransfield Strait (Antarctic Peninsula). Polar Biol. 2013, 36, 537–547. [Google Scholar] [CrossRef]
- Suslin, V.; Churilova, T.A. Regional algorithm for separating light absorption by chlorophyll-a and coloured detrital matter in the Black Sea, using 480–560 nm bands from ocean colour scanners. Int. J. Remote Sens. 2016, 37, 4380–4400. [Google Scholar] [CrossRef]
- Churilova, T.; Suslin, V.; Krivenko, O.; Efimova, T.; Moiseeva, N. Spectral Approach to Assessment of Phytoplankton Photosynthesis Rate in the Black Sea Based on Satellite Information: Methodological Aspects of the Regional Model Development. J. Sib. Fed. Univ. Biol. 2016, 9, 367–384. (In Russian) [Google Scholar] [CrossRef]
- Morel, A.; Bricaud, A. Theoretical results concerning light absorption in a discrete medium and application to specific absorption of phytoplankton. Deep-Sea Res. 1981, 28, 1375–1393. [Google Scholar] [CrossRef]
- Churilova, T.; Suslin, V.; Efimova, T.; Moiseeva, N.; Skorokhod, E. Effect of dissolved and suspended matter on light in the sea and phytoplankton light absorbance capacity in coastal waters of the Black Sea. Fundam. Prikl. Gidrofiz. 2020, 13, 42–53. [Google Scholar] [CrossRef]
- Bitiutskii, D.G.; Samyshev, E.Z.; Minkina, N.I.; Melnikov, V.V.; Chudinovskih, E.S.; Usachev, S.I.; Salyuk, P.A.; Serebrennikov, A.N.; Zuev, O.A.; Orlov, A.M. Distribution and Demography of Antarctic Krill and Salps in the Atlantic Sector of the Southern Ocean during Austral Summer 2021–2022. Water 2022, 14, 3812. [Google Scholar] [CrossRef]
- Pakhomov, E.A.; Froneman, P.W.; Perissinoto, R. Salp/krill interactions in the Southern Ocean: Spatial segregation and implications for the carbon flux. Deep Sea Res. 2002, 2, 1881–1907. [Google Scholar] [CrossRef]
- Atkinson, A.; Siegel, V.; Pakhomov, E.A.; Rothery, P. Long-term decline in krill stock and increase in salps within the Southern Ocean. Nature 2004, 432, 100–103. [Google Scholar] [CrossRef] [PubMed]
- Atkinson, A.; Hill, S.L.; Pakhomov, E.; Siegel, V.; Anadon, R.; Chiba, S.; Daly, K.L.; Downie, R.; Fielding, S.; Fretwell, P.; et al. KRILLBASE: A circumpolar database of Antarctic krill and salp numerical densities, 1926–2016. Earth Sci. Data Syst. 2017, 9, 193–2107. [Google Scholar] [CrossRef] [Green Version]
- Bombosch, A. Euphausia Superba or Salpa Thompsoni—Who Is Going to Win? 2008. Available online: https://www.ir.canterbury.ac.nz/bitstream/handle/10092/13921/Bombosch.pdf?sequence=1/ (accessed on 14 December 2022).
- Groeneveld, Y.; Berger, U.; Henschke, N.; Pakhomov, E.; Reiss, C.; Meyer, B. Blooms of a key grazer in the Southern Ocean—An individual-based model of Salpa thompsoni. Prog. Oceanogr. 2020, 185, 102339. [Google Scholar] [CrossRef]
- Luo, J.Y.; Stock, C.A.; Henschke, N.; Dunne, J.P.; O’Brien, T.D. Global ecological and biogeochemical impacts of pelagic tunicates. Prog. Oceanogr. 2022, 205, 102822. [Google Scholar] [CrossRef]
- Johnston, N.M.; Murphy, E.J.; Atkinson, A.; Andrew, J.; Constable, A.J.; Cotté, C.; Cox, M.; Daly, K.L.; Driscoll, R.; Flores, H.; et al. Status, Change and Futures of Zooplankton in the Southern Ocean. Front. Ecol. Evol. 2022, 9, 624692. [Google Scholar] [CrossRef]
- Minkina, N.I.; Samyshev, E.Z.; Pakhomov, E.A.; Melnikov, V.V. Temporal and satial variability of energy exchange in Antarctic salps. Res. Sq. 2022, submitted. [Google Scholar] [CrossRef]
- Samyshev, E.Z. Conclusion on the state of krill population and pelagic ecosystem in the western region of the Atlantic part of Antarctica in the pre-winter period of 1998. Bull. Ukr. Antarct. Cent. 2000, 3, 231–236. [Google Scholar]
- Lomakin, P.D.; Samyshev, E.Z. Oceanographic conditions in the area of the South Shetland Islands in March–April 1997, 1998 and their influence on the distribution of krill and salp. Oceanology 2004, 44, 882–891. [Google Scholar]
- Artamonov, Y.V. Seasonal Variability of Large-Scale Water Circulation and Thermohaline Fronts of the South Atlantic. Ph.D. Thesis, Marine Hydrophysical Institute of the National Academy of Sciences of Ukraine, Sevastopol, Ukraine, 2005; 363p. [Google Scholar]
- Kabata, Z. Csustacea as Enemies of Fishes: Diseaes of Fishes; Snieszko, S.F., Axelrod, H.R., Eds.; TFH PublicationsInc.: Jersey City, NJ, USA, 1970; pp. 1–171. [Google Scholar]
- Kabata, Z. Diseases caused by metazoans: Crustaceans. In Diseases of Marine Animals; Kinne, O., Ed.; Biologische Anstalt Helgoland Jahresbericht: Hamburg, Germany, 1984; Volume 4, Part 1; pp. 321–399. [Google Scholar]
- Kazachenko, V.N. Influence of parasitic copepods on fish. Izv. TINRO 2008, 154, 204–213. [Google Scholar]
- Kazachenko, V.N.; Kovaleva, N.N.; Nguyen, V.T.; Ngo, H.D. Three new species and one new genus of parasitic copepods (Crustacea: Copepoda) from fishes of the South China Sea. Russ. J. Mar. Biol. 2017, 43, 264–269. [Google Scholar] [CrossRef]
- Ho, J.S.; Kim, I.H.; Nagasawa, K.; Saruwatari, T. Paeonocanthusantarcticensis (Hewitt, 1965): A rare copepod parasite of bathypelagic fish, Bathylagusantarcticus Günther, from the Antarctic Ocean. Zool. Sci. 2003, 20, 1315–1321. [Google Scholar] [CrossRef] [PubMed]
- Cherel, Y.; Boxshall, G.A. Sarcotretes (Copepoda: Pennellidae) parasitizing myctophid fishes in the Southern Ocean: New information from seabird diet. J. Parasitol. 2004, 90, 1288–1292. [Google Scholar] [CrossRef] [PubMed]
- Polyakova, T.A.; Gordeev, I.I. Parasites as an inseparable part of Antarctic and Subantarctic marine biodiversity. In Antarctic Peninsula Region of the Southern Ocean; Morozov, E.G., Flint, M.V., Spiridonov, V.A., Eds.; Advances in Polar EcologyBook Series; Springer: Berlin/Heidelberg, Germany, 2021; Volume 6, pp. 321–354. [Google Scholar] [CrossRef]


| Station Coordinates | Station Number | Max. Biolum. | Max. Level (m) of Biolum. | Biolum. Means | Temp, °C | Salinity, PSU |
|---|---|---|---|---|---|---|
| 62°33.48′ S 059°33.85′ W | 1 | 272.3 | 166 | 149.57 | 2.05 | 33.8 |
| 62°34.96′ S 059°31.92′ W | 2 | 159.4 | 176 | 88.4 | 1.9 | 33.8 |
| 62°35.93′ S 059°29.42′ W | 3 | 169.87 | 179 | 165.84 | 1.76 | 33.85 |
| 62°36.89′ S 059°27.30′ W | 4 | 190.8 | 198 | 166.3 | 1.88 | 33.9 |
| 62°40.01′ S 059°22.01′ W | 5 | 115.67 | 113 | 100.72 | 1.32 | 34.11 |
| 62°44.86′ S 059°11.89′ W | 6 | 110 | 179 | 107.81 | 1.38 | 34.1 |
| 62°54.04′ S 058°53.23′ W | 7 | 109 | 111 | 101.59 | 0.68 | 34.18 |
| 63°02.14′ S 058°35.66′ W | 8 | 81.4 | 128 | 18.69 | 0.07 | 34.19 |
| 63°10.01′ S 058°20.05′ W | 9 | 55.93 | 152 | 17.42 | 0.07 | 34.19 |
Publisher’s Note: MDPI stays neutral with regard to jurisdictional claims in published maps and institutional affiliations. |
© 2022 by the authors. Licensee MDPI, Basel, Switzerland. This article is an open access article distributed under the terms and conditions of the Creative Commons Attribution (CC BY) license (https://creativecommons.org/licenses/by/4.0/).
Share and Cite
Mirzoeva, N.; Polyakova, T.; Samyshev, E.; Churilova, T.; Mukhanov, V.; Melnik, A.; Proskurnin, V.; Sakhon, E.; Skorokhod, E.; Chuzhikova-Proskurnina, O.; et al. Current Assessment of Water Quality and Biota Characteristics of the Pelagic Ecosystem of the Atlantic Sector of Antarctica: The Multidisciplinary Studies by the Institute of Biology of the Southern Seas. Water 2022, 14, 4103. https://doi.org/10.3390/w14244103
Mirzoeva N, Polyakova T, Samyshev E, Churilova T, Mukhanov V, Melnik A, Proskurnin V, Sakhon E, Skorokhod E, Chuzhikova-Proskurnina O, et al. Current Assessment of Water Quality and Biota Characteristics of the Pelagic Ecosystem of the Atlantic Sector of Antarctica: The Multidisciplinary Studies by the Institute of Biology of the Southern Seas. Water. 2022; 14(24):4103. https://doi.org/10.3390/w14244103
Chicago/Turabian StyleMirzoeva, Natalia, Tatiana Polyakova, Ernest Samyshev, Tatiana Churilova, Vladimir Mukhanov, Alexandr Melnik, Vladislav Proskurnin, Evgeny Sakhon, Elena Skorokhod, Olga Chuzhikova-Proskurnina, and et al. 2022. "Current Assessment of Water Quality and Biota Characteristics of the Pelagic Ecosystem of the Atlantic Sector of Antarctica: The Multidisciplinary Studies by the Institute of Biology of the Southern Seas" Water 14, no. 24: 4103. https://doi.org/10.3390/w14244103