
Groundwater Quality and Potential Pollution in the Southern Shimabara Peninsula, Japan

1
Institute of Integrated Science and Technology, Nagasaki University, 1-14 Bunkyo-machi, Nagasaki 852-8521, Japan
2
Undergraduate School of Humanities and Science, Tokai University, 9-1-1 Toroku, Higashi-ku, Kumamoto 862-8652, Japan
3
Graduate School of Fisheries and Environmental Sciences, Nagasaki University, 1-14 Bunkyo-machi, Nagasaki 852-8521, Japan
4
Division of Water Resources Engineering & Centre for Advanced Middle Eastern Studies, Lund University, P.O. Box 118, SE-221 00 Lund, Sweden
*
Author to whom correspondence should be addressed.
Water 2022, 14(24), 4106; https://doi.org/10.3390/w14244106
Submission received: 9 November 2022
/
Revised: 8 December 2022
/
Accepted: 14 December 2022
/
Published: 16 December 2022
(This article belongs to the Special Issue Urban Water-Related Problems)
Abstract
:Nitrate pollution in groundwater is a severe problem in Shimabara Peninsula, Nagasaki Prefecture, Japan. Previous studies have investigated water quality characteristics in the northern part of the peninsula and shown serious effects of nitrate pollution in the groundwater. The present study aimed to investigate the groundwater quality in the southern areas of the peninsula for improved understanding of the water quality status for the entire peninsula. Groundwater samples were collected at 56 locations in Minami-Shimabara City from 28 July to 4 August 2021. The spatial distribution of water quality constituents was assessed by Piper-trilinear and Stiff diagrams for major ion concentrations. One agricultural area in the western parts exceeded Japanese recommended standards for water. According to the Piper-trilinear diagram, 44 sampling sites (78.6%) were classified as alkaline earth carbonate type, nine sites (16.1%) as alkaline earth non-carbonate type, and three sites (5.3%) as alkaline carbonate type. Stiff diagrams displayed Ca-HCO3 water type for most of the sites. Na-HCO3 and Mg-HCO3 types were found in coastal areas. Principal component analyses showed that the first component corresponded to dissolved constituents in groundwater and denitrification, the second effects of ion exchange and low nitrate pollution, and the third effects of severe nitrate pollution. Hierarchical cluster analysis was used to classify the groundwater into five groups. The first group included sites with relatively high nitrate concentration. The second group had relatively low ion concentration, distributed from center to eastern parts. The third group included intermediate ion concentration, distributed at lower altitudes along the coastal line. The fourth and fifth groups had a higher ion concentration, especially characterized by high sodium and bicarbonate concentration.
1. Introduction
Groundwater is a globally important resource used for domestic, industrial, and agricultural purposes. In 2018, groundwater dependency for these uses in Japan was 20.1%, 27.3%, and 5.4%, respectively [1]. In some areas, the dependence on groundwater for domestic use is 100%. Therefore, groundwater quality assessment is essential to protect residents’ health and preserve their living environment. In Japan, assessments have continuously been carried out for 28 water quality parameters (e.g., cadmium, lead, arsenic, dichloromethane, carbon tetrachloride, benzene, nitrate+nitrite-nitrogen (NO3+NO2-N), fluoride, and boron) for which environmental standards of groundwater pollution are established under the Basic Environment Law. In 2020, an investigation was conducted for 3103 wells to assess the overall groundwater quality. In total, 10 parameters were found to exceed environmental standards [2]. NO3+NO2-N had the highest exceedance at 3.3%. This was followed by arsenic at 2.1% and fluoride at 0.8%. NO3+NO2-N has continued to present the highest exceedance rates since it was added to the criteria in 1999, and this is typified throughout Japan. Nitrate pollution in groundwater is the most prevalent type of anthropogenic pollution [3]. In many cases, nitrate pollution in groundwater is caused by fertilizer and livestock wastewater in agricultural areas [3]. Other pollutants, such as arsenic and fluoride stem from natural sources originally contained in rocks [3]. The release and fate of these elements in groundwater are controlled by water-rock interaction processes in hydrogeological paths of the water [4,5].
The Shimabara Peninsula in Nagasaki Prefecture, Japan, depends on groundwater for most of its water supply due to the small amounts of surface water [6]. However, the peninsula is experiencing severe nitrate pollution in groundwater. Water quality monitoring has shown that the number of tap water source (groundwater) wells above environmental standards for NO3+NO2-N ranged from 5.1% to 10.0% during 2005 to 2020 [7]. Although the general pollution level is slowly decreasing, some wells are still showing increasing concentrations and require continuous monitoring. The Shimabara Peninsula consists of three cities: Shimabara, Unzen, and Minami-Shimabara. In 2011, we started an investigation on groundwater quality in Shimabara City, where pollution is particularly severe. We found concentrations up to 26.6 mg/L NO3-N related to intensive agricultural activities (fertilizer and livestock production) [8]. Further investigation displayed pollution spread with depth in groundwater [9] and that there is a strong relationship between pollution in soil and groundwater [10]. In 2018, the study area was expanded to Unzen City. We found maximum NO3-N concentrations of 19.9 mg/L and that the pollution is related to agriculture as in Shimabara City [11]. Although the assessment of groundwater pollution has been established for Shimabara and Unzen Cities; groundwater chemistry including nitrate pollution has not been studied in the Minami-Shimabara City. For this reason, we evaluated spatial characteristics of groundwater chemistry in the Minami-Shimabara City for improved understanding of the status of nitrate pollution in this area and the hydrochemical characteristics of groundwater in vulnerable aquifers compared to the hydrochemistry of the Shimabara and Unzen Cities.
2. Materials and Methods
2.1. Study Area
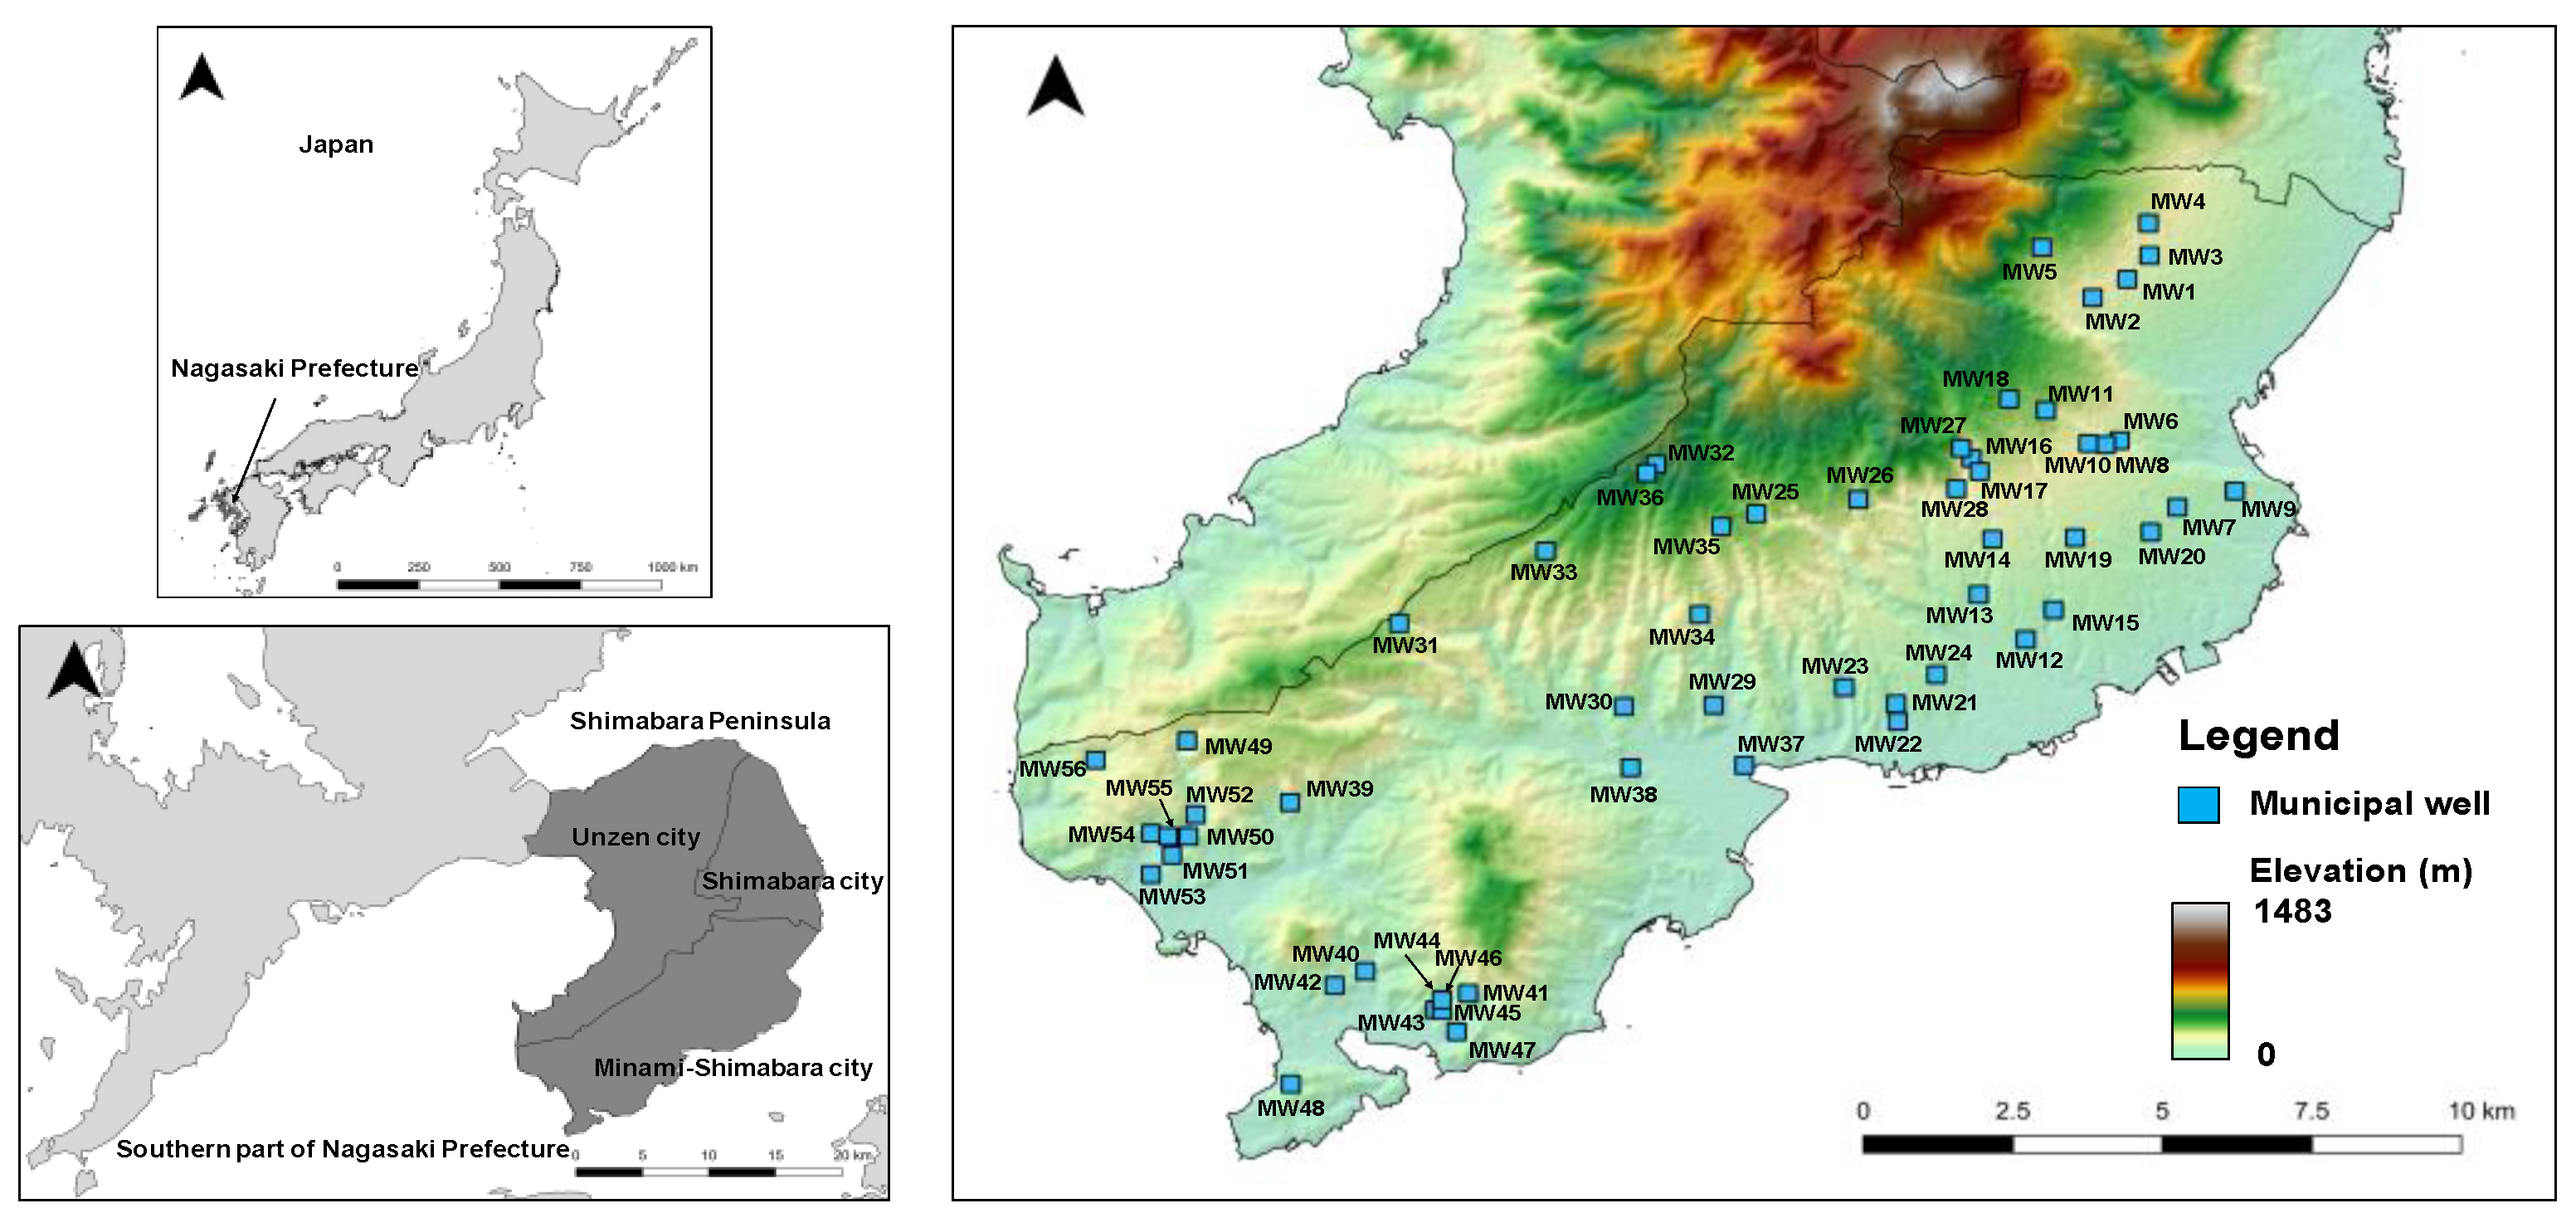
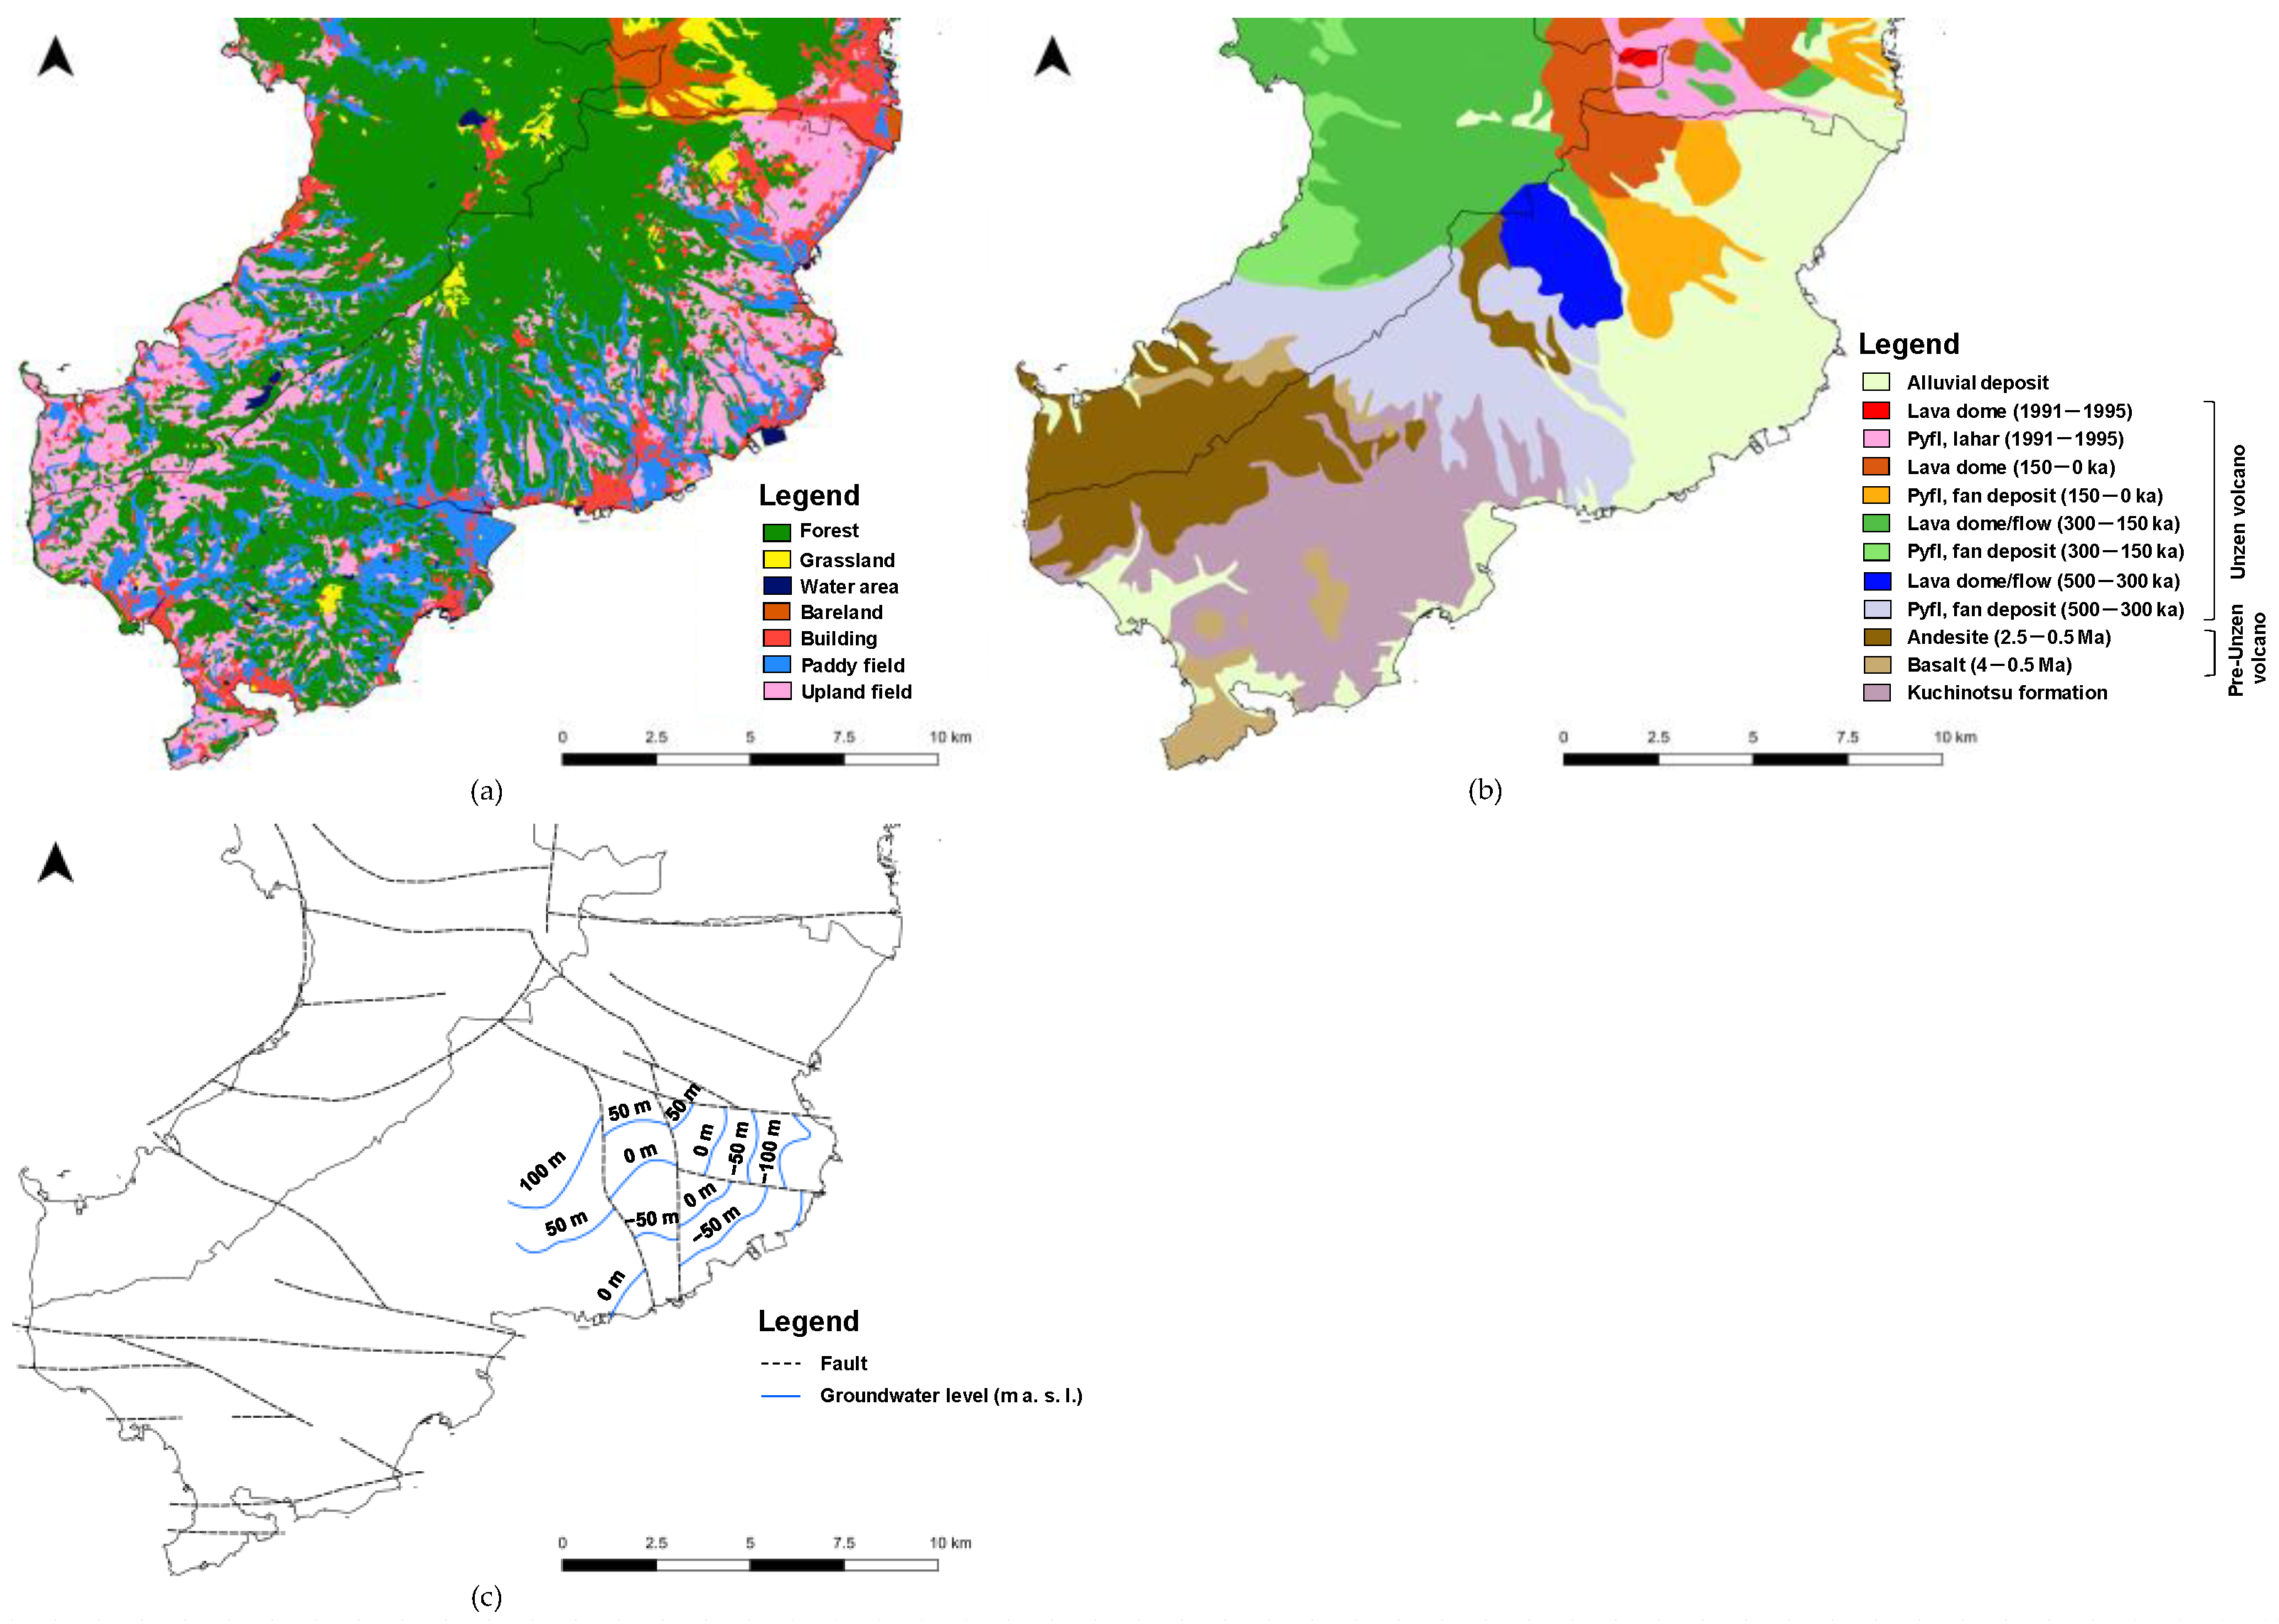
Minami-Shimabara City is located in the south of Shimabara Peninsula, Nagasaki Prefecture (Figure 1) with an area of approximately 17,000 ha. In 2017, the population was 44,200 with a water supply coverage of 92.8% [12]. There are 5 surface reservoirs, a main river, 60 groundwater sources, and 2 springs supplying water to the city [12]. Groundwater has the highest ratio of water withdrawal, reaching 86.1% [12]. The land use map is shown in Figure 1a [13]. Forests cover 35.6% of the total area [14]. The agricultural land area is 4730 ha (paddy fields 1650 ha; upland fields 3070 ha) [14], equivalent to 27.8% of the city area. This ratio is higher than that of Nagasaki Prefecture as a whole and is characterized by agriculture use in upland fields. Mainly cultivated crops are rice, potatoes, fodder crops, and leaf tobacco. Nitrogen application by chemical fertilizer and manure for the 10 major crops is estimated at 1715 kg/day [7]. Livestock production is thriving, with 223 livestock facilities (49 dairies, 138 beef cattle, 14 pork, 5 egg, and 17 broiler production units) in 2019 [7]. This corresponds to 35,950 cattle, 79,000 pigs, and 2,900,000 chicken [7]. The resulting nitrogen generation from livestock waste is estimated at 6625 kg/day [7].
Figure 2b shows the geology of the study area [15]. In the southern part of the area, the Kuchinotsu formation, which consists mainly of freshwater sediment and shallow-marine sediment of middle Pliocene to early Pleistocene age [16], is exposed. Pre-Unzen volcanic rocks (4 Ma–500 ka) are partially distributed above the Kuchinotu formation. Pre-Unzen volcanic rocks and Kuchinotsu formation are overlain by the Unzen volcanic rocks (500 ka–present), which are widely distributed in the Shimabara Peninsula [16]. Unzen volcanic rocks are observed near the southern border and in the center of the peninsula. Alluvial deposits are found at lower elevation areas in the north. Pre-unzen volcanic rocks are mainly composed of olivine basalt and amphibole andesite, while Unzen volcanic rocks contain hornblende andesite to dacite rich in plagioclase, hornblende, and biotite mottling [16]. Figure 2c shows the hydrogeological map of the study area [17]. Groundwater levels are only evident in a part of the study area. There are many faults in this area, and the groundwater levels differ greatly due to these. Especially, in the south and east, groundwater levels are complex due to faults.
The climate is humid subtropical. Mean temperature and mean annual precipitation are 17.3 °C and 1836 mm, respectively (1992 to 2021; data from Kuchinotsu observatory, 32°36.7′ N, 130°11.6′ E) [18].
2.2. Sampling and Analyses
Groundwater samples were taken from 56 municipal wells (Figure 1) during July to August 2021. All samples were stored in pre-washed bottles. Stagnant water in the well pipes was removed before water sampling. pH, electrical conductivity (EC), oxidant redox potential (ORP), and dissolved oxygen (DO) were measured on-site by using hand-held instruments (HORIBA D-51 and D-54, and HACH HQ30d). Bicarbonate ion (HCO3−) was determined by the titration method with 0.1 N HCl on-site. All water samples were filtered by 0.45 µm membrane filter on-site. Major anions (Cl−, NO3−, SO42−) and cations (Na+, K+, Mg2+, Ca2+) were measured by ion-chromatography (DKK-TOA, IA-300) in the laboratory. The validity of the analytical results was confirmed by converting ion concentrations from mg/L to mmolc/L and then calculating the charge balance errors (CBE) using:
According to Rahman et al. [19], CBE < ±5 is good, and CBE < ±10 is acceptable. In this study, the CBEs of the samples ranged from −3.6 to 7.3, with <±5 in 41 samples and <±10 in 15 samples.
Principal component analysis (PCA) and hierarchical cluster analysis (HCA) for the hydrochemical parameters were used to interpret processes controlling water chemistry (mineral dissolution, anthropogenic input, sea water intrusion, ion exchange, evapotranspiration, etc.) and grouping the water samples e.g., [20,21,22,23,24]. These methods were also used previously for the Shimabara and Unzen groundwater [8,11]. PCA and HAC were performed based on major ion concentrations (Cl−, NO3−, SO42−, HCO3−, Na+, K+, Mg2+, and Ca2+). The principal components were extracted based on the Kaiser criterion to only retain components with eigenvalues greater than 1. The HCA was performed based on Ward’s method. All analyses were performed by using the statistical software JMP Pro 13 (SAS Institute Inc., 100 SAS Campus Drive, Cary, North Carolina 27513-2414, USA).
3. Results and Discussion
3.1. Water Chemistry
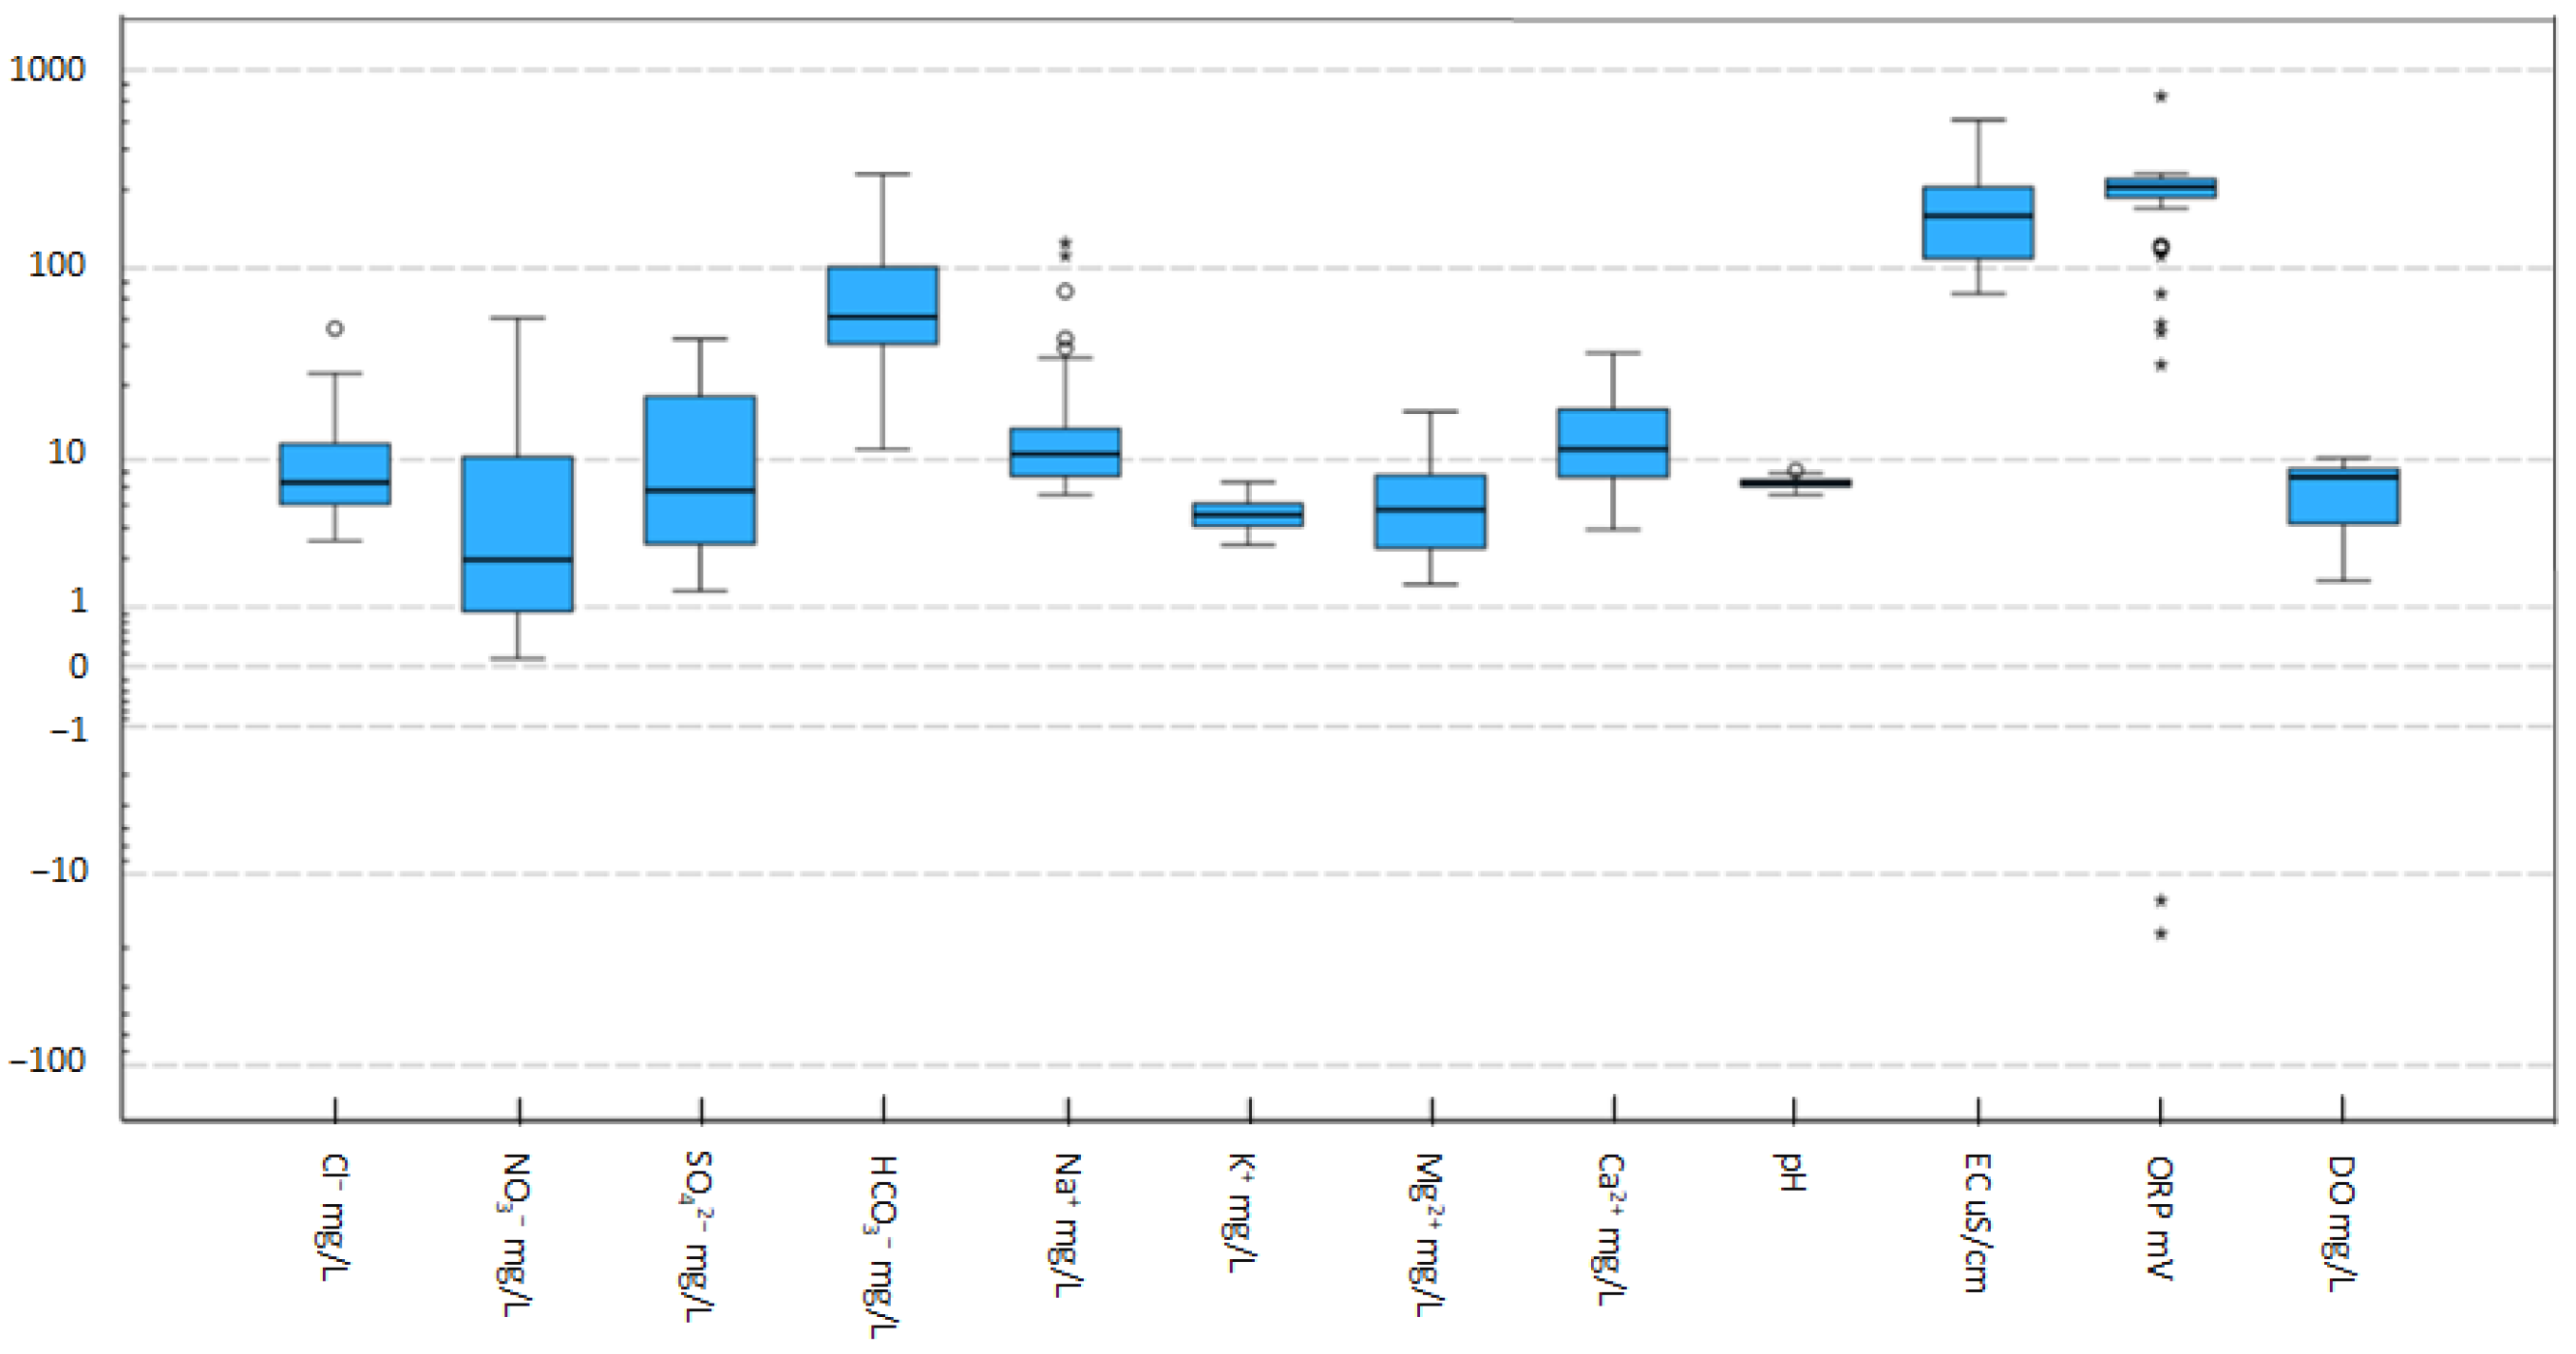
The analysis results of hydrochemical parameters are shown in Table 1 and Figure 3. pH ranged from 6.3 to 8.7, indicating that groundwater in the study is weakly acidic to weakly alkaline. EC ranged from 74 to 563 μS/cm. The range of pH and EC was generally close to the Shimabara and Unzen groundwater [8,11]. ORPs ranged from −21 to 738 mV, meaning that groundwater is oxic or anoxic. The latter was observed at two sampling points (MW51 and MW55). The redox conditions are strong indicators of contaminants that might be present at elevated concentrations [25]. The nitrate concentration is more likely to exceed the recommended limits for oxic conditions [25]. On the other hand, microbially driven reduction of nitrate to nitrogen gas occurs only under anoxic conditions [25]. Gillham and Cherry [26] reported that denitrification processes can occur when the DO in groundwater is less than 2 mg/L. In our study, DO ranged from 1.7 to 10.2 mg/L, with two sampling points (MW44 and MW50) showing less than 2.0 mg/L. Thus, at sampling points (MW44, MW50, MW51, and MW55) with low DO or ORP, NO3− concentrations between 0.1 to 1.9 mg/L indicate that denitrification is likely to occur. These conditions were not observed in Shimabara and Unzen [8,11]. The total dissolved solids (TDS) were estimated from EC by the following equation [27].
where TDS and EC are in mg/L and dS/m, respectively. TDS ranged from 47.4 to 360.3 mg/L with a mean of 134.4 mg/L. The samples were characterized by HCO3− followed by SO42−, Cl−, and NO3− for anions (Figure 3). Cations were characterized by Ca2+ and Na+ followed by Mg2+ and K+.
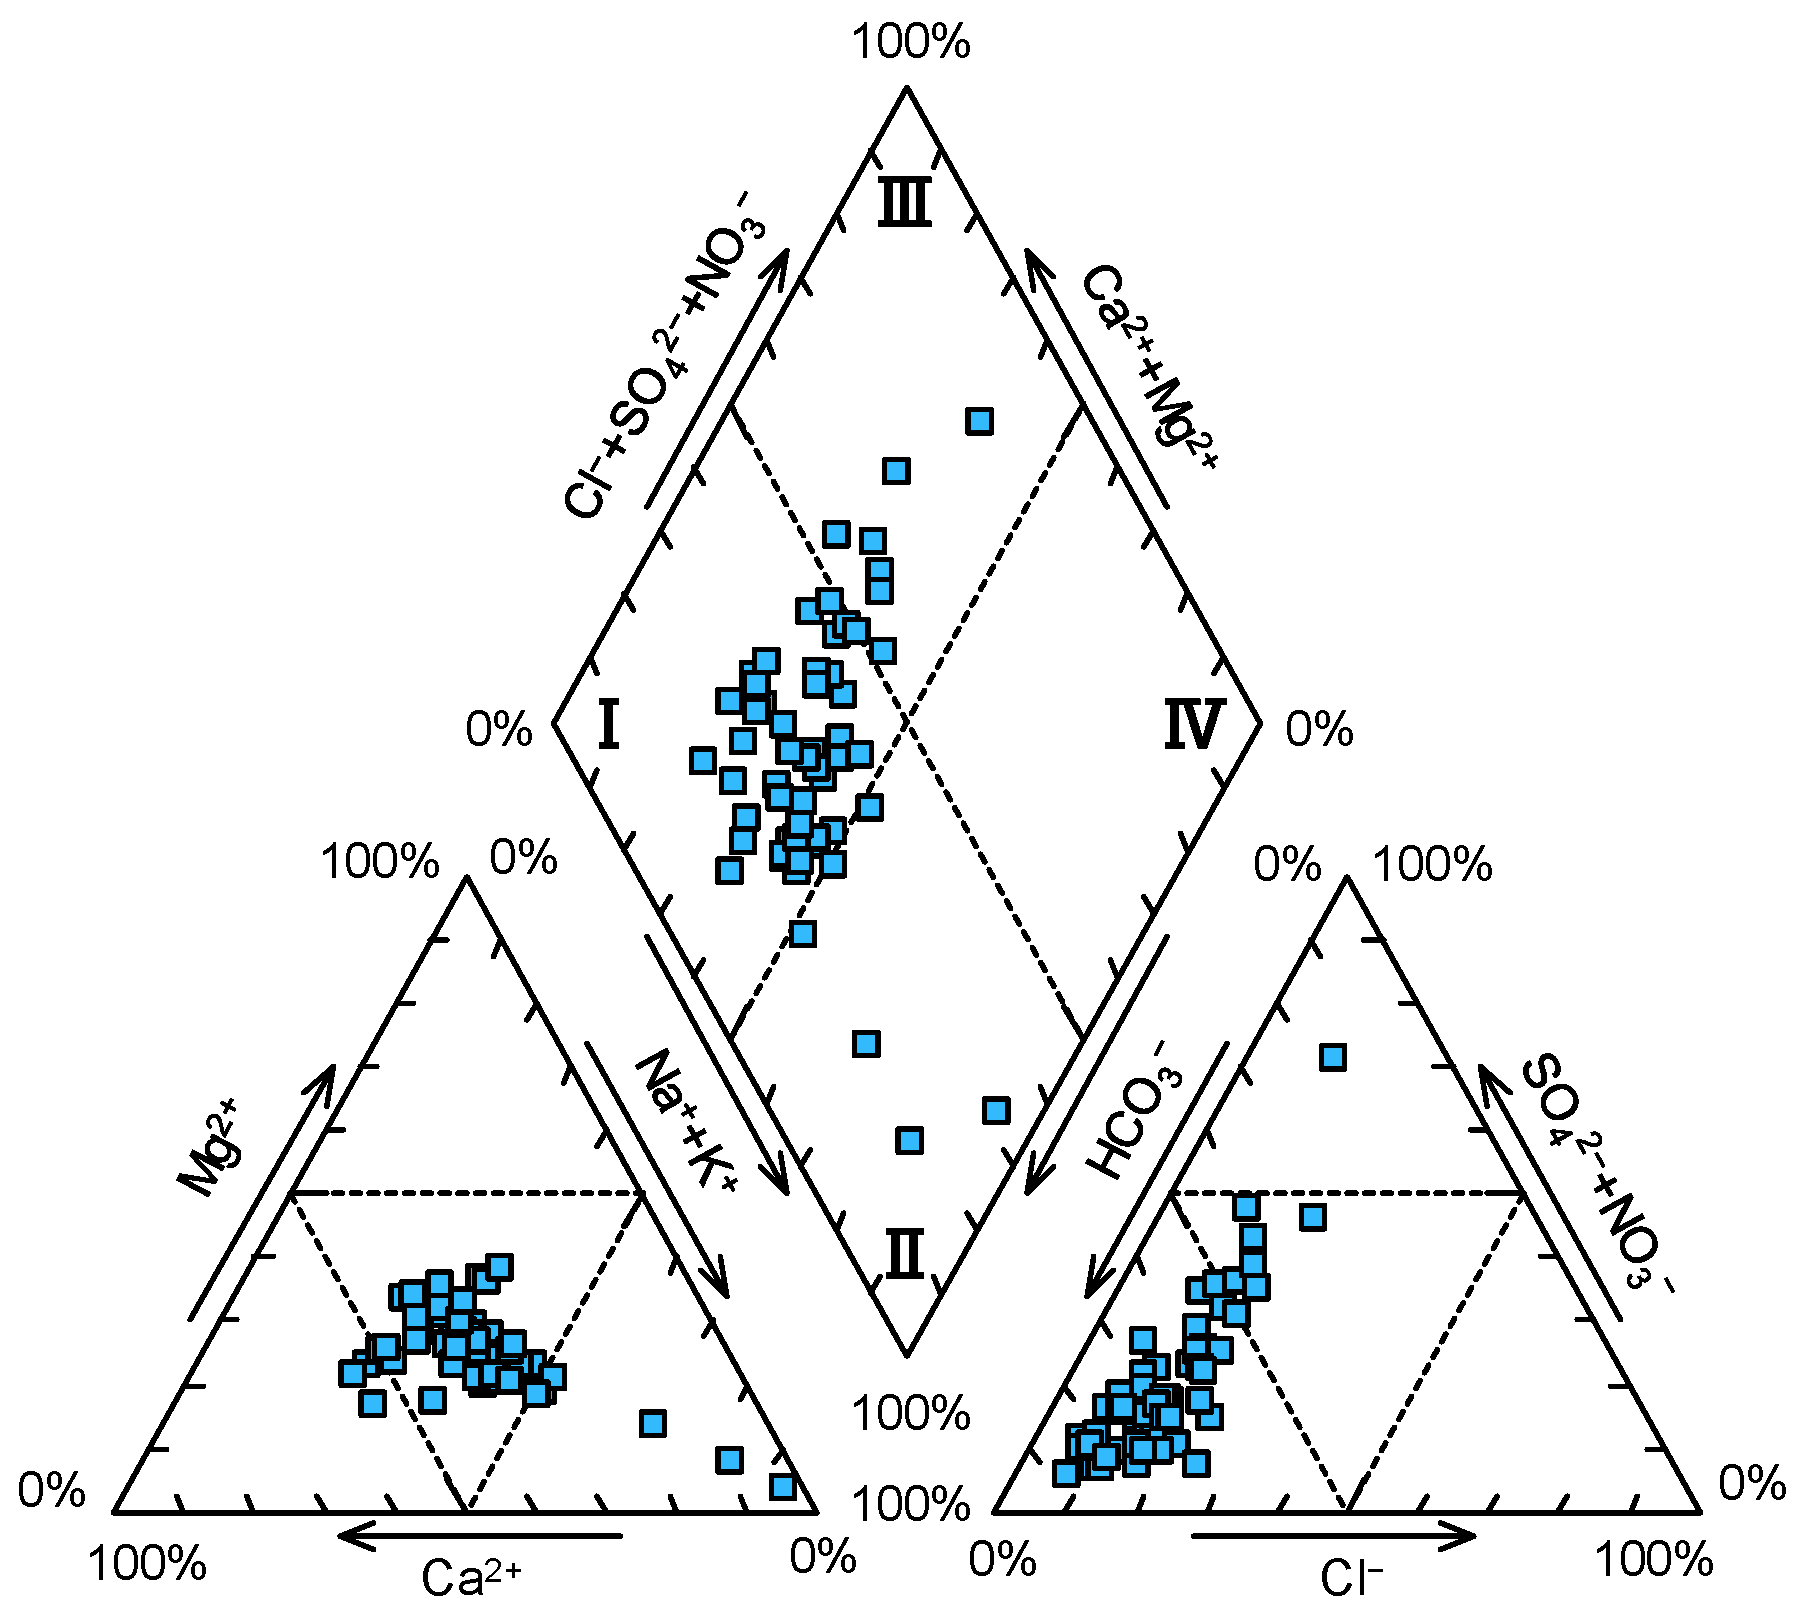
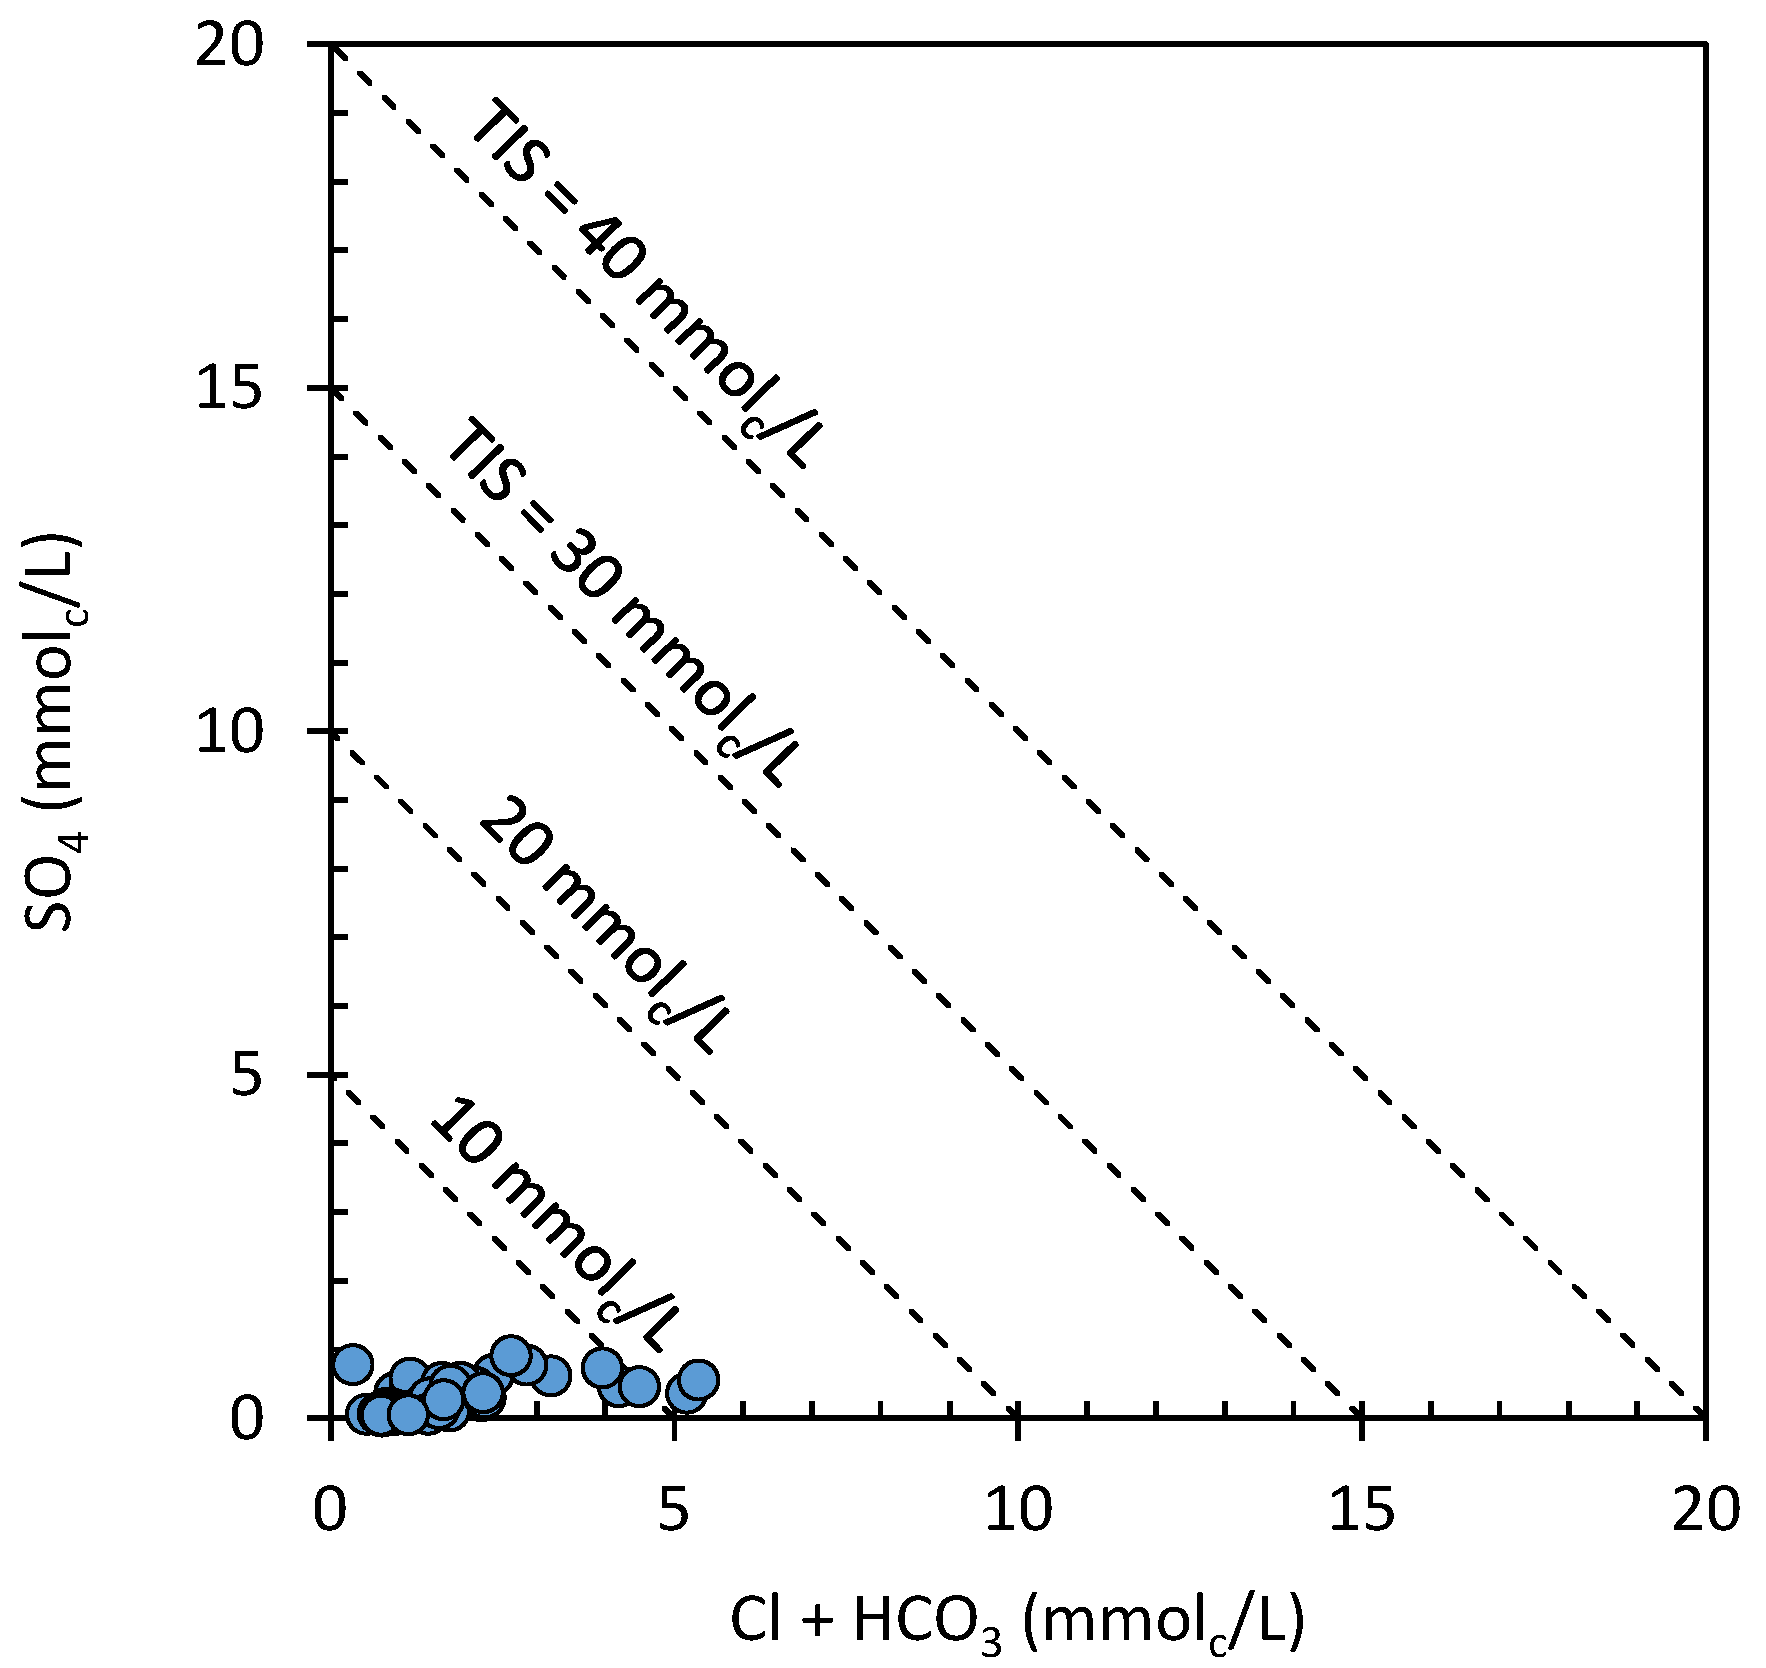
Groundwater samples were plotted using trilinear Piper diagram for easy visual understanding the characteristics of water chemistry (Figure 4). Forty-four sampling points (78.6%) were classified as alkaline earth carbonate type, which is common in shallow groundwater in Japan. Nine points (16.1%) showed alkaline earth non-carbonate type, which is classified as groundwater with high nitrate concentration in Shimabara and Unzen [8,11]. Three samples (5.3%) were classified as alkaline carbonate type. This type of water is commonly found in deep groundwater with long residence time and was not identified in Shimabara and Unzen [8,11]. To consider salinity, Total Ionic Salinity (TIS) is shown in Figure 5 [28]. According to the figure groundwater in Minami-Shimabara has low TIS (<10 mmolc/L).
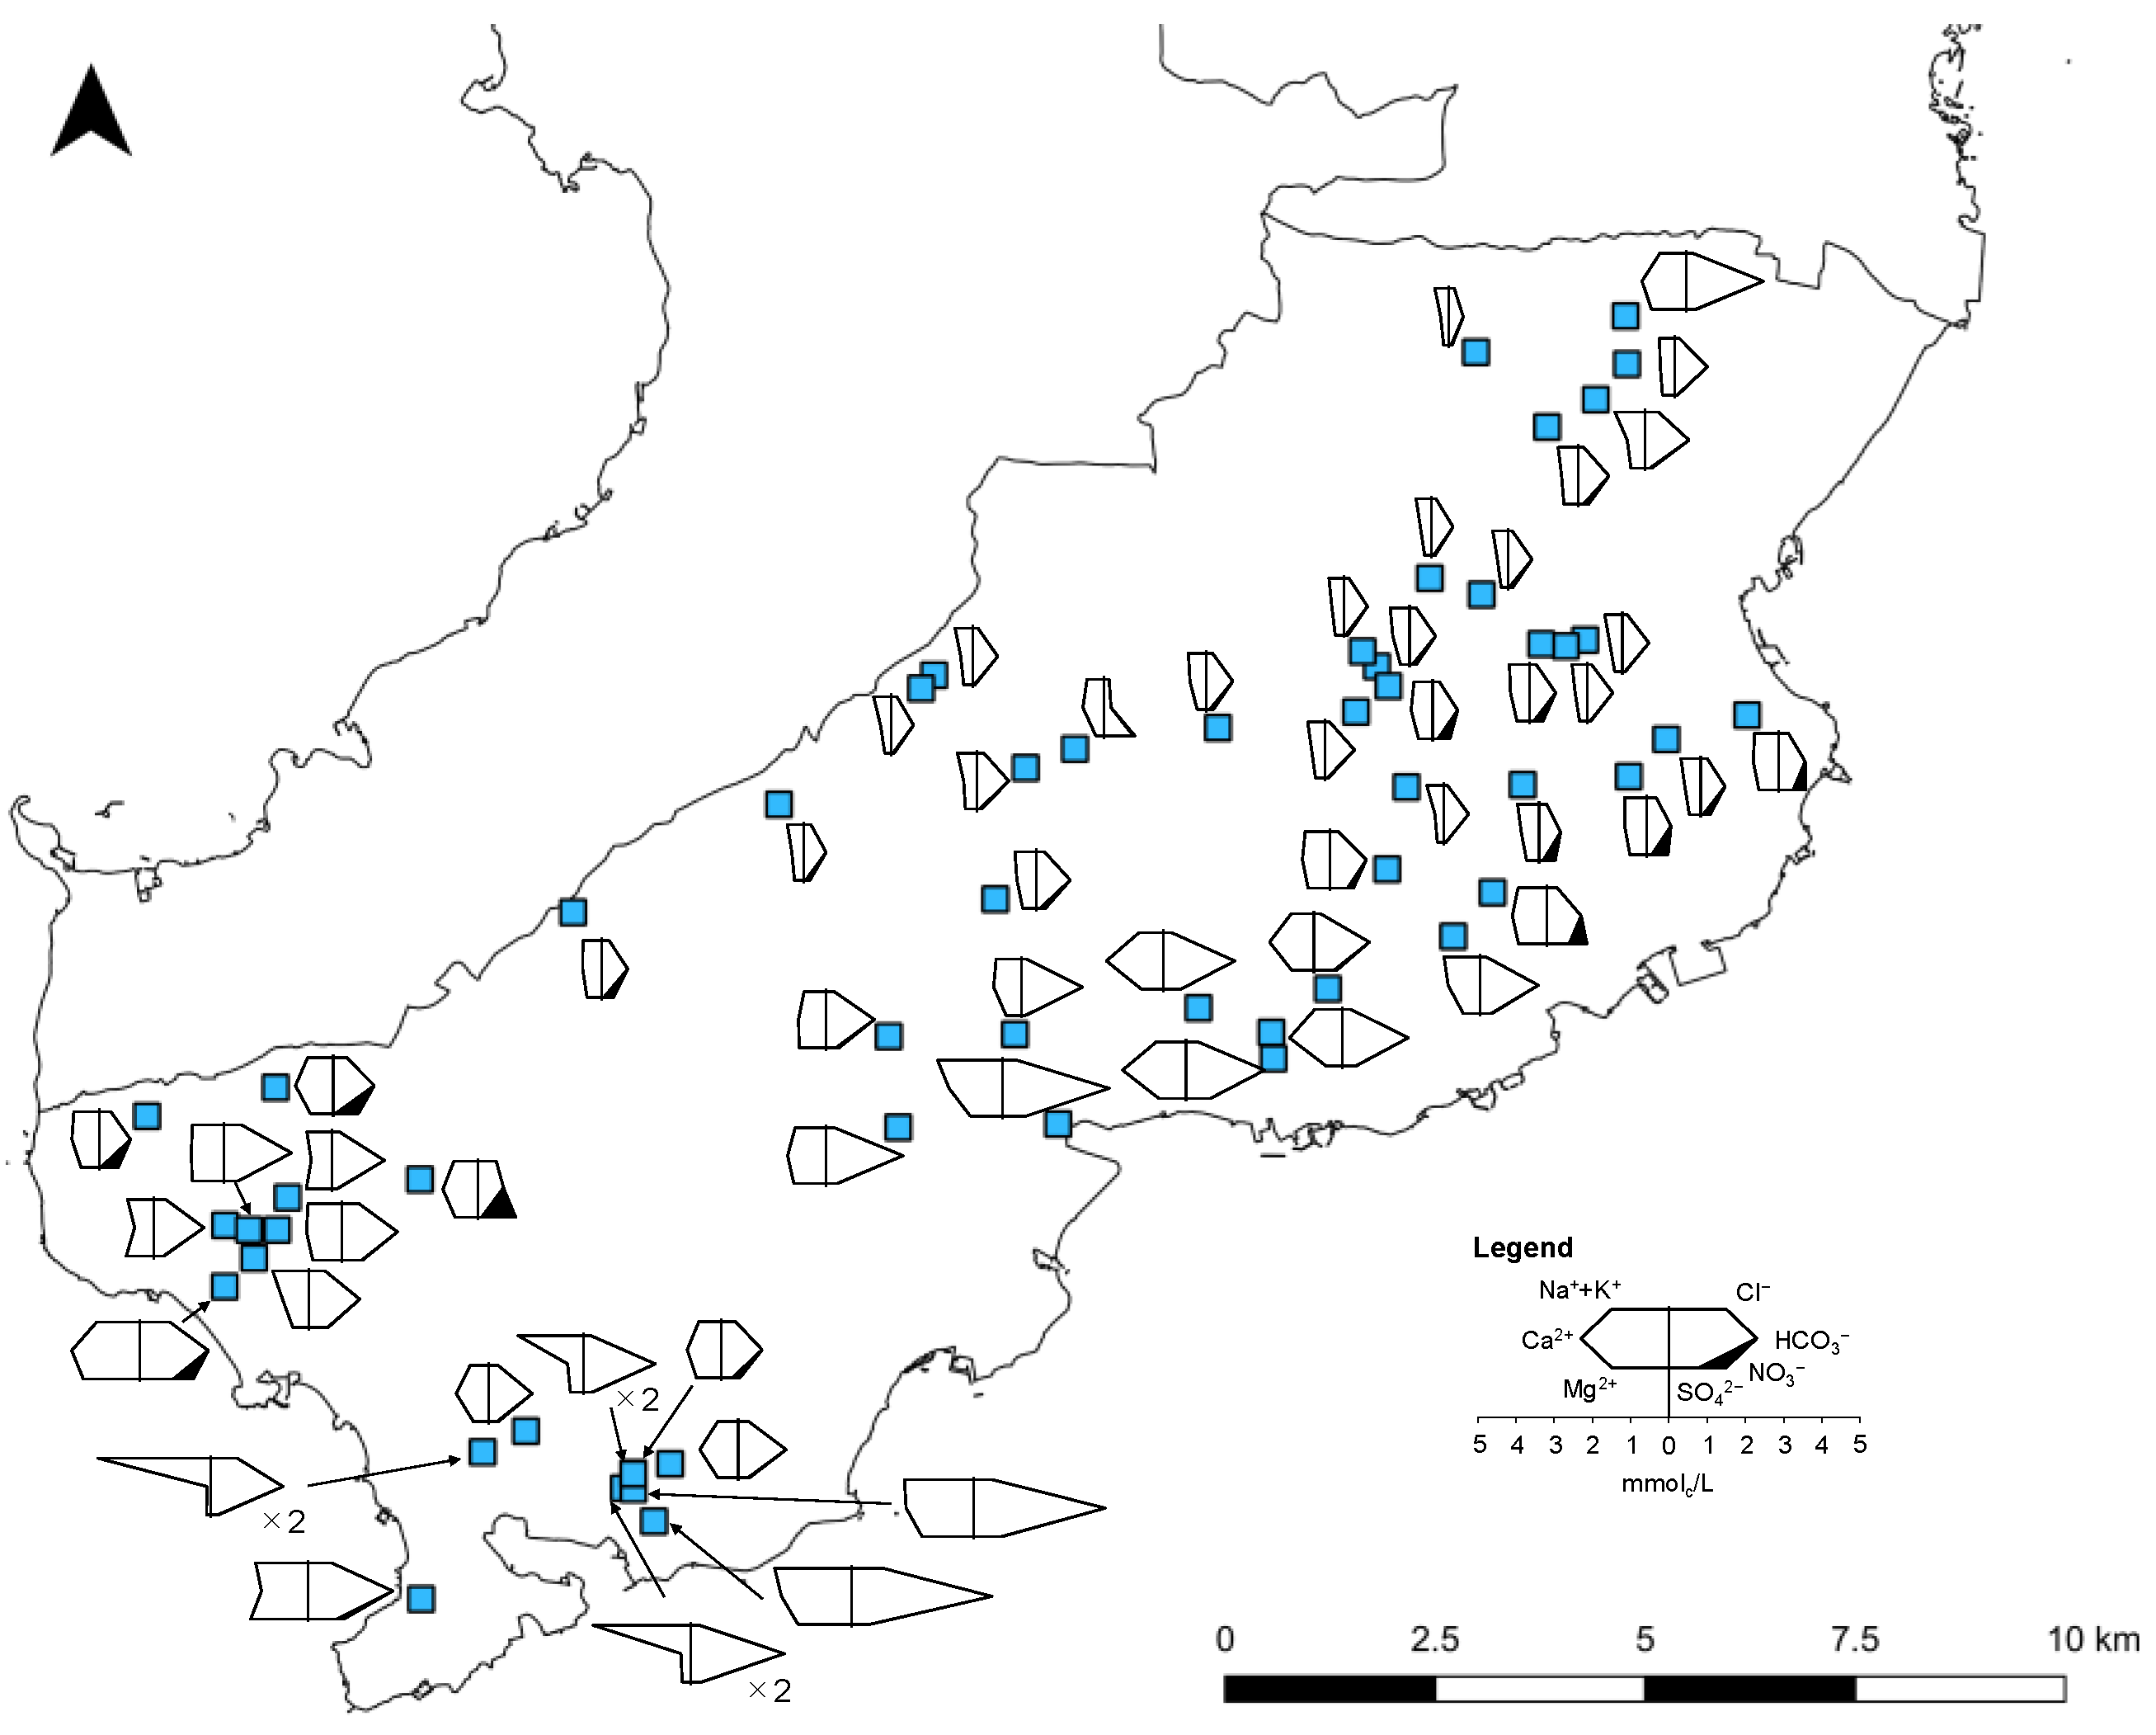
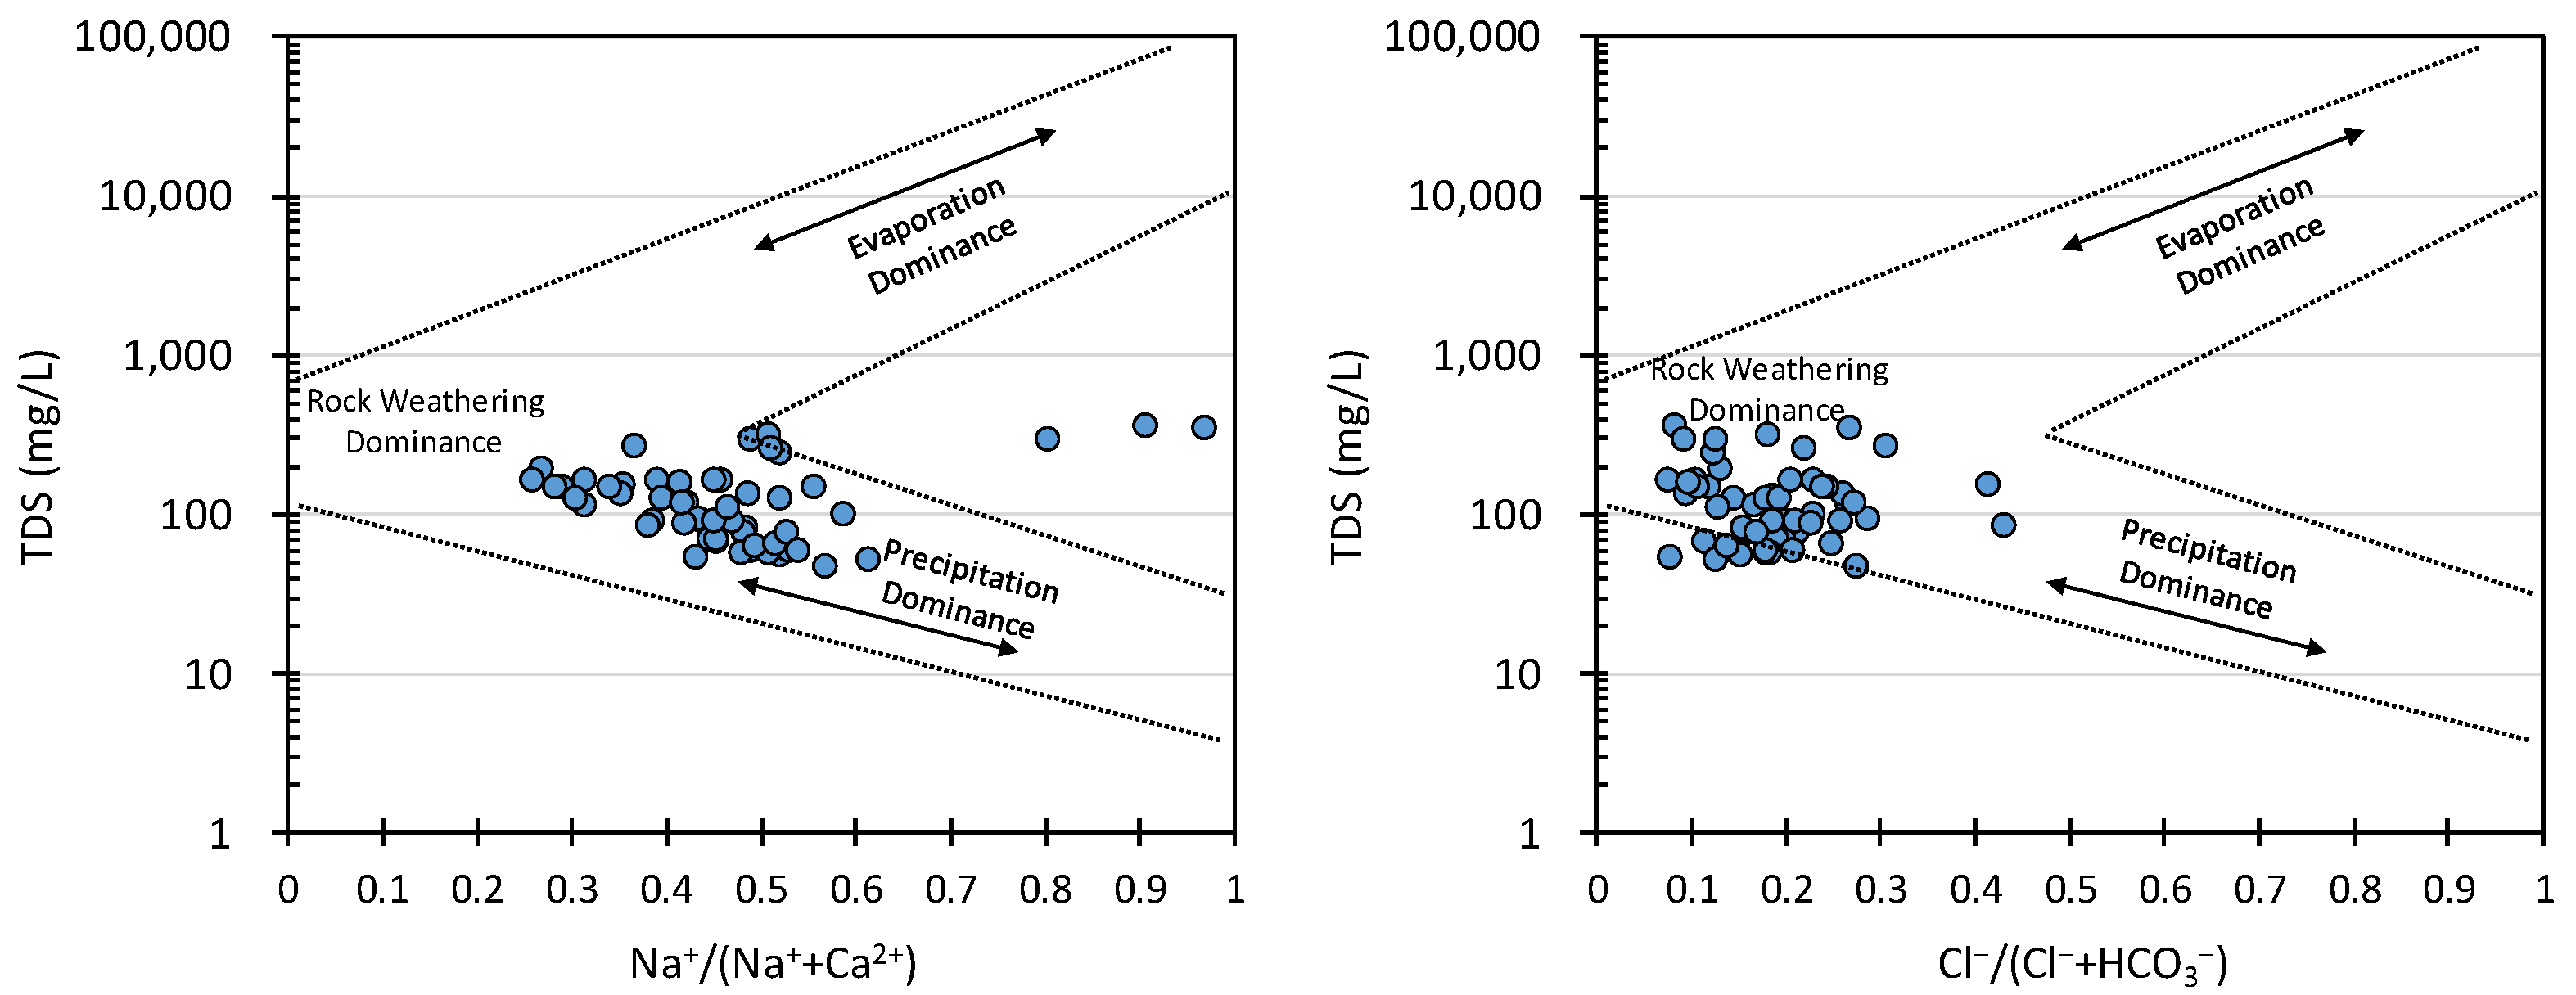
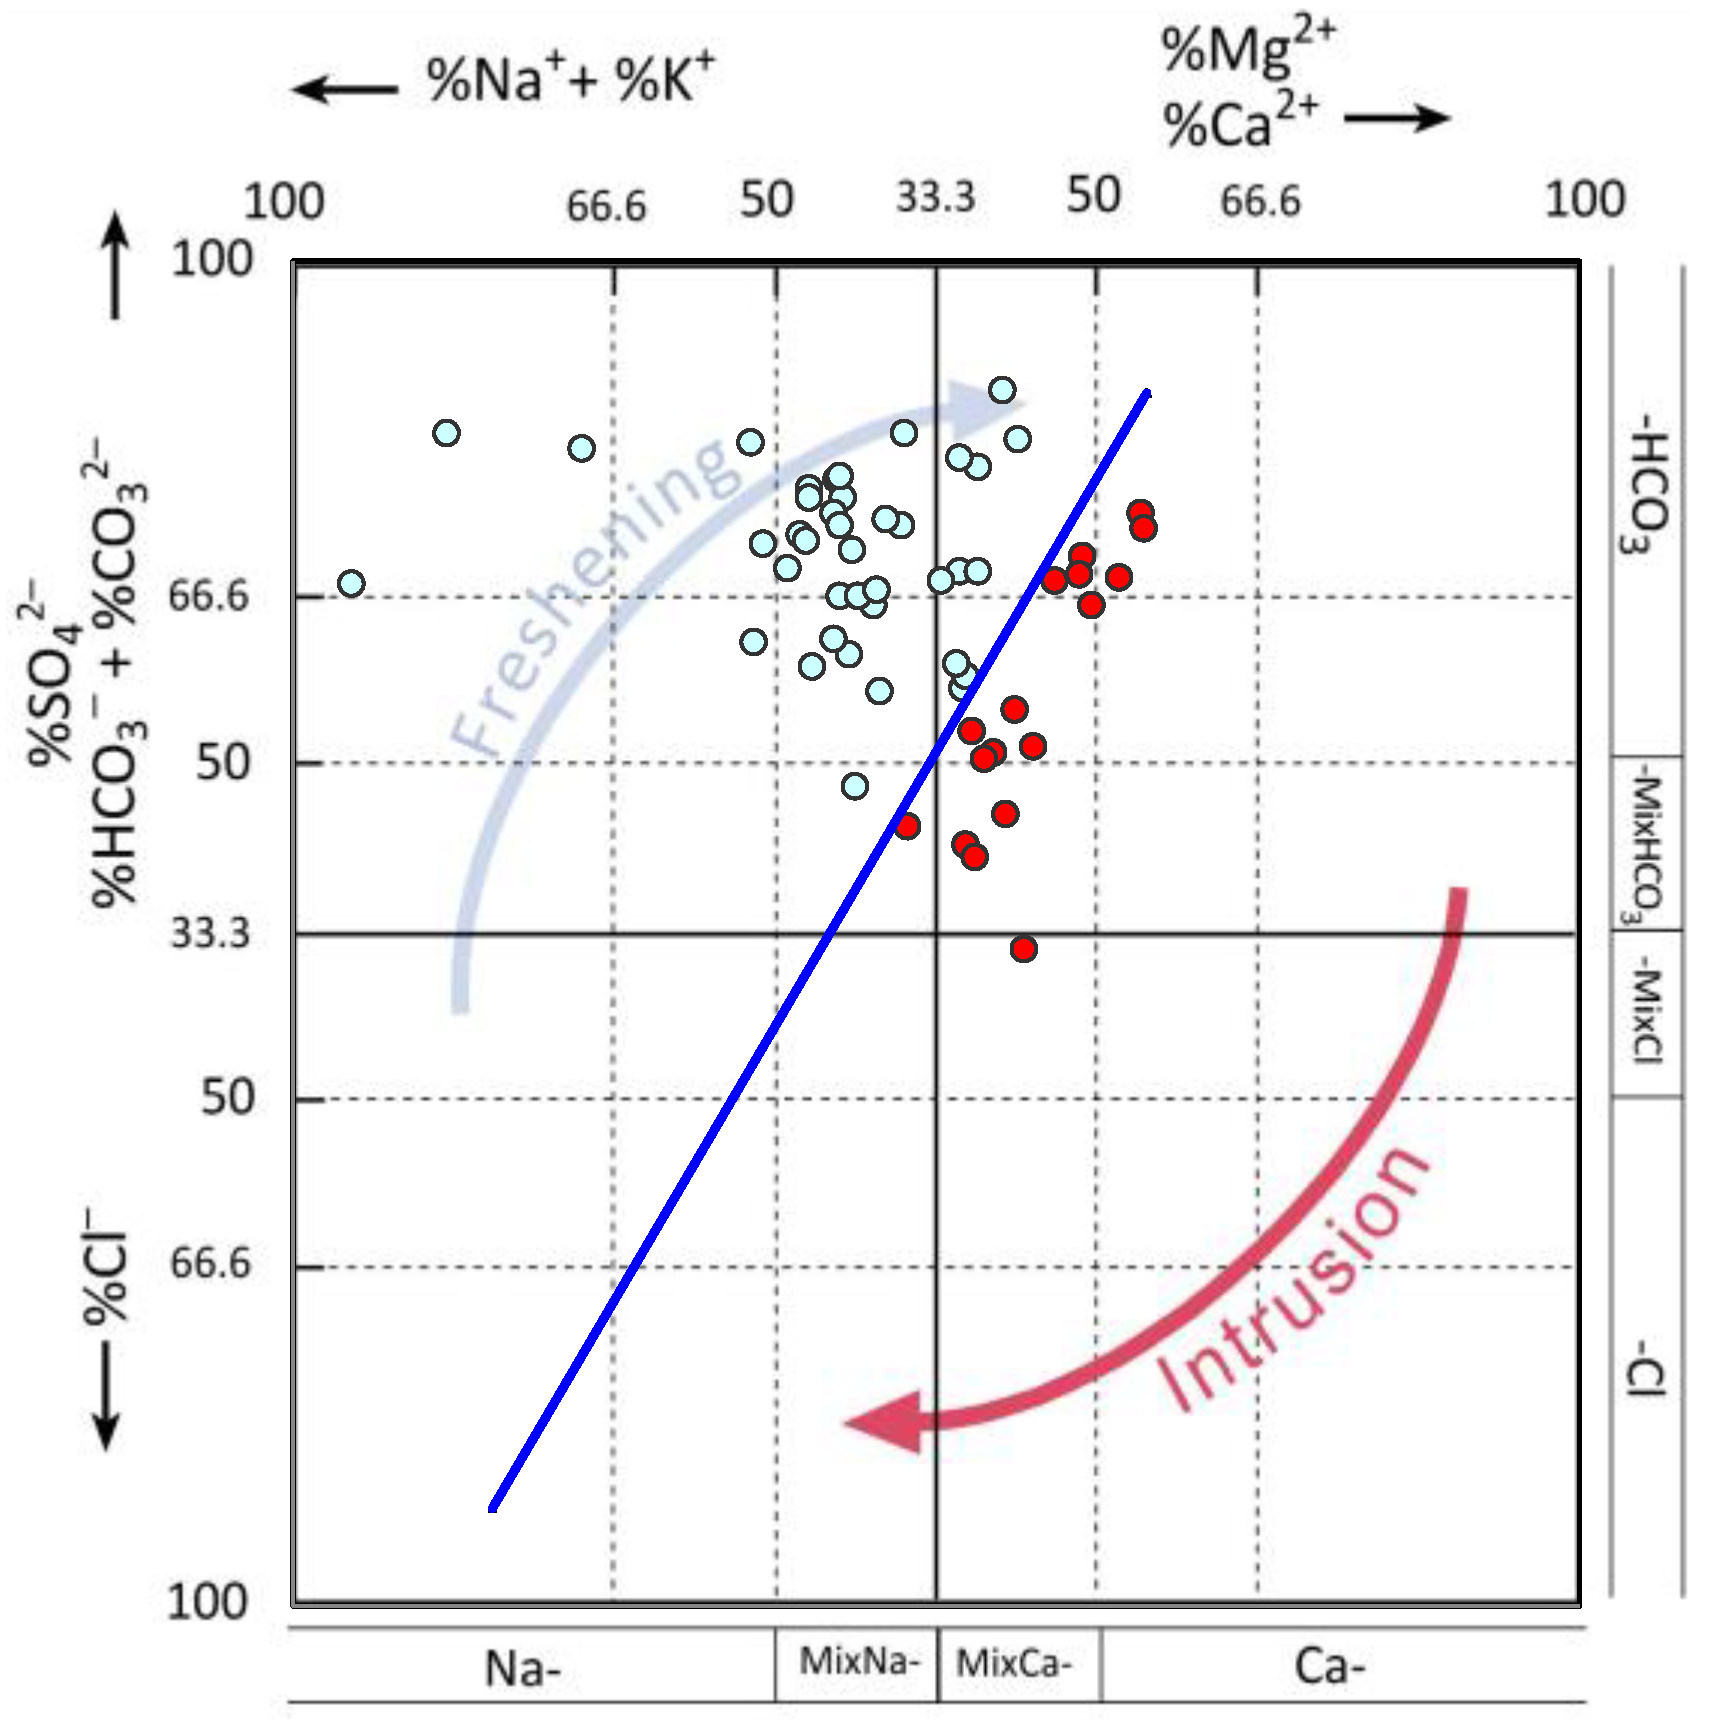
The concentration of major dissolved ions is visualized using Stiff diagram in Figure 6. Most of the samples represent the Ca-HCO3 type. The Ca-(SO4+NO3), Ca-SO4, Na-HCO3, and Mg-HCO3 types were observed in a small number of wells. Na-HCO3 and Mg-HCO3 were found in the coastal area and thus, have larger arrows than other samples. To decipher mechanisms controlling groundwater chemistry, Gibbs diagram [29,30,31] is shown in Figure 7. Gibbs diagram is described by the ratio of cation and anion endmembers (Na+/(Na+ + Ca2+)) and (Cl−/(Cl− + HCO3−)), respectively, as a function of TDS. This indicates the functional sources of dissolved chemical constituents, such as precipitation, rock weathering, or evaporation dominance. The diagram shows that most groundwater samples are affected by rock weathering processes, suggesting that longer residence time, large contribution of mineral dissolution, and the influence of ion exchange form water chemistry in the study area. A few samples were influenced by precipitation. The difference of these factors appears as the difference of ion concentrations and water type. The water samples in precipitation dominance have lower concentration. Higher concentrations and water types of Na-HCO3 and Mg-HCO3 are dominated by rock weathering processes. Influence of seawater was mainly found in the south part of Minami-Shimabara City [17], but no Na-Cl type samples were identified. Figure 8 shows the distribution of groundwater samples in the Hydrochemical Facies Evolution (HFE) diagram [32] by using Excel Macro [33]. HFE-diagram reveals that 70% of the groundwater samples correspond to freshening phase and 30% correspond to intrusion phase. Since the study area faces to the sea, it is assumed that groundwater samples, which is characterized by high concentration and ratio of Na+, such as MW42, MW43, and MW44 in the left upper corner of freshening phase, are affected by seawater intrusion.
The southern part of the city has little surface water and relies on groundwater for irrigation. However, as mentioned above, groundwater with high Na+ concentrations were observed. Therefore, the suitability of groundwater for irrigation was evaluated by plotting a USSL diagram (Figure 9). The USSL diagram is drawn based on the salinity (EC) and sodium hazard (Sodium Adsorption Ratio: SAR) [34]. The SAR is calculated by [34]:
where the concentrations of Na+, Ca2+, and Mg2+ are all expressed in mmolc/L. Most of the groundwater samples belong to C1-S1 (low salinity hazard and low sodium hazard) class or C2-S1 (medium salinity hazard and low sodium hazard). Only two samples (MW42 and MW43) were classified in the C2-S2 (medium salinity hazard and medium sodium hazard) class. The following is a summary of each class [34]. Low salinity water (C1) can be used for irrigation with most crops on most soils with little likelihood that soil salinity will develop. Some leaching is required, but this occurs under normal irrigation practices except in soils of extremely low permeability. Medium salinity water (C2) can be used if a moderate amount of leaching occurs. Plants with moderate salt tolerance can be grown in most cases without species practices for salinity control. Low salinity water (S1) can be used for irrigation on almost all soils with little danger of the development of harmful levels of exchangeable sodium. However, sodium sensitive crops, such as stone-fruit trees and avocados may accumulate harmful concentrations of sodium. Medium sodium water (S2) will present an appreciable sodium hazard in fine textured soils having high cation exchange capacity, especially under low leaching conditions, unless gypsum is present in the soil. Consequently, Figure 9 shows that groundwater in the study area can be used for irrigation, but attention must be paid to the use of groundwater belonging to the C2-S2 class. Further evaluation of water quality for irrigation was conducted based on Food and Agriculture Organization (FAO) guidelines [35] (Table 2). According to the FAO guidelines, although most of the groundwater samples has no potential irrigation problem, some samples have elevated EC, SAR, Na, NO3-N, and HCO3 or even potentially severe problem in view of SAR. In addition, some of the samples have a pH somewhat out of range. Therefore, caution should be exercised in some places when using groundwater. Since most tree crops and woody plants are sensitive to sodium [35], groundwater having high SAR should be avoided. These results are generally consistent with the caution given from the USSL diagram.
3.2. Nitrate Pollution
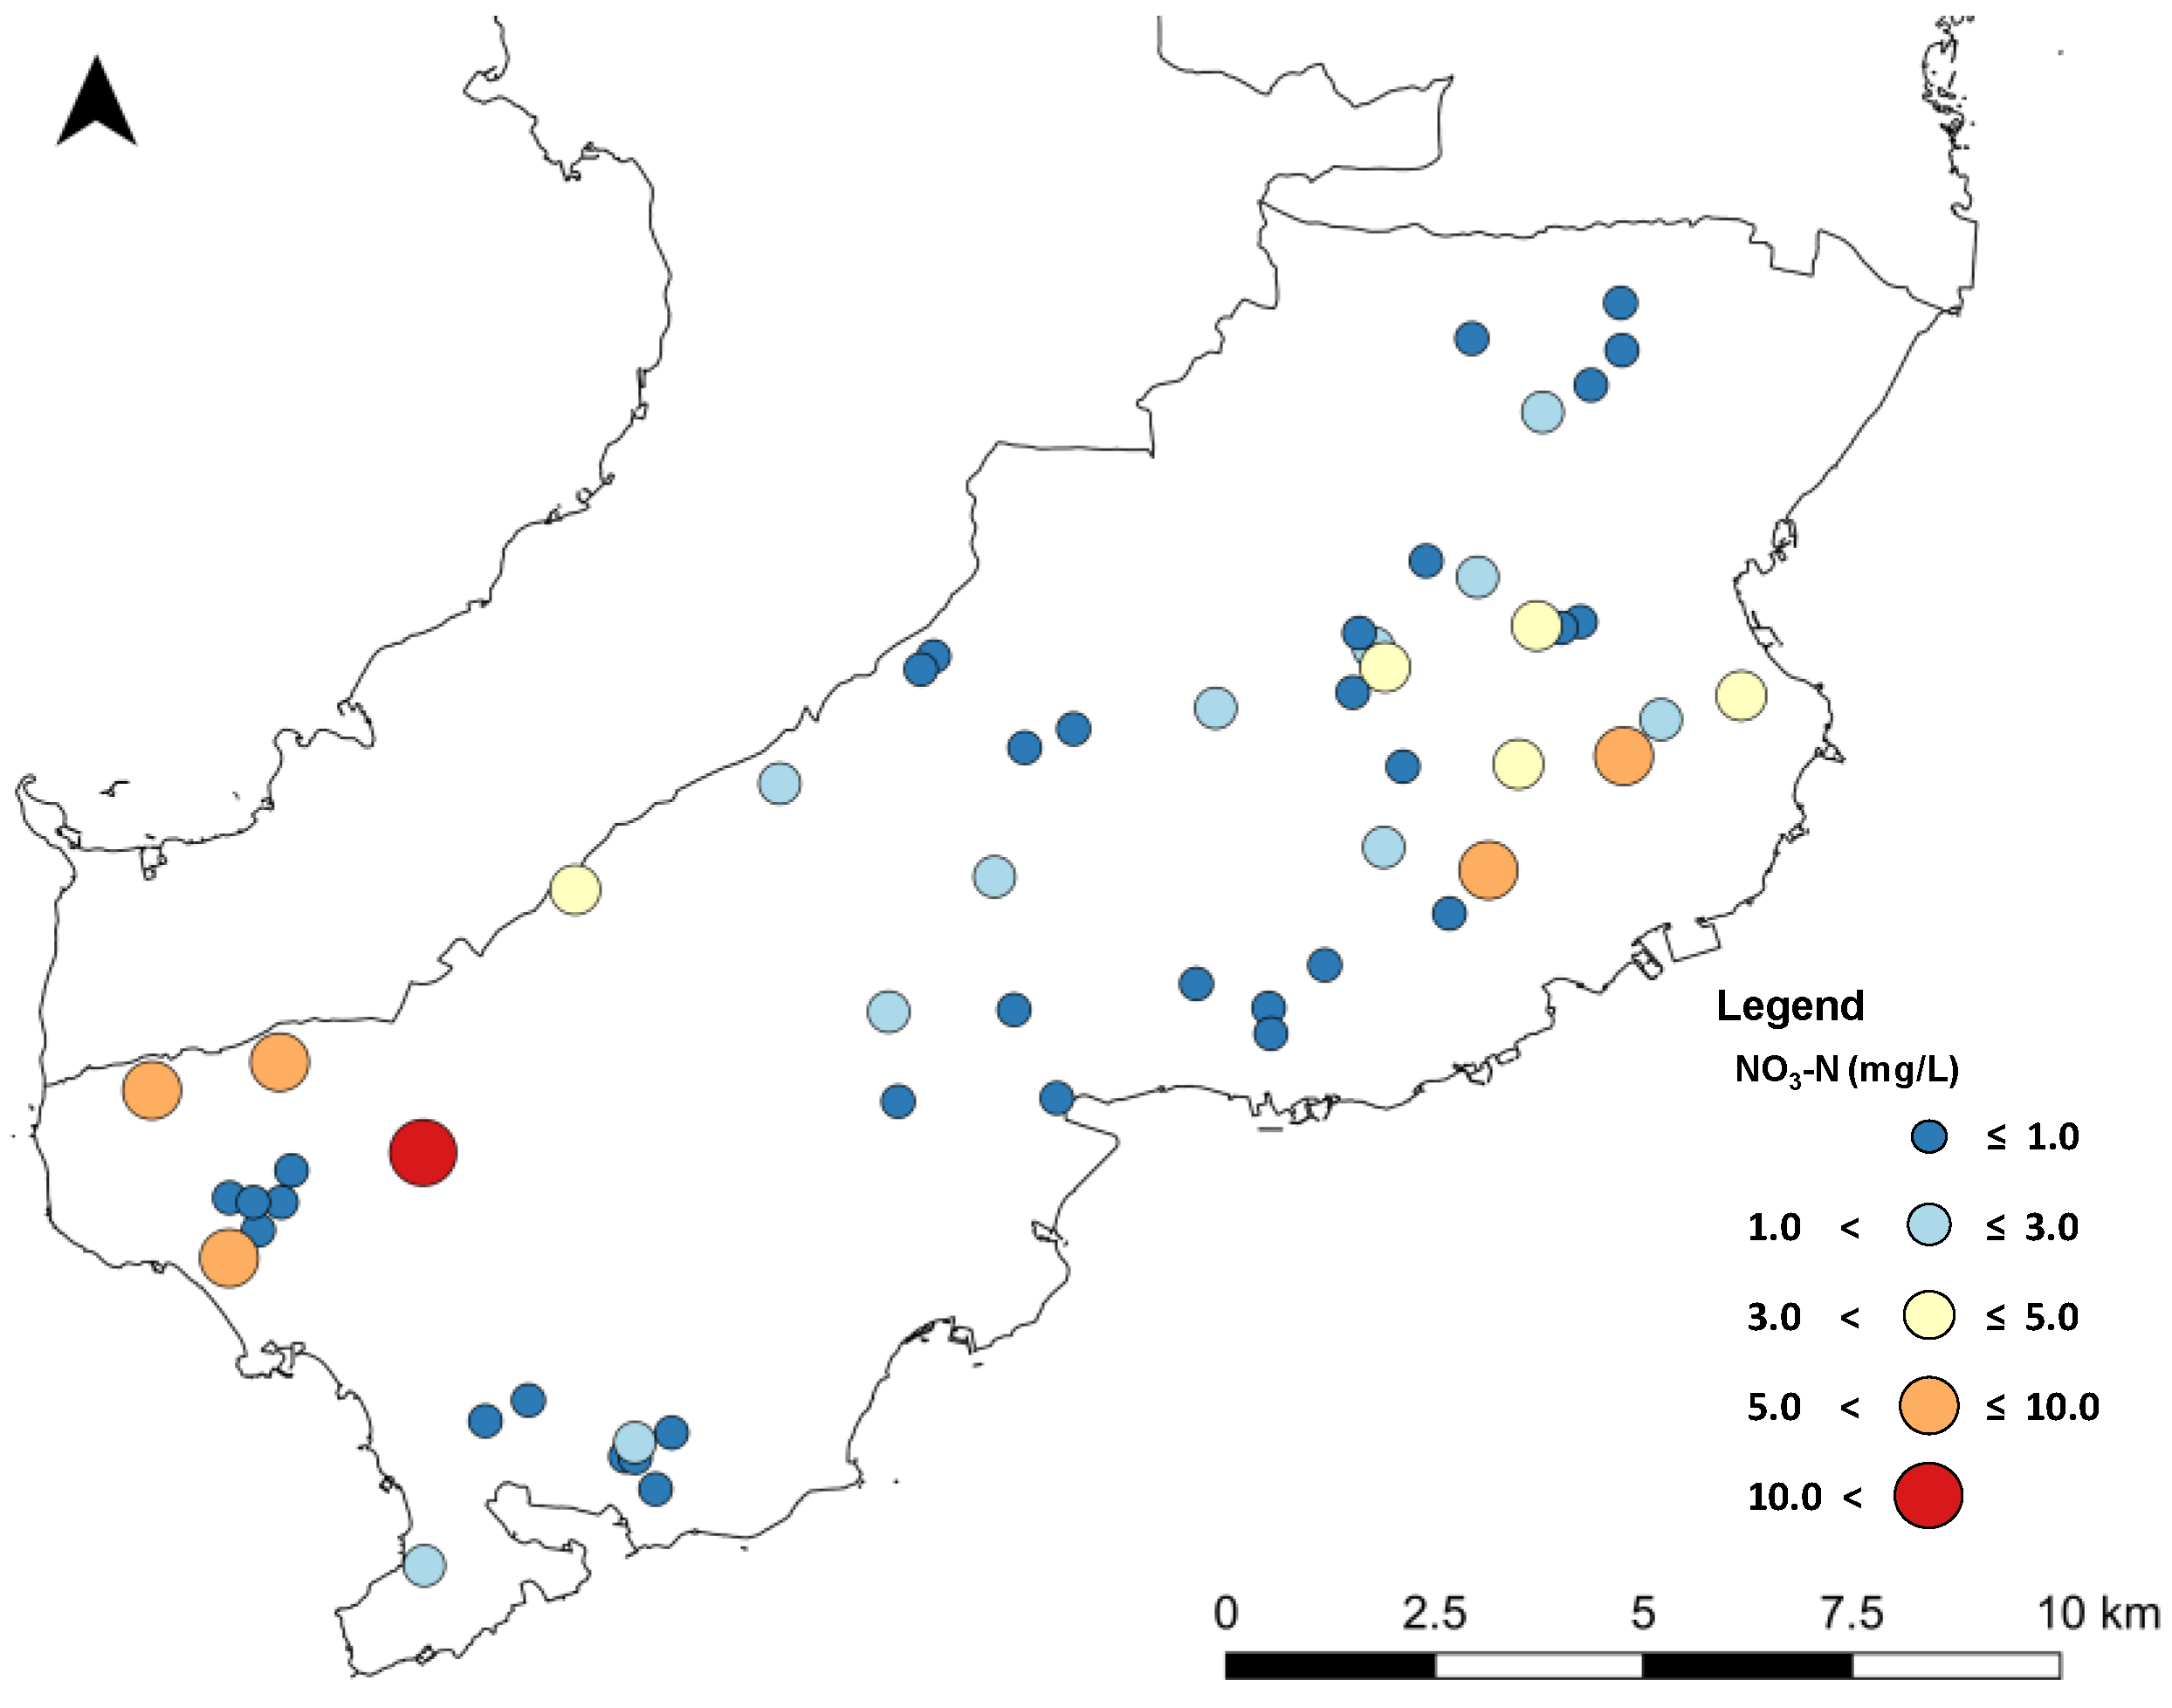
The nitrate (NO3-N) concentration ranged between 0.02 and 12.6 mg/L, with an average of 1.8 mg/L. The maximum concentration was found at MW39, the only point where NO3-N concentration exceeded the Japanese drinking water standard (10 mg/L). The drinking water standard of World Health Organization [36] for NO3− concentration (50 mg/L) was exceeded in one point. The maximum nitrate concentration in Shimabara City was 26.6 mg/L [8] and that in Unzen City 19.9 mg/L [11]. Compared to these values, the pollution level in Minami-Shimabara City is lower. Only one sampling point exceeded the standard limits for NO3-N concentration. This is lower than the 38% in Shimabara City [8] and the 12% in Unzen City [11]. Even if the standard limits were not exceeded, relatively high NO3-N concentrations were observed, e.g., 8.4 mg/L at MW49, 7.3 mg/L at MW53, and 6.5 mg/L at MW15. Nitrate can occur naturally, but nitrate concentrations greater than 1 mg/L are likely to indicate effects of human activities [37]. Under this criterion, 21 sampling points (38%: except for the smallest blue circle in Figure 10) can be considered polluted by nitrate. As mentioned above, denitrification may occur in the groundwater in this area, and it is considered that at some sampling points the nitrate concentration has decreased below 1 mg/L due to denitrification. Sampling points with nitrate concentration exceeding the criteria of 1.0 mg/L [37] were observed in the southwestern and eastern parts of the study area (Figure 10), and the land use here is upland agriculture (Figure 2). This suggests that nitrate pollution of groundwater in this area is related to agricultural activities.
Correlation among the eight major dissolved ion components is shown in Table 3. In the investigation of Shimabara and Unzen [8,11], NO3− showed a high positive correlation with Cl−, SO42−, and K+, suggesting that nitrate is derived from chemical fertilizers ((NH4)2SO4), manure, and livestock waste. However, in Minami-Shimabara, NO3− is not correlated with Cl−, SO42−, and K+. Focusing on Cl−, SO42−, and K+ concentrations in MW39, where NO3-N concentration exceeded the Japanese drinking water standard, the relationship is as follows: Cl− 16.9 mg/L > K+ 5.1 mg/L > SO42− 4.2 mg/L. For MW49 with NO3-N of 8.4 mg/L, which has the next highest NO3-N concentration, a relationship of Cl− 12.3 mg/L > K+ 6.4 mg/L > SO42− 2.7 mg/L was observed. The SO42− concentration at these points is similar to or lower than those at other points with low NO3-N concentration (Figure 6). At the sampling points where such a relationship between ion concentrations is found, SO42− concentration is low, and manure and/or livestock waste are supposed to be a dominant nitrate source. Analysis of stable nitrogen oxygen isotopes NO3− is required for a more valid assessment of the nitrate source.
3.3. Multivariate Analysis
A principal component analysis summarized the 12 hydrochemical parameters into three principal components based on the Kaiser index (Table 4). The eigenvalues of principal component 1 (PC1), 2 (PC2), and 3 (PC3) were 5.64, 1.92, and 1.33, respectively. These explained 46.9%, 16.0%, and 11.1%, respectively, of the total variance. PC1 had positive loadings for EC and all ions except NO3− and K+, indicating that it is related to dissolved constituents controlled by rock weathering and precipitation. The negative loadings of ORP and DO in PC1 are related to denitrification. PC2 had positive loadings for Ca2+ and negative loadings for Na+, implying ion exchange. The positive loading of NO3− in PC2 represents lower nitrate pollution exceeding the criteria of 1.0 mg/L indicating effects of human activities. PC3 had positive loadings for Cl− and NO3−, indicating relatively severe nitrate pollution including the exceedance of standard limits.
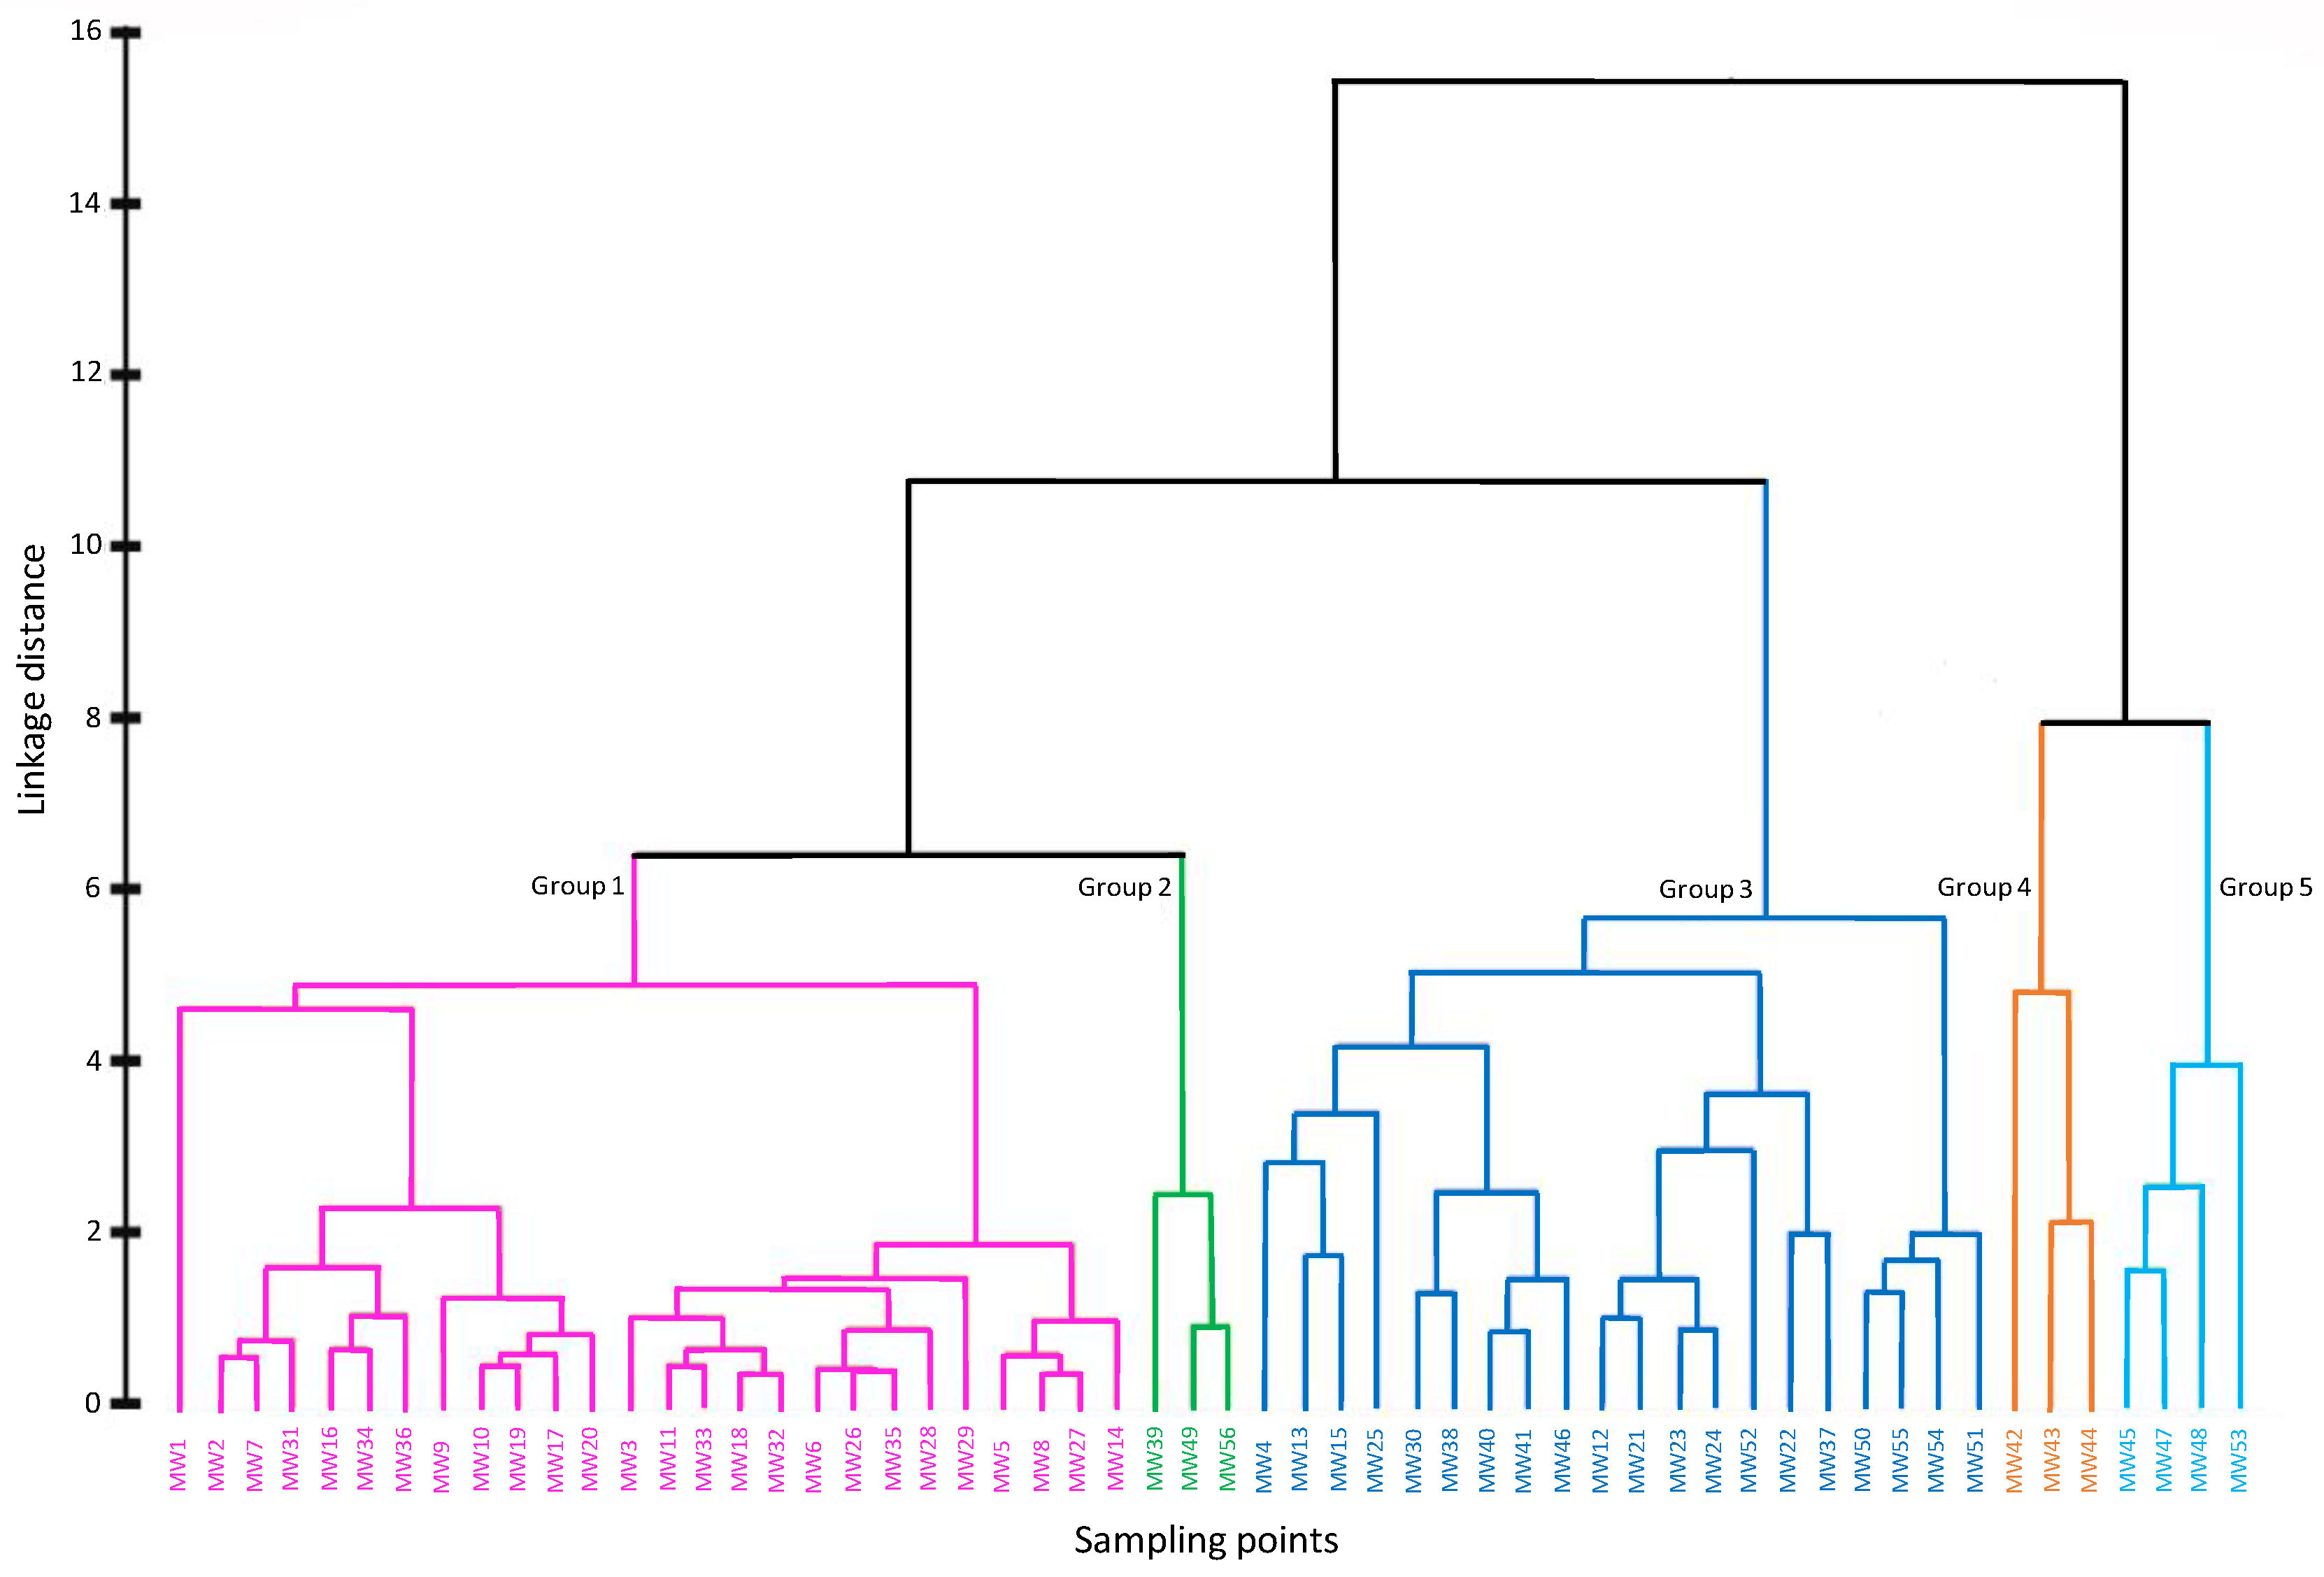
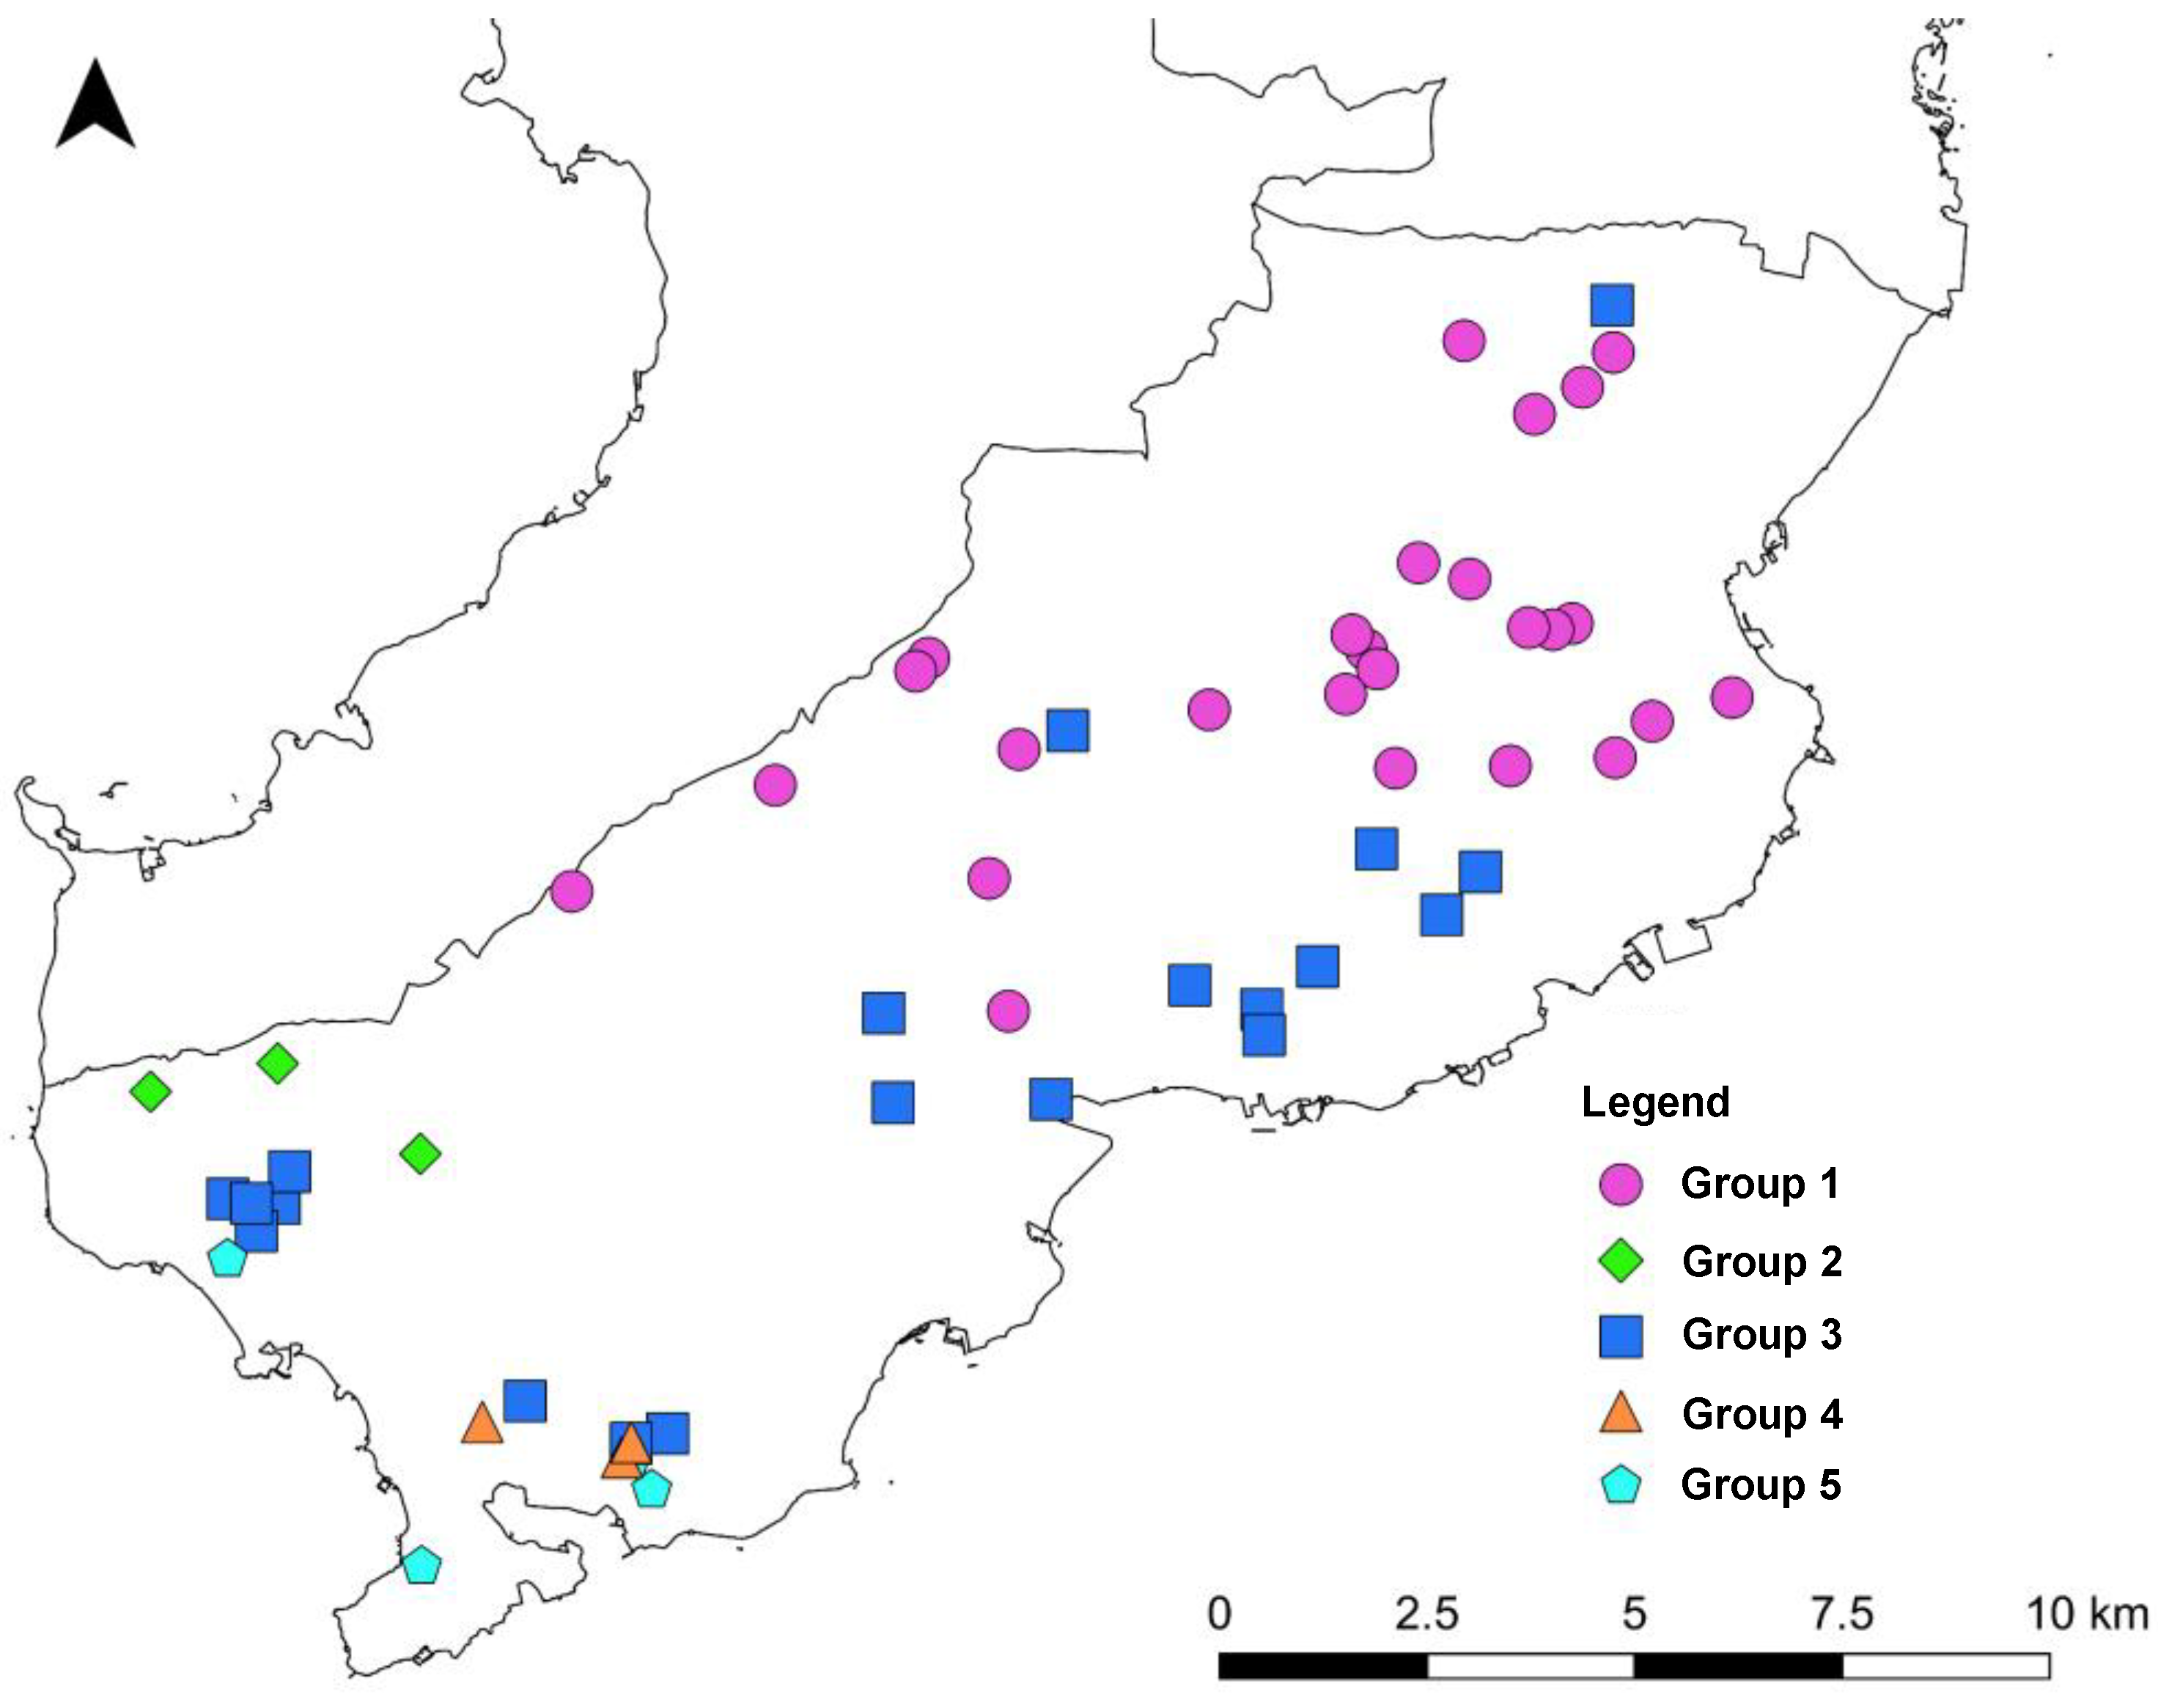
Results of the HCA are shown in Table 5 and Figure 11. The 56 groundwater samples were classified into five groups, with the number of samples in each group ranging from 3 to 26. Figure 12 shows the scatter plot of the principal components related to groups. PC1 effectively separated groups, meaning that dissolved constituents are different for each group. Group 1 shows relatively low scores for PC1, indicating lower dissolved constituents. Mainly the sampling points indicated by smaller Stiff diagrams in Figure 6 are contained in this group. Group 1 is distributed from the center to east in the study area. Group 2 and 3 has similar scores of PC1 and PC2, representing intermediate ion concentrations. However these groups are be distinguished by PC3, meaning that nitrate pollution level are different for these groups. As shown in Table 5, water samples having higher NO3− concentrations were classified into Group 2. The difference between Group 2 and 3 is characterized by difference in locality (Figure 13). Group 2 is located in the western part of study area, while Group 3 is mainly located at lower altitude along the coastal line. PC1 and PC3 of Group 4 is similar to that of Group 5, but these groups are clearly distinguished by PC2. In other words, Group 4 has relatively high negative scores for PC2, indicating negative effects of ion exchange, and anthropogenic activities. Group 4 is associated with deep groundwater with high concentrations of sodium and bicarbonate ions (Table 5). The five groups can be generally summarized in three categories.PC1 and Figure 11 show that Group 4 and 5, which are characterized by high ion concentration especially Na+ and HCO3−, are different from the other groups. Based on overall ion concentration including nitrate, the remaining groups can be categorized by either intermediate ion concentration (Group 3) or lower ion concentration (Group 1 and 2).
4. Conclusions
To improve the understanding of cause and effects of nitrate pollution and hydrochemical characteristics of groundwater in the Shimabara Peninsula, groundwater samples were collected from 56 municipal wells in Minami-Shimabara City. Major dissolved ions and pH, EC, ORP, and DO were analyzed. The ORP and DO values suggested that denitrification may be responsible for decreasing nitrate concentrations. The major groundwater composition was Ca-HCO3 type. In addition, Na-HCO3, Mg-HCO3, and Ca-(SO4+NO3) types were also observed at a few locations. This water chemistry is formed by rock weathering, precipitation, and mixing with saltwater from seawater intrusion. NO3-N concentrations exceeded Japanese drinking water standards (10 mg/L) at one location. The pollution is related to agricultural land use. The high Cl− and low SO42+ concentrations at this point suggest that the pollution source is manure and/or livestock waste. PCA showed that processes controlling water chemistry are explained by three principal components: PC1 corresponds to dissolved constituents in groundwater and denitrification, PC2 represents ion exchange and low nitrate pollution, and PC3 represents severe nitrate pollution. HCA classified the 56 water samples 5 five groups. These can be broadly divided into 3 categories: the first characterized by high ion concentration especially in Na+ and HCO3− (Group 4 and 5); the second representing the intermediate ion concentration group (Group 3), and the third with low ion concentration (Group 1 and 2).
The study revealed that the extent of nitrate pollution in Minami-Shimabara City is small. In other words, NO3-N concentrations are lower than in Shimabara and Unzen Cities, and the percentage of NO3-N exceeding the standard limits is also small. The sampling campaign was between July and August when rainfall amount was large. In the investigations conducted during this period, a decrease in nitrate concentration was observed in Shimabara City due to dilution caused by rainfall [8,10]. Therefore, future surveys are needed at different seasons. It is also necessary to introduce analysis of nitrogen oxygen stable isotopes of NO3− to clarify the nitrate source.
Since this study found high Na+ concentrations in some wells, we additionally evaluated the suitability of groundwater for agricultural use. Groundwater was evaluated using the USSL diagram and FAO guideline. In some places, due to high EC, SAR, Na, NO3-N, HCO3, and pH, caution is necessary when using groundwater for irrigation. In addition, groundwater with high SAR should not be used for some types of crop species. In Minami-Shimabara City, agricultural wells have been installed in addition to the municipal wells that were investigated in this study. Since groundwater is affected by seawater in some areas [17], it is necessary to collect groundwater samples for agricultural wells to evaluate their suitability for agricultural production.
Author Contributions
Conceptualization, methodology, supervision, K.N.; investigation, K.N. and Z.-Q.Y.; formal analysis, data curation, H.A., K.N. and Z.-Q.Y.; writing—original draft preparation, K.N. and H.A.; writing—review and editing, K.N. and R.B.; funding acquisition, K.N. All authors have read and agreed to the published version of the manuscript.
Funding
This work was supported by JSPS KAKENHI Grant Number JP20K12209.
Institutional Review Board Statement
Not applicable.
Informed Consent Statement
Not applicable.
Data Availability Statement
The data presented in this study are available on request from the corresponding author.
Acknowledgments
The authors thank the Water Works Bureau of Minami-Shimabara City for support of the water sampling.
Conflicts of Interest
The authors declare no conflict of interest.
References
- Current Status of Groundwater Utilization. Available online: https://www.mlit.go.jp/mizukokudo/mizsei/mizukokudo_mizsei_tk1_000062.html (accessed on 12 October 2022).
- Groundwater Quality Measurement Results for FY2022. Available online: https://www.env.go.jp/water/report/r03-03/post_3.html (accessed on 12 October 2022).
- Kuroda, K.; Fukushi, T. Groundwater Contamination in Urban Areas. In Groundwater Management in Asian Cities; Takizawa, S., Ed.; Springer: Tokyo, Japan, 2008; pp. 125–149. [Google Scholar]
- Fuoco, I.; Marini, L.; De Rosa, R.; Figoli, A.; Gabriele, B.; Apollaro, C. Use of reaction path modelling to investigate the evolution of water chemistry in shallow to deep crystalline aquifers with a special focus on fluoride. Sci. Total Environ. 2022, 830, 154566. [Google Scholar] [CrossRef] [PubMed]
- Fuoco, I.; De Rosa, R.; Barca, D.; Figoli, A.; Gabriele, B.; Apollaro, C. Arsenic polluted waters: Application of geochemical modelling as a tool to understand the release and fate of the pollutant in crystalline aquifers. J. Environ. Manag. 2022, 301, 113796. [Google Scholar] [CrossRef] [PubMed]
- Shimabara Area Peninsula Development Plan. Available online: https://www.mlit.go.jp/common/001124224.pdf (accessed on 15 October 2022).
- The Second Term of Shimabara Peninsula Nitrate Load Reduction Project, Revised Edition in FY2020. Available online: https://www.pref.nagasaki.jp/shared/uploads/2021/04/1617338157.pdf (accessed on 12 October 2022).
- Nakagawa, K.; Amano, H.; Asakura, H.; Berndtsson, R. Spatial trends of nitrate pollution and groundwater chemistry in Shimabara, Nagasaki, Japan. Environ. Earth. Sci. 2016, 75, 234. [Google Scholar] [CrossRef] [Green Version]
- Amano, H.; Nakagawa, K.; Berndtsson, R. Groundwater geochemistry and nitrate-contaminated agricultural site. Environ. Earth. Sci. 2016, 75, 1145. [Google Scholar] [CrossRef] [Green Version]
- Nakagawa, K.; Amano, H.; Persson, M.; Berndtsson, R. Spatiotemporal variation of nitrate concentrations in soi and groundwater of an intensely polluted agricultural area. Sci. Rep. 2021, 11, 2598. [Google Scholar] [CrossRef] [PubMed]
- Nakagawa, K.; Amano, H.; Berndtsson, R. Spatiotemporal characteristics of groundwater chemistry in Unzen, Nagasaki, Japan. Water 2021, 13, 426. [Google Scholar] [CrossRef]
- Minami-Shimabara City Waterworks Business Management Strategy Development Outsourcing. Available online: https://www.city.minamishimabara.lg.jp/common/UploadFileOutput.ashx?c_id=3&id=6250&sub_id=6&flid=32496 (accessed on 15 October 2022).
- Vegetation Survey 1/25,000. Available online: http://gis.biodic.go.jp/webgis/sc-025.html?kind=vg67 (accessed on 17 October 2022).
- Agriculture, Forestry, and Fisheries in Graphs and Statistics. Available online: http://www.machimura.maff.go.jp/machi/contents/42/214/details.html (accessed on 15 October 2022).
- Seamless Digital Geological Map of Japan V2 1: 200,000. Available online: https://gbank.gsj.jp/seamless/ (accessed on 19 October 2022).
- Sugimoto, T. Geology and petrology at Shimabara Peninsula, Kyushu, Japan -From recent results-. J. Geotherm. Res. Soc. Jpn. 2006, 28, 347–360. [Google Scholar]
- Murakami, T. 1:50,000 Hydrogeological Maps of Japan Shimabara Peninsula, No.25; Geological Survey of Japan: Kawasaki, Japan, 1975; Available online: https://www.gsj.jp/Map/EN/environment.html (accessed on 31 October 2022). (In Japanese)
- Past Weather Data. Available online: https://www.data.jma.go.jp/obd/stats/etrn/index.php?prec_no=84&block_no=0922&year=&month=&day=&view= (accessed on 17 October 2022).
- Rahman, A.; Mondal, N.C.; Tiwari, K.K. Anthropogenic nitrate in groundwater and its health risks in the view of background concentration in a semi arid area of Rajasthan, India. Sci. Rep. 2021, 11, 9279. [Google Scholar] [CrossRef] [PubMed]
- Chotpantarat, S.; Parkchai, T.; Wisitthammasri, W. Multivariate statistical analysis of hydrochemical data and stable isotopes of groundwater contaminated with nitrate at Huay Sai royal development study center and adjacent areas in Phetchaburi province, Thailand. Water 2020, 12, 1127. [Google Scholar] [CrossRef] [Green Version]
- Zainol, N.F.M.; Zainuddin, A.H.; Looi, L.J.; Aris, A.Z.; Isa, N.M.; Sefie, A.; Yusof, K.M.K.K. Spatial Analysis of Groundwater Hydrochemistry through Integrated Multivariate Analysis: A Case Study in the Urbanized Langat Basin, Malaysia. Int. J. Environ. Public Health 2021, 18, 5733. [Google Scholar] [CrossRef] [PubMed]
- El-Kholy, R.A.; Zaghlool, E.; Isawi, H.; Soliman, E.A.; Khalil, M.M.H.; El-Aassar, A.-H.M.; Said, M.M. Groundwater quality assessment using water quality index and multivariate statistical analysis case study: East Matrouh, Northwestern coast, Egypt. Environ. Sci. Poll. Res. 2022, 29, 65699–65722. [Google Scholar] [CrossRef] [PubMed]
- Kanellopoulos, C.; Argyraki, A. Multivariate statistical assessment of groundwater in cases with ultramafic rocks and anthropogenic activities influence. Appl. Geochem. 2022, 141, 105292. [Google Scholar] [CrossRef]
- Wali, S.U.; Alias, N.B.; Harun, S.B.; Umar, K.J.; Gada, M.A.; Dankani, I.M.; Kaoje, I.U.; Usman, A.A. Water quality indices and multivariate statistical analysis of urban groundwater in semi-arid Sokoto Basin, Northwestern Nigeria. Groundw. Sustain. Dev. 2022, 18, 100779. [Google Scholar] [CrossRef]
- Oxidant/Reduction (Redox). Available online: https://www.usgs.gov/mission-areas/water-resources/science/oxidationreduction-redox (accessed on 28 October 2022).
- Gillham, R.W.; Cherry, J.A. Field Evidence of Denitrification in Shallow Groundwater Flow System. Water Qual. Res. J. 1978, 13, 53–72. [Google Scholar] [CrossRef]
- Evangelou, V.P. Environmental Soil and Water Chemistry: Principles and Applications; John Wiley and Sons: New York, NY, USA, 1998; pp. 80–82. [Google Scholar]
- Apollaro, C.; Tripodi, V.; Vespasiano, G.; De Rosa, R.; Dotsika, E.; Fuoco, I.; Critelli, S.; Muto, F. Chemical, isotopic and geotectonic relations of the warm and cold waters of the Galatro and Antonimina thermal areas, southern Calabria, Italy. Mar. Pet. Geol. 2019, 109, 469–483. [Google Scholar] [CrossRef]
- Gibbs, R.J. Mechanisms Controlling World Water Chemistry. Science 1970, 170, 1088–1090. [Google Scholar] [CrossRef] [PubMed]
- Elango, L.; Kannan, R. Rock–water interaction and its control on chemical composition of groundwater. Dev. Environ. Sci. 2007, 5, 229–243. [Google Scholar]
- Mohamed, A.; Asmoay, A.; Alshehri, F.; Abdelrady, A.; Othman, A. Hydro-Geochemical Applications and Multivariate Analysis to Assess the Water–Rock Interaction in Arid Environments. Water 2022, 12, 6340. [Google Scholar] [CrossRef]
- Giménez-Forcada, E. Dynamic of Sea Water Interface using Hydrochemical Facies Evolution Diagram. Groundwater 2010, 48, 212–216. [Google Scholar] [CrossRef] [PubMed]
- Giménez-Forcada, E.; Sánchez San Román, F.J. An Excel Macro to Plot the HFE-Diagram to Identify Sea Water Intrusion Phases. Groundwater 2015, 53, 819–824. [Google Scholar] [CrossRef] [PubMed]
- U.S. Salinity Laboratory Staff. Diagnosis and Improvement of Saline and Alkali Soils; Agricultural Handbook No.60.; U.S. Government Printing Office: Washington, DC, USA, 1954; 160p. [Google Scholar]
- Ayers, R.S.; Westcot, D.W. Water Quality for Agriculture; Food and Agriculture Organization of the United Nations: Rome, Italy, 1985; pp. 6–11. [Google Scholar]
- World Health Organization. Guidelines for Drinking-Water Quality; Fourth Edition Incorporating the First and Second Addenda; World Health Organization: Geneva, Switzerland, 2022; pp. 438–444. [Google Scholar]
- Dubrovsky, N.M.; Burow, K.R.; Clark, G.M.; Gronberg, J.M.; Hamilton, P.A.; Hitt, K.J.; Mueller, D.K.; Munn, M.D.; Nolan, B.T.; Puckett, L.J.; et al. The Quality of Our Nation’s Waters—Nutrients in the Nation’s Streams and Groundwater, 1992–2004; U.S. Geological Survey Circular 1350.; U.S. Geological Survey: Reston, VA, USA, 2010; 174p. [Google Scholar]
Figure 1.
Study area and groundwater sampling locations in the Minami-Shimabara City.

Figure 2.
Land use and geology, (a) vegetation, (b) geology, (c) hydrogeology; (Pyfl) Pyroclastic flow. Vegetation map is based on data collected by Biodiversity Center of Japan [13]. Geological map 1/200,000 scale is based on data collected by Geological Survey of Japan [15]. Hydrogeological map is based on the groundwater investigation by Murakami [17].

Figure 3.
Box plots of hydrochemical components of groundwater samples. A circle is a far outlier. Starred point is a “far out” outlier.
Figure 3.
Box plots of hydrochemical components of groundwater samples. A circle is a far outlier. Starred point is a “far out” outlier.

Figure 4.
Trilinear Piper diagram of groundwater in Minami-Shimabara City.

Figure 5.
Total Ionic Salinity of groundwater in Minami-Shimabara City.

Figure 6.
Major ion variation in Minami-Shimabara City groundwater using Stiff diagrams.

Figure 7.
Gibbs diagram of groundwater in Minami-Shimabara City.

Figure 8.
Hydrochemical Facies Evolution (HFE) of groundwater in Minami-Shimabara City.

Figure 9.
USSL diagram based on EC and SAR.

Figure 10.
Distribution of nitrate concentration in groundwater.

Figure 11.
Dendrogram for groundwater samples divided into five groups.

Figure 12.
Scatter plots for PC1, PC2, and PC3.

Figure 13.
Spatial location of each group.


Table 1.
Descriptive statistics of hydrochemical components of groundwater samples.
| Cl− | NO3− | SO42− | HCO3− | Na+ | K+ | Mg2+ | Ca2+ | pH | EC | ORP | DO | |
|---|---|---|---|---|---|---|---|---|---|---|---|---|
| mg/L | mg/L | mg/L | mg/L | mg/L | mg/L | mg/L | mg/L | µS/cm | mV | mg/L | ||
| Min | 3.3 | 0.1 | 1.4 | 11.4 | 6.3 | 3.1 | 1.6 | 3.9 | 6.3 | 74 | −21 | 1.7 |
| Max | 49.2 | 55.7 | 43.5 | 299.7 | 134.3 | 7.5 | 18.2 | 37.0 | 8.7 | 563 | 738 | 10.2 |
| Mean | 10.0 | 7.9 | 12.7 | 81.5 | 17.9 | 4.9 | 6.3 | 14.6 | 7.4 | 210 | 235 | 6.8 |
| S.D. 1 | 7.7 | 11.2 | 11.2 | 60.3 | 23.8 | 1.0 | 4.0 | 8.7 | 0.5 | 126 | 106 | 2.5 |
Note: 1 S.D. = standard deviation.
Table 2.
Guidelines for interpretations of water quality for irrigation.
| Unit | Degree of Restriction on Use | |||
|---|---|---|---|---|
| None | Slight to Moderate | Severe | ||
| EC | dS/m | <0.7 | 0.7–3.0 | >3.0 |
| TDS | mg/L | <450 | 450–2000 | >2000 |
| Na (surface irrigation) | SAR | <3 | 3–9 | >9 |
| Na (sprinkler irrigation) | meq/L | <3 | >3 | |
| Cl (surface irrigation) | meq/L | <4 | 4–10 | >10 |
| Cl (sprinkler irrigation) | meq/L | <3 | >3 | |
| NO3-N | mg/L | <5 | 5–30 | >30 |
| HCO3 | meq/L | <1.5 | 1.5–8.5 | >8.5 |
| pH | Normal range 6.5–8.4 | |||
Table 3.
Correlation matrix for eight dissolved ions (n = 56).
| Cl− | NO3− | SO42− | HCO3− | Na+ | K+ | Mg2+ | Ca2+ | |
|---|---|---|---|---|---|---|---|---|
| Cl− | 1.00 | 0.15 | 0.50 | 0.65 | 0.74 | −0.10 | 0.52 | 0.39 |
| NO3− | - | 1.00 | −0.05 | −0.26 | −0.13 | 0.24 | 0.14 | 0.10 |
| SO42− | - | - | 1.00 | 0.57 | 0.38 | 0.12 | 0.71 | 0.72 |
| HCO3− | - | - | - | 1.00 | 0.84 | 0.07 | 0.56 | 0.52 |
| Na+ | - | - | - | - | 1.00 | −0.10 | 0.19 | 0.10 |
| K+ | - | - | - | - | - | 1.00 | 0.20 | 0.32 |
| Mg2+ | - | - | - | - | - | - | 1.00 | 0.83 |
| Ca2+ | - | - | - | - | - | - | - | 1.00 |
Table 4.
Relationship between extracted principal components (PCs) and ions.
| PC 1 | PC 2 | PC 3 | |
|---|---|---|---|
| Cl− | 0.770 | −0.213 | 0.337 |
| NO3− | −0.083 | 0.421 | 0.775 |
| SO42− | 0.793 | 0.278 | −0.093 |
| HCO3− | 0.903 | −0.267 | 0.006 |
| Na+ | 0.708 | −0.599 | 0.235 |
| K+ | 0.104 | 0.543 | 0.286 |
| Mg2+ | 0.716 | 0.548 | −0.002 |
| Ca2+ | 0.773 | 0.508 | −0.029 |
| pH | 0.430 | −0.560 | 0.227 |
| EC | 0.969 | −0.082 | 0.182 |
| ORP | −0.518 | −0.113 | 0.435 |
| DO | −0.755 | −0.084 | 0.447 |
| Eigenvalue | 5.64 | 1.92 | 1.33 |
| Explained variance % | 46.9 | 16.0 | 11.1 |
| Cumulative % of variance | 46.9 | 62.9 | 74.0 |
Table 5.
Hydrochemical component depending on each group.
| Samples | Cl− | NO3− | SO42− | HCO3− | Na+ | K+ | Mg2+ | Ca2+ | NO3-N | pH | EC | ORP | DO | ||
|---|---|---|---|---|---|---|---|---|---|---|---|---|---|---|---|
| mg/L | mg/L | mg/L | mg/L | mg/L | mg/L | mg/L | mg/L | mg/L | µS/cm | mV | mg/L | ||||
| Group 1 | 26 | Min | 3.3 | 0.1 | 1.4 | 23.2 | 6.3 | 3.1 | 1.6 | 4.2 | 0.0 | 6.8 | 74 | 242 | 7.2 |
| Max | 12.1 | 26.1 | 17.9 | 97.5 | 15.6 | 6.1 | 6.4 | 14.7 | 5.9 | 7.9 | 190 | 738 | 10.1 | ||
| Mean | 5.9 | 7.4 | 4.3 | 44.4 | 8.7 | 4.7 | 3.5 | 8.2 | 1.7 | 7.3 | 116 | 287 | 8.8 | ||
| S.D. | 1.9 | 7.4 | 3.2 | 13.7 | 2.0 | 0.8 | 1.2 | 2.6 | 1.7 | 0.2 | 29 | 93 | 0.7 | ||
| Group 2 | 3 | Min | 10.9 | 28.6 | 2.2 | 41.3 | 11.6 | 5.1 | 5.7 | 14.2 | 6.5 | 7.0 | 187 | 201 | 7.3 |
| Max | 16.9 | 55.7 | 4.2 | 65.7 | 11.7 | 6.4 | 7.4 | 19.9 | 12.6 | 7.4 | 241 | 287 | 10.2 | ||
| Mean | 13.4 | 40.5 | 3.0 | 52.5 | 11.7 | 5.8 | 6.8 | 17.6 | 9.2 | 7.3 | 222 | 230 | 8.5 | ||
| S.D. | 3.1 | 13.8 | 1.0 | 12.3 | 0.1 | 0.7 | 1.0 | 3.0 | 3.1 | 0.2 | 30 | 49 | 1.5 | ||
| Group 3 | 20 | Min | 5.0 | 0.1 | 6.5 | 11.4 | 7.7 | 3.3 | 2.5 | 9.9 | 0.0 | 6.3 | 136 | −21 | 1.9 |
| Max | 16.1 | 28.9 | 37.3 | 171.8 | 34.7 | 7.5 | 11.0 | 33.3 | 6.5 | 8.0 | 383 | 302 | 9.0 | ||
| Mean | 9.6 | 3.8 | 19.3 | 90.4 | 14.1 | 5.3 | 7.6 | 19.3 | 0.9 | 7.3 | 234 | 204 | 5.1 | ||
| S.D. | 3.4 | 6.7 | 8.0 | 33.6 | 5.8 | 1.3 | 2.2 | 6.5 | 1.5 | 0.5 | 52 | 101 | 2.2 | ||
| Group 4 | 3 | Min | 13.8 | 1.9 | 17.3 | 231.3 | 76.3 | 3.4 | 2.6 | 3.9 | 0.4 | 8.1 | 466 | 74 | 1.7 |
| Max | 49.2 | 2.5 | 26.6 | 299.7 | 134.3 | 4.8 | 8.2 | 16.5 | 0.6 | 8.7 | 563 | 231 | 6.2 | ||
| Mean | 26.2 | 2.1 | 21.9 | 254.3 | 108.8 | 4.3 | 5.5 | 10.3 | 0.5 | 8.4 | 529 | 177 | 3.7 | ||
| S.D. | 19.9 | 0.3 | 4.7 | 39.3 | 29.6 | 0.8 | 2.8 | 6.3 | 0.1 | 0.3 | 55 | 89 | 2.3 | ||
| Group 5 | 4 | Min | 17.5 | 0.7 | 22.0 | 111.2 | 23.6 | 3.9 | 16.6 | 24.3 | 0.2 | 6.9 | 407 | 32 | 2.3 |
| Max | 28.9 | 32.1 | 43.5 | 224.2 | 43.7 | 5.2 | 18.2 | 37.0 | 7.3 | 8.3 | 507 | 207 | 6.2 | ||
| Mean | 24.2 | 11.2 | 34.5 | 170.6 | 33.8 | 4.6 | 17.5 | 33.2 | 2.5 | 7.7 | 453 | 104 | 3.9 | ||
| S.D. | 5.4 | 14.7 | 9.0 | 55.5 | 9.2 | 0.6 | 0.7 | 6.0 | 3.3 | 0.6 | 44 | 81 | 1.7 |
Publisher’s Note: MDPI stays neutral with regard to jurisdictional claims in published maps and institutional affiliations. |
© 2022 by the authors. Licensee MDPI, Basel, Switzerland. This article is an open access article distributed under the terms and conditions of the Creative Commons Attribution (CC BY) license (https://creativecommons.org/licenses/by/4.0/).
Share and Cite
MDPI and ACS Style
Nakagawa, K.; Amano, H.; Yu, Z.-Q.; Berndtsson, R. Groundwater Quality and Potential Pollution in the Southern Shimabara Peninsula, Japan. Water 2022, 14, 4106. https://doi.org/10.3390/w14244106
AMA Style
Nakagawa K, Amano H, Yu Z-Q, Berndtsson R. Groundwater Quality and Potential Pollution in the Southern Shimabara Peninsula, Japan. Water. 2022; 14(24):4106. https://doi.org/10.3390/w14244106
Chicago/Turabian StyleNakagawa, Kei, Hiroki Amano, Zhi-Qiang Yu, and Ronny Berndtsson. 2022. "Groundwater Quality and Potential Pollution in the Southern Shimabara Peninsula, Japan" Water 14, no. 24: 4106. https://doi.org/10.3390/w14244106
Note that from the first issue of 2016, this journal uses article numbers instead of page numbers. See further details here.