
Carbon Neutrality Assessment and Driving Factor Analysis of China’s Offshore Fishing Industry

1
School of Management Science and Engineering, Shandong University of Finance and Economics, Jinan 250014, China
2
Institute of Marine Economy and Management, Shandong University of Finance and Economics, Jinan 250014, China
*
Author to whom correspondence should be addressed.
Water 2022, 14(24), 4112; https://doi.org/10.3390/w14244112
Submission received: 31 August 2022
/
Revised: 11 December 2022
/
Accepted: 13 December 2022
/
Published: 16 December 2022
(This article belongs to the Special Issue Marine Economic Development and Conservation)
Abstract
:The marine fishing industry has a huge carbon sink potential and is also an important source of carbon emissions. The low-carbon development of the marine fishing industry is particularly important. Based on the perspective of carbon neutrality, this study analyzed the trend of net carbon emissions, carbon emissions and carbon sinks in the offshore fishing industry in China and 11 coastal provinces from 2010 to 2019 and decomposed the driving factors of the net carbon emissions of the offshore fishing industry with the LMDI decomposition method. The results show the following: (1) China’s offshore fishing industry is in a partially carbon-neutral state. Overall, the net carbon emissions have decreased, and the carbon neutrality capacity has improved. However, the net carbon emissions have increased since 2016. From 2010 to 2019, both the carbon emissions and carbon sinks of China’s offshore fishing industry declined. Carbon emissions fluctuated at first and then declined rapidly, while carbon sinks rose slowly and then showed a significant downward trend. (2) The offshore fishing industry in coastal provinces is also in a state of partial carbon neutrality, and the trends of carbon emissions, carbon sinks and net carbon emissions in most provinces are consistent with the national trends, but there are large differences between regions. (3) For the whole country, among the driving factors of net carbon emissions in the offshore fishing industry, industrial development is the main positive driving factor, and population size is the main negative driving factor. The net carbon coefficient and energy intensity also play a certain role in driving net carbon emissions. (4) Population size is an important inhibitory factor for the net carbon emissions of the offshore fishing industry in most coastal provinces, and the driving direction of the net carbon coefficient, energy intensity and industrial development is inconsistent. Based on the above research, relevant suggestions are put forward for the green development of the marine fishing industry.
1. Introduction
Carbon sinks, through afforestation and vegetation restoration, reduce the concentration of carbon dioxide in the atmosphere. Biological carbon sinks in particular have the advantages of being safe, efficient and economically feasible [1] while contributing to the conservation of biodiversity. The development of biological carbon sinks has become an important way to achieve the goal of carbon neutrality and promote sustainable economic and social development. With the concepts of “ocean blue carbon” [2] and “carbon sink fishery” [3], the carbon sink function of fisheries has been emphasized. Fishery is considered as the only controllable and effective sink industry in the ecosystem [4], and the carbon sink potential is huge. On the other hand, fishery is an important part of large agriculture, and it generates considerable carbon emissions in parallel with its economic development. China is a large fishing country, and its marine fishing output ranks first in the world all the year round. In the face of severe pressure on fishery resources and the environmental carrying capacity of fisheries, the sustainable development of marine fisheries and carbon neutrality have become inevitable.
As an important part of the fishery industry, the marine fishing industry provides rich aquatic products and makes important contributions to maintaining food security, in-creasing fishermen’s incomes and promoting the development of coastal areas. The marine fishing industry is a carbon sink fishery, mainly through biological pumps that sequester carbon and move carbon out of the water body so as to achieve the carbon sink function. Marine plants use carbon dioxide for photosynthesis to convert inorganic carbon into organic carbon and transfer energy through the food chain or food web, and part of the marine organisms is harvested and used by humans in the form of catch to achieve “carbon transfer” [5].
The marine fishing industry is highly dependent on energy [6], accounting for more than 70% of fishery energy consumption. The energy consumption per unit output value is far higher than that of the primary industry. The energy consumption per ton of the marine fishing industry in China is also higher than that of other advanced countries [7]. The fuel consumption of fishing vessels has become an important source of carbon emissions. Therefore, the marine fishing industry has the dual attributes of “carbon source” and “carbon sink”, and it is necessary to examine the changes of carbon emissions and carbon sinks in the marine fishing industry from the perspective of carbon neutrality. Identifying the drivers of carbon neutral capacity changes and analyzing their contribution effects can help us understand the impact of each factor on carbon neutral capacity improvement, which is important for better guiding the low-carbon development of China’s marine fisheries.
This study makes the following contributions. First, on the basis of the assessment of carbon emissions and carbon sinks, the net carbon emissions were calculated and the changes in the carbon neutral level of China’s offshore fishing industry were analyzed. Secondly, the trophic level method was used to estimate the carbon sink of the offshore fishing industry, taking into account the energy transfer efficiency in the food chain. Thirdly, the LMDI decomposition method was used to analyze the contribution effects of each driving factor to the net carbon emissions from the offshore fishing industry. In theory, differently from the previous studies that only focused on carbon emissions, this study evaluated the carbon sinks of the offshore fishing industry, which enriches the relevant studies of the marine fishing industry and carbon sinks. The contribution of each factor was found through the LMDI decomposition, which provided a theoretical reference for the development of the offshore fishing industry. The practical significance is that the study emphasizes the ecological function of the offshore fishing industry, proves the huge carbon sink potential of the offshore fishing industry, supports the emission reduction of the marine fishing industry and puts forward targeted suggestions.
2. Literature Review
There are few studies on the carbon emissions and carbon sink changes of the marine fishing industry from the perspective of carbon neutrality, most of which study the carbon changes of the marine fishing industry from the single perspective of carbon emissions or carbon sink. Commercial fisheries are highly dependent on fossil fuels, exacerbating air pollution and greenhouse gas emissions [8,9,10,11,12]. Greer et al. emphasized the potential importance of marine fishing as a part of the global CO2 emission reduction strategy by estimating the total carbon dioxide emissions and carbon emission intensity from global marine fishing fuel combustion from 1950 to 2016 [13]. China is a major country in marine fishing, and fishing vessels are an important source of energy consumption and carbon emissions [14,15,16]. The greenhouse gas emissions of Chinese fishing vessels account for about one-quarter of the total emissions of global fishing vessels [8]. Moreover, the greenhouse gas emissions of China’s marine fishing industry show a steady growth trend [17]. The carbon emissions of the marine fishing industry are affected by fishing methods and fishing gear selection. Trawling and gill nets are high-emission fishing methods, and the energy consumption and carbon emissions of fishing vessels can be reduced by upgrading fishing vessels and strengthening the management of fishing operations [17,18]. Kristófersson et al. found that overall catches and abundance are the most important factors affecting fishery carbon emissions [19]. The seasonal fishing ban policy can also reduce greenhouse gas emissions [12].
In terms of carbon sinks, studies have found that marine animals play an important role in marine carbon storage. Reconstructing whales can remove 160,000 t of carbon from the atmosphere every year, which is equivalent to protecting 843 hectares of forest [20]; 12,000 sperm whales can remove a net 200,000 t of carbon from the atmosphere to the deep sea each year [21]. Gao et al. stated that carbon sink fishery has huge carbon sink potential. The global carbon sinks of fishery aquaculture and fish catching were 2,270,000–3,160,000 and 2,370,000–3,160,000 tons, respectively. Carbon sink fishery can become an important source of China’s carbon sink growth potential in the future [22]. Liu et al. proposed an evaluation framework and accounting method for ocean carbon sinks that comprehensively considers the types of carbon sinks and their characteristic storage cycle timescales [23]. Yang et al. integrated the particulate organic carbon (POC) and dissolved organic carbon (DOC) released by shellfish and algae into the dissolved organic carbon sink measurement model and found that the regional carbon sink differences were significant in China’s marine fisheries in 2020 [24]. The marine fishing industry removes higher trophic level marine organisms from the water body through fishing and harvesting, forming a fishery carbon sink [1]. Zhang et al. calculated the carbon sequestration of China’s fishery industry in the Yellow Sea and Bohai Sea, and the annual carbon sequestration from 1980 to 2000, was 3,610,000–26,130,000 and 2,830,000–10,080,000 tons, respectively. Overfishing reduced the nutrient level of the catch, leading to a maximum reduction of 23% and 27% of the annual carbon sequestration. Therefore, resource-conservation fishery should be developed [25]. By establishing an overall assessment model and a sub-species assessment model, Yue et al. calculated that the average carbon sinks of China’s Indian Ocean tuna fishery were 541,300 and 550,500 t, respectively [26].
In terms of the research on the influencing factors of carbon changes, scholars have used the STIRPAT model, the SDA model, the LMDI model and other methods to enrich the exploration in many fields [27,28,29]. In the field of marine fisheries, the LMDI decomposition method based on Kaya identity is mostly used to analyze carbon emissions. From the perspective of marine fisheries as a whole, some scholars focus on the driving effect of industrial scale, energy intensity, economic development, technological progress and other factors on carbon emissions or implied carbon emissions [30,31,32]. Some scholars have also focused on the effects of structure, scale and carbon ratio coefficient on the carbon sequestration capacity of mariculture [33,34]. Wang and Wang found through LMDI decomposition model analysis that carbon intensity is the main contributor of carbon emission reduction and the decoupling process of the marine fishing industry, and industrial structure is the main inhibiting factor of carbon emission reduction [35]. For pelagic fishing, the carbon emission intensity corresponds to the carbon decoupling state of the industry’s economic growth. Scale and industrial structure factors have a strong driving effect on carbon emissions. Therefore, promoting equipment upgrading, accelerating the construction of overseas bases and building a long-term mechanism for energy conservation and emission reduction have become important measures for the low-carbon development of pelagic fishing [36]. With the proposed goal of carbon neutrality, scholars began to analyze the contribution effects of various driving factors on the net carbon emissions of marine fisheries and suggested that carbon intensity, industrial structure and industrial scale were important driving factors [37,38].
In summary, abundant achievements have been made in the study of carbon emissions from marine fisheries. Scholars have reached a consensus that the fuel consumption of marine fishing vessels is the main carbon emission source of marine fisheries, which lays a solid foundation for further research on carbon emissions from marine fisheries. However, the research on the carbon sink of marine fishery is still in the development stage, and few scholars have conducted preliminary exploration, lacking systematic analysis. The research on the development of China’s marine fishing industry from the perspective of carbon neutrality is rare. The analysis of the driving factors of carbon neutrality in the marine fishing industry can help to find the deficiencies in the low-carbon development of the marine fishing industry, so as to formulate energy-saving and emission reduction measures. However, most of the existing studies are from the perspective of marine fisheries as a whole, and there is a lack of special research on the marine fishing industry, a high energy consumption sector. In addition, the existing studies on the influencing factors of carbon change are mostly based on carbon emissions, ignoring the marine capture carbon sink, which is not conducive to promoting the overall level of carbon neutrality in fisheries.
This study took the offshore fishing industry, a typical marine fishing industry, as the research object. Based on the existing research, this study focused on the carbon emissions and carbon sinks of the marine fishing industry from the perspective of carbon neutrality, evaluated the carbon neutrality capacity of the offshore fishing industry in China and 11 coastal provinces (except Hong Kong, Macao and Taiwan) from 2010 to 2019 and analyzed the dynamic change trend. The LMDI decomposition method was used in this study to decompose the driving factors of carbon neutrality change in the offshore fishing industry, in order to gain a deeper understanding of carbon-related changes in the marine fishing industry and provide a reference for the low-carbon development, energy conservation and emission reduction of the marine fishing industry.
3. Methods and Data Sources
The marine fishing industry can be divided into offshore fishing and pelagic fishing. Most of the existing studies take them as a whole, but the characteristics of resources and environment they face are very different. Taking them as a whole diminishes the characteristics between different production departments, which is not conducive to discovering the problems existing in each production department and leads to difficulty in making targeted decisions. In addition, the policies adopted for offshore fishing and pelagic fishing are different, emphasizing the control of offshore fishing and the development of pelagic fishing. For offshore fishing, due to marine environmental pollution and overfishing, China’s offshore fishery resources are facing depletion. Therefore, China has introduced a series of management measures, such as the summer fishing moratorium system, and the “zero growth” and “negative growth” system of marine fishing output. As for pelagic fisheries, it is an important direction for China’s marine fishing industry to emphasize the standardized and orderly development of pelagic fisheries and participate in the development of international fishery resources.
In China, the output of offshore fishing accounts for a large proportion of the total output of marine fishing, and the proportion of fishing vessels owned at the end of the year is high. In 2019, for example, the output of offshore fishing in China was 10,001,515 tons, accounting for 82.17% of the total output of marine fishing. The power of marine fishing motor boats in offshore fishing reached 10.7003 million kW, accounting for 78.98% of the total power of marine fishing motor boats. Whether it is the output of catch or the input of fishing vessels, the offshore fishing industry can suitably reflect the general level of the development of China’s marine fishing industry. Therefore, this study took the offshore fishery as the research object.
3.1. Assessment of Carbon Neutrality in Marine Fisheries
According to the definition of carbon neutrality [39], the carbon neutrality capacity of the offshore fishing industry is calculated in Equation (1):
represents the net carbon emission of offshore fishery, represents the carbon emission of the offshore fishing industry and represents the carbon sink of offshore fishing. When , it is completely carbon neutral, indicating that the carbon emission generated by offshore fishery can be completely offset by the capture carbon sink; when , it is partially carbon neutral. Net carbon emissions reflect the balance between carbon emissions and carbon sinks. When net carbon emissions are low, it indicates that the offshore fishing industry has a high carbon neutrality ability.
3.1.1. Estimation of Carbon Emissions from Marine Fisheries
Previous studies have shown that the fossil energy combustion of marine fishing vessels is an important source of carbon emissions from the marine fishing industry. Therefore, this study calculated the carbon emissions of offshore motorized fishing vessels as the carbon emissions of the offshore fishing industry. Fuel consumption can be obtained according to the power and fuel coefficient of marine fishing vessels in different operating modes, and the carbon emission can be calculated in combination with the carbon emission coefficient, as shown in Equation (2):
In Equation (2), represents fishing vessel power in different operation modes, represents oil coefficient, represents carbon emission factor, represents the average low calorific value of diesel oil and represents operating modes of marine fishing vessels, including trawl, purse seine, gill net, open net, fishing tackle and others. As the power in different operation modes in the China Fishery Yearbook does not separate the power of offshore fishing vessels from that of pelagic fishing vessels, the carbon emission calculated in Equation (2) is the total carbon emission of offshore fishing and pelagic fishing.
The carbon emission of the marine fishing industry is related to the fuel consumption of fishing vessels, and the fuel consumption is obtained according to the power of fishing vessels. Therefore, the carbon emission of offshore fishery is estimated according to the proportion of the power of offshore fishing motor vessels to the total power of marine fishing motor vessels, as shown in Equation (3):
where is the carbon emission of offshore fishery, represents the power of offshore motorized fishing vessels and represents the total power of marine motorized fishing vessels; that is, the sum of the power of offshore fishing and pelagic fishing motorized fishing vessels.
3.1.2. Estimation of Carbon Sinks from Marine Fisheries
Marine organisms sequestrate carbon in the form of biological pumps. Primary producers such as phytoplankton transform carbon in seawater from inorganic carbon to organic carbon through photosynthesis, and then transfer it from a lower nutrient level to a higher trophic level through the food chain [5]. The marine fishing industry removes part of the carbon from the water by fishing the catch to achieve “carbon transfer”, which is the marine fishing carbon sink. Referring to Zhang et al. [25], the trophic level method was used to evaluate the carbon sink of offshore fishing; that is, according to the catch and the corresponding trophic level, the amount of the primary producer being consumed was derived based on the energy transfer process, and then the marine fishing carbon sink was estimated according to its carbon content. The specific process is as follows:
(1) Biomass of prey () with average trophic level between 1 and 2 was estimated by conversion of trophic level, see Equation (4).
where means catch, represents the trophic level of the catch and represents the ecological conversion efficiency among the trophic levels. Because the trophic levels of catches are different, the transformation of trophic levels is different. is a parameter related to the trophic level of catches. When the trophic level of catches is between 2 and 3, 3 and 4 and 4 and 5, is 1, 2, 3, respectively. The ecological conversion efficiency is determined by referring to the research of Tang et al. [40] (see Equation (5)).
(2) The biomass of preyed primary producers () is calculated. The proportion of primary producers with trophic level 1 and primary consumers with trophic level 2 among the ingested is first calculated (see Equation (6)):
where is the proportion of primary producers with trophic level 1.
The biomass of primary producers such as phytoplankton is then further estimated in Equation (7):
represents the ecological conversion efficiency of primary producers such as phytoplankton consumed by primary consumers..
(3) Assuming that the carbon content of primary producers such as phytoplankton is 4.49% [41], the removed carbon sink is estimated to be the carbon sink of the marine fishing industry (). See Equation (8):
Offshore catches can be divided into fish, crustaceans, shellfish, algae, cephalopods and others. The total yield of fish, crustaceans and cephalopods accounted for an average of 92.45% of the total yield of offshore fishing products in 2010–2019, and the trophic level was high. Other marine catches have low yields and low or more difficult to determine trophic levels, so carbon transfer through the food chain/web of fish, crustaceans and cephalopods is used as a marine fishery carbon sink.
3.2. LMDI Decomposition Method
The Kaya identity [42] proposed by Yoichi Kaya reflects the impact of energy intensity, economic growth, population size and other factors on carbon dioxide emissions. The logarithmic mean division index (LMDI) decomposition method [43] decomposes multiple driving factors of carbon emissions based on Kaya identity to investigate the impact of various factors on carbon emissions. The LMDI decomposition method can eliminate the residual term, meet the requirements of reversible factors and has the advantage of unique results. Therefore, it is widely used in the analysis of carbon-related influencing factors in various fields. This study analyzed the driving factors of net carbon emissions from China’s offshore fishing industry from 2010 to 2019 by using the additive form of the LMDI decomposition method.
Firstly, Equation (9) is used to express the net carbon emission of the offshore fishing industry:
where is the total energy consumption of the offshore fishing industry, is the catch output of the offshore fishing industry and is the number of employees of the offshore fishing industry. is net carbon coefficient, representing the net carbon emission per unit energy consumption; is energy intensity, representing energy consumption per unit catch; is industrial development, representing per capita catch output, reflecting the output level of the offshore fishing industry and reflects the population size of the offshore fishery.
and refer to the net carbon emissions of offshore fishing in the base period and period, respectively. According to the additive LMDI decomposition method, Equation (10) can be obtained:
In Equation (10), net carbon emission changes are decomposed into four factors: net carbon coefficient effect (), energy intensity effect (), industrial development effect () and population size effect (). The contribution values of each factor are calculated as shown in Equation (11)
is the logarithmic average function defined as follows (see Equation (12)):
3.3. Data Sources
In this work, the carbon neutrality level of the offshore fishing industry was studied by using the data of 11 coastal provinces in China (except Hong Kong, Macao and Taiwan) from 2010 to 2019, and the driving factors of net carbon emissions from offshore fishing industry were analyzed by using the LMDI decomposition model. The fuel coefficient of marine motor fishing boats in different operating modes refers to the Reference Standard for Calculating the Oil Price Subsidy of Domestic Motor Fishing Vessels. The carbon emission factor and the average low calorific value of diesel oil come from the IPCC Guidelines for National Greenhouse Gas Inventory 2006 and General Principles for Calculation of Comprehensive Energy Consumption, respectively. In the calculation of marine capture carbon sink, the trophic levels of fish mainly come from Fishbase and Sealifebase, and trophic levels of unclassified fish, crustaceans and cephalopods are represented by their respective average values. Other data come from China Fishery Yearbook and China Fishery Statistical Yearbook.
In addition, the “number of professionals in marine fishing” in the China Fishery Statistical Yearbook includes both the total number of professional practitioners in offshore fishing and those in pelagic fisheries, and it is not possible to directly obtain data on the number of professional practitioners in offshore fishing. The number of fishing boat personnel in actual production is directly related to the power of the fishing boat. Generally speaking, the higher the power of the fishing boat, the more operators are required. Therefore, the number of offshore fishing practitioners is estimated according to the ratio of the power of the offshore motorized fishing boat to the total power of the marine motorized fishing boat. The total energy consumption calculated based on the power also includes the energy consumption of the offshore fishing industry and the pelagic fisheries, and is calculated based on the power ratio of the offshore motorized fishing vessel in the same way.
4. Results and Analysis
4.1. Carbon Neutrality in Offshore Fishing Industry
According to the assessment method of the carbon neutrality level of the marine fishing industry, the net carbon emissions of the marine fishing industry in the whole country and each coastal province were estimated, and the calculation results are shown in Table 1. It can be seen from Table 1 that the carbon emission of the offshore fishing industry in the whole country and each coastal province is higher than that of the marine fishing carbon sink. Therefore, China’s offshore fishery is still partially carbon neutral.
During the study period, the change of net carbon emissions from offshore fishing in China can be roughly divided into two stages: from 2010 to 2016, it showed a rapid downward trend, from 1,869,100 tons in 2010 to 1,560,900 tons in 2016, a decrease of 16.49%; from 2016 to 2019, it showed an upward trend, but the increment was lower. Therefore, the net carbon emissions of China’s offshore fishing industry declined as a whole.
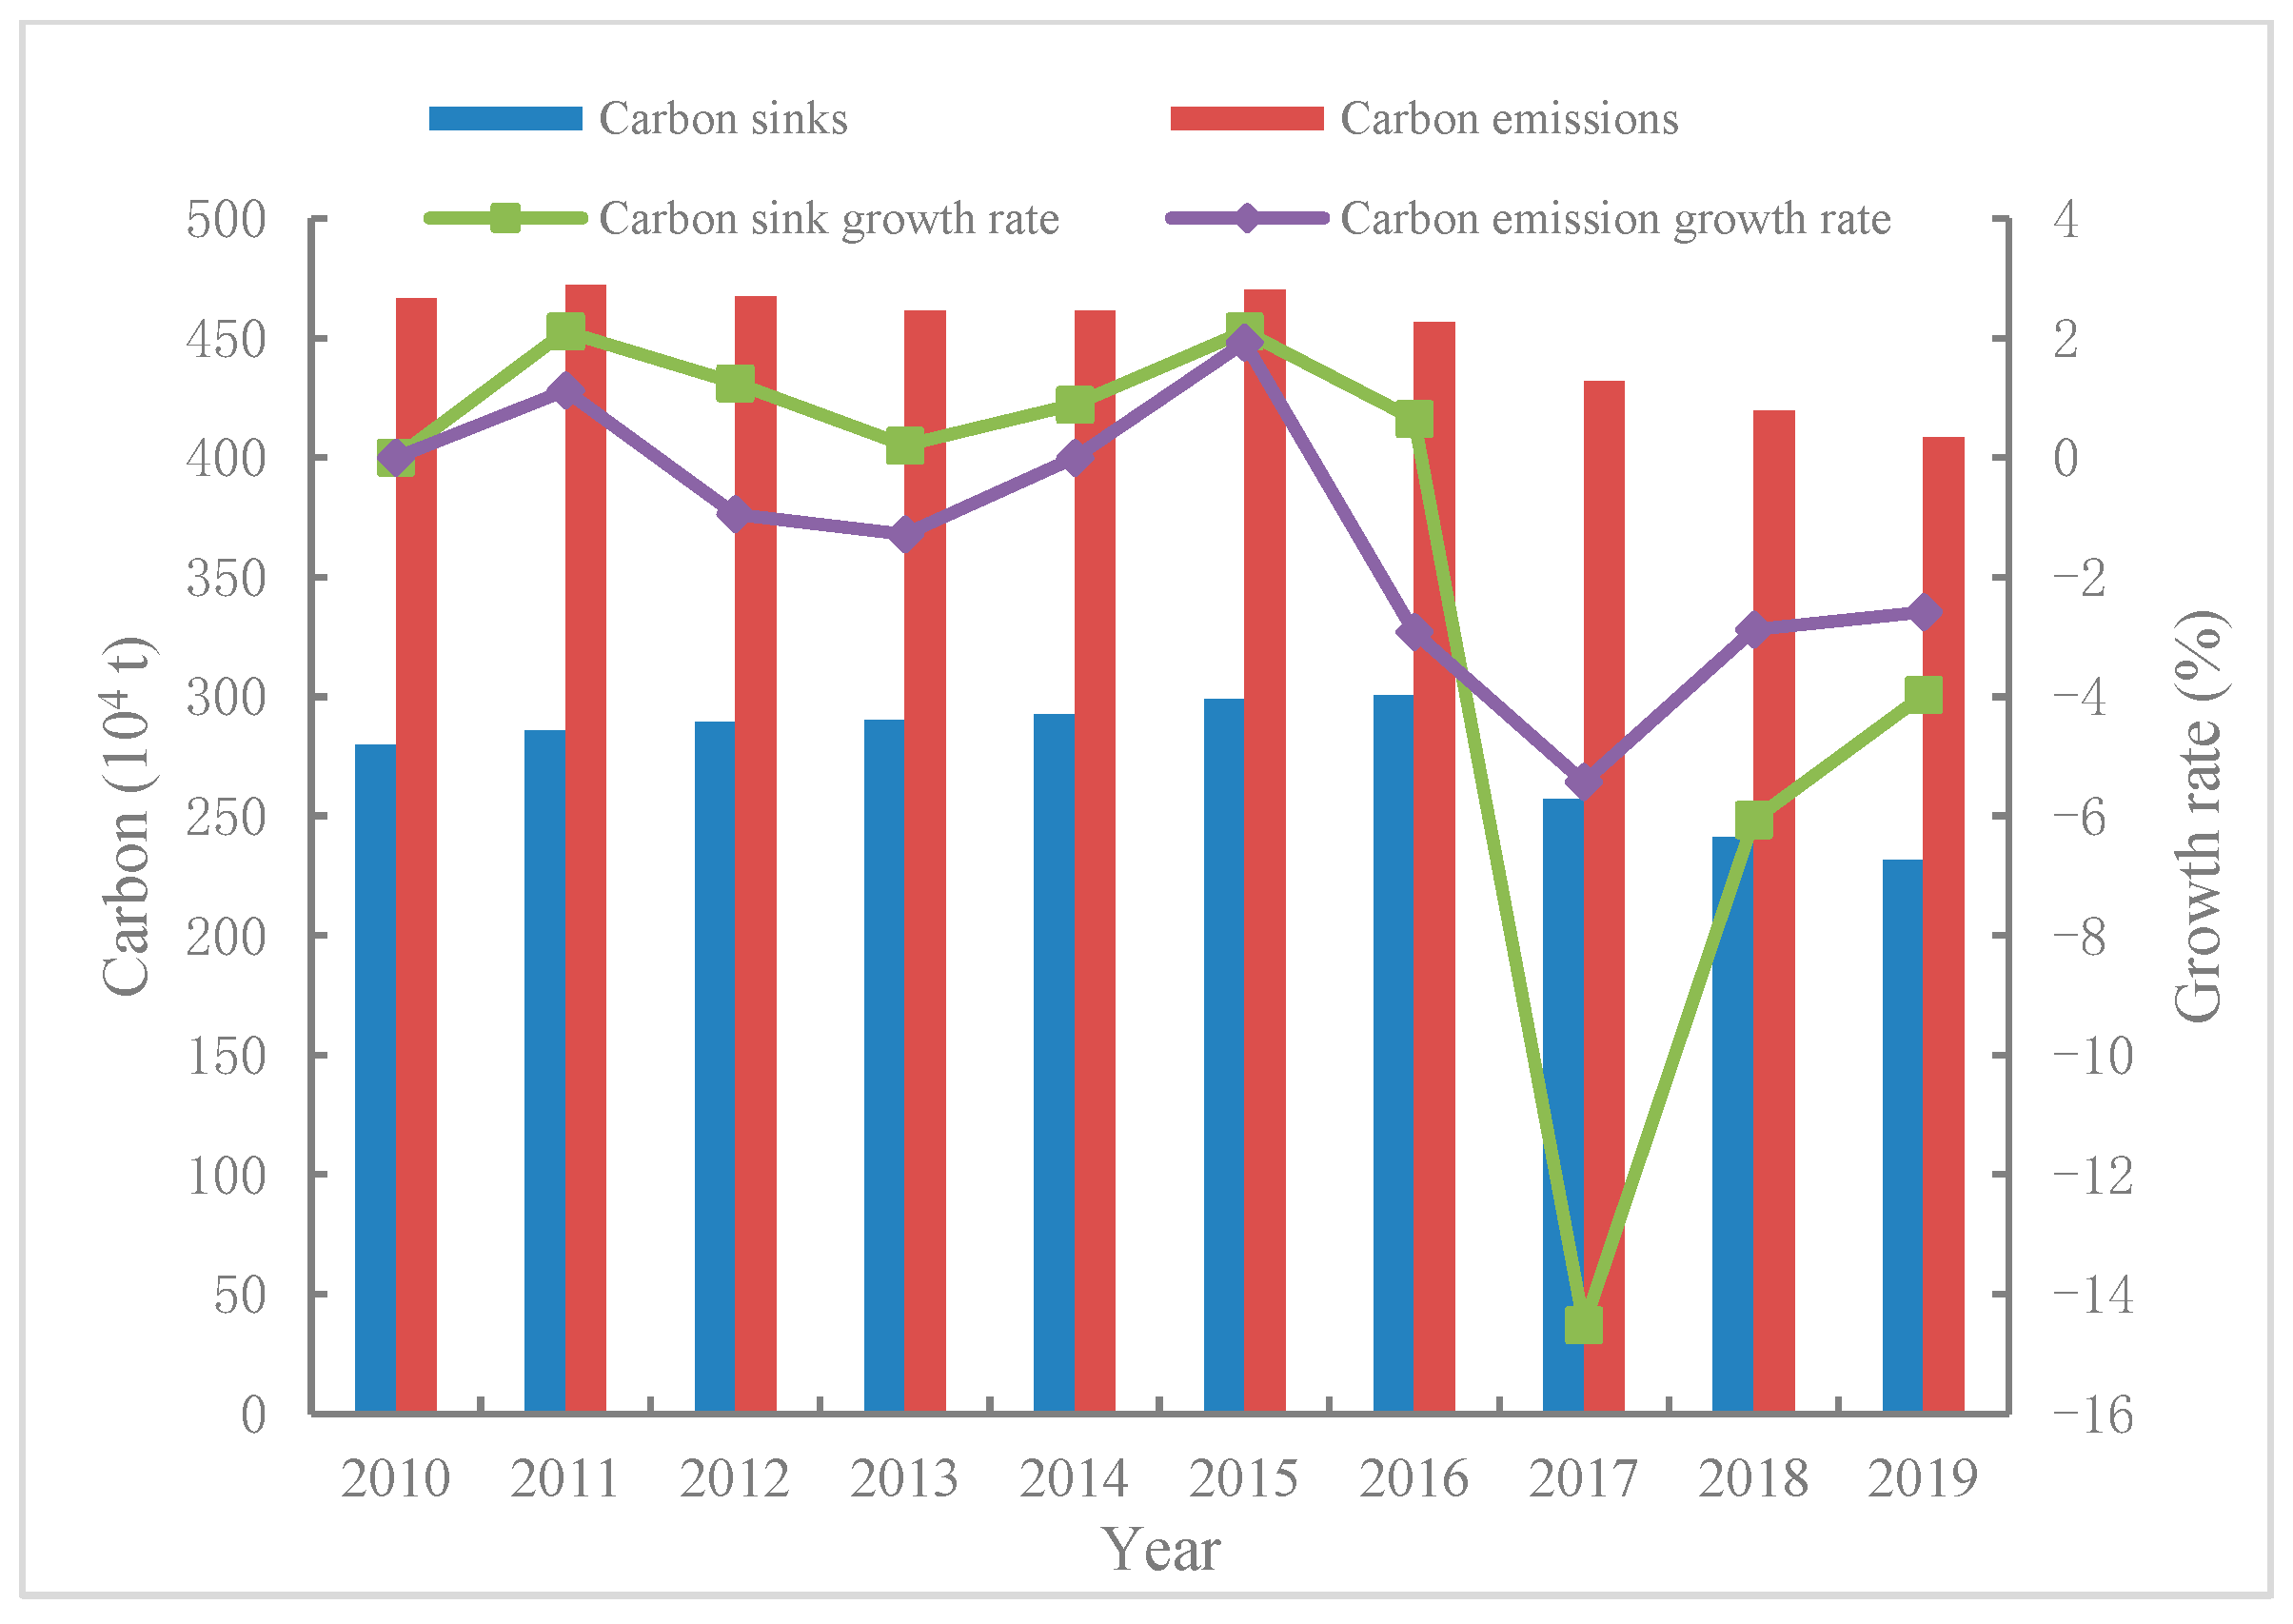
Specifically, the carbon emissions and carbon sinks of China’s offshore fishing industry are shown in Figure 1. According to the total carbon emission and its year-on-year growth rate as shown in Figure 1, the carbon emission of China’s offshore fishing industry fluctuated from 2010 to 2015, with the highest growth rate of 1.93% in 2015. However, the year-on-year growth rate of carbon emission after 2016 was always lower than 0, showing a continuous downward trend. The decline in 2017 was the largest, with the year-on-year growth rate of −5.43%. The offshore fishing carbon sink showed a general trend of increasing first and then decreasing, rising from 2,798,200 tons in 2010 to the highest value of 3,005,400 tons in 2016and declining rapidly after 2016. In 2019, the offshore fishing carbon sink was only 2,317,500 tons, decreasing by 22.89% compared with 2016.
According to the provincial results of net carbon emissions from offshore fishing shown in Table 1, there are large regional differences in net carbon emissions from offshore fishing. Zhejiang has the highest net carbon emission from offshore fishing, with an average net carbon emission of 411,200 tons during the study period, ranking first among coastal provinces, followed by Guangdong province, the net carbon emission of which even exceeded Zhejiang province in 2016 and 2017. However, the net carbon emission of both provinces showed a general downward trend, showing a good trend of low-carbon development. Tianjin and Shanghai had relatively low net carbon emissions. The average net carbon emissions of Tianjin’s offshore fishing industry from 2010 to 2019 were only 10,100 tons.
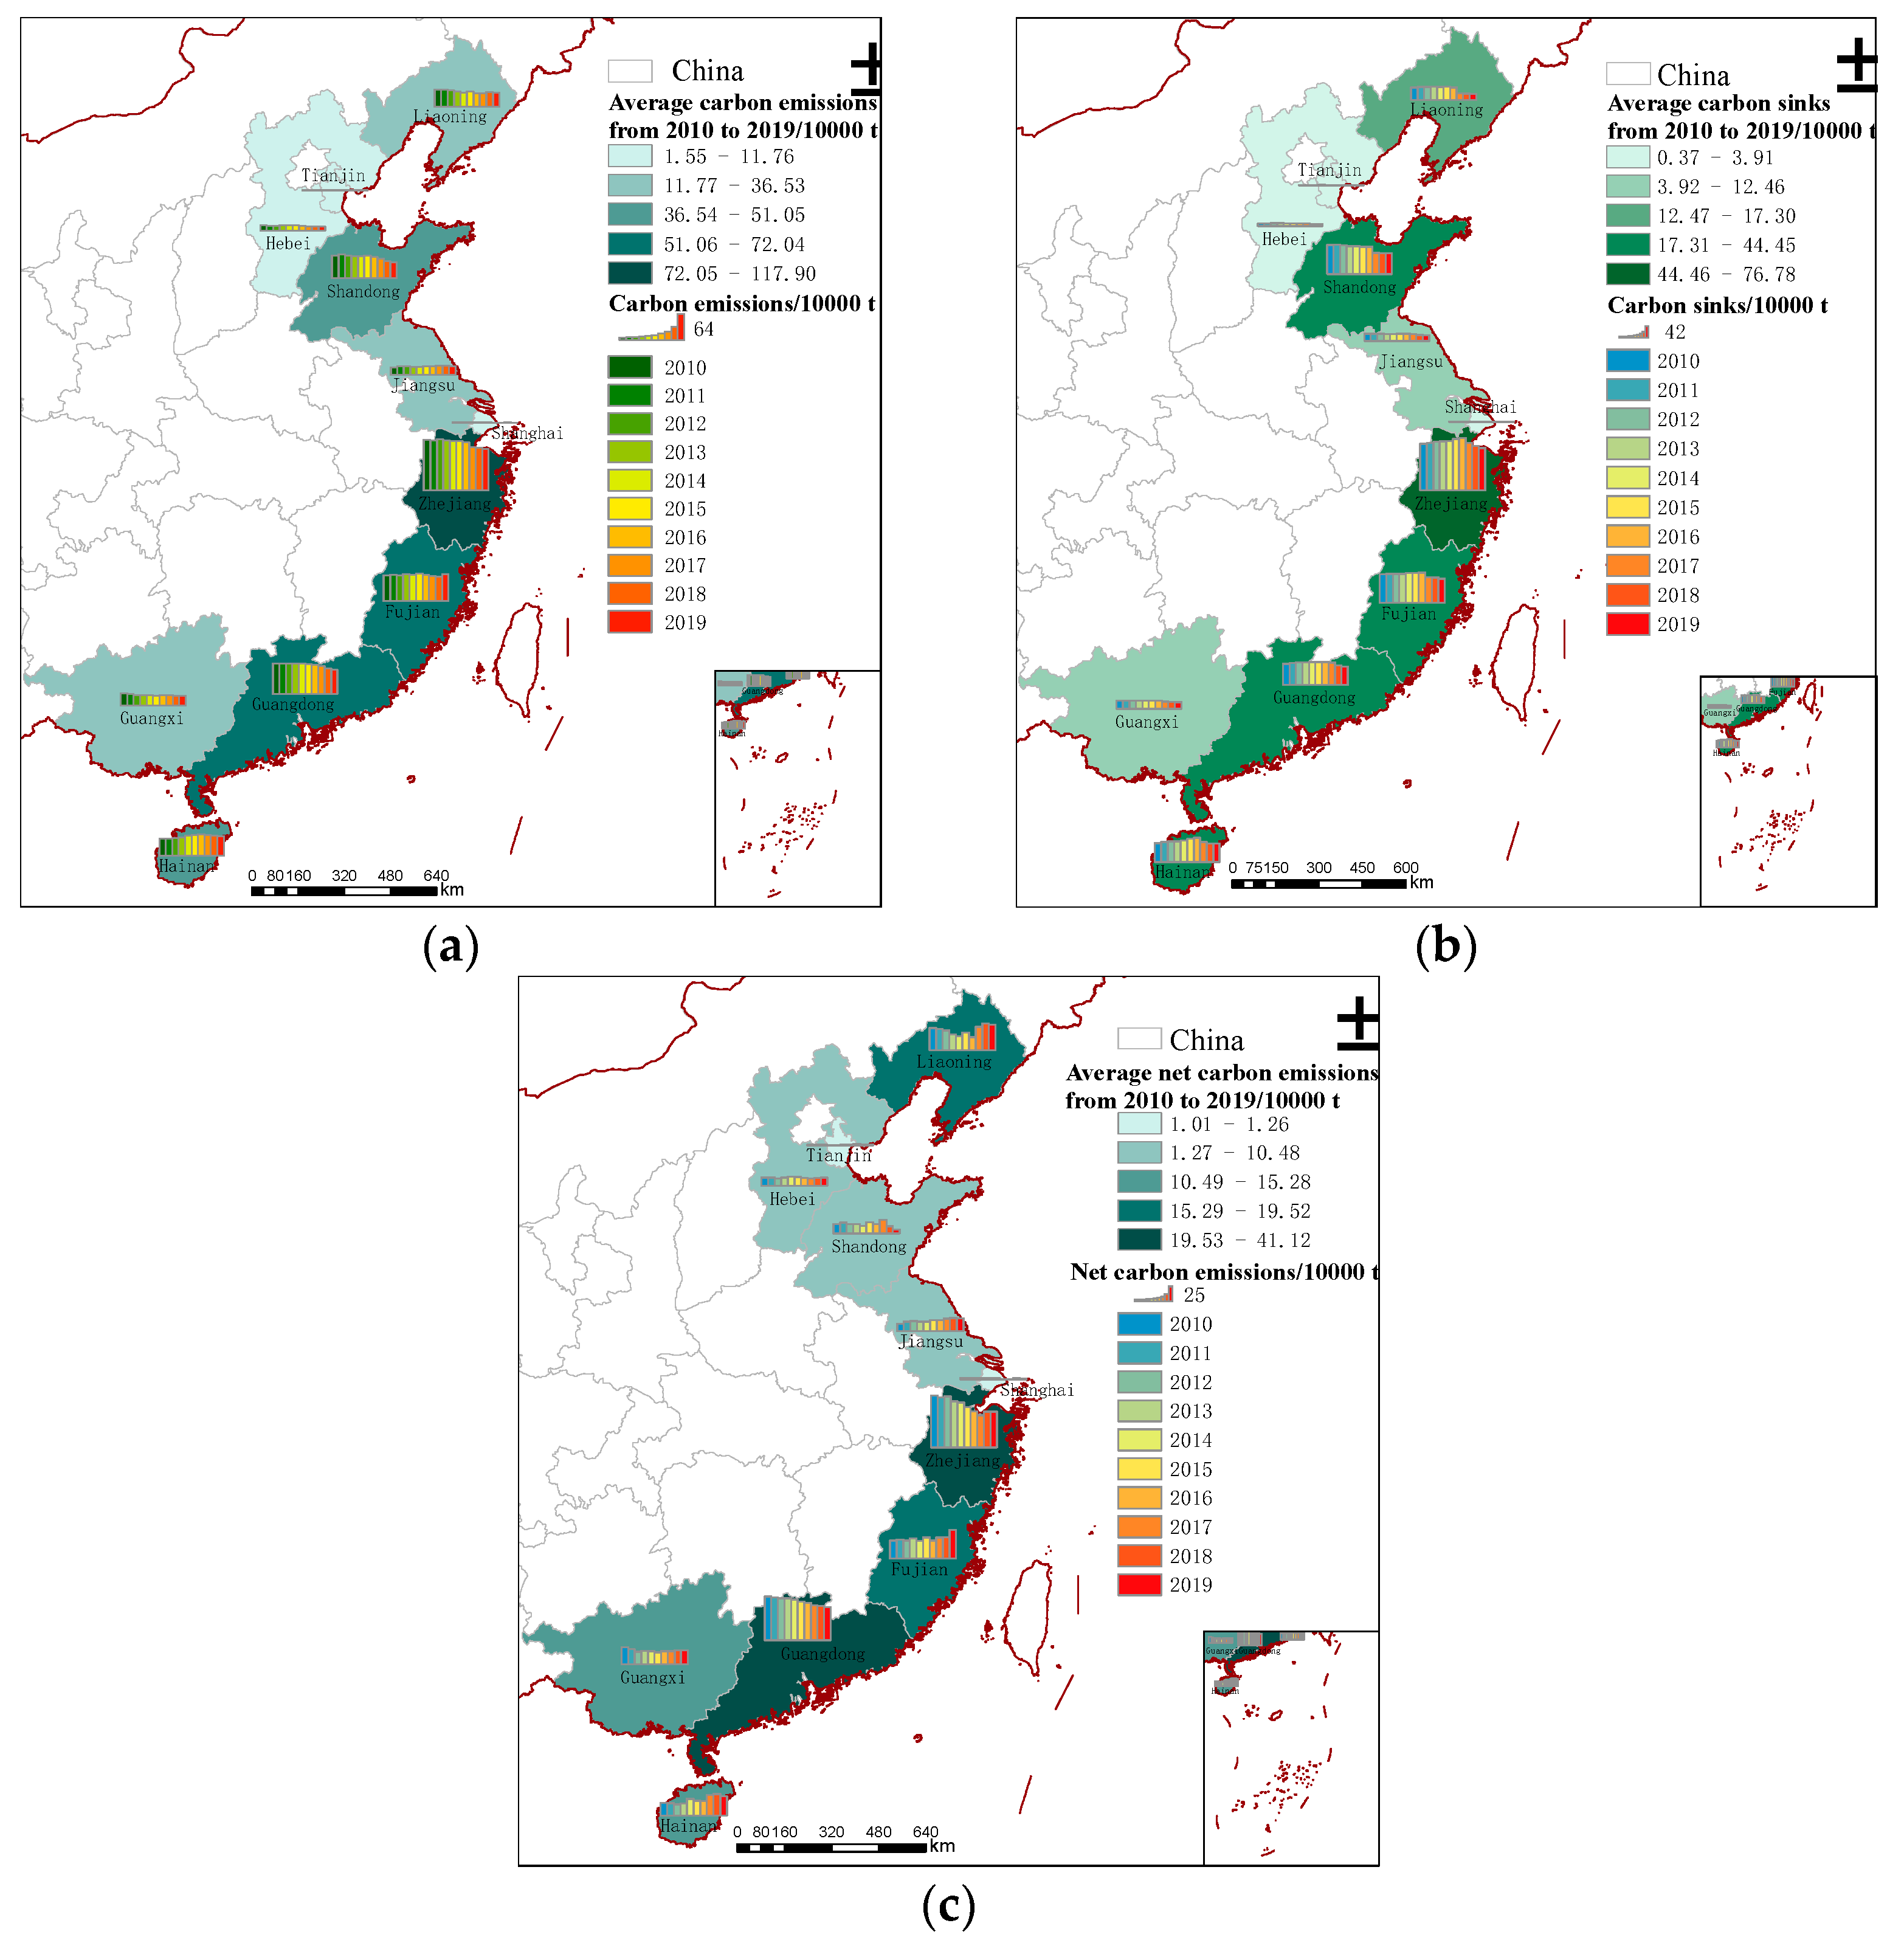
Figure 2 shows the average levels and time-series changes of carbon emissions, carbon sinks and net carbon emissions from the offshore fishing industry in China’s coastal provinces from 2010 to 2019. It can be seen from Figure 2 that the offshore fishing industry in Zhejiang belongs to the type of high carbon emission and high carbon sink. Zhejiang has a large-scale marine fishing industry. In 2019, the power of its offshore fishing boats was about 2,774,700 kW, accounting for 25.93% of the total power of motorized fishing boats for offshore fishing in China, so carbon emissions were high. Zhejiang has the largest fishing ground in China (Zhoushan fishing ground). It is rich in fishery resources and is the main producing area of marine aquatic products. In 2019, the output of offshore fishing accounted for 27.23% of the total output of offshore fishing in China. Therefore, the carbon sink of offshore fishing is also high. In general, the net carbon emissions of offshore fisheries in Zhejiang are high, and the process of the carbon neutrality of the marine capture fisheries has a long way to go. The offshore fishing industry in Tianjin and Shanghai is of a low-carbon emission and low-carbon sink type, which may be due to the small scale of the offshore fishing industry.
Carbon emissions from offshore fishing in most provinces showed a downward trend. Among them, Zhejiang, Guangdong and Shandong have large carbon emission bases and obvious emission reduction effects. During the study period, the carbon sink change of the offshore fishing industry in most provinces was consistent with that of the whole country, showing a trend of first rising and then falling. The reduction in marine fishing carbon sink may be caused by the decline of marine fishing output. The Thirteenth Five-Year Plan for National Fishery Development issued by the Ministry of Agriculture in 2016 emphasized that the domestic fishing intensity should be gradually reduced, the domestic fishing output would achieve “negative growth” and the domestic marine fishing output should be controlled within 10 million tons by 2020. In 2017, the pilot work of quota fishing was launched. The implementation of a series of measures to control offshore fishing led to a significant decline in offshore fishing output in 2016, and the carbon sink of offshore fishing decreased in 2016.
It is worth noting that Fujian’s offshore fishing output was always lower than that of Shandong from 2010 to 2019, but its offshore fishing carbon sink began to be higher than that of Shandong from 2013, which may be caused by the low average trophic level of Shandong’s marine fishing catch. The carbon sink of marine fishing is affected by the fishing output and the trophic level of the catch. Although increasing the fishing output can increase the carbon sink, overfishing may lead to the destruction of the marine ecosystem and the decline of the trophic level, which is also not conducive to the sustainable development of the carbon sink function of marine fishing. Therefore, it is necessary to develop resource conservation fisheries and realize the sustainable development of marine fisheries.
4.2. Empirical Analysis of Driving Factor Decomposition
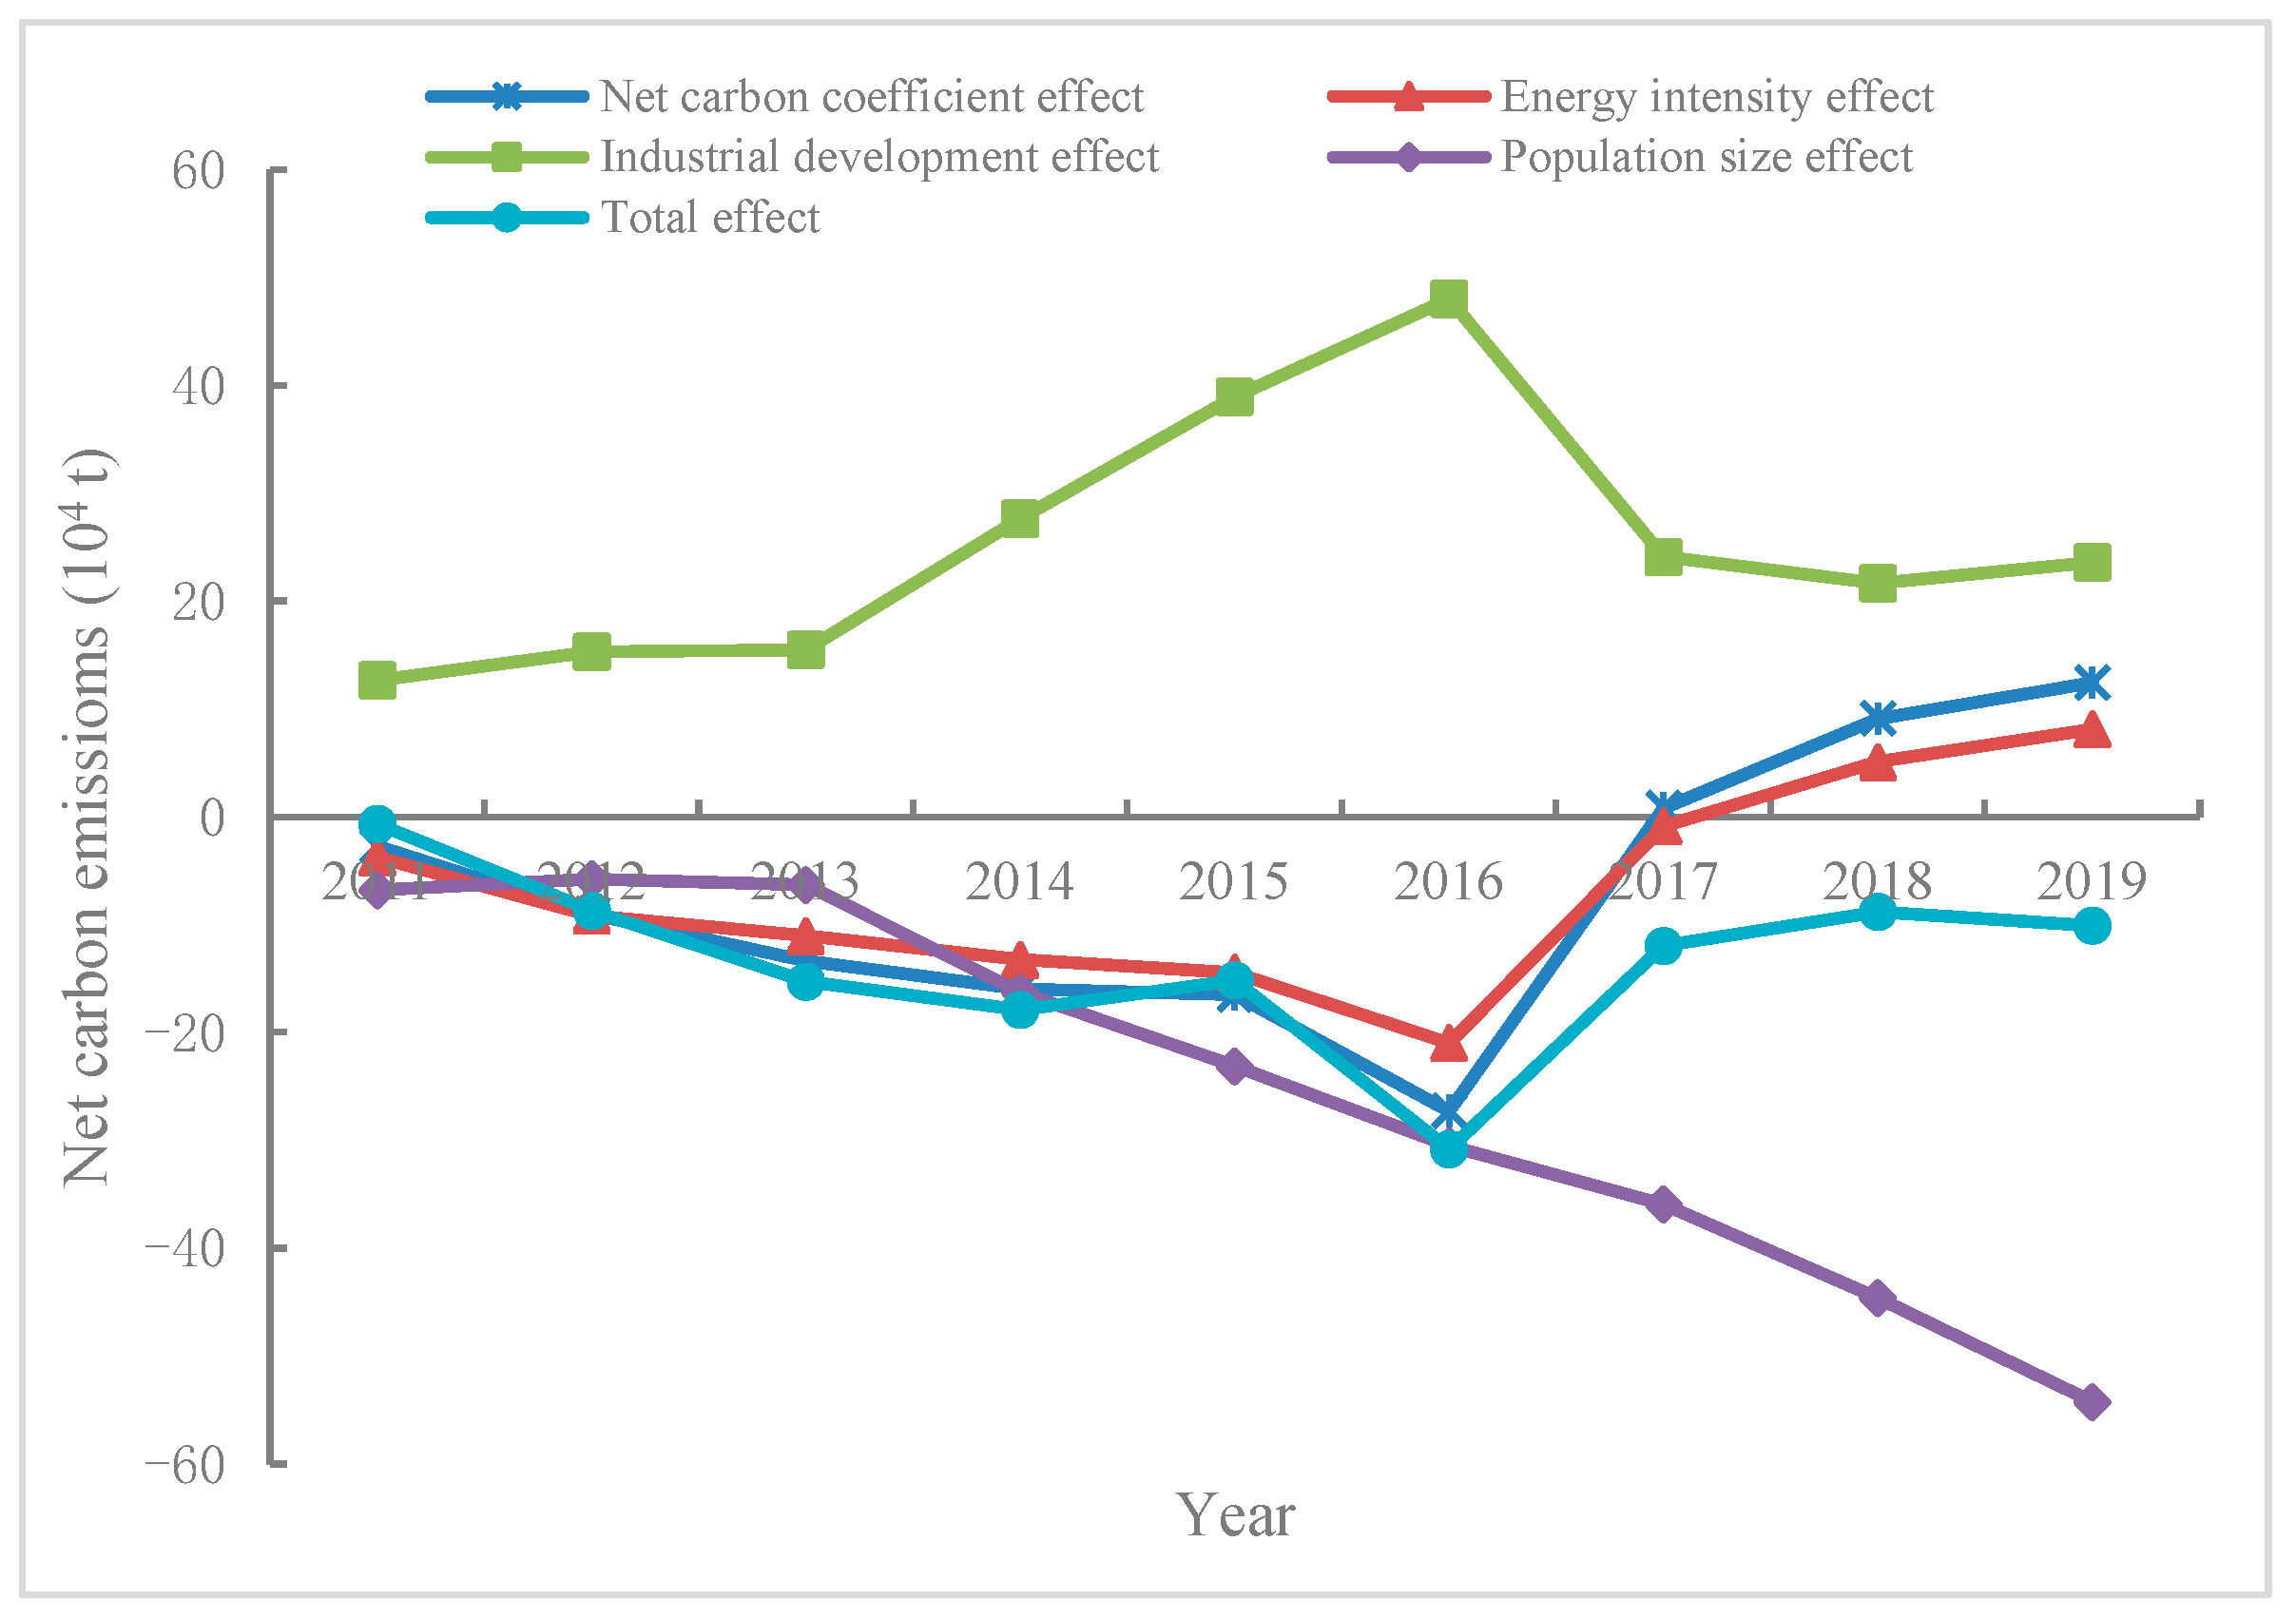
Identifying the driving factors of net carbon emissions from marine fisheries can help us understand the real reasons for the change in the carbon neutrality capacity of marine fisheries and formulate measures to improve the carbon neutrality level of marine fisheries. In this study, the contribution of the net carbon coefficient, energy intensity, industrial development and population size to the change of net carbon emission of offshore fishery in China and coastal provinces was calculated with the LMDI decomposition model. The annual effects of each driving factor of net carbon emissions from China’s offshore fishing industry during 2010–2019 are shown in Table 2, and the annual cumulative effects are shown in Figure 3. From the cumulative effect of driving factors, industrial development is the main positive driving factor of net carbon emissions from China’s offshore fishing industry, while population size is the main restraining factor. The contribution value of the net carbon coefficient and energy intensity is also positive, which also drives the net carbon emissions from China’s offshore fishing industry to a certain extent.
As shown in Figure 3, industrial development has always been the main positive driving factor for the net carbon emissions of China’s offshore fishing industry. Before 2016, the cumulative effect of industrial development expanded year by year and was the only positive driving factor. After 2016, the driving effect of industrial development weakened, but the cumulative effect of the net carbon coefficient and energy intensity began to turn positive, which together caused the net carbon emissions to increase. From 2010 to 2019, the cumulative effect of population size has been expanding year by year, which has continuously inhibited the net carbon emissions of the marine fishing industry. Overall, the driving direction and changing trend of the net carbon coefficient and energy intensity are the same.
(1) Net carbon coefficient effect. From 2010 to 2019, the cumulative contribution of the net carbon coefficient factor to the carbon emission of China’s offshore fishing industry was 124,580 tons, and the annual average contribution value was 13,840 tons. In general, the change of the net carbon coefficient promoted the net carbon emission of the offshore fishing industry. However, from the year-on-year effect of the net carbon coefficient shown in Table 2, the contribution value of the net carbon coefficient factor from 2010 to 2016 was negative, exerting a restraining effect on the net carbon emission. After 2017, the positive driving effect of the net carbon coefficient weakened, and the overall trend was good. The net carbon coefficient reflects the net carbon emission per unit of energy consumption. Although the carbon emission coefficient of energy consumption in this paper is a fixed value, and the net carbon coefficient is mainly affected by carbon sink, increasing the proportion of clean energy and fundamentally reducing the net carbon emission coefficient of energy are effective measures to improve the carbon neutrality capacity of the marine fishing industry.
(2) Energy intensity effect. From 2010 to 2019, the cumulative contribution value of energy intensity was 81,200 tons, and the annual average effect was 9020 tons, which played a certain role in promoting the net carbon emissions of China’s offshore fishing industry. As shown in Figure 3, the cumulative effect of energy intensity is positive, which is mainly affected by the increase in marine fishing energy intensity in 2017–2019. Energy intensity, that is, the energy consumption per unit output, reflects the energy dependence of the marine fishing process. Although the energy consumption is reduced, the catch output is significantly reduced, resulting in the energy intensity effect changing from negative to positive. This is influenced to a certain extent by the fishing quota system, but it also indicates that energy efficiency should continue to be improved in the future, and unnecessary energy consumption should be reduced through measures such as strengthening marine fishery resource surveys. At the same time, the marine fishing structure should be optimized and the proportion of high-energy-consuming fishing methods such as trawling should be reduced.
(3) Industrial development effect. From 2010 to 2019, the cumulative increment of carbon emissions generated by industrial development was 235,830 tons, with an average contribution value of 26,200 tons. Industrial development is the main driving factor behind the net carbon emissions of China’s offshore fishing industry. This shows that industrial development mainly depends on general technological progress; that is, improving production efficiency and promoting the increase in fishery output through the mechanization of fishing operations and increasing the use of energy-consuming fishing machines. On the other hand, the effect value of industrial development began to appear negative, which also showed that the development of the marine fishing industry was gradually realizing carbon decoupling, and the emission reduction effect was significant.
(4) Population size effect. From 2010 to 2019, the cumulative effect of population size on the net carbon emissions of China’s offshore fishing industry was −542,620 tons, with an average effect of −60,290 tons, which is the main driving factor to improve the carbon neutrality level of the offshore fishing industry. As shown in Table 2 and Figure 3, except for 2012, the annual effect of population size is negative, indicating that the change of population size has a continuous inhibitory effect on net carbon emissions. The carbon emission reduction effect of the population size factor is mainly caused by the shrinking population size of the marine fishing industry. Compared with 2010, the estimated number of offshore fishing professionals in 2019 decreased by about 26.95%. The reduction in population size reduces the demand for marine fishing, and reduces some high-energy marine fishing production activities, exerting a restraining effect on net carbon emissions. The decrease in the number of marine fishing professionals reflects the effectiveness of the policy of changing industries. In the future, the support of the policy should be strengthened continuously, so as to arouse the enthusiasm of the fishermen to reduce the number of boats and to realize the high-quality development of marine fishery.
It should be noted from the statistical data that the number of professional practitioners of marine fishing is declining steadily, which has a restraining effect on the carbon emissions of marine fishing. In fact, marine capture fishery practitioners have changed from traditional fishermen who lived on the sea as a single subject to a pattern of coexistence of traditional fishermen specializing in marine fishing, fishermen and farmers who engage in part-time and temporary fishing, fishery cooperative organizations and fishery enterprises. The scale of the fishermen increased [44], which may have a certain impact on the LMDI decomposition results of the driving factors of net carbon emissions in the offshore fishing industry.
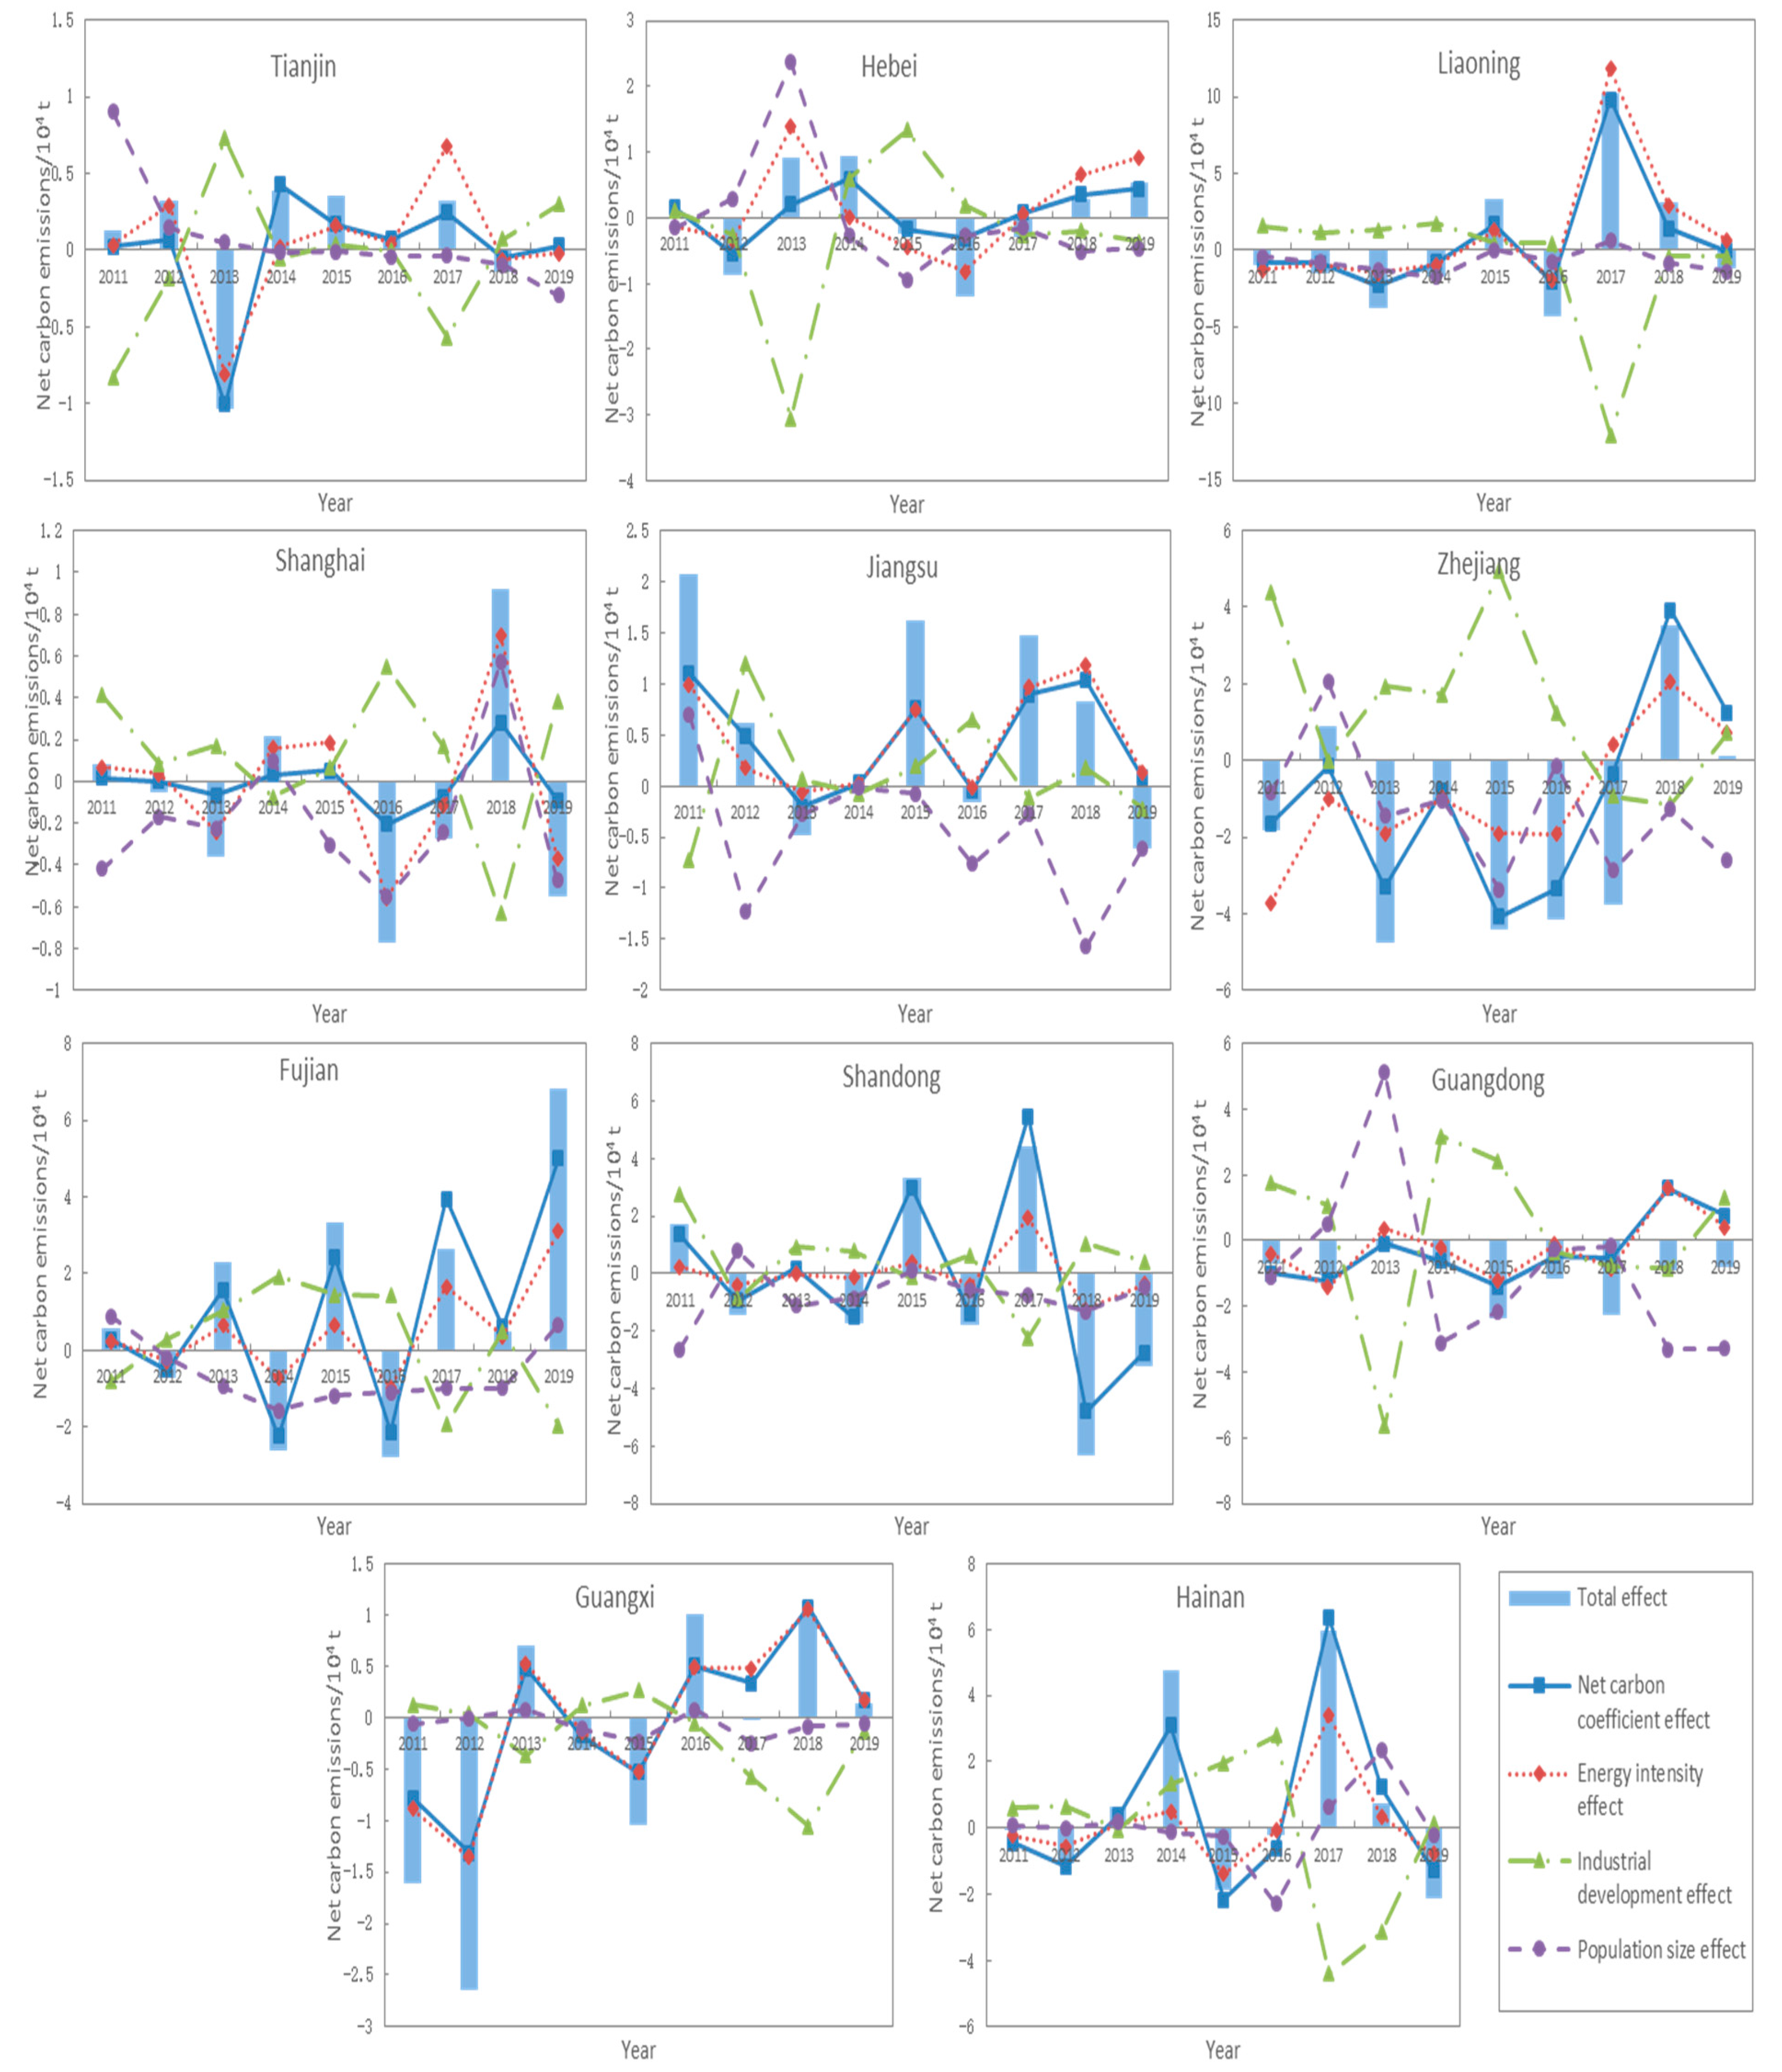
The cumulative contribution of driving factors to the net carbon emissions of the offshore fishing industry in 11 coastal provinces in China from 2010 to 2019 is shown in Table 3, and the year-by-year effects of the previous year as the base period are shown in Figure 4. From the cumulative effect values shown in Table 3, it can be seen that except for Tianjin and Hainan, the population size factor is a negative driving effect. For Hebei, Liaoning, Jiangsu, Fujian and Hainan, the driving direction of the net carbon coefficient and energy intensity is the same, which drives the net carbon emissions of the offshore fishing industry. In terms of industrial development, the effect values of Tianjin, Hebei, Liaoning, Guangxi and Hainan are negative, which inhibits the net carbon emissions.
The province with the highest cumulative effect of net carbon coefficient from 2010 to 2019 is Fujian, which is the main factor influencing the change of net carbon emissions in Fujian, with a contribution rate of 42.48%. The net carbon coefficient effect in Fujian shown in Figure 4 shows a fluctuating upward trend, especially since 2017, and the cumulative contribution value is 95,350 tons. In response to the strategy of the negative growth of marine fishing output, Fujian’s fishing output decreased from 2,038,600 tons in 2016 to 1,611,600 tons. In the case of small changes in fishing energy consumption, the marine fishing carbon sink is reduced, resulting in an increase in the net carbon coefficient, which drives the net carbon emissions of marine fishing. Energy intensity is the main factor affecting the net carbon emissions of Liaoning’s offshore fishing industry. From 2016 to 2017, the energy consumption of offshore fishing in Liaoning increased by 1.95%, while the fishing output decreased by 48.96%, resulting in an increase in energy consumption per unit of output from 0.35 to 0.69. The increasing effect is significant. Industrial development is a positive driver of net carbon emissions from the offshore fishing industry in Shanghai, Jiangsu, Zhejiang, Fujian, Shandong and Guangdong, indicating that the increase in per capita fishing production in these regions is still highly dependent on energy. In the future, it is necessary to strengthen the research and promotion of energy-saving fishing machines and low-carbon fishing technologies. The population size change in Tianjin has the highest positive promotion effect on the net carbon emissions of the offshore fishing industry, which may be due to the small scale of its early marine fishing industry. In general, the population scale effect of most provinces is exerting a continuous inhibitory effect, and the overall trend is good.
The change of the effect value of the driving factors shows strong policy relevance. Taking Shandong Province as an example, due to the negative growth policy of marine fishing output and the management of quota fishing, its marine fishing output in 2017 decreased by 23.67% year-on-year, and the change of output is much higher than that in other years. The change of marine fishing output affects the net carbon emission, the net carbon coefficient and energy intensity change from negative to positive and the effect of industrial development change from positive to negative, and the change of effect value was also higher than that in other years. On the other hand, the impact of this policy is not sustainable. It only has a great impact on the effect value in the early stage of the policy. It may be that at the beginning of the policy, fishery management is relatively strict. When the target is expected to be achieved, the corresponding fishery management will be relaxed, which will affect the sustainable development of the policy effect. In general, the improvement of the carbon neutrality level in marine fisheries not only depends on the introduction of policies but is also affected by the degree of policy implementation.
5. Discussion
The carbon emissions of China’s offshore fishing industry declined rapidly after entering the 13th Five Year Plan, which is similar to the research conclusion of Li et al. [38]. This is because, since the 13th Five Year Plan, China’s fishery has advocated ecological priority and green development, and the number of marine fishing motor vessels has rapidly decreased, which has contributed to the reduction in carbon emissions, indicating that this policy has an important guiding significance for the low-carbon development of China’s marine fisheries.
The use of the trophic level method to assess the carbon sink of offshore capture fisheries in this study is relatively rare in the study of the carbon sink of fisheries. Compared with the carbon removal results (1,430,000–1,570,000 t/year) calculated by Gao et al. [22] based on the C sequestration rate of the catch, the carbon sink obtained from the trophic level method is higher. A possible reason is that the average transfer efficiency between different trophic levels, the trophic levels of different species of organisms, the average value of phytoplankton carbon content and the carbon content between different species of organisms of different fishing species all influence the results.
From the LMDI decomposition results, industrial development promoted the increase in net carbon emissions from China’s offshore fishing industry, which is similar to the findings of Li et al. [31] and Shao et al. [30]. Industrial development has contributed to an increase in the demand for marine capture products and an increase in the use of large machinery and equipment for fishing activities, leading to an increase in the potential demand for energy consumption and an expansion of the carbon emission base. The population size promotes carbon emission reduction in the offshore fishing industry, which is consistent with the findings of Li et al. [31] and opposite to those of Zhu et al. [37]. This may be due to the shrinkage of the employed population in the offshore fishing industry in this study, while the population size increased in the study of Zhu et al. [37]. Energy intensity played an inhibitory role during 2010–2016, which is similar to the conclusions of Shao et al. [30] and Wang et al. [35], but it started to have a positive effect in 2017. The difference in results may be due to the significant reduction in marine fishing yield in the late period of the study and the difference in the choice of indicators. The energy intensity index in this paper refers to the energy consumption per unit of production, not the energy consumption per unit of output.
The net carbon emission assessment results show that the carbon emission of the offshore fishing industry in China is still relatively high. Ecological priorities will help reduce carbon emissions from offshore fishing. The offshore fishing industry has great potential of carbon sink, so more attention should be paid to the carbon sink function of capture fisheries. With the decline of marine fishing intensity, the catch decreases and the marine fishing carbon sink also decreases. Therefore, the marine fishing yield is still an important factor affecting the marine fishing carbon sink. However, it should be noted that overfishing will lead to the decline of marine biological resources and the decrease in the average trophic level of catch species, which is not conducive to long-term carbon sink function. Therefore, resource-conserving fisheries should be developed from a long-term perspective. In addition, different research methods differ in the estimation of carbon sinks, so it is necessary to strengthen the research on the calculation method of carbon sinks and form a scientific evaluation system of fishery carbon sinks.
From the decomposition results, the reduction in the net carbon emissions of the offshore fishing industry depends on the control of energy intensity, the reduction in population size and the decoupling of industrial development. Therefore, in order to achieve low-carbon development in the offshore fishing industry, it is necessary to continue to adhere to the system of vessel reduction and production conversion while guiding the progress of low-carbon technology in the offshore fishing industry to achieve carbon decoupling.
6. Conclusions and Recommendations
This study evaluated the carbon neutral status of China’s offshore fishing industry from 2010 to 2019 and analyzed the dynamic trends of carbon emissions, carbon sinks and net carbon emissions. The LMDI decomposition method was used to decompose the driving effects of each driving factor of net carbon emissions. The main conclusions are as follows:
(1) China’s offshore fishing industry is still in a partially carbon neutral state, and the overall carbon neutral capacity is improved. The change of net carbon emissions can be divided into two stages: 2010–2016 is a rapid decline stage, and 2016–2019 is an upward stage. The carbon emissions from offshore fishing fluctuated from 2010 to 2015, and decreased rapidly from 2015 to 2019. The offshore fishing carbon sink showed a trend of rising first and then decreasing, and reached the maximum value in 2016.
(2) The offshore fishing industry in coastal provinces is also in a state of partial carbon neutrality. The trends of carbon emissions, carbon sinks and net carbon emissions in most provinces are consistent with those in China, but there are large differences between regions. As a major marine fishing province, Zhejiang’s carbon emissions, carbon sinks and net carbon emissions are much higher than other provinces, while Tianjin and Shanghai are far lower than other provinces due to their small marine fishing scale.
(3) For the whole country, the net carbon coefficient, energy intensity and industrial development have positive cumulative effects on net carbon emissions. Industrial development is the main factor driving the increase in net carbon emissions from offshore fishing, while population size is the main factor restraining the growth of carbon emissions.
(4) Population size is an important inhibitory factor for the net carbon emissions of the offshore fishing industry in most coastal provinces, while the net carbon coefficient, energy intensity and industrial development factors have different driving directions for different provinces.
Based on the above research, the following suggestions are put forward for the low-carbon development of the marine fishing industry:
The marine fishing industry has great potential of carbon sink, so more attention should be paid to its ecological function. In order to realize the long-term carbon sink function of the offshore fishing industry, the principle of sustainable development should be adhered to. The restoration of marine fishery resources and the ecological environment can be promoted by controlling the intensity of marine fishing, establishing artificial fishing reefs and developing marine pastures.
According to the LMDI decomposition results, the following measures can be taken to improve the carbon neutrality of the marine fishing industry. To reduce the carbon emission coefficient of energy through the low carbonization of the energy structure, the structure of marine fishing should be optimized to reduce energy intensity using information and intelligent means to improve energy efficiency. It is necessary to reasonably control the size of the marine fishing population and strengthen the education and training of marine fishing personnel. In addition, it is important to strengthen policy guidance, encourage the research and development of energy-saving and environmental protection technologies and guide the green development of industries.
Author Contributions
Conceptualization and validation, H.G.; writing and data curation, Y.C.; review and editing, A.Z. All authors have read and agreed to the published version of the manuscript.
Funding
This paper is supported by the National Social Science Fund Major Projects (fund number 19ZDA080).
Institutional Review Board Statement
The study did not involve humans or animals.
Informed Consent Statement
Not applicable.
Data Availability Statement
Not applicable.
Conflicts of Interest
The authors declare no conflict of interest.
References
- Tang, Q.S.; Liu, H. Strategy for carbon sink and its amplification in marine fisheries. Eng. Sci. 2016, 18, 68–73. [Google Scholar] [CrossRef]
- Nellemann, C.; Corcoran, E.; Duarte, C.M.; Valdés, L.; DeYoung, C.; Fonseca, L.E.; Grimsditch, G.D. Blue Carbon—A Rapid Response Assessment; United Nations Environment Programme: Nairobi, Kenya, 2009; Volume 9. [Google Scholar]
- Tang, Q.S. Carbon sinks fisheries and fast development of modern fisheries. Jiangxi Aquat. Technol. 2011, 2, 5–7. [Google Scholar] [CrossRef]
- Yang, J.; Sun, Y.P.; Liu, H.B.; Ge, X.P. Characteristics of carbon cycles and mechanism of carbon sink in inland fishery ecosystem. J. Fish. China 2012, 36, 794–800. [Google Scholar] [CrossRef]
- Tang, Q.S.; Liu, H.; Fang, J.G. Strategic Studies on the Amplification of Biological Carbon Sink: Amplification of Ocean Biological Carbon Sink; Science Press: Beijing, China, 2015. [Google Scholar]
- Shi, L.; Qin, H.; Liu, L.T. Development situation and trend of world marine fishing industry and its enlightenment to China. Mar. Sci. 2018, 42, 126–134. [Google Scholar] [CrossRef]
- Tang, Z.M.; Zhang, X.; Huang, H.L.; Chen, X.X.; Chai, X.F. Cause analysis and Countermeasures of high energy consumption in marine fishing in China. China Fish. 2010, 6, 24–25. [Google Scholar] [CrossRef]
- Parker, R.W.R.; Blanchard, J.L.; Gardner, C.; Green, B.S.; Hartmann, K.; Tyedmers, P.H.; Watson, R.A. Fuel use and greenhouse gas emissions of world fisheries. Nat. Clim. Chang. 2018, 8, 333–337. [Google Scholar] [CrossRef]
- Port, D.; Perez, J.A.A.; de Menezes, J.T. Energy direct inputs and greenhouse gas emissions of the main industrial trawl fishery of Brazil. Mar. Pollut. Bull. 2016, 107, 251–260. [Google Scholar] [CrossRef]
- Lee, J.; Kim, T.; Ellingsen, H.; Hognes, E.S.; Hwang, B. Energy consumption and greenhouse gas emission of Korean offshore fisheries. J. Ocean Univ. China 2018, 17, 675–682. [Google Scholar] [CrossRef]
- Hua, J.; Wu, Y. Implications of energy use for fishing fleet—Taiwan example. Energy Policy 2011, 39, 2656–2668. [Google Scholar] [CrossRef]
- Driscoll, J.; Tyedmers, P. Fuel use and greenhouse gas emission implications of fisheries management: The case of the New England Atlantic herring fishery. Mar. Policy 2010, 34, 353–359. [Google Scholar] [CrossRef]
- Greer, K.; Zeller, D.; Woroniak, J.; Coulter, A.; Winchester, M.; Palomares, M.L.D.; Pauly, D. Global trends in carbon dioxide (CO2) emissions from fuel combustion in marine fisheries from 1950 to 2016. Mar. Policy 2019, 107, 103382. [Google Scholar] [CrossRef]
- Xu, H.; Liu, H.; Zhang, J.H.; Ni, Q.; Shen, J.; Jiang, L. Estimation of fishery energy consumption in China. China Fish. 2007, 11, 74–76, 78. [Google Scholar] [CrossRef]
- Xu, H. Report on fishery industry energy conservation and emissions reduction research in China. Fish. Modern. 2008, 4, 1–7. [Google Scholar] [CrossRef]
- Zhang, Z.L.; Wang, W.; He, Y.P. The calculation of emissions of carbon during the process of fishing boats operations in China. J. Shanghai Ocean Univ. 2010, 19, 848–852. [Google Scholar]
- Yue, D.D.; Wang, L.M.; Ruan, W.; Ji, W.W. Time series analysis and factor decomposition of greenhouse gas emissions of marine fishing in China. Resour. Environ. Yangtze Basin 2014, 23, 1057–1063. [Google Scholar] [CrossRef]
- Yue, D.D.; Wang, L.M.; Wang, Q.; Zhou, Y.S. GHG emissions estimation and efficiency analysis of marine fisheries. J. Shanxi Agric. Sci. 2013, 41, 873–876. [Google Scholar] [CrossRef]
- Kristofersson, D.; Gunnlaugsson, S.; Valtysson, H. Factors affecting greenhouse gas emissions in fisheries: Evidence from Iceland’s demersal fisheries. ICES J. Mar. Sci. 2021, 78, 2385–2394. [Google Scholar] [CrossRef]
- Pershing, A.J.; Christensen, L.B.; Record, N.R.; Sherwood, G.D.; Stetson, P.B.; Humphries, S. The impact of whaling on the ocean carbon cycle: Why bigger was better. PLoS ONE 2010, 5, e12444. [Google Scholar] [CrossRef]
- Lavery, T.J.; Roudnew, B.; Gill, P.; Seymour, J.; Seuront, L.; Johnson, G.; Mitchell, J.G.; Smetacek, V. Iron defecation by sperm whales stimulates carbon export in the Southern Ocean. Proc. Biol. Sci. 2010, 277, 3527–3531. [Google Scholar] [CrossRef] [Green Version]
- Gao, Y.; Yu, G.; Yang, T.; Jia, Y.; He, N.; Zhuang, J. New insight into global blue carbon estimation under human activity in land-sea interaction area: A case study of China. Earth-Sci. Rev. 2016, 159, 36–46. [Google Scholar] [CrossRef]
- Liu, C.; Liu, G.; Casazza, M.; Yan, N.; Xu, L.; Hao, Y.; Franzese, P.P.; Yang, Z. Current status and potential assessment of China’s ocean carbon sinks. Environ. Sci. Technol. 2022, 56, 6584–6595. [Google Scholar] [CrossRef] [PubMed]
- Yang, L.; Hao, X.; Shen, C.; An, D. Assessment of carbon sink capacity and potential of marine fisheries in China under the carbon neutrality target. Resour. Sci. 2022, 44, 716–729. [Google Scholar] [CrossRef]
- Zhang, B.; Sun, S.; Tang, Q.S. Carbon sink by marine fishing industry. Prog. Fish. Sci. 2013, 34, 70–74. [Google Scholar] [CrossRef]
- Yue, D.D.; Wang, L.M.; Zhang, X.; Zheng, H.F.; Feng, C.L.; Zhang, H.; Wang, Y.J.; Dai, Y.Y. Studies on assessment of carbon sinks of India Ocean tuna fishery—Taking China for example. J. Agric. Sci. Technol. 2014, 16, 132–138. [Google Scholar] [CrossRef]
- Wang, S.H.; Yi, X.J. Can the financial industry ‘Anchor’ carbon emission reductions? The mediating and moderating effects of the technology market. Energy Environ. 2022, 22, 100–105. [Google Scholar] [CrossRef]
- Wang, S.H.; Wang, X.Q.; Tang, Y. Drivers of carbon emission transfer in China-An analysis of international trade from 2004 to 2011. Sci. Total Environ. 2020, 709, 135924. [Google Scholar] [CrossRef] [PubMed]
- Xu, G.Q.; Cai, Z.; Feng, S.W. Spatial and temporal differences and influencing factors of carbon emissions based on the analysis of the two-stage LMDI model-An empirical study on Jiangsu Province. Soft Sci. 2021, 35, 107–113. [Google Scholar]
- Shao, G.L.; Kong, H.Z.; Yu, J.K.; Li, C. Decomposition of driving factors of marine fishery carbon emissions in China based on LMDI method. J. Agrotech. Econ. 2015, 6, 119–128. [Google Scholar] [CrossRef]
- Li, C.; Li, H.Y.; Kong, H.Z.; Feng, W. Structural characteristics and driving factors of embodied carbon emissions from fishery production system in China. Resour. Sci. 2021, 43, 1166–1177. [Google Scholar] [CrossRef]
- Ma, G.H.; Zhang, Y.C.; Yao, F.B. Study on the driving factors of carbon emission of fishery economy in China—Dual perspective analysis based on LMDI and decoupling model. J. Qingdao Univ Nat. Sci. Ed. 2022, 35, 117–123. [Google Scholar] [CrossRef]
- Sun, K.; Cui, Q.Q.; Su, Z.X.; Wang, Y.N. Spatio-temporal evolution and influencing factors of the economic value for mariculture carbon sinks in China. Geogr. Res. 2020, 39, 2508–2520. [Google Scholar] [CrossRef]
- Ren, W.H. Study on the removable carbon sink estimation and decomposition of influencing factors of mariculture shellfish and algae in China-a two-dimensional perspective based on scale and structure. Environ. Sci. Pollut. Res. 2021, 28, 21528–21539. [Google Scholar] [CrossRef] [PubMed]
- Wang, Q.; Wang, S. Carbon emission and economic output of China’s marine fishery—A decoupling efforts analysis. Mar. Policy 2022, 135, 104831. [Google Scholar] [CrossRef]
- Li, C.; Chi, P.; Shao, G.L. Research on the responsive relationship between China’s deep-sea fishery carbon emissions and industry economic growth—An empirical analysis based on decoupling theory and LMDI decomposition. Sci. Technol. Manag. Res. 2016, 36, 233–237. [Google Scholar] [CrossRef]
- Zhu, X.K.; Tan, C.L.; Zhang, Y. Research on decomposition of factors affecting net carbon emissions from marine fisheries in Zhejiang Province. Mar. Econ. 2021, 1–9. [Google Scholar] [CrossRef]
- Li, Z.; Zhang, L.; Wang, W.; Ma, W. Assessment of carbon emission and carbon sink capacity of China’s marine fishery under carbon neutrality target. J. Mar. Sci. Eng. 2022, 10, 1179. [Google Scholar] [CrossRef]
- Du, X.W. On carbon peak and carbon neutralization. Peoples Forum Acad. Front. 2021, 14, 22–27, 143. [Google Scholar] [CrossRef]
- Tang, Q.S.; Guo, X.W.; Sun, Y.; Zhang, B. Ecological conversion efficiency and its influencers in twelve species fish in the Yellow Sea eosystem. J. Mar. Syst. 2007, 67, 282–291. [Google Scholar] [CrossRef]
- Sun, J. Study on phytoplankton biomass I. Phytoplankton measurement biomass from cell volume or plasma volume. Acta Oceanol. Sin. China Ed. 1999, 21, 75–85. [Google Scholar] [CrossRef]
- Kaya, Y. Impact of Carbon Dioxide Emission Control on GNP Growth: Interpretation of Proposed Scenarios; Presentation to the Energy and Industry Subgroup; Response Strategies Working Group: Paris, France, 1990. [Google Scholar]
- Ang, B.W. LMDI decomposition approach: A guide for implementation. Energy Policy 2015, 86, 233–238. [Google Scholar] [CrossRef]
- Han, Y. Marine fishery resources management and policy adjustment in China since 1949. China Rural Econ. 2018, 9, 14–28. [Google Scholar]
Figure 1.
Carbon change in China’s offshore fishing industry from 2010 to 2019.

Figure 2.
Temporal and spatial distribution of carbon in offshore fishing in China’s coastal provinces from 2010 to 2019. (a) Carbon emissions of offshore fishing; (b) Carbon sinks of offshore fishing; (c) Net carbon emissions of offshore fishing.
Figure 2.
Temporal and spatial distribution of carbon in offshore fishing in China’s coastal provinces from 2010 to 2019. (a) Carbon emissions of offshore fishing; (b) Carbon sinks of offshore fishing; (c) Net carbon emissions of offshore fishing.

Figure 3.
Cumulative effect of driving factors of net carbon emissions from China’s offshore fishing industry from 2010 to 2019.
Figure 3.
Cumulative effect of driving factors of net carbon emissions from China’s offshore fishing industry from 2010 to 2019.

Figure 4.
Decomposition results of net carbon emissions from offshore fishing in China’s coastal provinces from 2010 to 2019.
Figure 4.
Decomposition results of net carbon emissions from offshore fishing in China’s coastal provinces from 2010 to 2019.


Table 1.
Net carbon emissions from China’s offshore fishing industry in 2010–2019 (104 t).
| Region | 2010 | 2011 | 2012 | 2013 | 2014 | 2015 | 2016 | 2017 | 2018 | 2019 |
|---|---|---|---|---|---|---|---|---|---|---|
| China | 186.91 | 186.24 | 178.21 | 171.61 | 169.01 | 171.73 | 156.09 | 174.94 | 178.08 | 176.81 |
| Tianjin | 0.86 | 0.99 | 1.31 | 0.27 | 0.65 | 1.01 | 1.08 | 1.39 | 1.25 | 1.26 |
| Hebei | 7.94 | 7.91 | 7.05 | 7.96 | 8.89 | 8.65 | 7.43 | 7.15 | 7.45 | 7.99 |
| Liaoning | 21.59 | 20.59 | 19.11 | 15.27 | 13.48 | 16.85 | 12.50 | 22.67 | 25.76 | 24.54 |
| Shanghai | 1.61 | 1.68 | 1.64 | 1.28 | 1.49 | 1.49 | 0.72 | 0.45 | 1.37 | 0.82 |
| Jiangsu | 7.19 | 9.25 | 9.87 | 9.40 | 9.35 | 10.98 | 10.82 | 12.29 | 13.11 | 12.50 |
| Zhejiang | 50.28 | 48.44 | 49.35 | 44.62 | 43.54 | 39.13 | 34.98 | 31.22 | 34.76 | 34.87 |
| Fujian | 17.37 | 17.96 | 17.25 | 19.56 | 16.94 | 20.29 | 17.52 | 20.18 | 20.66 | 27.47 |
| Shandong | 8.93 | 10.67 | 9.23 | 9.19 | 7.47 | 10.80 | 9.03 | 13.44 | 7.13 | 3.91 |
| Guangdong | 42.07 | 41.35 | 40.31 | 40.06 | 39.30 | 36.96 | 35.80 | 33.52 | 32.60 | 31.79 |
| Guangxi | 16.43 | 14.81 | 12.16 | 12.86 | 12.55 | 11.50 | 12.51 | 12.48 | 13.46 | 13.59 |
| Hainan | 12.24 | 12.19 | 11.09 | 11.70 | 16.44 | 14.56 | 14.34 | 20.29 | 21.05 | 18.89 |
Table 2.
Decomposition results of net carbon emissions from China’s offshore fishing industry from 2010 to 2019 (104 t).
Table 2.
Decomposition results of net carbon emissions from China’s offshore fishing industry from 2010 to 2019 (104 t).
| Year | Total Effect | ||||
|---|---|---|---|---|---|
| 2011 | −2.751 | −3.771 | 12.662 | −6.811 | −0.670 |
| 2012 | −6.303 | −5.402 | 2.638 | 1.029 | −8.038 |
| 2013 | −4.330 | −1.872 | 0.171 | −0.558 | −6.590 |
| 2014 | −2.592 | −2.214 | 12.168 | −9.966 | −2.604 |
| 2015 | −0.534 | −1.207 | 11.291 | −6.835 | 2.716 |
| 2016 | −10.790 | −6.518 | 9.087 | −7.416 | −15.638 |
| 2017 | 28.082 | 20.091 | −23.923 | −5.397 | 18.853 |
| 2018 | 8.294 | 5.968 | −2.452 | −8.674 | 3.136 |
| 2019 | 3.383 | 3.045 | 1.942 | −9.634 | −1.265 |
| Average effect | 1.384 | 0.902 | 2.620 | −6.029 | −1.122 |
| 2010–2019 | 12.458 | 8.120 | 23.583 | −54.262 | −10.100 |
Table 3.
Decomposition results of net carbon emissions from offshore fishing in China’s coastal provinces from 2010 to 2019 (104 tons).
Table 3.
Decomposition results of net carbon emissions from offshore fishing in China’s coastal provinces from 2010 to 2019 (104 tons).
| Region | Total Effect | ||||
|---|---|---|---|---|---|
| Tianjin | −0.033 | 0.342 | −0.508 | 0.599 | 0.400 |
| Hebei | 0.774 | 1.299 | −1.921 | −0.106 | 0.046 |
| Liaoning | 6.029 | 10.030 | −6.385 | −6.720 | 2.954 |
| Shanghai | −0.052 | −0.134 | 1.120 | −1.720 | −0.786 |
| Jiangsu | 4.136 | 4.157 | 1.141 | −4.123 | 5.311 |
| Zhejiang | −8.498 | −8.235 | 12.840 | −11.516 | −15.409 |
| Fujian | 8.921 | 4.704 | 1.925 | −5.449 | 10.102 |
| Shandong | −1.421 | −0.031 | 3.297 | −6.863 | −5.018 |
| Guangdong | −2.910 | −1.820 | 2.154 | −7.703 | −10.278 |
| Guangxi | −0.261 | −0.212 | −1.677 | −0.684 | −2.834 |
| Hainan | 5.280 | 1.303 | −0.202 | 0.273 | 6.654 |
Publisher’s Note: MDPI stays neutral with regard to jurisdictional claims in published maps and institutional affiliations. |
© 2022 by the authors. Licensee MDPI, Basel, Switzerland. This article is an open access article distributed under the terms and conditions of the Creative Commons Attribution (CC BY) license (https://creativecommons.org/licenses/by/4.0/).
Share and Cite
MDPI and ACS Style
Guan, H.; Chen, Y.; Zhao, A. Carbon Neutrality Assessment and Driving Factor Analysis of China’s Offshore Fishing Industry. Water 2022, 14, 4112. https://doi.org/10.3390/w14244112
AMA Style
Guan H, Chen Y, Zhao A. Carbon Neutrality Assessment and Driving Factor Analysis of China’s Offshore Fishing Industry. Water. 2022; 14(24):4112. https://doi.org/10.3390/w14244112
Chicago/Turabian StyleGuan, Hongjun, Yuhuan Chen, and Aiwu Zhao. 2022. "Carbon Neutrality Assessment and Driving Factor Analysis of China’s Offshore Fishing Industry" Water 14, no. 24: 4112. https://doi.org/10.3390/w14244112
Note that from the first issue of 2016, this journal uses article numbers instead of page numbers. See further details here.