Article

Impacts of Precipitation Type Variations on Runoff Changes in the Source Regions of the Yangtze and Yellow River Basins in the Past 40 Years

1
State Key Laboratory of Simulation and Regulation of Water Cycle in River Basin, China Institute of Water Resources and Hydropower Research, Beijing 100038, China
2
State Key Laboratory of Hydroscience and Engineering, Department of Hydraulic Engineering, Tsinghua University, Beijing 100084, China
3
College of Hydrology and Water Resources, Hohai University, Nanjing 210000, China
*
Authors to whom correspondence should be addressed.
Water 2022, 14(24), 4115; https://doi.org/10.3390/w14244115
Submission received: 29 September 2022 / Revised: 10 December 2022 / Accepted: 13 December 2022 / Published: 16 December 2022
(This article belongs to the Special Issue Impacts of Climate Change on Water Resources and Water Risks)

Abstract

:
Variations of precipitation type can exert substantial impacts on hydrological processes, yet few studies have quantified the impacts of precipitation type variations on runoff changes in high−altitude regions. In this study, we attempted to examine the potential impacts of precipitation type variations induced by the warming climate on the runoff changes of the source regions of the Yangtze River and Yellow River basins from 1979 to 2018, where the mean elevation is over 4000 m. A modified precipitation type identification method using the wet-bulb temperature, and a runoff change attribution method based on a modified Budyko framework has been applied. Results showed that fluctuations of precipitation contributed to the majority of the runoff variations in the source regions of the Yangtze River basin, which accounted for 51.64%. However, the changes of characteristic parameter n, which indicates the impacts of the underlying surface, explained 56.22% of the runoff changes in the source regions of the Yellow River. It was shown that the trend of shifting from snowfall to rainfall due to a warming climate could result in runoff decreasing, which contributed to 24.06% and 11.29% of the runoff changes in the two source regions, comparatively.

1. Introduction

Precipitation (P) has been recognized as one of the most sensitive variables to runoff changes. The amount, type, intensity, and duration of P can vary the hydrological processes to various extents [1,2]. Particularly, the variations of precipitation type (PT) induced by changing climate, which indicate the changes of the proportion of snowfall and rainfall, have been regarded as one of the driving forces of changes in hydrological processes and distribution of water resources [3,4,5,6]. P falling as snow is beneficial to the formation of snow cover and glaciers in cold regions, which alter the seasonal and annual rhythm of river discharge. On the contrary, P falling as rain can accelerate the melting of glaciers and snow cover and generate surface runoff directly. Therefore, it is of great importance to estimate the impacts of PT variations on hydrological processes.
It is estimated that PT changed significantly at the regional scale, which is particularly true in cold regions, e.g., the Qinghai-Tibetan Plateau (QTP). Results from Wang et al. [7] and Bo et al. [8] showed that the snow fraction significantly decreased on the QTP with a mean slope of −1.1% per decade from 1961 to 2016, while strong temporal variation and spatial heterogeneity were presented. The largest decreases of snow fraction occurred in autumn, followed by summer. Significant decreasing trends were found in the middle and east regions of the QTP. Zhu et al. [9], examined the changes of snow/precipitation ratio in seasonal frozen regions and permafrost regions in the QTP, which found that significant trends in these regions existed. Therefore, the temporal and spatial differences in the variations of PT give rise to the necessity of understanding the regional impacts on hydrological changes, particularly runoff changes.
Quantifying the contribution of anthropogenic factors and climate change to runoff changes is the basis for formulating adaptation strategies of water resources utilization against changing climate [10,11]. A number of study have used various statistical methods, hydrological models and paired watershed methods to examine the impacts of climate change and human activities on runoff changes [12,13,14]. However, the limitations of these studies still exist. For example, there always exists a lack of physical basis and adequate observation data to support the implementation of statistical methods [15]. Hydrological models facilitate rigorous physical interpretation and play an important role in exploring the water cycle. However, it has inherent drawbacks in terms of high input data requirements and complex model validation calibration, which increase the uncertainties of simulation results [15,16,17]. Since the paired watershed method is usually suitable for small watersheds, it could hardly be applied in large watersheds [18,19]. Compared with the above methods, the Budyko framework [20] requires only meteorological data as inputs and only one parameter to be calibrated [19]. Meanwhile, the Budyko method takes into account the water and energy constraints in long-term hydrological processes in a concise manner, estimating the contribution of climate variability and underlying surface changes to runoff variability in a more intuitive way, and on a clear physical basis.
Budyko [20] proposed a framework based on the long-term average water balance theory of a watershed that is controlled by the supply and demand of water (P and evaporation) in the atmosphere. Since 1974, a variety of forms of Budyko equations have been proposed based on the Budyko curve [21,22]. Due to the comprehensiveness and effectiveness of Budyko in studying the effects of climate and underlying surface conditions on hydrological processes, the framework has been widely applied in different regions globally, and has proven its excellent accuracy in large basins and at long-term scales [17,23]. Previous studies on the runoff changes attribution using the Budyko framework-based method, particularly in the QTP, mainly focused on separating the influence of climate and human factors on runoff variations [24,25]. However, few of them attempted to quantitatively evaluate the influences of snowfall on runoff variations. Although Zhang et al. [26] have developed a Budyko framework considering snowfall, they did so for the whole of China and only 1% of the alpine source area basins. There are still few studies on the source regions of alpine basins. Particularly, the differences of these effects between different alpine basins need to be further studied.
In this study, a modified PT identification method using the wet-bulb temperature was applied to investigate the spatio-temporal variations of snowfall proportions. Particularly, the improved Budyko framework considering snowfall, and a new division method of complementarity was used to further evaluate the impacts of snowfall proportions on runoff variations. The contribution rates of environmental factors to runoff changes were quantified. Two adjacent alpine river basins, i.e., the source regions of the Yangtze River (SRLR) and the Yellow River (SRYR), were selected as the study areas.

2. Materials and Methods
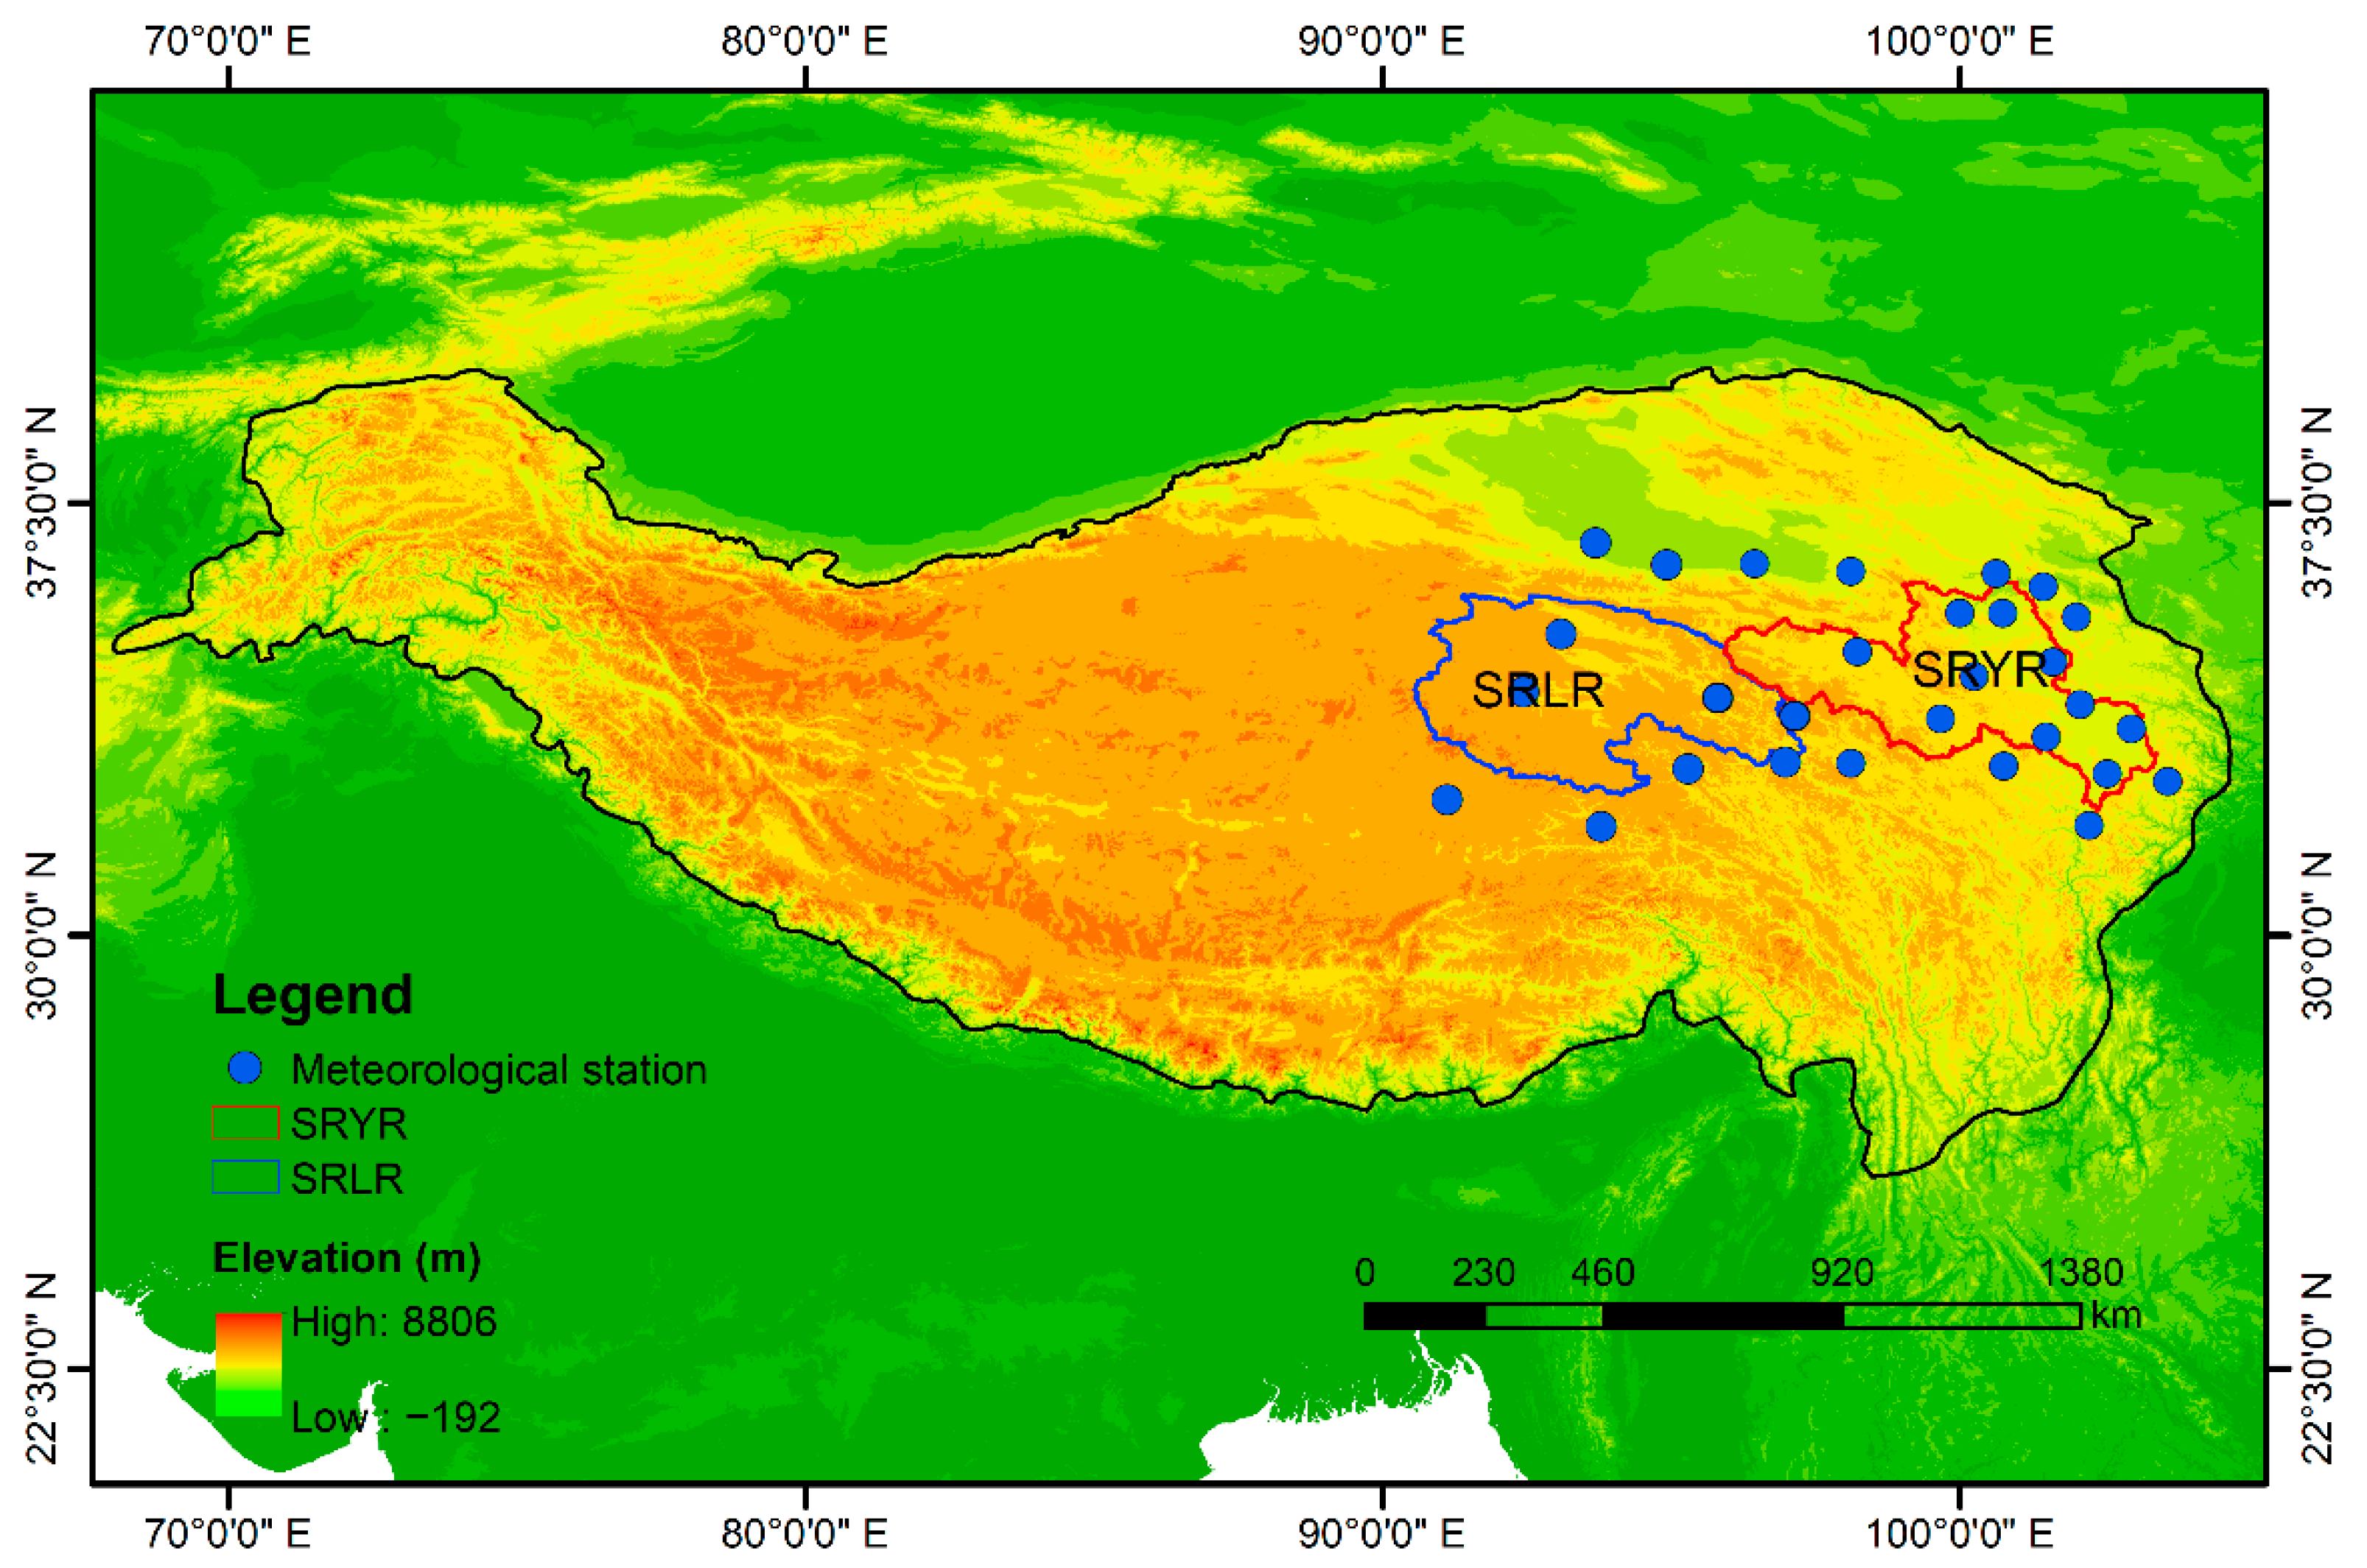
2.1. Study Area

The source regions of the Yangtze and Yellow River basins, abbreviated by the SRLR and SRYR, were selected as the study areas, which are located on the QTP with a mean elevation of 4533 m. The SRLR and SRYR, which are usually defined as the regions of the river basin with the outlets at Zhimenda and Tangnaihai hydrological stations, cover an area of 148,000 km2 and 122,000 km2, respectively (Figure 1). These two regions are regarded as high-altitude river basins, with an elevation ranging from 2569 to 6560 m. However, divergent climate characteristics are found in the two regions. The mean temperature of SRLR and SRYR are 0.16 °C and 0.86 °C, ranging from −1.49 °C in the winter to 2.08 °C in the summer. Nevertheless, the SRLR is relatively drier compared with the SRYR, with a mean annual P of 343.89 mm and 502.72 mm, respectively. It has been recorded that the SRLR and SRYR are getting warmer and wetter (You et al. [26], Zhang et al. [27], Chen et al. [28]), with an increasing rate of the mean annual temperature of 0.53 °C/10a and 0.48 °C/10a, respectively. Meanwhile, the increasing rate of mean annual P of SRLR and SRYR are 23.3 mm/10a and 34.6 mm/10a, respectively (Figure 2).

2.2. Identification of Precipitation Types

In this study, a PT identification method based on wet-bulb temperature (Tw), proposed by Ding et al. [29], was applied to distinguish the proportion of snowfall, sleet, and rainfall of P for the SRLR and SRYR. This method was regarded to have more satisfactory performance than other methods [4,30], e.g., methods based on temperature profile and other atmospheric conditions [31], methods using surface air conditions [32], etc. Particularly, an improvement of 35.42% in the average accuracy of PT identification was found in the QTP compared with Tw [29]. The specific steps of the method are described as follows.
First, the daily Tw was calculated for the date when P occurred:
T w = T a e s ( T a ) · ( 1 RH ) 0.000643 P a + Δ
e s ( T a ) = 6.1078 exp ( 17.27 T a T a + 237.2 )
where, T a is the daily mean temperature, °C, e s ( T a ) is the saturated vapor pressure at T a , kPa, RH is the relative humidity, the range is 0–1, P a is the atmospheric pressure, kPa, ∆ is the slope of the saturation water vapor pressure-temperature curve (kPa/°C), Δ = 4098 e s / ( T a + 237.2 ) 2 .
Then, the critical temperatures TA and TB are calculated to distinguish between PT: (TA is Tmin, TB is Tmax)
T A = { T 0 Δ S · ln ( e Δ T Δ S 2 · e Δ T Δ S ) , Δ T / Δ S > ln 2 T 0 ,     Δ T / Δ S ln 2  
T B = { 2 T 0 T A ,   Δ T / Δ S > ln 2 T 0 ,   Δ T / Δ S ln 2
where Δ T and Δ S   and   T 0 are functions of relative humidity (RH) and elevation (z, km), respectively: Δ T = 0.215 0.099 · RH + 1.018 · RH 2 , Δ S = 2.37 1.634 · RH and T 0 = 5.87 0.1042 · Z + 0.0885 · Z 2 + 16.06 · RH 9.614 · RH 2 . Δ T / Δ S = ln 2 , equivalent to RH = 78%. If RH > 78%, the T A and T B values are different, otherwise, T A and T B are the same. This means that the double threshold method is used when RH > 78% and the single threshold method is used when RH ≤ 78%. The latter means that the probability of sleet occurring at low relative humidity is negligible.
Finally, the magnitude of the wet-bulb temperature is compared with the critical temperature to determine the type of P occurring on that day:
PT = { snow , T w T A sleet , T A < T W < T B rain , T w T B

2.3. Modified Budyko Framework Considering Snowfall Factor

A modified Buydko framework was proposed by Zhang et al. [26] in this study to quantify the impacts of PT variations on runoff changes in high-altitude regions. A variety of forms of the Budyko framework have been developed in the past decades [22,33]. Particularly, the Budyko equation, developed by Choudhury and Yang [33], Equation (6), has been used to study the relationships between P, evapotranspiration, and runoff at the river basin scale [33].
1 Q P = [ 1 + ( ET p P ) n ] 1 n
where, P and ETp represent precipitation, and potential evapotranspiration, respectively, all of which are multiyear averages, and n is a characteristic parameter of the underlying surface.
Regarding the Equation (6), the potential evapotranspiration (ETp) at each station was estimated using the Penman-Monteith equation recommended by the Food and Agriculture Organization (FAO) [34]. The Ordinary Kriging interpolation method was used to calculate the spatial distribution of precipitation and potential evapotranspiration. Ordinary Kriging interpolation uses the generalized least squares method to unbiased and optimally estimate the above expressions to obtain weight values, the limitation of which is that the interpolation results are affected by spatial stationarity. However, the ordinary Kriging interpolation method can be used for spatial interpolation, and the prediction results and prediction errors can be obtained at the same time, which is convenient for evaluating and analyzing the accuracy of the prediction results, and it has good smoothing effect to reduce the influence of extreme outliers on the overall distribution of the sample.
ET p = 0.408 Δ ( R n G ) + γ 900 T + 273 μ 2 ( e s e a ) Δ + γ ( 1 + 0.34 μ 2 )
where ETp is the potential evapotranspiration (mm day−1), Rn represents the net radiation of the crop surface (MJ m−2 day−1), G represents the heat flux density of the soil (MJ M−2 Day−1), T represents the daily mean air temperature (°C), μ 2 is the wind speed at 2 m altitude (m s−1), es is the saturated vapor pressure (kPa), ea is the actual vapor pressure (kPa), es − ea is the insufficient vapor pressure (kPa), Δ is the slope of the vapor pressure (kPa°C−1), and γ is the enthalpy-humidity constant (kPa°C−1).
When the surface temperature rises to a certain level, the snow begins to melt and enters the water cycle process as moisture [35]. Therefore, a variable, snow ratio (SR) was introduced into the Budyko framework to quantify the impacts of PT variations on annual runoff changes. The snow ratio (SR) was calculated by the ratio of the mean annual snowfall to the mean annual P.
1 Q P = [ ( 1 SR )   n + ( ET p P )   n ] 1   n
The sensitivity factors for each of these elements are:
Q P = 1 P Q P ( ET p ) n [ ( 1 SR ) P ] n + ( ET p ) n
Q ET p = P Q ET p [ ( 1 SR ) P ] n [ ( 1 SR ) P ] n + ( ET p ) n
Q SR = P Q 1 SR ( ET p )   n [ ( 1 SR ) P ]   n + ( ET p )   n
Q n = P Q n ( ln [ ( 1 SR ) n P n + ( ET p ) n ] n [ ( 1 SR ) P ] n ln [ ( 1 SR ) P ] + ( ET p ) n ln ( ET p ) [ ( 1 SR ) P ] n + ( ET p ) n )
Equation (9) can be abbreviated as Q = f (P, ETp, SR, n′), and the runoff elasticity coefficient for each independent variable x can then be calculated as follows:
ε x = Q x × x Q
where ε x is the elasticity coefficient, and x represents each influence factor (P, ETp, SR, n′). A positive elasticity coefficient for a variable indicates that Q increases as the variable increases, while a negative elasticity coefficient indicates that Q decreases as the variable increases.
A complementary method, proposed by Zhou et al. [36], has been applied to examine the relative contributions of environmental factors to runoff changes. Particularly, the impacts of PT variations were quantified by calculating the relative contribution of SR on annual runoff changes, when factors including P, evapotranspiration, and snowfall ratio were considered. The annual runoff changes could be calculated using Equation (14).
Δ Q = α [ ( Q P ) 1 Δ P + ( Q ET p ) 1 Δ ET p + ( Q SR ) 1 Δ SR + P 2 Δ ( Q P ) + ET p , 2 Δ ( Q ET p ) + SR 2 Δ ( Q SR ) ] + ( 1 α ) [ ( Q P ) 2 Δ P + ( Q ET p ) 2 Δ ET p + ( Q SR ) 2 Δ SR + P 1 Δ ( Q P ) + ET p , 1 Δ ( Q ET p ) + SR 1 Δ ( Q SR ) ]
where, α is a weighting factor taking values in the range [0, 1] and following the recommendation of [36], using α = 0.5 is quite close to the best estimate of the magnitude of the climate effect and basin effect, with subscripts 1 and 2 denoting two different stages considering the changes of climatic factors, respectively. Hence, the relative contributions of P, ETp, SR, and n’ to the changes in Q are:
C _ ( P ) = α [ ( Q P ) 1 Δ P ] + ( 1 α ) [ ( Q P ) 2 Δ P ]
C _ ( ET p ) = α [ ( Q P ) 1 Δ ET p ] + ( 1 α ) [ ( Q ET p ) 2 Δ ET p ]
C _ ( SR ) = α [ ( Q SR ) 1 Δ SR ] + ( 1 α ) [ ( Q SR ) 2 Δ SR ]
C _ ( n ) = α [ P 2 Δ ( Q P ) + ET p , 2 Δ ( Q ET p ) + SR 2 Δ ( Q SR ) ] + ( 1 α ) [ ( Q SR ) 2 Δ SR + P 1 Δ ( Q P ) + ET p , 1 Δ ( Q ET p ) + SR 1 Δ ( Q SR ) ]

2.4. Statistical Analysis

The Pettitt nonparametric test, which has been widely used in hydrologic and climatic fields [37,38,39], is applied to identify points of abrupt change point of the annual runoff series [40]. The state variables of the Pettitt nonparametric test were calculated using the following equations.
U k , N = i = 1 k sgn ( X i X j )
K = max 1 k N | U k , N |
P 2 exp [ 6 K 2 / ( N 3 + N 2 ) ]
where, Xi and Xj are the sequence values of time i and j, respectively, N is the total number of elements in the series, and the breakpoint K is determined by the maximum value of UK,N, and the significance level of this study was set at 0.05.

2.5. Data

Meteorological data, including the T, P, relative humidity, sunshine hours, wind speed, and air pressure, were obtained from The China Meteorological Data Service Center (http://www.cma.gov.cn/, accessed on 18 March 2021). Particularly, the China Surface Climate Data Daily Value Dataset (V3.0) was selected due to its high quality and adequate amount of data in this study, in which meteorological data from 1979 to 2018 were extracted. In this study, 29 stations that fall in or surrounding the two sources regions were used, where the basic information of the stations was listed in Supplementary Material (Table S1). Monthly discharge data of Zhimenda and Tangnaihai stations from 1979 to 2018 were derived from the hydrologic data yearbook, which represents the outlets of the source regions of the Yangtze and Yellow river basin, respectively. Basic information about the hydrological stations were demonstrated in the Supplementary Materials. Additionally, the digital elevation model (DEM) data with a spatial resolution of 90 m was obtained from the SRTM (Shuttle Radar Topography Mission), which was derived from the Geospatial Data Cloud (http://www.gscloud.cn/, accessed on 5 February 2022).

3. Results

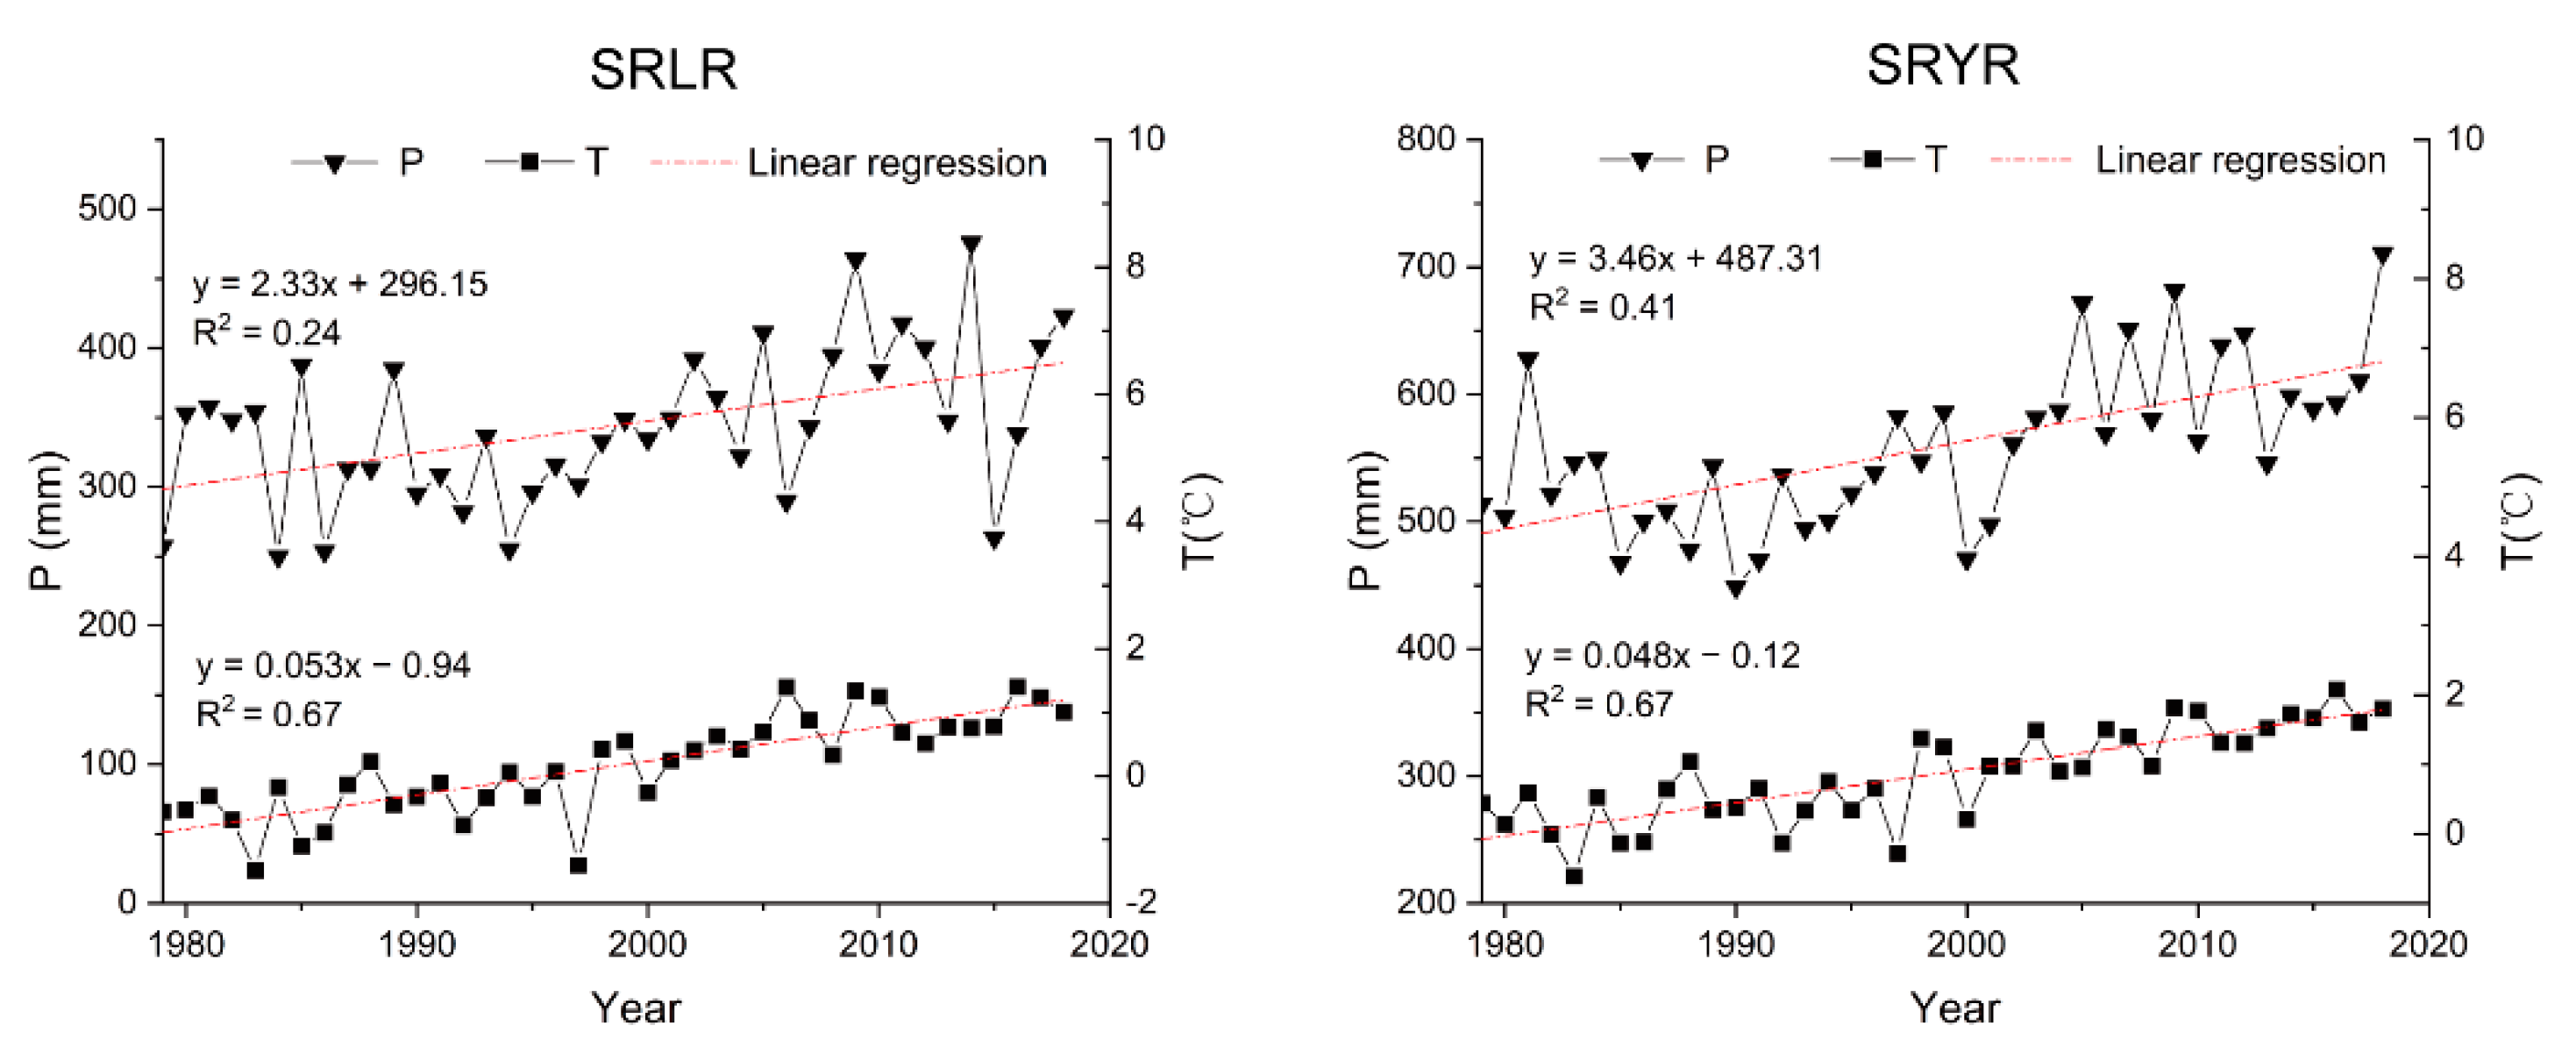
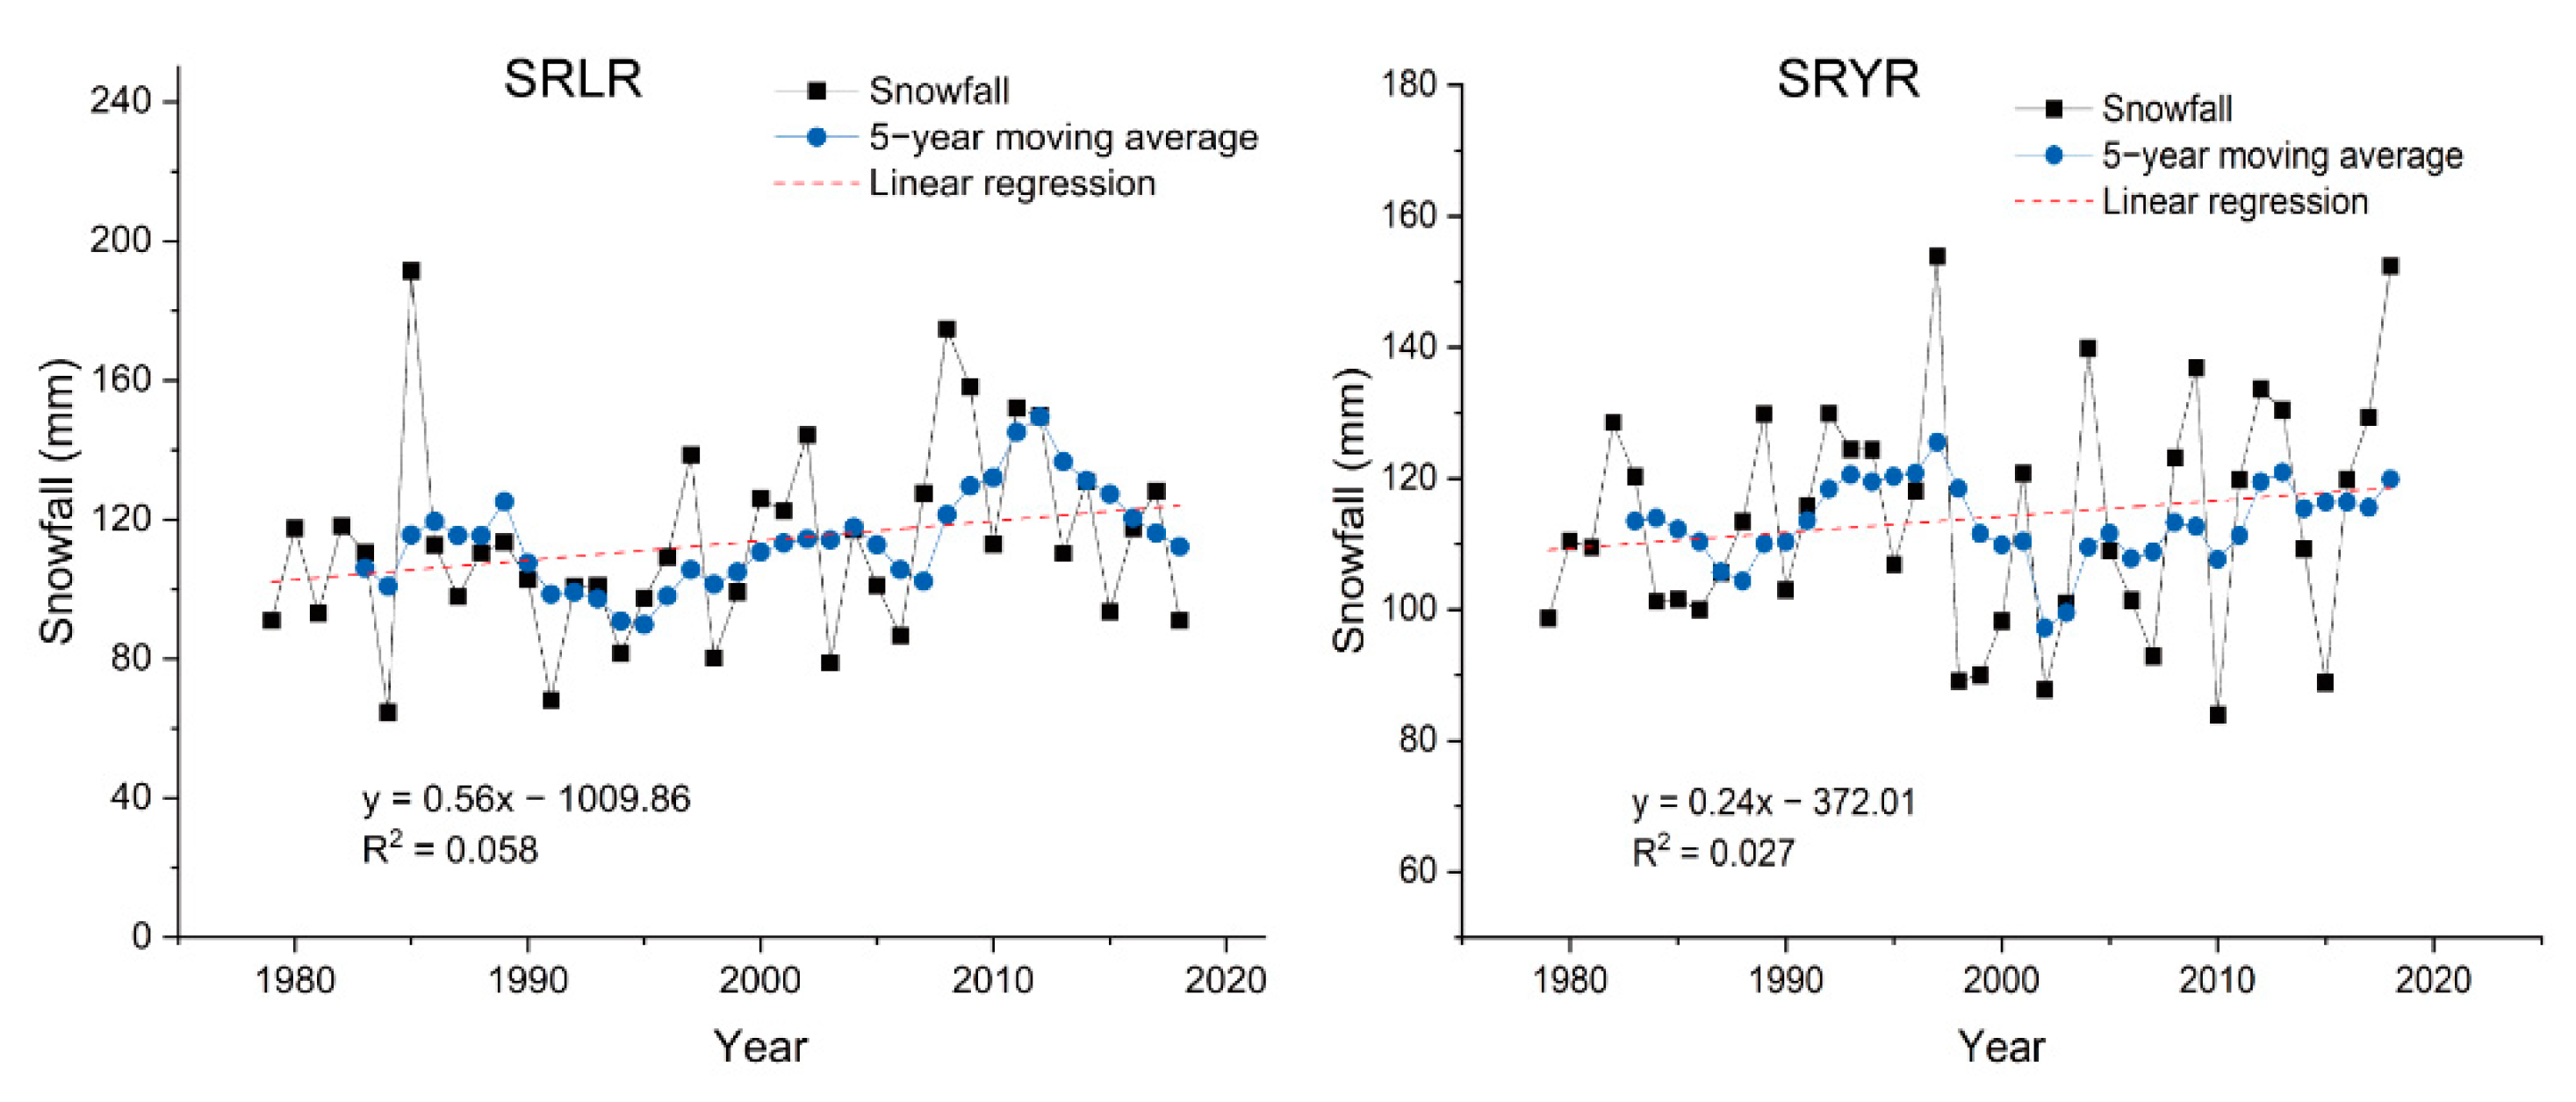
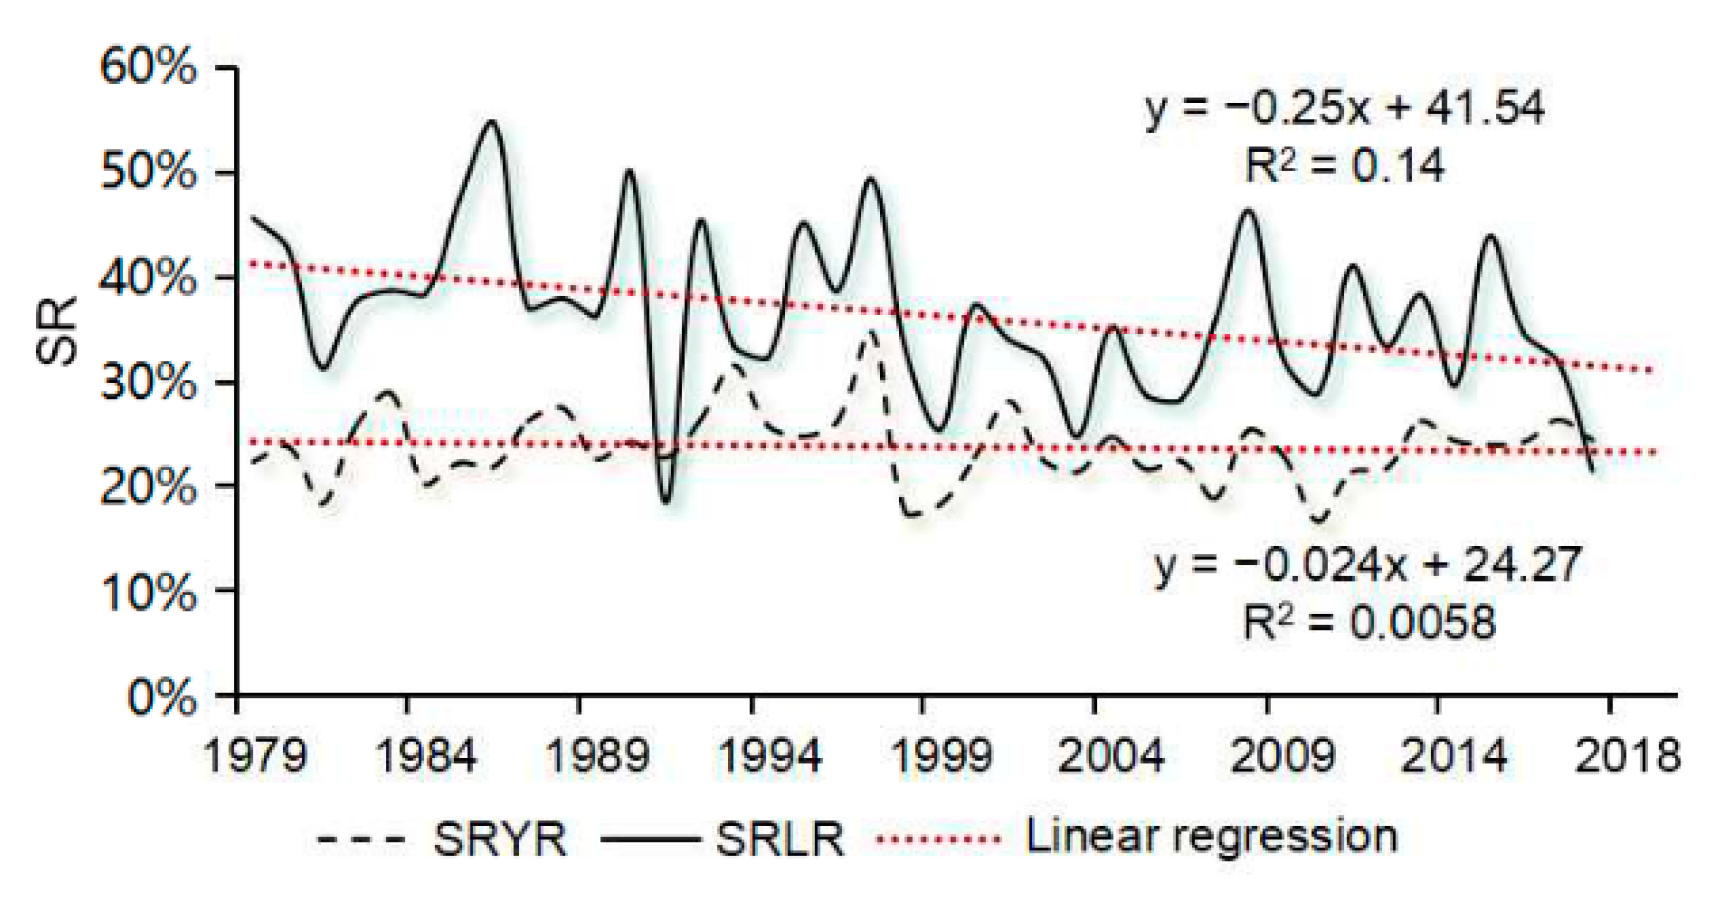
3.1. Variations of the Precipitation Type of the SRLR and SRYR

The PT identification results showed that the average annual snowfall amount of the SRLR and SRYR increased at a rate of 5.62 mm/10a and 2.43 mm/10a, respectively, with a mean value of 113.07 mm and 113.83 mm from 1979 to 2018 (Figure 3). However, the proportions of the PTs in the two source regions have experienced significant changes in the past four decades. The proportions of snowfall, indicated by SR, showed a decreasing trend with a rate of 2.50%/10a and 0.24%/10a for the SRLR and SRYR, respectively (Figure 4). The proportions of snowfall in P of the SRLR and SRYR in the 1980s were 42.75% and 27.82% respectively. However, these proportions decreased to 28.85% and 16.66% in the 2010s.
Strong spatial heterogeneity was presented in terms of SR and SR trends in the SRLR and SRYR (Figure 5). Results showed that SR in SRLR is higher in the northern and eastern regions and lower in the southern regions, while SR in SRYR is higher in the western regions and lower in the northern, eastern, and southern regions. There was a significant decreasing trend in SR in the northern and central regions of SRLR and a significant decreasing trend in SR in the western and northern regions of SRYR. In addition, we divided the watersheds at 500 m intervals with reference to the studies of Liu et al. [41] and Guo et al. [42] in the Tibetan Plateau region and found that the variations of SR were found to be elevation-dependent (Figure 6). Results showed that the SR trend of SRLR was stable below 4500 m and fluctuated greatly above 4500 m, while the SR trend of SRYR was more stable below 3500 m and fluctuated in the range above 3500 m. The mean values of SR trend also showed a weak upward trend with the increasing of altitude, with an SR trend of −0.83 for SRLR below 4500 m and an SR trend of −0.20 for regions above 4500 m, and an SR trend of −0.15 for SRYR below 3500 and an SR trend of −0.14 for regions above 3500 m. This trend may be related to the altitude dependence of warming on the Tibetan Plateau, that is, warming is significantly higher at higher altitudes than at lower altitudes, and the temperature rise at high altitudes tends to increase with increasing altitude.

3.2. Variations and Attributions of Runoff Changes of the SRLR and SRYR

This study analyzed the evolutionary characteristics of runoff based on measured annual runoff data from the study basin. The results showed that the long-term average runoff depths for SRLR and SRYR are 99.95 mm and 163.40 mm, respectively. According to the 5-year moving average curve, the SRLR runoff depth increased significantly at a rate of 7.41 mm/10a, while the SRYR runoff decreased at a rate of 7.64 mm/year (Figure 7). The Pettitt method was used to analyze the runoff time series data of the Zhimenda and Tangnaihai hydrological station from 1979 to 2018. Figure 8 displays the trend and catastrophe analysis results of runoff in both basins, with SRLR runoff depth mutating in 2004 and SRYR runoff depth mutating in 1990. Therefore, the runoff series can be divided into two periods, the baseline period and the change period, according to the year of the abrupt change. The average runoff depths for the SRLR baseline period (1979–2004) and the change period (2005–2018) were 90.58 mm and 117.35 mm. A comparison of the two periods indicated a more significant increase in SRLR runoff. Similarly, the average runoff depths for the SRYR baseline period (1979–1990) and the change period (1991–2018) were 190.31 mm and 151.87 mm, indicating a decrease of 38.44 mm.
It was shown that P was the dominant factor affecting SRLR runoff (Figure 9), with a contribution of 51.64%, and n′ has the largest contribution to the reduction of runoff in the SRYR, accounting for 56.22%. ETp has the least influence on the runoff in the two study basins, with contributions of 2.61% and 1.26%. The annual decrease in SR contributed −24.06% to SRLR runoff and −11.29% to SRYR runoff. The different roles played by climatic factors in the attribution of runoff changes are consistent with the results of their trend analysis.
The elasticity coefficients of runoff to P, SR, ETp, and n′ were calculated by the Budyko formula. According to Table 1, the differences in hydrological variables and the estimated watershed parameter n′ between the two stages were compared, and the absolute value of the elasticity coefficient of ETp to runoff was the largest. For SRLR, a 1% increase in P would result in a 1.43–1.53% increase in runoff, and for SRYR, a 1% increase in P would result in a 1.62–2.10% increase in runoff. The elasticity coefficients for runoff to ETp and n′ were both negative, with a 1% increase in ETp leading to a 2.01–2.23% decrease in runoff and a 1% increase in n′ leading to a 0.86–1.07% decrease in the runoff for SRLR. For SRYR, a 1% increase in ETp would result in a 1.49–2.84% decrease in the runoff, and a 1% increase in n’ would result in a 1.13–1.81% decrease in the runoff. There was a positive correlation between SR and runoff in both catchments, with a 1% increase in SR in SRLR leading to a 1.14–1.29% increase in runoff and a 1% increase in SR in SRYR leading to a 0.47–0.85% increase in runoff. Comparing the elastic coefficients of all the factors in the base period and the change period, the absolute values of all the factors except SR increased, indicating that the sensitivity of these factors increased. The elasticity coefficient of SR decreased in both basins, indicating that the sensitivity of runoff to SR decreased.
Based on the calculation of the elasticity coefficients, the complementary method was used to distinguish the influence degree of each factor on the runoff changes. Table 2 summarized the changes in runoff caused by each factor and it can be seen that the simulated runoff variation Δ Qsim has an error of less than 5% compared to the measured runoff Δ Qobs , indicating that the Budyko equation considering SR performed well in the attribution analysis of runoff. As shown in Figure 9, P is the dominant factor affecting SRLR runoff.
It should be noted that the effect of snowfall on runoff is important, and the contribution rate of SR to runoff were negative in both basins. The study found that the phase shift from snow to rain significantly reduced the average flow. In addition to the effects of P and ETP, the changes in runoff were also largely attributed to the changes in n′. Overall, from 1979 to 2018, underlying surface changes contributed positively to both SRLR and SRYR runoff.

4. Discussion

4.1. Precipitation Type Identification in High-Altitude Regions

P in the SRLR and SRYR has increased significantly over the last four decades, with a maximum rate of increase of 34.6 mm/10a. Previous studies have shown that annual P has increased in most regions of the Tibetan Plateau since the 1960s [43]. Yan et al. [44] found that the annual mean temperature increase at over 2000 m on the Tibetan Plateau was greater than the global rate of increase, indicating that the surface temperatures rose faster at higher altitudes. The significant rising of temperature could play a key role in affecting the snowfall and its proportions in precipitation [45]. Deng et al. [46] showed that 59.1% of stations on the Tibetan Plateau showed an increasing trend in snowfall, which was consistent with the results found in this study. However, the impacts of warming on snowfall may be reflected in the proportions to P, i.e., the SR, as can be seen in Figure 4. The results showed that the SR of SRLR and SRYR decreased at 2.50%/10a and 0.24%/10a, respectively. It has been found that more proportions of precipitation fall as rain than that as snow in cold regions, e.g., the QTP [7], the western United States [47] and New England [48], making SR decline a global problem. The results were similar to those of Wang et al. [49] who found that SR declined at a rate of −0.164/10a throughout the year except for November on the QTP. Spatially, the SR declined more significantly in the southwestern and central regions of the QTP. It can been seen from the results that the rate of SR decline in the SRLR region in this study was ten times greater than that of the SRYR, which is located in the central part of the Tibetan Plateau (Figure 1), and thus its SR decline rate was faster than that of the SRYR.
Results also showed that the changes of SR were closely related to altitude, with SRLR and SRYR taking 4500 m and 3500 m as the critical thresholds, respectively, below which SR trends are more stable, and SR trends increase with altitude. Deng et al. [46] showed that the effect of altitude on snowfall trends is also significant. Li et al. [50] found that P occurs as snowfall in areas above 3500 m in Xinjiang. Guo et al. [51] in the Tianshan region found that SR decreased significantly below 2500 m in altitude between 1961 and 2010, and at high altitudes above 3500 m The decrease in SR at high altitudes above 3500 m was small.

4.2. Impacts of Precipitation Type Variations on Runoff Changes at River Basin Scale

Reliable attribution of runoff changes is fundamental to our understanding of the hydrological cycle, and essential for decision makers to manage water resources sustainably [52]. Many scholars have analyzed the contribution of SRLR and SRYR to the long-term variation in runoff using a variety of methods. For instance, Jia et al. [53] studied the runoff characteristics of SRLR from 1964 to 2018 and found that the contribution of P to the changes of runoff was 67.5%. Zheng et al. [54] found that land use and land cover changes dominated the effect of SRYR from 1990–2000, contributing about 70% of the runoff changes. Snowfall is an important source of irrigation and drinking water in alpine regions. Due to the different trends in the phase transformation of P, the sources of runoff recharge change significantly, including the types of possible recharge sources and their respective proportions. The effects of rainfall or snowfall on runoff could not therefore be considered simply. The results of this study, which took snowfall into account, show (Figure 9) that SR contributes 24.06% and 11.29% to SRLR and SRYR runoff variations, respectively, in the context of the Budyko hypothesis, indicating that SR has a significant influence on runoff, which has often been overlooked in previous studies. Changes in SR may lead to future regional water shortages [55], and studies in the Alpine basin have shown that declines in SR can lead to summer water shortages or flood disasters [56]. The decline in SR will lead to a delay in the start of the snow season and an earlier end of the season, and will also affect the accumulation and melting processes of glaciers. Thus influenced by changes in PTs, more uncertainty is expected in runoff predictions for snowmelt and P recharge rivers, and changes in water flow and water resources will be more complex. Therefore, clarifying the mechanisms influencing SR changes and the sensitivity of runoff to SR changes will be important for future water resources management policies.

4.3. Impacts of Underlying Surface Conditions on Runoff Changes in High-Altitude Regions

Many studies have shown that parameter n’ is a function of human activities, soil properties, topography, and land-cover vegetation [57,58,59,60]. According to Zhang et al. [61], the SRYR grassland area has decreased by approximately 10% since 1990, and the sand area has increased by approximately 4%. Liu et al. [62] found an increase in grassland and wetland area in SRLR, and a significant decrease in grassland cover in SRYR over the nearly 30-year period from the late 1970s to 2012, with a more dramatic overall change in SRYR. The increase in vegetation area may intercept more P and will increase actual evapotranspiration, negatively impacting runoff [63]. The QTP has a wide distribution of cryosphere, complex topography, and ecosystems, and climate warming has caused permafrost degradation and glacier retreat in the study area [64,65]. Jin et al. [66] found that from 1980 to 2016, the multi-year permafrost area in the SRYR shrank by about 2000 km2 and the active layer thickness expanded at a rate of 35 cm/10a. Shi et al. [67] showed that the active layer thickness (ALT) in the SRLR increased at a rate of 4.2 cm/10a from 1982 to 2015. These processes can have a considerable impacts on hydrological processes. The results of this paper show that the main factor of SRYR runoff reduction is parameter n′, which may be due to the drastic changes of the underlying surface and the obvious degradation of frozen soil. The comparison showed that the rate of permafrost degradation is much greater in the SRYR than in the SRLR, and that the overall magnitude of land use changes is more dramatic, which may lead to the parameter n’ being the dominant factor in runoff changes in the SRYR rather than climate.

5. Conclusions

In this study, a wet-bulb temperature-based PT identification method was presented to detect the changes of the proportions of snowfall and rainfall from 1979 to 2018. Afterward, a modified Budyko framework considering the snowfall ratio was applied to examine the impacts of environmental factors on annual runoff changes. The main conclusions are presented as follows.
(1)
The proportions of snowfall decreased at 2.50%/10a and 0.24%/10a for the source regions of the Yangtze and Yellow River basins, respectively, while the snowfall amount increased due to the increase of P amount.
(2)
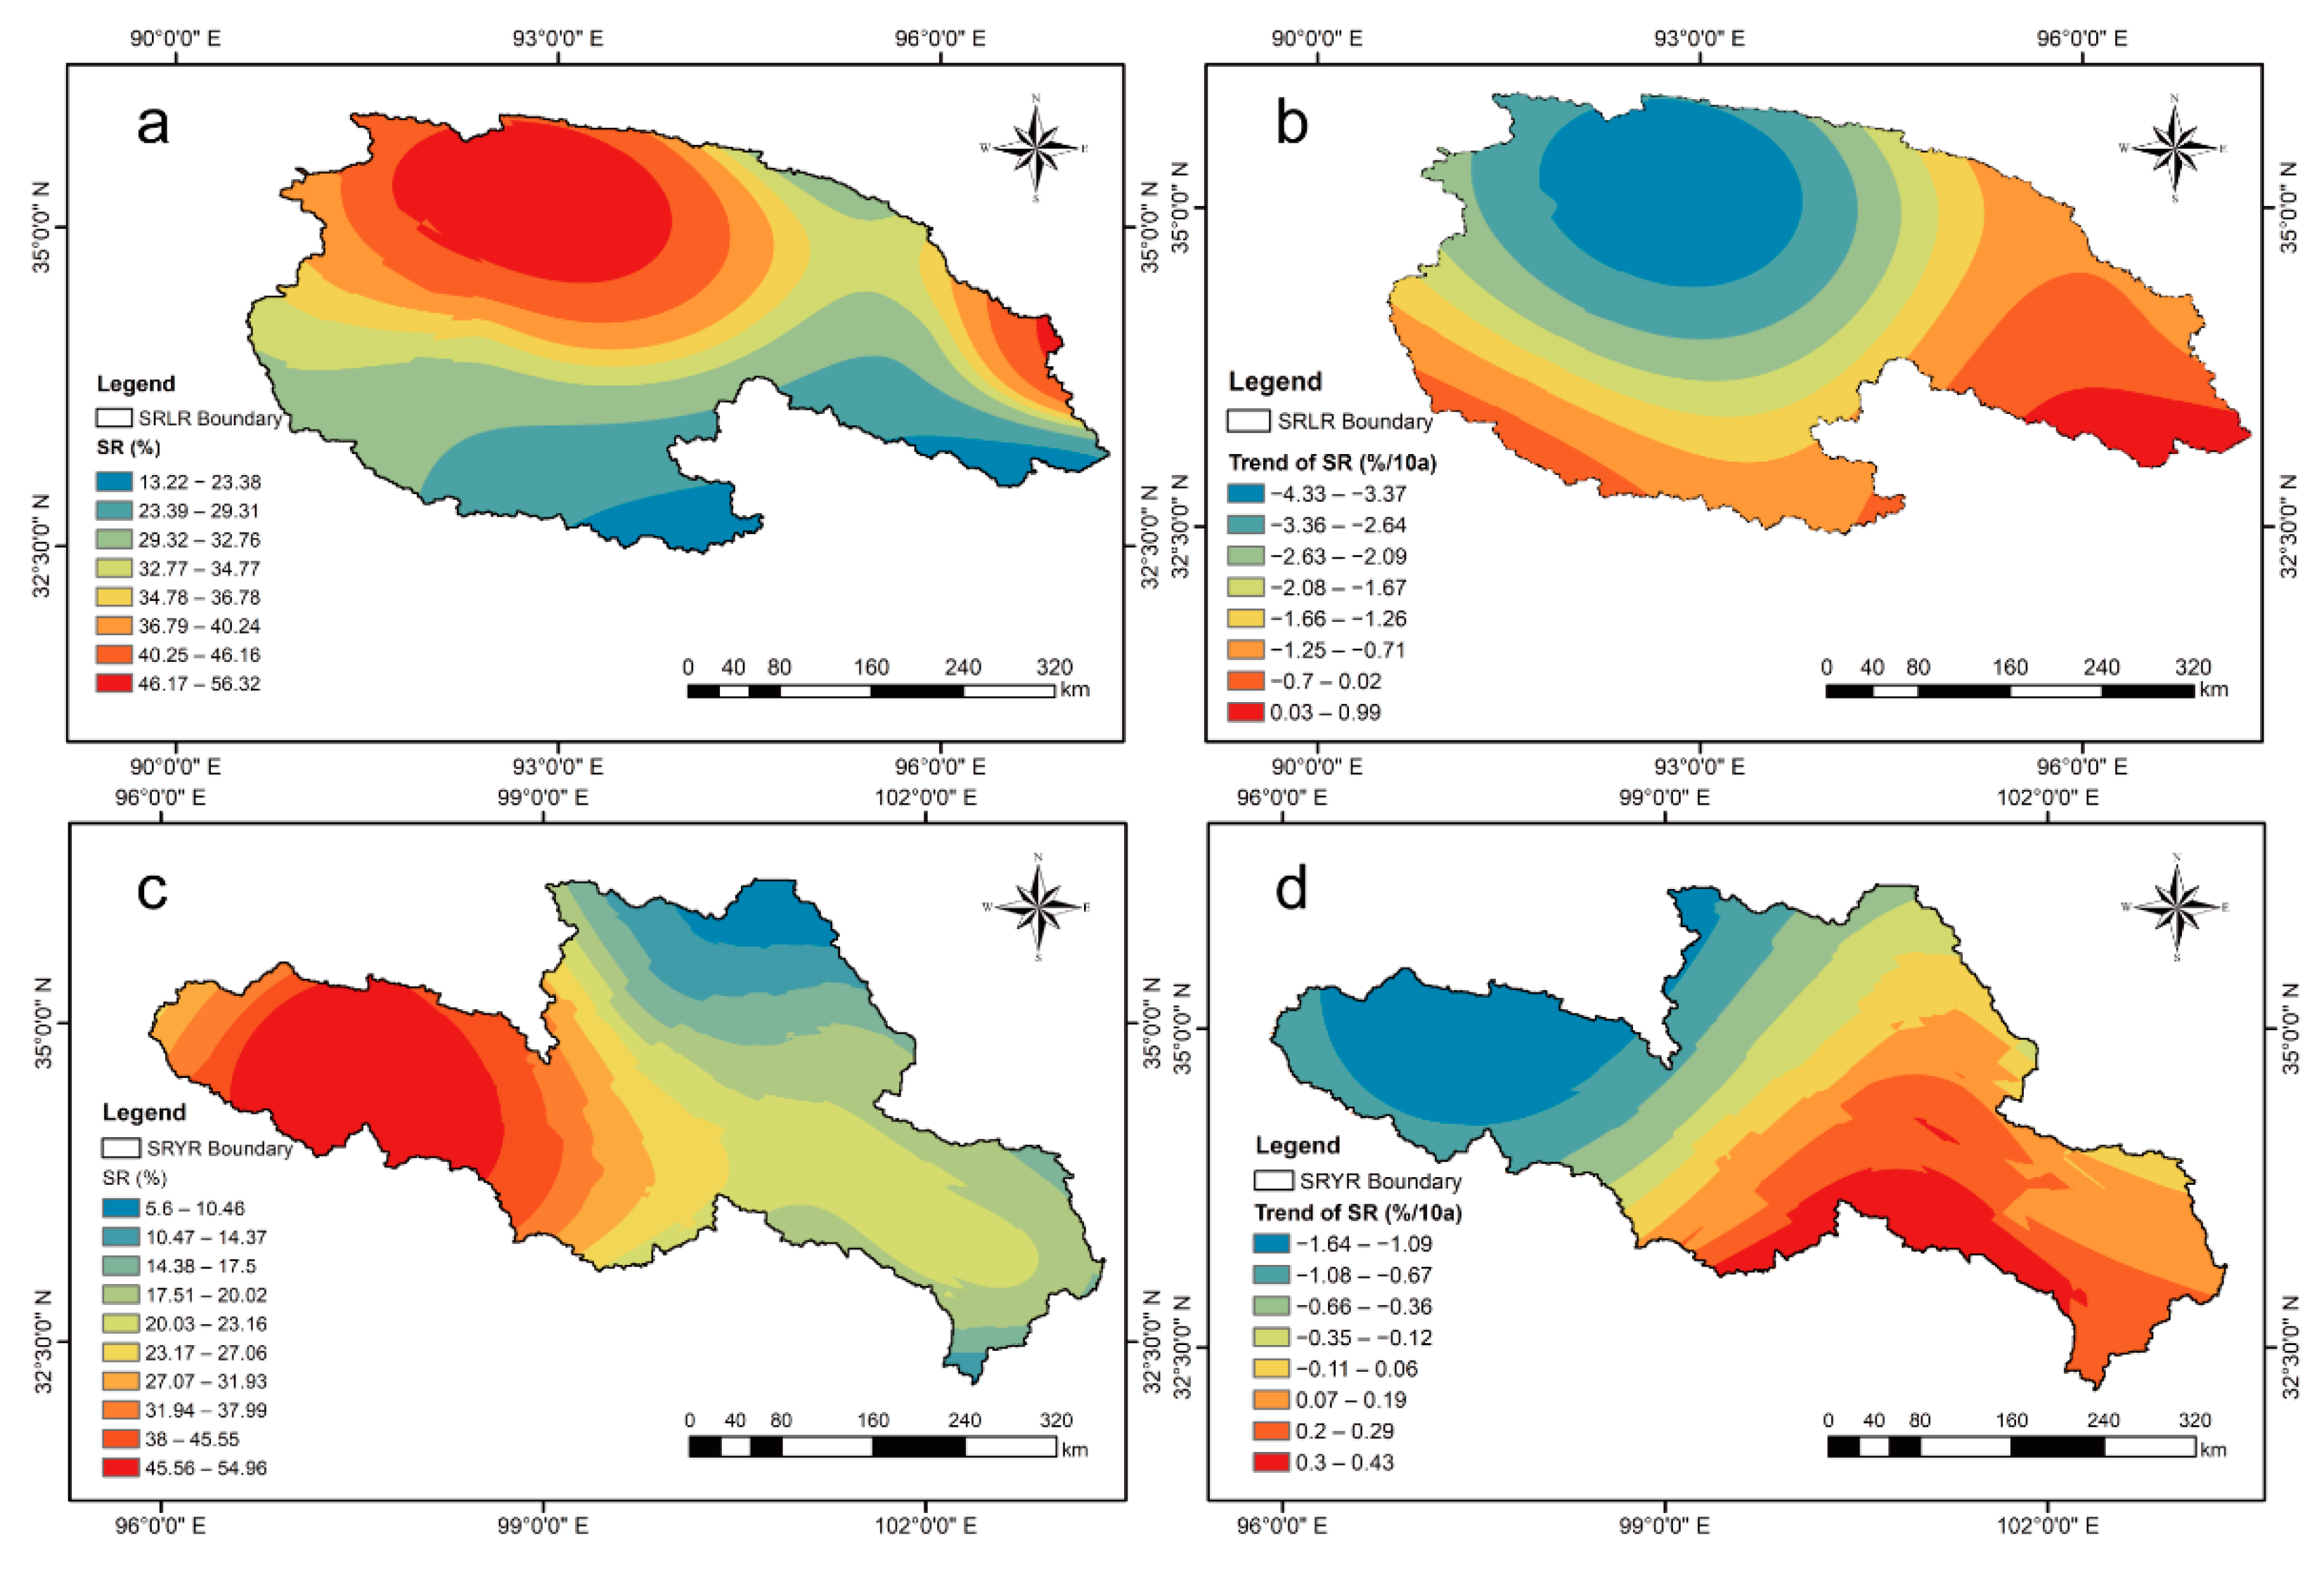
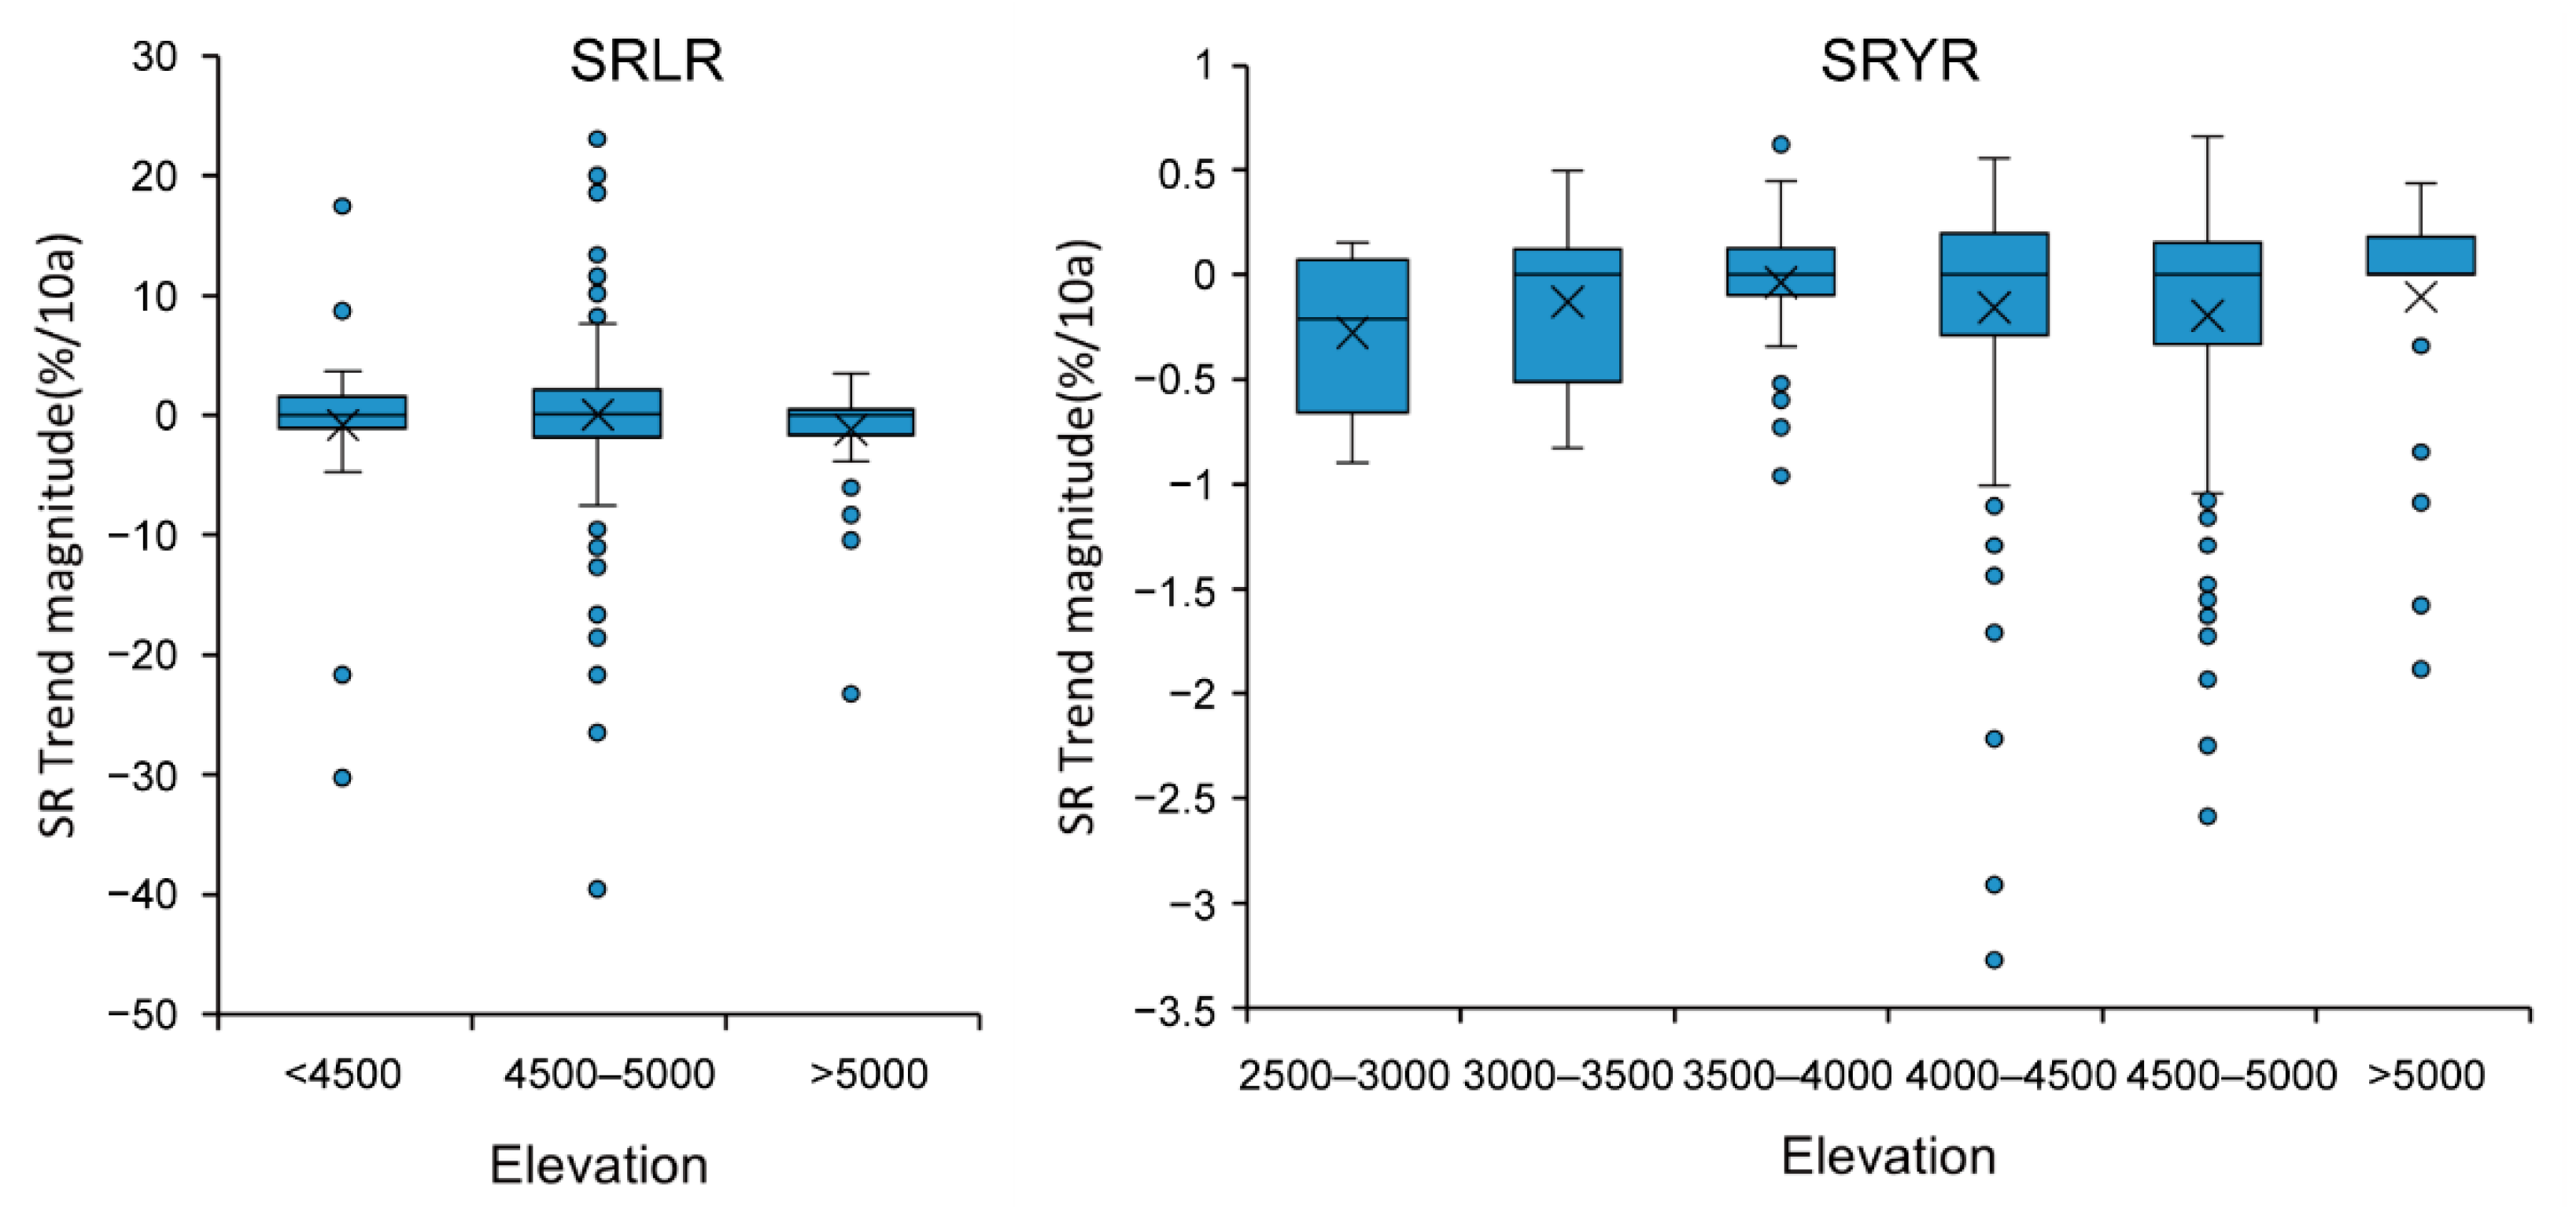
Strong spatial heterogeneity of the SR variations has been found in the two regions. Particularly, SR trends for SRLR and SRYR are more stable below the 4500 m and 3500 m thresholds, respectively, and more volatile above the thresholds.
(3)
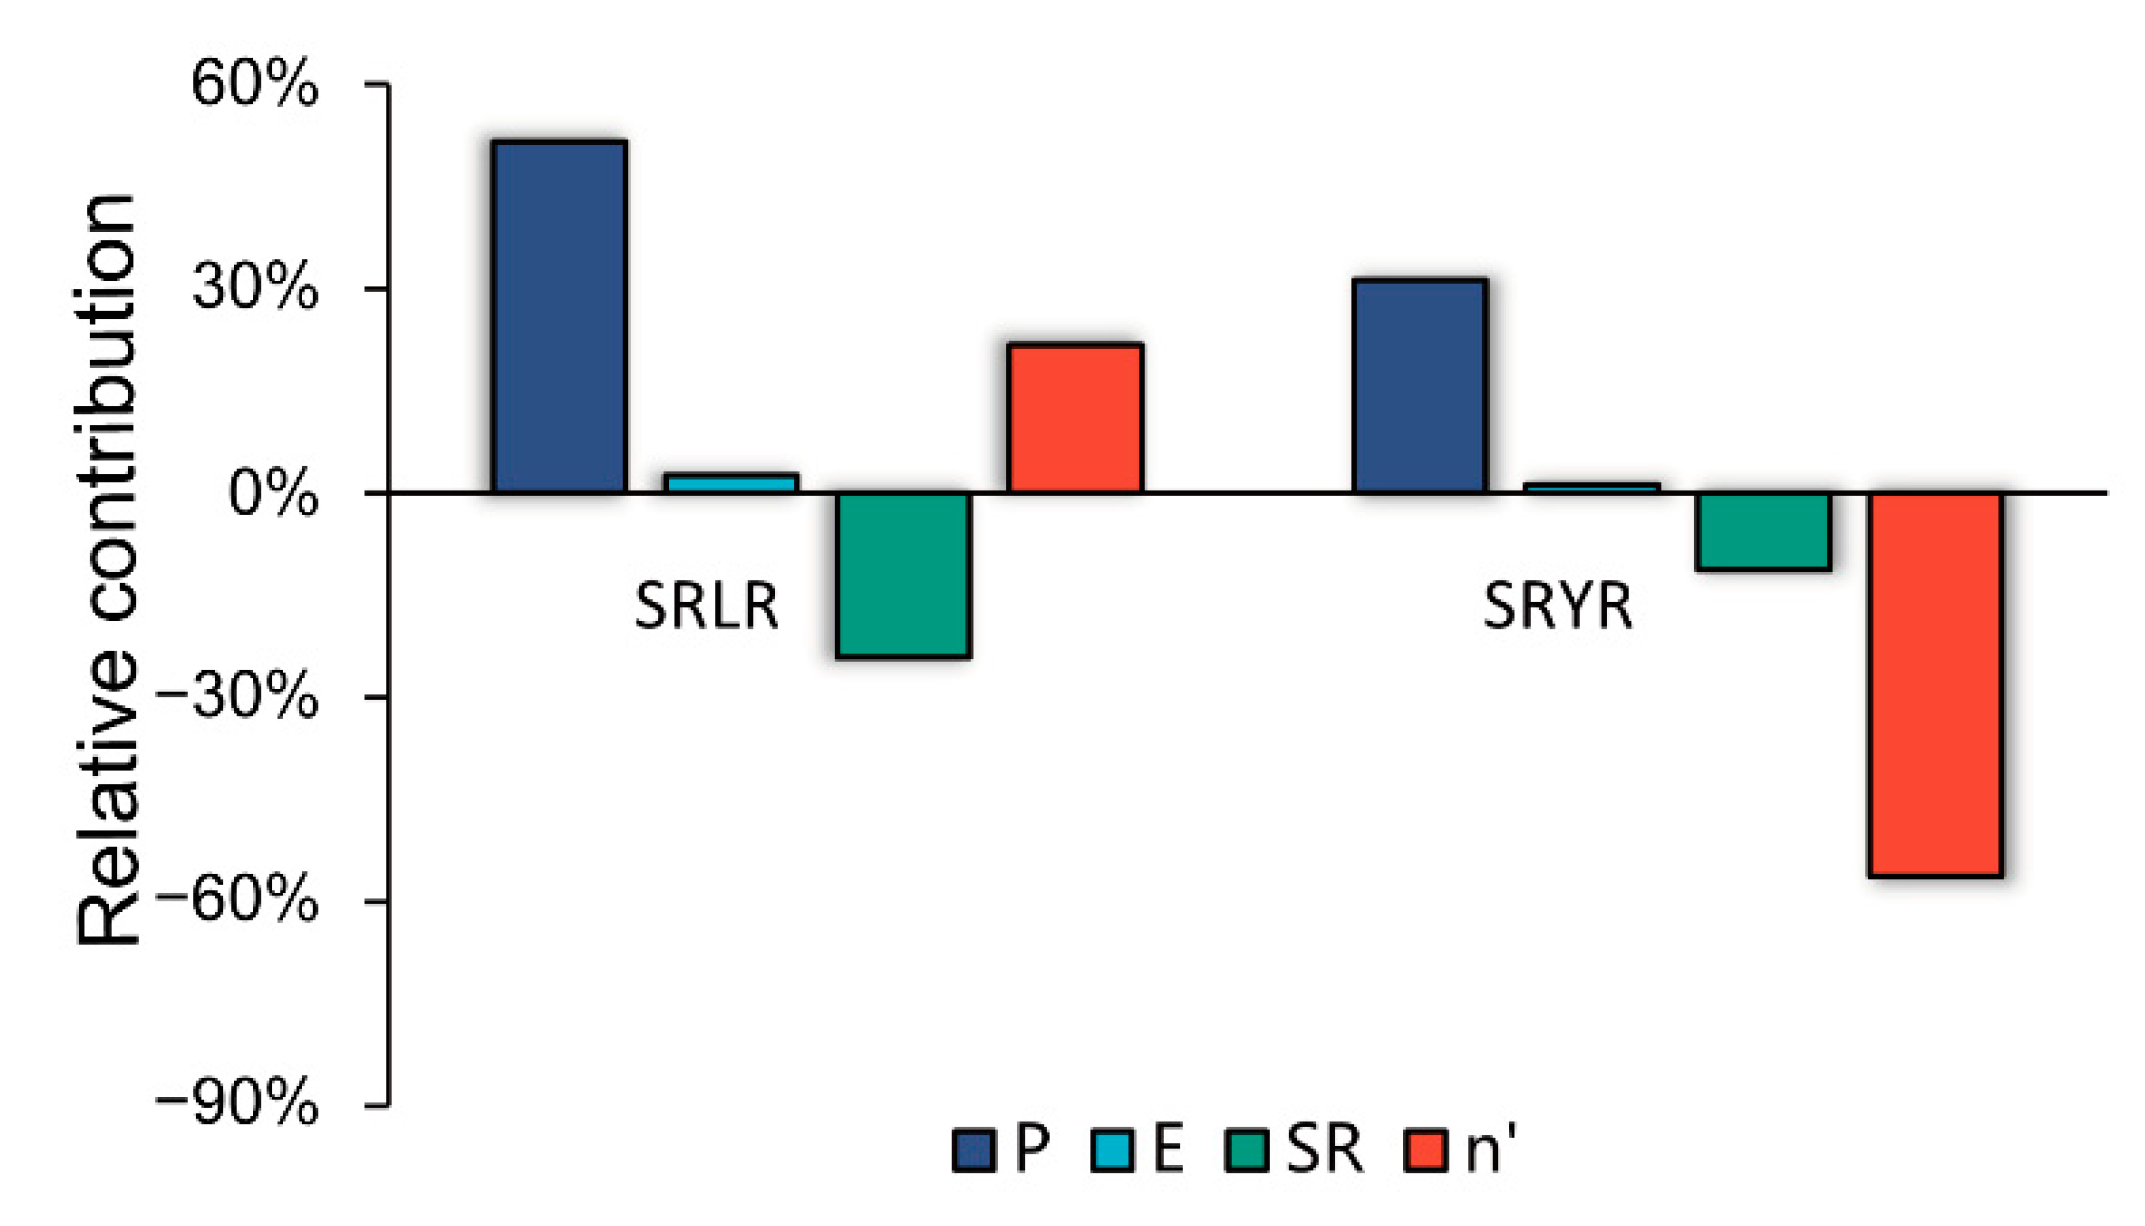
The impacts of PT variations on runoff changes in the SRLR were relatively larger than that in the SRYR, with a relative contribution of −24.06% and −11.29%, respectively. Particularly, the impacts of underlying surfaces on annual runoff changes were not negligible in the SRYR, since a significant increasing trend was found in the vegetation recovery in this region. Apart from that, the variations of PT and cryospheric conditions will exert substantial impacts on the inter-annual and intra-annual runoff changes.

Supplementary Materials

The following supporting information can be downloaded at: https://www.mdpi.com/article/10.3390/w14244115/s1, Table S1: Information for meteorological stations. Table S2: Information for hydrological stations.

Author Contributions

Conceptualization, Y.H., Y.Z. and Y.W.; methodology, Y.Z.; software, J.L.; validation, Y.H., J.L., Y.Y. and W.X. (Weihua Xiao); formal analysis, Y.H.; data curation, Y.H.; writing—original draft preparation, Y.H.; writing—review and editing, F.L., W.X. (Wei Xue) and B.H.; funding acquisition, Y.Z. All authors have read and agreed to the published version of the manuscript.

Funding

This work was financially supported by the IWHR Research & Development Support Program (WR110145B0052021), the Second Tibetan Plateau Scientific Expedition and Research Program (STEP) (Grant No. 2019QZKK0207), the Young Talent Think Tank of Science and Technology of the China Association of Science and Technology (20220615ZZ07110156), the National Natural Science Foundation of China (No. 51909275 and U2240201), the Qinghai Central Government Guided Local Science and Technology Development Fund Project (2022ZY020) and the Open Research Fund of State Key Laboratory of Simulation and Regulation of Water Cycle in River Basin, China Institute of Water Resources and Hydropower Research (Grant No. IWHR-SKL-KF202204).

Institutional Review Board Statement

Not applicable.

Informed Consent Statement

Not applicable.

Data Availability Statement

Not applicable.

Conflicts of Interest

The authors declare no conflict of interest.

References

  1. Liu, Z.; Wang, T.; Han, J.; Yang, W.; Yang, H. Decreases in mean annual streamflow and interannual streamflow variability across snow−affected catchments under a warming climate. Geophys. Res. Lett. 2022, 49, e2021GL097442. [Google Scholar] [CrossRef]
  2. Dingman, S.L. Physical Hydrology, 3rd ed.; Waveland Press, Inc.: Long Grove, IL, USA, 2014; ISBN 978-1-4786-1118-9. [Google Scholar]
  3. Barnhart, T.B.; Molotch, N.P.; Livneh, B.; Harpold, A.A.; Knowles, J.F.; Schneider, D. Snowmelt rate dictates streamflow. Geophys. Res. Lett. 2016, 43, 8006–8016. [Google Scholar] [CrossRef]
  4. Dai, A. Temperature and pressure dependence of the rain-snow phase transition over land and ocean. Geophys. Res. Lett. 2008, 35, 62–77. [Google Scholar] [CrossRef]
  5. Foster, L.M.; Bearup, L.A.; Molotch, N.P.; Brooks, P.D.; Maxwell, R.M. Energy budget increases reduce mean streamflow more than snow–rain transitions: Using integrated modeling to isolate climate change impacts on rocky mountain hydrology. Environ. Res. Lett. 2016, 11, 044015. [Google Scholar] [CrossRef]
  6. Berghuijs, W.R.; Woods, R.A.; Hrachowitz, M. A precipitation shift from snow towards rain leads to a decrease in streamflow. Nat. Clim. Chang. 2014, 4, 583–586. [Google Scholar] [CrossRef] [Green Version]
  7. Wang, J.; Zhang, M.; Wang, S.; Ren, Z.; Che, Y.; Qiang, F.; Qu, D. Decrease in snowfall/rainfall ratio in the Tibetan Plateau from 1961 to 2013. J. Geogr. Sci. 2016, 26, 1277–1288. [Google Scholar] [CrossRef]
  8. Su, B.; Xiao, C.; Zhao, H.; Huang, Y.; Dou, T.; Wang, X.; Chen, D. Estimated changes in different forms of precipitation (snow, sleet, and rain) across China: 1961–2016. Atmos. Res. 2022, 270, 106078. [Google Scholar] [CrossRef]
  9. Zhu, X.; Wu, T.; Li, R.; Wang, S.; Hu, G.; Wang, W.; Qin, Y.; Yang, S. Characteristics of the ratios of snow, rain and sleet to precipitation on the Qinghai-Tibet Plateau during 1961–2014. Quat. Int. 2017, 444, 137–150. [Google Scholar] [CrossRef]
  10. Hasan, E.; Tarhule, A.; Kirstetter, P.-E.; Clark, R.; Hong, Y. Runoff sensitivity to climate change in the Nile River Basin. J. Hydrol. 2018, 561, 312–321. [Google Scholar] [CrossRef]
  11. Zhai, R.; Tao, F. Contributions of climate change and human activities to runoff change in seven typical catchments across China. Sci. Total Environ. 2017, 605–606, 219–229. [Google Scholar] [CrossRef]
  12. Zhang, Y.; Guan, D.; Jin, C.; Wang, A.; Wu, J.; Yuan, F. Analysis of impacts of climate variability and human activity on streamflow for a River Basin in Northeast China. J. Hydrol. 2011, 410, 239–247. [Google Scholar] [CrossRef]
  13. Zhang, A.; Zhang, C.; Fu, G.; Wang, B.; Bao, Z.; Zheng, H. Assessments of impacts of climate change and human activities on runoff with SWAT for the Huifa River Basin, Northeast China. Water Resour. Manag. 2012, 26, 2199–2217. [Google Scholar] [CrossRef]
  14. Bi, H.; Liu, B.; Wu, J.; Yun, L.; Chen, Z.; Cui, Z. Effects of precipitation and landuse on runoff during the past 50 years in a typical watershed in Loess Plateau, China. Int. J. Sediment Res. 2009, 24, 352–364. [Google Scholar] [CrossRef]
  15. Zeng, S.; Xia, J.; Du, H. Separating the effects of climate change and human activities on runoff over different time scales in the Zhang River Basin. Stoch. Environ. Res. Risk Assess. 2014, 28, 401–413. [Google Scholar] [CrossRef]
  16. Li, Z.; Liu, W.; Zhang, X.; Zheng, F. Impacts of land use change and climate variability on hydrology in an agricultural catchment on the Loess Plateau of China. J. Hydrol. 2009, 377, 35–42. [Google Scholar] [CrossRef]
  17. Ning, T.; Li, Z.; Liu, W. Separating the impacts of climate change and land surface alteration on runoff reduction in the Jing River Catchment of China. CATENA 2016, 147, 80–86. [Google Scholar] [CrossRef]
  18. Kirchner, J.W. Getting the right answers for the right reasons: Linking measurements, analyses, and models to advance the science of hydrology. Water Resour. Res. 2006, 42, 3. [Google Scholar] [CrossRef]
  19. Yuan, Z.; Yan, D.; Yang, Z.; Xu, J.; Huo, J.; Zhou, Y.; Zhang, C. Attribution assessment and projection of natural runoff change in the Yellow River Basin of China. Mitig. Adapt. Strateg. Glob. Chang. 2018, 23, 27–49. [Google Scholar] [CrossRef]
  20. Budyko, M.I. Evaporation under Natural Conditions; Office of Technical Services, U.S. Dept. of Commerce: Washington, DC, USA, 1963. [Google Scholar]
  21. Wang, C.; Wang, S.; Fu, B.; Zhang, L. Advances in hydrological modelling with the Budyko framework: A review. Prog. Phys. Geogr. Earth Environ. 2016, 40, 409–430. [Google Scholar] [CrossRef]
  22. Fu, B. On the calculation of the evaporation from land surface. Chin. J. Atmos. Sci. 1981, 5, 23–31. [Google Scholar]
  23. He, Y.; Song, J.; Hu, Y.; Tu, X.; Zhao, Y. Impacts of different weather conditions and landuse change on runoff variations in the Beiluo River Watershed, China. Sustain. Cities Soc. 2019, 50, 101674. [Google Scholar] [CrossRef]
  24. Liu, J.; Chen, J.; Xu, J.; Lin, Y.; Yuan, Z.; Zhou, M. Attribution of runoff variation in the headwaters of the Yangtze River Based on the Budyko hypothesis. Int. J. Environ. Res. Public Health 2019, 16, 2506. [Google Scholar] [CrossRef] [PubMed] [Green Version]
  25. Jiang, C.; Li, D.; Gao, Y.; Liu, W.; Zhang, L. Impact of climate variability and anthropogenic activity on streamflow in the three rivers headwater region, Tibetan Plateau, China. Theor. Appl. Climatol. 2017, 129, 667–681. [Google Scholar] [CrossRef]
  26. Zhang, D.; Cong, Z.; Ni, G.; Yang, D.; Hu, S. Effects of snow ratio on annual runoff within the Budyko Framework. Hydrol. Earth Syst. Sci. 2015, 19, 1977–1992. [Google Scholar] [CrossRef] [Green Version]
  27. Zhang, W.; Zhou, T.; Zhang, L. Wetting and greening tibetan plateau in early summer in recent decades. J. Geophys. Res. Atmos. 2017, 122, 5808–5822. [Google Scholar] [CrossRef]
  28. Chen, H.; Zhu, Q.; Peng, C.; Wu, N.; Wang, Y.; Fang, X.; Gao, Y.; Zhu, D.; Yang, G.; Tian, J.; et al. The impacts of climate change and human activities on biogeochemical cycles on the Qinghai-Tibetan Plateau. Glob. Chang. Biol. 2013, 19, 2940–2955. [Google Scholar] [CrossRef]
  29. Ding, B.; Yang, K.; Qin, J.; Wang, L.; Chen, Y.; He, X. The dependence of precipitation types on surface elevation and meteorological conditions and its parameterization. J. Hydrol. 2014, 513, 154–163. [Google Scholar] [CrossRef]
  30. Hock, R.; Holmgren, B. A distributed surface energy-balance model for complex topography and its application to Storglaciären, Sweden. J. Glaciol. 2005, 51, 25–36. [Google Scholar] [CrossRef] [Green Version]
  31. Schuur, T.J.; Park, H.-S.; Ryzhkov, A.V.; Reeves, H.D. Classification of precipitation types during transitional winter weather using the RUC model and polarimetric radar retrievals. J. Appl. Meteorol. Climatol. 2012, 51, 763–779. [Google Scholar] [CrossRef]
  32. Chen, R.; Lu, S.; Kang, E.; Ji, X.; Zhang, Z.; Yang, Y.; Qing, W. A distributed water-heat coupled model for mountainous watershed of an Inland River Basin of Northwest China (I) model structure and equations. Environ. Geol. 2008, 53, 1299–1309. [Google Scholar] [CrossRef]
  33. Yang, H.; Yang, D.; Lei, Z.; Sun, F. New analytical derivation of the mean annual water-energy balance equation. Water Resour. Res. 2008, 44. [Google Scholar] [CrossRef]
  34. Allan, R.; Pereira, L.; Smith, M. Crop Evapotranspiration—Guidelines for Computing Crop Water Requirements; FAO Irrigation and Drainage Paper 56; FAO: Rome, Italy, 1998; Volume 56. [Google Scholar]
  35. Zhang, J. Physical Hydrology; The Yellow River Water Conservancy Press: Zhengzhou, China, 2007. [Google Scholar]
  36. Zhou, S.; Yu, B.; Zhang, L.; Huang, Y.; Pan, M.; Wang, G. A new method to partition climate and catchment effect on the mean annual runoff based on the Budyko complementary relationship. Water Resour. Res. 2016, 52, 7163–7177. [Google Scholar] [CrossRef] [Green Version]
  37. Zhang, L.; Potter, N.; Hickel, K.; Zhang, Y.; Shao, Q. Water balance modeling over variable time scales based on the Budyko framework—Model development and testing. J. Hydrol. 2008, 360, 117–131. [Google Scholar] [CrossRef]
  38. Ryberg, K.R.; Hodgkins, G.A.; Dudley, R.W. Change points in annual peak streamflows: Method comparisons and historical change points in the United States. J. Hydrol. 2020, 583, 124307. [Google Scholar] [CrossRef]
  39. Zuo, D.; Xu, Z.; Wu, W.; Zhao, J.; Zhao, F. Identification of streamflow response to climate change and human activities in the Wei River Basin, China. Water Resour. Manag. 2014, 28, 833–851. [Google Scholar] [CrossRef]
  40. Pettitt, A.N. A non-parametric approach to the change-point problem. J. R. Stat. Soc. Ser. C Appl. Stat. 1979, 28, 126–135. [Google Scholar] [CrossRef]
  41. Liu, X.; Cheng, Z.; Yan, L.; Yin, Z.-Y. Elevation dependency of recent and future minimum surface air temperature trends in the Tibetan Plateau and its surroundings. Glob. Planet. Chang. 2009, 68, 164–174. [Google Scholar] [CrossRef]
  42. Guo, D.; Sun, J.; Yang, K.; Pepin, N.; Xu, Y. Revisiting recent elevation-dependent warming on the Tibetan Plateau using satellite-based data sets. J. Geophys. Res. Atmos. 2019, 124, 8511–8521. [Google Scholar] [CrossRef] [Green Version]
  43. Wang, X.; Pang, G.; Yang, M. Precipitation over the Tibetan Plateau during recent decades: A review based on observations and simulations. Int. J. Climatol. 2018, 38, 1116–1131. [Google Scholar] [CrossRef]
  44. Yan, L.; Liu, X. Has climatic warming over the Tibetan Plateau paused or continued in recent years? J. Earth Ocean Atmos.Sci. 2014, 1, 13–28. [Google Scholar]
  45. Li, Z.; Chen, Y.; Li, Y.; Wang, Y. Declining snowfall fraction in the Alpine regions, Central Asia. Sci. Rep. 2020, 10, 3476. [Google Scholar] [CrossRef] [Green Version]
  46. Deng, H.; Pepin, N.C.; Chen, Y. Changes of snowfall under warming in the Tibetan Plateau. J. Geophys. Res. Atmos. 2017, 122, 7323–7341. [Google Scholar] [CrossRef]
  47. Feng, S.; Hu, Q. Changes in winter snowfall/precipitation ratio in the contiguous United States. J. Geophys. Res. Atmos. 2007, 112, D15. [Google Scholar] [CrossRef]
  48. Huntington, T.G.; Hodgkins, G.A.; Keim, B.D.; Dudley, R.W. Changes in the proportion of precipitation occurring as snow in New England (1949–2000). J. Clim. 2004, 17, 2626–2636. [Google Scholar] [CrossRef]
  49. Wang, G.; He, Y.; Huang, J.; Guan, X.; Wang, X.; Hu, H.; Wang, S.; Xie, Y. The influence of precipitation phase changes on the recharge process of terrestrial water storage in the cold season over the Tibetan Plateau. J. Geophys. Res. Atmos. 2022, 127, e2021JD035824. [Google Scholar] [CrossRef]
  50. Li, Q.; Yang, T.; Qi, Z.; Li, L. Spatiotemporal variation of snowfall to precipitation ratio and its implication on water resources by a regional climate model over Xinjiang, China. Water 2018, 10, 1463. [Google Scholar] [CrossRef] [Green Version]
  51. Guo, L.; Li, L. Variation of the proportion of precipitation occurring as snow in the Tian Shan mountains, China. Int. J. Climatol. 2015, 35, 1379–1393. [Google Scholar] [CrossRef]
  52. Huntington, T.G. Evidence for intensification of the global water cycle: Review and synthesis. J. Hydrol. 2006, 319, 8395. [Google Scholar] [CrossRef]
  53. Jia, J.; He, K.; Wang, D. A study on the change pattern of runoff and its influencing factors in the Yangtze River source area in the past 55 years. In Proceedings of the China Water Resources Society 2021 Annual Academic Conference, Beijing, China, 25 October 2021; The Yellow River Water Conservancy Press: Zhengzhou, China, 2021; pp. 44–53. [Google Scholar]
  54. Zhao, F.; Xu, Z.; Zhang, L.; Zuo, D. Streamflow response to climate variability and human activities in the upper catchment of the Yellow River Basin. Sci. China Ser. E Technol. Sci. 2009, 52, 3249. [Google Scholar] [CrossRef]
  55. Ellis, A.; Sauter, K. The significance of snow to surface water supply: An empirical case study from the southwestern United States. Phys. Geogr. 2017, 38, 211–230. [Google Scholar] [CrossRef]
  56. Bocchiola, D. Long term (1921–2011) hydrological regime of alpine catchments in Northern Italy. Adv. Water Resour. 2014, 70, 51–64. [Google Scholar] [CrossRef]
  57. Tang, Y.; Hooshyar, M.; Zhu, T.; Ringler, C.; Sun, A.Y.; Long, D.; Wang, D. Reconstructing annual groundwater storage changes in a large-scale irrigation region using GRACE data and Budyko model. J. Hydrol. 2017, 551, 397–406. [Google Scholar] [CrossRef]
  58. Tang, Y.; Wang, D. Evaluating the role of watershed properties in long-term water balance through a Budyko equation based on two-stage partitioning of precipitation. Water Resour. Res. 2017, 53, 4142–4157. [Google Scholar] [CrossRef]
  59. Ning, T.; Li, Z.; Liu, W. Vegetation dynamics and climate seasonality jointly control the interannual catchment water balance in the loess Plateau under the Budyko framework. Hydrol. Earth Syst. Sci. 2017, 21, 1515–1526. [Google Scholar] [CrossRef] [Green Version]
  60. Xing, W.; Wang, W.; Shao, Q.; Yong, B. Identification of dominant interactions between climatic seasonality, catchment characteristics and agricultural activities on Budyko-type equation parameter estimation. J. Hydrol. 2018, 556, 585–599. [Google Scholar] [CrossRef]
  61. Zheng, H.; Zhang, L.; Zhu, R.; Liu, C.; Sato, Y.; Fukushima, Y. Responses of streamflow to climate and land surface change in the headwaters of the Yellow River Basin. Water Resour Res. 2009, 45, 7. [Google Scholar] [CrossRef]
  62. Liu, L.; Cao, W.; Shao, Q.; Huang, L.; He, T. Characteristics of land use/cover and macroscopic ecological changes in the headwaters of the Yangtze River and of the Yellow River over the past 30 years. Sustainability 2016, 8, 237. [Google Scholar] [CrossRef] [Green Version]
  63. Yang, Y.; Shang, S.; Jiang, L. Remote sensing temporal and spatial patterns of evapotranspiration and the responses to water management in a large irrigation district of North China. Agric. For. Meteorol. 2012, 164, 112–122. [Google Scholar] [CrossRef]
  64. Han, P.; Long, D.; Han, Z.; Du, M.; Dai, L.; Hao, X. Improved understanding of snowmelt runoff from the headwaters of China’s Yangtze River using remotely sensed snow products and hydrological modeling. Remote Sens. Environ. 2019, 224, 44–59. [Google Scholar] [CrossRef]
  65. Yao, Z.; Liu, Z.; Huang, H.; Liu, G.; Wu, S. Statistical estimation of the impacts of glaciers and climate change on river runoff in the headwaters of the Yangtze River. Quat. Int. 2014, 336, 89–97. [Google Scholar] [CrossRef]
  66. Jin, X.; Jin, H.; Luo, D.; Sheng, Y.; Wu, Q.; Wu, J.; Wang, W.; Huang, S.; Li, X.; Liang, S.; et al. Impacts of permafrost degradation on hydrology and vegetation in the source area of the Yellow River on Northeastern Qinghai-Tibet Plateau, Southwest China. Front. Earth Sci. 2022, 10, 845824. [Google Scholar] [CrossRef]
  67. Shi, R.; Yang, H.; Yang, D. Spatiotemporal variations in frozen ground and their impacts on hydrological components in the source region of the Yangtze River. J. Hydrol. 2020, 590, 125237. [Google Scholar] [CrossRef]
Figure 1. Locations of SRLR and SRYR.
Water 14 04115 g001
Figure 2. Long-term variations in precipitation and temperature (T) in SRLR and SRYR.
Water 14 04115 g002
Figure 3. Snowfall anomaly and 5-year moving average for the study area.
Water 14 04115 g003
Figure 4. Variation trend for SR in SRLR and SRYR.
Water 14 04115 g004
Figure 5. Spatial distribution of SR and SR trend in the study region during1979–2018: (a) SR of SRLR; (b) SR trend of SRLR; (c) SR of SRYR; (d) SR trend of SRYR.
Water 14 04115 g005
Figure 6. The trend of SR propensity of SRLR and SRYR with altitude.
Water 14 04115 g006
Figure 7. The changing trend of the Q and ETp from 1979–2018 in SRLR and SRYR.
Water 14 04115 g007
Figure 8. The abrupt change in the runoff in the SRLR and SRYR during 1979–2018; the black line represents the temporal variation in runoff; the red line represents the multi-year mean runoff before and after the abrupt change; the blue line indicates the year of the abrupt change.
Water 14 04115 g008
Figure 9. Contribution of each factor to changes in basin runoff.
Water 14 04115 g009
Table 1. Characteristics of hydrometeorological number elements and elasticity coefficients for SRLR and SRYR.
Elasticity Coefficient
WatershedPeriodETp/mmQ/mmP/mmSRn′βETβpβSRβn′
SRLR1979–2018701.599.95343.890.361.32−2.011.431.15−0.86
1979–2004703.1390.58323.200.381.25−2.121.441.29−0.95
2005–2018698.48117.35383.320.341.15−2.231.531.14−1.07
SRYR1979–2018678.54163.40558.270.241.00−1.491.930.47−1.61
1979–1990681.30190.31517.310.270.99−2.311.620.85−1.13
1991–2018677.36151.87575.820.231.04−2.842.100.84−1.81
Table 2. Changes in runoff due to changes in factors estimated by Budyko (mm).
ETpPSRn Δ Q s i m Δ Q o b s Error
SRLR1.3125.88−12.0610.8726.0026.772.88%
SRYR1.3533.57−12.14−60.44−37.66−38.452.05%
Publisher’s Note: MDPI stays neutral with regard to jurisdictional claims in published maps and institutional affiliations.

