Article

Numerical Simulation of the Wormhole Propagation in Fractured Carbonate Rocks during Acidization Using a Thermal-Hydrologic-Mechanics-Chemical Coupled Model

1
School of Civil Engineering, Qingdao University of Technology, Qingdao 266520, China
2
School of Science, Qingdao University of Technology, Qingdao 266520, China
3
Research Centre for Mathematics and Interdisciplinary Sciences, Shandong University, Qingdao 266237, China
*
Authors to whom correspondence should be addressed.
Water 2022, 14(24), 4117; https://doi.org/10.3390/w14244117
Submission received: 27 October 2022 / Revised: 9 December 2022 / Accepted: 13 December 2022 / Published: 16 December 2022
(This article belongs to the Topic Human Impact on Groundwater Environment)

Abstract

:
Acidizing is a widely adopted approach for stimulating carbonate reservoirs. The two-scale continuum (TSC) model is the most widely used model for simulating the reactive process in a carbonate reservoir during acidizing. In realistic cases, there are overburden pressure and pore pressure at present. When the injected acid reacts with the rock, the dissolution of the rock and the consumption of the acid in the pore will break the mechanical balance of the rock. Many experimental studies show that cores after acidizing have lower strength. However, it is still not clear how the deformation of rocks by the change of ground stress influences the acidizing dynamics. For fractured carbonate reservoirs, fractures play a leading role in the flow of injected acid, which preferentially flows into the fractures and dissolves the fracture walls. The effect of the combined action of rock mechanical balance broken and fracture wall dissolution on the formation of wormholes in fractured carbonate reservoirs remains to be studied. To address the above-mentioned issues, a thermal-hydrologic-mechanical-chemical coupled model is presented based on the TSC model for studying the wormhole propagation in fractured carbonate reservoirs under practical conditions. Linear and radial flow cases are simulated to investigate the influences of fracture distribution, reaction temperature, and effective stress on acidizing dynamics. The simulation results show that more wormhole branches are formed by acidizing if the fractures are perpendicular to the flow direction of acid. Temperature is a key parameter affecting the acidification dissolution patterns, so the influence of temperature cannot be ignored during the acidification design. As the effective stress of the formation increases, the diameter of the wormhole gradually decreases, and the branching decreases. More acid is needed for the same stimulation result under higher effective stress.

1. Introduction

Acidizing is one of the most common enhanced oil recovery (EOR) methods for oil and gas reservoirs. In matrix acidizing [1], the wormhole [2] penetrates the contaminated area near the wellbore, connecting the formation and the wellbore to increase production. There are typically five types of dissolution patterns for acidizing carbonate cores according to laboratory studies [3,4,5,6,7]. They are named face dissolution, conical dissolution, wormhole, ramified wormhole, and uniform dissolution. The patterns of dissolution depend on injection rates. Face dissolution takes place at a low injection rate, but uniform dissolution is formed when acid is injected at a high rate. Ramified wormholes and conical wormholes can be observed at other injection rates.
To understand the mechanism of wormhole propagation in carbonate reservoirs, extensive research has been conducted [3,4,8,9,10,11,12,13,14,15,16,17,18,19,20,21]. The two-scale continuum (TSC) model developed by Panga et al. (2005) [22] is the most commonly used one due to its computational efficiency. In the past decade, the TSC model has been continuously extended to better simulate wormhole propagation. Up to now, the TSC model can examine the influence of the reservoir conditions (temperature [23,24,25], pressure [25], domain geometry [26], rock properties (permeability [18], heterogeneity [18,27,28,29], anisotropy [27], minerals proportions [30], fracture geometry [31] and acid system characteristics (reaction kinetics and mass transfer [22], reaction rate and viscosity [32] on the wormhole formation. In addition, carbonate reservoirs usually have natural fractures. The injected acid penetrates the formation guided by the fractures, increasing the permeability of the formation. The productivity enhancement effect of acidization on fractured carbonate reservoirs is usually greater than that on nonfractured reservoirs [33,34,35]. Natural fractures have considerable effects on the acid distribution and wormhole propagation. Hence, it is important to study the acidizing process of naturally fractured carbonate reservoirs.
The models used to simulate the reactive flow process in fractured porous media can be divided into four categories. (1) the single fracture model [36,37,38,39,40,41,42,43]; (2) the fracture network model [44,45]; (3) the pseudo-fracture model [26,46,47] and (4) the discrete fracture model (DFM) [33,34,48,49,50,51,52]. The single fracture model only studies the reaction and flow in a single fracture. The fracture network model assumes that the acid flows only along the fractures while ignoring the fractures that are not directly connected to the wellbore. The DFM method treats the fractures explicitly and can characterize the effect of each fracture on fluid flow and solute transport. Due to the complexity of fracture geometry, an unstructured mesh is needed. However, when the distance or the angle between the adjacent fractures is very small, tiny mesh elements are required to discretize the area between fractures, leading to computational difficulties. The pseudo-fracture model treats fractures as high-porosity areas, which is simple in concept and can effectively model fractures in the dissolution process. Therefore, the pseudo-fracture model is adopted in the current study.
In realistic formation, the rock bears the internal fluid pressure in the pore and the overburdened rock pressure. When the injected acid reacts with the rock, the rock is constantly dissolved and the consumption of the acid in the pore will break the mechanical balance of the rock, resulting in the change of effective stress. When the effective stress changes, the pore structure [53] of the reservoir is deformed, which leads to the change of geophysical properties, hence the reservoir is stress sensitivity [54,55]. The stress sensitivity of fractured carbonate rocks is greater than that of non-fractured carbonate rocks and results mainly from that of fractures in the reservoir. Therefore, stress plays an important role in the acidification process of fractured carbonate rocks. It is necessary to study the formation mechanism of wormholes with formation pressure.
This paper establishes a Thermal-Hydrologic-mechanics-Chemical (THmC) coupled model to study the dissolution dynamics of acidizing fractured carbonate rocks. We use the capital letters T, H, and C to represent the full coupling of the thermal-hydrologic-chemical process, and lowercase (m) to indicate simplified mechanics. The model is focused on the Thermal-Hydrologic-Chemical processes and their coupling, with additional mechanical processes considered within a simplified geomechanically model. The main aim of this paper is to establish a comprehensive and practical simulation method for simulating the acidizing process in fractured carbonate reservoirs. The model takes into account the effect of reaction kinetics, rock heterogeneity, stress, and temperature effects on wormhole formation during acidization. Using realistic reservoir conditions, the dissolution process can be investigated by our model accurately.
This paper is organized as follows. In Section 2, the mathematical model is presented to describe the reaction involving the chemical system, fluid flow, mass and energy transport, rock dissolution, etc. In Section 3, the dimensionless mathematical model is derived. In Section 4 and Section 5, the numerical method is presented. In Section 6, a sensitivity analysis of fracture parameters, reaction exotherm, and effective stress is conducted. In the last section, the conclusions of the paper are summarized.

2. Mathematical Model

The assumptions regarding the thermal-hydrologic-mechanics-chemical coupled model in carbonate rocks are as follows. First, both fluid and solid materials are assumed to be incompressible, while the rock itself can still deform under stress due to a modification of the pore space. Second, the thermal equilibrium between fluid and rock can be achieved instantaneously. Third, CO 2 generated from the acid reaction is dissolved in the liquid phase.

2.1. Chemical System

The main mineral component of the carbonate rock is CaCO 3 and CaMg ( CO 3 ) 2 . Therefore, hydrochloric acid (HCl) [56] is appropriate for stimulating the formation. Hydrochloric acid can be completely ionized into hydrogen ions H + and chloride ions ( Cl ) in aqueous solution, and the reaction between the hydrochloric acid and calcite, occurring at the fluid-solid surface can be expressed as:
2 H + + CO 3 2 H 2 O + C O 2

2.2. Darcy Scale Model

The governing equations of Darcy flow in porous media are as follows:
v = K μ · P
ϕ t + · v = 0
where v denotes the velocity, t is the time, K is the permeability tensor of the formation, P is the pressure of formation, ϕ is the formation porosity and μ is the fluid viscosity. The material balance equation for the solute transport in the liquid phase is
( ϕ C f ) t + · ( v C f ) = · ( ϕ D e · C f ) k c a v ( C f C s )
where C f denotes the concentration of acid in the liquid phase, C s is the concentration of acid at the fluid–solid surface, D e is the dispersion tensor, k c is the mass transfer coefficient and a v is the specific surface area. In general, a chemical reaction occurs on the liquid-solid surface and the amount of acid liquid per unit area transmitted to the liquid-solid surface is the same as that consumed by the surface reaction, expressed as:
k c ( C f C s ) = R ( C s )
where R ( C s ) denotes the reaction power, R ( C s ) is equal to k s · C s when the chemical reaction rate is proportional to the concentration of the reactants. k s is the surface reaction rate constant that is dependent on temperature, calculated by the Arrhenius equation as:
k s = A · exp ( E a R T )
where A denotes the pre-exponential factor, E a is the activation energy and the value of both of them can be determined experimentally [57]; R is the universal gas constant; T is the temperature (in Kelvins). Let k s 0 indicate the rate at temperature T 0 . The rate at other temperatures can be calculated by the following formula
k s = k s 0 · exp E a R 1 T 1 T 0
Porosity is changed by chemical reactions over time as:
( ϕ ) t = R ( C s ) a v α ρ
where ρ s denotes the density of solid and α is the power of the acid dissolving.

2.3. Pore Scale Model

Coefficient k c indicates the mass transfer rate from the liquid phase to the liquid-solid interface. Its value is related to the velocity and physical properties of the fluid along with the pore structure. The dimensionless form of the mass transfer coefficient is named the Sherwood number S h and is written as:
S h = 2 k c r p D m = S h + 0.7 Re p 1 / 2 S c 1 / 3
where r p is the pore radius; S h is the asymptotic Sherwood number; The value of S h is taken as 3 in this article. Re p is the pore Reynolds number expressed as Re p = 2 r p u / ν , where ν denotes the kinematic viscosity; S c is the Schmidt number defined as S c = ν / D m and D m is the molecular diffusivity.
The fractal dimension for pore spaces D f and tortuosity D T can be expressed respectively as:
D f = d E ln ϕ ln λ min λ max
D T = ln 1 ϕ 2 + 1 ϕ 4 + ϕ + 1 + 1 ϕ . 9 5 ϕ 8 1 ϕ 8 ϕ ln D f 1 D f λ max λ min 1 ϕ ϕ π 8 4 D f
where d E is the Euclidean dimension. λ min and λ max are the smallest and largest pore diameter, respectively. Sensitivity analysis shows that the value of λ min and λ max has little influence on the fractal dimension [28]. In this paper, the ratio of λ max / λ min is set to be a typical value 0.01 following in Liu et al., 2017 [28]. Permeability is expressed by:
K = π D f 1 D T 2 8 4 D f 1 + D T 2 d 2 128 3 + D T D f ϕ 1 ϕ 3 + D T 2
During the chemical reaction, the variation of permeability is correlated with the change in pore radius. The permeability, pore radius, and rock-acid interfacial surface area are expressed as follows:
K K 0 = π D f 1 D T 2 8 4 D f 1 + D T 2 3 + D T 0 D f 0 π D f 0 1 D T 0 2 8 4 D f 0 1 + D T 0 2 3 + D T D f ϕ 1 ϕ 3 + D T 2 ϕ 0 1 ϕ 0 3 + D T 0 2
r p r 0 = K K 0 ϕ 0 ϕ
a v a 0 = ϕ ϕ 0 r 0 r p
where K 0 indicates the initial permeability of the matrix, the subscript 0 is the initial value of the corresponding parameter, β is the constant that relates with the structure of the medium, r 0 and a 0 are the initial values of average pore radius and interfacial area, respectively.
The diffusion coefficient following the exponential Arrhenius relation is given by:
D m = D m 0 exp E D R 1 T 1 T 0
where E D indicates the activation energy of diffusion, and its value can be determined experimentally [58], varying from 12.6 to 28.1 kJ/mol. R is the universal gas constant.
The dispersion tensors depend on the pore structure, the pore-scale flow, and the properties of the fluid in the fluid flow. The relative ratio of convection to diffusion is expressed by the Peclet number, defined as:
P e p = v d h ϕ D m
where v denotes the magnitude of the Darcy velocity, d h is the pore diameter defined as d h = 2 r p . When pore connectivity is good, Panga [22] gave the calculation formula of diffusion coefficient as:
D e X = α o s D m + D m λ X P e p
D e T = α o s D m + D m λ T P e p
where the subscripts X and T indicate acid injection direction and vertical direction respectively. The X denotes the x direction, and T is the y and z direction in the 3D orthogonal coordinate system. However, in 3D radial coordinate system, the X is the r direction and T is the θ and z direction; α o s , λ X and λ T are the constants related to the pore structure. In this paper, we set typical values for them, which are 0.5, 0.5, and 0.1 respectively.

2.4. Energy Transport

First, the chemical reaction between HCl and carbonate rocks releases heat, resulting in a change in formation temperature. Second, the chemical reaction and acid transport rates are influenced by temperature. Third, there is energy transfer between the injected acid and the formation. The energy transport equation is written as:
t ϕ ρ f C f P T + ( 1 ϕ ) ρ s C s P T + ρ f C f P · ( v T ) = ϕ Γ f + ( 1 ϕ ) Γ s · ( T ) + 2 ( Δ H r ( T ) ) a v k e C f
where ρ f indicates the density of the liquid phase; ρ s is the density of the solid phase, C f p is the specific heat capacity of the liquid phase; C s p is the specific heat capacity of the solid phase. T is the temperature; Γ f is the coefficient of heat conduction in the liquid phase, Γ s is the coefficient of heat conduction in the solid phase; Δ H r T is the heat released by reaction at temperature T, defined as the heat generated per mole of H + consumed and expressed as:
Δ H r ( T ) = | Δ H r e s u l t a n t s ( T ) | | Δ H r e a c t a n t s ( T ) |
Equation (21) indicates the enthalpy difference between resultants and reactants. Kirchhoff’s law determines the value of enthalpy at different temperatures. At temperature T, the exothermic heat of reaction Equation (1) derived as follows:
Δ H r T = 6846 + 8.038 T 3.22 × 10 3 T 2 870.3 T 1

3. Dimensionless Model

The governing equations are rewritten into their dimensionless forms using the following parameters:
x D = x L , y D = y L , z D = z L , r D = r L , r w D = r w L , U = v v 0 , t D = t L / v 0 , r p D = r p r 0 , a v D = a v a 0 , T D = T T o , κ = K k 0 , D m D = D m D m 0 , C D = C C 0 , C f D P = C f P C s P , P D = P P e ( μ v 0 L ) / K 0 , h T 2 = 2 K s ( T 0 ) r 0 D m 0 , D a = K s ( T 0 ) a v 0 L u 0 , N a c = α C 0 ρ s , ρ f D = ρ f ρ s , A E = E a R T 0 , D m D = D m D m 0 , a v D = a v a v 0 , P e L = u 0 L D m 0 , η = 2 r 0 L , H T 2 = K s ( T 0 ) a v 0 L 2 D m 0 , P e H = L u 0 ρ s C s p f Γ e f + ( 1 f ) Γ e s , H D = Δ H r c 0 T 0 ρ s C s p .
where subscript D indicates that the variable is dimensionless; L is the characteristic length set to be the core length for linear flow and the core radius for radial flow; U is the dimensionless velocity; κ is the dimensionless permeability. η is the ratio of the pore-to-domain scale. A E is the dimensionless activation energy; H D is the dimensionless exothermic reaction; H T 2 and h T 2 are Thiele modulus, which is the reaction velocity divided by the diffusion velocity at the initial pore volume. D a is the Damkohler number defined as the reaction rate divided by the convection velocity; P e L and P e H are the Peclet number defined on a core scale and heat transport scale, respectively. However, P e L is the convective transport rate divided by the diffusive transport rate. P e H is the ratio of heat transfer by convection to that by thermal conduction. The acid capacity constant N a c is defined as the volume of dissolved solids per unit volume of consumed acid. Therefore, the governing equations can be rewritten as:
U = κ · P D
ϕ t D + · κ · P D = 0
ϕ C D t D + · U C D = · D e D C D S h · D m D · D a · a v D · C D · exp A E ( 1 1 / T D ) S h · D m D + h T 2 r p D · exp A E ( 1 1 / T D )
ϕ t D = S h · D a · a v D · C D · D m D · N a c · exp A E ( 1 1 / T D ) S h · D m D + h T 2 r p D · exp A E ( 1 1 / T D )
T D t D ϕ ρ f D C f D P + ( 1 ϕ ) + ρ f D C f D P · U T D = 1 P e H · ( T D ) + H D · S h · D m D · D a · a v D · C D · exp A E 1 1 T D S h · D m D + h T 2 r p D · exp A E 1 1 T D
D e D X = ϕ α o s D a D m D H T 2 + λ X | U | r p D · η
D e D Y = ϕ α o s D a D m D H T 2 + λ Y | U | r p D · η
The dimensionless form of the initial and boundary conditions can be written as:
κ · P D · n = 1 , on Ω i n
C D ϕ α o s D a D m D H T 2 + λ X | U | r p D · η C D · n = 1 , on Ω i n
T D = T f D , on Ω i n
P D = 0 , on Ω o u t
c D · n = 0 , on Ω o u t , and Ω t r a n
T D · n = 0 , on Ω o u t , and Ω t r a n
P D · n = 0 , on Ω t r a n
c D = 0 , T D = T s D , at , t = 0

4. Numerical Method

The governing equations are solved sequentially and described as follows. First, the permeability, mass transfer coefficient, and diffusion coefficient are calculated based on initial conditions. Then, they are brought into Equation (24) to solve the pressure distribution at t n + 1 . Next, the pressure distribution is brought in Equation (23) to obtain the Darcy velocity. The reactive transport procedure is divided into two parts, i.e., a physical transport process and a process involving chemical reactions. In the physical transport process, the distribution of temperature and acid concentration is calculated by physical transport, followed by their values modified by reactions, as shown below:
T D t D ϕ ρ f D C f D P + ( 1 ϕ ) + ρ f D C f D P · U T D = 1 P e H · ( T D ) ϕ C D t D + · U C D = · D e D · C D ϕ t D = 0
t D ϕ ρ f D C f D P + ( 1 ϕ ) T D H D ϕ N a c = 0 t D ϕ C D + ϕ N a c = 0 ϕ t D = N a c · S h · D a · a v D · C D · D m D · exp A E ( 1 1 / T D ) S h · D m D + h T 2 r p D · exp A E ( 1 1 / T D )
The finite volume method is employed to discretize these governing equations. Orthogonal and radial grids are used for the linear and radial cases, respectively. The diffusion terms are discretized by the central difference scheme and the TVD scheme is used to discretize the convection terms. The backward Euler scheme is used for time integration to help the convergence of solutions at larger time steps. For the linear case, the simulation is performed on a 5 × 2 cm rectangle core. This rectangular domain is discretized with a 500 × 200 orthogonal grid. For the radial case, the simulation is performed on an annular domain, which is discretized with a 160 × 640 radial grid system (160 cells in r direction and 640 cells in θ direction). The fractures are introduced by the following procedure:
(1)
Generate randomly distributed discrete fractures.
(2)
Calculate the starting point and end point coordinates of each fracture.
(3)
Loop all faces of the grid cell to check whether the fracture segment intersects the face segment.
(4)
If the fracture intersects the face segment of the grid cell, set the two cells sharing the face as the fracture cell, and change its porosity to 0.99.
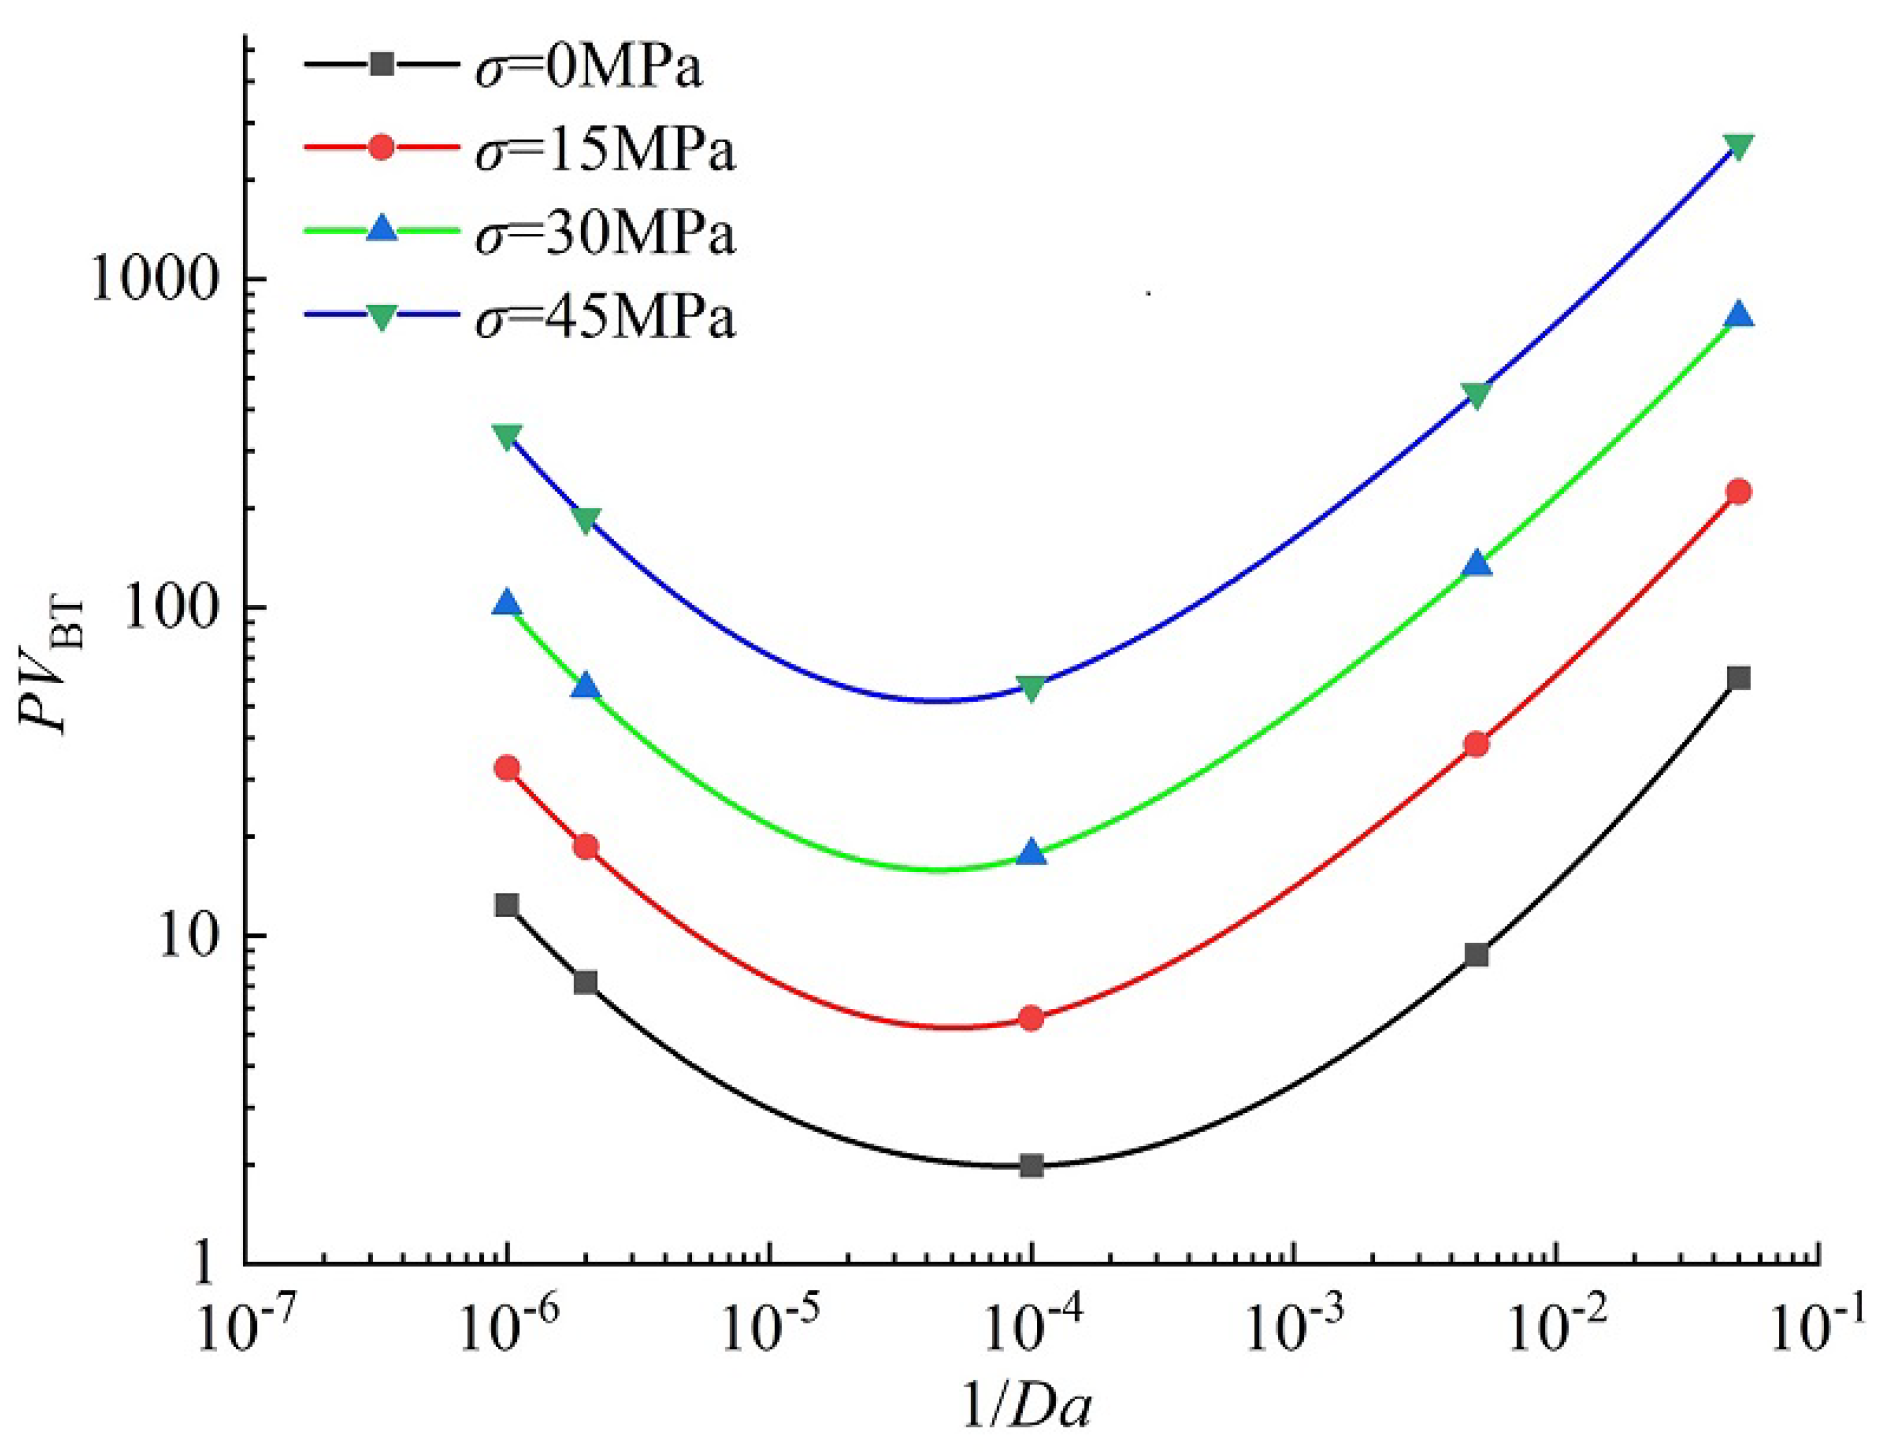
The porosity value 0.99 used to characterize fractures is obtained by comparing the Darcy formula with the laminar flow formula, through which the cubic law can be derived as:
K = b 2 12
In the current work, we set the fracture aperture b = 1 mm, which means that the permeability of fracture is 8 × 10 7 md. For a porous medium with an average porosity of 0.35 and an average permeability of 100 md, it can be calculated with Equation (13) that the porosity of fracture is 0.99.

5. Effect of Stress

Prior to the development of oil and gas reservoirs, the pressure of overburden formation is balanced by the pressure of pore fluid and the support of the rock skeleton. With the dissolution of rocks, the porosity increases consequentially. If the influence of stress is ignored, the variation of porosity can be obtained through the procedure described in Section 4. However, stress exists in the actual formation. The influence of stress should be considered on the basis of the original porosity increment induced by rock dissolution. The influence of stress on porosity increment can be expressed as follows:
Δ ϕ = Δ ϕ 0 e a 0 σ
where Δ ϕ indicates the increment of porosity under the current effective formation stress; Δ ϕ 0 is the porosity increment induced by rock dissolution; a 0 is the pore compression coefficient of rock at the original pressure and its value is 0.08; σ is the effective stress of rock and its value can be calculated by
σ = P 0 P
where P 0 is the pressure of the primordial formation; P is the current pore pressure of the rock.

6. Results and Discussions

This section presents simulation results for the sensitivity analysis of fracture parameters, temperature, and stress. The values of the parameters are as in Table 1 unless otherwise stated.

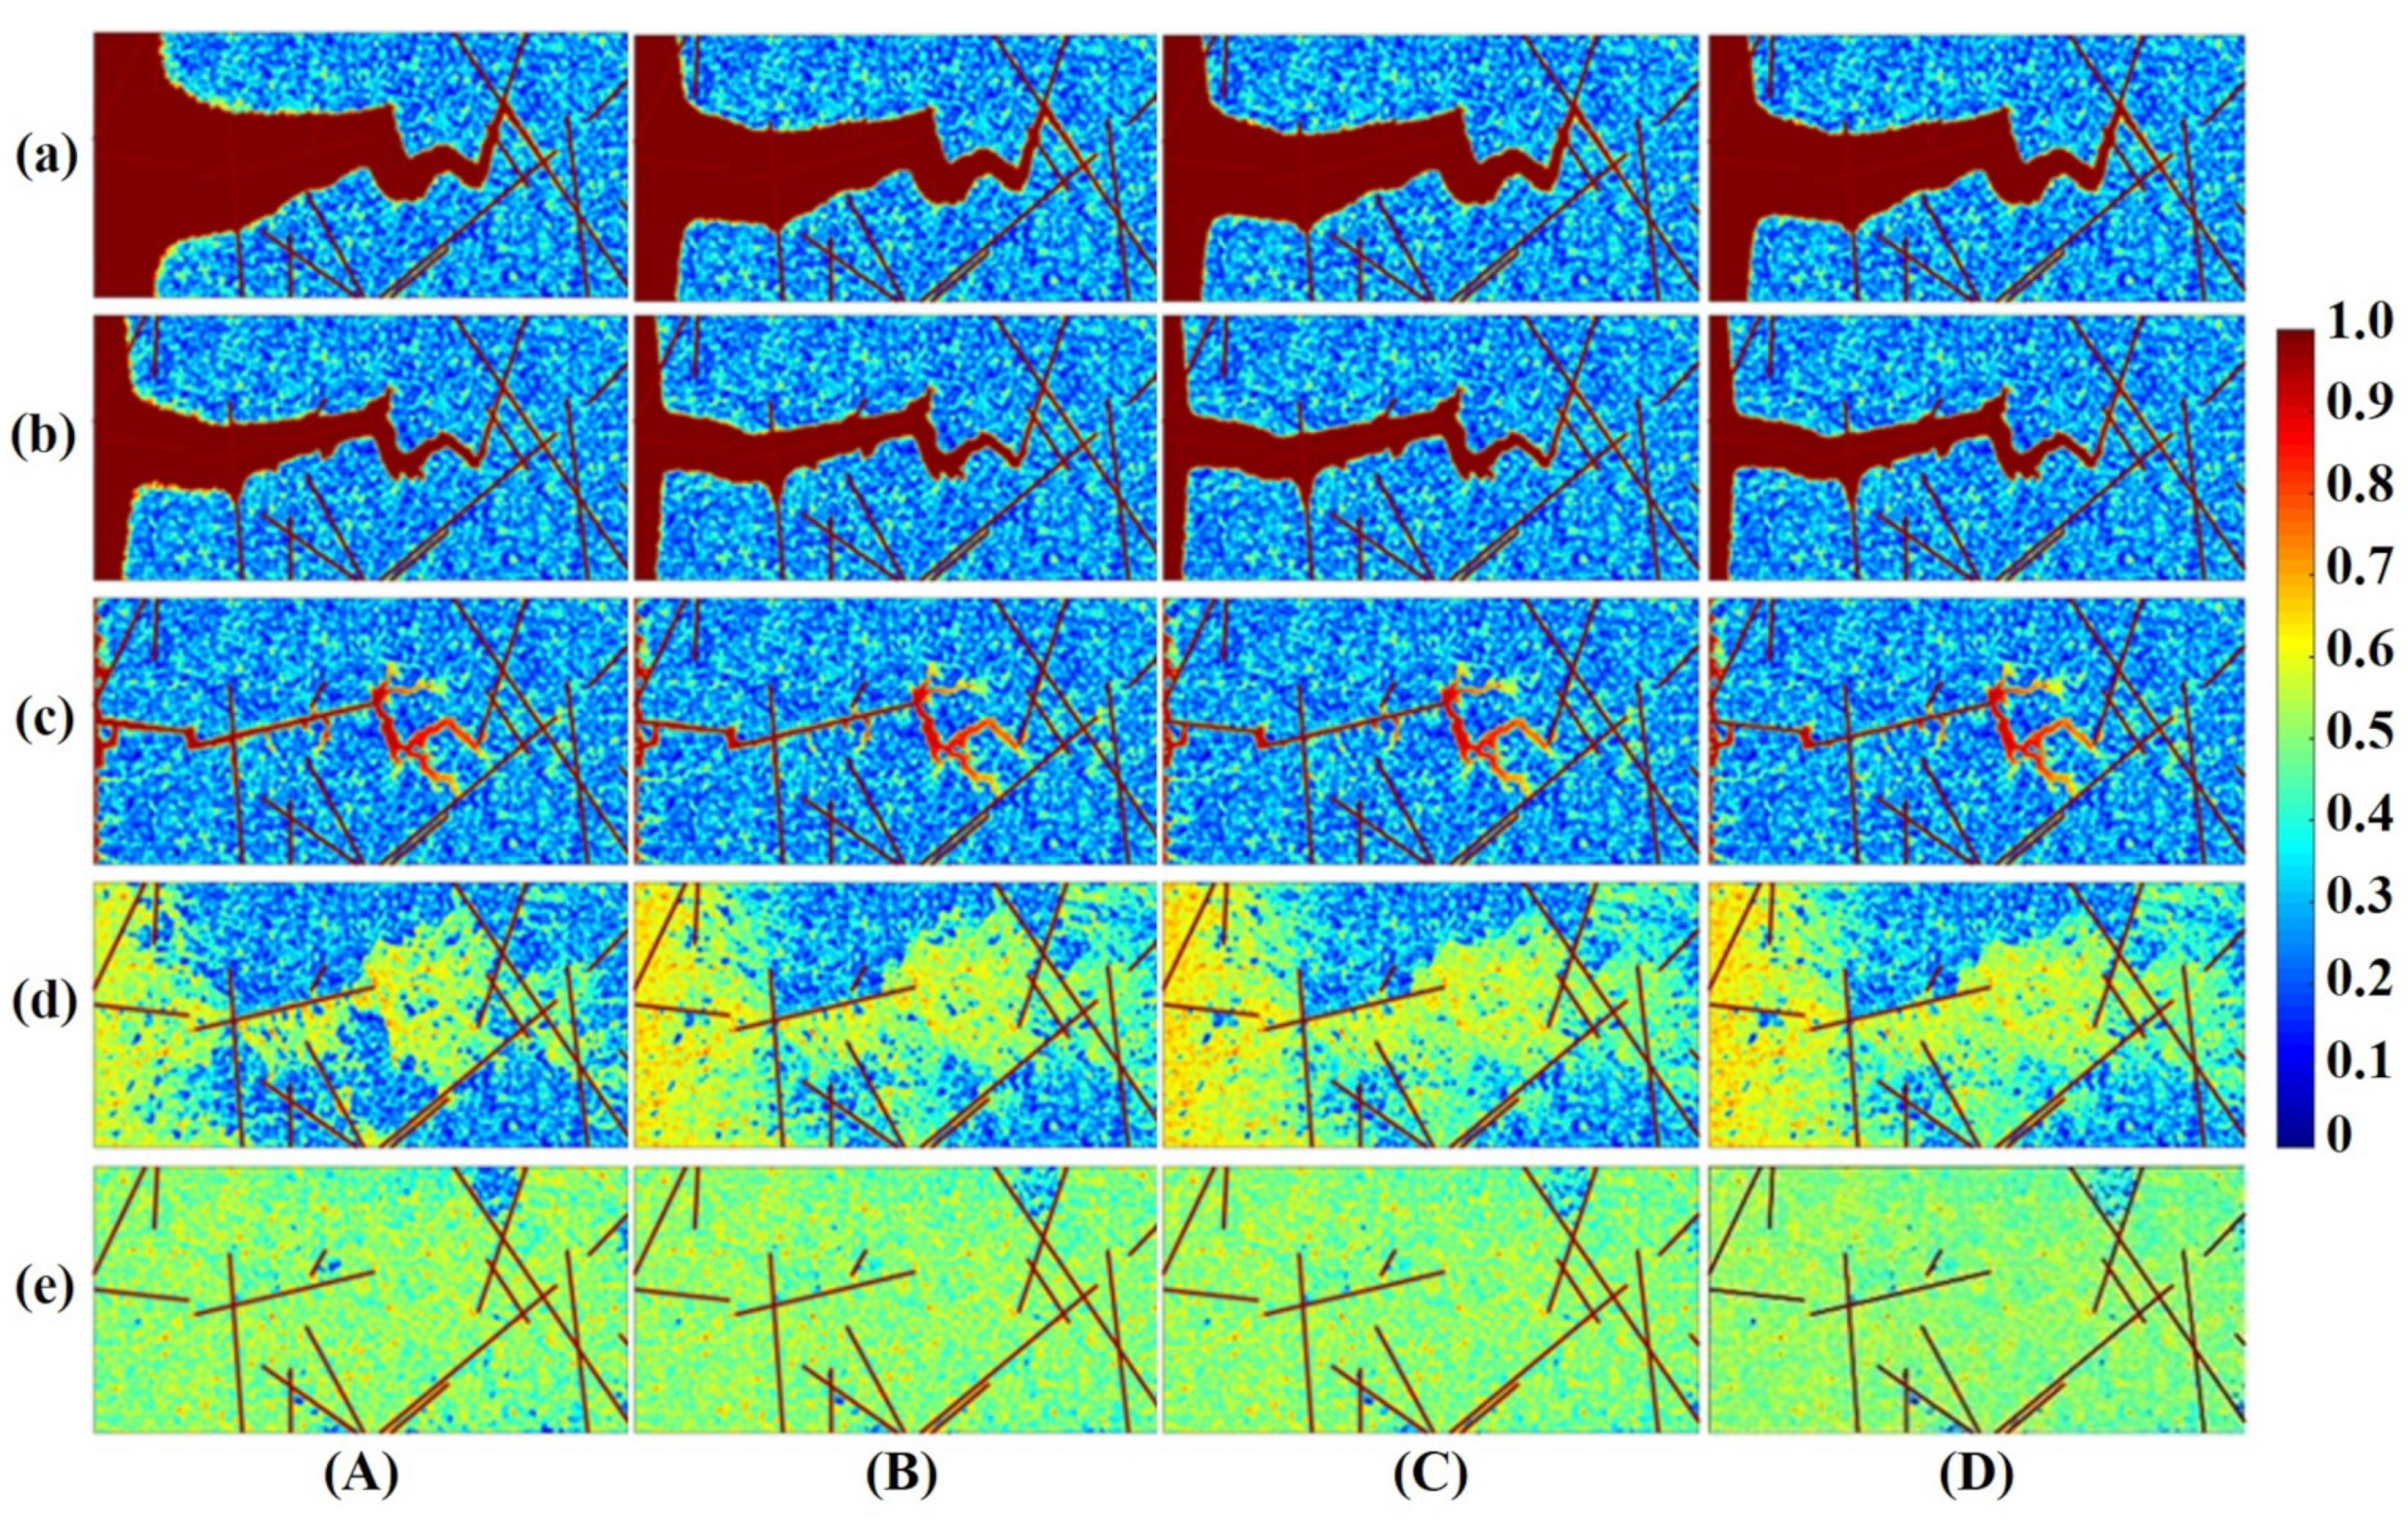
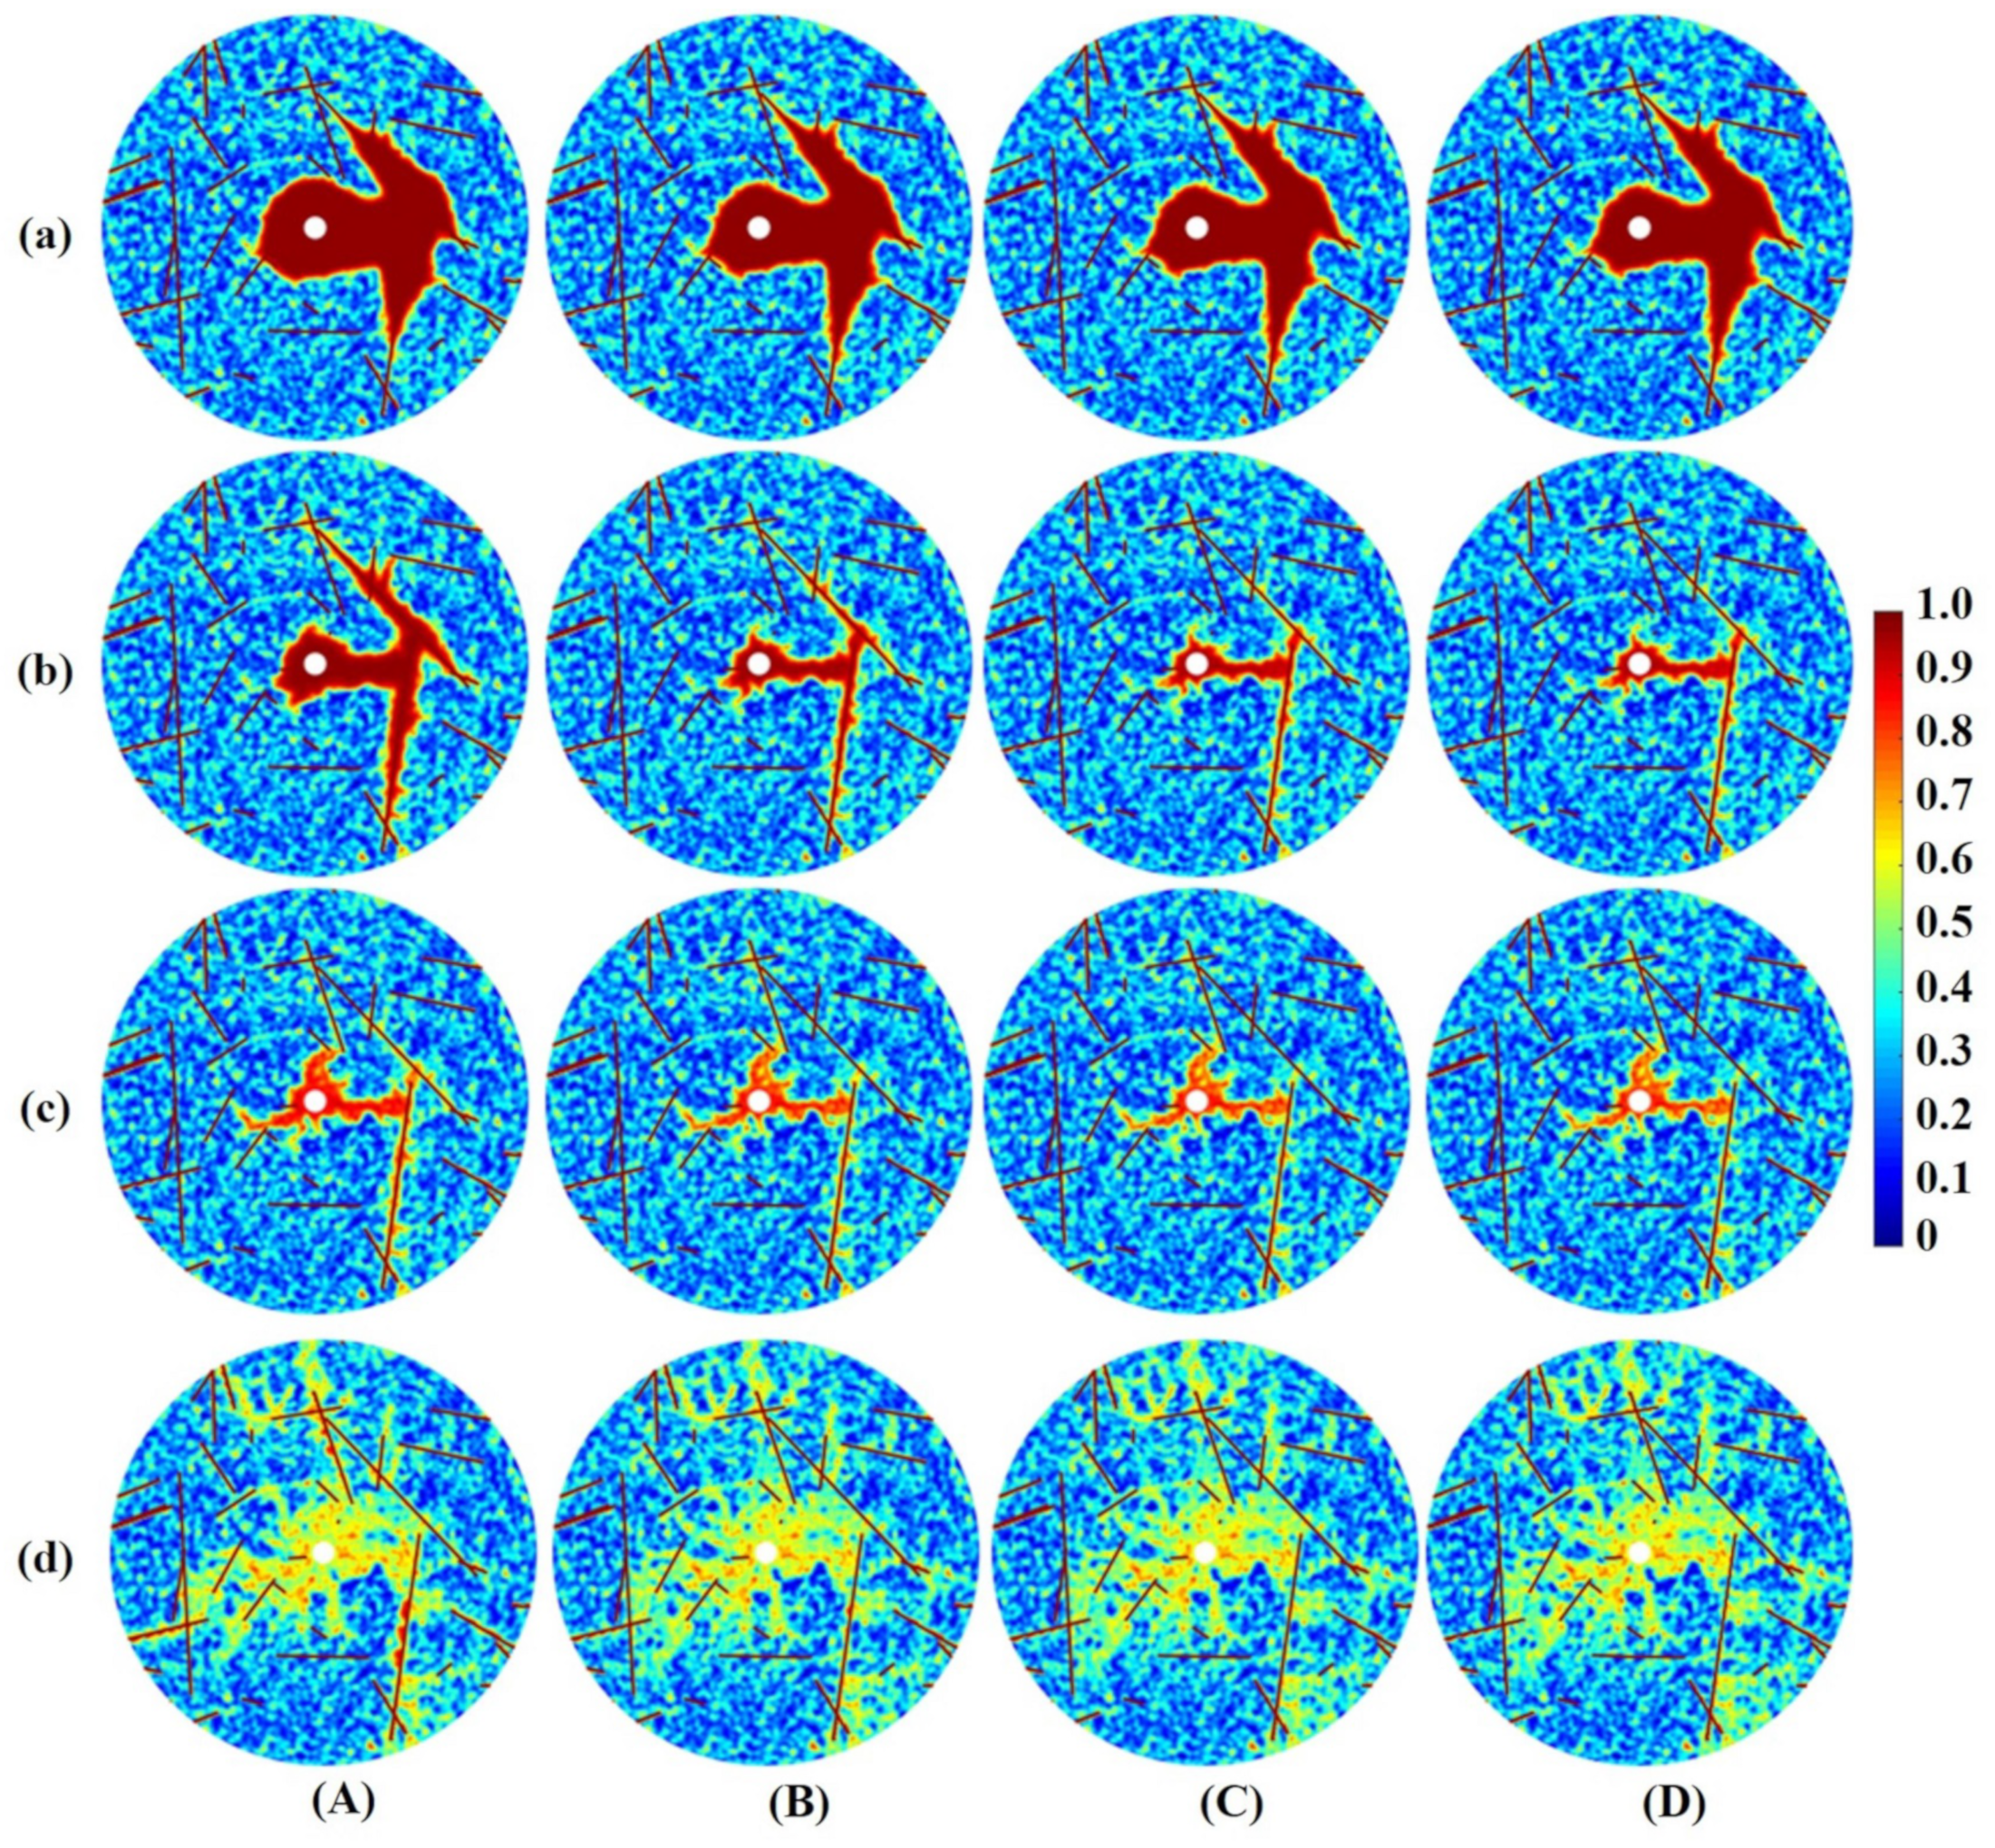
6.1. Effect of Fracture Parameters

6.1.1. Effect of Fracture Orientation

The effects of fracture orientation on the dissolution structure are studied from both radial and linear aspects (Figure 1), while keeping the other parameters fixed. It is evident in Figure 1 that the wormhole is formed along the fractures which become part of the wormhole. However, the direction of the wormhole is not along fractures if the fractures are perpendicular to the injection direction (Figure 1 row(c), column (A)). The calculated P V B T is plotted against fracture inclinations (Figure 2). It can be seen from Figure 2 that as the fracture inclination increases, the breakthrough pore volume increases, but then decreases. When the dip angle between the fracture and the flow direction is small, the fracture becomes part of the wormhole, and the breakthrough can be achieved by dissolving a small amount of rock. When fractures are perpendicular to the flow direction, wormholes spread along both the fracture direction and fluid flow direction. Furthermore, the presence of the fractures makes the wormholes produce more branches, which means more acid is needed to dissolve the rock. So, the breakthrough pore volume reaches its maximum when the fracture inclination is 90 . However, fracture orientation has little effect on wormhole structures in radial acidizing simulation as shown in Figure 1 column (B).

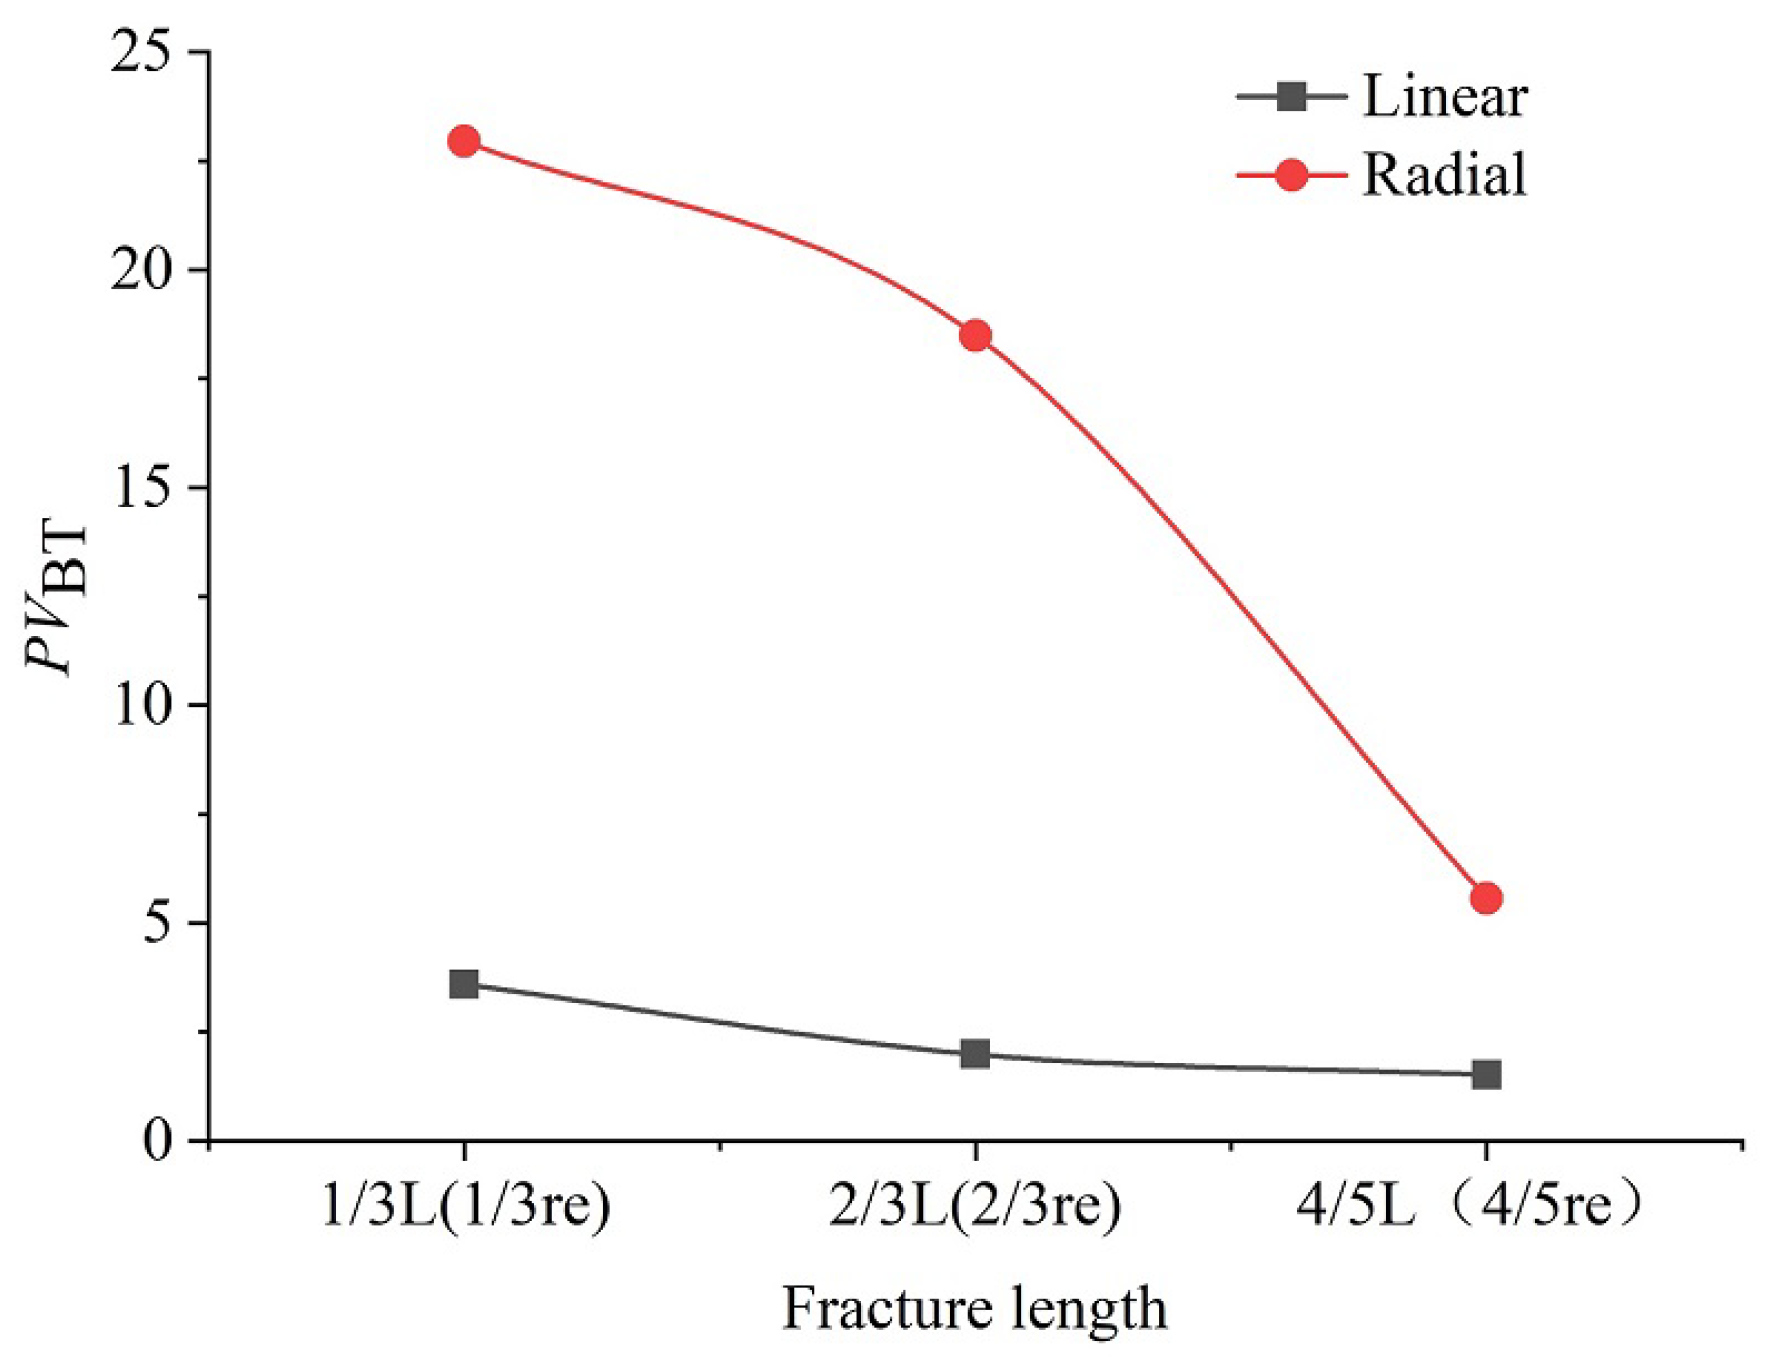
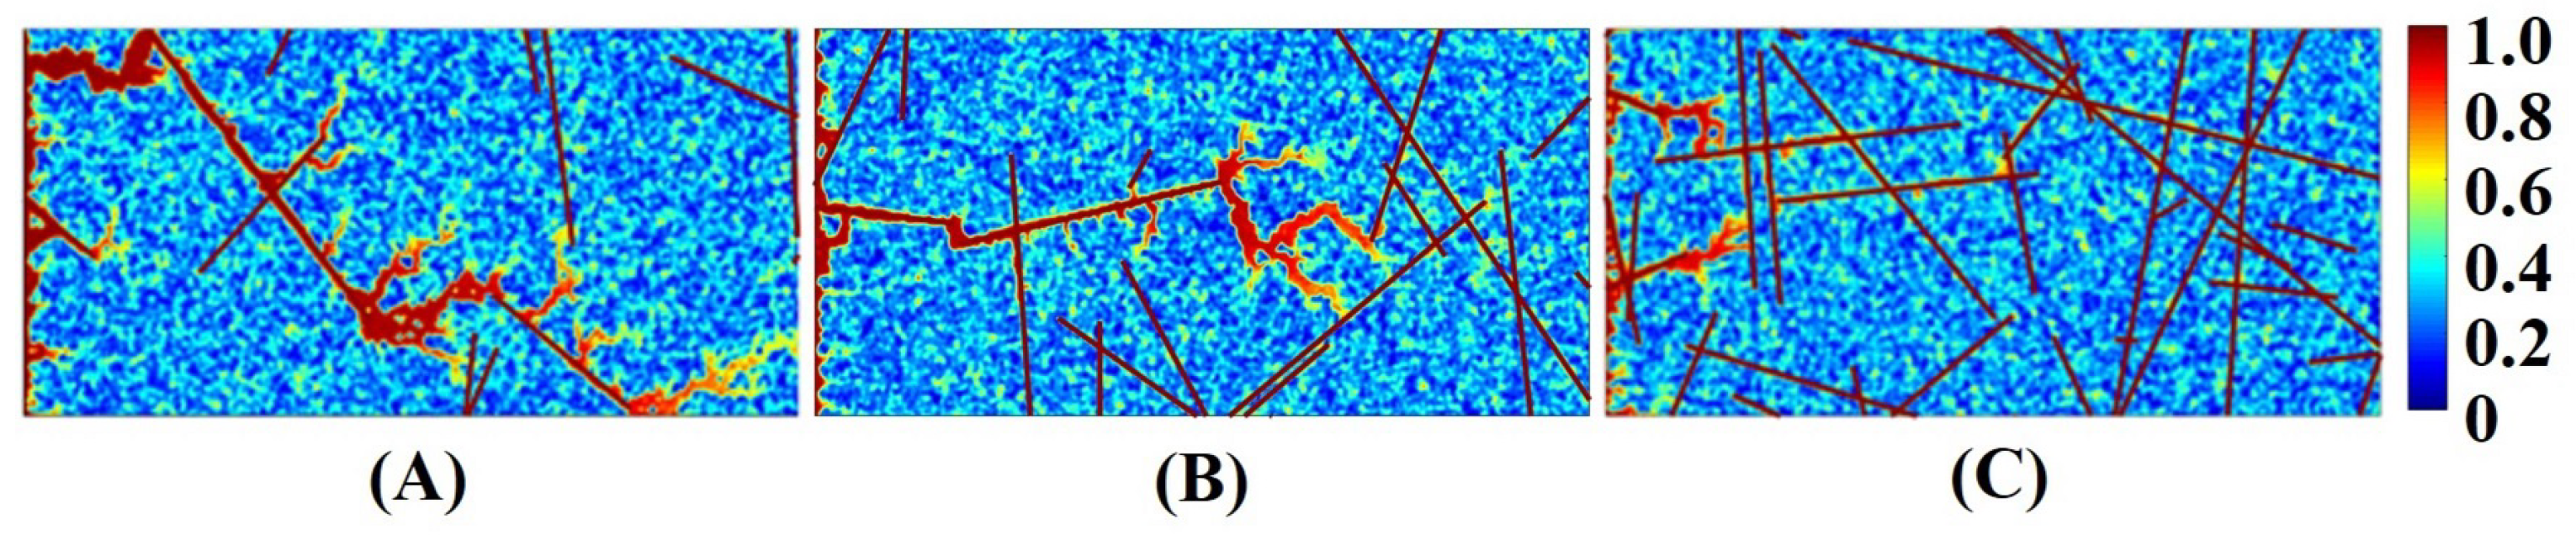
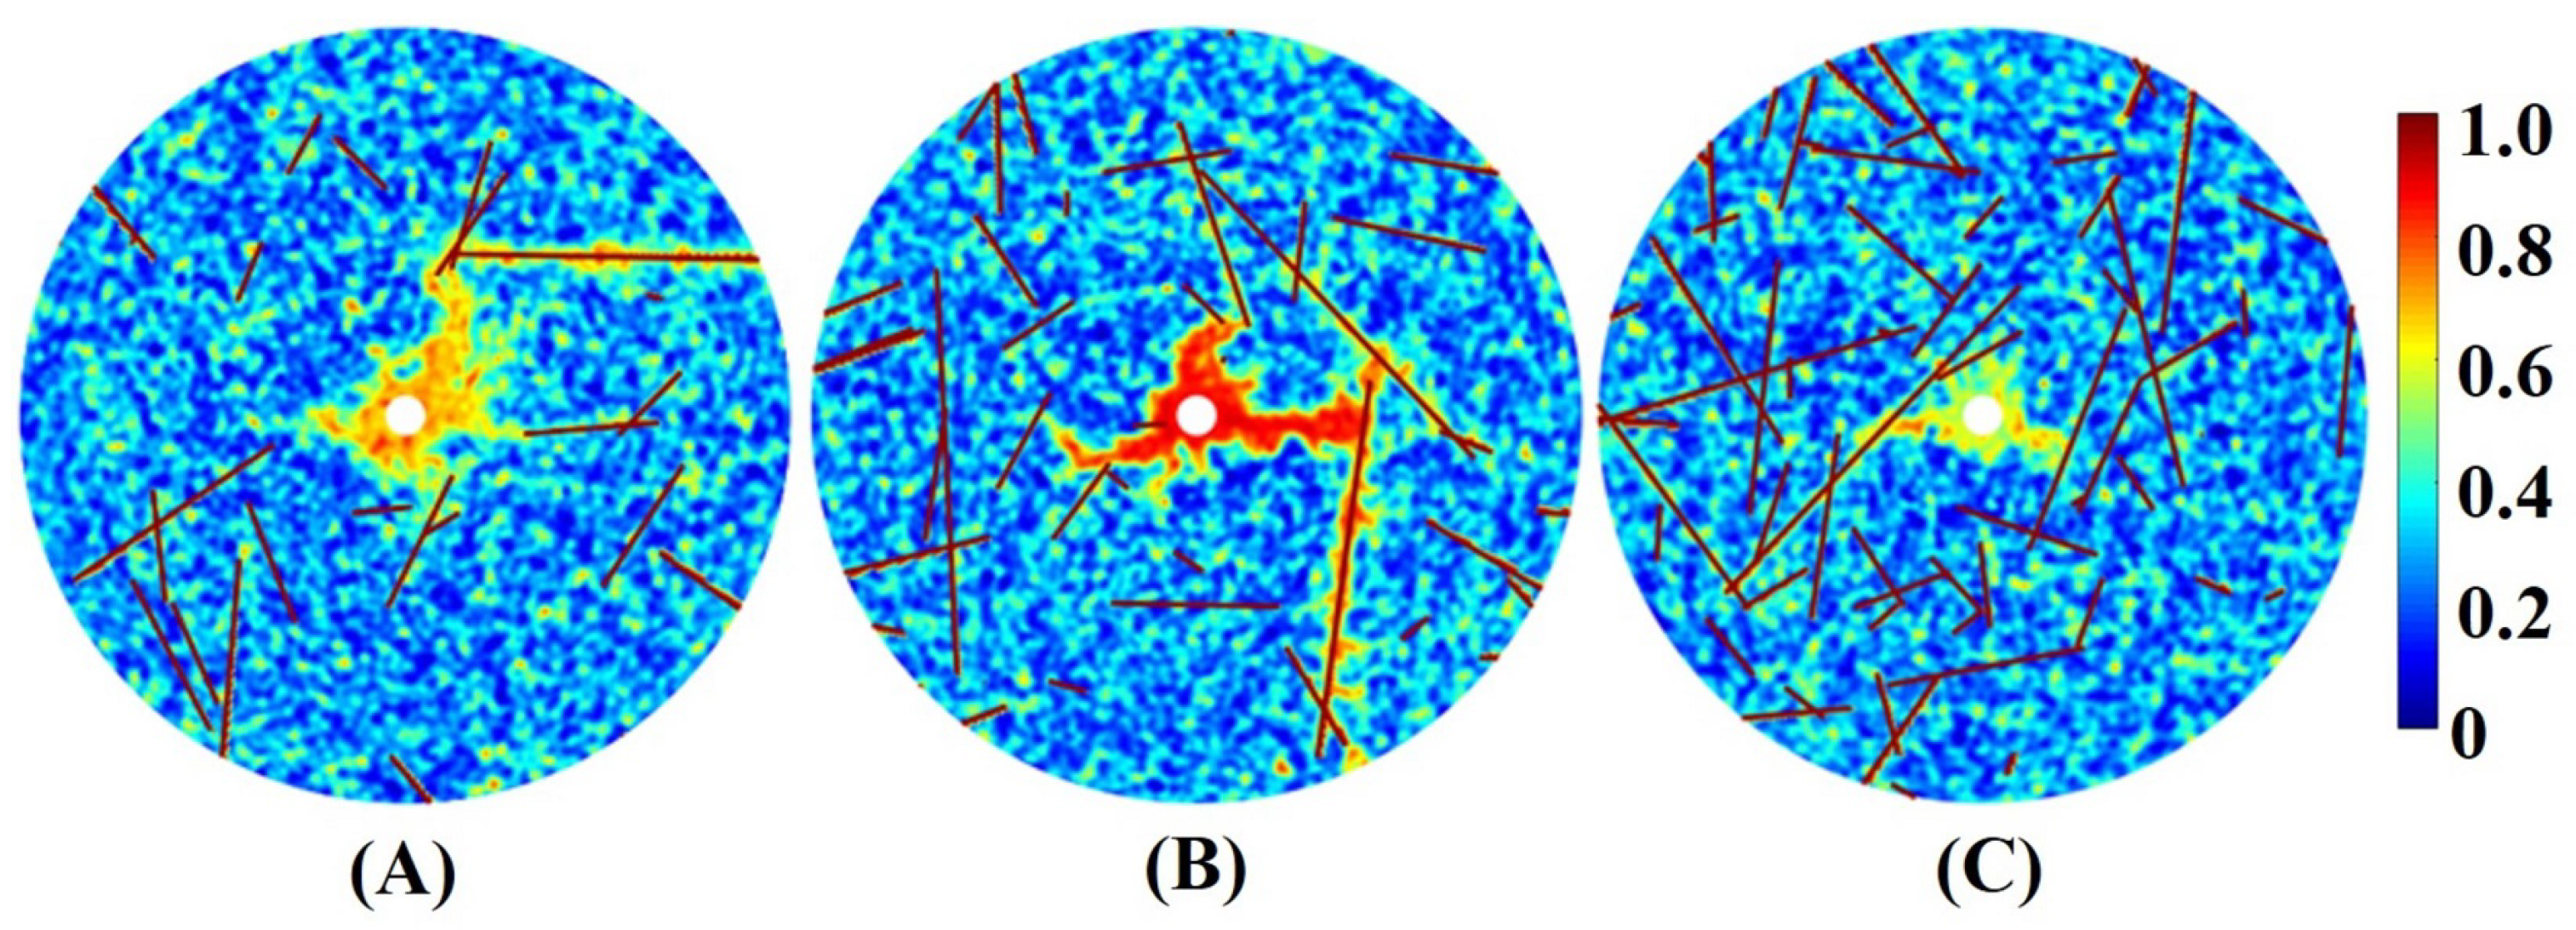
6.1.2. Effect of Fracture Length

The distribution of natural fractures is an important factor for acidization Figure 3 and Figure 4 show the influence of fracture length on dissolution structure. L L and L R are the average fracture lengths of linear and radial acidizing simulations, respectively. The values are placed under the picture. Related parameters are shown in Table 1. In Figure 3A and Figure 4A, the wormholes are more irregular, wider, and more branched. Obviously, as the fracture length is increased, wormholes become thinner with fewer branches (Figure 3 and Figure 4). When the fractures are longer, they can be interconnected to allow acid advances faster through fractures and prevent the formation of ramified wormholes. The relationship is shown between P V B T against fracture length in Figure 5. The P V B T for the longest fractures is the smallest, demonstrating that longer fractures can significantly improve the efficiency of wormhole propagation.

6.1.3. Effect of Fracture Density

The density of natural fractures has a significant influence on wormhole propagation. The reactive flow simulation of cores with a different number of fractures was carried out for both the linear and radial cases (Figure 6 and Figure 7). It is obvious that when the fracture density is small, wormholes are created with more branches. As the increase of the number of fractures, competition appears between fractures. When the number of fractures is large, the injected acid mainly flows along the fractures. This is attributable to the fact that the permeability of the fracture is much larger than that of the matrix. The injected acid preferentially flows along the path with the least resistance during wormhole propagation, resulting in a smaller breakthrough volume of injected acid and much higher efficiency in wormhole formation.

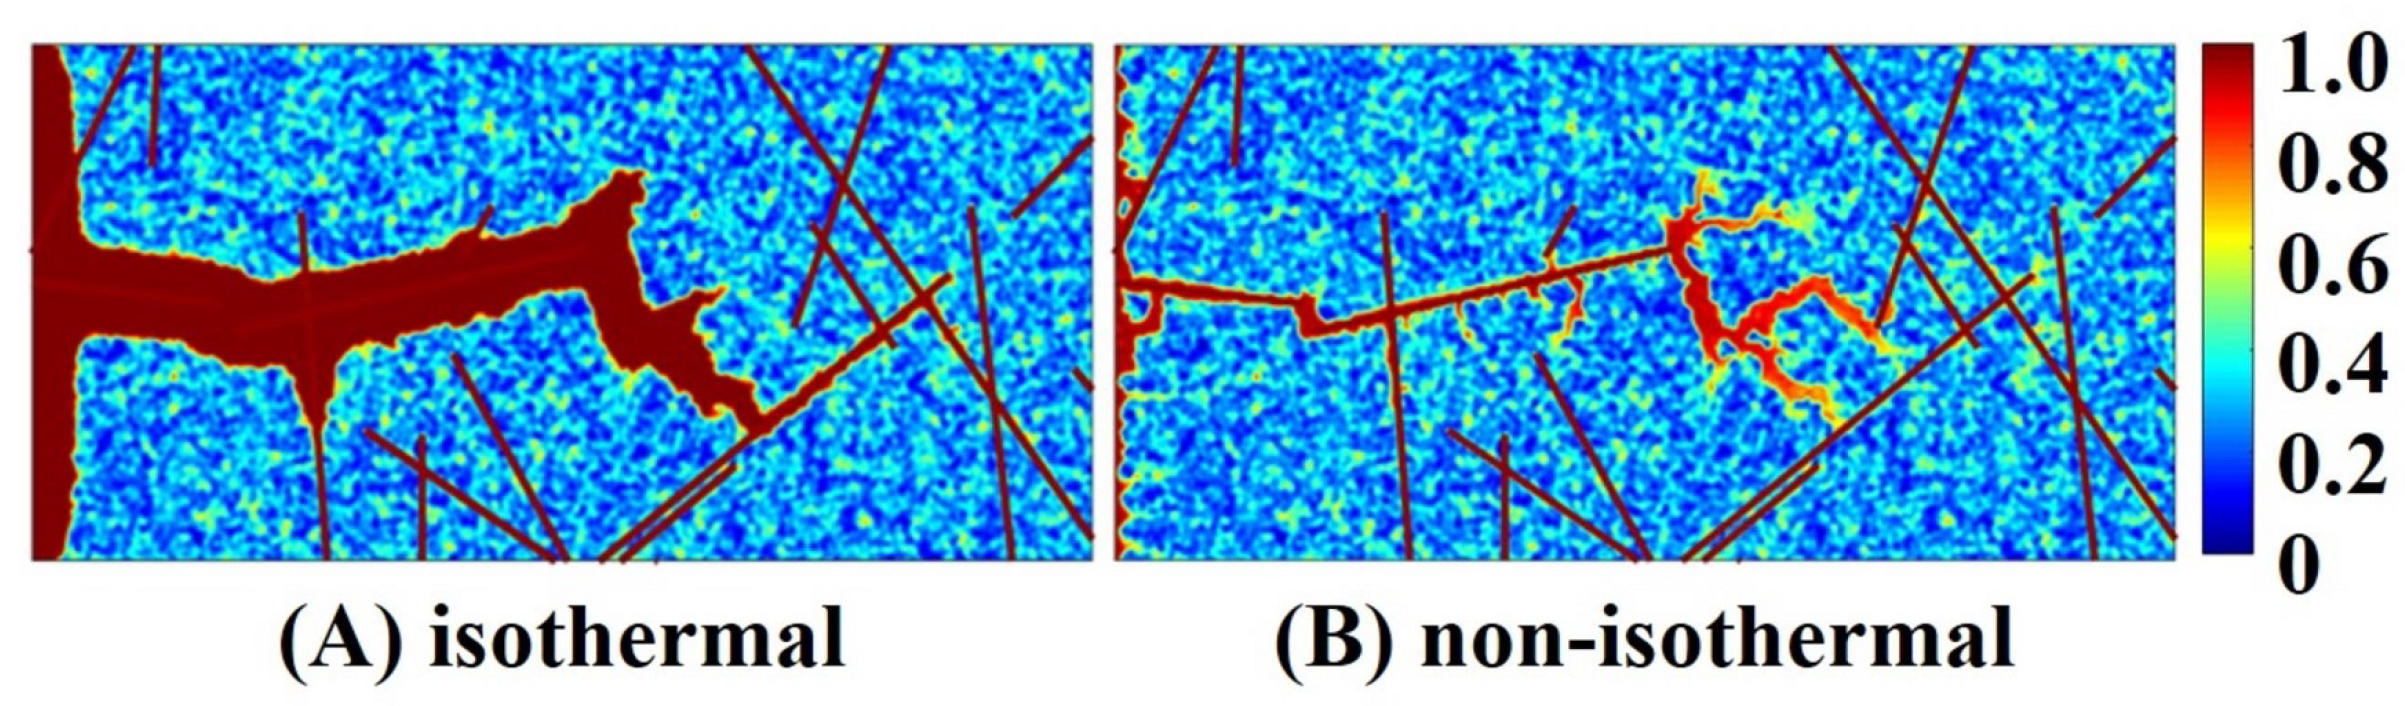
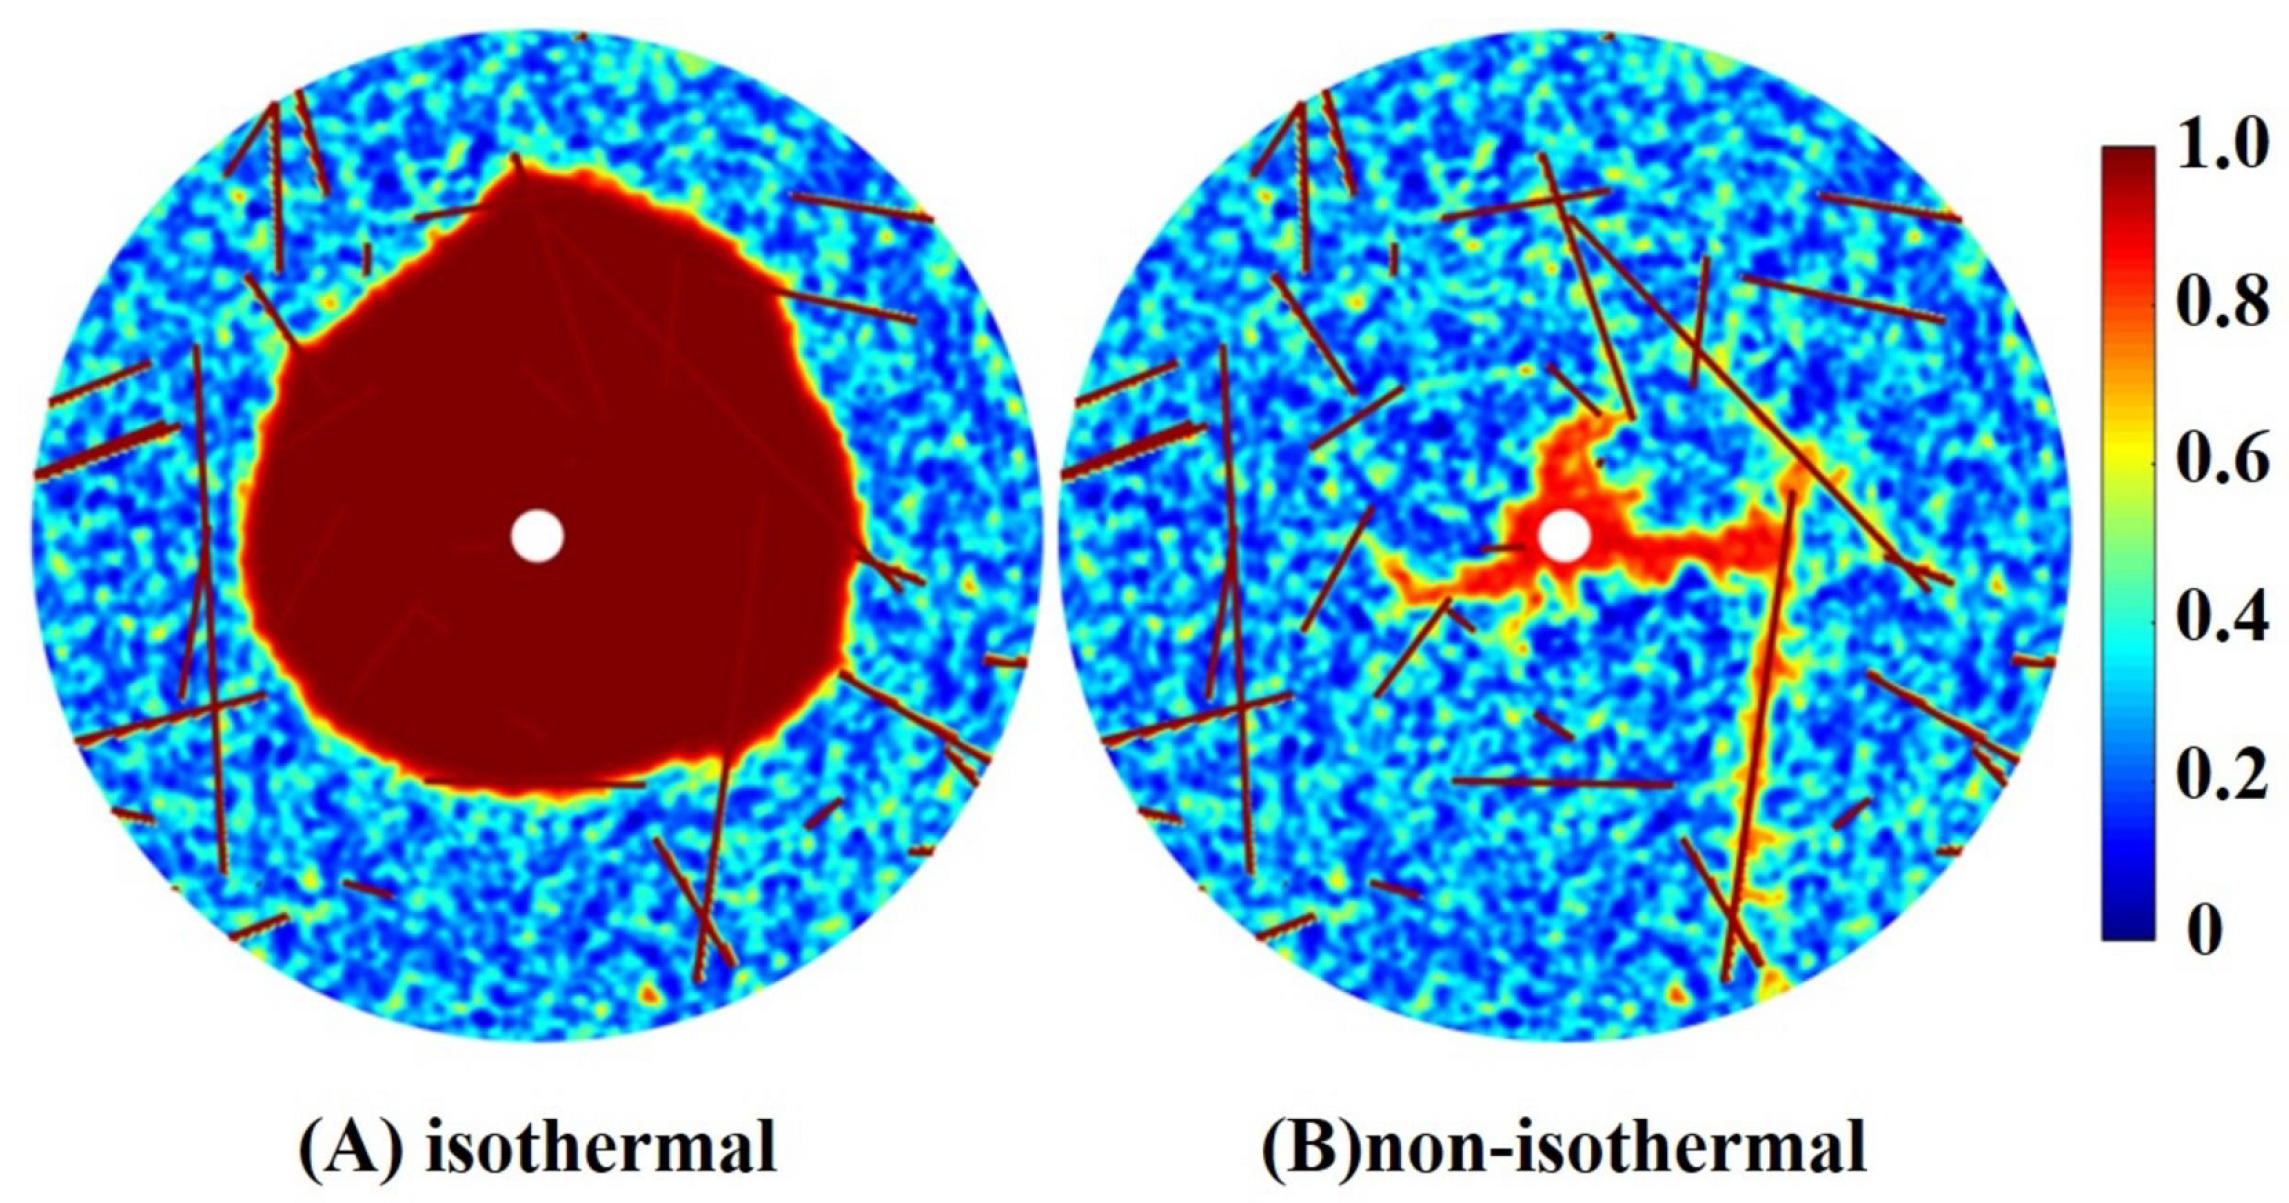
6.2. Effect of Reaction Temperature

In this section, the acid is injected into the rock radially or linearly at the same formation temperature (375 K). The effect of temperature on the dissolution pattern is investigated. The acid reaction with carbonate minerals releases heat and increases the temperature of the formation, which in its turn accelerates the reaction. To investigate the effect of this heating on the dissolution pattern, in this section, the formation temperature is set to a constant value of 375 K. The dissolution structures are shown in Figure 8 and Figure 9. It is obvious that different wormhole patterns are generated at the breakthrough stage under the influence of temperature. This is because acid reaction becomes faster at a higher temperature. The diffusivity and reactivity also increase with higher temperatures. Hence, different dissolution modes are produced at the same injection rate.

6.3. Effect of Stress Sensitivity

Stress sensitivity is a common characteristic in oil and gas reservoirs. Many theoretical, numerical, and experimental studies have been conducted to study the effect of stress sensitivity [59,60,61,62]. The distribution, variation, and stress sensitivity of fractures along with the hydraulic properties of the matrix are regarded as important parameters for thermal–hydraulic–mechanical modeling [63,64,65].
Although many studies have been carried out on the stress sensitivity of fractured reservoirs, they mainly focus on the relationship between reservoir permeability and stress sensitivity but neglect the effect on the dissolution patterns. The stress sensibility of the reservoir results mainly from the presence of fractures. The influence of the effective stress on wormhole patterns is analyzed in fractured carbonate rocks from the radial and linear aspects. This is evident in Figure 10 and Figure 11 that the range of the wormhole propagation is reduced at low injection rates. While at high injection rates, the range of the wormhole propagation is extended (Figure 10d). It is worth noting that at a low injection rate, the change of effective stress has little effect on wormhole structures in Figure 11d. The rapid injection and incomplete reaction allow some reactants to propagate further downstream, resulting in a more uniform dissolution. The effective stress has little effect on the dissolution patterns of wormhole in linear simulation (Figure 10). However, the dissolution pattern is changed by the conical dissolution of the wormhole in radial simulation (Figure 11 row (b)). The reason is that the value of the formation porosity decreases as the effective stress increases. The value of P V B T is plotted against 1 / D a in Figure 12. It could be observed in Figure 12 that P V B T increases with higher effective stress regardless of the injection rate.

7. Conclusions

In this study, we developed a Thermal-Hydrologic-mechanics-Chemical coupled model to simulate the dissolution process during acidizing in carbonate reservoirs. The following conclusions are made after analyzing the influence of fracture parameters, temperature, and stress on the dissolution process.
1. Wormhole propagation is affected by the orientation of fractures. The wormhole grows along the fracture direction in both linear and radial cases. When acid is injected into the formation radially, no matter which direction the fracture is, the injected acid can always flow along the fracture direction. Therefore, the direction of wormhole propagation is determined by the fracture distribution of the formation.
2. With the increase in fracture length, thinner wormholes with fewer branches are obtained. If there is a long fracture in the formation, the wormhole will expand along this fracture. Therefore, to make all zones near the wellbore be stimulated sufficiently, long fractures need to be plugged before the acid is injected into the formation.
3. The presence of natural fractures enhanced the efficiency of acidizing. As increasing natural-fracture density, wormholes are formed with fewer branches. The injected acid preferentially selectively flows into fractures with the least resistance, resulting in much higher efficiency in wormhole propagation.
4. The influence of temperature on the dissolution pattern cannot be ignored, and hence should be considered in the acidizing design. With the increase in temperature, not only the acid reaction becomes faster, but also the diffusivity and reactivity also increase. Hence, different dissolution patterns are produced at the same injection rate by Comparing the non-isothermal and isothermal dissolution structures.
5. As the effective stress increases, the increment of porosity decreases, and the permeability enhancement is inhibited, resulting in the increase of P V B T . Therefore, the mechanical compaction effects should be considered when designing the acidizing stimulation treatment.
It should be noted that in this work we are mainly concerned with coupling in Thermal-Hydrologic-Chemical(THC) processes and only local effects are considered for the mechanics, so only limited simulation result is presented. In practice, the mechanics should be coupled to THC processes fully. A fully coupled Thermal-Hydrologic-Mechanics-Chemical model for simulating the wormhole formation during acidizing will be developed in our future work.

Author Contributions

Z.Z. and K.Z. designed the research. P.L. performed the numerical calculations and wrote the main manuscript. C.H., L.J. and W.J. contributed to the interpretation of results and writing. All authors reviewed the manuscript. All authors have read and agreed to the published version of the manuscript.

Funding

The authors gratefully acknowledge the support from the National Natural Science Foundation of China (No. 51804325, No. 52274057), the Major Scientific and Technological Projects of CNPC under Grant ZD2019-183-008, the Major Scientific and Technological Projects of CNOOC under Grant CCL2022RCPS0397RSN, the Science and Technology Support Plan for Youth Innovation of University in Shandong Province under Grant 2019KJH002, 111 Project under Grant B08028, and the China Postdoctoral Science Foundation (No. 2019M652508).

Data Availability Statement

The datasets generated during the current study are available from the corresponding author on reasonable request.

Conflicts of Interest

The authors declare no conflict of interest.

Abbreviations

The following abbreviations are used in this manuscript:
THmCThermal-Hydrologic-mechanics-Chemical
TSCTwo-Scale Continuum
TVDTotal Variation Diminishing
EOREnhanced Oil Recovery

References

  1. Wei, W.; Varavei, A.; Sanaei, A.; Sepehrnoori, K. Geochemical modeling of wormhole propagation in carbonate acidizing considering mineralogy heterogeneity. SPE J. 2019, 24, 2163–2181. [Google Scholar] [CrossRef]
  2. Qiu, X.; Aidagulov, G.; Ghommem, M.; Edelman, E.; Brady, D.; Abbad, M. Towards a better understanding of wormhole propagation in carbonate rocks: Linear vs. radial acid injection. J. Pet. Sci. Eng. 2018, 171, 570–583. [Google Scholar] [CrossRef]
  3. Fredd, C.; Fogler, H.S. Alternative stimulation fluids and their impact on carbonate acidizing. SPE J. 1998, 3, 34–41. [Google Scholar] [CrossRef]
  4. Fredd, C.N.; Fogler, H.S. Influence of transport and reaction on wormhole formation in porous media. AIChE J. 1998, 44, 1933–1949. [Google Scholar] [CrossRef] [Green Version]
  5. Fredd, C.N.; Fogler, H. Optimum conditions for wormhole formation in carbonate porous media: Influence of transport and reaction. SPE J. 1999, 4, 196–205. [Google Scholar] [CrossRef]
  6. McDuff, D.R.; Shuchart, C.E.; Jackson, S.K.; Postl, D.; Brown, J.S. Understanding wormholes in carbonates: Unprecedented experimental scale and 3-D visualization. In Proceedings of the SPE Annual Technical Conference and Exhibition; OnePetro: Dubai, United Arab Emirates, 2010. [Google Scholar]
  7. Aljawad, M.S.; Aboluhom, H.; Schwalbert, M.P.; Al-Mubarak, A.; Alafnan, S.; Mahmoud, M. Temperature impact on linear and radial wormhole propagation in limestone, dolomite, and mixed mineralogy. J. Nat. Gas Sci. Eng. 2021, 93, 104031. [Google Scholar] [CrossRef]
  8. Jeffry, S.J.M.; Trjangganung, K.; Chandrakant, A.A.; Madon, B.; Katende, A.; Ismail, I. Selection of suitable acid chemicals for matrix stimulation: A Malaysian Brown field scenario. J. Pet. Sci. Eng. 2020, 186, 106689. [Google Scholar] [CrossRef]
  9. Aldhayee, K.; Ali, M.T.; Nasr-El-Din, H.A. Modeling wormhole propagation during closed-fracture-acidizing stimulation in tight-carbonate formations. SPE J. 2020, 25, 2373–2400. [Google Scholar] [CrossRef]
  10. Al-Arji, H.; Al-Azman, A.; Le-Hussain, F.; Regenauer-Lieb, K. Acid stimulation in carbonates: A laboratory test of a wormhole model based on Damköhler and Péclet numbers. J. Pet. Sci. Eng. 2021, 203, 108593. [Google Scholar] [CrossRef]
  11. Cheng, H.; Zhu, D.; Hill, A. The effect of evolved CO2 on wormhole propagation in carbonate acidizing. SPE Prod. Oper. 2017, 32, 325–332. [Google Scholar] [CrossRef]
  12. Daccord, G. Chemical dissolution of a porous medium by a reactive fluid. Phys. Rev. Lett. 1987, 58, 479. [Google Scholar] [CrossRef]
  13. Daccord, G.; Lenormand, R.; Lietard, O. Chemical dissolution of a porous medium by a reactive fluid—I. Model for the “wormholing” phenomenon. Chem. Eng. Sci. 1993, 48, 169–178. [Google Scholar] [CrossRef]
  14. Kelemen, P.B.; Whitehead, J.; Aharonov, E.; Jordahl, K.A. Experiments on flow focusing in soluble porous media, with applications to melt extraction from the mantle. J. Geophys. Res. Solid Earth 1995, 100, 475–496. [Google Scholar] [CrossRef]
  15. Golfier, F.; Zarcone, C.; Bazin, B.; Lenormand, R.; Lasseux, D.; Quintard, M. On the ability of a Darcy-scale model to capture wormhole formation during the dissolution of a porous medium. J. Fluid Mech. 2002, 457, 213–254. [Google Scholar] [CrossRef]
  16. Siddiqui, S.; Nasr-El-Din, H.A.; Khamees, A.A. Wormhole initiation and propagation of emulsified acid in carbonate cores using computerized tomography. J. Pet. Sci. Eng. 2006, 54, 93–111. [Google Scholar] [CrossRef]
  17. Machado, A.; Oliveira, T.; Cruz, F.; Lopes, R.; Lima, I. X-ray microtomography of hydrochloric acid propagation in carbonate rocks. Appl. Radiat. Isot. 2015, 96, 129–134. [Google Scholar] [CrossRef]
  18. Maheshwari, P.; Ratnakar, R.; Kalia, N.; Balakotaiah, V. 3-D simulation and analysis of reactive dissolution and wormhole formation in carbonate rocks. Chem. Eng. Sci. 2013, 90, 258–274. [Google Scholar] [CrossRef]
  19. Frick, T.; Mostofizadeh, B.; Economides, M. Analysis of radial core experiments for hydrochloric acid interaction with limestones. In Proceedings of the SPE Formation Damage Control Symposium; OnePetro: Dubai, United Arab Emirates, 1994. [Google Scholar]
  20. Dong, K.; Jin, X.; Zhu, D.; Hill, A. The effect of core dimensions on the optimum acid flux in carbonate acidizing. In Proceedings of the SPE International Symposium and Exhibition on Formation Damage Control; OnePetro: Dubai, United Arab Emirates, 2014. [Google Scholar]
  21. Karale, C.; Beuterbaugh, A.; Pinto, M.; Hipparge, G.; Prakash, A. HP/HT Carbonate Acidizing—Recent Discoveries and Contradictions in Wormhole Phenomenon. In Proceedings of the Offshore Technology Conference Asia; OnePetro: Dubai, United Arab Emirates, 2016. [Google Scholar]
  22. Panga, M.K.; Ziauddin, M.; Balakotaiah, V. Two-scale continuum model for simulation of wormholes in carbonate acidization. AIChE J. 2005, 51, 3231–3248. [Google Scholar] [CrossRef]
  23. Li, Y.; Liao, Y.; Zhao, J.; Peng, Y.; Pu, X. Simulation and analysis of wormhole formation in carbonate rocks considering heat transmission process. J. Nat. Gas Sci. Eng. 2017, 42, 120–132. [Google Scholar] [CrossRef]
  24. Liu, P.; Li, J.; Sun, S.; Yao, J.; Zhang, K. Numerical investigation of carbonate acidizing with gelled acid using a coupled thermal–hydrologic–chemical model. Int. J. Therm. Sci. 2021, 160, 106700. [Google Scholar] [CrossRef]
  25. Xue, H.; Huang, Z.; Zhao, L.; Wang, H.; Kang, B.; Liu, P.; Liu, F.; Cheng, Y.; Xin, J. Influence of acid-rock reaction heat and heat transmission on wormholing in carbonate rock. J. Nat. Gas Sci. Eng. 2018, 50, 189–204. [Google Scholar] [CrossRef]
  26. Liu, P.; Couples, G.D.; Yao, J.; Huang, Z.; Song, W.; Ma, J. A general method for simulating reactive dissolution in carbonate rocks with arbitrary geometry. Comput. Geosci. 2018, 22, 1187–1201. [Google Scholar] [CrossRef]
  27. Liu, P.; Yan, X.; Yao, J.; Sun, S. Modeling and analysis of the acidizing process in carbonate rocks using a two-phase thermal-hydrologic-chemical coupled model. Chem. Eng. Sci. 2019, 207, 215–234. [Google Scholar] [CrossRef]
  28. Liu, P.; Yao, J.; Couples, G.D.; Ma, J.; Iliev, O. 3-D modelling and experimental comparison of reactive flow in carbonates under radial flow conditions. Sci. Rep. 2017, 7, 17711. [Google Scholar] [CrossRef] [PubMed] [Green Version]
  29. Jia, C.; Sepehrnoori, K.; Huang, Z.; Zhang, H.; Yao, J. Numerical studies and analysis on reactive flow in carbonate matrix acidizing. J. Pet. Sci. Eng. 2021, 201, 108487. [Google Scholar] [CrossRef]
  30. Liu, P.; Xue, H.; Zhao, L.; Zhao, X.; Cui, M. Simulation of 3D multi-scale wormhole propagation in carbonates considering correlation spatial distribution of petrophysical properties. J. Nat. Gas Sci. Eng. 2016, 32, 81–94. [Google Scholar] [CrossRef]
  31. Qi, N.; Chen, G.; Liang, C.; Guo, T.; Liu, G.; Zhang, K. Numerical simulation and analysis of the influence of fracture geometry on wormhole propagation in carbonate reservoirs. Chem. Eng. Sci. 2019, 198, 124–143. [Google Scholar] [CrossRef]
  32. Jia, C.; Huang, Z.; Sepehrnoori, K.; Yao, J. Modification of two-scale continuum model and numerical studies for carbonate matrix acidizing. J. Pet. Sci. Eng. 2020, 197, 107972. [Google Scholar] [CrossRef]
  33. Liu, P.; Yao, J.; Couples, G.D.; Huang, Z.; Sun, H.; Ma, J. Numerical modelling and analysis of reactive flow and wormhole formation in fractured carbonate rocks. Chem. Eng. Sci. 2017, 172, 143–157. [Google Scholar] [CrossRef]
  34. Liu, P.; Yao, J.; Couples, G.D.; Ma, J.; Huang, Z.; Sun, H. Modeling and simulation of wormhole formation during acidization of fractured carbonate rocks. J. Pet. Sci. Eng. 2017, 154, 284–301. [Google Scholar] [CrossRef]
  35. Mou, J.; Yu, X.; Wang, L.; Zhang, S.; Ma, X.; Lyu, X. Effect of Natural Fractures on Wormhole-Propagation Behavior. SPE Prod. Oper. 2019, 34, 145–158. [Google Scholar] [CrossRef]
  36. Deng, H.; Molins, S.; Steefel, C.; DePaolo, D.; Voltolini, M.; Yang, L.; Ajo-Franklin, J. A 2.5 D reactive transport model for fracture alteration simulation. Environ. Sci. Technol. 2016, 50, 7564–7571. [Google Scholar] [CrossRef] [Green Version]
  37. Hill, A.; Zhu, D.; Dong, C.; Luna-Garcia, A. Computer model predicts matrix acidizing of naturally fractured carbonate. J. Pet. Technol. 2001, 53, 20–25. [Google Scholar] [CrossRef]
  38. Hanna, R.B.; Rajaram, H. Influence of aperture variability on dissolutional growth of fissures in karst formations. Water Resour. Res. 1998, 34, 2843–2853. [Google Scholar] [CrossRef]
  39. Upadhyay, V.K.; Szymczak, P.; Ladd, A.J. Initial conditions or emergence: What determines dissolution patterns in rough fractures? J. Geophys. Res. Solid Earth 2015, 120, 6102–6121. [Google Scholar] [CrossRef] [Green Version]
  40. Dong, C.; Zhu, D.; Hill, A. Modeling of the acidizing process in naturally fractured carbonates. SPE J. 2002, 7, 400–408. [Google Scholar] [CrossRef]
  41. Detwiler, R.L.; Rajaram, H. Predicting dissolution patterns in variable aperture fractures: Evaluation of an enhanced depth-averaged computational model. Water Resour. Res. 2007, 43, 1–14. [Google Scholar] [CrossRef]
  42. Szymczak, P.; Ladd, A. Wormhole formation in dissolving fractures. J. Geophys. Res. Solid Earth 2009, 114, 1–22. [Google Scholar] [CrossRef] [Green Version]
  43. O’Brien, G.; Bean, C.; McDermott, F. Numerical investigations of passive and reactive flow through generic single fractures with heterogeneous permeability. Earth Planet. Sci. Lett. 2003, 213, 271–284. [Google Scholar] [CrossRef]
  44. Dong, C.; Zhu, D.; Hill, A. Acid penetration in natural fracture networks. SPE Prod. Facil. 2002, 17, 160–170. [Google Scholar] [CrossRef]
  45. Dong, C.; Zhu, D.; Hill, A. Acidizing in Naturally Fractured Carbonate Reservoirs. In Proceedings of the SPE/DOE Improved Oil Recovery Symposium; OnePetro: Dubai, United Arab Emirates, 2002. [Google Scholar]
  46. Li, Y.; Liao, Y.; Zhao, J. Wormhole dissolution pattern study in complicated carbonate rock based on two-scale continuum model and equivalent seepage theory. Nat. Gas Geosci. 2016, 27, 121–127. [Google Scholar]
  47. Kalia, N.; Balakotaiah, V. Effect of medium heterogeneities on reactive dissolution of carbonates. Chem. Eng. Sci. 2009, 64, 376–390. [Google Scholar] [CrossRef]
  48. Garipov, T.; Karimi-Fard, M.; Tchelepi, H. Discrete fracture model for coupled flow and geomechanics. Comput. Geosci. 2016, 20, 149–160. [Google Scholar] [CrossRef]
  49. Sandve, T.H.; Berre, I.; Nordbotten, J.M. An efficient multi-point flux approximation method for discrete fracture–matrix simulations. J. Comput. Phys. 2012, 231, 3784–3800. [Google Scholar] [CrossRef]
  50. Therrien, R.; Sudicky, E. Three-dimensional analysis of variably-saturated flow and solute transport in discretely-fractured porous media. J. Contam. Hydrol. 1996, 23, 1–44. [Google Scholar] [CrossRef]
  51. Alotaibi, M.; Chen, H.; Sun, S. Generalized multiscale finite element methods for the reduced model of Darcy flow in fractured porous media. J. Comput. Appl. Math. 2022, 413, 114305. [Google Scholar] [CrossRef]
  52. Milliotte, C.; Jonoud, S.; Wennberg, O.P.; Matthäi, S.K.; Jurkiw, A.; Mosser, L. Well-data-based discrete fracture and matrix modelling and flow-based upscaling of multilayer carbonate reservoir horizons. Geol. Soc. Lond. Spec. Publ. 2018, 459, 191–210. [Google Scholar] [CrossRef]
  53. Yang, Y.; Tao, L.; Yang, H.; Iglauer, S.; Wang, X.; Askari, R.; Yao, J.; Zhang, K.; Zhang, L.; Sun, H. Stress sensitivity of fractured and vuggy carbonate: An X-Ray computed tomography analysis. J. Geophys. Res. Solid Earth 2020, 125, e2019JB018759. [Google Scholar] [CrossRef]
  54. Bohnsack, D.; Potten, M.; Freitag, S.; Einsiedl, F.; Zosseder, K. Stress sensitivity of porosity and permeability under varying hydrostatic stress conditions for different carbonate rock types of the geothermal Malm reservoir in Southern Germany. Geotherm. Energy 2021, 9, 1–59. [Google Scholar] [CrossRef]
  55. Wang, L.; Yang, S.; Meng, Z.; Chen, Y.; Qian, K.; Han, W.; Wang, D. Time-dependent shape factors for fractured reservoir simulation: Effect of stress sensitivity in matrix system. J. Pet. Sci. Eng. 2018, 163, 556–569. [Google Scholar] [CrossRef]
  56. Mustafa, A.; Alzaki, T.; Aljawad, M.S.; Solling, T.; Dvorkin, J. Impact of acid wormhole on the mechanical properties of chalk, limestone, and dolomite: Experimental and modeling studies. Energy Rep. 2022, 8, 605–616. [Google Scholar] [CrossRef]
  57. Kalia, N.; Glasbergen, G. Wormhole formation in carbonates under varying temperature conditions. In Proceedings of the 8th European Formation Damage Conference; OnePetro: Dubai, United Arab Emirates, 2009. [Google Scholar]
  58. Wilke, C.; Chang, P. Correlation of diffusion coefficients in dilute solutions. AIChE J. 1955, 1, 264–270. [Google Scholar] [CrossRef]
  59. Vairogs, J.; Hearn, C.; Dareing, D.W.; Rhoades, V. Effect of rock stress on gas production from low-permeability reservoirs. J. Pet. Technol. 1971, 23, 1161–1167. [Google Scholar] [CrossRef]
  60. Tian, Y. Experimental study on stress sensitivity of naturally fractured reservoirs. In Proceedings of the SPE Annual Technical Conference and Exhibition; OnePetro: Dubai, United Arab Emirates, 2014. [Google Scholar]
  61. Abass, H.; Ortiz, I.; Khan, M.; Beresky, J.; Sierra, L. Understanding stress dependant permeability of matrix, natural fractures, and hydraulic fractures in carbonate formations. In Proceedings of the SPE Saudi Arabia Section Technical Symposium; OnePetro: Dubai, United Arab Emirates, 2007. [Google Scholar]
  62. Tan, Q.; Kang, Y.; You, L.; Xu, C.; Zhang, X.; Xie, Z. Stress-sensitivity mechanisms and its controlling factors of saline-lacustrine fractured tight carbonate reservoir. J. Nat. Gas Sci. Eng. 2021, 88, 103864. [Google Scholar] [CrossRef]
  63. Brehme, M.; Blöcher, G.; Cacace, M.; Kamah, Y.; Sauter, M.; Zimmermann, G. Permeability distribution in the Lahendong geothermal field: A blind fault captured by thermal–hydraulic simulation. Environ. Earth Sci. 2016, 75, 1–11. [Google Scholar] [CrossRef]
  64. Cacace, M.; Jacquey, A.B. Flexible parallel implicit modelling of coupled thermal–hydraulic–mechanical processes in fractured rocks. Solid Earth 2017, 8, 921–941. [Google Scholar] [CrossRef] [Green Version]
  65. Konrad, F.; Savvatis, A.; Wellmann, F.; Zosseder, K. Hydraulic behavior of fault zones in pump tests of geothermal wells: A parametric analysis using numerical simulations for the Upper Jurassic aquifer of the North Alpine Foreland Basin. Geotherm. Energy 2019, 7, 1–28. [Google Scholar] [CrossRef]
Figure 1. Porosity fields show the impact of fracture orientation on wormhole structures (A) Linear case, (B) Radial case and at different fracture dips: (a) 30 , (b) 60 , (c) 90 , (d) 120 ( 60 ), (e) 150 ( 30 ).
Water 14 04117 g001
Figure 2. The effect of fracture dip on dimensionless breakthrough volumes corresponds to the dissolution structures in Figure 1 column (A).
Water 14 04117 g002
Figure 3. Effect of fracture length on wormhole structures in linear acidizing simulation.
Water 14 04117 g003
Figure 4. Effect of fracture length on wormhole structures in radial acidizing stimulation.
Water 14 04117 g004
Figure 5. The dimensionless breakthrough volumes correspond to the dissolution structures in Figure 3 and Figure 4.
Water 14 04117 g005
Figure 6. Influence of fracture density on wormhole structures, the number of fractures: (A) 12; (B) 17; (C) 30.
Water 14 04117 g006
Figure 7. Influence of fracture density on wormhole structures, the number of fractures: (A) 20; (B) 35; (C) 50.
Water 14 04117 g007
Figure 8. Comparison of dissolution structures for non-isothermal and isothermal cases in linear acidizing simulation.
Water 14 04117 g008
Figure 9. Comparison of dissolution structures for non-isothermal and isothermal cases in radial acidizing stimulation.
Water 14 04117 g009
Figure 10. Comparison of dissolution structures at different effective stress: (A) σ = 0 MPa, (B) σ = 15 MPa, (C) σ = 30 MPa, (D) σ = 45 MPa and at different injection rates: 1 / D a = (a) 10 6 (b) 2 × 10 6 , (c) 10 4 , (d) 0.005 , (e) 0.05 .
Water 14 04117 g010
Figure 11. Comparison of dissolution structures at different effective stress: (A) σ = 0 MPa, (B) σ = 15 MPa, (C) σ = 30 MPa, (D) σ = 45 MPa and at different injection rates: 1 / D a = (a) 0.00075 , (b) 0.0225 , (c) 0.075 , (d) 0.75 .
Water 14 04117 g011
Figure 12. Comparison of the P V B T calculated under different effective stress conditions.
Water 14 04117 g012
Table 1. List of values of parameters used in the simulation.
ParametersValues
L5 cm
H2 cm
r e 10 cm
r w 0.5 cm
ϕ 0 0.35
K 0 100 md
r 0 5 × 10 6
k s 0.2
υ 0.0286
S h 3
S c 1000
N a c 0.1
η 1 × 10 6
v 0 0.004 cms
α o s 0.5
λ T 0.1
λ X 0.5
m1
β 1
h T 2 0.07
Publisher’s Note: MDPI stays neutral with regard to jurisdictional claims in published maps and institutional affiliations.

