

Differentiating Nitrate Origins and Fate in a Semi-Arid Basin (Tunisia) via Geostatistical Analyses and Groundwater Modelling

 , , ,
, , ,  ,
,
Abstract
:1. Introduction
2. Study Area
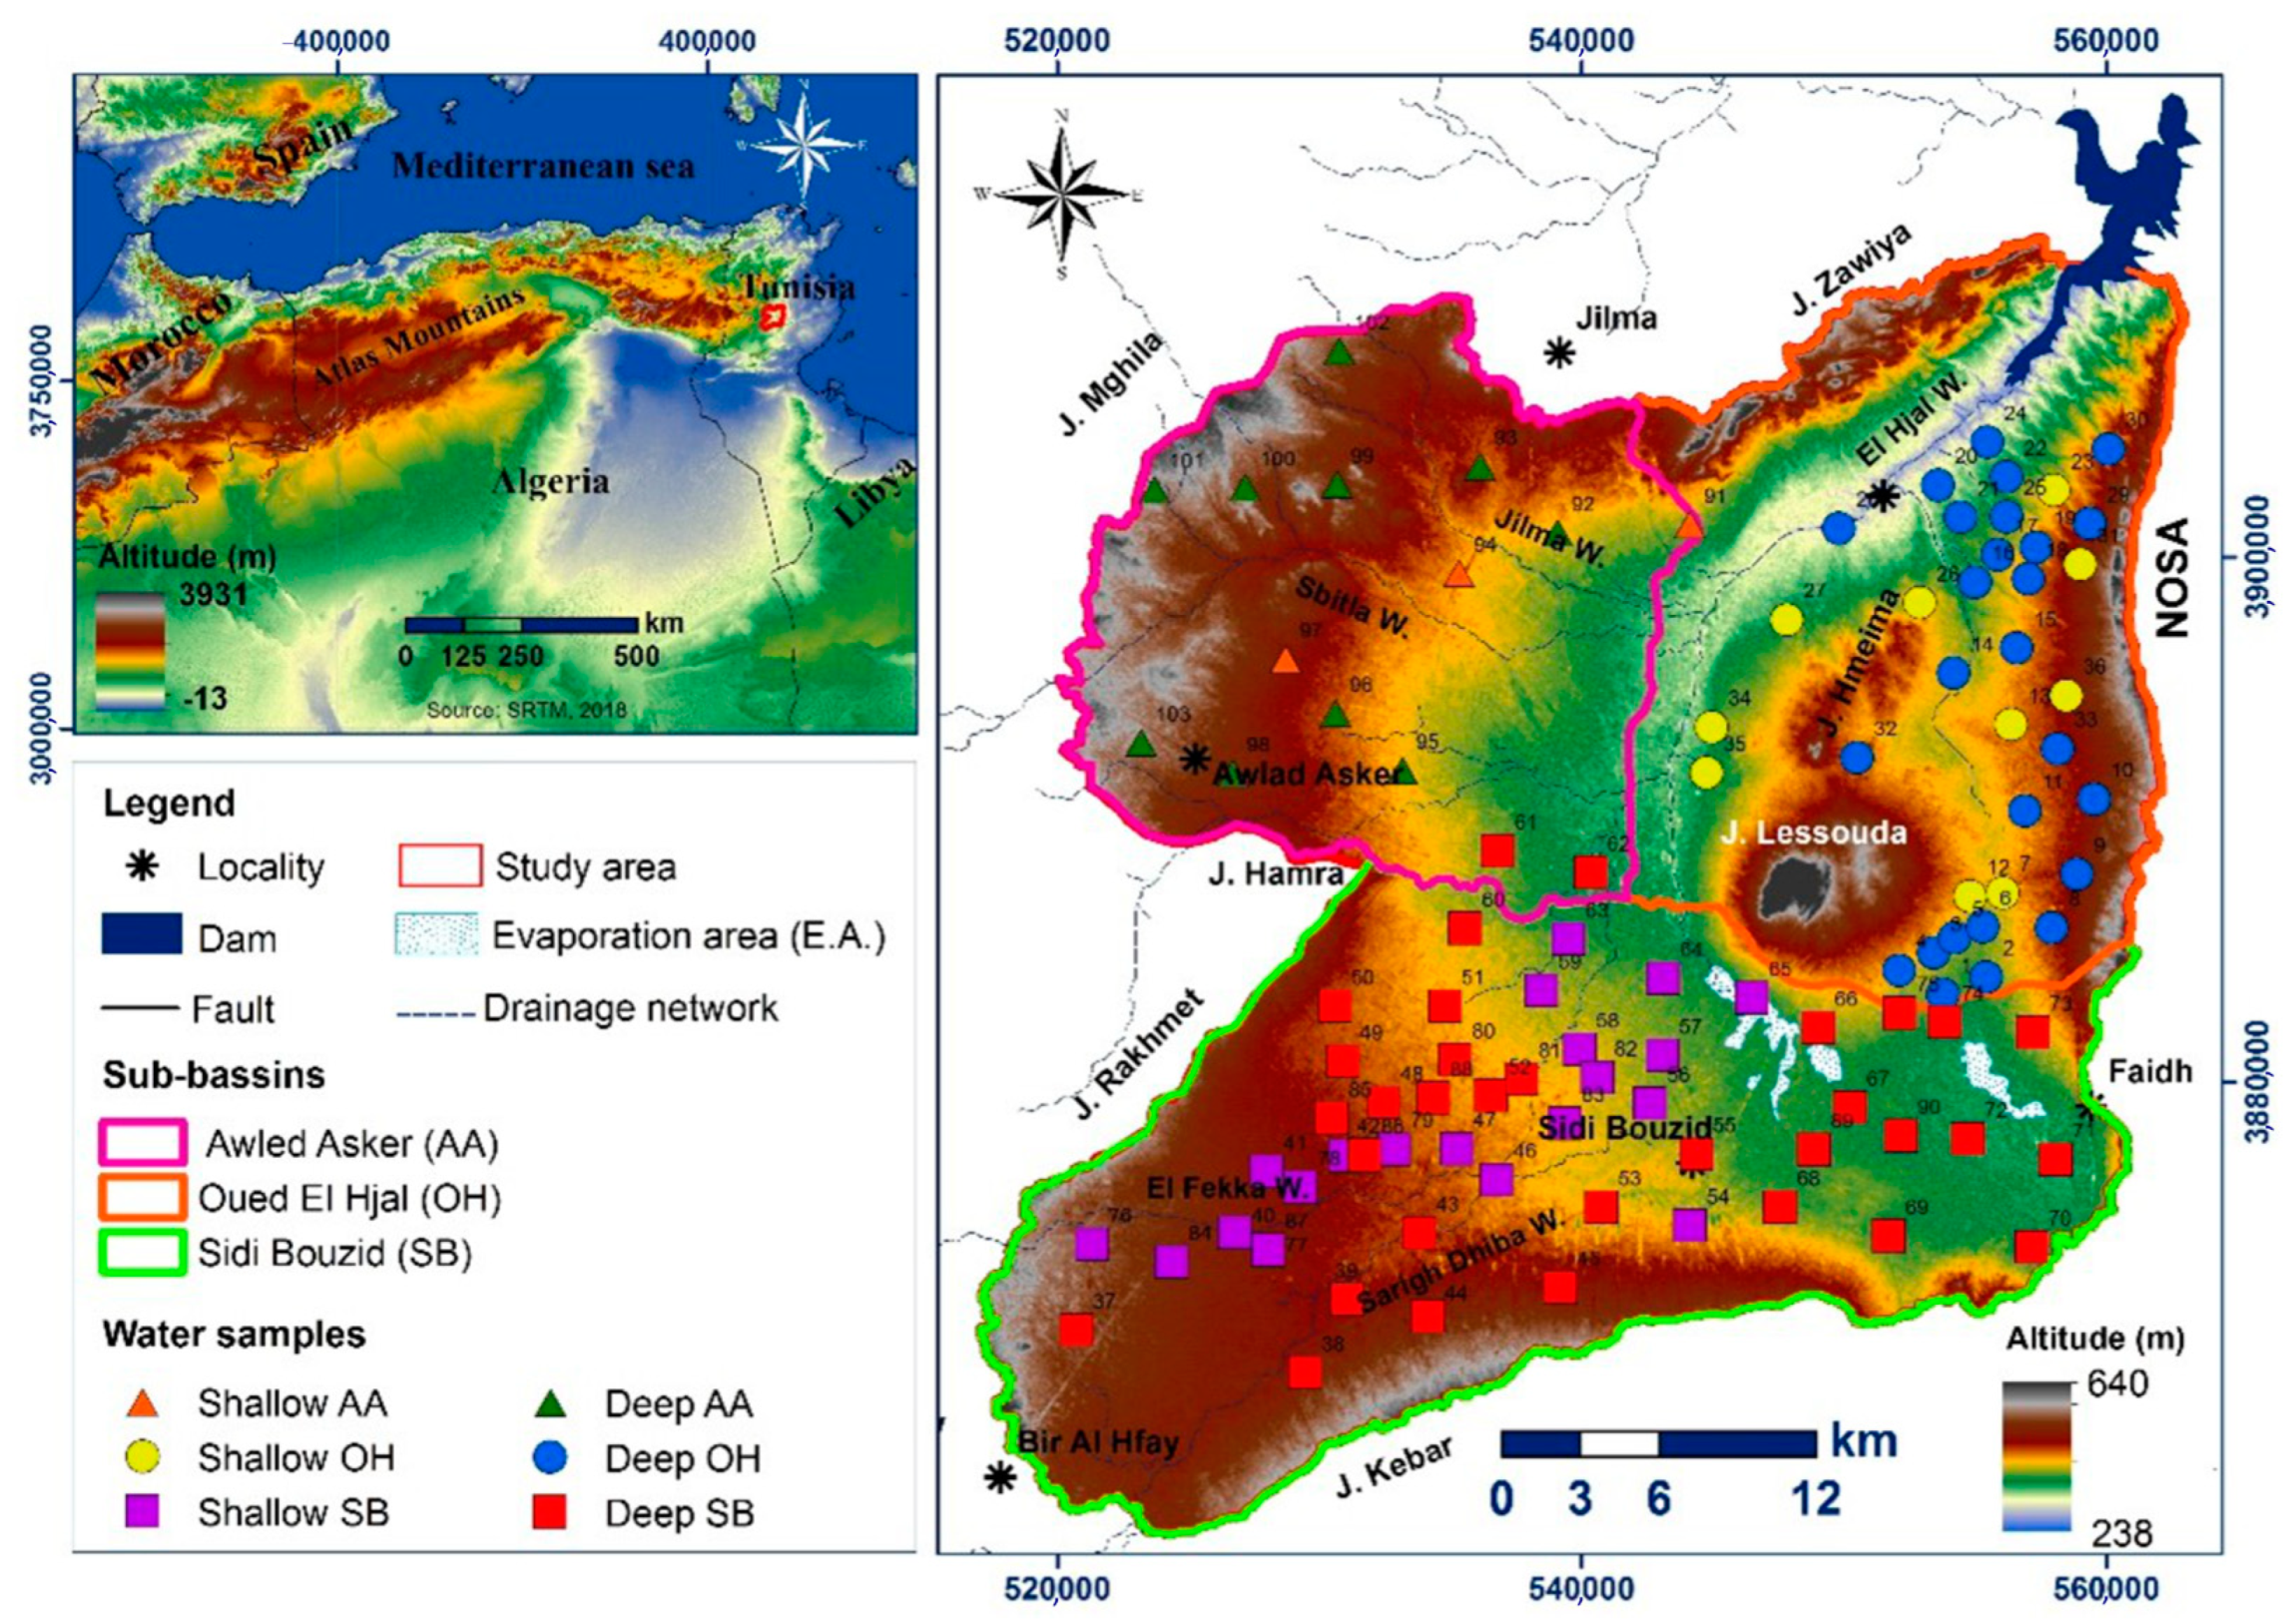
2.1. Geography and Climate
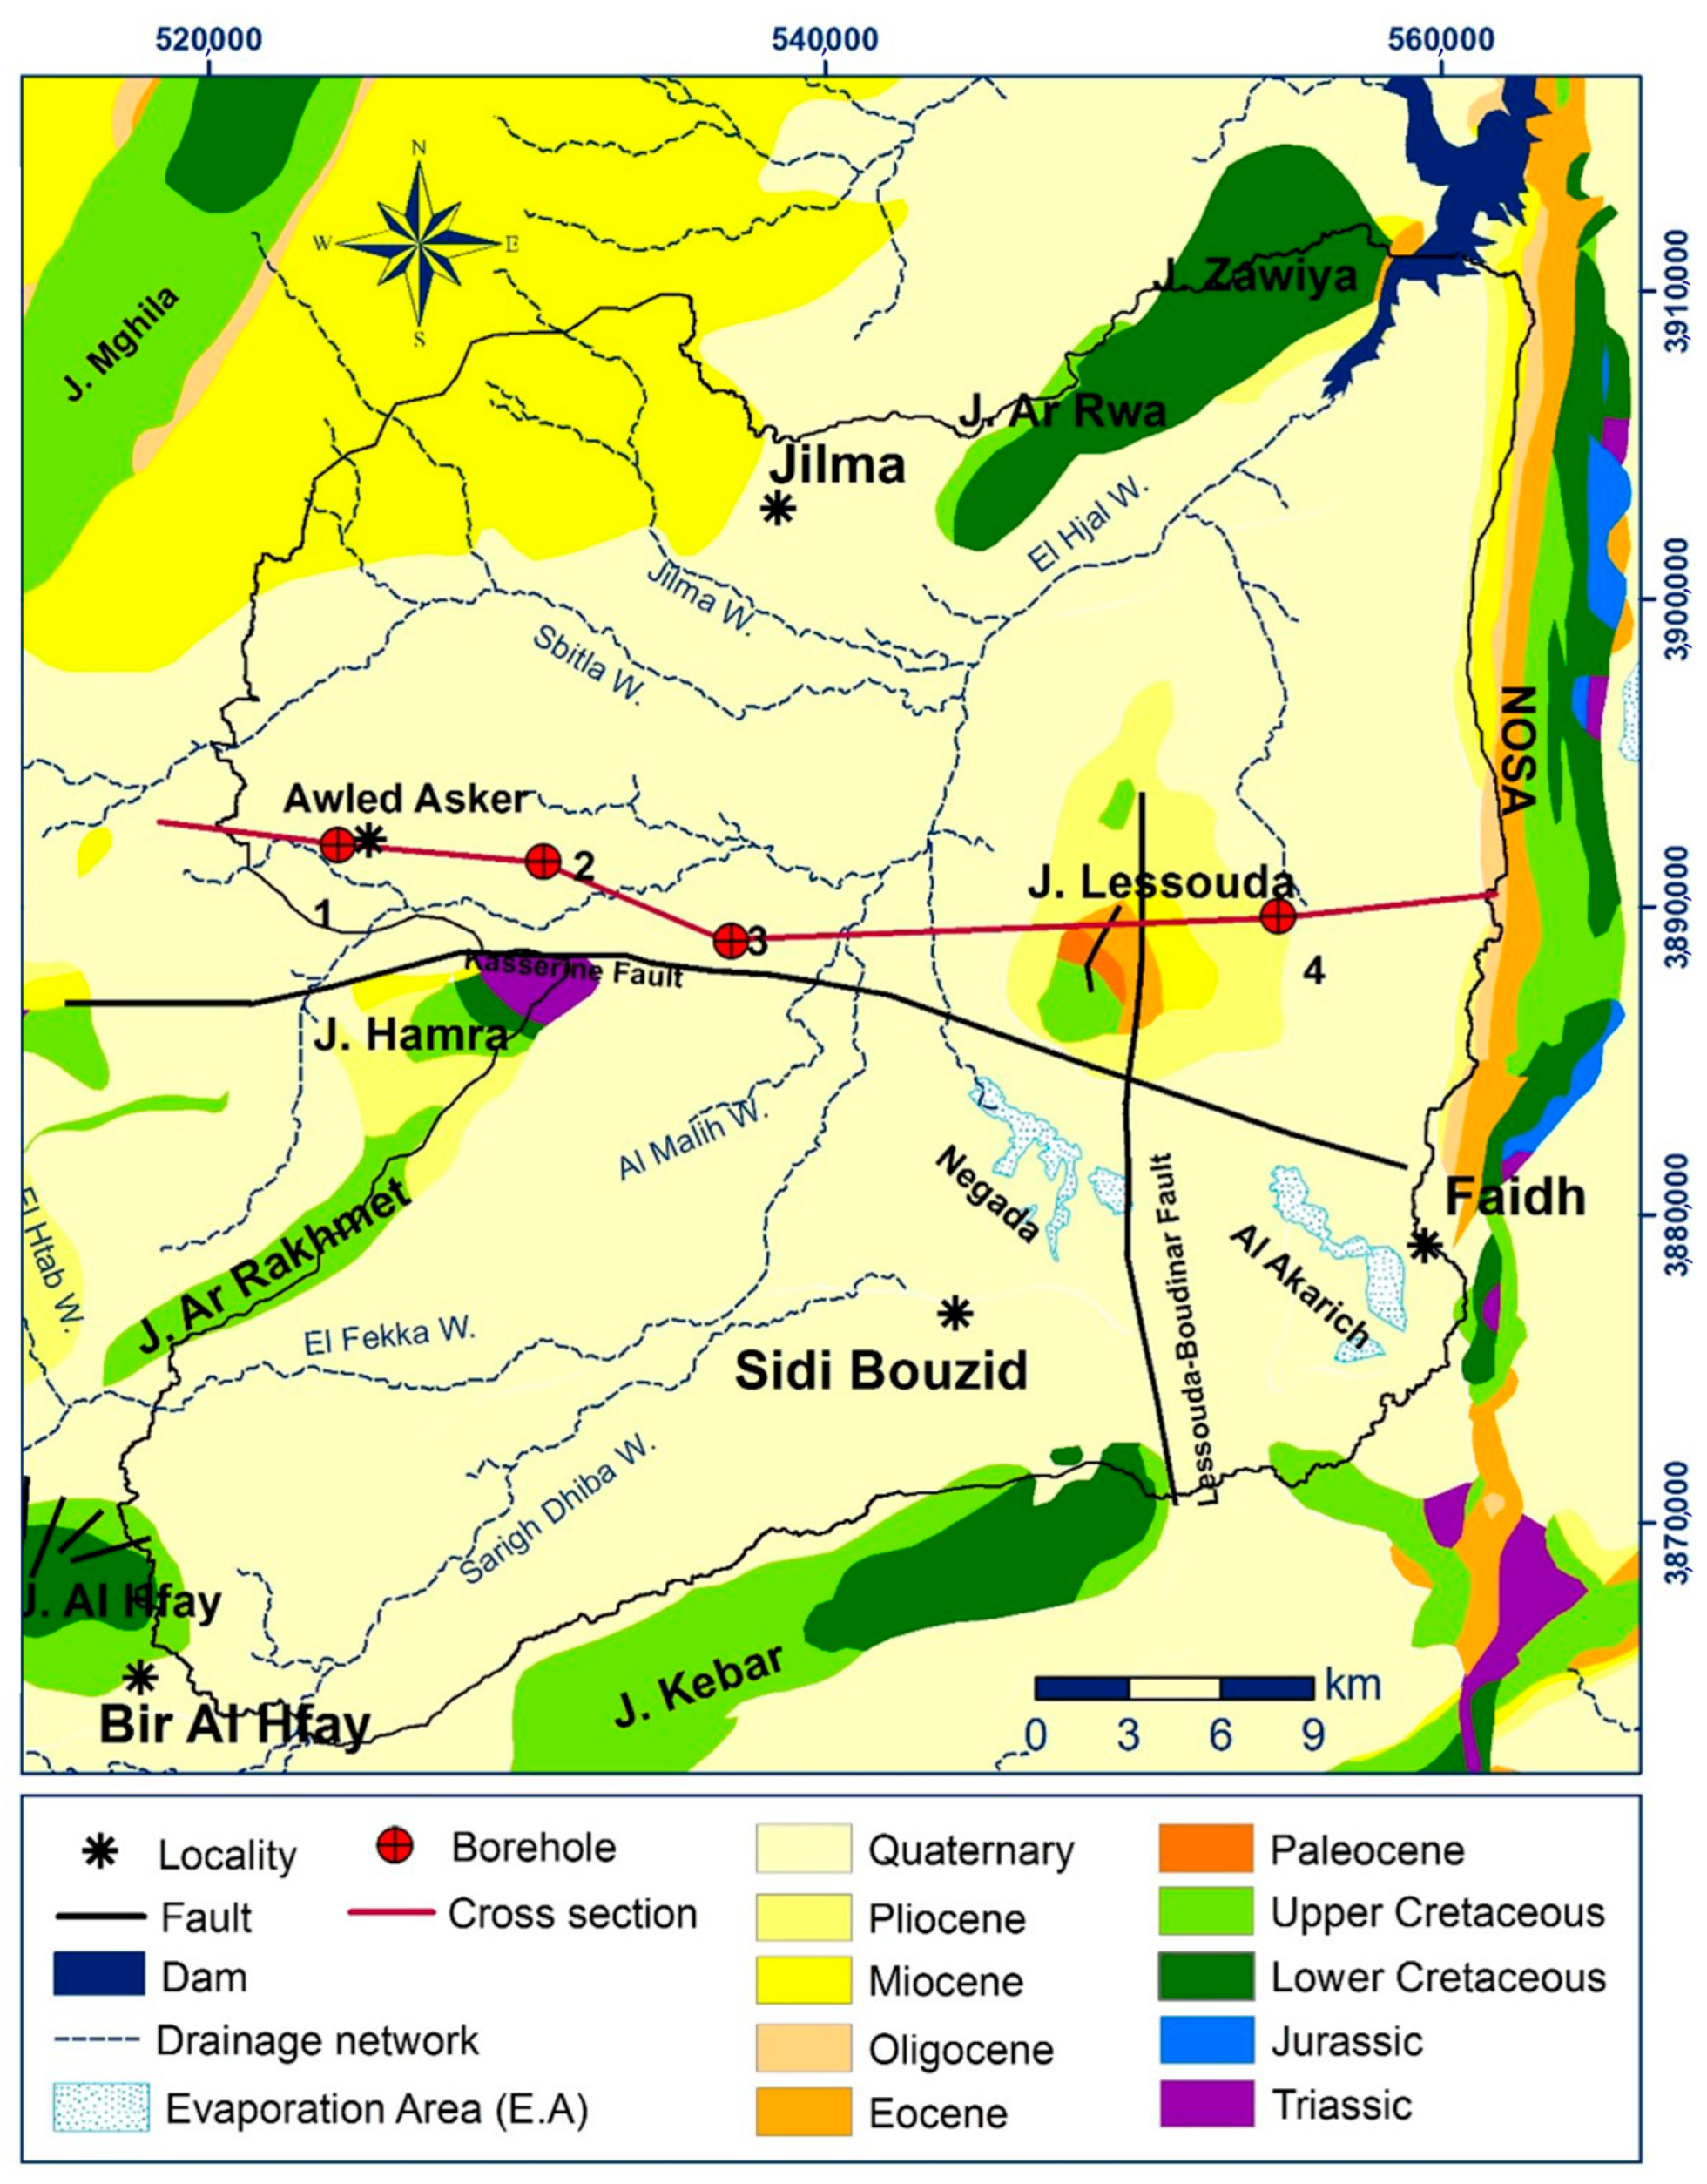
2.2. Geology
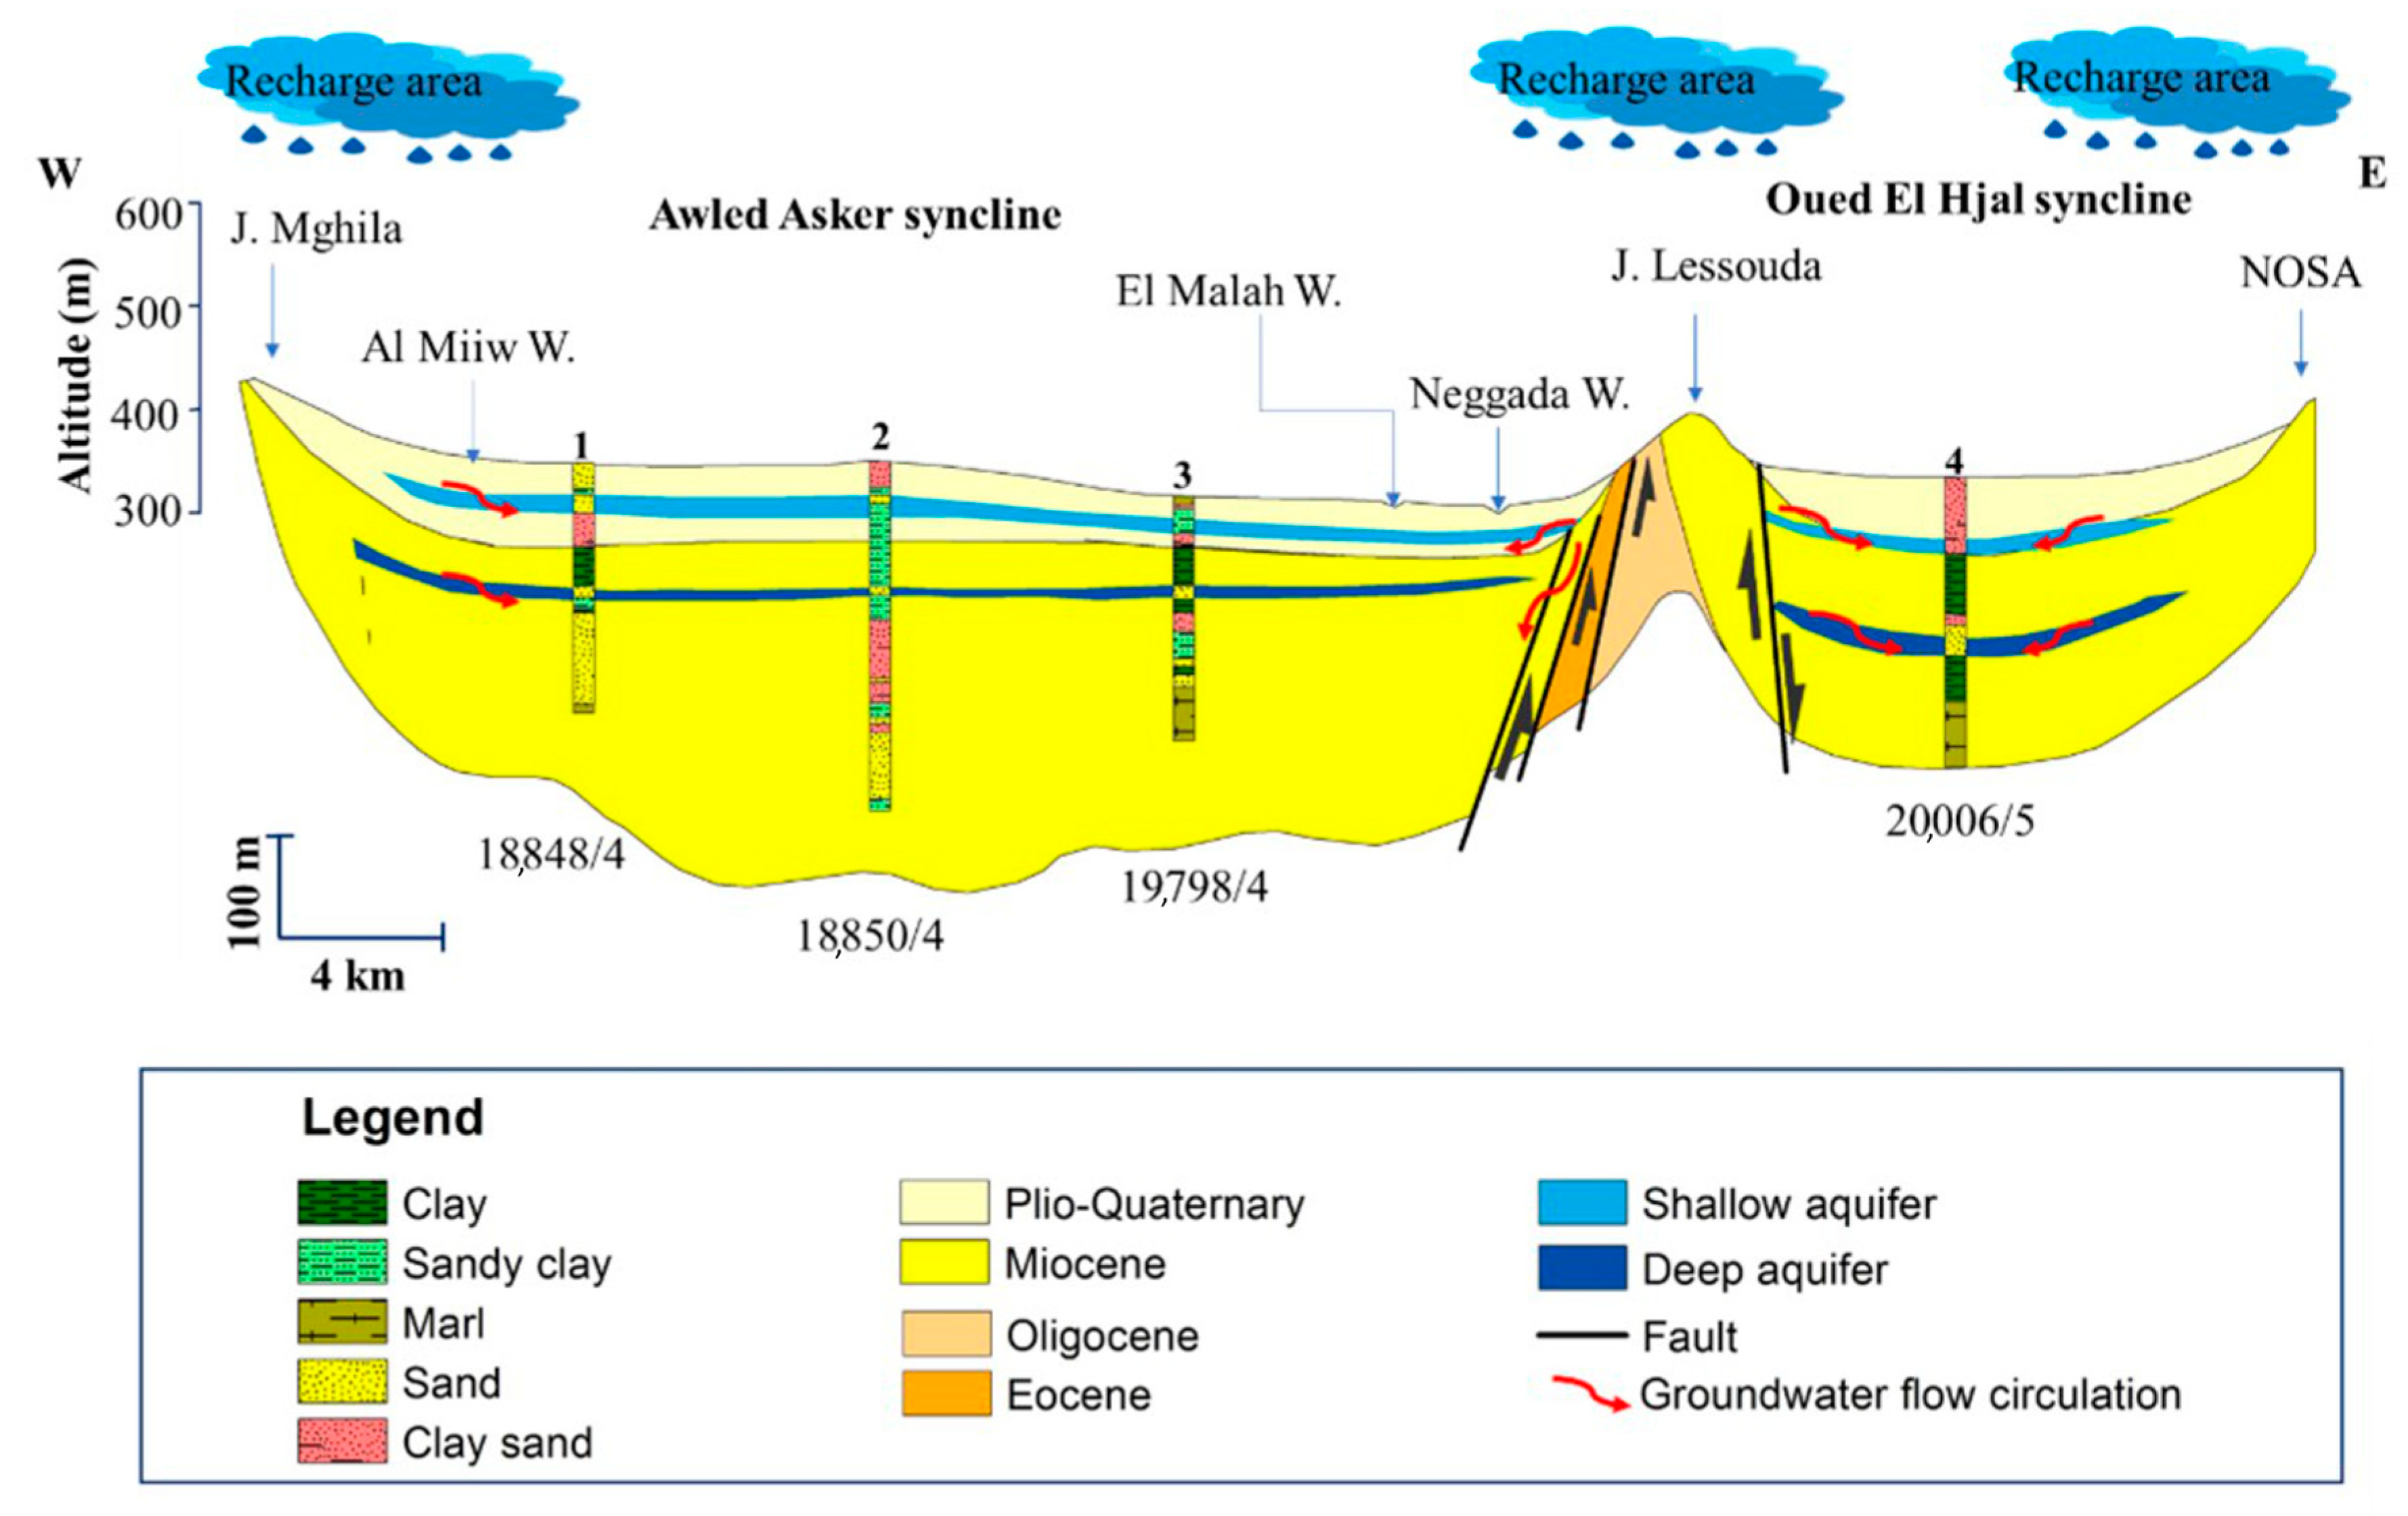
2.3. Hydrogeology
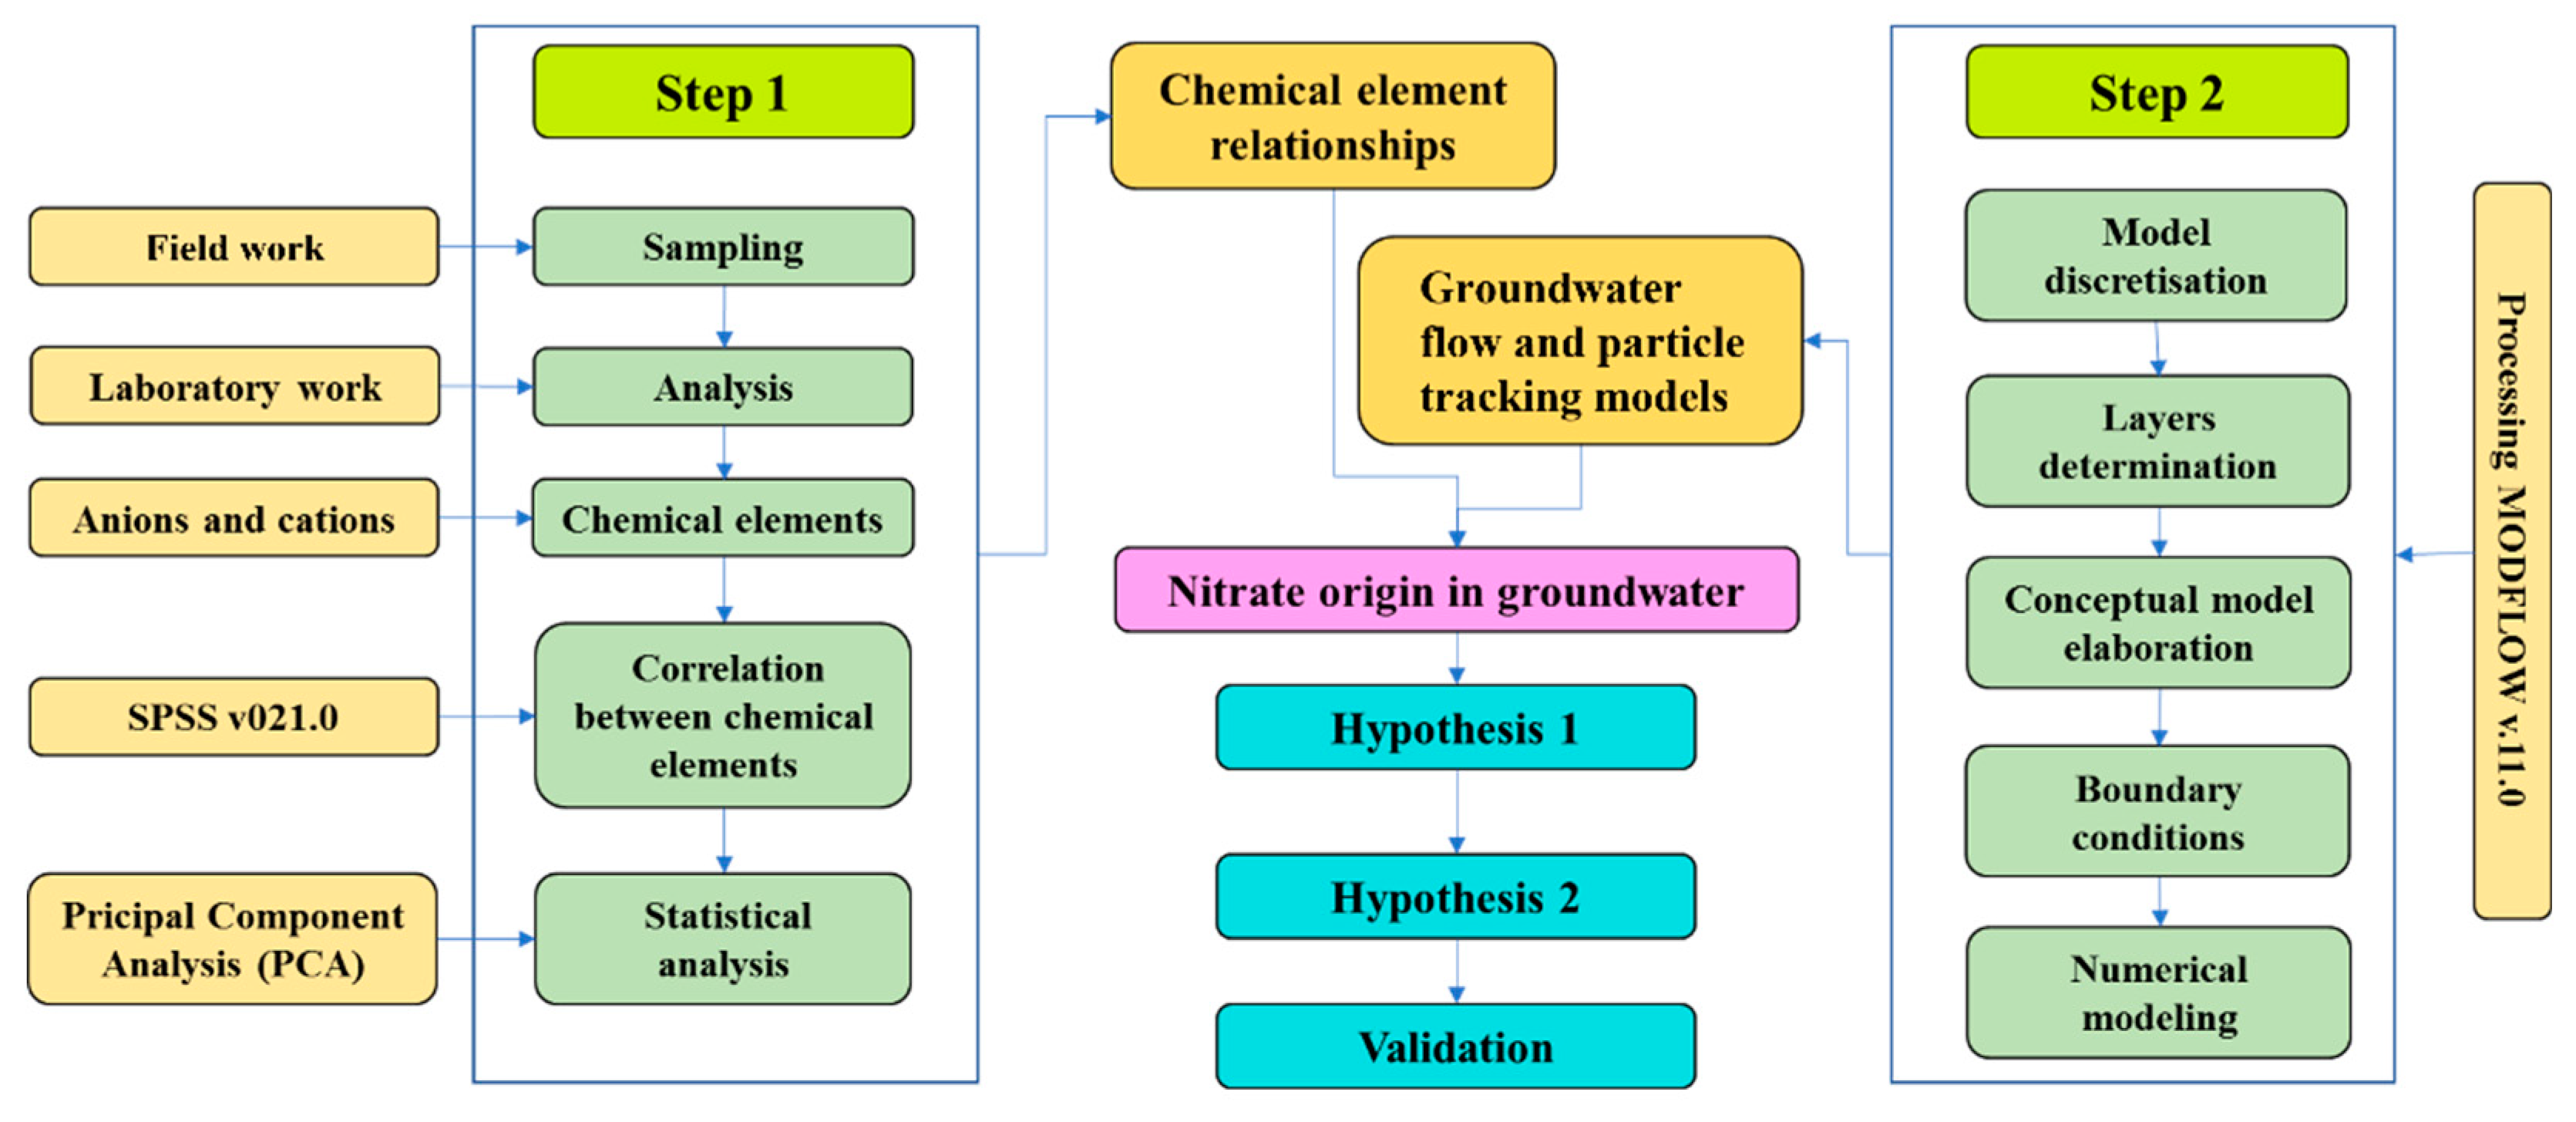
3. Materials and Methods
3.1. Groundwater Flow Simulation
Governing Equations and Groundwater Model Selection
3.2. Data Collection and Processing
4. Results and Discussion
4.1. Hydrochemical Characteristics
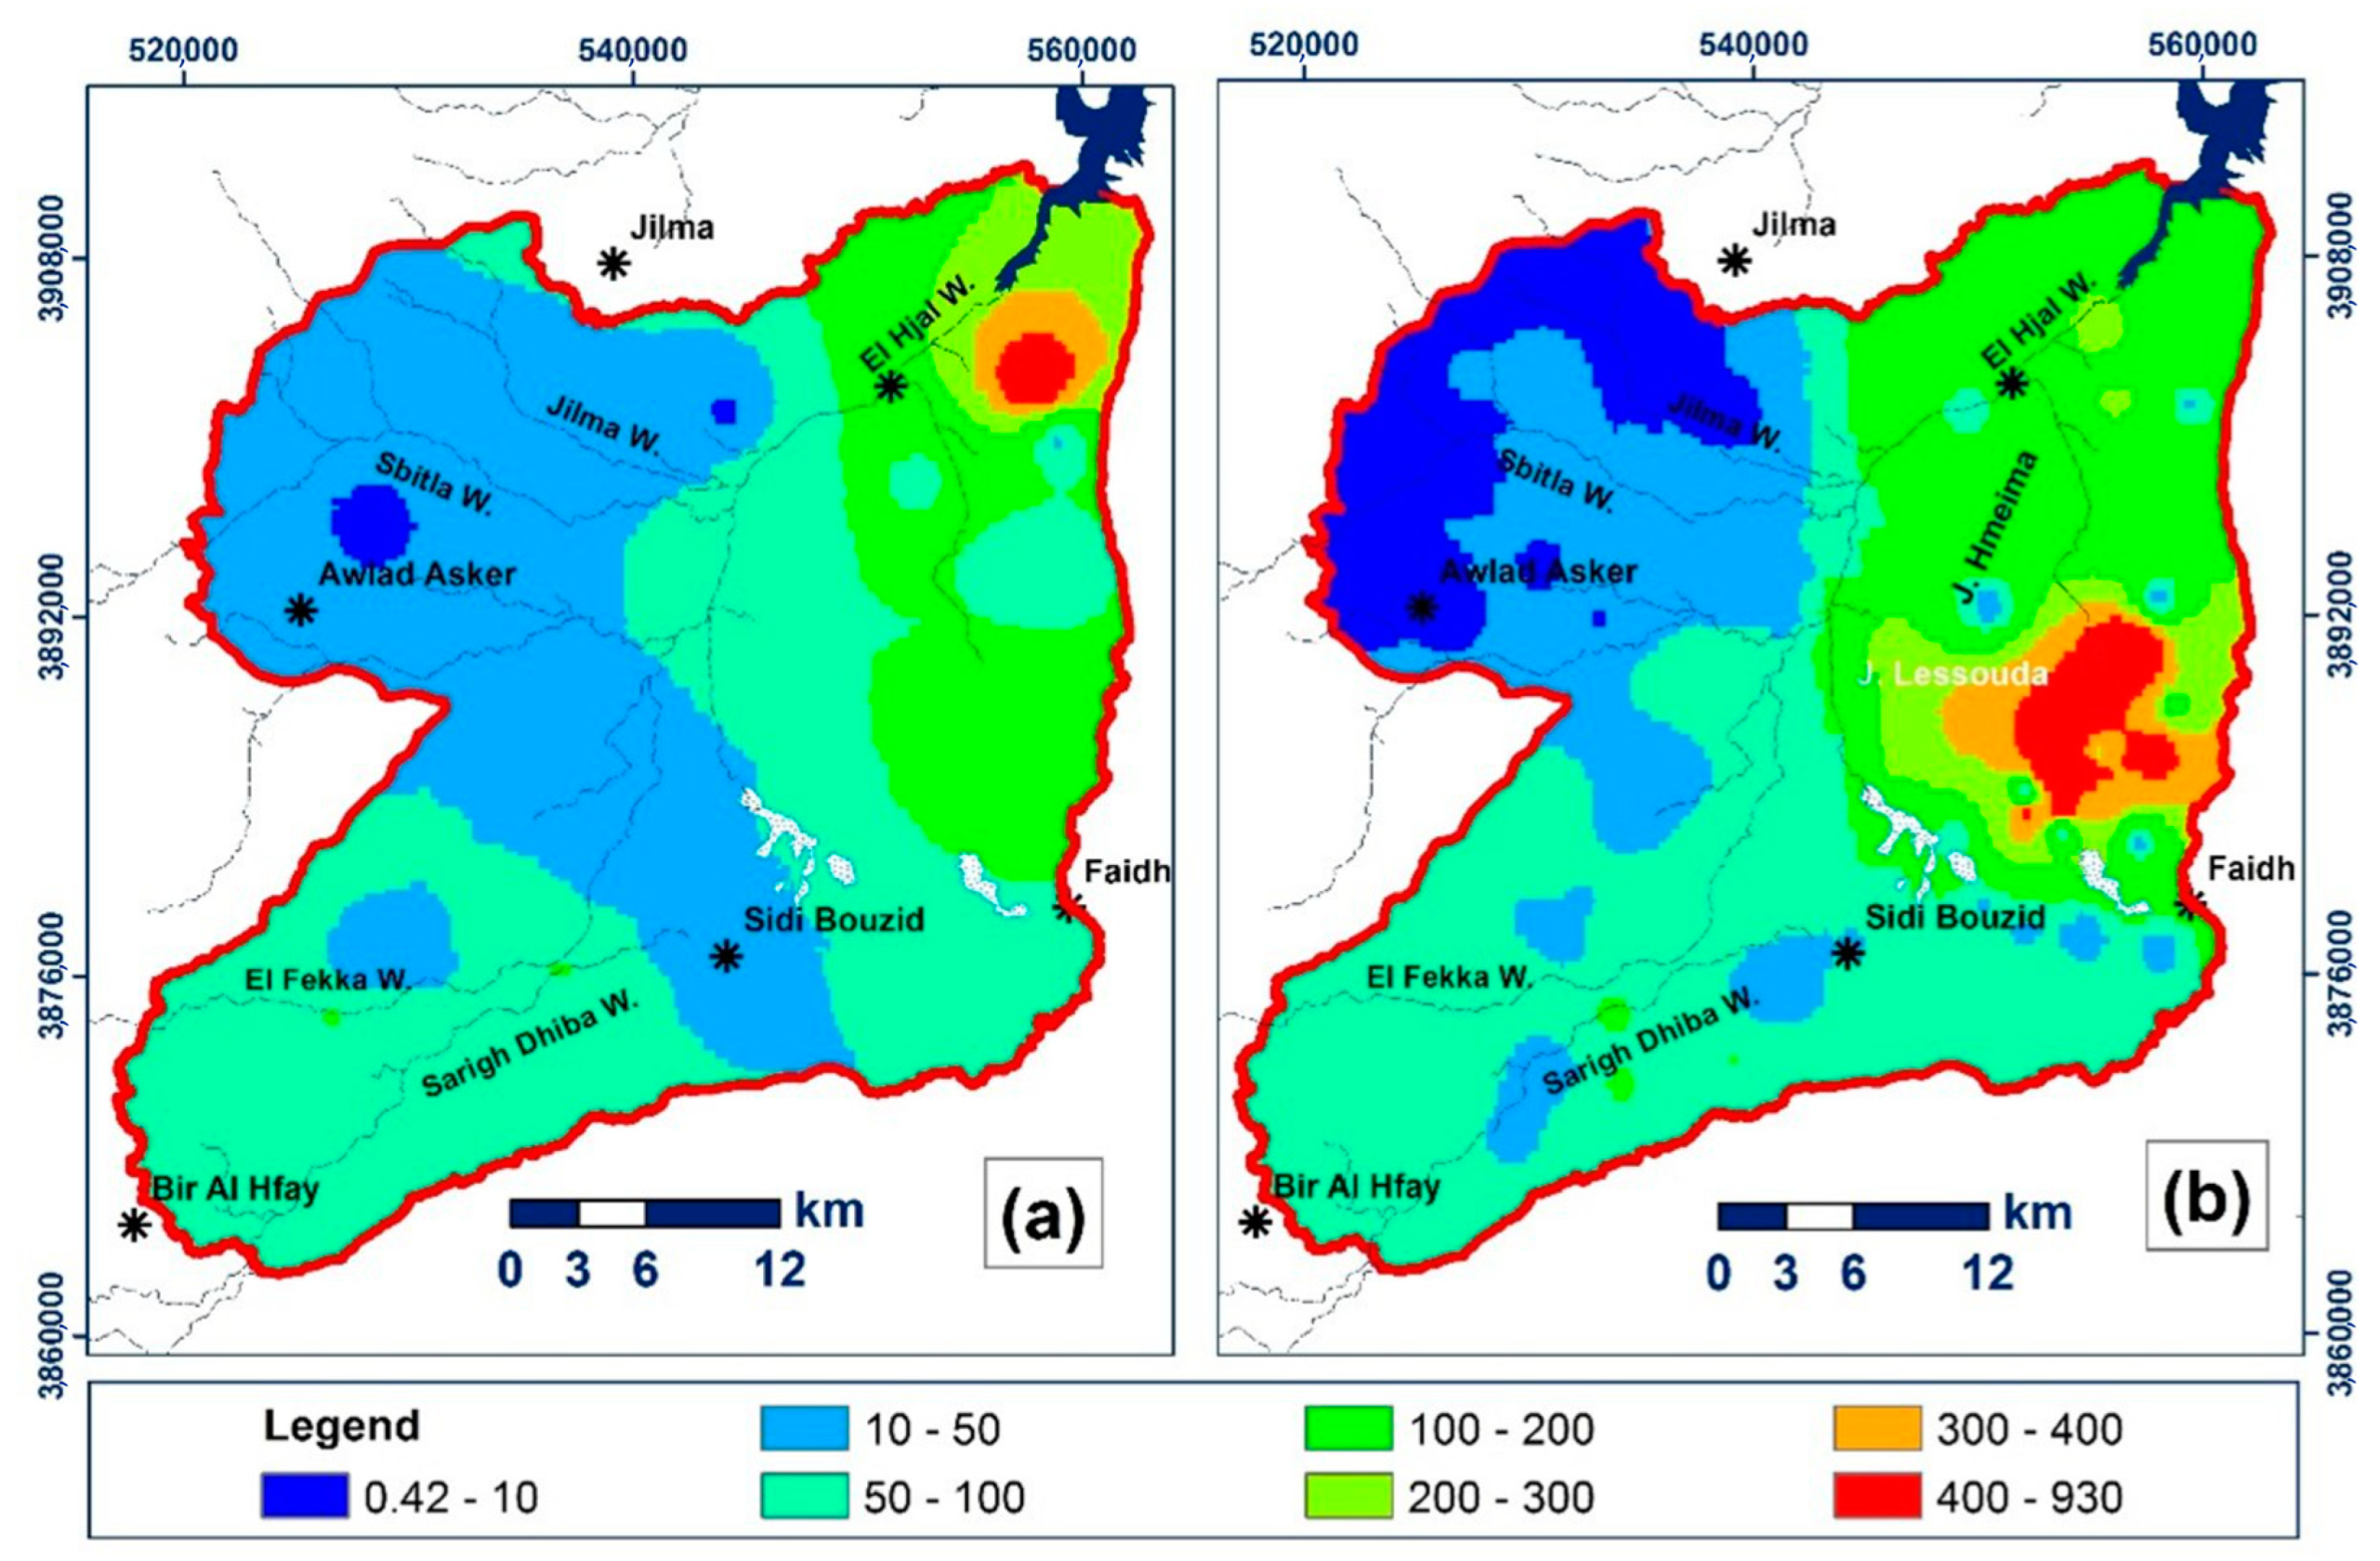
4.1.1. NO3− Concentrations in Groundwater
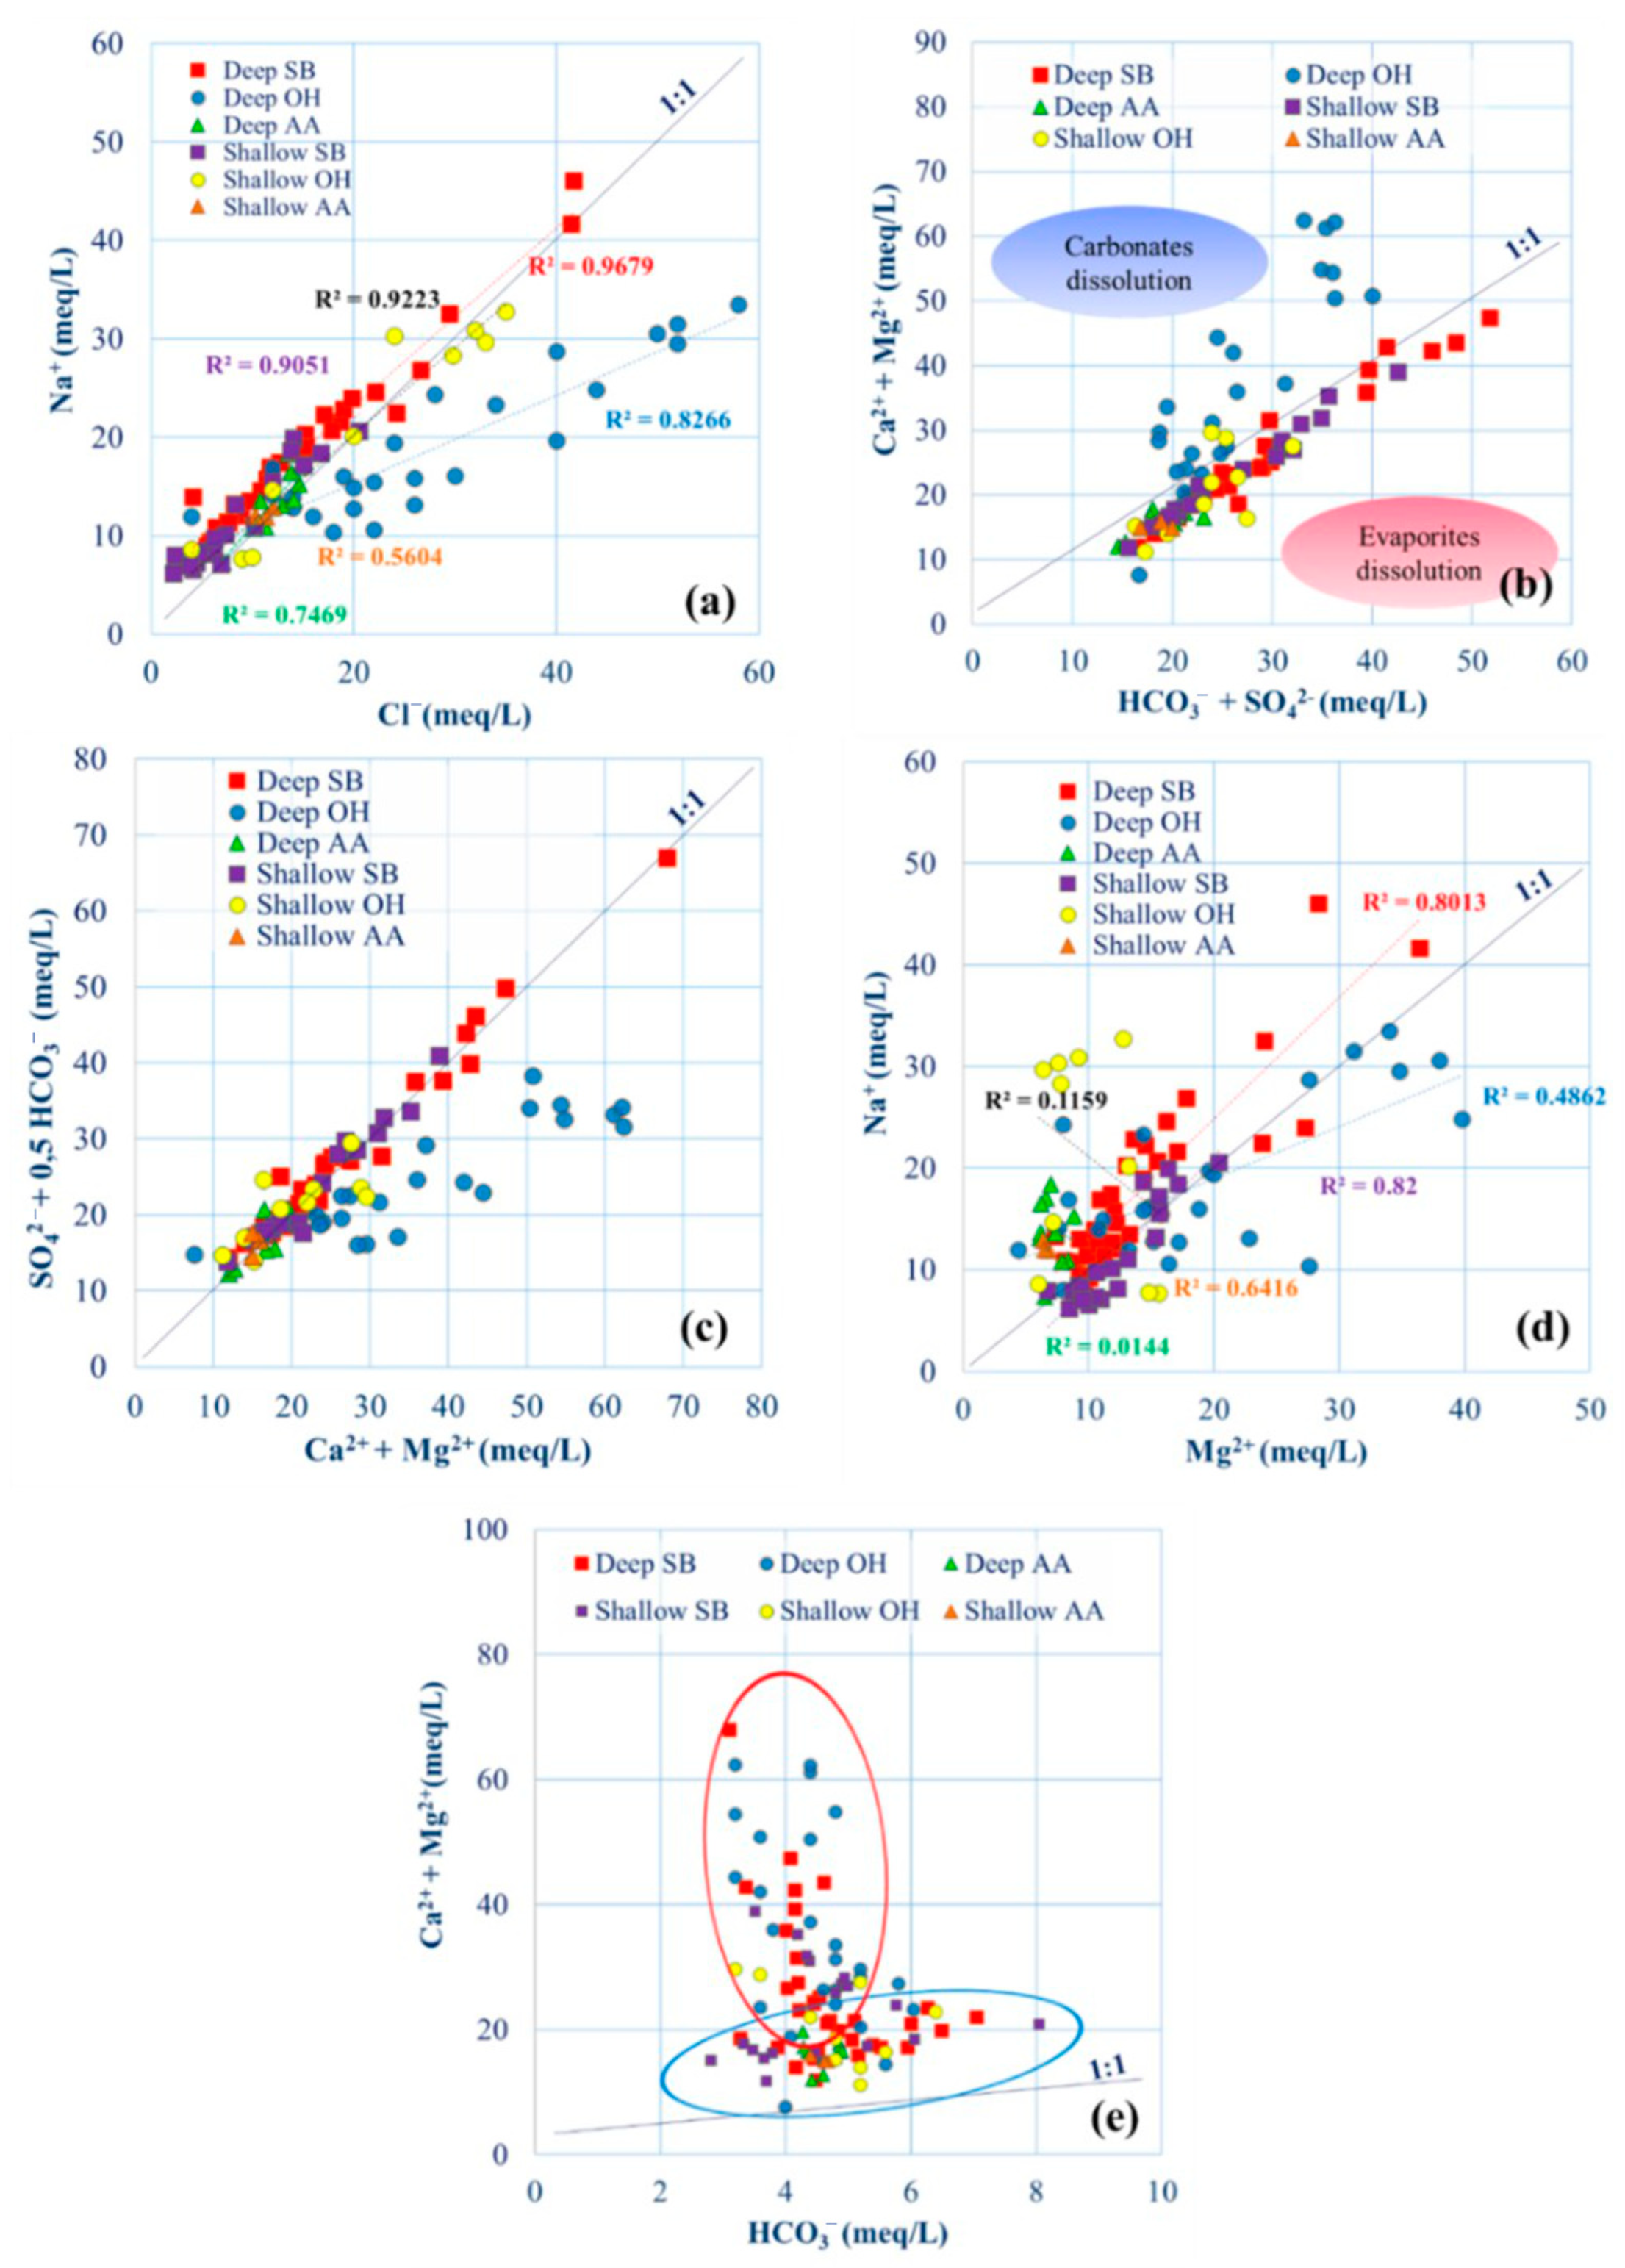
4.1.2. Comparison Nitrate with Other Ions
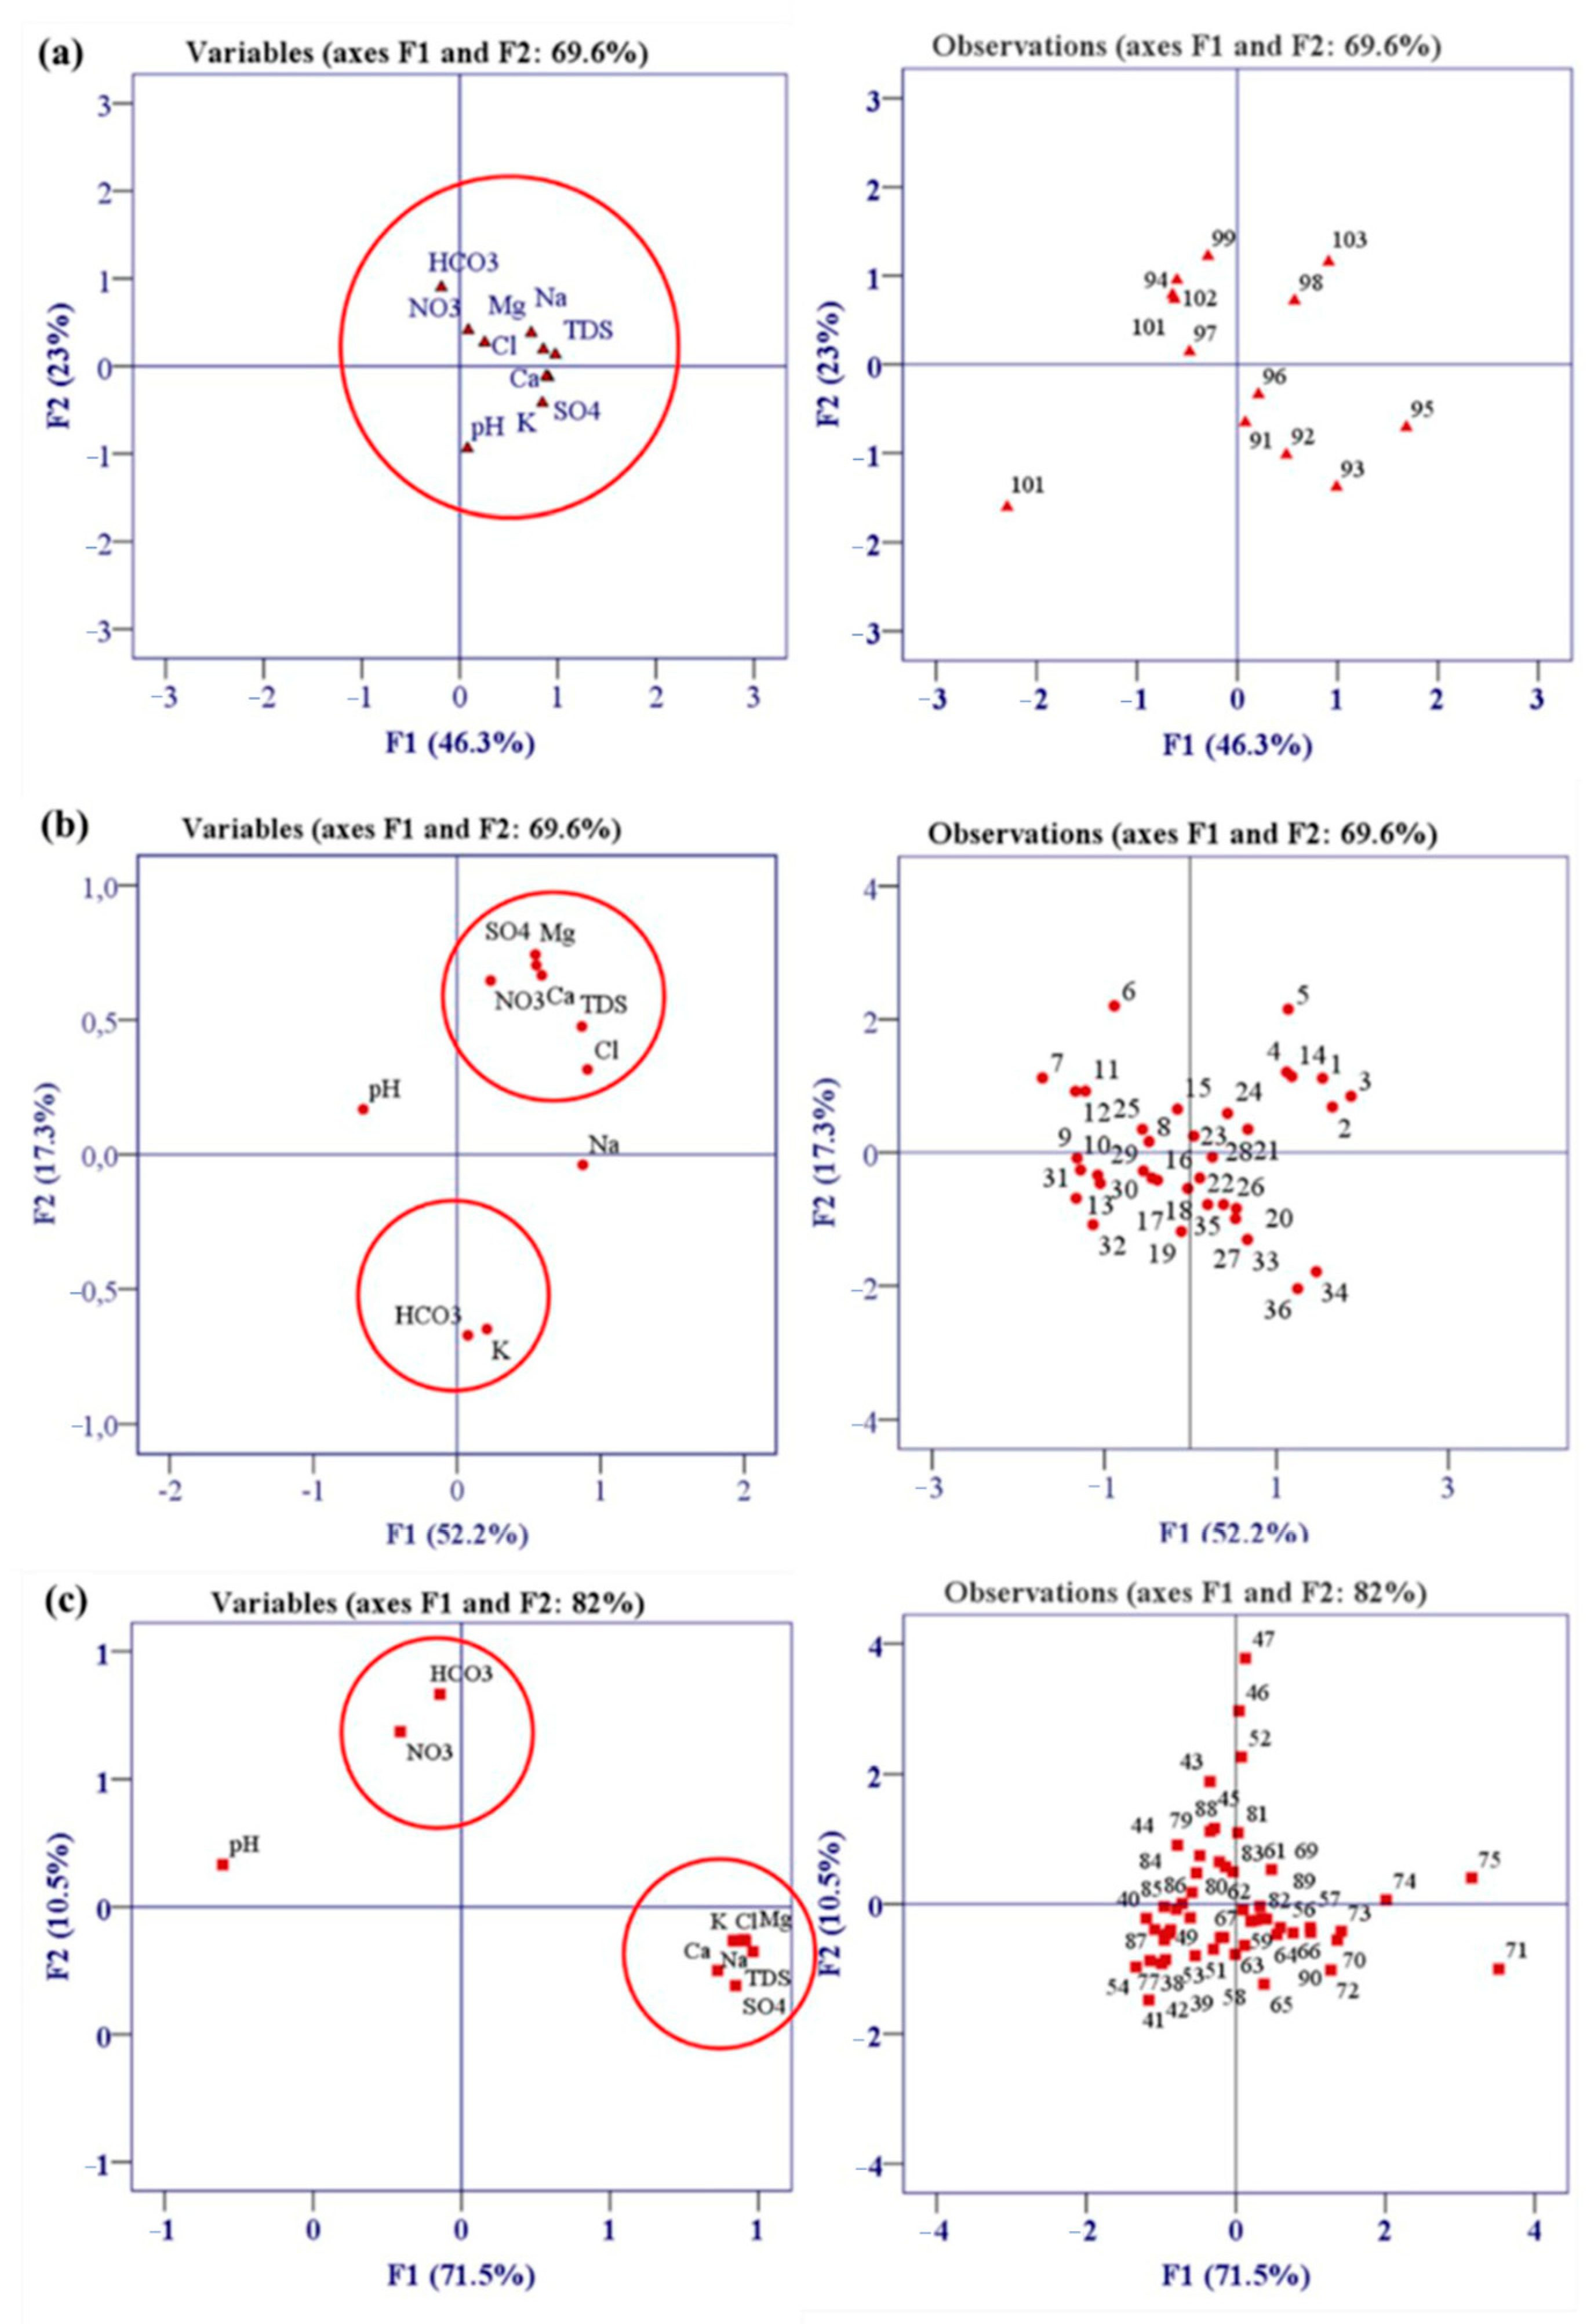
4.1.3. Principal Component Analysis
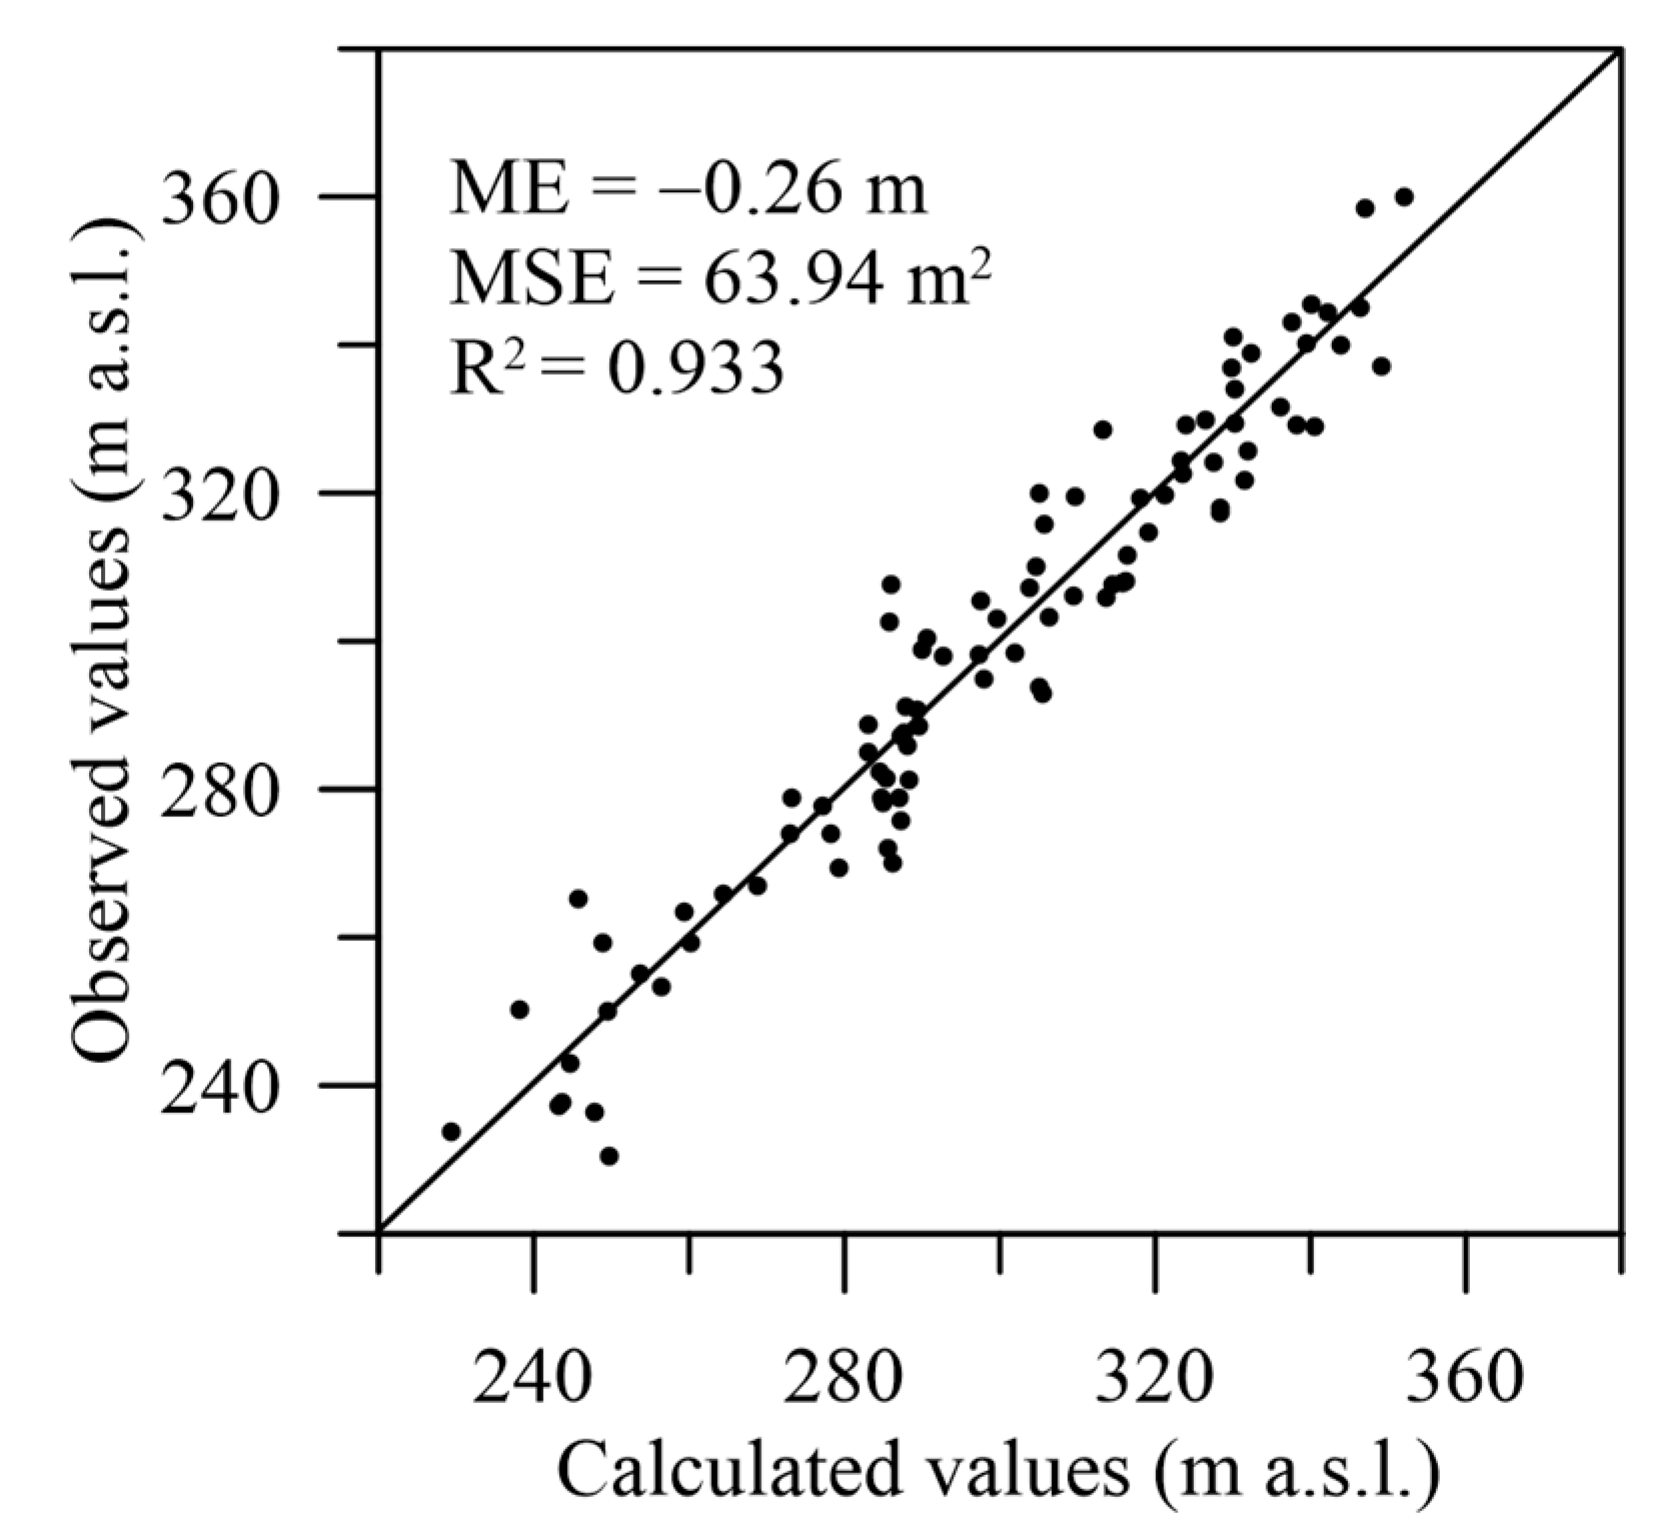
4.2. Model Discretization and Calibration
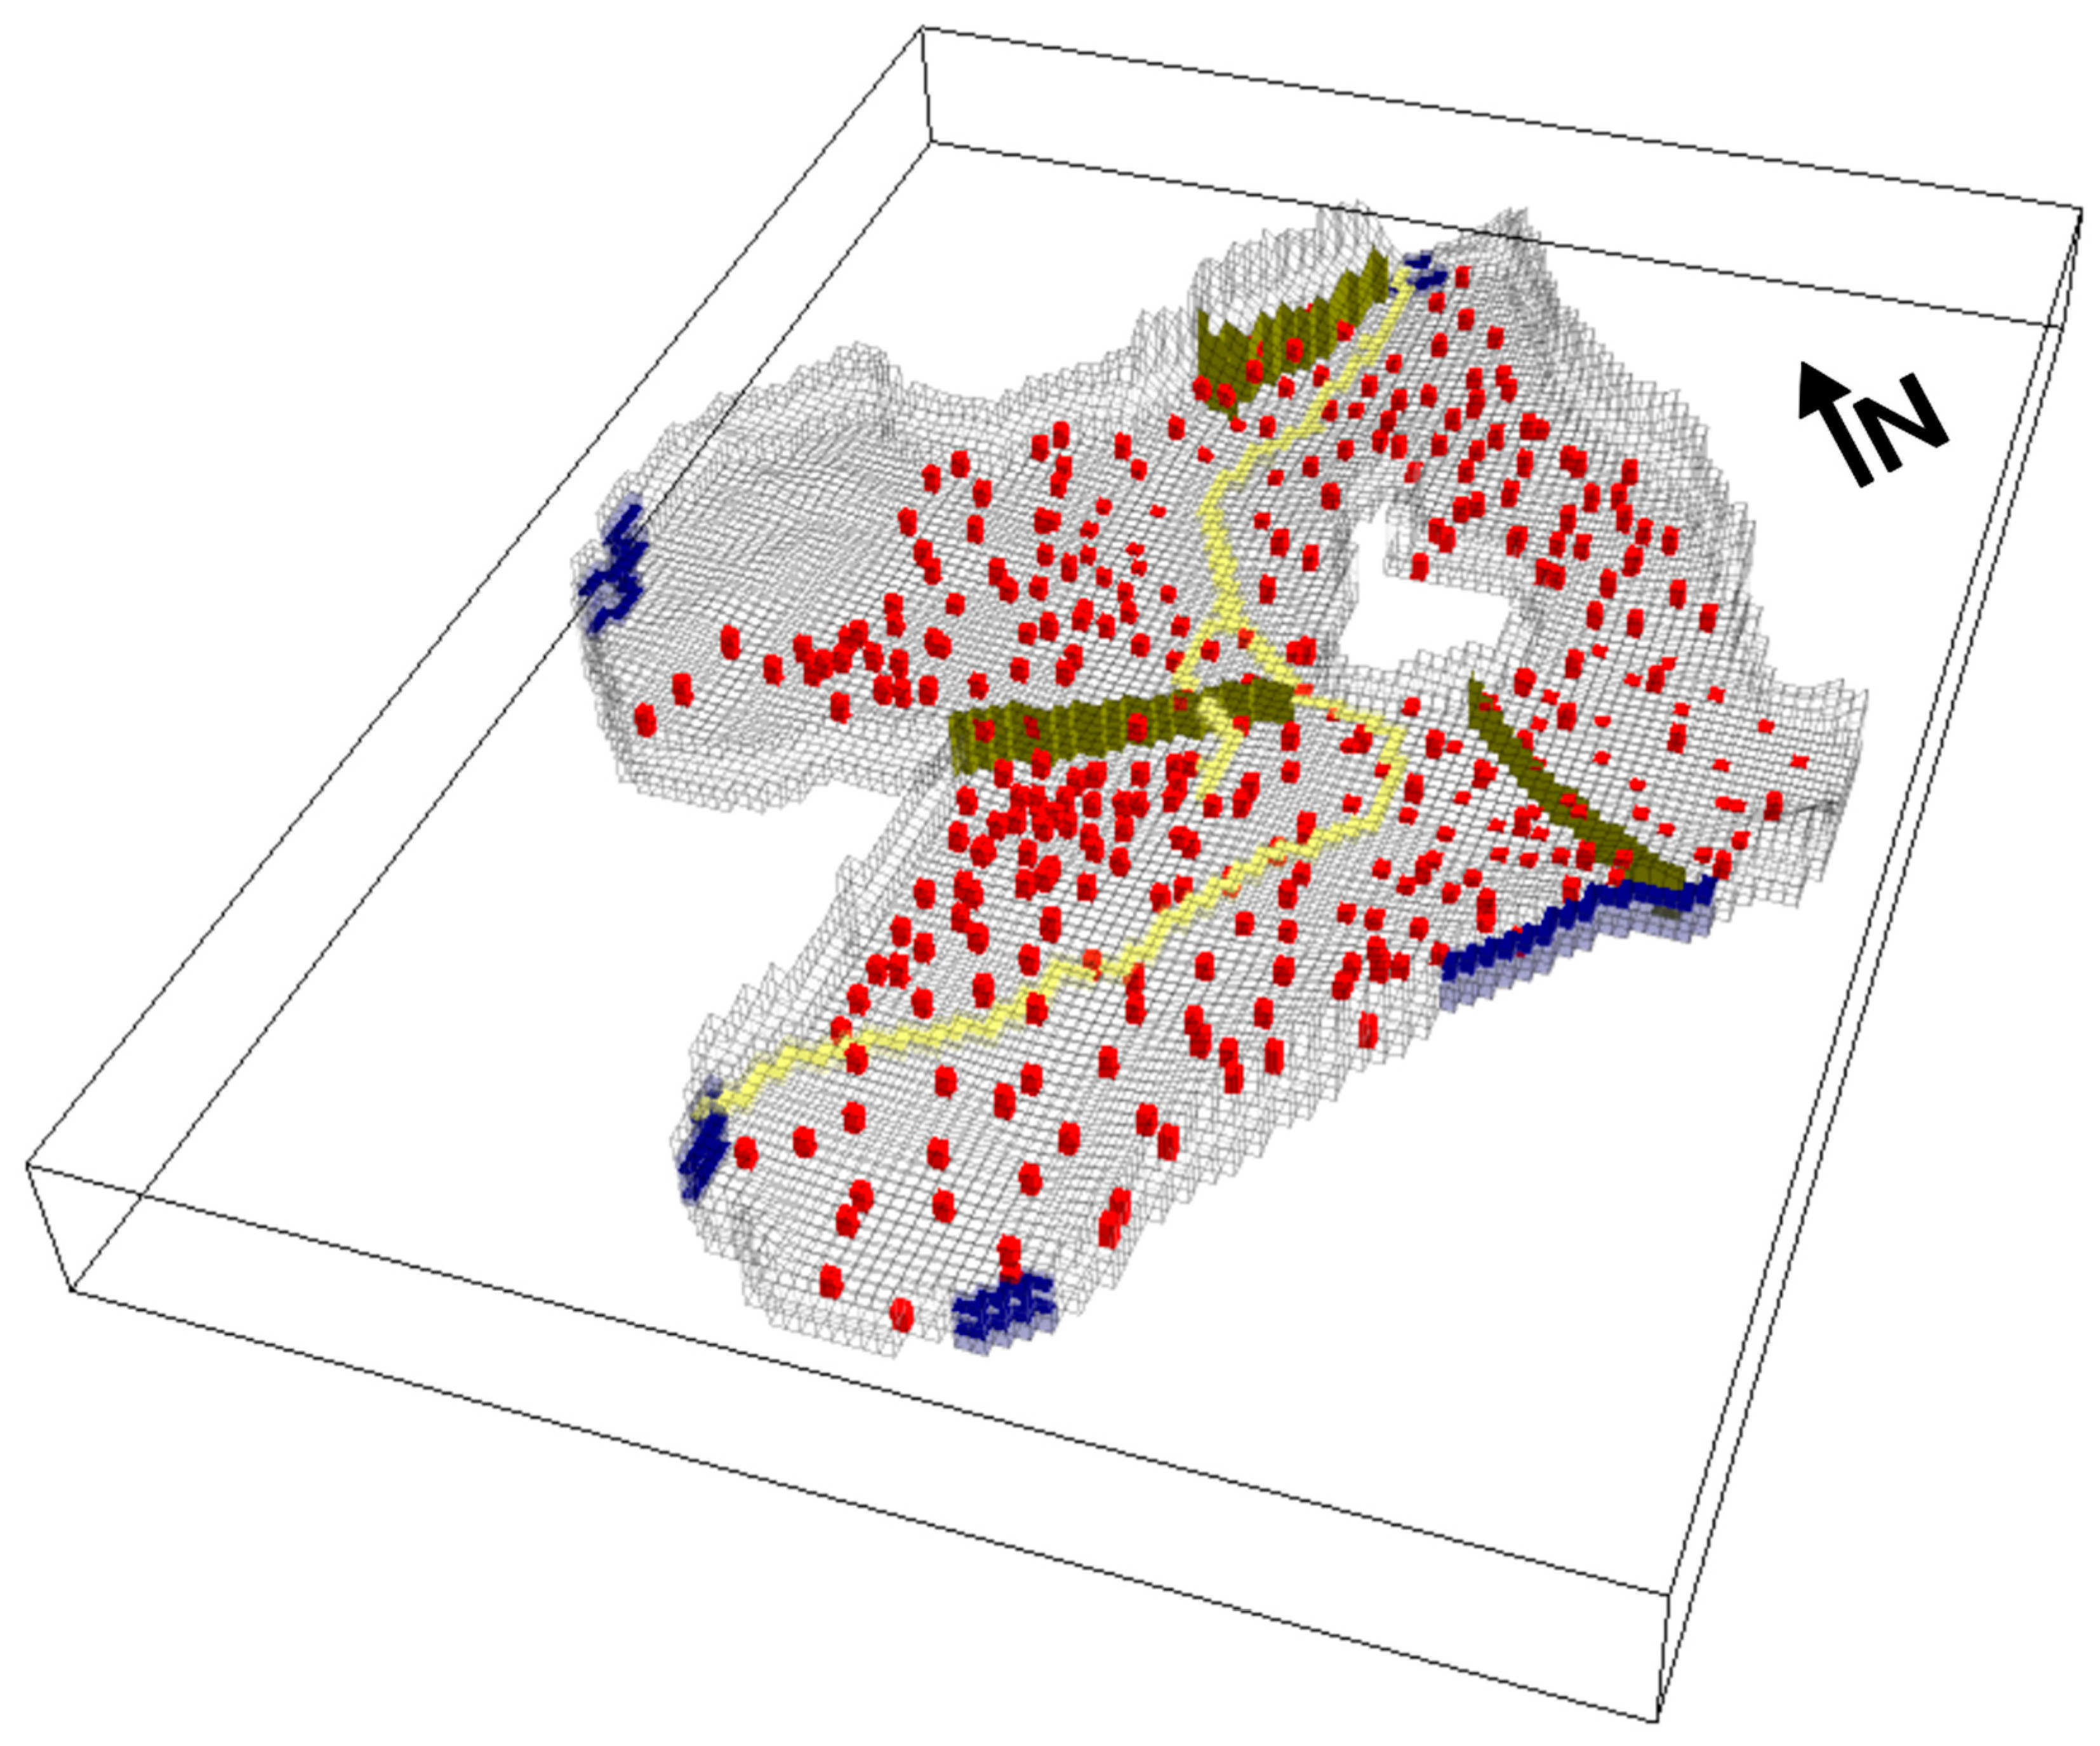
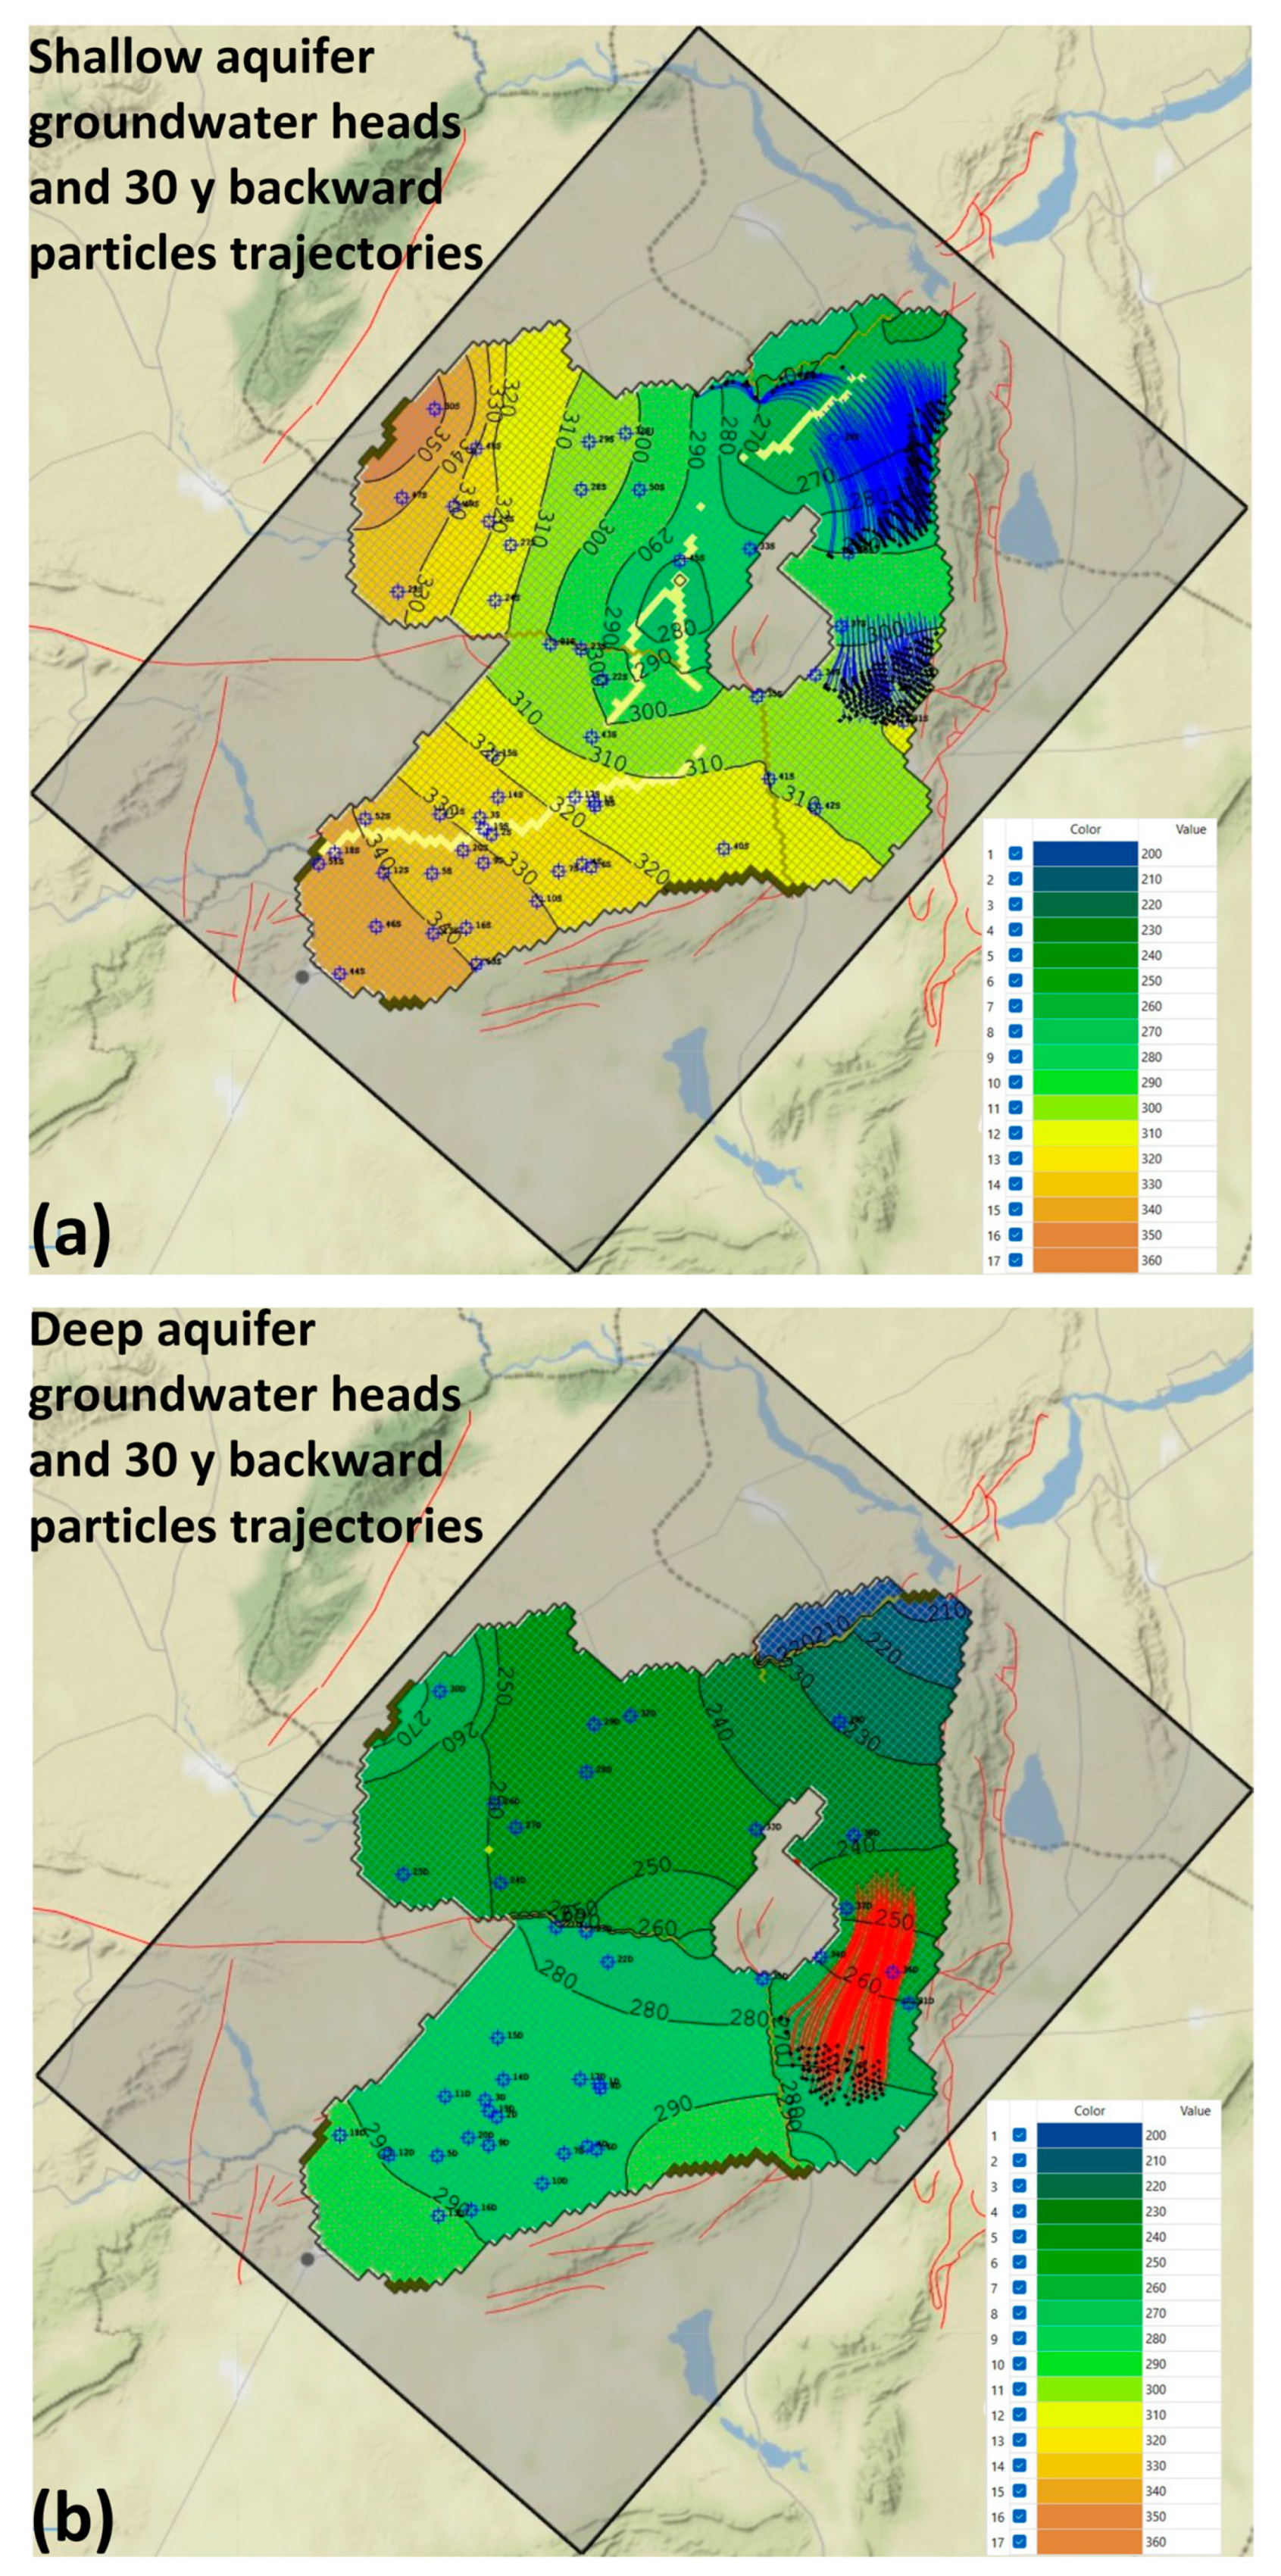
4.3. Particle Tracking Results
5. Conclusions
Supplementary Materials
Author Contributions
Funding
Data Availability Statement
Conflicts of Interest
References
- Guermazi, E.; Milano, M.; Reynard, E.; Zairi, M. Impact of climate change and anthropogenic pressure on the groundwater resources in arid environment. Mitig. Adapt. Strateg. Glob. Chang. 2019, 24, 73–92. [Google Scholar] [CrossRef]
- Nadiri, A.A.; Moghaddam, A.A.; Tsai, F.T.; Fijani, E. Hydrogeochemical analysis for Tasuj plain aquifer, Iran. J. Earth Syst. Sci. 2013, 122, 1091–1105. [Google Scholar] [CrossRef] [Green Version]
- Hamed, Y.; Awad, S.; Ben Sâad, A. Nitrate contamination in groundwater in the Sidi Aïch–Gafsa oases region, Southern Tunisia. Environ. Earth Sci. 2013, 70, 2335–2348. [Google Scholar] [CrossRef]
- Nadiri, A.A.; Aghdam, F.S.; Khatibi, R.; Moghaddam, A.A. The problem of identifying arsenic anomalies in the basin of Sahand dam through risk-based ‘soft modelling’. Sci. Total Environ. 2018, 613, 693–706. [Google Scholar] [CrossRef] [PubMed]
- Busico, G.; Alessandrino, L.; Mastrocicco, M. Denitrification in intrinsic and specific groundwater vulnerability assessment: A review. Appl. Sci. 2021, 11, 10657. [Google Scholar] [CrossRef]
- Nadiri, A.A.; Aghdam, F.S.; Razzagh, S.; Barzegar, R.; Jabraili-Andaryan, N.; Senapathi, V. Using a soft computing OSPRC risk framework to analyze multiple contaminants from multiple sources; a case study from Khoy Plain, NW Iran. Chemosphere 2022, 308, 136527. [Google Scholar] [CrossRef]
- Nadiri, A.A.; Sadeghfam, S.; Gharekhani, M.; Khatibi, R.; Akbari, E. Introducing the risk aggregation problem to aquifers exposed to impacts of anthropogenic and geogenic origins on a modular basis using ‘risk cells’. J. Environ. Manag. 2018, 217, 654–667. [Google Scholar] [CrossRef]
- Hamed, Y.; Hadji, R.; Ncibi, K.; Hamad, A.; Ben Saad, A.; Melki, A.; Khelifi, F.; Mokadem, N.; Mustafa, E. Modelling of potential groundwater artificial recharge in the transboundary Algero-Tunisian Basin (Tebessa-Gafsa): The application of stable isotopes and hydroinformatics tools. Irrig. Drain. 2022, 71, 137–156. [Google Scholar] [CrossRef]
- Ascott, M.J.; Gooddy, D.C.; Wang, L.; Stuart, M.E.; Lewis, M.A.; Ward, R.S.; Binley, A.M. Global patterns of nitrate storage in the vadose zone. Nat. Commun. 2017, 8, 1416. [Google Scholar] [CrossRef] [Green Version]
- Nadiri, A.A.; Sedghi, Z.; Khatibi, R. Qualitative risk aggregation problems for the safety of multiple aquifers exposed to nitrate, fluoride and arsenic contaminants by a ‘Total Information Management’ framework. J. Hydrol. 2021, 595, 126011. [Google Scholar] [CrossRef]
- Cox, A.N. Allen’s Astrophysical Quantities, 4th ed.; AIP Press: New York, NY, USA, 2000; ISBN 0-387-98746-0. [Google Scholar]
- Walvoord, M.A.; Phillips, F.M.; Stonestrom, D.A.; Evans, R.D.; Hartsough, P.C.; Newman, B.D.; Striegl, R.G. A reservoir of nitrate beneath desert soils. Science 2003, 302, 1021–1024. [Google Scholar] [CrossRef] [PubMed] [Green Version]
- Ncibi, K.; Hadji, R.; Hamdi, M.; Mokadem, N.; Abbes, M.; Khelifi, F.; Zighmi, K.; Hamed, Y. Application of the analytic hierarchy process to weight the criteria used to determine the Water Quality Index of groundwater in the northeastern basin of the Sidi Bouzid region, Central Tunisia. Euro-Mediterr. J. Environ. Integr. 2020, 5, 19. [Google Scholar] [CrossRef]
- Valiente, N.; Gil-Márquez, J.M.; Gómez-Alday, J.J.; Andreo, B. Unraveling groundwater functioning and nitrate attenuation in evaporitic karst systems from southern Spain: An isotopic approach. Appl. Geochem. 2020, 123, 104820. [Google Scholar] [CrossRef]
- World Health Organization’s (WHO). Guidelines for Drinking-Water Quality: Fourth Edition Incorporating the First and second Addenda; WHO: Geneva, Switzerland, 2022; p. 614. ISBN 978-92-4-004506-4. [Google Scholar]
- Razzagh, S.; Nadiri, A.A.; Khatibi, R.; Sadeghfam, S.; Senapathi, V.; Sekar, S. An investigation to human health risks from multiple contaminants and multiple origins by introducing ‘Total Information Management’. Environ. Sci. Pollut. Res. 2021, 28, 18702–18724. [Google Scholar] [CrossRef] [PubMed]
- Ncibi, K.; Mosbahi, M.; Gaaloul, N. Assessment of groundwater risk to Plio-quaternary aquifer’s contamination: Semi-arid climate case (central Tunisia). Desalin. Water Treat. 2018, 124, 211–222. [Google Scholar] [CrossRef]
- Ncibi, K.; Hadji, R.; Hajji, S.; Besser, H.; Hajlaoui, H.; Hamad, A.; Mokadem, N.; Ben Saad, A.; Hamdi, M.; Hamed, Y. Spatial variation of groundwater vulnerability to nitrate pollution under excessive fertilization using Index Overlay Method in Central Tunisia. Irrig. Drain. 2021, 70, 1209–1226. [Google Scholar] [CrossRef]
- Yangui, H.; Zouari, K.; Trabelsi, R. Recharge mode and mineralization of groundwater in a semi-arid region: Sidi Bouzid plain (central Tunisia). Environ. Earth Sci. 2011, 63, 969–979. [Google Scholar] [CrossRef]
- Petelet-Giraud, E.; Baran, N.; Vergnaud-Ayraud, V.; Portal, A.; Michel, C.; Joulian, C.; Lucassou, F. Elucidating heterogeneous nitrate contamination in a small basement aquifer. A multidisciplinary approach: NO3 isotopes, CFCs-SF6, microbiological activity, geophysics and hydrogeology. J. Contam. Hydrol. 2021, 241, 103813. [Google Scholar] [CrossRef]
- Busico, G.; Cuoco, E.; Kazakis, N.; Colombani, N.; Mastrocicco, M.; Tedesco, D.; Voudouris, K. Multivariate statistical analysis to characterize/discriminate between anthropogenic and geogenic trace elements occurrence in the Campania Plain, Southern Italy. Environ. Pollut. 2018, 234, 260–269. [Google Scholar] [CrossRef]
- Hosono, T.; Tokunaga, T.; Kagabu, M.; Nakata, H.; Orishikida, T.; Lin, I.T.; Shimada, J. The use of δ15N and δ18O tracers with an understanding of groundwater flow dynamics for evaluating the origins and attenuation mechanisms of nitrate pollution. Water Res. 2013, 47, 2661–2675. [Google Scholar] [CrossRef]
- Xue, Y.; Song, J.; Zhang, Y.; Kong, F.; Wen, M.; Zhang, G. Nitrate pollution and preliminary source identification of surface water in a semi-arid river basin, using isotopic and hydrochemical approaches. Water 2016, 8, 328. [Google Scholar] [CrossRef] [Green Version]
- Lorette, G.; Sebilo, M.; Buquet, D.; Lastennet, R.; Denis, A.; Peyraube, N.; Charriere, V.; Studer, J.C. Tracing sources and fate of nitrate in multilayered karstic hydrogeological catchments using natural stable isotopic composition (δ15N-NO3− and δ18O-NO3−). Application to the Toulon karst system (Dordogne, France). J. Hydrol. 2022, 610, 127972. [Google Scholar] [CrossRef]
- Xuan, Y.; Liu, G.; Zhang, Y.; Cao, Y. Factor affecting nitrate in a mixed land-use watershed of southern China based on dual nitrate isotopes, sources or transformations? J. Hydrol. 2022, 4, 127220. [Google Scholar] [CrossRef]
- Kendall, C.; Aravena, R. Nitrate Isotopes in Groundwater Systems. In Environmental Tracers in Subsurface Hydrology; Cook, P.G., Herczeg, A.L., Eds.; Springer: Boston, MA, USA, 2000. [Google Scholar] [CrossRef]
- Widory, D.; Kloppmann, W.; Chery, L.; Bonnin, J.; Rochdi, H.; Guinamant, J.L. Nitrate in groundwater: An isotopic multi-tracer approach. J. Contam. Hydrol. 2004, 72, 165–188. [Google Scholar] [CrossRef] [PubMed]
- Levy, Y.; Shapira, R.H.; Chefetz, B.; Kurtzman, D. Modeling nitrate from land surface to wells’ perforations under agricultural land: Success, failure, and future scenarios in a Mediterranean case study. Hydrol. Earth Syst. Sci. 2017, 21, 3811–3825. [Google Scholar] [CrossRef] [Green Version]
- Mastrocicco, M.; Colombani, N.; Castaldelli, G.; Jovanovic, N. Monitoring and modeling nitrate persistence in a shallow aquifer. Water Air Soil Pollut. 2011, 217, 83–93. [Google Scholar] [CrossRef]
- Pulido-Velazquez, M.; Peña-Haro, S.; García-Prats, A.; Mocholi-Almudever, A.F.; Henríquez-Dole, L.; Macian-Sorribes, H.; Lopez-Nicolas, A. Integrated assessment of the impact of climate and land use changes on groundwater quantity and quality in the Mancha Oriental system (Spain). Hydrol. Earth Syst. Sci. 2015, 19, 1677–1693. [Google Scholar] [CrossRef] [Green Version]
- Koh, E.H.; Lee, E.; Kaown, D.; Green, C.T.; Koh, D.C.; Lee, K.K.; Lee, S.H. Comparison of groundwater age models for assessing nitrate loading, transport pathways, and management options in a complex aquifer system. Hydrol. Process. 2018, 32, 923–938. [Google Scholar] [CrossRef]
- Harbaugh, A.W.; Langevin, C.D.; Hughes, J.D.; Niswonger, R.N.; Konikow, L.F. MODFLOW-2005, Version 1.12.00; The U.S. Geological Survey Modular Groundwater Model: U.S. Geological Survey Software Release, 3 February 2017; USGS: Reston, VA, USA, 2017. [CrossRef]
- Pollock, D.W. MODPATH, v7.2.01; A Particle-Tracking Model for MODFLOW: U.S. Geological Survey Software Release, 15 December 2017; USGS: Reston, VA, USA, 2017. [CrossRef]
- Missaoui, R.; Abdelkarim, B.; Ncibi, K.; Hamed, Y.; Choura, A.; Essalami, L. Assessment of Groundwater Vulnerability to Nitrate Contamination Using an Improved Model in the Regueb Basin, Central Tunisia. Water Air Soil Pollut. 2022, 233, 320. [Google Scholar] [CrossRef]
- Hamdi, M.; Louati, D.; Rajouene, M.; Abida, H. Impact of spate irrigation of floodwaters on agricultural drought and groundwater recharge: Case of Sidi Bouzid plain, Central Tunisia. Arab. J. Geosci. 2016, 9, 653. [Google Scholar] [CrossRef]
- Kocsis, L.; Ounis, A.; Baumgartner, C.; Pirkenseer, C.; Harding, I.C.; Adatte, T.; Chaabani, F.; Neili, S.M. Paleocene-Eocene palaeoenvironmental conditions of the main phosphorite deposits (Chouabine Formation) in the Gafsa Basin, Tunisia. J. African Earth Sci. 2014, 100, 586–597. [Google Scholar] [CrossRef]
- National Mining Office. Geological Map of Tunisie; National Mining Office: Tunis, Tunisia, 1987. [Google Scholar]
- Gaiolini, M.; Colombani, N.; Busico, G.; Rama, F.; Mastrocicco, M. Impact of Boundary Conditions Dynamics on Groundwater Budget in the Campania Region (Italy). Water 2022, 14, 2462. [Google Scholar] [CrossRef]
- Graham, R.C.; Hirmas, D.R.; Wood, Y.A.; Amrhein, C. Large near-surface nitrate pools in soils capped by desert pavement in the Mojave Desert, California. Geology 2008, 36, 259–262. [Google Scholar] [CrossRef] [Green Version]
- Chiang, E. Processing Modflow, Version 11.0.3; A Graphical User Interface for MODFLOW, GSFLOW, MODPATH, MT3D, PEST, SEAWAT, and ZoneBudget, Simcore Software, Irvine, California; 4 July 2022. Available online: https://www.simcore.com/wp/processing-modflow-11/ (accessed on 1 December 2022).
- Hallenberger, M.; Reuning, L.; Schoenherr, J. Dedolomitization Potential of Fluids from Gypsum-to-Anhydrite Conversion: Mass Balance Constraints from the Late Permian Zechstein-2-Carbonates in NW Germany. Geofluids 2018, 2018, 1784821. [Google Scholar] [CrossRef] [Green Version]
- Besser, H.; Dhaouadi, L.; Hadji, R.; Hamed, Y.; Jemmali, H. Ecologic and economic perspectives for sustainable irrigated agriculture under arid climate conditions: An analysis based on environmental indicators for southern Tunisia. J. Afr. Earth Sci. 2021, 177, 104134. [Google Scholar] [CrossRef]
- Schoenherr, J.; Reuning, L.; Hallenberger, M.; Lüders, V.; Lemmens, L.; Biehl, B.C.; Lewin, A.; Leupold, M.; Wimmers, K.; Strohmenger, C.J. Dedolomitization: Review and case study of uncommon mesogenetic formation conditions. Earth-Sci. Rev. 2018, 185, 780–805. [Google Scholar] [CrossRef]
- Aschonitis, V.G.; Papamichail, D.; Demertzi, K.; Colombani, N.; Mastrocicco, M.; Ghirardini, A.; Castaldelli, G.; Fano, E.A. High-resolution global grids of revised Priestley–Taylor and Hargreaves–Samani coefficients for assessing ASCE-standardized reference crop evapotranspiration and solar radiation. Earth Syst. Sci. Data 2017, 9, 615–638. [Google Scholar] [CrossRef]
- Doherty, J. PEST-Model-Independent Parameter Estimation, Version 12; Watermark Computing: Corinda, Australia, 2010. Available online: http://www.pesthomepage.org/(accessed on 1 November 2022).
- Kaplan, D.I.; Bertsch, P.M.; Adriano, D.C.; Miller, W.P. Soil-borne mobile colloids as influenced by water flow and organic carbon. Environ. Sci. Technol. 1993, 27, 1193–1200. [Google Scholar] [CrossRef]


| F1 | F2 | |
|---|---|---|
| Oued El Hjal | ||
| Eigenvalue | 5.227 | 1.737 |
| Variance (%) | 52.268 | 17.374 |
| Cumulated variance (%) | 52.268 | 69.642 |
| Sidi Bouzid | ||
| Eigenvalue | 7.151 | 1.051 |
| Variance (%) | 71.508 | 10.510 |
| Cumulated variance (%) | 71.508 | 82.018 |
| Awled Asker | ||
| Eigenvalue | 4.637 | 2.326 |
| Variance (%) | 46.369 | 23.263 |
| Cumulated variance (%) | 46.369 | 69.633 |
| Parameter | Value | Composite Sensitivity |
|---|---|---|
| K layer 1 Shallow aquifer (m/s) | 8.50 × 10⁻⁵ | 4705 |
| K layer 2 Shallow aquifer (m/s) | 1.00 × 10⁻³ | 364 |
| K layer 4 Deep aquifer (m/s) | 1.37 × 10⁻³ | 707 |
| Recharge rate (mm/y) | 38.7 | 134 |
| Evapotranspiration rate (mm/y) | 625 | 13 |
| GHB Conductance (m2/s) | 0.1 | 22 |
| Drain Conductance (m2/s) | 0.24 | 122 |
| Shallow Aquifer | Deep Aquifer | |||
|---|---|---|---|---|
| Flow in | m3/s | % | m3/s | % |
| GHB | 1.106 | 28.5 | 3.59 | 92.0 |
| Recharge | 2.78 | 71.5 | 0 | 0 |
| From Shallow aquifer | 0 | 0 | 0.300 | 8.0 |
| Flow out | m3/s | % | m3/s | % |
| Wells | 1.01 | 25.7 | 3.10 | 79.4 |
| Drains | 2.34 | 60.3 | 0 | 0 |
| Evapotranspiration | 0.157 | 4.0 | 0 | 0 |
| GHB | 8.55×10⁻² | 2.2 | 0.80 | 20.5 |
| To Deep aquifer | 0.300 | 8.7 | 0 | 0 |
| Total | 3.88 | 100 | 3.90 | 100 |
| IN-OUT | 6.39 × 10⁻³ | −1.35 × 10⁻² | ||
| Percent error | 0.16 | −0.35 | ||
Publisher’s Note: MDPI stays neutral with regard to jurisdictional claims in published maps and institutional affiliations. |
© 2022 by the authors. Licensee MDPI, Basel, Switzerland. This article is an open access article distributed under the terms and conditions of the Creative Commons Attribution (CC BY) license (https://creativecommons.org/licenses/by/4.0/).
Share and Cite
Ncibi, K.; Mastrocicco, M.; Colombani, N.; Busico, G.; Hadji, R.; Hamed, Y.; Shuhab, K. Differentiating Nitrate Origins and Fate in a Semi-Arid Basin (Tunisia) via Geostatistical Analyses and Groundwater Modelling. Water 2022, 14, 4124. https://doi.org/10.3390/w14244124
Ncibi K, Mastrocicco M, Colombani N, Busico G, Hadji R, Hamed Y, Shuhab K. Differentiating Nitrate Origins and Fate in a Semi-Arid Basin (Tunisia) via Geostatistical Analyses and Groundwater Modelling. Water. 2022; 14(24):4124. https://doi.org/10.3390/w14244124
Chicago/Turabian StyleNcibi, Kaouther, Micòl Mastrocicco, Nicolò Colombani, Gianluigi Busico, Riheb Hadji, Younes Hamed, and Khan Shuhab. 2022. "Differentiating Nitrate Origins and Fate in a Semi-Arid Basin (Tunisia) via Geostatistical Analyses and Groundwater Modelling" Water 14, no. 24: 4124. https://doi.org/10.3390/w14244124