
Spatio-Temporal Analysis and Driving Factors of Soil Water Erosion in the Three-River Headwaters Region, China

1
Institute of Urban & Rural Mining Research, Changzhou University, Changzhou 213164, China
2
School of Environmental Science and Engineering, Changzhou University, Changzhou 213164, China
3
Key Laboratory of Land Surface Pattern and Simulation, Institute of Geographic Sciences and Natural Resources Research, Chinese Academy of Sciences, Beijing 100101, China
*
Authors to whom correspondence should be addressed.
Water 2022, 14(24), 4127; https://doi.org/10.3390/w14244127
Submission received: 24 November 2022
/
Revised: 12 December 2022
/
Accepted: 15 December 2022
/
Published: 18 December 2022
(This article belongs to the Special Issue Monitoring of the Water and Soil Conservation Using Remote Sensing Techniques)
Abstract
:Soil water erosion is considered to be a major threat to ecosystems and an important environmental problem. Aggravation of soil and water loss in the Three-River Headwaters Region (TRHR) is a prominent problem in China. In this research, the Revised Universal Soil Loss Equation (RUSLE) was applied to evaluate annual soil loss caused by water erosion in the TRHR from 2000 to 2020. Spatiotemporal patterns of soil water erosion were analyzed and the main driving factors of rainfall erodibility and vegetation coverage were investigated using ArcGIS spatial analysis. The results revealed that during the study period, soil erosion in the TRHR averaged 10.84 t/hm2/a, and values less than 25 t/hm2/a were characterized as micro and mild erosion. The soil erosion modulus observed a slightly increasing trend over the past decade. The changing trends in the Yangtze, Huanghe, and Lancang river source regions (YRSR, HRSR, and LRSR) were 0.03, 0.07, and 0.03 t/hm2/a, respectively. Both rainfall erodibility and vegetation coverage observed a growing trend, with slopes of 6.78 MJ·mm/(t·hm2·a) and 0.12%/a, respectively. In general, variation of rainfall erodibility showed a relatively higher contribution to soil erosion than vegetation coverage. Findings of this study could provide information for sustainable vegetation restoration, soil conservation, and water management at a regional scale.
1. Introduction
Land is one of the most important resources for human survival, and its damage directly feeds back to human economic and social development. In the early 1990s, it was estimated that 56% of the global land was being degraded and showed light to severe forms of soil erosion by water [1]. Soil water erosion has become a global environmental problem that threatens national and regional ecological security. Serious soil erosion leads to land resource destruction, productivity declines, grain production reduction, and regional food insecurity [2]. Moreover, a large amount of sediment loss causes water pollution and siltation in rivers, lakes, and reservoirs; aggravates flood disasters; and threatens downstream cities. Current erosion rates are several orders of magnitude higher than the natural rates of soil formation [3], and soil erosion in China is among the most severe worldwide [4]. Accelerated forms of soil erosion have become a major challenge to achieve the UN Sustainable Development Goals [5]. In addition, soil erosion can release carbon dioxide, thereby exacerbating global warming [6].
From the actual investigation of erosion markers in the early stage, to localization observation, localization simulation test, and then to the soil erosion model, soil erosion research has experienced a development stage from qualitative to semi-quantitative to quantitative. Quantifying soil erosion is a prerequisite for guiding soil conservation and sustainability. Soil erosion models are effective methods to detect and predict soil loss. In the 1950s, the Universal Soil Loss Equation (USLE) was established in the USDA (United States Department of Agriculture) based on a large number of plot observations and artificial simulated precipitation experiments [7]. Its derivative, RUSLE, was developed in 1997 to improve the measurement method of each factor of the USLE equation [8]. They were both empirical models, and some process-based physical models were put forward by researchers, such as the WEPP (Water Erosion Prediction Project) [9], the EUROSEM (European Soil Erosion Model) [10], and the LISEM (Limburg Soil Erosion Model) [11]. Model comparisons show that the empirical models do not necessarily lead to higher uncertainties compared to physical models [12]. Among these models, the RUSLE is widely applied throughout the world due to its simple structure and available parameters [13]. The development of GIS and remote sensing technologies has enabled quantitative study over long time scales and large spatial scales.
According to the RUSLE model, spatiotemporal variations in soil water erosion are related to soil, precipitation, topography, vegetation, and conservation measures [14]. Among these factors, topography and soil are relatively stable and change little over short time periods [15]. Thus, vegetation and rainfall are two sensitive and direct factors that affect soil water erosion [16], which could strengthen or weaken regional soil erosion intensity. The impacts of rainfall on soil water erosion are mainly responded by rainfall erodibility [17]. Vegetation could decrease the kinetic energy of raindrops through litter and canopy [18], thus reducing the loss of soil, and root fixation also could prevent soil erosion [19]. The relationships among vegetation, rainfall, and soil water erosion become complex and uncertain because of their interactions [20]. Therefore, the dominant factors of soil erosion must be identified for sustainable soil and water management.
The Three-River Headwaters Region (TRHR) is known as the “Chinese water tower” and located in the hinterland of the Tibetan Plateau (TP), which is the source of the Yellow River, the Yangtze River, and the Lancang River [21]. Due to its special geographical location, rich natural resources, highly concentrated plateau biodiversity, and important ecological functions, the TRHR has become a significant part of TP’s ecological security barrier in China. In recent decades, the ecological environment in the TRHR has suffered continuous degradation owing to the combined effects of climate change and anthropogenic activities [22], which seriously threatens the sustainable development and ecological security of the middle and lower reaches of the three rivers. Water and soil loss are prominent issues associated with the ecological environment in this region.
Intensive research has focused on grassland degradation and restoration [23], grassland yield and grazing pressure [24], vegetation dynamics [25], climate change [26], ecosystem services, and values [27], and has assessed the effects of ecological conservation projects [28]. Moreover, previous studies mainly focused on soil erosion and its driving factors in the TRHR. Therefore, we applied the RUSLE to simulate soil water erosion over the last 20 years and then quantitatively analyzed the spatiotemporal patterns and dominant factors controlling soil erosion in this study. Findings of this study could provide scientific support for future ecosystem conservation at a regional scale.
2. Material and Methods
2.1. Study Area
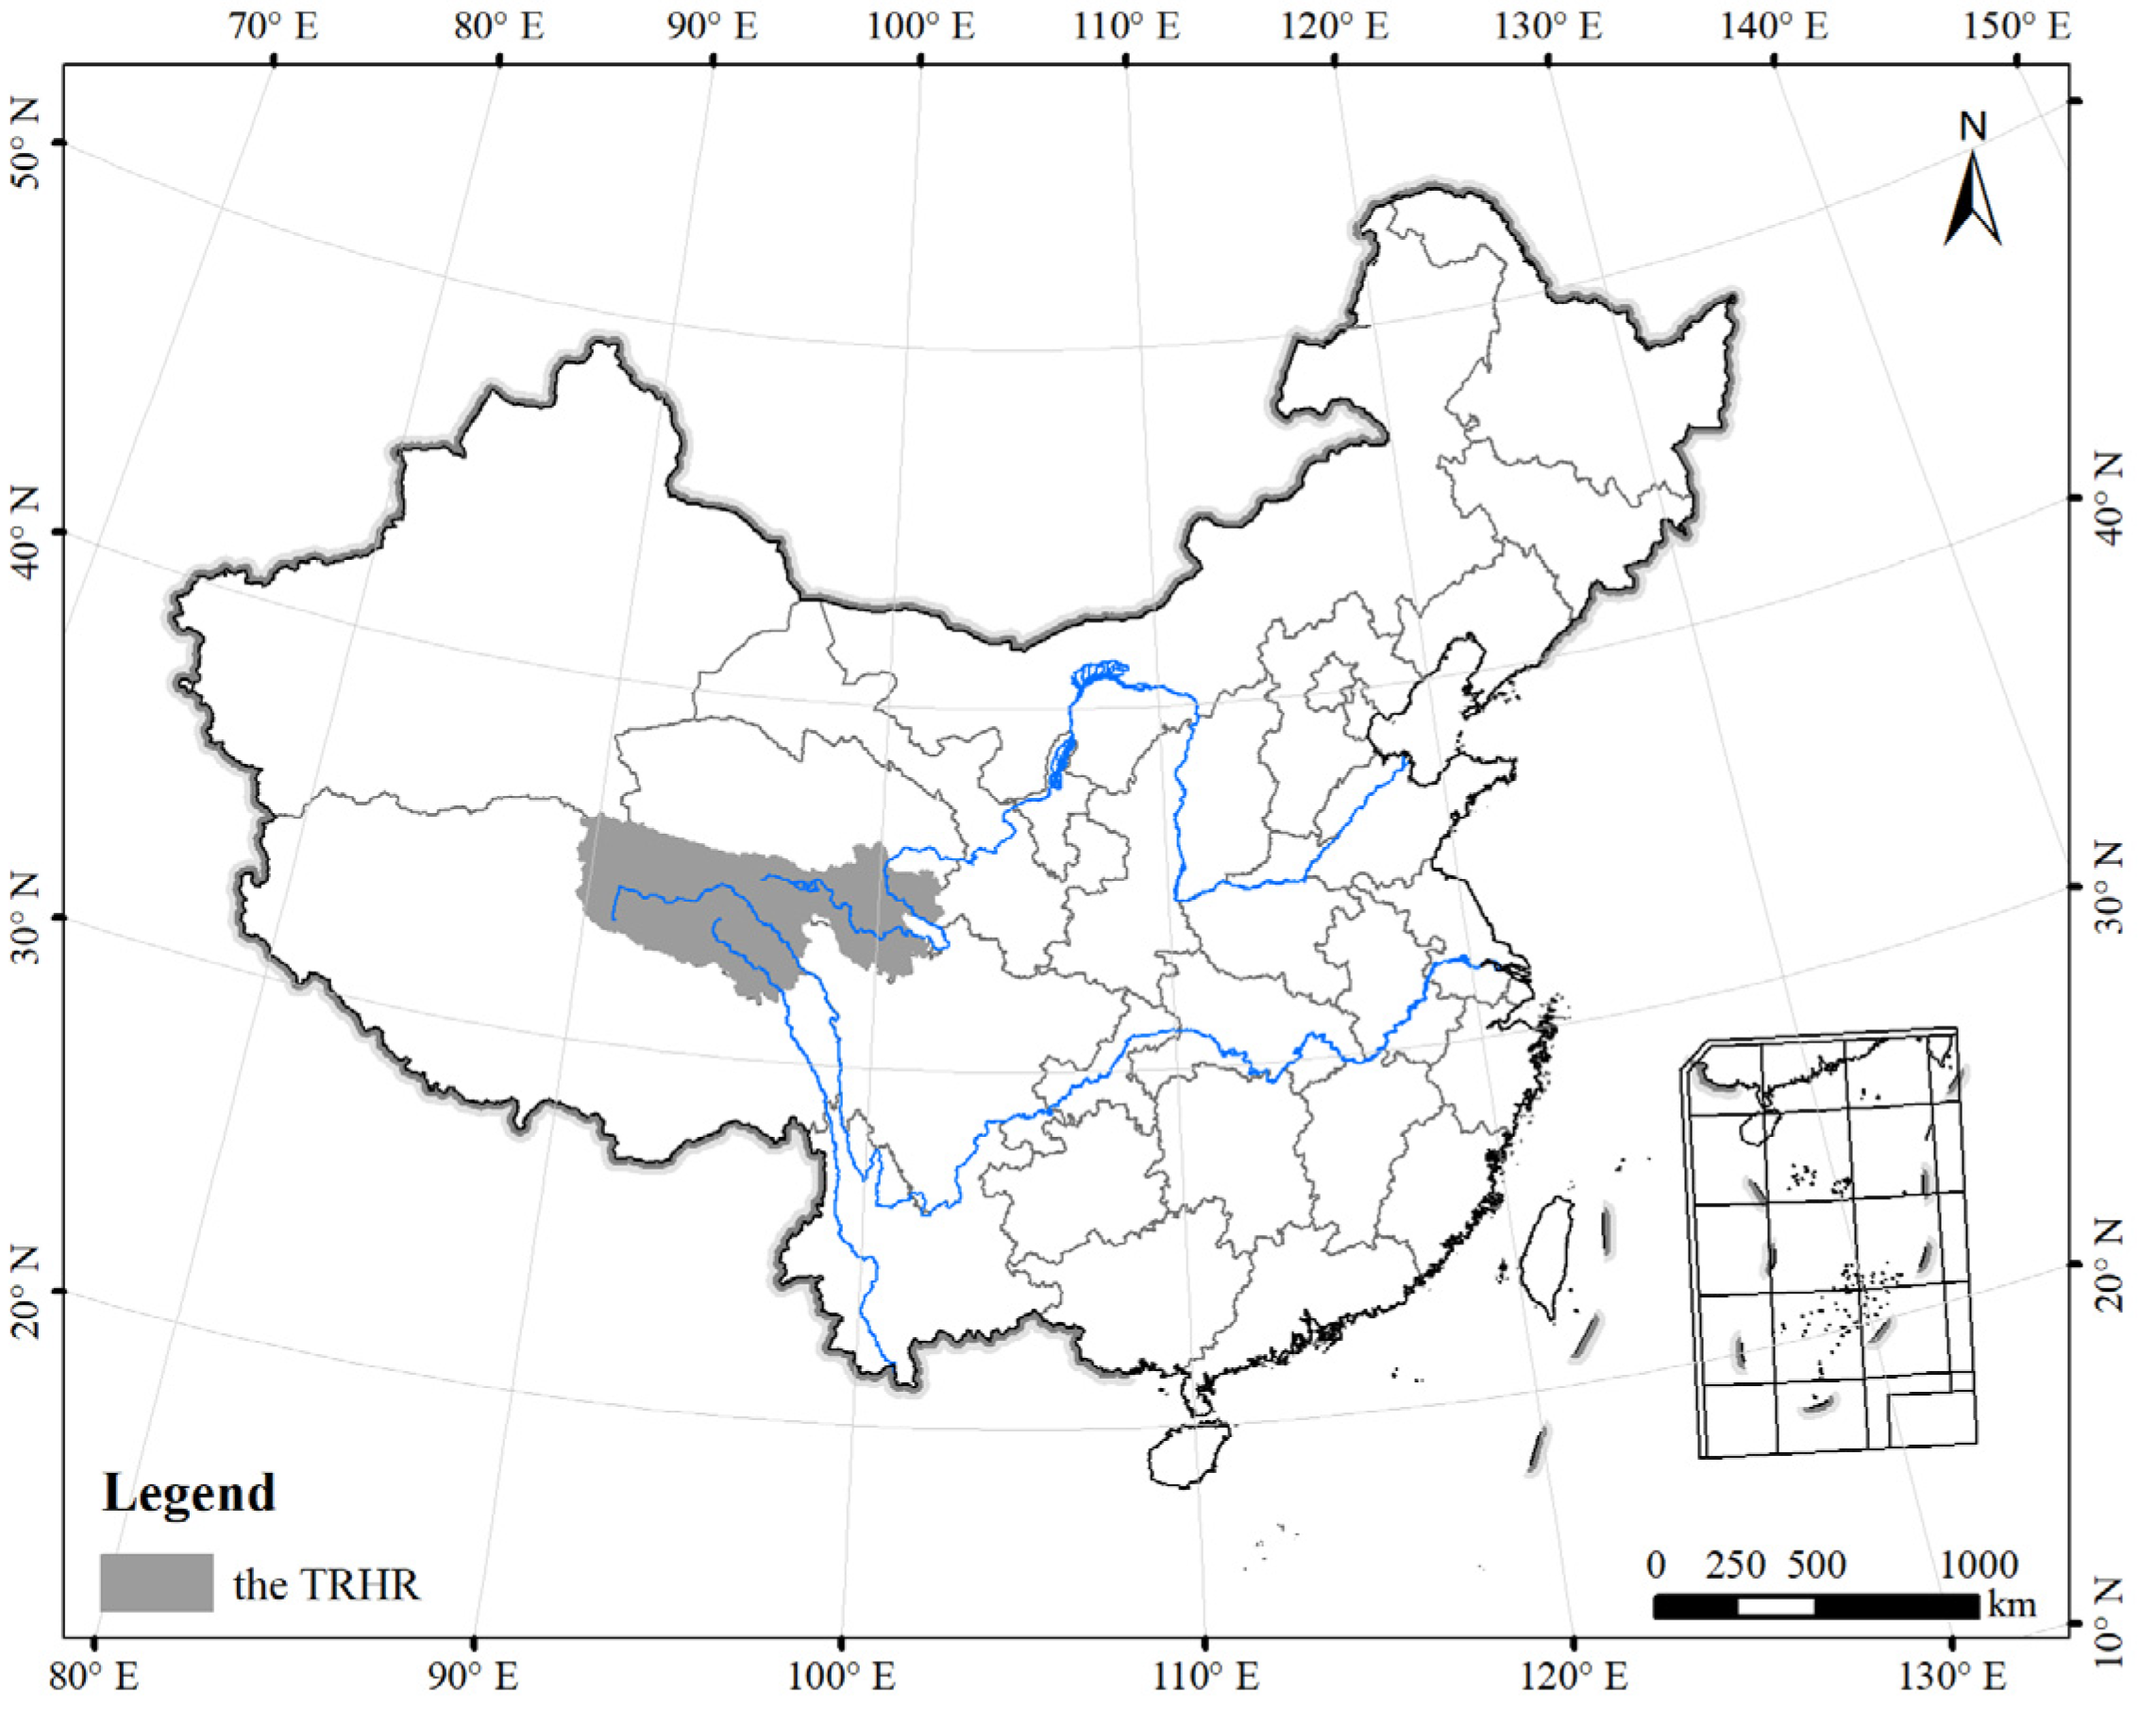
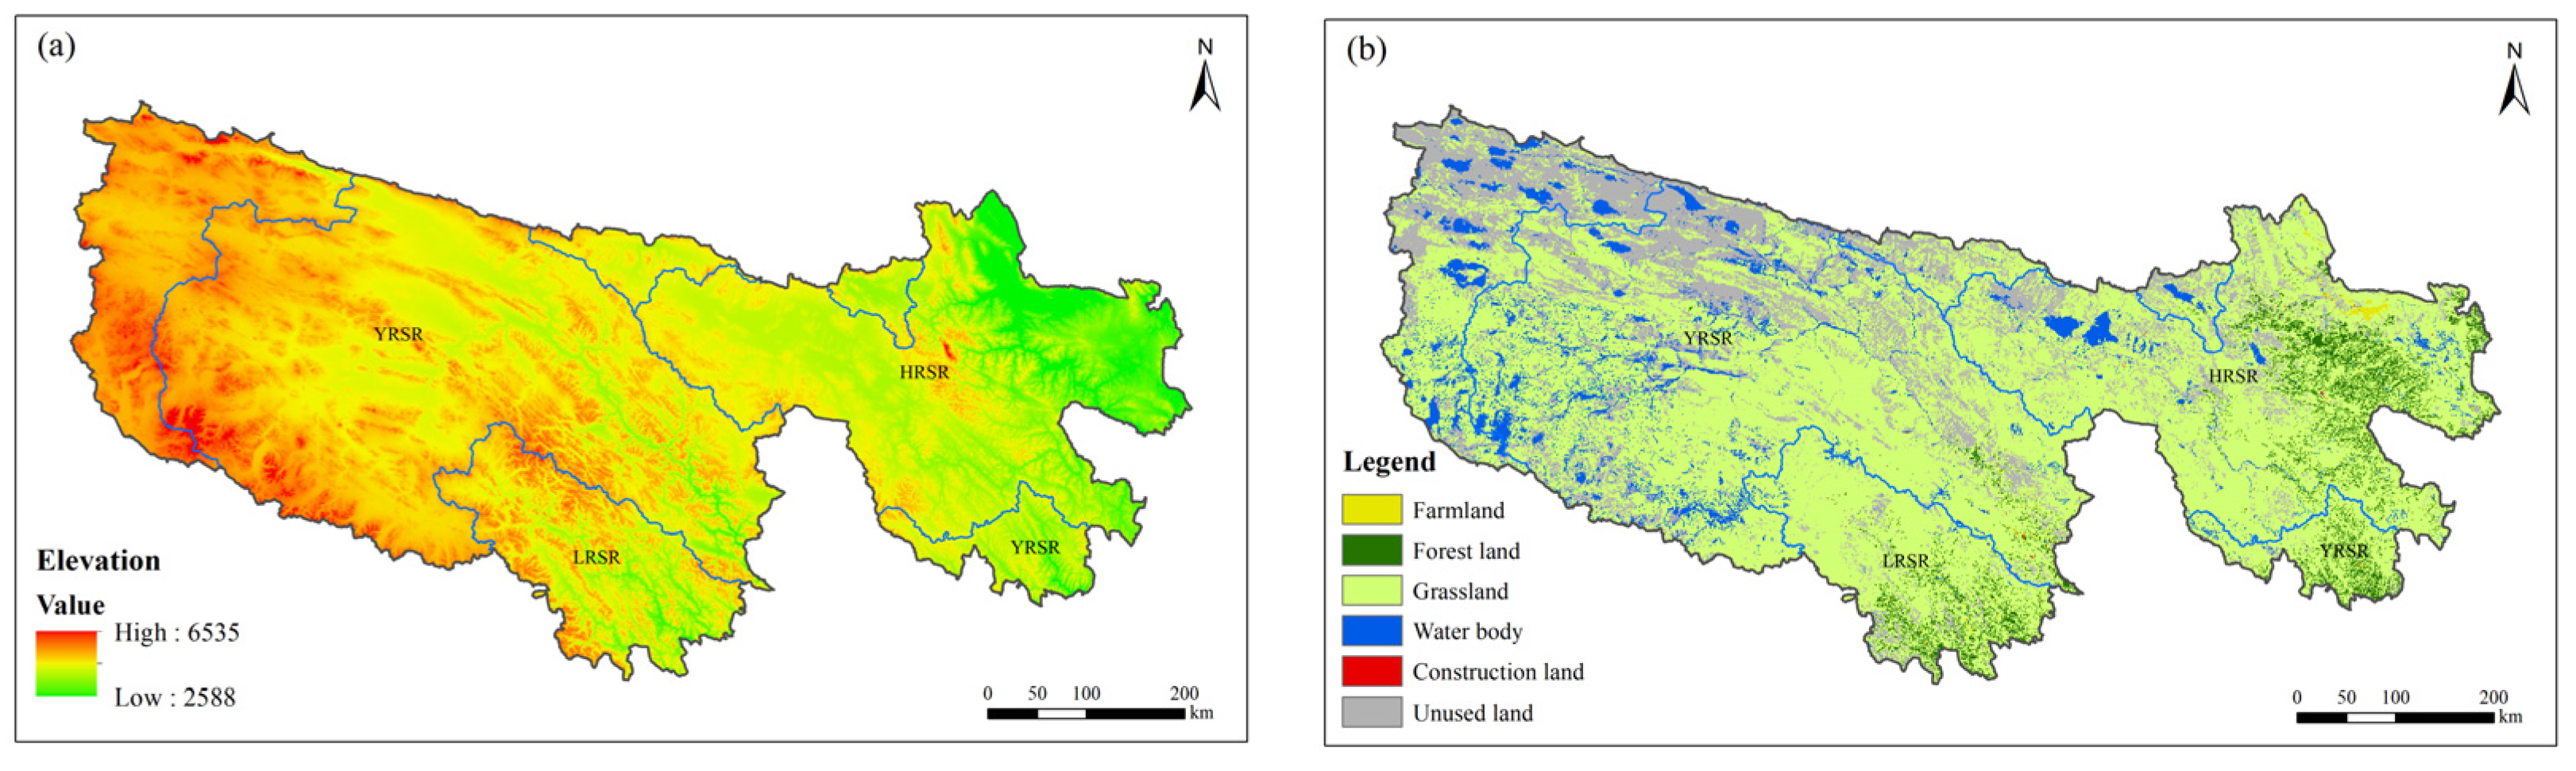
Located in the south of Qinghai Province, the TRHR (31°39′~36°12′ N, 89°45′~102°23′ E) covers an area of 36.3 × 10⁴ km2 (Figure 1). The area ratios of the Yangtze River Source Region (YRSR), the Huanghe River Source Region (HRSR), and the Lancang River Source Region (LRSR) are 45.36%, 27.75%, and 10.19%, respectively. The geomorphic type is mainly mountainous, and the average altitude is 4500 m (Figure 2a). The region has a typical plateau continental climate, characterized by alternating hot and cold seasons, distinct wet and dry seasons, small annual temperature differences, large daily temperature differences, long sunshine duration, and strong radiation. The average annual precipitation is 262.2~772.8 mm, and the average annual temperature is −5.6~3.8 °C. The vertical zonal distribution of soil is obvious, and the soil types from low to high altitudes are mountain forest, chestnut, gray cinnamomic, mountain meadow, alpine steppe, alpine meadow, and alpine cold desert soils. The TRHR was dominated by grasslands, which account for 67.54% of the total land area. The areas of other land use types were unused land, water bodies, forest land, farmland, and construction land (Figure 2b).
2.2. Data Sources
The RUSLE parameters include precipitation, NDVI, soil property, and DEM. Daily rainfall data collected from the NMIC (National Meteorological Information Center, http://data.cma.cn/ accessed on 20 May 2022) from 2000 to 2020 were used to analyze the R factor of the TRHR. The factor K was estimated by using soil texture and soil organic carbon data, which were collected from the RESDC-CAS (Resource and Environment Science and Data Center, Chinese Academy of Sciences, http://resdc.cn/ accessed on 20 May 2022), with a resolution of 1-km. The L and S factors were estimated using the DEM dataset derived from the GDC (Geospatial Data Cloud, http://www.gscloud.cn/ accessed on 20 May 2022) with a resolution of 90-m. The factor C was estimated based on the 16-day NDVI gridded products (MOD13Q1), collected from NASA EOS DATA (https://modis.gsfc.nasa.gov/data/ accessed on 20 May 2022) with a resolution of 250-m. The annual station data for R were spatially interpolated into raster grids using the Anusplin method. All raster datasets with various spatial resolutions were resampled to the same resolution of 250-m.
2.3. Methods
2.3.1. Estimating of Soil Water Erosion
Soil water erosion intensity of the TRHR is estimated by applying the RUSLE model [8]. It can be expressed as follows:
In this formula, A is the annual modulus of soil water erosion, t/hm2/a; R is the rainfall erodibility factor, MJ·mm/(t·hm2·a); K is the soil erodibility factor, t·h/(MJ·mm); L is the slope length factor and S is the slope gradient factor; C is the vegetation coverage and management factor, dimensionless with values ranging from 0~1; and P is the soil erosion control practice factor, dimensionless with values ranging from 0~1.
Rainfall is an external factor causing soil water erosion. Rainfall erodibility reflects the capacity of soil to strip and carry by rainfall, and is related to rainfall amount, intensity, kinetic energy, type, and duration [29]. In this research, the R was estimated by the accumulations of half-month rainfall erodibility applying daily rainfall data [30]. Since the time resolution of the Normalized Difference Vegetation Index (NDVI) data for calculating vegetation coverage and management factor is 16-day, to maintain consistency of time steps for each parameter, this paper changed the time step from half month to 16-day, with 23 periods per year [31]. Annual rainfall erodibility is estimated as follows:
In this formula, M is the 16-day rainfall erodibility, MJ·mm/(t·hm2·a); and Dj is the rainfall effective for the day j in 16-day, with the actual rainfall exceeding 12 mm [32]. Terms β and α are undetermined parameters. is the average daily rainfall exceeding 12 mm, while is the average annual rainfall for those days with rainfall exceeding 12 mm.
The factor K is a parameter of the sensitivity of the properties of soil to water erosion. In this study, K was estimated according to the properties of soil by using the following equation [33]:
In this formula, SAN serves as the fraction of sand (%); SIL serves as the fraction of silt (%), and CLA serves as the fraction of clay (%). C serves as the content of soil organic carbon (%).
Topography impacts the occurrence, formation, and development of soil and vegetation; determines the redistribution of land surface matter and energy; and limits the movement and direction of land surface runoff [34] and responds the impacts of slope gradient and length on soil erosion [35]. Topographic factors L and S were estimated by using the algorithms from McCool et al. (1989) [36] and Liu et al. (2000) [37]:
In this formula, λ presents the slope length (m), the parameters β and m are dimensionless constants that according to the percent slope θ.
The vegetation coverage and management factor C was calculated using vegetation coverage from Cai et al. (2000) [38] as follows:
In this formula, F is the fraction of vegetation coverage (%), which is mostly calculated using NDVI [39]. The dimidiate pixel model was applied in this study as follows:
In this formula, NDVI is the Normalized Difference Vegetation Index for a pixel, NDVIsoil is the NDVI value for bare soil, and NDVImax is the NDVI value for pure vegetation.
The control practice factor P refers to the ratio of soil loss to specific support practices for slope planting [40]. As the cropland area was very small in the TRHR, it was not considered in this study.
2.3.2. Spatiotemporal Analysis of Soil Erosion
The temporal changing trends in soil erosion and related driving factors from 2000 to 2020 were estimated by using the equation of slope, which was calculated by linear regression by using the OLS (ordinary least-squares) method [41]. It can be expressed as follows:
In this formula, n is the total number of years, j is the number of years, and Mj presents the value of soil erosion modulus or other variables. Positive value of the slope indicates an increasing trend, while negative indicates a decreasing trend [42].
2.3.3. Classification and Gradation of Soil Water Erosion
The simulated soil water erosion modulus for each raster is plotted to visualize the spatial patterns. Furthermore, according to the Standards of SL 190—2007 for the Classification and Gradation of Soil Erosion promulgated by the Ministry of Water Resources (China), soil erosion is generally grouped into six different grades according to its intensity [43], and each grade represents a different degree of erosion (Table 1).
3. Results
3.1. Spatiotemporal Variations of Soil Erosion in the TRHR
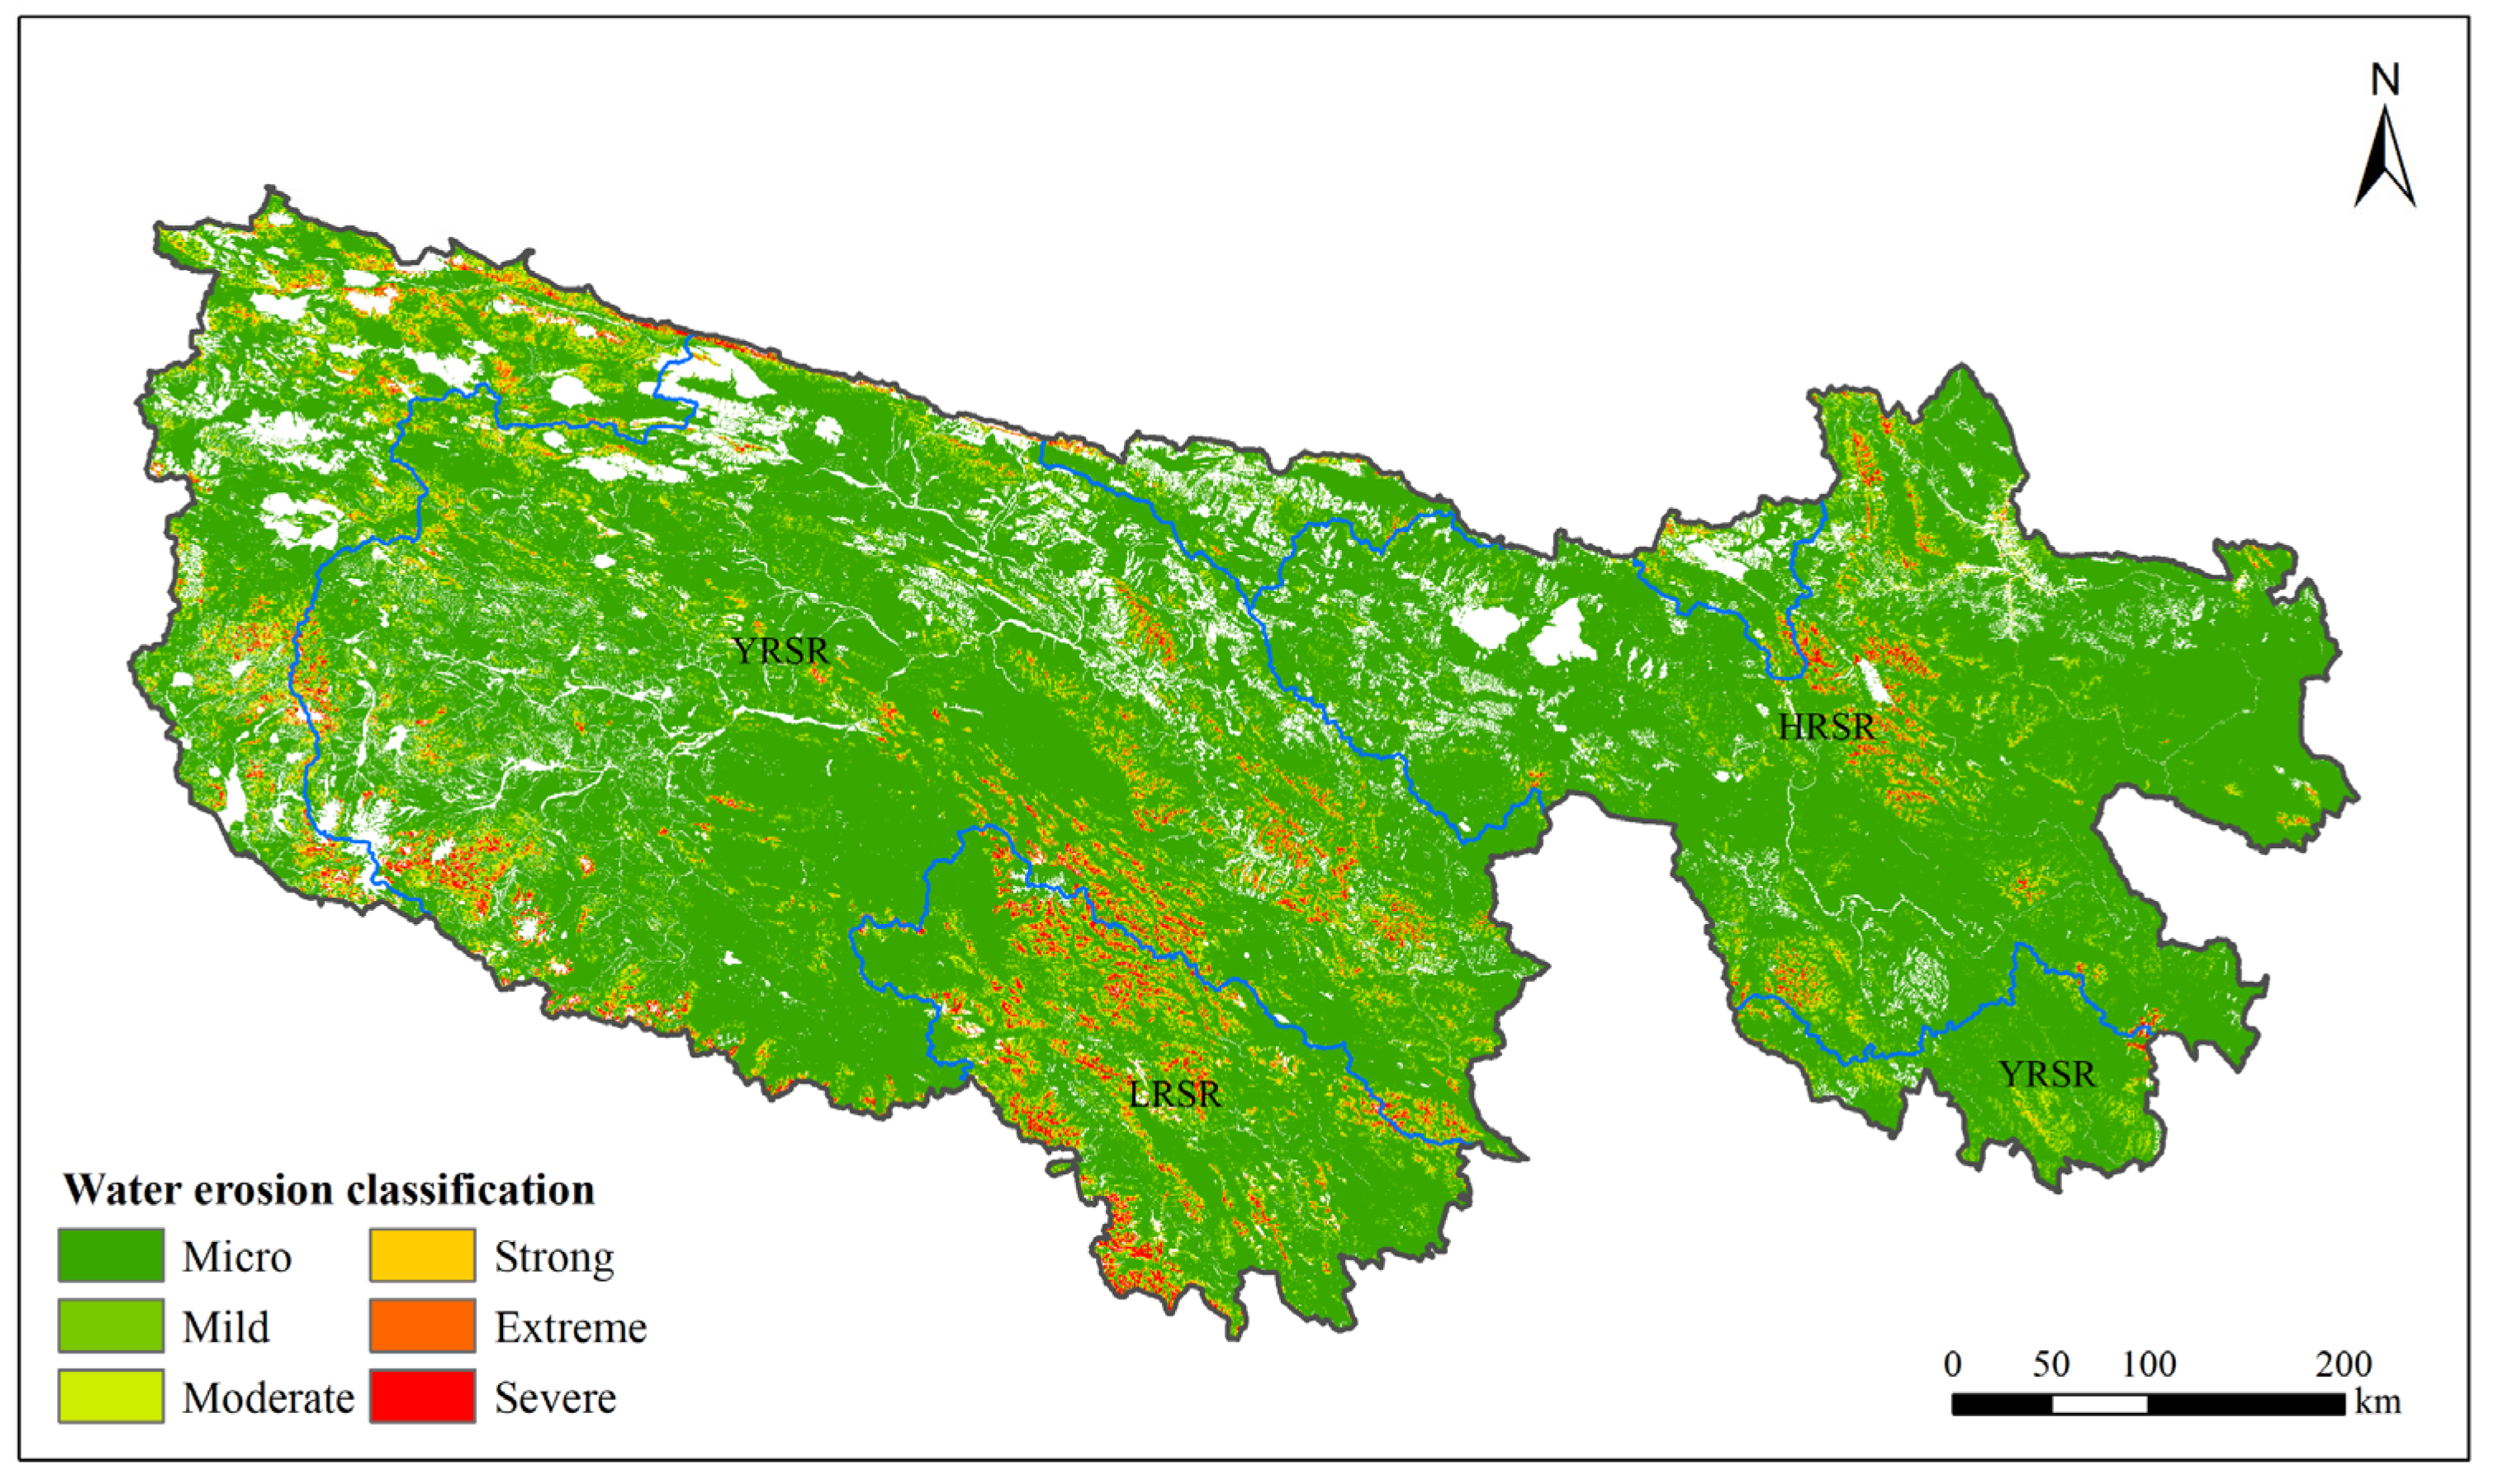
The average annual soil erosion of the TRHR was 0.39 billion t/a between 2000 and 2020. Over this period, the soil erosion modulus was 10.84 t/hm2/a, which showed a slightly increasing trend of 0.02 t/hm2/a. From the gradation and classification standards of soil water erosion intensity, the TRHR mainly presented micro and mild soil erosion. Regions with soil water erosion modulus less than 25 t/hm2/a (micro, mild) accounted for 90.59% of the total TRHR. The area presenting strong, extreme, severe soil water erosion (higher than 50 t/hm2/a) accounted for 5.10% and was distributed in local areas of the TRHR (Figure 3).
The temporal changing trend of modulus of the soil water erosion in the TRHR during 2000~2020 was shown in Figure 4. The soil water erosion change was divided into five classifications according to the slope: obvious increase (slope > 0.5), slight increase (0.02 < slope ≤ 0.5), stable (−0.02 < slope ≤ 0.02), slight decrease (−0.5 < slope ≤ −0.02), and obvious decrease (slope ≤ −0.5). Of the total area, 49.12% presented a stable soil erosion modulus, 27.26% showed an increase, and 23.62% showed a decrease. Soil erosion modulus increase mainly occurred in the northern regions of the HRSR and the middle regions of the TRHR, while the decreasing phenomenon was primarily distributed in the western and southern areas of the TRHR.
Average annual soil water erosion modulus was highest in the LRSR during the years of 2000 to 2020, with the amount of 21.85 t/hm2/a, which was 2.20 and 3.46 times higher than that of the YRSR and HRSR, respectively. The percentage of area at each soil erosion classification level in the three source regions of the TRHR during 2000 and 2020 was shown in Table 2. Moreover, in the YRSR, HRSR, and LRSR, 91.61%, 95.48%, and 81.73% showed micro and mild soil water erosion (less than 25 t/hm2/a), while 4.50%, 2.31%, and 11.55% showed more than severe soil water erosion (higher than 50 t/hm2/a), respectively. The temporal trends in soil erosion modulus of the YRSR, HRSR, and LRSR were 0.03, 0.07, and 0.03 t/hm2/a, respectively. The HRSR had the lowest soil erosion modulus but the highest variation tendency. The areas of the YRSR, HRSR and LRSR where soil erosion modulus remained stable accounted for 50.55, 58.48, and 37.70% of each area.
3.2. Driving Forces of Soil Water Erosion in the TRHR
As soil property and topography are more stable than other factors, soil erosion is more related to climatic factor (rainfall erodibility) and vegetation factor (vegetation coverage). Rainfall erodibility is significant for the severity degree of soil loss. In addition, the vegetation coverage impacts positively on the terrestrial surface by conserving the soil surface from water erosion.
The spatial distribution of rainfall erodibility changes between 2000 and 2020 of the TRHR is shown in Figure 5. Erodibility of rainfall in the southern and eastern regions of the TRHR was relatively high, whereas that in the western and central regions was relatively low, which was similarly distributed with the spatial pattern of rainfall. The average rainfall erodibility was 898.65 MJ·mm/(t·hm2·a) during 2000 and 2020, and this increased annually by an average of 6.78 MJ·mm/(t·hm2·a). Soil water erosion modulus was correlated positively with rainfall erodibility (R2 = 0.67), and the higher erosion modulus was observed in the regions with higher rainfall erodibility degrees. The rainfall erodibility values of the YRSR, HRSR, and LRSR were 808.80, 1078.81, and 1191.06 MJ·mm/(t·hm2·a), respectively, with trends of 3.50, 19.31, and 0.20 MJ·mm/(t·hm2·a). In general, the rainfall erodibility of the TRHR mainly increased, primarily because of the increased precipitation in recent years. Nearly 63.10% of this region showed increased rainfall erodibility. Moreover, a large-scale artificial rainfall enhancement project had been carried out, resulting in a total precipitation increase of 55.17 billion m3 during the period from 2006 to 2016, which was mainly operated in the HRSR, and it was also a main reason for the significant increase in the observed rainfall erodibility. With an increase in rainfall erodibility, the effects of external forces on soil water erosion were strengthened, and the possibility of soil water erosion was accordingly increased.
During 2000~2020, the mean annual fraction vegetation coverage in the TRHR was 16.25%, which showed an increasing trend of 0.12% per year. The spatial vegetation coverage during the period was most obvious from the northwest to southeast. For most areas of the TRHR, vegetation coverage improved, with only 13.50% of this region showing a decreasing trend, which was primarily observed in the middle regions of the TRHR (Figure 6). Vegetation coverage of the YRSR, HRSR, and LRSR was 13.61, 24.02, and 23.45%, respectively, with the changing trends of 0.09, 0.18, and 0.08%/a, respectively. In general, vegetation coverage in the TRHR had improved significantly in recent years. On the one hand, the climate tended to be warmer and wetter under the increased temperature, precipitation, and glacial meltwater [22], and these conditions were conducive to faster vegetation recovery. On the other hand, in order to cope with ecological deterioration in the TRHR, the ecological protection project had been implemented since 2004, and several ecological restoration measures had been performed. The situation of grassland degradation had been locally and temporarily improved [41], which was effective to the control and prevention of soil water erosion.
4. Discussion
4.1. Overlapping Statistics of Soil Erosion and Driving Factors
Overlapping statistical analysis refers to assessing pixels in two or more grid layers at the same location, to establish correlations among the attributes of more spatial objects [44]. In order to find the influence of rainfall erodibility and fraction vegetation coverage on soil water erosion in the TRHR, we spatially overlapped the three variation trend datasets between 2000 and 2020. According to the increasing or decreasing trend of each data, we analyzed the four main combinations, which, with the proportion of 90.48%, accounted for the TRHR’s total area (Table 3).
Type Ⅰ showed an increased soil erosion modulus with increased rainfall erodibility but decreased vegetation coverage, with the proportion of 8.84% accounting for the total area, and was mainly observed in the central and southern parts of the TRHR. Increased rainfall erodibility resulted in an enhancement in the external force of soil water erosion, while decreased fraction vegetation coverage weakened the conservation effect of vegetation on the surface soil. The combined effects of these two factors led to an upward trend in soil erosion. In this case, soil erosion increased most obviously with a slope of 0.20 t/hm2/a, which was 10 times more than the mean slope of the entire region.
Type Ⅱ showed the opposite trends as Type Ⅰ, and accounted for an area ratio of 25.90%, which was primarily observed in the western regions of the TRHR. Combined with decreased rainfall erodibility and increased vegetation coverage, which were both conducive to control of soil loss, soil erosion modulus of this region showed a significant decrease of 0.14 t/hm2/a.
Type Ⅲ and Type Ⅳ showed increased and decreased soil erosion modulus with both increased rainfall erodibility and increased vegetation coverage, and they accounted for area ratios of 38.34% and 17.40%, respectively. The simultaneous increase in these two driving factors had opposite effects on soil loss, with the former enhancing the soil erosion modulus and the latter having an inhibitory effect. The final soil erosion showed opposite results, which could be interpreted as the different dominant roles of rainfall erodibility and vegetation coverage on soil loss in each region.
4.2. Suggestions for Sustainable Land Use Management
Under the joint action of climate change and ecological protection, soil erosion in the TRHR showed an increased trend over the last 20 years. Artificial enhancements in rainfall not only promoted vegetation growth and improved vegetation coverage, but also resulted in significant improvements in rainfall erodibility. Vegetation recovery was based on the combined impacts of ecological programs and climatic fluctuations. However, such restoration was only temporary and local, and did not indicate a whole or fundamental improvement in the TRHR [45]. Although the vegetation coverage was enhanced, the restoration of vegetation roots was slow, and the soil’s ability to combat the soil erosion did not obviously increase. Based on the spatially heterogeneous characteristics of the overlapping analysis among soil erosion and its main driving factors, targeted soil erosion prevention and control measures were suggested according to the four types discussed above. The Type Ⅰ area was the main grazing area of the TRHR, which would strengthen livestock reduction measures and reduce grazing pressure on grassland in order to promote vegetation recovery. The Type Ⅱ area basically realized a virtuous cycle, which would strengthen the supervision of ecological protection and continue to strengthen the achievements. The Type Ⅲ and Type Ⅳ areas would focus on community structure restoration to enhance the soil fixation ability of vegetation roots.
4.3. Limitations and Future Work
Although the Anusplin method can significantly improve the interpolation precision of R factor, low density of meteorological stations in the western TRHR was a source of uncertainty, which would increase certain errors in model simulation. In addition, more localization parameters and higher spatial and temporal resolutions of remote sensing data would reduce the uncertainties.
Besides climatic factor and vegetation factor discussed in this paper, topography, soil properties, and planting practices also had influences on soil water erosion. Thus, how to determinize the contributions of each factor in soil water erosion needs to be considered in the future.
5. Conclusions
Based on the RUSLE model simulation and ArcGIS spatial analysis, this study analyzed the spatial and temporal patterns of soil water erosion in the TRHR, China, and discussed the main driving factors underlying rainfall erodibility and vegetation coverage during the years of 2000~2020. The primary conclusions we observed in this study are summarized as follows.
The long-term average soil water erosion ranged from 9.31 t/hm2 in 2000 to 10.07 t/hm2 in 2020 for the entire TRHR, with an average of 10.84 t/hm2/a. Soil water erosion was mainly observed as micro and mild, with the proportion of 90.59% accounting for the total area. Soil water erosion modulus exhibited a slight increasing trend of 0.02 t/hm2/a during the study period. Among all sub-basins, average annual soil erosion modulus of the YRSR, HRSR, and LRSR was 9.94, 6.31, and 21.85 t/hm2/a, respectively. The HRSR showed the highest increase at a rate of 0.07 t/hm2/a, while that in the YRSR was the lowest at 0.03 t/hm2/a.
Rainfall and vegetation were two sensitive and direct factors that impacted soil water erosion, with increasing precipitation intensifying soil erosion by enhancing rainfall erodibility. Vegetation coverage showed an increasing trend of 0.12%/a, which had inhibitory effects on soil loss.
Nearly 47.18% of the TRHR exhibited increased soil erosion, which was mainly due to increased rainfall erodibility (Type Ⅰ and Type Ⅲ). Nearly 43.30% of the area showed decreased soil erosion, which was mainly because of the increased vegetation coverage (Type Ⅱ and Type Ⅳ). Adaptive management is needed to maintain a stable and balanced development pattern for ecosystems in the TRHR.
Author Contributions
Conceptualization, W.C. and T.H.; methodology, D.W.; software, R.P.; writing—original draft preparation, D.W.; writing—review and editing, L.H.; visualization, R.P.; project administration, W.C.; funding acquisition, L.H. All authors have read and agreed to the published version of the manuscript.
Funding
This research was funded by National Key R&D Program of China (2021YFB2600105), Technology Project of Changzhou University (ZMF20020441), and Changzhou Key Laboratory of Biomass Green, Safe and High Value Utilization Technology (CM20223011).
Data Availability Statement
Data are accessible through the National Meteorological Information Centre (http://data.cma.cn/ accessed on 20 May 2022), Resource and Environment Science and Data Center, Chinese Academy of Sciences (http://resdc.cn/ accessed on 20 May 2022), Geospatial Data Cloud (http://www.gscloud.cn/ accessed on 20 May 2022), and NASA EOS DATA (https://modis.gsfc.nasa.gov/data/ accessed on 20 May 2022).
Acknowledgments
The authors are grateful to the anonymous reviewers and editor for the positive and constructive comments and suggestions for this paper.
Conflicts of Interest
The authors declare no conflict of interest.
References
- Oldeman, L.R. Global Extent of Soil Degradation; Bi-Annual Report 1991–1992; ISRIC: Wageningen, The Netherlands, 1992. [Google Scholar]
- Pimentel, D.; Burgess, M. Soil erosion threatens food production. Agriculture 2013, 3, 443–463. [Google Scholar] [CrossRef] [Green Version]
- Wuepper, D.; Borrelli, P.; Finger, R. Countries and the global rate of soil erosion. Nat. Sustain. 2020, 3, 51–55. [Google Scholar] [CrossRef]
- Hu, Y.F.; Han, Y.Q.; Cao, W.; Zhang, Y.Z. Mapping the spatial distribution of water erosion research hot regions in China. Acta Ecol. Sin. 2019, 39, 5829–5835. [Google Scholar]
- Keesstra, S.D.; Bouma, J.; Wallinga, J.; Tittonell, P.; Smith, P.; Cerdà, A.; Montanarella, L.; Quinton, J.N.; Pachepsky, Y.; Putten, W.; et al. The significance of soils and soil science towards realization of the United Nations Sustainable Development Goals. Soil 2016, 2, 111–128. [Google Scholar] [CrossRef] [Green Version]
- Lugato, E.; Smith, P.; Borrelli, P.; Panagos, P.; Ballabio, C.; Orgiazzi, A.; Fernandez, O.; Montanarella, L.; Jones, A. Soil erosion is unlikely to drive a future carbon sink in Europe. Sci. Adv. 2018, 4, eaau3523. [Google Scholar] [CrossRef] [Green Version]
- Wischmeier, W.H.; Smith, D.D. Predicting Rainfall Erosion Losses: A Guide to Conservation Planning. In Agriculture Handbook; United States Department of Agriculture: Washington, DC, USA, 1978. [Google Scholar]
- Renard, K.; Foster, G.; Weesies, G. Predicting Soil Erosion by Water: A Guide to Conservation Planning with the Revised Universal Soil Loss Equation (Rusle). In Agriculture Handbook; United States Department of Agriculture: Washington, DC, USA, 1997. [Google Scholar]
- Yu, B.; Ciesiolka, C.; Rose, C.W.; Coughlan, K.J. A validation test of WEPP to predict runoff and soil loss from a pineapple farm on a sandy soil in subtropical Queensland. Aust. J. Soil Res. 2000, 38, 537–554. [Google Scholar] [CrossRef]
- Morgan, R.P.; Quinton, J.N.; Smith, R.E.; Govers, G.; Poesen, J.W.; Auerswald, K.; Chisci, G.; Torri, D.; Styczen, M.E. The European Soil Erosion Model (EUROSEM): A dynamic approach for predicting sediment transport from fields and small catchments. Earth Surf. Process. Landf. 1998, 23, 527–544. [Google Scholar] [CrossRef]
- De Roo, A.P.J.; Wesseling, C.G.; Ritsema, C.J. LISEM: A single-event physically based hydrological and soil erosion model for drainage basins. I: Theory, input and output. Hydrol. Process. 1996, 10, 1107–1117. [Google Scholar] [CrossRef]
- Alewell, C.; Borrelli, P.; Meusburger, K.; Panagos, P. Using the USLE: Chances, challenges and limitations of soil erosion modelling. Int. Soil Water Conserv. Res. 2019, 7, 203–225. [Google Scholar] [CrossRef]
- Ghosal, K.; Das Bhattacharya, S. A Review of RUSLE Model. J. Indian Soc. Remote Sens. 2020, 48, 689–707. [Google Scholar] [CrossRef]
- Chappell, A.; Baldock, J.; Sanderman, J. The global significance of omitting soil erosion from soil organic carbon cycling schemes. Nat. Clim. Chang. 2016, 6, 187–191. [Google Scholar] [CrossRef]
- Teng, H.F.; Liang, Z.Z.; Chen, S.C.; Liu, Y.; Viscarra Rossel, R.A.; Chappell, A.; Yu, F.; Shi, Z. Current and future assessments of soil erosion by water on the Tibetan Plateau based on RUSLE and CMIP5 climate models. Sci. Total Environ. 2018, 635, 673–686. [Google Scholar] [CrossRef]
- Munson, S.M.; Belnap, J.; Okin, G.S. Responses of wind erosion to climate-induced vegetation changes on the Colorado Plateau. Proc. Natl. Acad. Sci. USA 2011, 108, 3854–3859. [Google Scholar] [CrossRef] [PubMed] [Green Version]
- Wang, N.; Jiao, J.Y.; Bai, L.C.; Zhang, Y.F.; Chen, Y.X.; Tang, B.Z.; Lang, Y.; Zhao, C.J.; Wang, H.L. Magnitude of soil erosion in small catchments with different land use patterns under an extreme rainstorm event over the Northern Loess Plateau, China. Catena 2020, 195, 104780. [Google Scholar] [CrossRef]
- Gyssels, G.; Poesen, J.; Bochet, E.; Li, Y. Impact of plant roots on the resistance of soils to erosion by water: A review. Prog. Phys. Geogr. 2005, 29, 189–217. [Google Scholar] [CrossRef] [Green Version]
- Zhang, B.; He, C.; Burnham, M.; Zhang, L. Evaluating the coupling effects of climate aridity and vegetation restoration on soil erosion over the Loess Plateau in China. Sci. Total Environ. 2016, 539, 436–449. [Google Scholar] [CrossRef]
- Sun, W.; Shao, Q.; Liu, J. Soil erosion and its response to the changes of precipitation and vegetation cover on the Loess Plateau. J. Geogr. Sci. 2013, 23, 1091–1106. [Google Scholar] [CrossRef]
- Xu, M.; Kang, S.; Chen, X.; Wu, H.; Wang, X.; Su, Z. Detection of hydrological variations and their impacts on vegetation from multiple satellite observations in the Three-River Source Region of the Tibetan Plateau. Sci. Total Environ. 2018, 639, 1220–1232. [Google Scholar] [CrossRef] [PubMed]
- Shao, Q.; Cao, W.; Fan, J.; Huang, L.; Xu, X. Effects of an ecological conservation and restoration project in the Three-River Source Region, China. J. Geogr. Sci. 2017, 27, 183–204. [Google Scholar] [CrossRef]
- Wu, Z.; Li, F.; Zhang, L.; Zhang, J.; Du, J. Research on grassland degradation of Three-river Headwaters Region based on reference vegetation coverage. J. Nat. Disasters 2014, 23, 94–102. [Google Scholar]
- Zhang, L.; Fan, J.; Zhou, D.; Zhang, H. Ecological protection and restoration program reduced grazing pressure in the Three-River Headwaters Region, China. Rangel. Ecol. Manag. 2017, 70, 540–548. [Google Scholar] [CrossRef]
- Zhang, X.; Jin, X. Vegetation dynamics and responses to climate change and anthropogenic activities in the Three-River Headwaters Region, China. Ecol. Indic. 2021, 131, 108223. [Google Scholar] [CrossRef]
- Xi, Y.; Miao, C.; Wu, J.; Duan, Q.; Lei, X.; Li, H. Spatiotemporal changes in extreme temperature and precipitation events in the Three-Rivers Headwater Region, China. J. Geophys. Res. Atmos. 2018, 123, 5827–5844. [Google Scholar] [CrossRef]
- Han, Z.; Song, W.; Deng, X.; Xu, X. Trade-offs and synergies in ecosystem service within the three-rivers Headwater region, China. Water 2017, 9, 588. [Google Scholar] [CrossRef] [Green Version]
- Shao, Q.; Fan, J.; Liu, J.; Huang, L.; Cao, W.; Liu, L. Target-based assessment on effects of First-stage ecological conservation and restoration project in Three-river Source Region, China and policy recommendations. Bull. Chin. Acad. Sci. 2017, 32, 35–44. [Google Scholar]
- Nearing, M.A.; Yin, S.; Borrelli, P.; Polyakov, V.O. Rainfall erosivity: An historical review. Catena 2017, 157, 357–362. [Google Scholar] [CrossRef]
- Jin, F.; Yang, W.; Fu, J.; Li, Z. Effects of vegetation and climate on the changes of soil erosion in the Loess Plateau of China. Sci. Total Environ. 2021, 773, 145514. [Google Scholar] [CrossRef]
- Cao, W.; Liu, L.L.; Wu, D. Soil erosion changes and driving factors in the Three-River Headwaters region. Acta Pratacult. Sin. 2018, 27, 10–22. [Google Scholar]
- Zhang, W.; Xie, Y.; Liu, Y. Rainfall erosivity estimation using daily rainfall amounts. Sci. Geogr. Sin. 2002, 6, 705–711. [Google Scholar]
- Williams, J.R.; Jones, C.A.; Dyke, P.T. A modelling approach to determining the relationship between erosion and soil productivity. Trans. ASAE 1984, 27, 129–144. [Google Scholar] [CrossRef]
- Zhang, H.; Wei, J.; Yang, Q.; Baartman, J.E.M.; Gai, L.; Yang, X.; Li, S.; Yu, J.; Ritsema, C.J.; Geissen, V. An improved method for calculating slope length (λ) and the LS parameters of the Revised Universal Soil Loss Equation for large watersheds. Geoderma 2017, 308, 36–45. [Google Scholar] [CrossRef]
- Lu, D.; Li, G.; Valladares, G.S.; Batistella, M. Mapping soil erosion risk in Rondônia, Brazilian Amazonia: Using RUSLE, remote sensing and GIS. Land Degrad. Dev. 2004, 15, 499–512. [Google Scholar] [CrossRef]
- McCool, D.K.; Foster, G.R.; Mutchler, C.K.; Meyer, L.D. Revised slope length factor for the universal soil loss equation. Trans. ASAE 1989, 32, 1571–1576. [Google Scholar] [CrossRef]
- Liu, B.Y.; Nearing, M.A.; Shi, P.J.; Jia, Z.W. Slope length effects on soil loss for steep slopes. Soil Sci. Soc. Am. J. 2000, 64, 1759–1963. [Google Scholar] [CrossRef] [Green Version]
- Cai, C.F.; Ding, S.W.; Shi, Z.H.; Huang, L.; Zhang, G.Y. Study of applying USLE and geographical information system IDRISI to predict soil erosion in small watershed. J. Soil Water Conserv. 2000, 14, 19–24. [Google Scholar]
- Li, Z.; Zhang, Y.; Zhu, Q.; He, Y.; Yao, W. Assessment of bank gully development and vegetation coverage on the Chinese Loess Plateau. Geomorphology 2015, 228, 462–469. [Google Scholar] [CrossRef]
- Angima, S.D.; Stott, D.E.; O’Neill, M.K.; Ong, C.K.; Weesies, G.A. Soil erosion prediction using RUSLE for central Kenyan highland conditions. Agric. Ecosyst. Environ. 2003, 97, 295–308. [Google Scholar] [CrossRef]
- Stow, D.; Daeschner, S.; Hope, A.; Douglas, D.; Petersen, A.; Myneni, R.; Zhou, L.; Oechel, W. Variability of the seasonally integrated normalized difference vegetation index across the north slope of Alaska in the 1990s. Int. J. Remote Sens. 2003, 24, 1111–1117. [Google Scholar] [CrossRef]
- Hussain, S.; Qin, S.J.; Nasim, W.; Bukhari, M.A.; Mubeen, M.; Fahad, S.; Raza, A.; Abdo, H.G.; Tariq, A.; Mousa, B.G.; et al. Monitoring the dynamic changes in vegetation cover using spatio-temporal remote sensing data from 1984 to 2020. Atmosphere 2022, 13, 1609. [Google Scholar] [CrossRef]
- SL 190-2007; Standards for Classification and Gradation of Soil Erosion. Ministry of Water Resources of the People’s Republic of China: Beijing, China, 2008.
- Jiang, C.; Zhang, L. Effect of ecological restoration and climate change on ecosystems: A case study in the Three-Rivers Headwater Region, China. Environ. Monit. Assess. 2016, 188, 382. [Google Scholar] [CrossRef]
- Zhang, D.; Jia, Q.; Wang, P.; Zhang, J.; Hou, X.; Li, X.; Li, W. Analysis of spatial variability in factors contributing to vegetation restoration in Yan’an, China. Ecol. Indic. 2020, 113, 106278. [Google Scholar] [CrossRef]
Figure 1.
The distribution of the Three-River Headwaters Region (TRHR), China.

Figure 2.
(a) Elevation and (b) land use distribution of the TRHR.

Figure 3.
The soil water erosion classification from 2000 to 2020 in the TRHR, China.

Figure 4.
The soil water erosion modulus changes from 2000 to 2020 in the TRHR, China.

Figure 5.
Spatial distribution of rainfall erodibility changes from 2000 to 2020 in the TRHR, China.
Figure 5.
Spatial distribution of rainfall erodibility changes from 2000 to 2020 in the TRHR, China.

Figure 6.
Spatial distribution of vegetation coverage changes from 2000 to 2020 in the TRHR, China.


Table 1.
The gradation and classification of soil water erosion intensity (t/hm2/a).
| Classification | Water Erosion Intensity |
|---|---|
| micro | <10 |
| mild | 10~25 |
| moderate | 25~50 |
| strong | 50~80 |
| extreme | 80~150 |
| severe | >150 |
Table 2.
Area percentage of soil erosion classification of the three source regions in the TRHR, China.
Table 2.
Area percentage of soil erosion classification of the three source regions in the TRHR, China.
| Classification | YRSR | HRSR | LRSR |
|---|---|---|---|
| micro | 81.18 | 88.26 | 66.99 |
| mild | 10.43 | 7.22 | 14.74 |
| moderate | 3.90 | 2.21 | 6.72 |
| strong | 1.73 | 0.91 | 3.60 |
| extreme | 1.79 | 0.90 | 4.21 |
| severe | 0.98 | 0.50 | 3.74 |
Table 3.
Overlapping statistics among soil erosion modulus, rainfall erodibility, and vegetation coverage in the TRHR, China 1.
Table 3.
Overlapping statistics among soil erosion modulus, rainfall erodibility, and vegetation coverage in the TRHR, China 1.
| Types | Slope of A | Slope of R | Slope of F | Area Ratio |
|---|---|---|---|---|
| Ⅰ: A increase, R increase, F decrease | 0.20 | 10.49 | −0.08 | 8.84 |
| Ⅱ: A decrease, R decrease, F increase | −0.14 | −5.07 | 0.10 | 25.90 |
| Ⅲ: A increase, R increase, F increase | 0.13 | 15.42 | 0.13 | 38.34 |
| Ⅳ: A decrease, R increase, F increase | −0.05 | 12.35 | 0.22 | 17.40 |
Notes: 1 A represents soil erosion modulus, R represents rainfall erodibility, F represents vegetation coverage.
Publisher’s Note: MDPI stays neutral with regard to jurisdictional claims in published maps and institutional affiliations. |
© 2022 by the authors. Licensee MDPI, Basel, Switzerland. This article is an open access article distributed under the terms and conditions of the Creative Commons Attribution (CC BY) license (https://creativecommons.org/licenses/by/4.0/).
Share and Cite
MDPI and ACS Style
Wu, D.; Peng, R.; Huang, L.; Cao, W.; Huhe, T. Spatio-Temporal Analysis and Driving Factors of Soil Water Erosion in the Three-River Headwaters Region, China. Water 2022, 14, 4127. https://doi.org/10.3390/w14244127
AMA Style
Wu D, Peng R, Huang L, Cao W, Huhe T. Spatio-Temporal Analysis and Driving Factors of Soil Water Erosion in the Three-River Headwaters Region, China. Water. 2022; 14(24):4127. https://doi.org/10.3390/w14244127
Chicago/Turabian StyleWu, Dan, Rui Peng, Lin Huang, Wei Cao, and Taoli Huhe. 2022. "Spatio-Temporal Analysis and Driving Factors of Soil Water Erosion in the Three-River Headwaters Region, China" Water 14, no. 24: 4127. https://doi.org/10.3390/w14244127
Note that from the first issue of 2016, this journal uses article numbers instead of page numbers. See further details here.