
Quantifying Groundwater Infiltrations into Subway Lines and Underground Car Parks Using MODFLOW-USG
 , , , , , and
Abstract
:1. Introduction
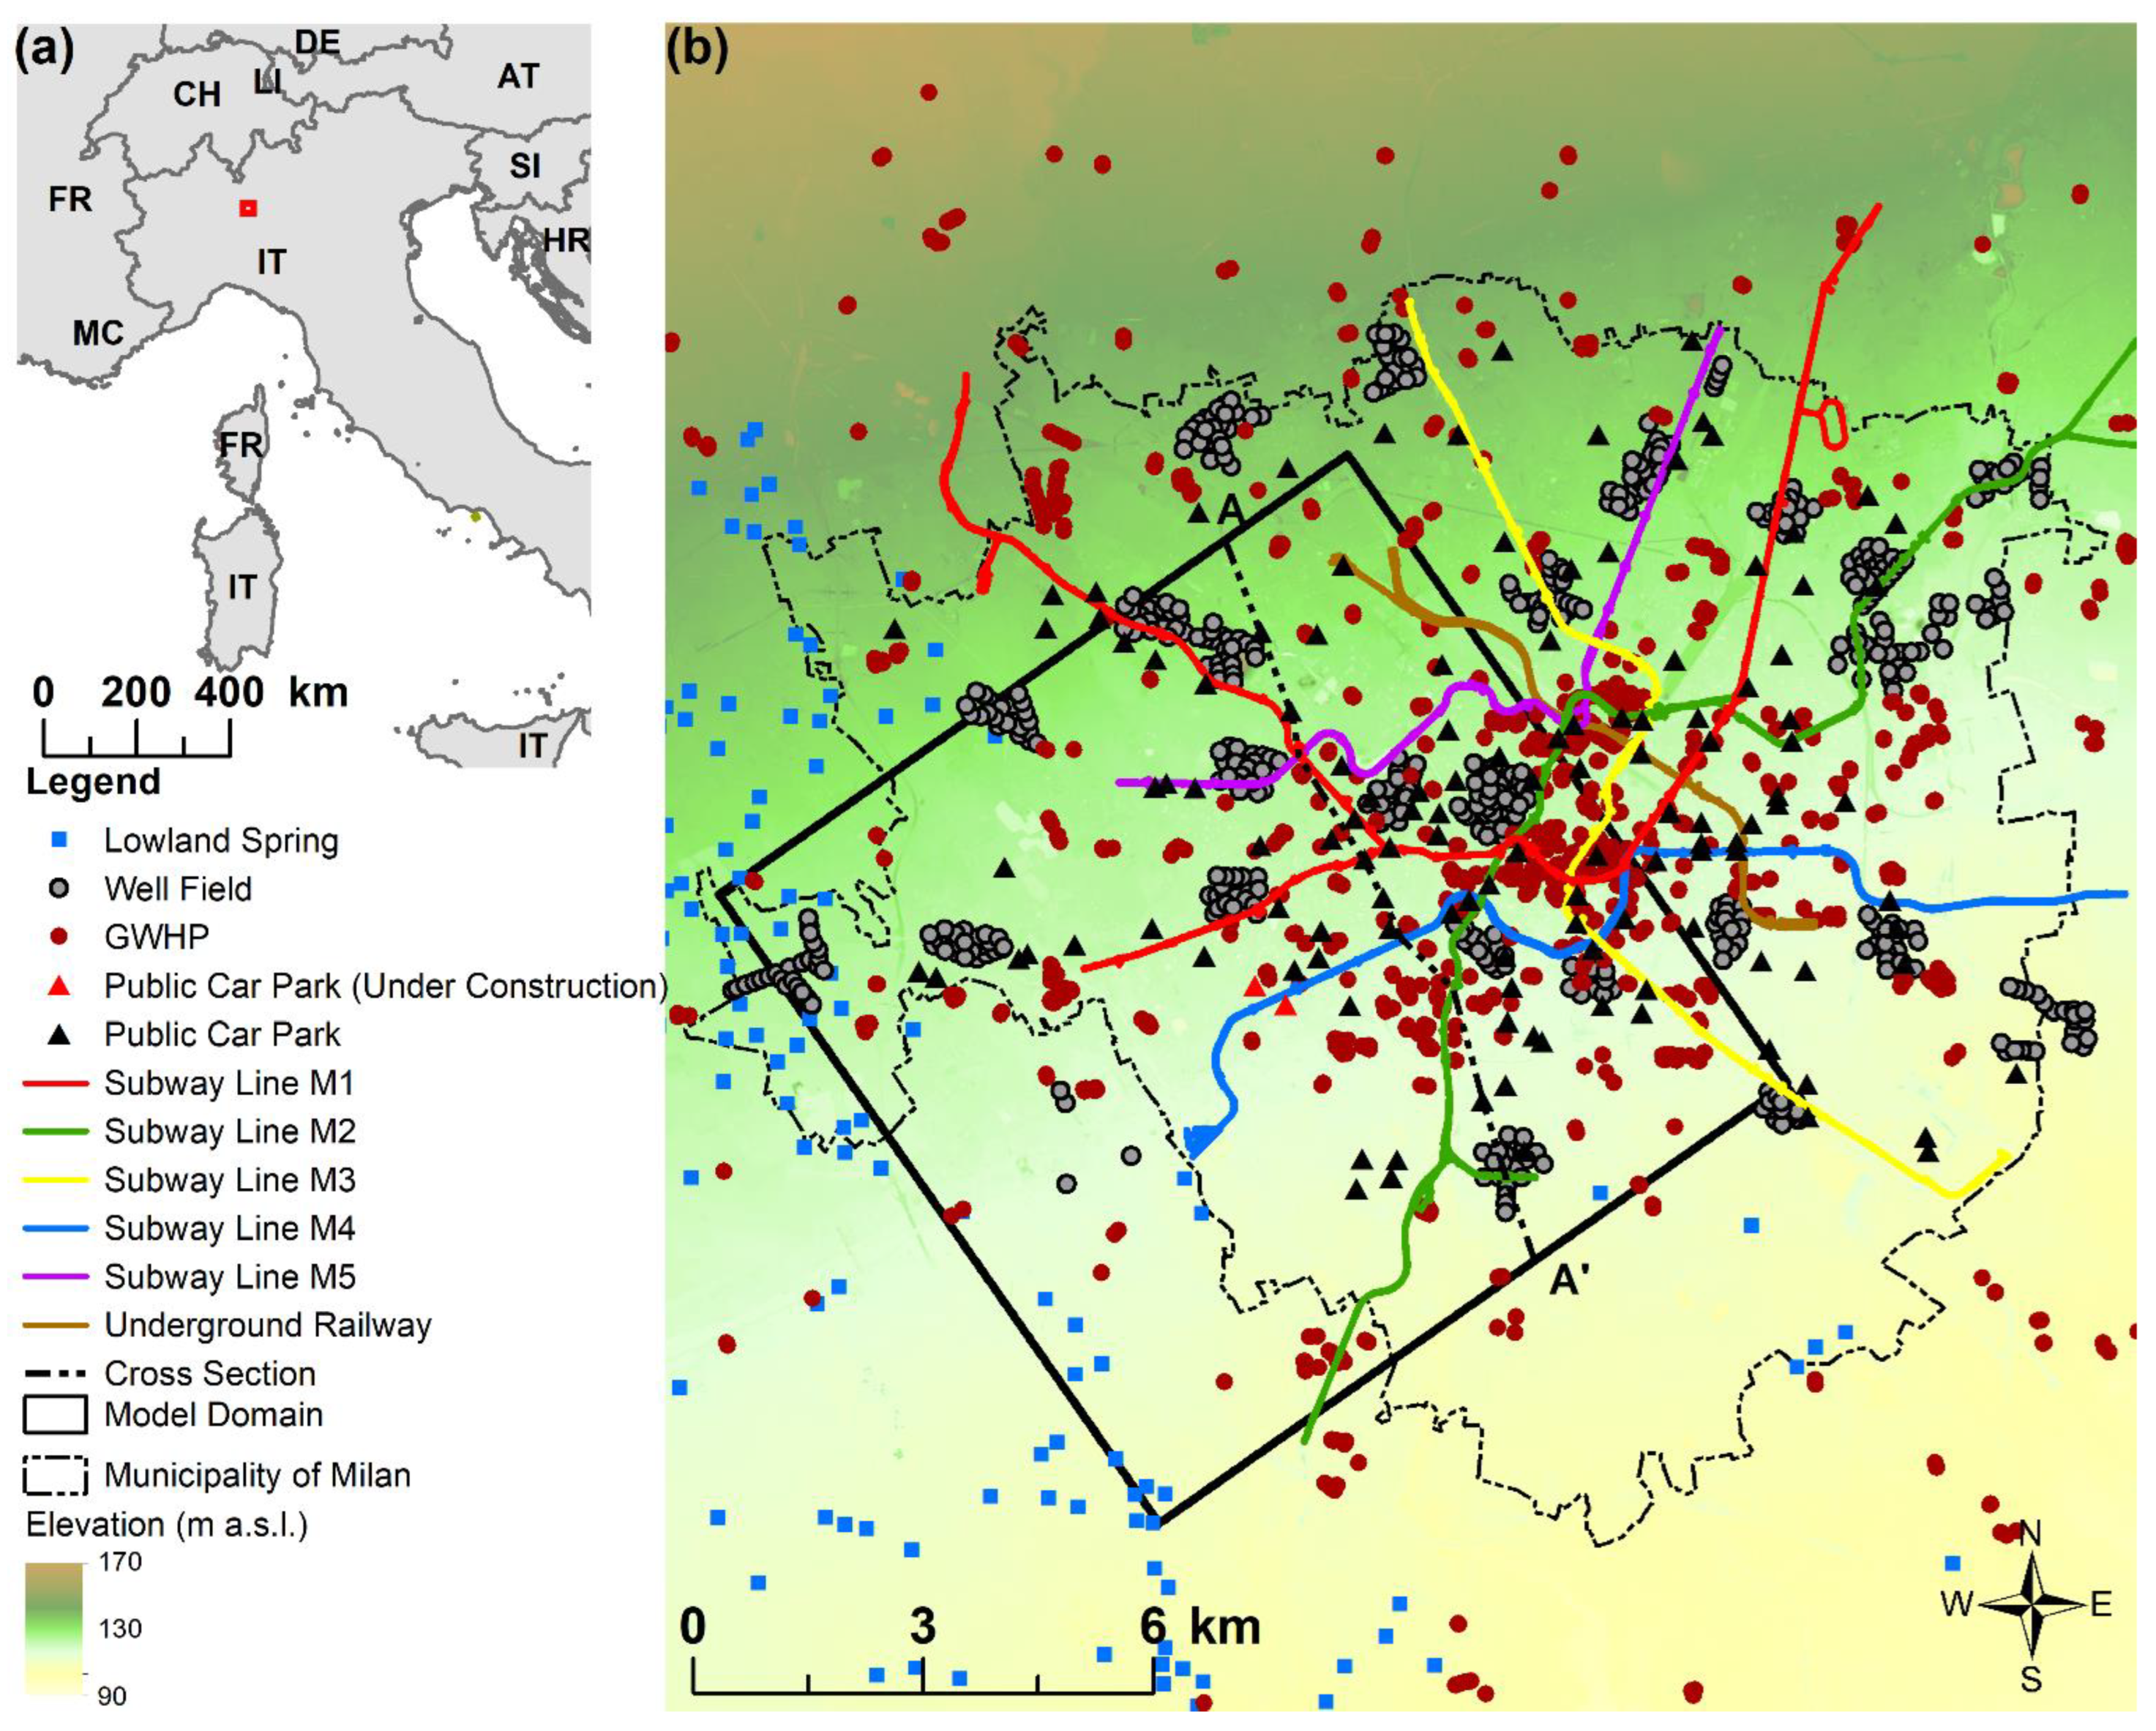
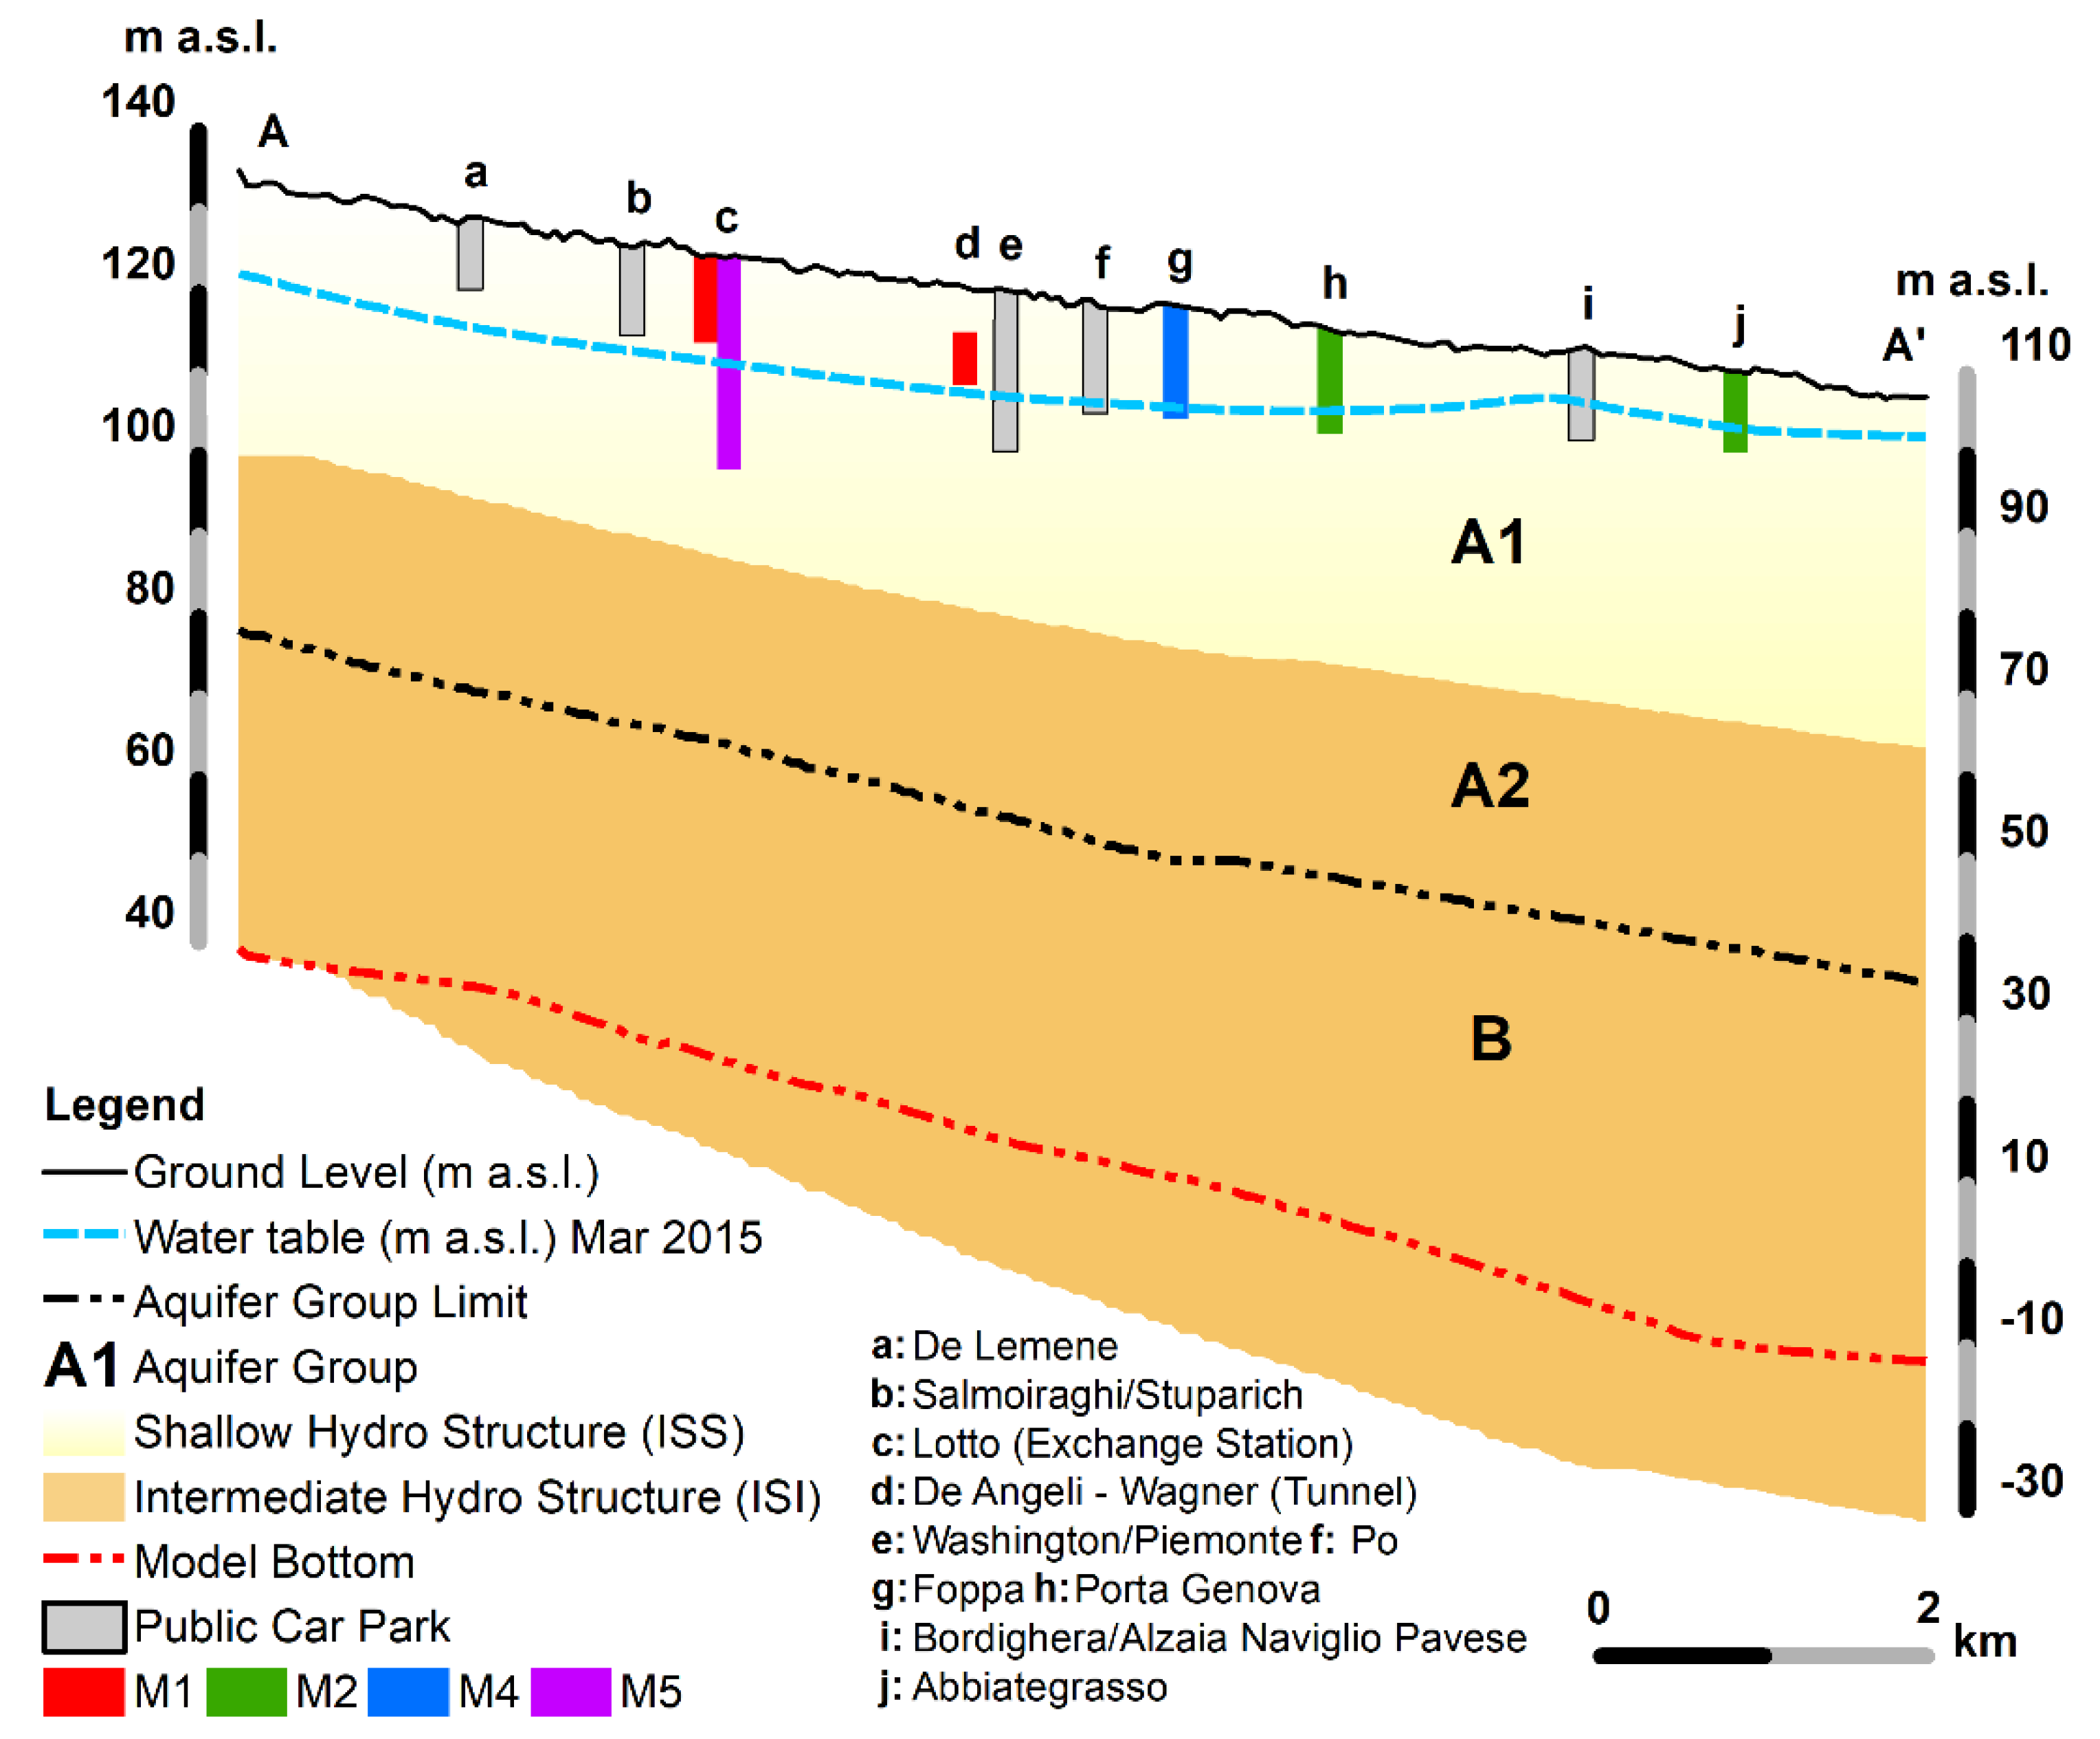
2. Urban Conceptual Model of the Study Area
3. Materials and Methods
3.1. Numerical Model
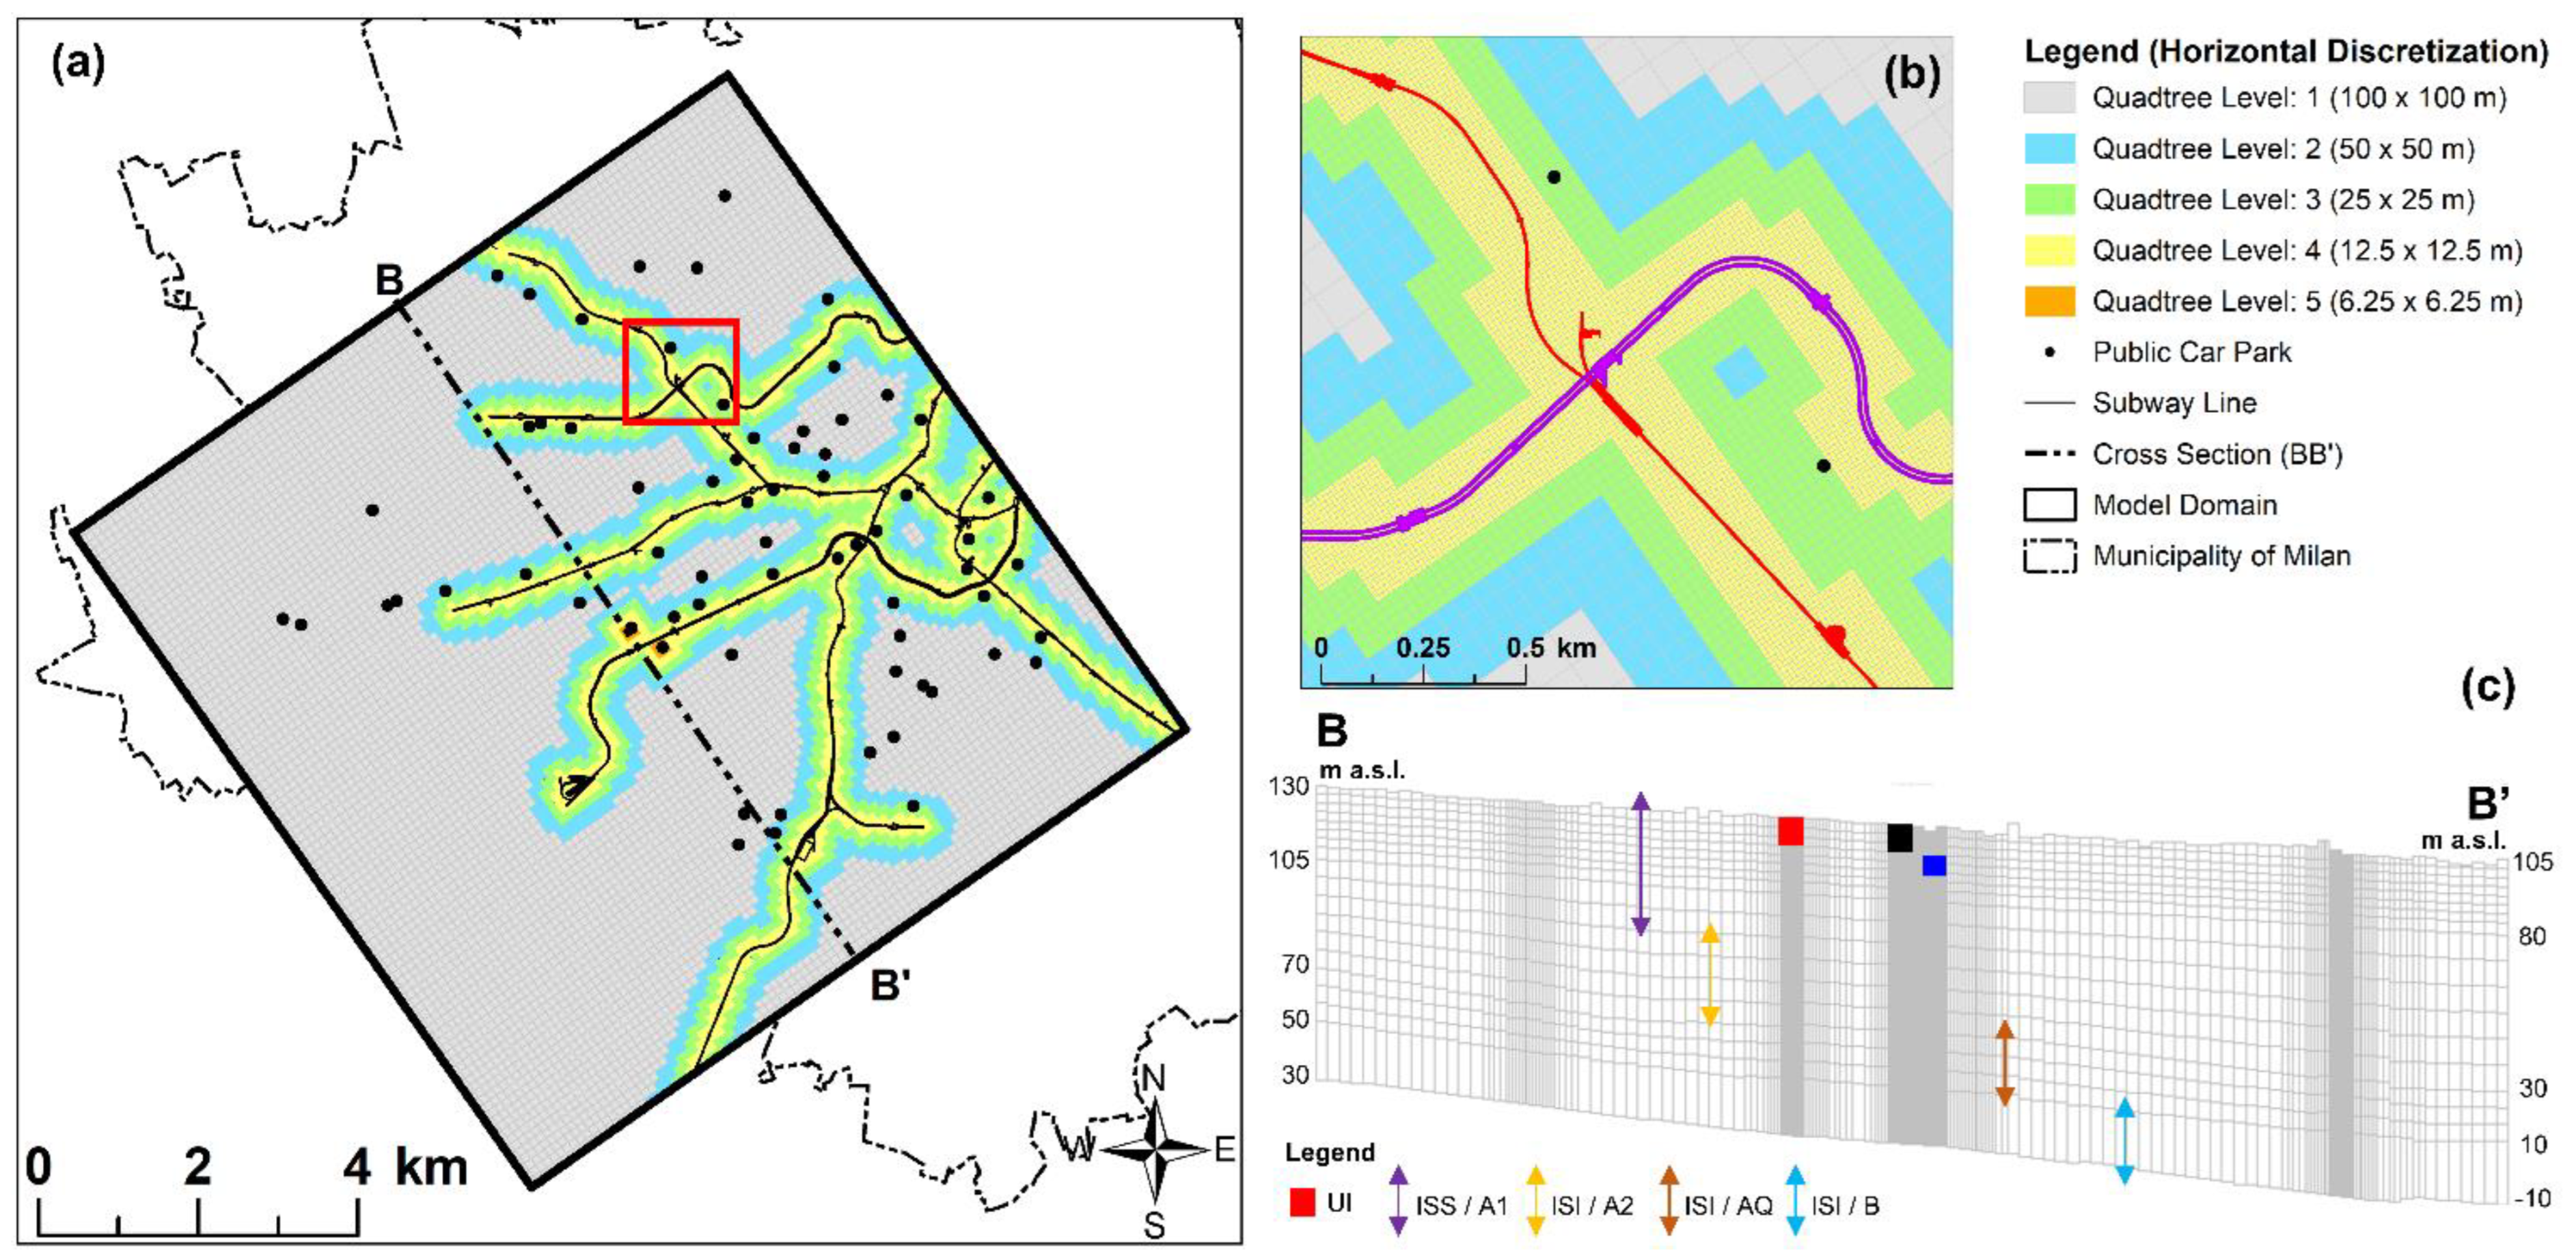
3.1.1. Grid Discretization
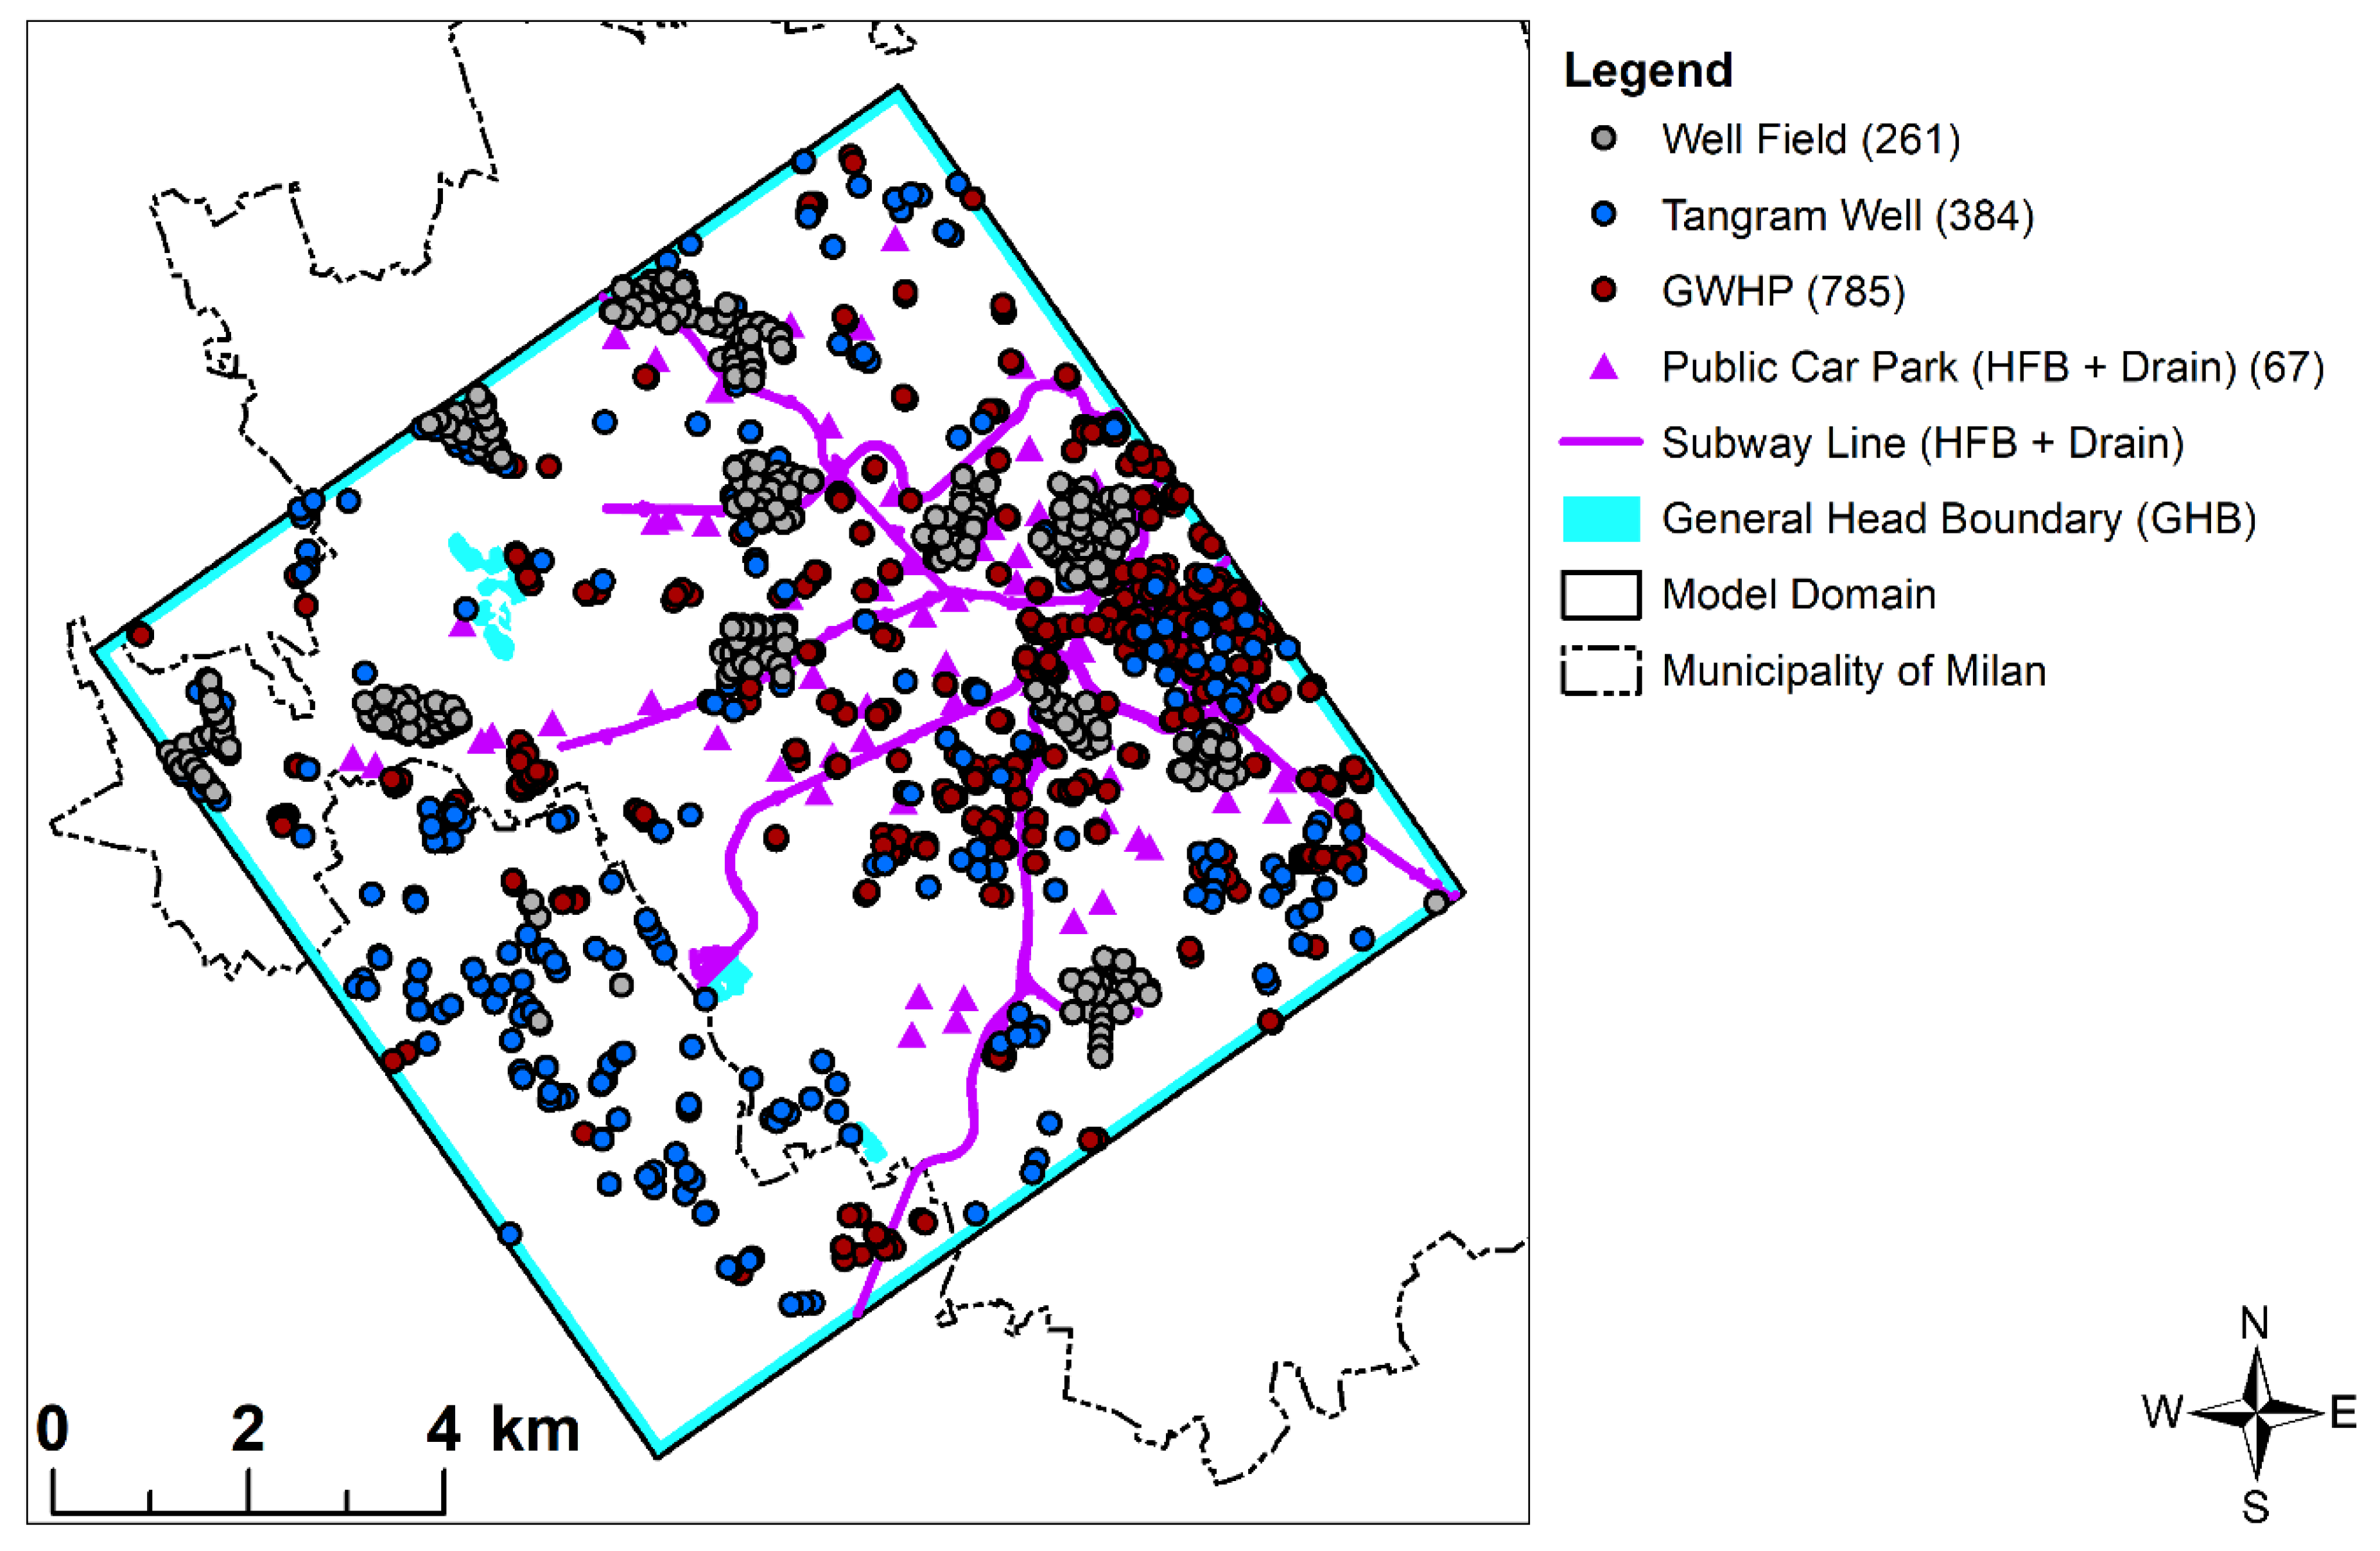
3.1.2. Boundary Conditions
- General Head Boundary (GHB) was used to model the initial heads along the borders around the study area, at their real distance from the analyzed domain. As for their hydraulic head values, the initial information was taken from a piezometric map of March 2015 (Mar15) for the study area [51]. In addition, the main quarries located inside the domain (Figure 4) have been represented as GHBs.
- WELL (WEL) was used to model the 261 public wells and 785 groundwater heat pumps (GWHPs) described in Section 2. Information on well discharge was readapted from De Caro et al. [61] with regard to public wells, and from Regione Lombardia [64] for GWHPs. Finally, a further 384 private wells fell within the analyzed domain; as their well discharge was mostly unknown, a discharge value of -432 m3/d was initially attributed to these wells.
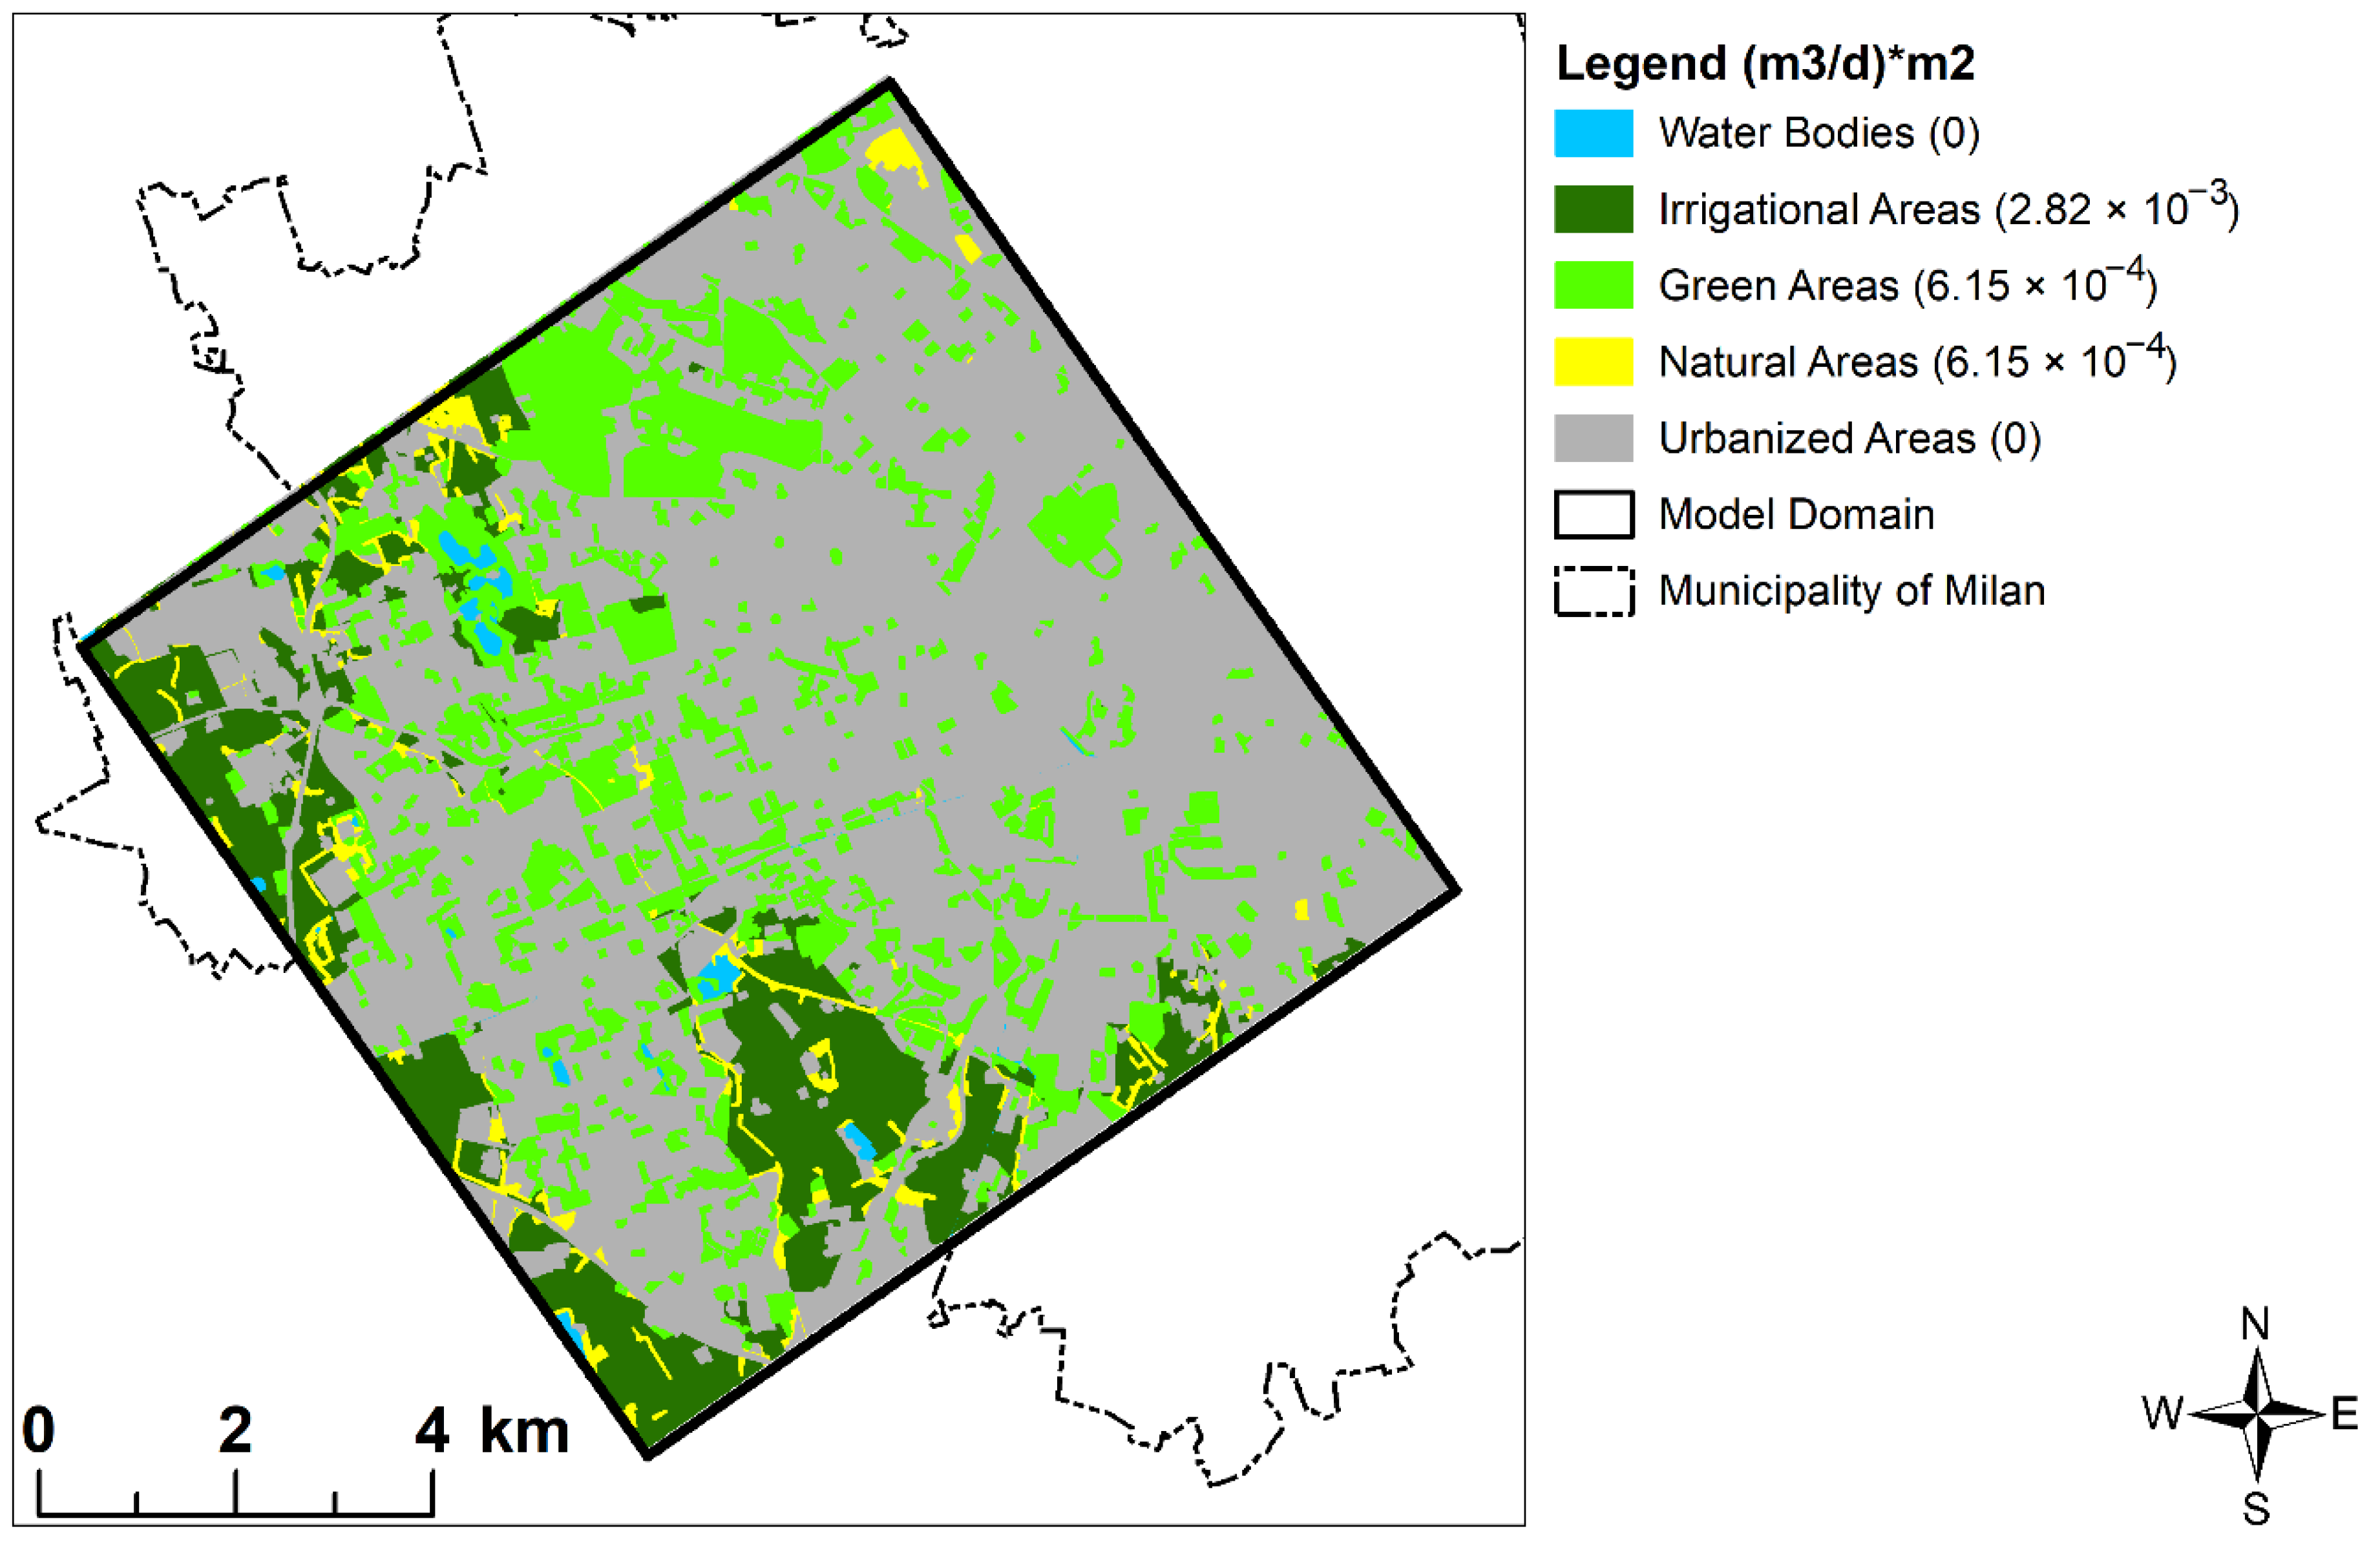
- Recharge (RCH): 5 zones, based on land use, were identified from the geographic database Dusaf 6.0 [67]; their values were calculated as the contribution of precipitations, irrigations, and runoff. The initial values for each zone were calculated starting from the precipitation data of Paderno Dugnano rain gauge (located just northward of the city of Milan), monitored by the regional environmental protection agency [68]. Precipitations amounted to 1496.2 mm/yr for the twelve months before Mar15, the period chosen for model calibration. Absence of infiltration was considered for urban areas and for surface water elements (i.e., quarries), while 20% of infiltration was attributed to the other recharge areas; moreover, an additional contribution from recharge infiltration was attributed to irrigational areas.
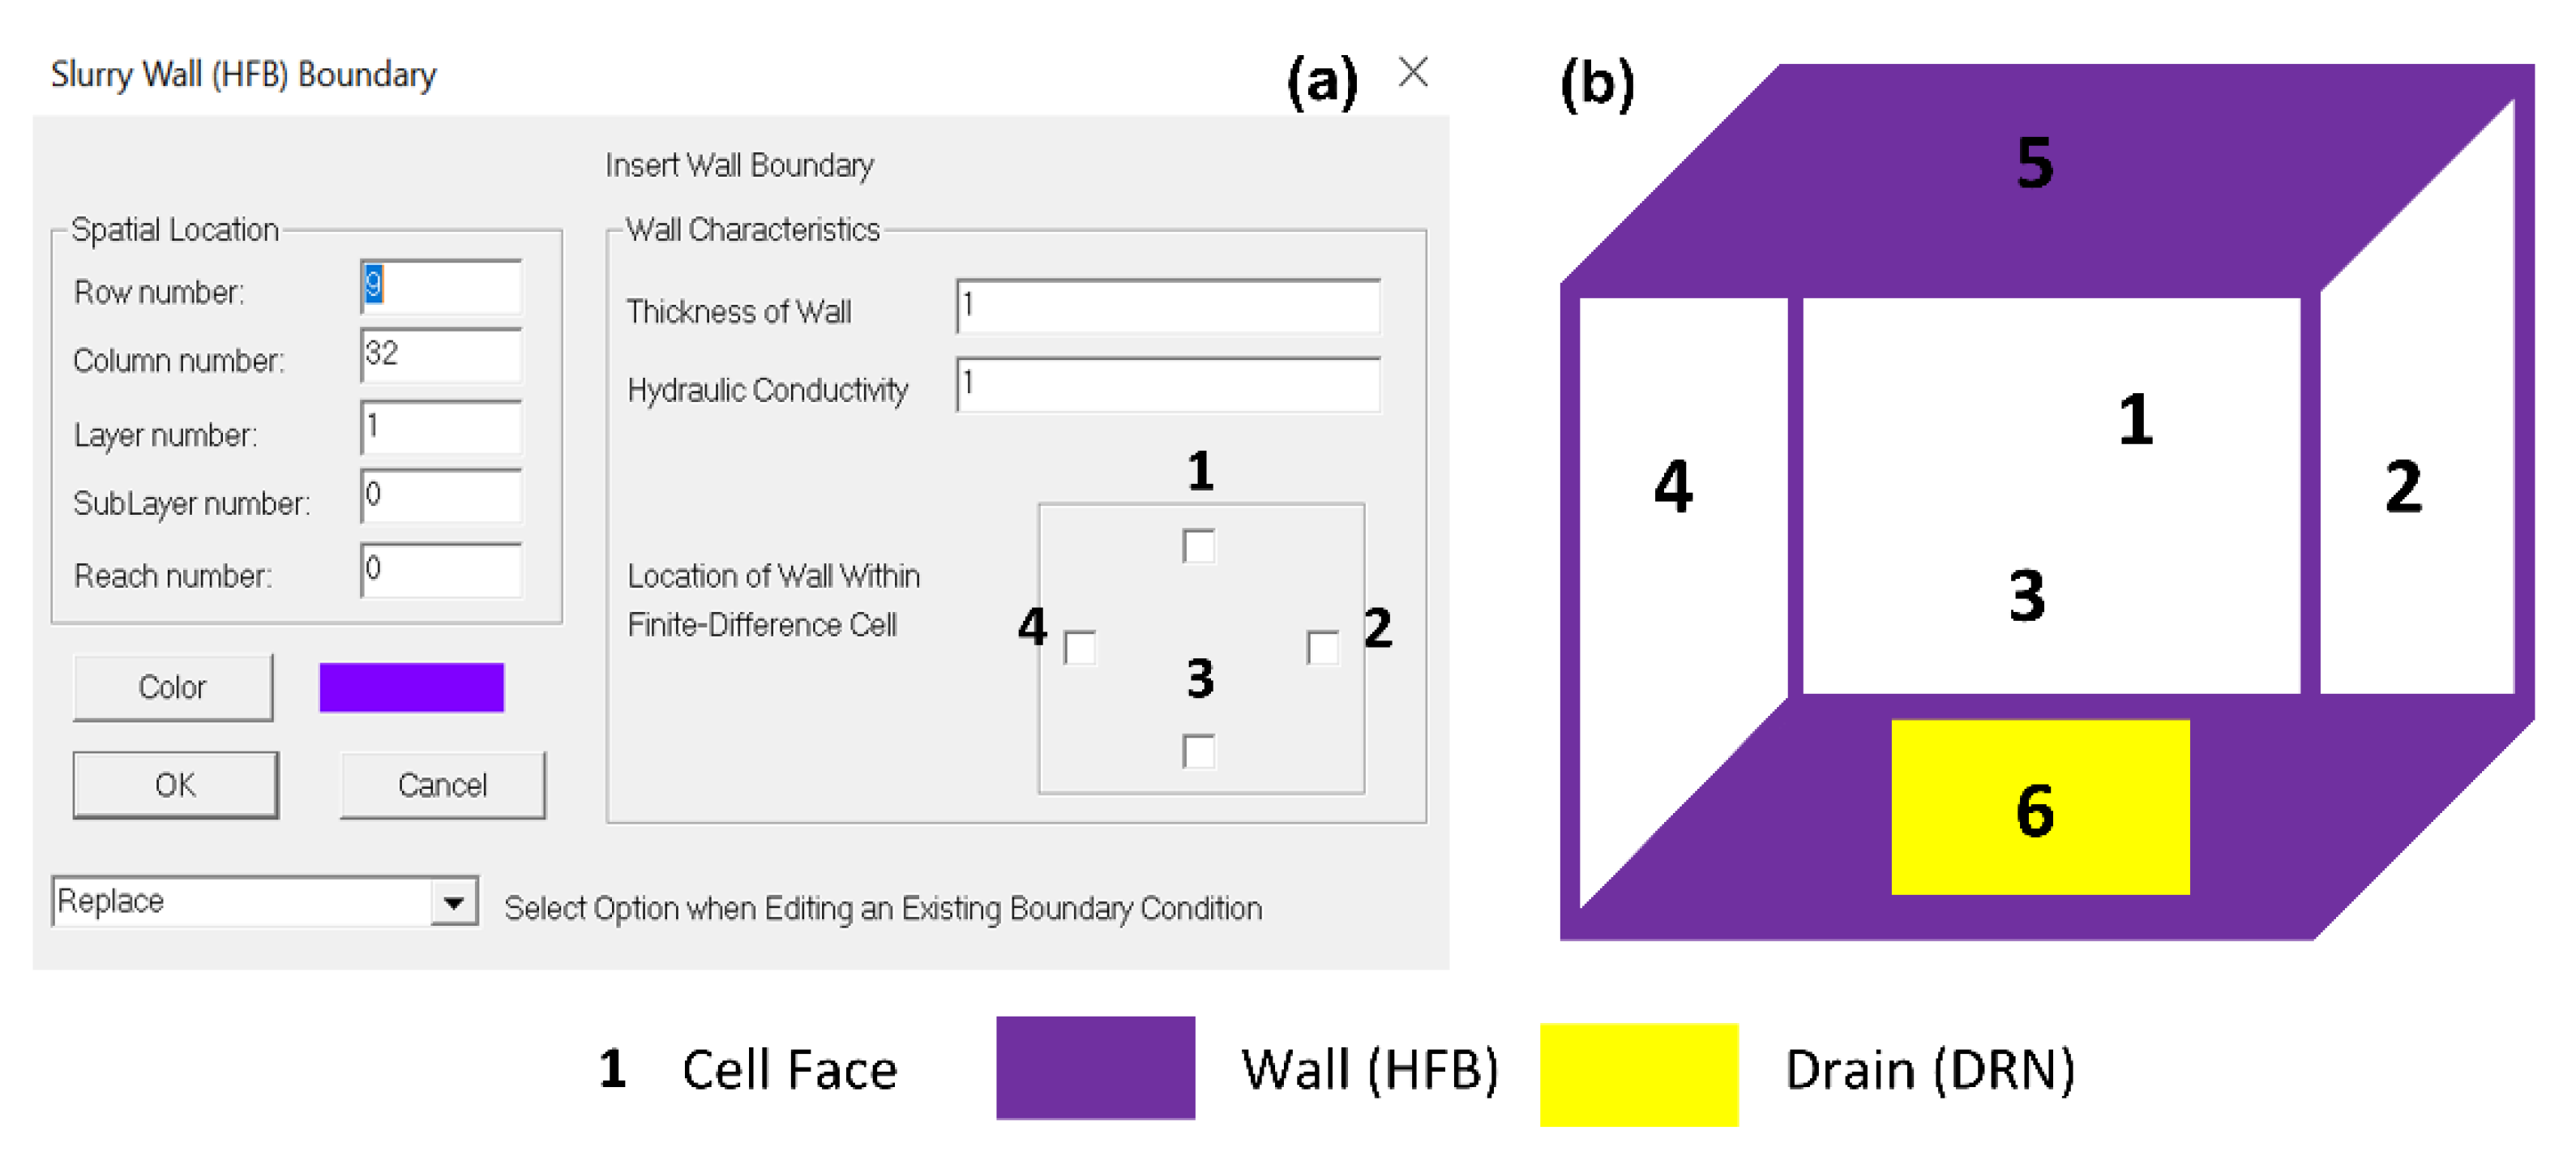
Underground Infrastructures Modeling
3.1.3. Further Modeling Aspects
3.2. Decision Management Support
4. Results
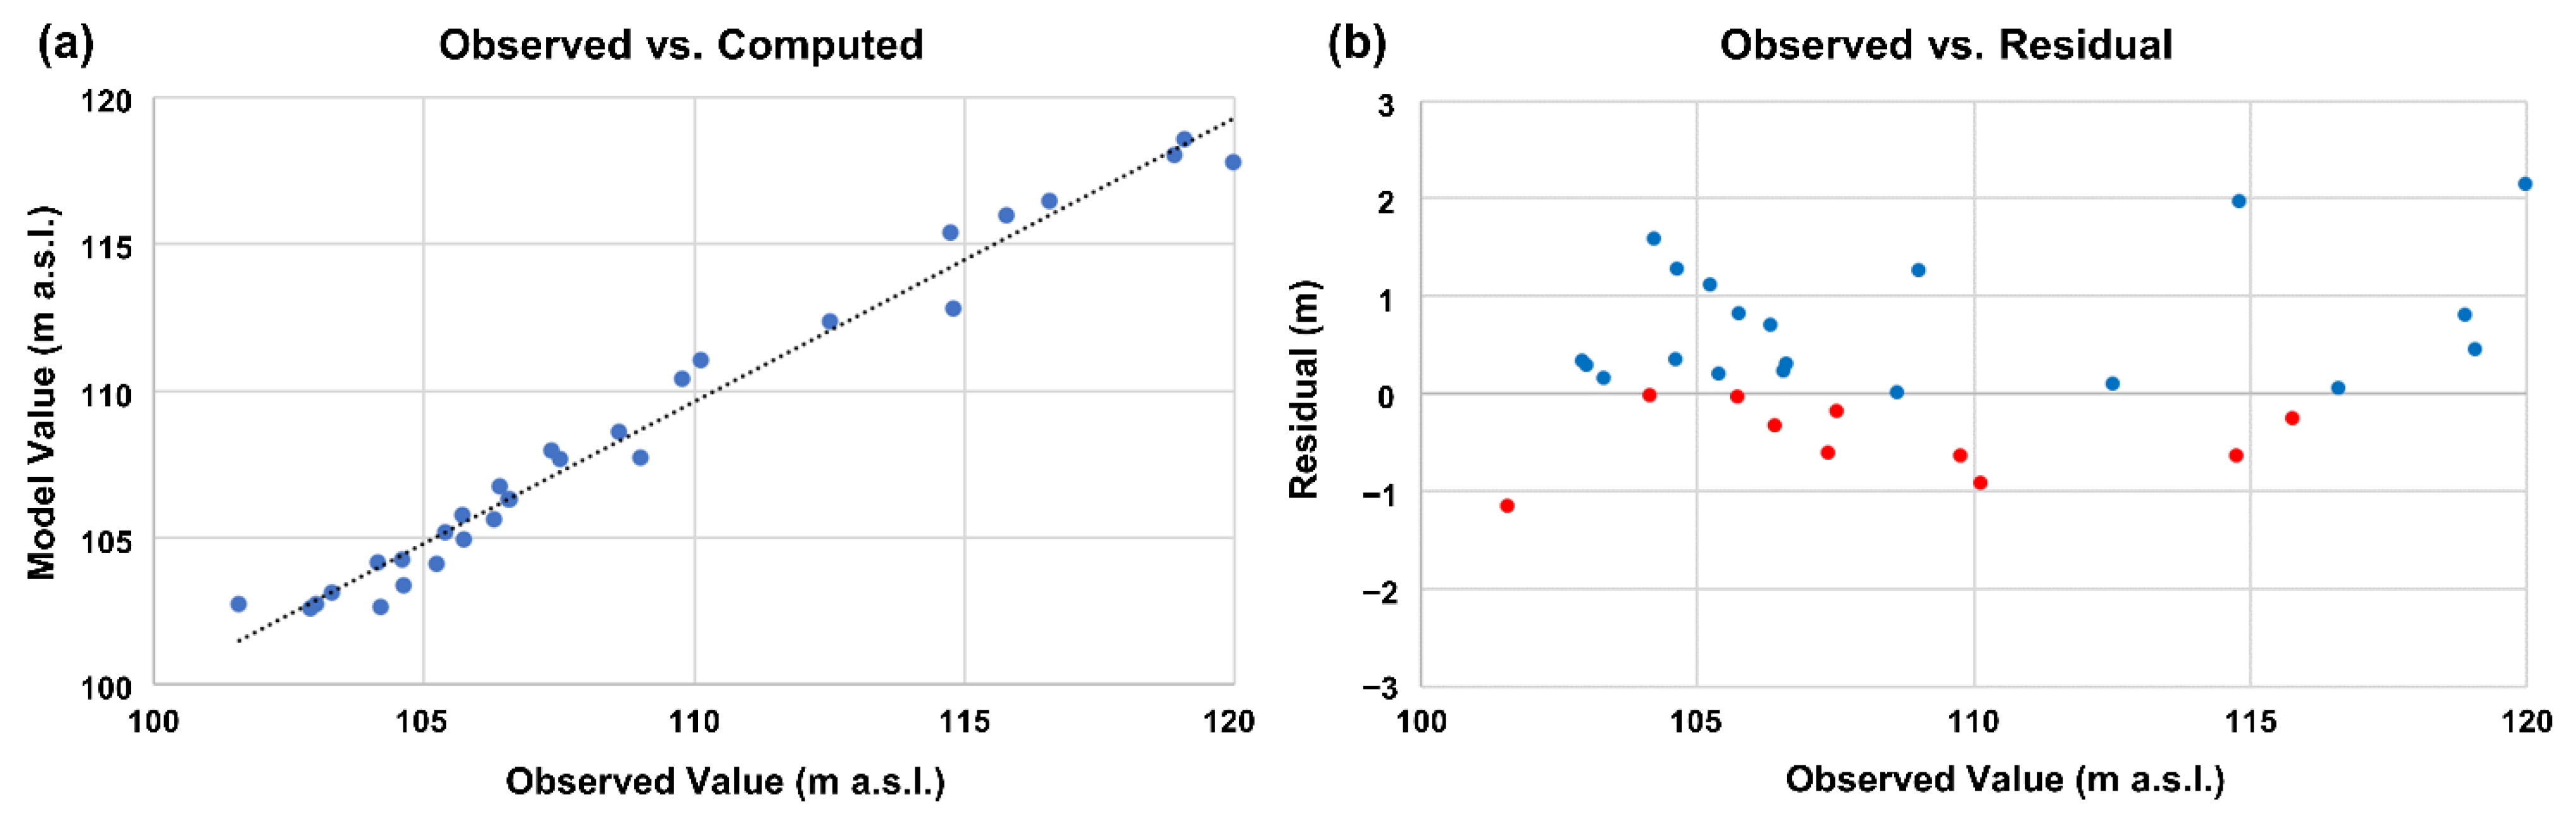
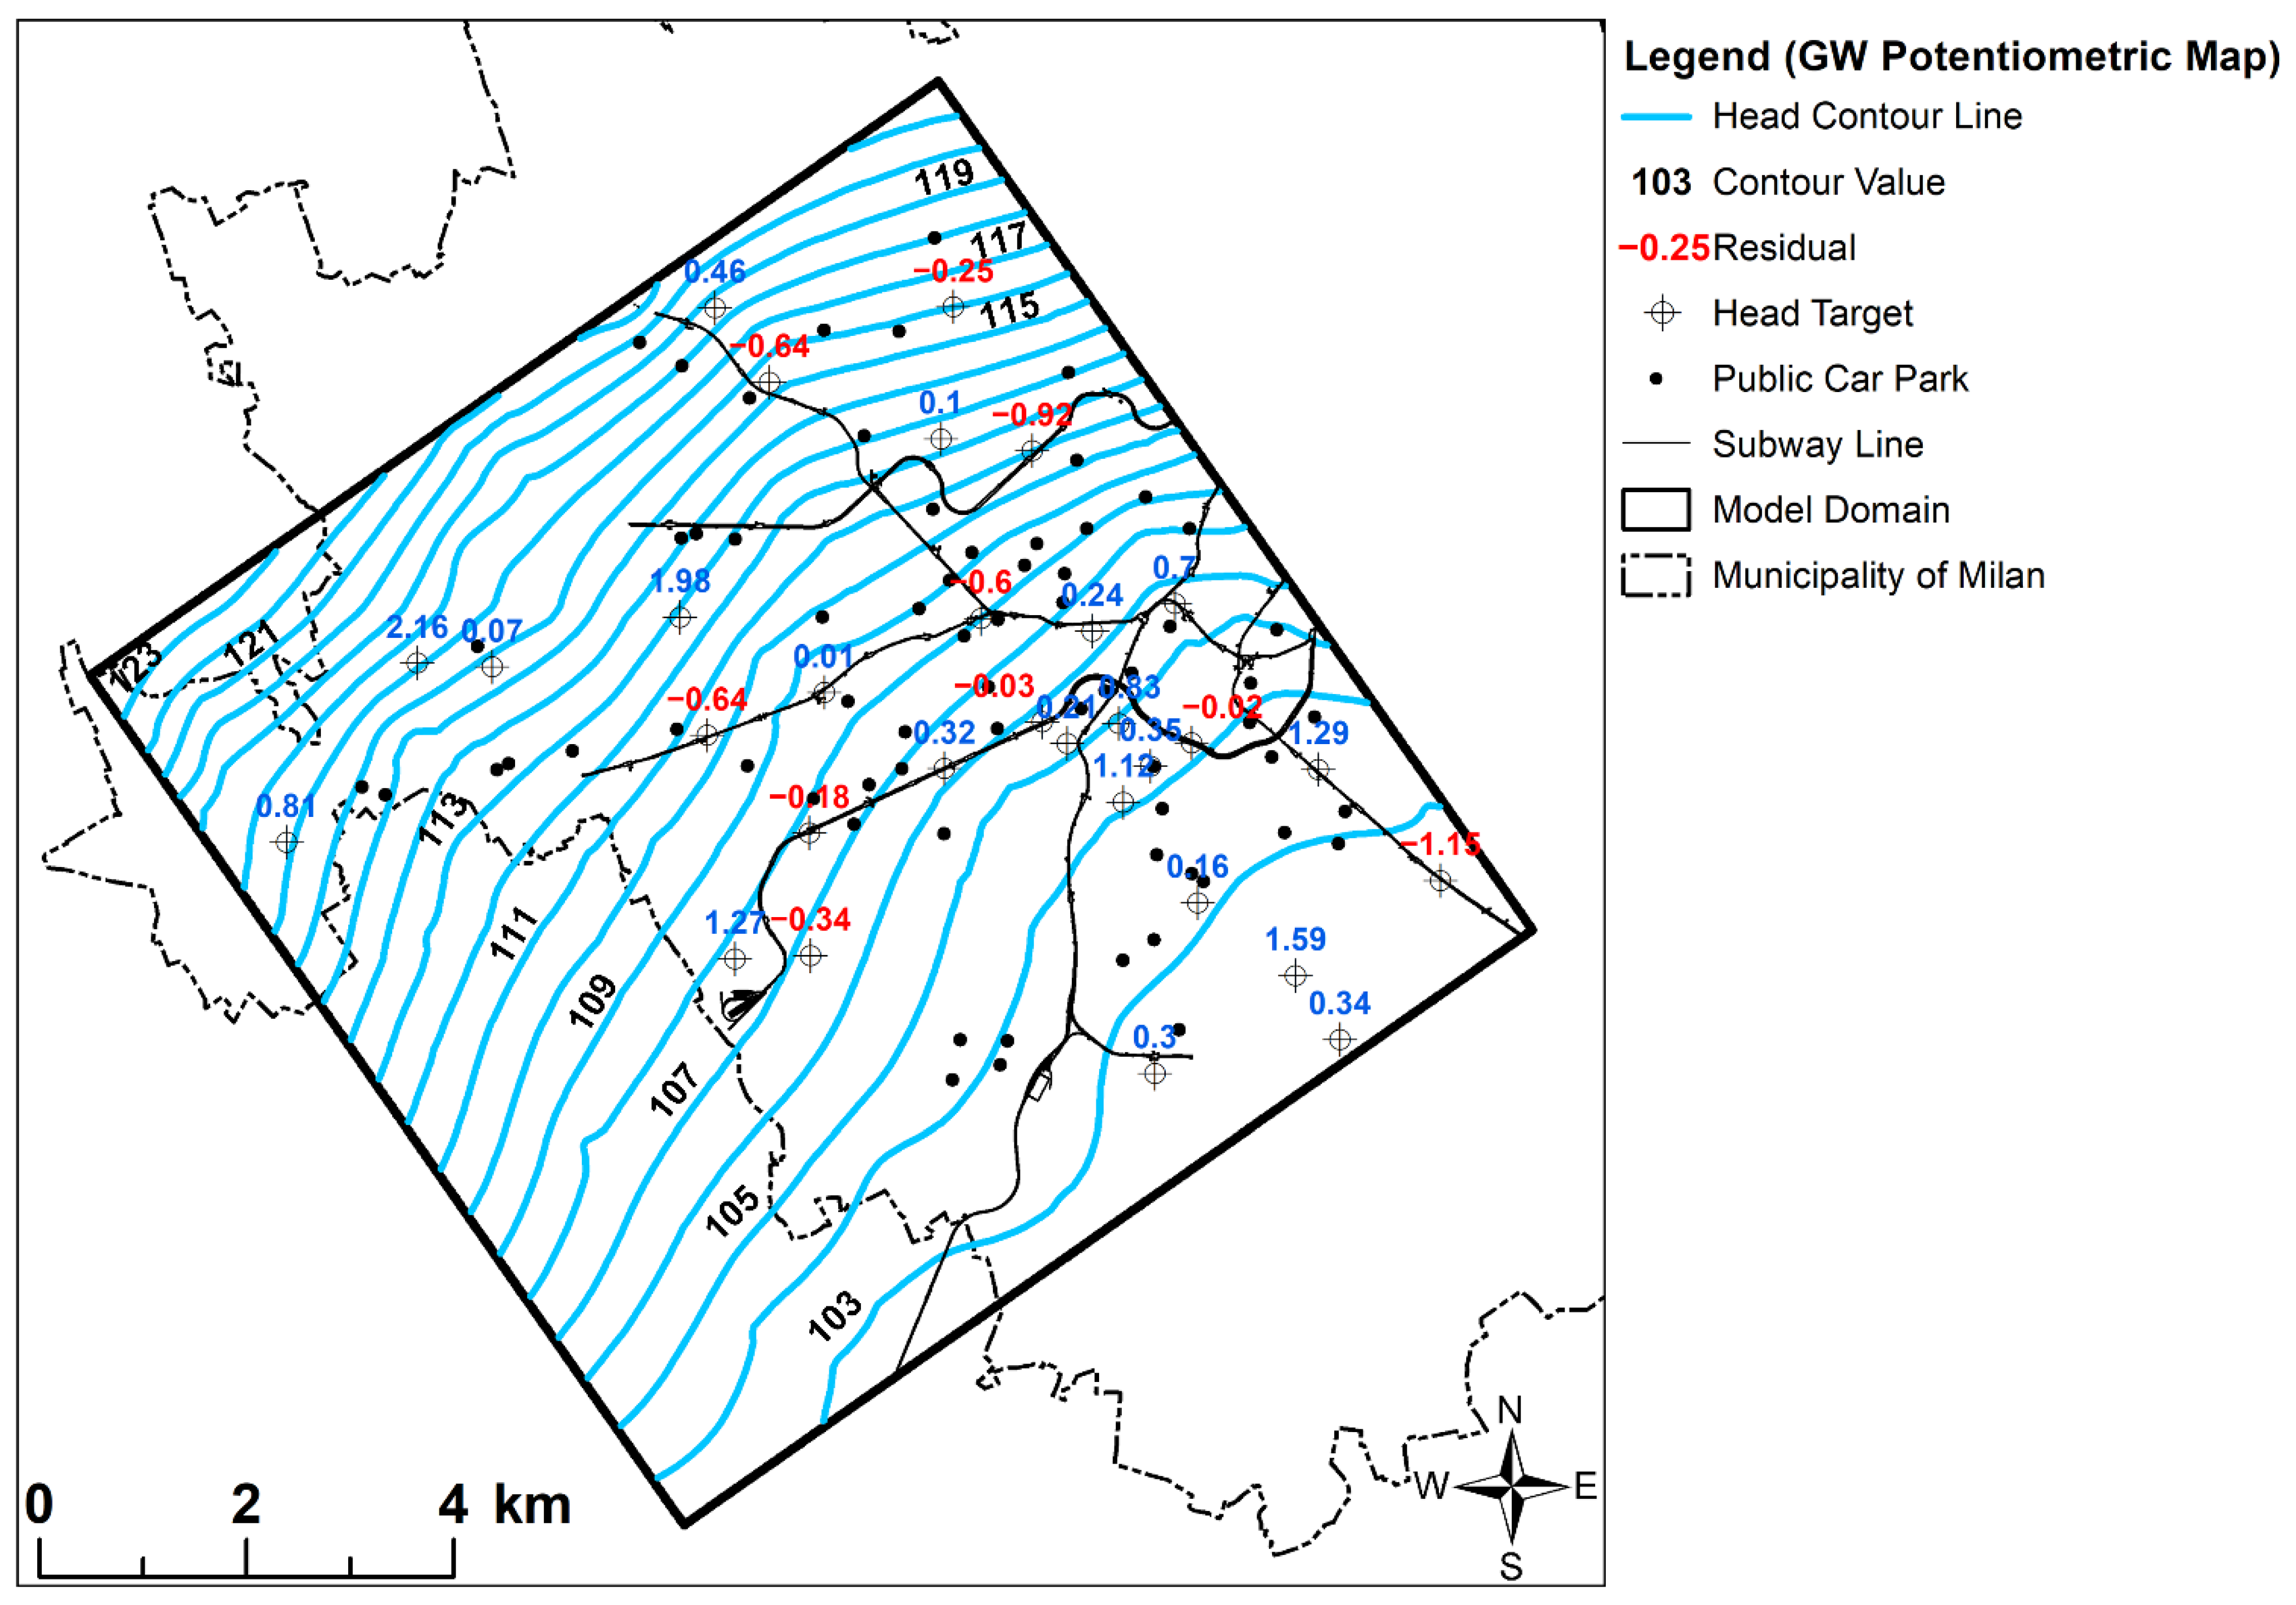
4.1. Model Calibration and Statistics
4.2. Modeling Scenarios
5. Discussion
5.1. Modeling Scenarios
5.2. Considerations of the Adopted Modeling Approach
5.3. Decision Management
6. Conclusions
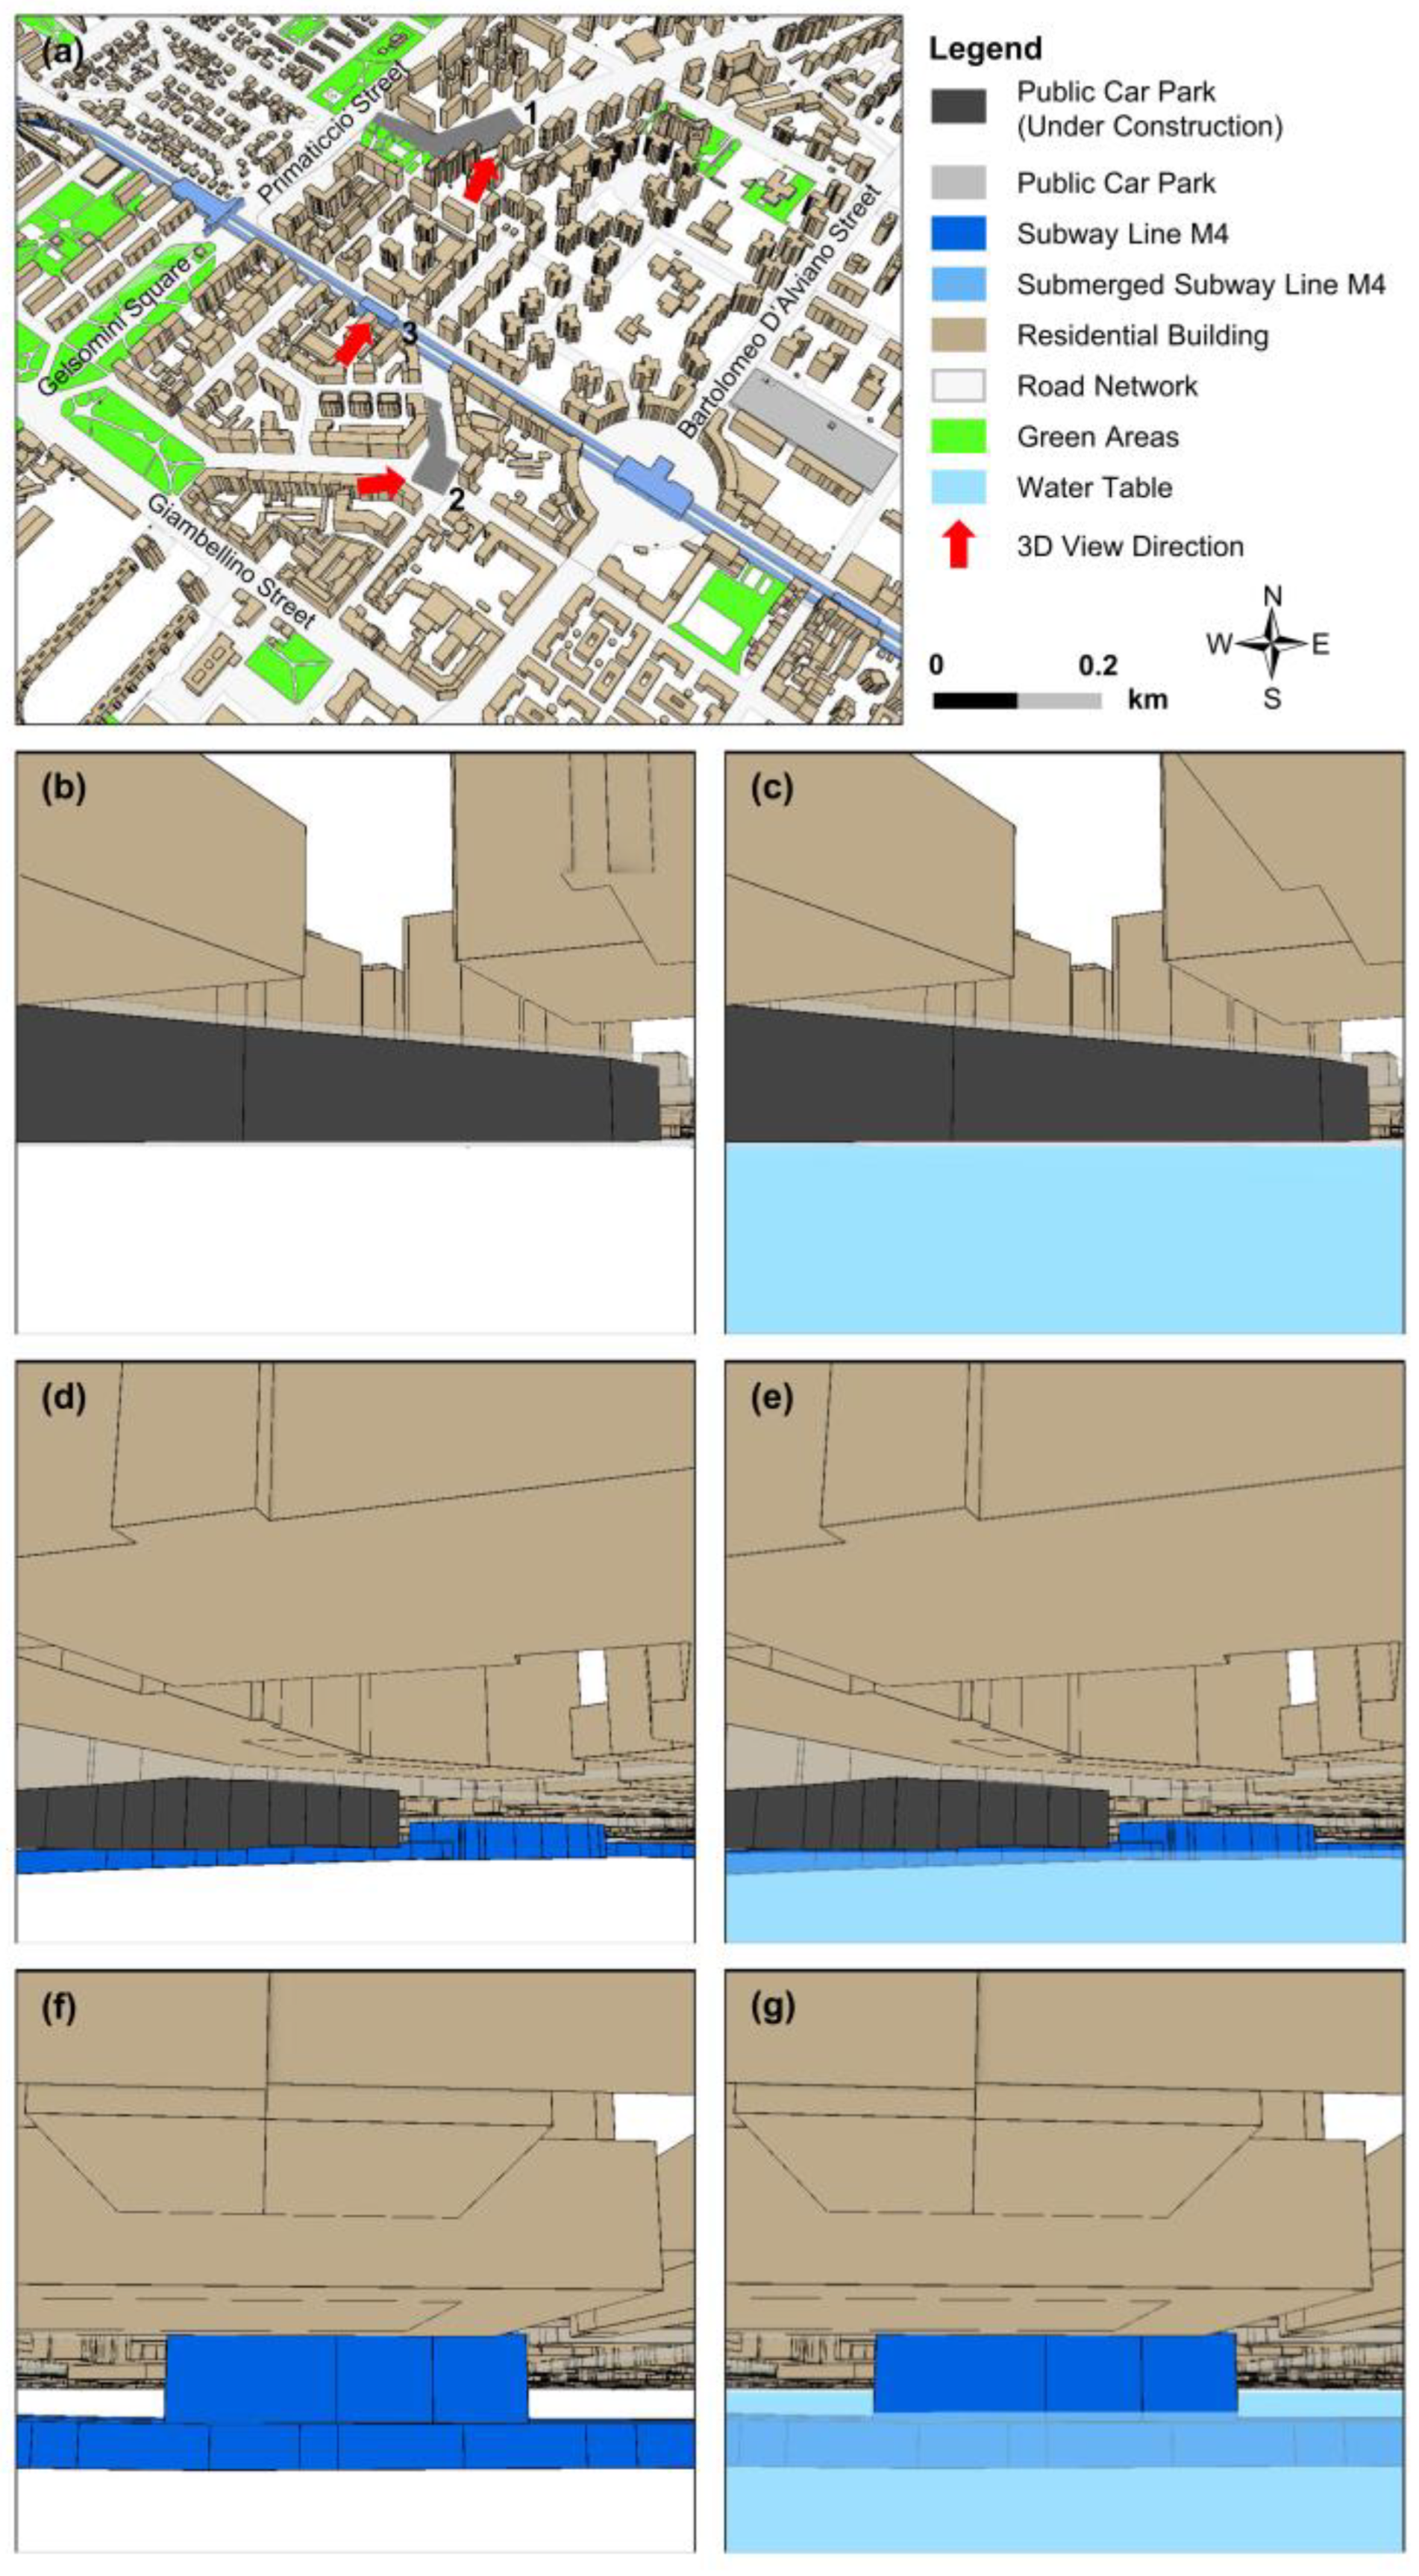
- Verification of the usefulness of the applied methodology to model the UIs, quantifying GW infiltrations through the combination of HFB and DRN packages. In particular, the adoption of MODFLOW-USG allowed the use of the HFB package to model the top and the bottom of the UIs, thus considering the interaction with the water table along the vertical direction as well. The existence of a 3D GDB of the UIs for the city of Milan helped to accurately model the UIs’ depth.
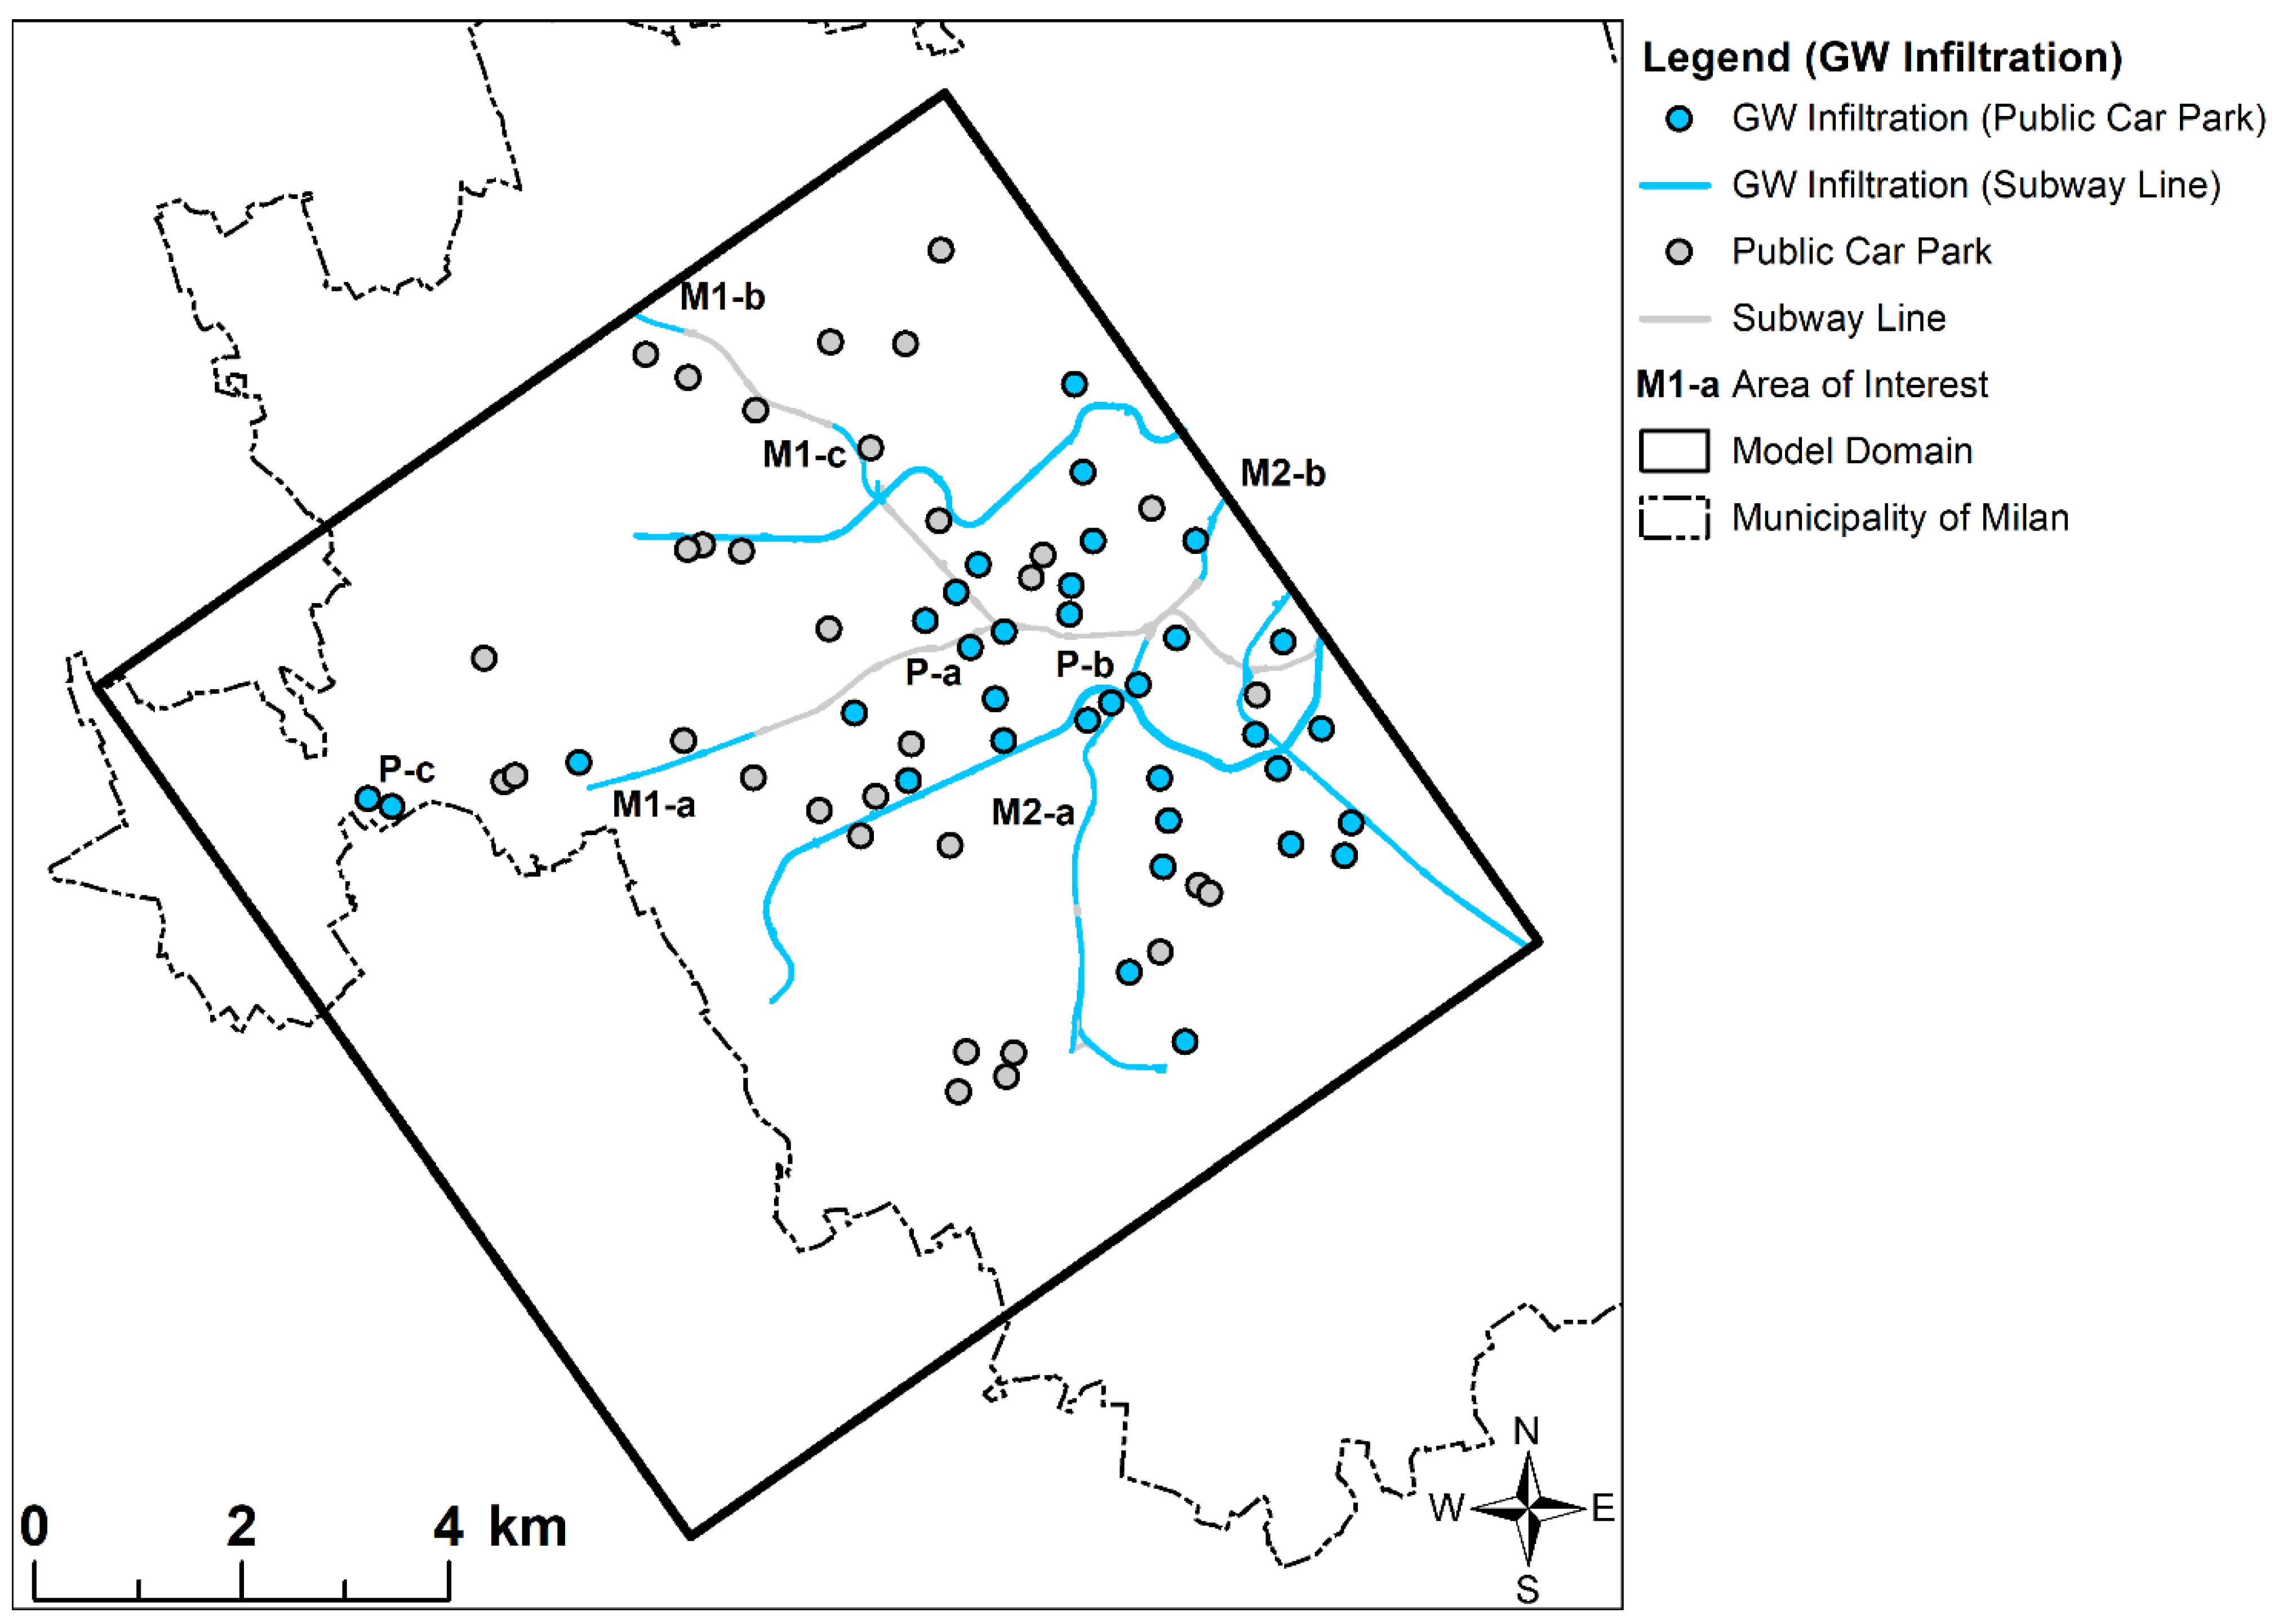
- Identification of the UI sectors more exposed to GW infiltrations under different conductance scenarios (from intact to leaky walls), providing a qualitative and quantitative overview intended for both the municipality decision makers and the subway managing company. The westmost stretch of subway line M1 and the sector around Sant’Agostino station for line M2 were among the most critical areas. Moreover, for the first time, public car parks have been deeply considered in a 3D groundwater flow numerical model for the city of Milan. Groundwater infiltrations were detected both for deep car parks in the central portion of the domain and shallow car parks in the western sectors. This resulted in an improvement of the already-existing urban conceptual model of the area.
- Support for the decision makers in designing possible dewatering systems, also proposing early warning monitoring systems and proactive solutions to secure the UIs from potential groundwater infiltration damages.
Author Contributions
Funding
Acknowledgments
Conflicts of Interest
References
- Vázquez-Suñé, E.; Sánchez-Vila, X.; Carrera, J. Introductory review of specific factors influencing urban groundwater, an emerging branch of hydrogeology, with reference to Barcelona, Spain. Hydrogeol. J. 2005, 13, 522–533. [Google Scholar] [CrossRef]
- Epting, J.; Huggenberger, P.; Rauber, M. Integrated methods and scenario development for urban groundwater management and protection during tunnel road construction: A case study of urban hydrogeology in the city of Basel, Switzerland. Hydrogeol. J. 2008, 16, 575–591. [Google Scholar] [CrossRef]
- Arshad, I.; Umar, R. Status of urban hydrogeology research with emphasis on India. Hydrogeol. J. 2020, 28, 477–490. [Google Scholar] [CrossRef]
- Un-Habitat. State of the World’s Cities 2008/9: Harmonious Cities; Routledge: Oxford, UK, 2012; ISBN 1136556729. [Google Scholar]
- La Vigna, F. Review: Urban groundwater issues and resource management, and their roles in the resilience of cities. Hydrogeol. J. 2022, 30, 1657–1683. [Google Scholar] [CrossRef]
- Schirmer, M.; Leschik, S.; Musolff, A. Current research in urban hydrogeology—A review. Adv. Water Resour. 2013, 51, 280–291. [Google Scholar] [CrossRef]
- Calderhead, A.I.; Martel, R.; Garfias, J.; Rivera, A.; Therrien, R. Pumping dry: An increasing groundwater budget deficit induced by urbanization, industrialization, and climate change in an over-exploited volcanic aquifer. Environ. Earth Sci. 2012, 66, 1753–1767. [Google Scholar] [CrossRef]
- Parriaux, A.; Tacher, L.; Kaufmann, V.; Blunier, P. Underground Resources and Sustainable Development in Urban Areas; The Geological Society of London: London, UK, 2006. [Google Scholar]
- Li, H.; Li, X.; Parriaux, A.; Thalmann, P. An integrated planning concept for the emerging underground urbanism: Deep City Method Part 2 case study for resource supply and project valuation. Tunn. Undergr. Sp. Technol. 2013, 38, 569–580. [Google Scholar] [CrossRef]
- Li, H.-Q.; Parriaux, A.; Thalmann, P.; Li, X.-Z. An integrated planning concept for the emerging underground urbanism: Deep City Method Part 1 concept, process and application. Tunn. Undergr. Sp. Technol. 2013, 38, 559–568. [Google Scholar] [CrossRef]
- Vähäaho, I. An introduction to the development for urban underground space in Helsinki. Tunn. Undergr. Sp. Technol. 2016, 55, 324–328. [Google Scholar] [CrossRef]
- Koziatek, O.; Dragićević, S. iCity 3D: A geosimualtion method and tool for three-dimensional modeling of vertical urban development. Landsc. Urban Plan. 2017, 167, 356–367. [Google Scholar] [CrossRef]
- Bobylev, N. Mainstreaming sustainable development into a city’s Master plan: A case of Urban Underground Space use. Land Use Policy 2009, 26, 1128–1137. [Google Scholar] [CrossRef]
- Attard, G.; Winiarski, T.; Rossier, Y.; Eisenlohr, L. Review: Impact of underground structures on the flow of urban groundwaterRevue: Impact des structures du sous-sol sur les écoulements des eaux souterraines en milieu urbainRevisión: Impacto de las estructuras del subsuelo en el flujo del agua subterránea. Hydrogeol. J. 2015, 24, 5–19. [Google Scholar] [CrossRef]
- Noethen, M.; Hemmerle, H.; Bayer, P. Sources, intensities, and implications of subsurface warming in times of climate change. Crit. Rev. Environ. Sci. Technol. 2022, 1–23. [Google Scholar] [CrossRef]
- Wilkinson, W. Rising groundwater levels in London and possible effects on engineering structures. IAHS-AISH Publ. 1985, 154, 145–157. [Google Scholar]
- Hernández, M.A.; González, N.; Chilton, J. Impact of Rising Piezometric Levels on Greater Buenos Aires Due to Partial Changing of Water Services Infrastructure. 1997. Available online: http://sedici.unlp.edu.ar/handle/10915/26650 (accessed on 10 November 2022).
- Vazquez-sune, E.; Sanchez-vila, X. Groundwater modelling in urban areas as a tool for local authority management: Barcelona case study (Spain). In Impacts of Urban Growth on Surface Water and Groundwater Quality: Proceedings of the International Symposium Held during IUGG 99, the XXII General Assembly of the International Union of Geodesy and Geophysics, Birmingham, UK, 18–30 July 1999; IAHS Press: Wallingford, UK, 1999; Volume 259, pp. 65–72. [Google Scholar]
- Hayashi, T.; Tokunaga, T.; Aichi, M.; Shimada, J.; Taniguchi, M. Effects of human activities and urbanization on groundwater environments: An example from the aquifer system of Tokyo and the surrounding area. Sci. Total Environ. 2009, 407, 3165–3172. [Google Scholar] [CrossRef]
- Lamé, A. Modélisation Hydrogéologique des Aquifères de Paris et Impacts des Aménagements du Sous-Sol sur Les Écoulements Souterrains. Available online: https://theses.hal.science/pastel-00973861/2013 (accessed on 10 November 2022).
- Ducci, D.; Sellerino, M. Groundwater Mass Balance in Urbanized Areas Estimated by a Groundwater Flow Model Based on a 3D Hydrostratigraphical Model: The Case Study of the Eastern Plain of Naples (Italy). Water Resour. Manag. 2015, 29, 4319–4333. [Google Scholar] [CrossRef]
- Colombo, L.; Gattinoni, P.; Scesi, L. Influence of underground structures and infrastructures on the groundwater level in the urban area of Milan, Italy. Int. J. Sustain. Dev. Plan. 2017, 12, 176–184. [Google Scholar] [CrossRef]
- Allocca, V.; Coda, S.; Calcaterra, D.; De Vita, P. Groundwater Rebound and Flooding in the Naples’ Periurban Area (Italy). J. Flood Risk Manag. 2021, 15, e12775. [Google Scholar] [CrossRef]
- El Tani, M. Circular tunnel in a semi-infinite aquifer. Tunn. Undergr. Sp. Technol. 2003, 18, 49–55. [Google Scholar] [CrossRef]
- Butscher, C. Steady-state groundwater inflow into a circular tunnel. Tunn. Undergr. Sp. Technol. 2012, 32, 158–167. [Google Scholar] [CrossRef]
- Hassani, A.N.; Katibeh, H.; Farhadian, H. Numerical analysis of steady-state groundwater inflow into Tabriz line 2 metro tunnel, northwestern Iran, with special consideration of model dimensions. Bull. Eng. Geol. Environ. 2016, 75, 1617–1627. [Google Scholar] [CrossRef]
- Farhadian, H.; Hassani, A.N.; Katibeh, H. Groundwater inflow assessment to Karaj Water Conveyance tunnel, northern Iran. KSCE J. Civ. Eng. 2017, 21, 2429–2438. [Google Scholar] [CrossRef]
- Xia, Q.; Xu, M.; Zhang, H.; Zhang, Q.; Xiao, X. xuan A dynamic modeling approach to simulate groundwater discharges into a tunnel from typical heterogenous geological media during continuing excavation. KSCE J. Civ. Eng. 2018, 22, 341–350. [Google Scholar] [CrossRef]
- Hassani, A.N.; Farhadian, H.; Katibeh, H. A comparative study on evaluation of steady-state groundwater inflow into a circular shallow tunnel. Tunn. Undergr. Sp. Technol. 2018, 73, 15–25. [Google Scholar] [CrossRef]
- Li, X.; Zhang, W.; Li, D.; Wang, Q. Influence of underground water seepage flow on surrounding rock deformation of multi-arch tunnel. J. Cent. South. Univ. Technol. 2008, 15, 69–74. [Google Scholar] [CrossRef]
- Guo, Y.; Wang, H.; Jiang, M. Efficient Iterative Analytical Model for Underground Seepage around Multiple Tunnels in Semi-Infinite Saturated Media. J. Eng. Mech. 2021, 147, 04021101. [Google Scholar] [CrossRef]
- Gao, C.L.; Zhou, Z.Q.; Yang, W.M.; Lin, C.J.; Li, L.P.; Wang, J. Model test and numerical simulation research of water leakage in operating tunnels passing through intersecting faults. Tunn. Undergr. Sp. Technol. 2019, 94, 103134. [Google Scholar] [CrossRef]
- Ai, Q.; Yuan, Y.; Jiang, X.; Wang, H.; Han, C.; Huang, X.; Wang, K. Pathological diagnosis of the seepage of a mountain tunnel. Tunn. Undergr. Sp. Technol. 2022, 128, 104657. [Google Scholar] [CrossRef]
- Golian, M.; Teshnizi, E.S.; Nakhaei, M. Prediction of water inflow to mechanized tunnels during tunnel-boring-machine advance using numerical simulation. Hydrogeol. J. 2018, 26, 2827–2851. [Google Scholar] [CrossRef]
- Zaidel, J.; Markham, B.; Bleiker, D. Simulating seepage into mine shafts and tunnels with MODFLOW. Ground Water 2010, 48, 390–400. [Google Scholar] [CrossRef]
- Lagudu, S.; Rao, V.V.S.G.; Nandan, M.J.; Khokhar, C. Application of MODFLOW for groundwater Seepage Problems in the Subsurface Tunnels. J. Ind. Geophys. Union 2015, 19, 422–432. [Google Scholar]
- Golian, M.; Abolghasemi, M.; Hosseini, A.; Abbasi, M. Restoring groundwater levels after tunneling: A numerical simulation approach to tunnel sealing decision-making. Hydrogeol. J. 2021, 29, 1611–1628. [Google Scholar] [CrossRef]
- Abd-Elaty, I.; Pugliese, L.; Straface, S. Inclined Physical Subsurface Barriers for Saltwater Intrusion Management in Coastal Aquifers. Water Resour. Manag. 2022, 36, 2973–2987. [Google Scholar] [CrossRef]
- Abd-Elaty, I.; Zelenakova, M. Saltwater intrusion management in shallow and deep coastal aquifers for high aridity regions. J. Hydrol. Reg. Stud. 2022, 40, 101026. [Google Scholar] [CrossRef]
- Chaussard, E.; Bürgmann, R.; Shirzaei, M.; Fielding, E.J.; Baker, B. Predictability of hydraulic head changes and characterization of aquifer-system and fault properties from InSAR-derived ground deformation. J. Geophys. Res. Solid Earth 2014, 119, 6572–6590. [Google Scholar] [CrossRef]
- Medici, G.; Smeraglia, L.; Torabi, A.; Botter, C. Review of Modeling Approaches to Groundwater Flow in Deformed Carbonate Aquifers. Groundwater 2021, 59, 334–351. [Google Scholar] [CrossRef]
- Bonomi, T.; Sartirana, D.; Toscani, L.; Stefania, G.A.; Zanotti, C.; Rotiroti, M.; Redaelli, A.; Fumagalli, L. Modeling groundwater/surface-water interactions and their effects on hydraulic barriers, the case of the industrial area of Mantua (Italy). Acque Sotter.-Ital. J. Groundw. 2022, 11, 43–55. [Google Scholar] [CrossRef]
- Bonomi, T.; Bellini, R. The tunnel impact on the groundwater level in an urban area: A modelling approach to forecast it. RMZ-Mater. Geoenviron. 2003, 50, 45–48. [Google Scholar]
- Boukhemacha, M.A.; Gogu, C.R.; Serpescu, I.; Gaitanaru, D.; Bica, I. A hydrogeological conceptual approach to study urban groundwater flow in Bucharest city, Romania. Hydrogeol. J. 2015, 23, 437–450. [Google Scholar] [CrossRef]
- Di Salvo, C.; Mancini, M.; Cavinato, G.P.; Moscatelli, M.; Simionato, M.; Stigliano, F.; Rea, R.; Rodi, A. A 3d geological model as a base for the development of a conceptual groundwater scheme in the area of the colosseum (Rome, Italy). Geosciences 2020, 10, 266. [Google Scholar] [CrossRef]
- Sartirana, D.; Rotiroti, M.; Zanotti, C.; Bonomi, T.; Fumagalli, L.; De Amicis, M. A 3D geodatabase for urban underground infrastructures: Implementation and application to groundwater management in Milan metropolitan area. ISPRS Int. J. Geo-Inf. 2020, 9, 609. [Google Scholar] [CrossRef]
- Parriaux, A.; Blunier, P.; Maire, P.; Tacher, L. The DEEP CITY Project: A Global Concept for a Sustainable Urban Underground Management. In Proceedings of the 11th ACUUS International Conference, Underground Space: Expanding the Frontiers, Athens, Greece, 10–13 September 2007; pp. 255–260. [Google Scholar]
- Delmastro, C.; Lavagno, E.; Schranz, L. Underground urbanism: Master Plans and Sectorial Plans. Tunn. Undergr. Sp. Technol. 2016, 55, 103–111. [Google Scholar] [CrossRef]
- Moghadam, S.T.; Delmastro, C.; Lombardi, P.; Corgnati, S.P. Towards a New Integrated Spatial Decision Support System in Urban Context. Procedia-Soc. Behav. Sci. 2016, 223, 974–981. [Google Scholar] [CrossRef]
- Panday, S.; Langevin, C.D.; Niswonger, R.G.; Ibaraki, M.; Hughes, J.D. MODFLOW–USG Version 1: An Unstructured Grid Version of MODFLOW for Simulating Groundwater Flow and Tightly Coupled Processes Using a Control Volume Finite-Difference Formulation; US Geological Survey: Reston, VA, USA, 2013; p. 66. [Google Scholar]
- Sartirana, D.; Rotiroti, M.; Bonomi, T.; De Amicis, M.; Nava, V.; Fumagalli, L.; Zanotti, C. Data-driven decision management of urban underground infrastructure through groundwater-level time-series cluster analysis: The case of Milan (Italy). Hydrogeol. J. 2022, 30, 1157–1177. [Google Scholar] [CrossRef]
- Bonomi, T.; Fumagalli, L.; Dotti, N. Fenomeno di inquinamento da solventi in acque sotterranee sfruttate ad uso potabile nel nord-ovest della provincia di Milano. Eng. Hydro Environ. Geol. 2009, 12, 43–59. [Google Scholar]
- Pulighe, G.; Lupia, F. Multitemporal geospatial evaluation of urban agriculture and (non)-sustainable food self-provisioning in Milan, Italy. Sustainability 2019, 11, 1846. [Google Scholar] [CrossRef] [Green Version]
- Istat. L’italia Del Censimento. Struttura Demografica e Processo di Rilevazione, Lombardia; Istat: Rome, Italy, 2011. [Google Scholar]
- Boscacci, F.; Camagni, R.; Caragliu, A.; Maltese, I.; Mariotti, I. Collective benefits of an urban transformation: Restoring the Navigli in Milan. Cities 2017, 71, 11–18. [Google Scholar] [CrossRef]
- Regione Lombardia & ENI Divisione AGIP. Geologia Degli Acquiferi Padani Della Regione Lombardia; Cipriano Carcano, A.P., Ed.; S.EL.CA: Florence, Italy, 2002. [Google Scholar]
- Regione Lombardia. Regione Lombardia Piano di Tutela ed Uso delle Acque (PTUA) 2016; Regione Lombardia: Milano, Italy, 2016. [Google Scholar]
- Bonomi, T.; Cavallin, A.; De Amicis, M.; Rizzi, S.; Tizzone, R.; Trefiletti, P. Evoluzione della dinamica piezometrica nell’area milanese in funzione di alcuni aspetti socio-economici. In Proceedings of the Atti Della Giornata Mondiale dell’Acqua Acque Sotterranee: Risorsa Invisibile, Rome, Italy, 23 March 1998; pp. 9–17. [Google Scholar]
- Bonomi, T. Groundwater Level Evolution in the Milan Area: Natural and Human Issues; IAHS-AISH Publication: Brunswick, ME, USA, 1999; pp. 195–202. [Google Scholar]
- Gattinoni, P.; Scesi, L. The groundwater rise in the urban area of Milan (Italy) and its interactions with underground structures and infrastructures. Tunn. Undergr. Sp. Technol. 2017, 62, 103–114. [Google Scholar] [CrossRef]
- De Caro, M.; Crosta, G.B.; Previati, A. Modelling the interference of underground structures with groundwater flow and remedial solutions in Milan. Eng. Geol. 2020, 272, 105652. [Google Scholar] [CrossRef]
- García-Gil, A.; Epting, J.; Ayora, C.; Garrido, E.; Vázquez-Suñé, E.; Huggenberger, P.; Gimenez, A.C. A reactive transport model for the quantification of risks induced by groundwater heat pump systems in urban aquifers. J. Hydrol. 2016, 542, 719–730. [Google Scholar] [CrossRef]
- Milan Metropolitan City. Documento di Piano Milano 2030 Visione, Costruzione, Strategie, Spazi; Milan Metropolitan City: Milano, Italy, 2019. [Google Scholar]
- Regione Lombardia Open Data Regione Lombardia. 2021. Available online: https://dati.lombardia.it/ (accessed on 15 December 2021).
- Rumbaugh, J.; Rumbaugh, O. Groundwater Vistas Version 7.24, Build 211; Environment Simulations Inc.: Reinholds, PA, USA, 2020. [Google Scholar]
- Beretta, G.P.; Avanzini, M.; Pagotto, A. Managing groundwater rise: Experimental results and modelling of water pumping from a quarry lake in Milan urban area (Italy). Environ. Geol. 2004, 45, 600–608. [Google Scholar] [CrossRef]
- Regione Lombardia Geoportal of the Lombardy Region, Italy. 2021. Available online: http://www.geoportale.regione.lombardia.it/ (accessed on 1 December 2021).
- ARPA Lombardia Agenzia Regionale per la Protezione dell’Ambiente [Regional Environmental Monitoring Agency]. 2021. Available online: https://www.arpalombardia.it/ (accessed on 13 November 2021).
- Hsieh, P.A.; Freckleton, J.R. Documentation of a Computer Program to Simulate Horizontal-Flow Barriers Using the U.S. Geological Survey’s Modular Three-Dimensional Finite-Difference Ground-Water Flow Model; US Geological Survey: Reston, VA, USA, 1993. [Google Scholar]
- Harbaugh, A.W. MODFLOW-2005, the US Geological Survey Modular Ground-Water Model: The Ground-Water Flow Process; US Department of the Interior, US Geological Survey: Reston, VA, USA, 2005. [Google Scholar]
- Harbaugh, A.W. A Computer Program for Calculating Subregional Water Budgets Using Results from the U.S. Geological Survey Modular Three-Dimensional Finite-Difference Ground-Water Flow Model. 1990. Available online: https://pubs.er.usgs.gov/publication/ofr90392 (accessed on 10 November 2022).
- Toscani, L.; Stefania, G.A.; Masut, E.; Prieto, M.; Legnani, A.; Gigliuto, A.; Ferioli, L.; Battaglia, A. Groundwater flow numerical model to evaluate the water mass balance and flow patterns in Groundwater Circulation Wells (GCW) with varying aquifer parameters. Acque Sotter.-Ital. J. Groundw. 2022. [Google Scholar] [CrossRef]
- Bonomi, T.; Del Rosso, F.; Fumagalli, L.; Canepa, P. Assessment of groundwater availability in the Milan Province aquifers. Mem. Descr. Della Cart. Geol. D’italia 2010, 90, 31–40. [Google Scholar]
- Bonomi, T.; Fumagalli, L.; Rotiroti, M.; Bellani, A.; Cavallin, A. The hydrogeological well database TANGRAM©: A tool for data processing to support groundwater assessment. Acque Sotter.-Ital. J. Groundw. 2014, 3, 98. [Google Scholar] [CrossRef]
- Paradigm Paradigm GOCAD 2009.1 User Guide; Paradigm: Houston, TX, USA, 2009. Available online: https://www.scribd.com/document/475499865/01-Getting-Started# (accessed on 10 November 2022).
- Airoldi, R.; Casati, P. Le Falde Idriche del Sottosuolo di Milano; Comune di Milano: Rome, Italy, 1989. [Google Scholar]
- Dassargues, A. Groundwater modelling to predict the impact of tunnel on the behavior of water table aquiefer in urban condition. In Proceedings of the XXVII IAH Congress: Groundwater in the Urban Environment, Balkema, Nottingham, UK, 21–27 September 1997; pp. 225–230. [Google Scholar]
- Attard, G.; Cuvillier, L.; Eisenlohr, L.; Rossier, Y.; Winiarski, T. Deterministic modelling of the cumulative impacts of underground structures on urban groundwater flow and the definition of a potential state of urban groundwater flow: Example of Lyon, FranceModélisation déterministe des impacts cumulés des structures so. Hydrogeol. J. 2016, 24, 1213–1229. [Google Scholar] [CrossRef]
- Wang, X.; Lei, Q.; Lonergan, L.; Jourde, H.; Gosselin, O.; Cosgrove, J. Heterogeneous fluid flow in fractured layered carbonates and its implication for generation of incipient karst. Adv. Water Resour. 2017, 107, 502–516. [Google Scholar] [CrossRef] [Green Version]
- Huang, Z.; Zhao, K.; Li, X.; Zhong, W.; Wu, Y. Numerical characterization of groundwater flow and fracture-induced water inrush in tunnels. Tunn. Undergr. Sp. Technol. 2021, 116, 104119. [Google Scholar] [CrossRef]
- Middlemis, H.; Merrick, N.; Ross, J.B. Groundwater Flow Modelling Guideline; Prepared for Murray-Darling Basin; Aquaterra Consulting Pty Ltd.: West Palm Beach, FL, USA, 2000; Project No. 125. [Google Scholar]
- Feinstein, D.T.; Hunt, R.J.; Reeves, H.W. Regional Groundwater-Flow Model of the Lake Michigan Basin in Support of Great Lakes Basin Water Availability and Use Studies; U. S. Geological Survey: Reston, VA, USA, 2010. [Google Scholar]
- Colombo, A. Milano e l’innalzamento della falda. Cave e Cantieri 1999, 2, 26–36. [Google Scholar]
- Bredehoeft, J. The conceptualization model problem-Surprise. Hydrogeol. J. 2005, 13, 37–46. [Google Scholar] [CrossRef]
- Lotti, F.; Borsi, I.; Guastaldi, E.; Barbagli, A.; Basile, P.; Favaro, L.; Mallia, A.; Xuereb, R.; Schembri, M.; Mamo, J.A.; et al. Numerically enhanced conceptual modelling (NECoM) applied to the Malta Mean Sea Level Aquifer. Hydrogeol. J. 2021, 29, 1517–1537. [Google Scholar] [CrossRef]
- Shi, S.; Xie, X.; Bu, L.; Li, L.; Zhou, Z. Hazard-based evaluation model of water inrush disaster sources in karst tunnels and its engineering application. Environ. Earth Sci. 2018, 77, 1–13. [Google Scholar] [CrossRef]
- Wang, X.; Li, S.; Xu, Z.; Li, X.; Lin, P.; Lin, C. An interval risk assessment method and management of water inflow and inrush in course of karst tunnel excavation. Tunn. Undergr. Sp. Technol. 2019, 92, 103033. [Google Scholar] [CrossRef]
- Bobylev, N. Transitions to a High Density Urban Underground Space. Procedia Eng. 2016, 165, 184–192. [Google Scholar] [CrossRef]
- Ferré, T.P.A. Revisiting the Relationship Between Data, Models, and Decision-Making. Groundwater 2017, 55, 604–614. [Google Scholar] [CrossRef] [PubMed]
- Wu, J.S.; Lee, J.J. Climate change games as tools for education and engagement. Nat. Clim. Chang. 2015, 5, 413–418. [Google Scholar] [CrossRef]
- Castilla-Rho, J.C. Groundwater Modeling with Stakeholders: Finding the Complexity that Matters First Things First: We Are Dealing. Groundwater 2017, 55, 620–625. [Google Scholar] [CrossRef] [PubMed]
- Colombo, L.; Gattinoni, P.; Scesi, L. Stochastic modelling of groundwater flow for hazard assessment along the underground infrastructures in Milan (northern Italy). Tunn. Undergr. Sp. Technol. 2018, 79, 110–120. [Google Scholar] [CrossRef]
- Previati, A.; Epting, J.; Crosta, G.B. The subsurface urban heat island in Milan (Italy)-A modeling approach covering present and future thermal effects on groundwater regimes. Sci. Total Environ. 2022, 810, 152119. [Google Scholar] [CrossRef]
- Attard, G.; Rossier, Y.; Winiarski, T.; Eisenlohr, L. Urban underground development confronted by the challenges of groundwater resources: Guidelines dedicated to the construction of underground structures in urban aquifers. Land Use Policy 2017, 64, 461–469. [Google Scholar] [CrossRef]
- Naranjo, R.C. Knowing Requires Data. Groundwater 2017, 55, 674–677. [Google Scholar] [CrossRef]
- Liu, J.Q.; Sun, Y.K.; Li, C.J.; Yuan, H.L.; Chen, W.Z.; Liu, X.Y.; Zhou, X.S. Field monitoring and numerical analysis of tunnel water inrush and the environmental changes. Tunn. Undergr. Sp. Technol. 2022, 122, 104360. [Google Scholar] [CrossRef]
- Blunier, P.; Tacher, L.; Parriaux, A. Systemic approach of urban underground resources exploitation. In Proceedings of the 11th ACUUS Conference, Athens, Greece, 10–13 September 2007; pp. 43–48. [Google Scholar]
- Admiraal, H.; Cornaro, A. Engaging decision makers for an urban underground future. Tunn. Undergr. Sp. Technol. 2016, 55, 221–223. [Google Scholar] [CrossRef]
- Di Salvo, C.; Ciotoli, G.; Pennica, F.; Cavinato, G.P. Pluvial flood hazard in the city of Rome (Italy). J. Maps 2017, 13, 545–553. [Google Scholar] [CrossRef] [Green Version]
- Peeters, L.J.M. Assumption Hunting in Groundwater Modeling: Find Assumptions Before They Find You. Groundwater 2017, 55, 665–669. [Google Scholar] [CrossRef] [PubMed]
- Carneiro, J.; Carvalho, J.M. Groundwater modelling as an urban planning tool: Issues raised by a small-scale model. Q. J. Eng. Geol. Hydrogeol. 2010, 43, 157–170. [Google Scholar] [CrossRef]
- Lyu, H.M.; Shen, S.L.; Zhou, A.; Yang, J. Perspectives for flood risk assessment and management for mega-city metro system. Tunn. Undergr. Sp. Technol. 2019, 84, 31–44. [Google Scholar] [CrossRef]
- Du, H.; Du, J.; Huang, S. GIS, GPS, and BIM-based risk control of subway station construction. In Proceedings of the ICTE 2015, the Fifth International Conference on Transportation Engineering, Dalian, China, 26–27 September 2015; pp. 1478–1485. [Google Scholar]
- Bayer, P.; Attard, G.; Blum, P.; Menberg, K. The geothermal potential of cities. Renew. Sustain. Energy Rev. 2019, 106, 17–30. [Google Scholar] [CrossRef]


| UI | Waterproofed | Initial Conductance (m²/d) (S1-S2-S3) | Fractures Conductance (m²/d) (S4-S5-S6) |
|---|---|---|---|
| M1 | No | 1.16 × 10⁻¹¹/10−10/10−9 | 1.16 × 10⁻⁷/10−6/10−5 |
| M2 | No | 1.16 × 10⁻¹¹/10−10/10−9 | 1.16 × 10⁻⁷/10−6/10−5 |
| M3 | Yes | 1.16 × 10⁻¹³ | 1.16 × 10⁻¹³ |
| M4 | Yes | 1.16 × 10⁻¹³ | 1.16 × 10⁻¹³ |
| M5 | Yes | 1.16 × 10⁻¹³ | 1.16 × 10⁻¹³ |
| Car Parks | --- | 1.16 × 10⁻¹³ | 1.16 × 10⁻⁹ |
| Statistical Parameter | Target Value |
|---|---|
| Absolute Residual Mean | 0.32 |
| Residual Sum of Squares (RSS) | 21.8 |
| RMSE | 0.85 |
| Minimum Residual | −1.15 |
| Maximum Residual | 2.16 |
| Range of Observations | 18.39 |
| Scaled RMSE (nRMSE) | 0.046 |
| Mass Balance | Inflow (m³/d) | Outflow (m³/d) | % Error |
|---|---|---|---|
| GHB | 419,633.07 | 72,039.06 | |
| Wells | 115,743.33 | 515,438.32 | |
| Drain | --- | 2.93 × 10⁻⁵ | |
| Recharge | 52,101.25 | --- | |
| Total | 587,477.65 | 587,477.38 | 4.59 × 10⁻⁵ |
| UI Category | Amount of Infiltration (m³/d) | % Below the Water Table | ||
|---|---|---|---|---|
| S1 (K = 1.16 × 10⁻¹¹ m/d) | S2 (K = 1.16 × 10⁻¹⁰ m/d) | S3 (K = 1.16 × 10⁻⁹ m/d) | ||
| M1 | 3.70 × 10⁻⁶ | 5.83 × 10⁻⁵ | 4.23 × 10⁻⁴ | 8.37 |
| M2 | 2.00 × 10⁻⁵ | 2.34 × 10⁻⁴ | 2.27 × 10⁻³ | 71.38 |
| S1–S3 (K = 1.16 × 10⁻¹³ m/d) | ||||
| M3 | 6.24 × 10⁻⁷ | 100 | ||
| M4 | 1.94 × 10⁻⁶ | 100 | ||
| M5 | 2.70 × 10⁻⁶ | 100 | ||
| Car Parks | 3.00 × 10⁻⁷ | 50.75 | ||
| Type | Name | Thickness/ Depth (m) | Volume × 10 (m³) | Amount of Infiltration (m³/d) (S1–S4) | Amount of Infiltration (m³/d) (S2–S5) | Amount of Infiltration (m³/d) (S3–S6) |
|---|---|---|---|---|---|---|
| S | Bisceglie (M1-a) | 11.93 | 33.49 | 1.13 × 10⁻⁷/ 4.35 × 10⁻⁶ | 1.12 × 10⁻⁶/ 4.35 × 10⁻⁵ | 2.04 × 10⁻⁴/ 4.35 × 10⁻⁴ |
| T | Bisceglie—Inganni (M1-a) | 6.5 | 42.88 | 2.04 × 10⁻⁶/ 2.71 × 10⁻⁵ | 2.04 × 10⁻⁵/ 2.71 × 10⁻⁴ | 4.30 × 10⁻⁵/ 2.71 × 10⁻³ |
| S | Inganni (M1-a) | 10.92 | 26.77 | 3.98 × 10⁻⁷/ 1.14 × 10⁻⁵ | 3.98 × 10⁻⁶/ 1.15 × 10⁻⁴ | 1.20 × 10⁻⁴/ 1.15 × 10⁻³ |
| T | Bonola—Uruguay (M1-b) | 6.5 | 42.81 | 1.75 × 10⁻⁷/ 4.05 × 10⁻⁶ | 2.43 × 10⁻⁶/ 4.50 × 10⁻⁵ | 1.81 × 10⁻⁵/ 3.94 × 10⁻⁴ |
| T | QT8—Lotto (M1-c) | 6.5 | 71.89 | 9.92 × 10⁻⁷/ 1.06 × 10⁻⁶ | 9.34 × 10⁻⁶/ 1.77 × 10⁻⁵ | 9.34 × 10⁻⁵/ 1.17 × 10⁻⁴ |
| T | Romolo—Porta Genova (M2-a) | 7 | 55.77 | 5.67 × 10⁻⁶/ 2.37 × 10⁻⁵ | 5.67 × 10⁻⁵/ 2.37 × 10⁻⁴ | 5.33 × 10⁻⁴/ 2.71 × 10⁻³ |
| T | Porta Genova—Sant’Agostino (M2-a) | 7 | 37.05 | 5.34 × 10⁻⁶/ 5.86 × 10⁻⁵ | 5.34 × 10⁻⁵/ 5.86 × 10⁻⁴ | 8.04 × 10⁻⁵/ 5.86 × 10⁻³ |
| S | Sant’Agostino (M2-a) | 17.35 | 23.77 | 8.24 × 10⁻⁷/ 5.29 × 10⁻⁵ | 8.24 × 10⁻⁶/ 5.29 × 10⁻⁴ | 2.64 × 10⁻⁴/ 5.29 × 10⁻³ |
| T | Lanza—Moscova (M2-b) | 7 | 36.41 | 1.03 × 10⁻⁶/ 6.03 × 10⁻⁶ | 1.03 × 10⁻⁵/ 6.03 × 10⁻⁵ | 2.84 × 10⁻⁵/ 6.02 × 10⁻⁴ |
| P | Washington/ Piemonte | 20 | 60.38 | 1.72 × 10⁻⁸/1.49 × 10−6 | ||
| P | Carducci Olona | 17 | 58.14 | 1.32 × 10⁻⁸/4.82 × 10−7 | ||
| P | Betulle Est | 5 | 23.02 | 2.56 × 10⁻⁹/3.04 × 10−7 | ||
Publisher’s Note: MDPI stays neutral with regard to jurisdictional claims in published maps and institutional affiliations. |
© 2022 by the authors. Licensee MDPI, Basel, Switzerland. This article is an open access article distributed under the terms and conditions of the Creative Commons Attribution (CC BY) license (https://creativecommons.org/licenses/by/4.0/).
Share and Cite
Sartirana, D.; Zanotti, C.; Rotiroti, M.; De Amicis, M.; Caschetto, M.; Redaelli, A.; Fumagalli, L.; Bonomi, T. Quantifying Groundwater Infiltrations into Subway Lines and Underground Car Parks Using MODFLOW-USG. Water 2022, 14, 4130. https://doi.org/10.3390/w14244130
Sartirana D, Zanotti C, Rotiroti M, De Amicis M, Caschetto M, Redaelli A, Fumagalli L, Bonomi T. Quantifying Groundwater Infiltrations into Subway Lines and Underground Car Parks Using MODFLOW-USG. Water. 2022; 14(24):4130. https://doi.org/10.3390/w14244130
Chicago/Turabian StyleSartirana, Davide, Chiara Zanotti, Marco Rotiroti, Mattia De Amicis, Mariachiara Caschetto, Agnese Redaelli, Letizia Fumagalli, and Tullia Bonomi. 2022. "Quantifying Groundwater Infiltrations into Subway Lines and Underground Car Parks Using MODFLOW-USG" Water 14, no. 24: 4130. https://doi.org/10.3390/w14244130