
Channel Bed Adjustment of the Lowermost Yangtze River Estuary from 1983 to 2018: Causes and Implications

 , , ,
, , ,  ,
,
Abstract
:1. Introduction
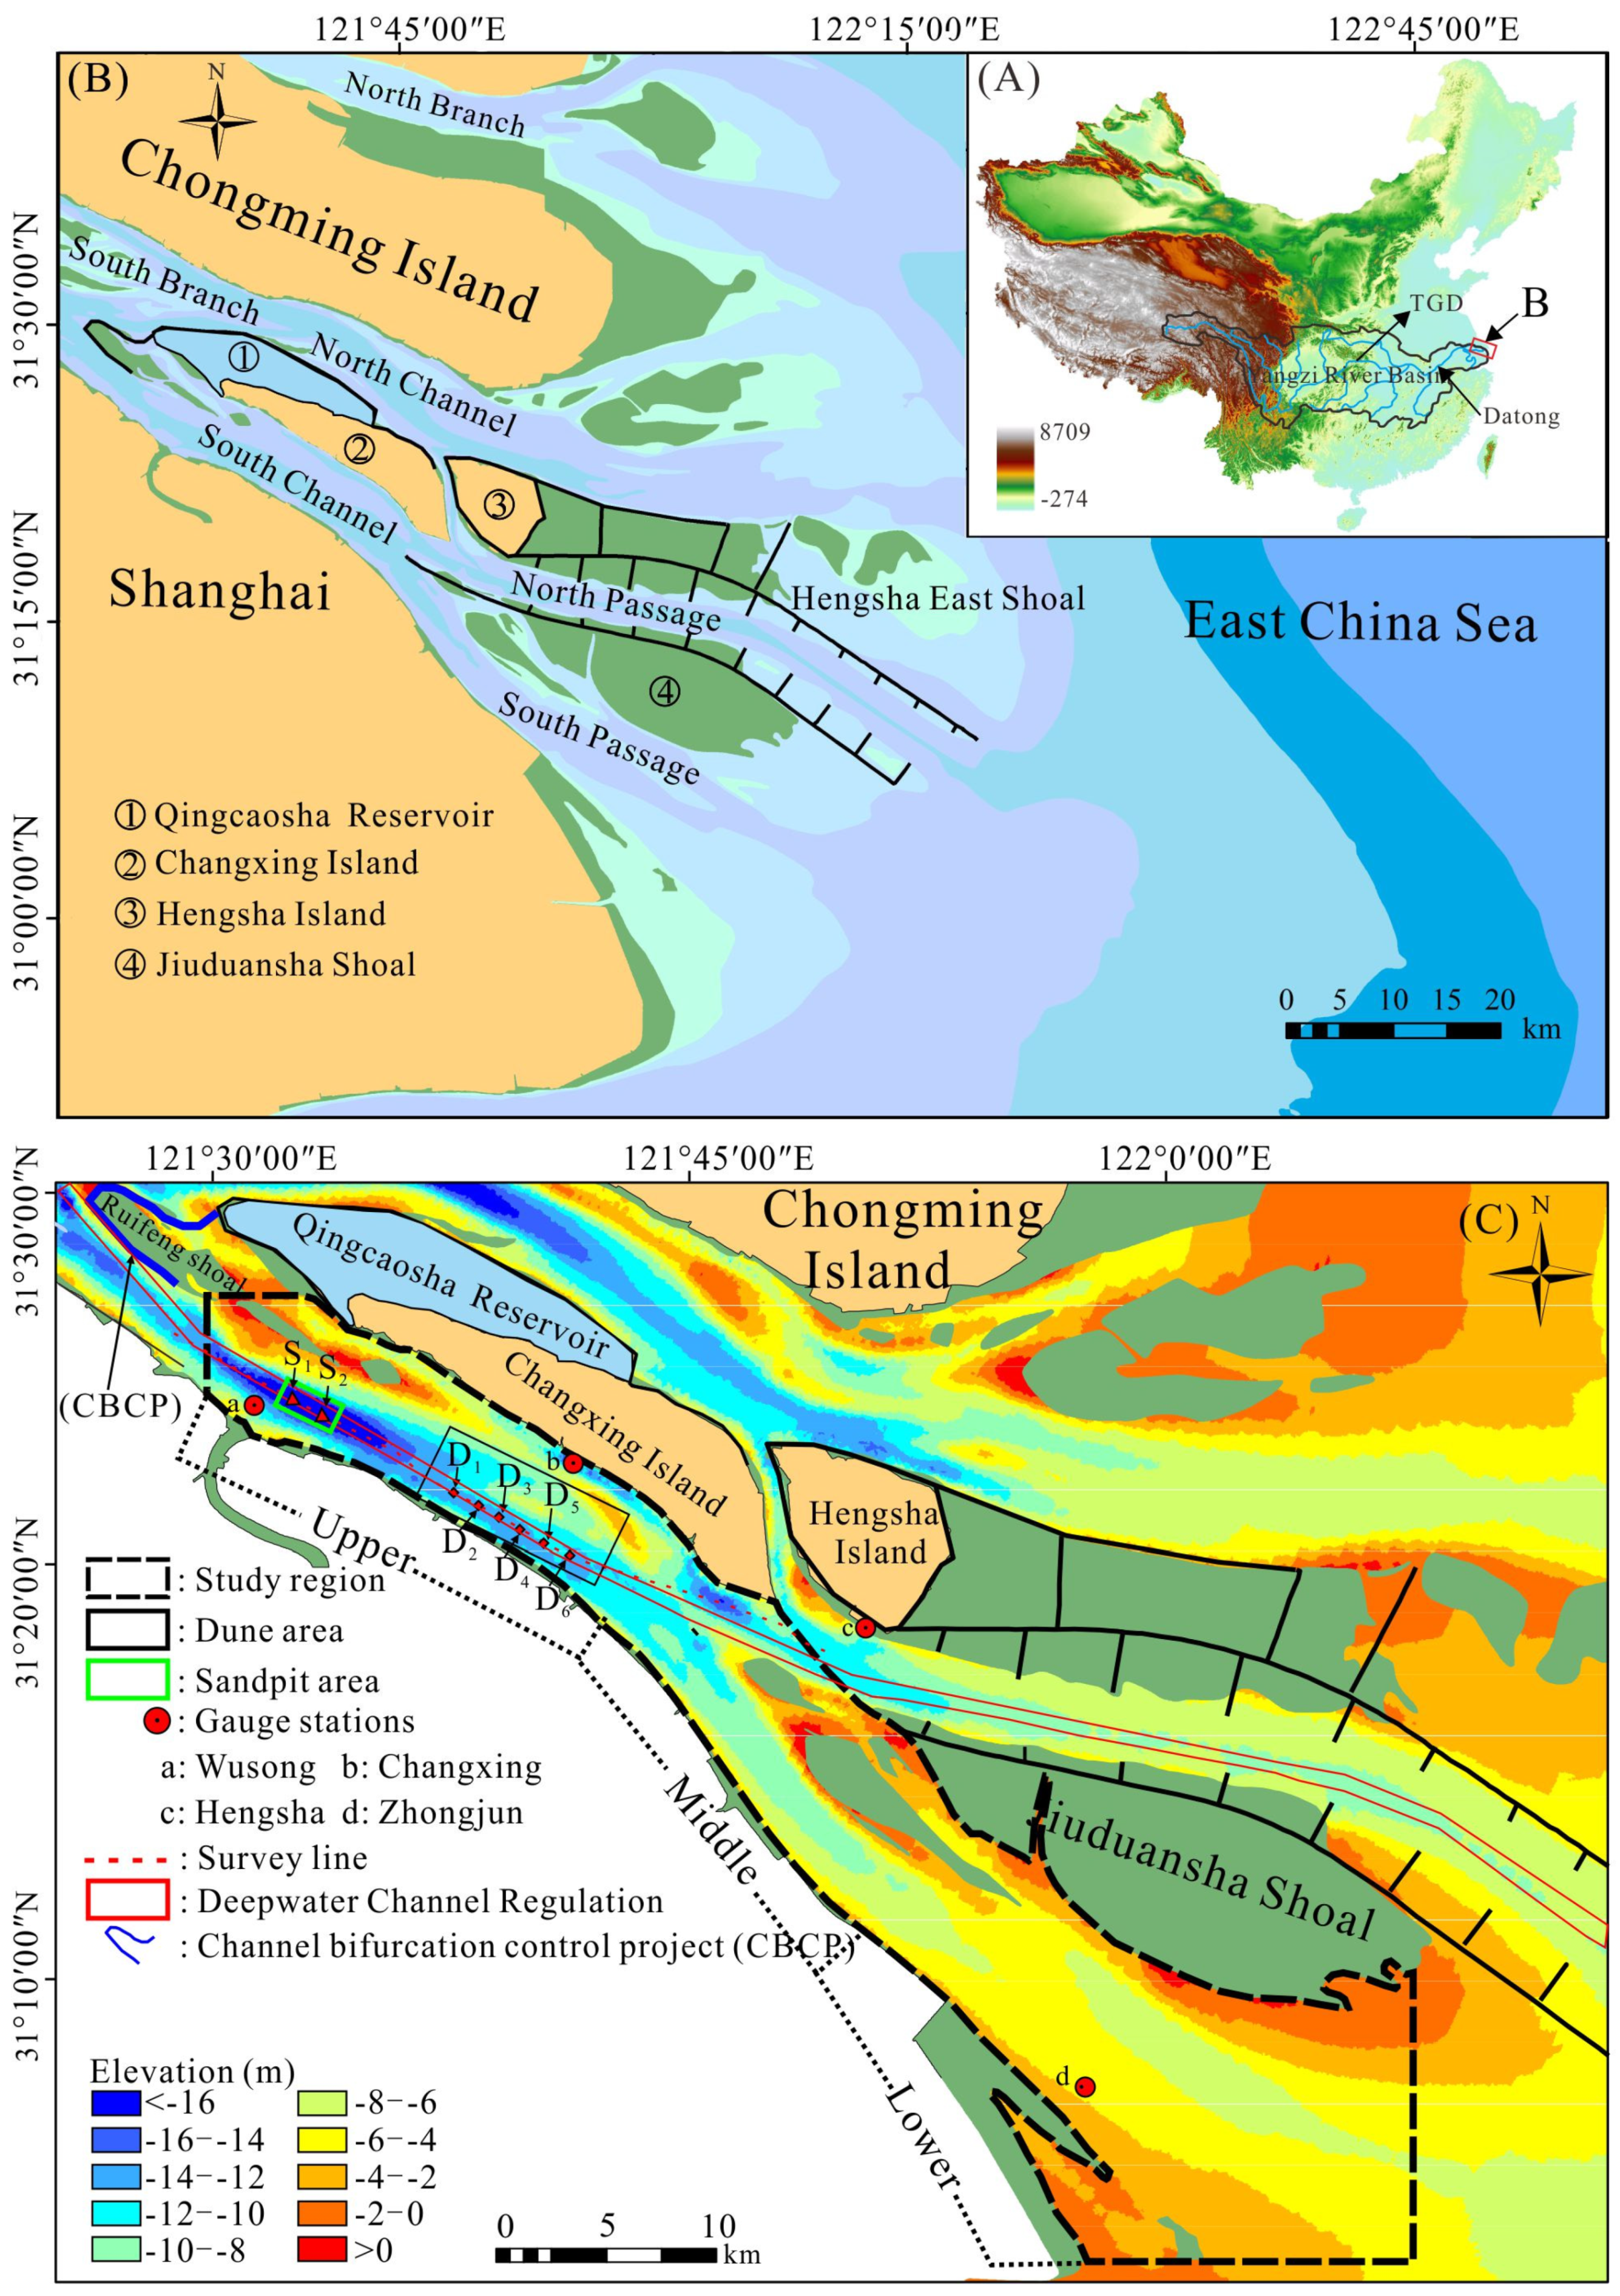
2. Study Area
3. Materials and Methods
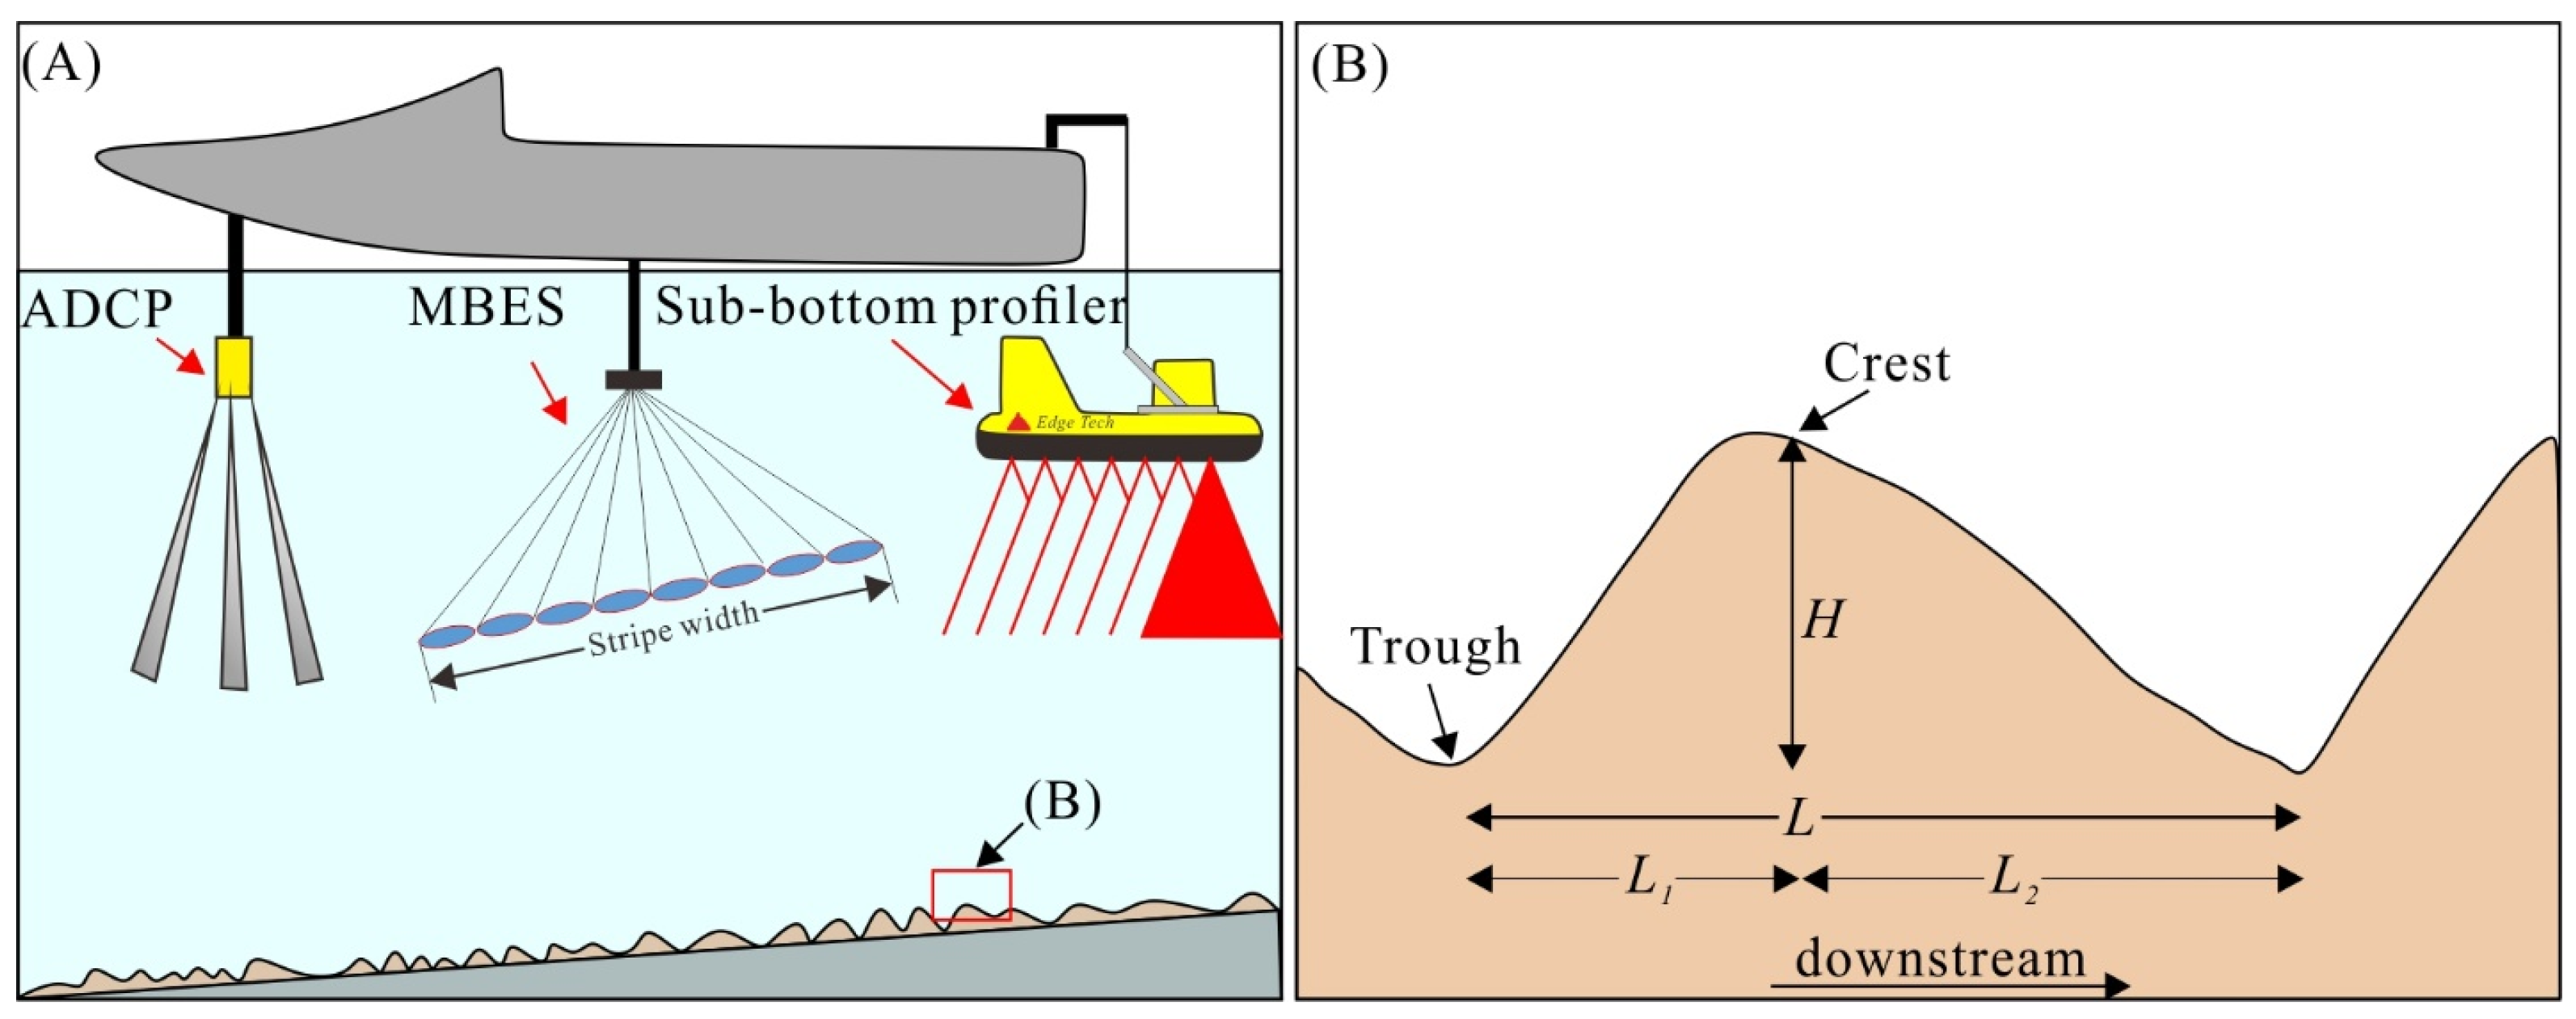
3.1. Bathymetric Data Acquisition and Processing
3.2. Field Measurements
3.3. Evaluation of the Dune Characteristics
3.4. Calculation of the Threshold Velocity of Dune and Bedload Transport Rate along the Channel Thalweg
4. Results
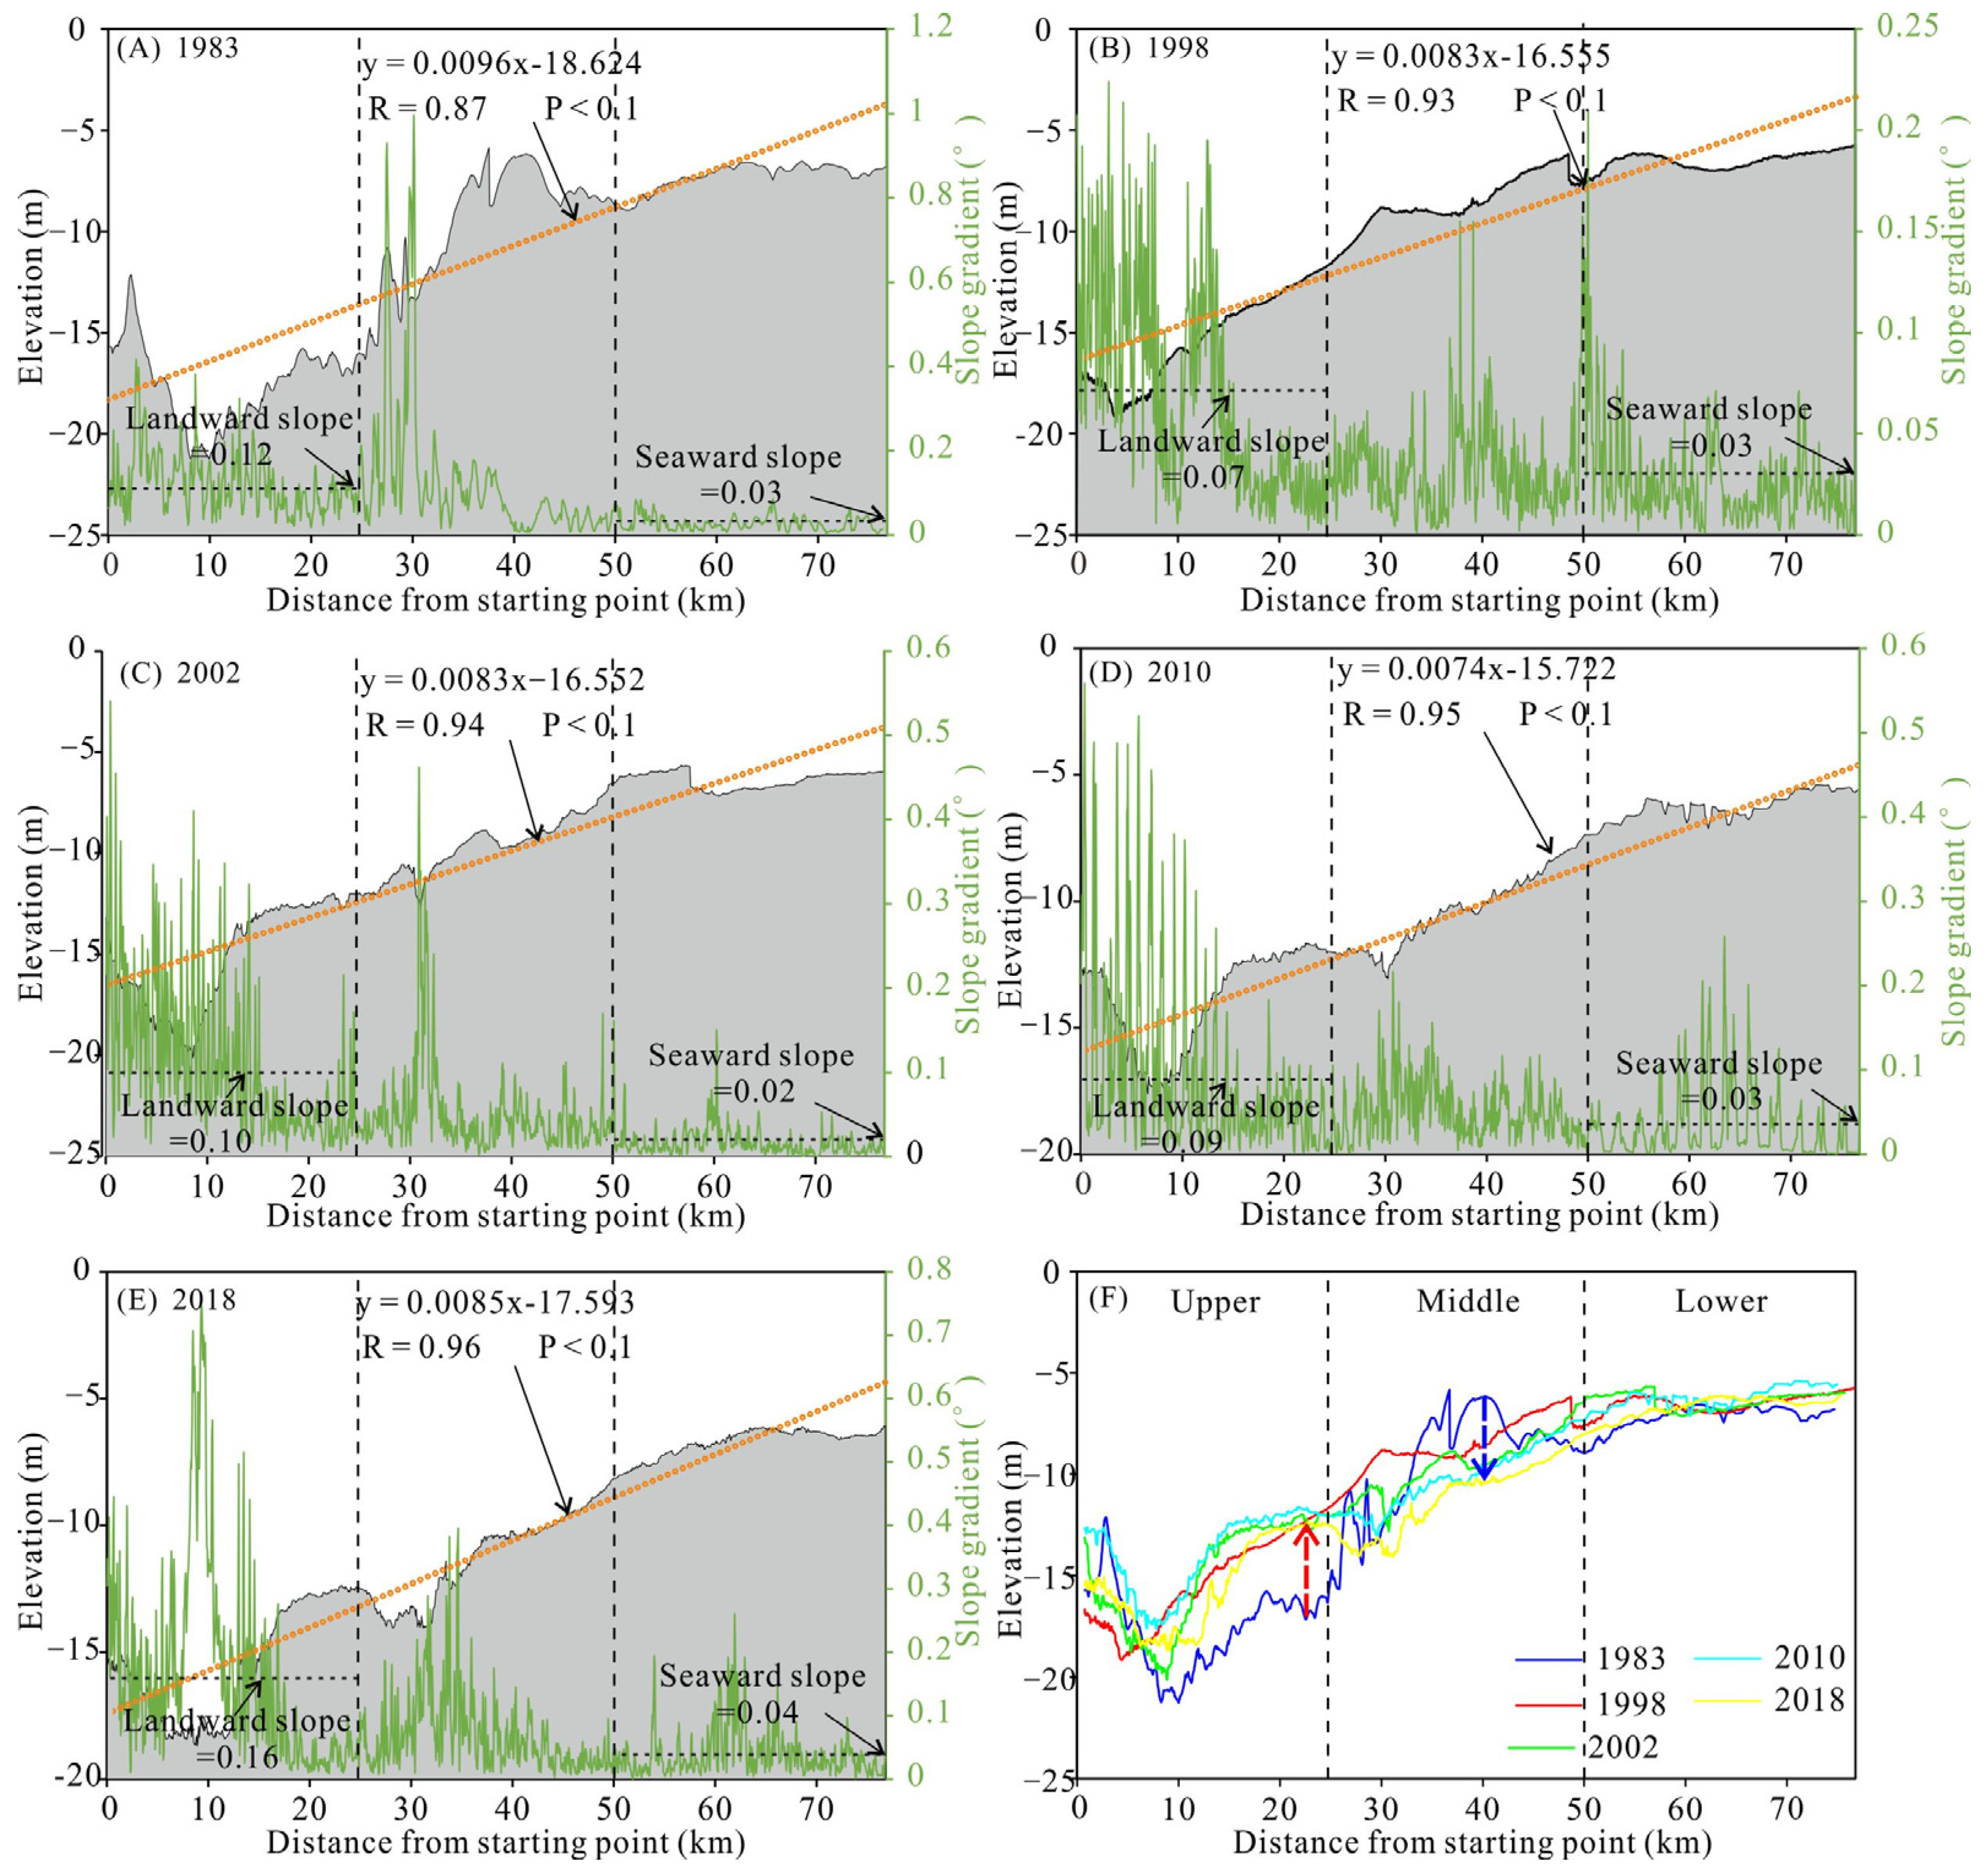
4.1. Changes in Channel Thalweg and Channel Slope Gradient
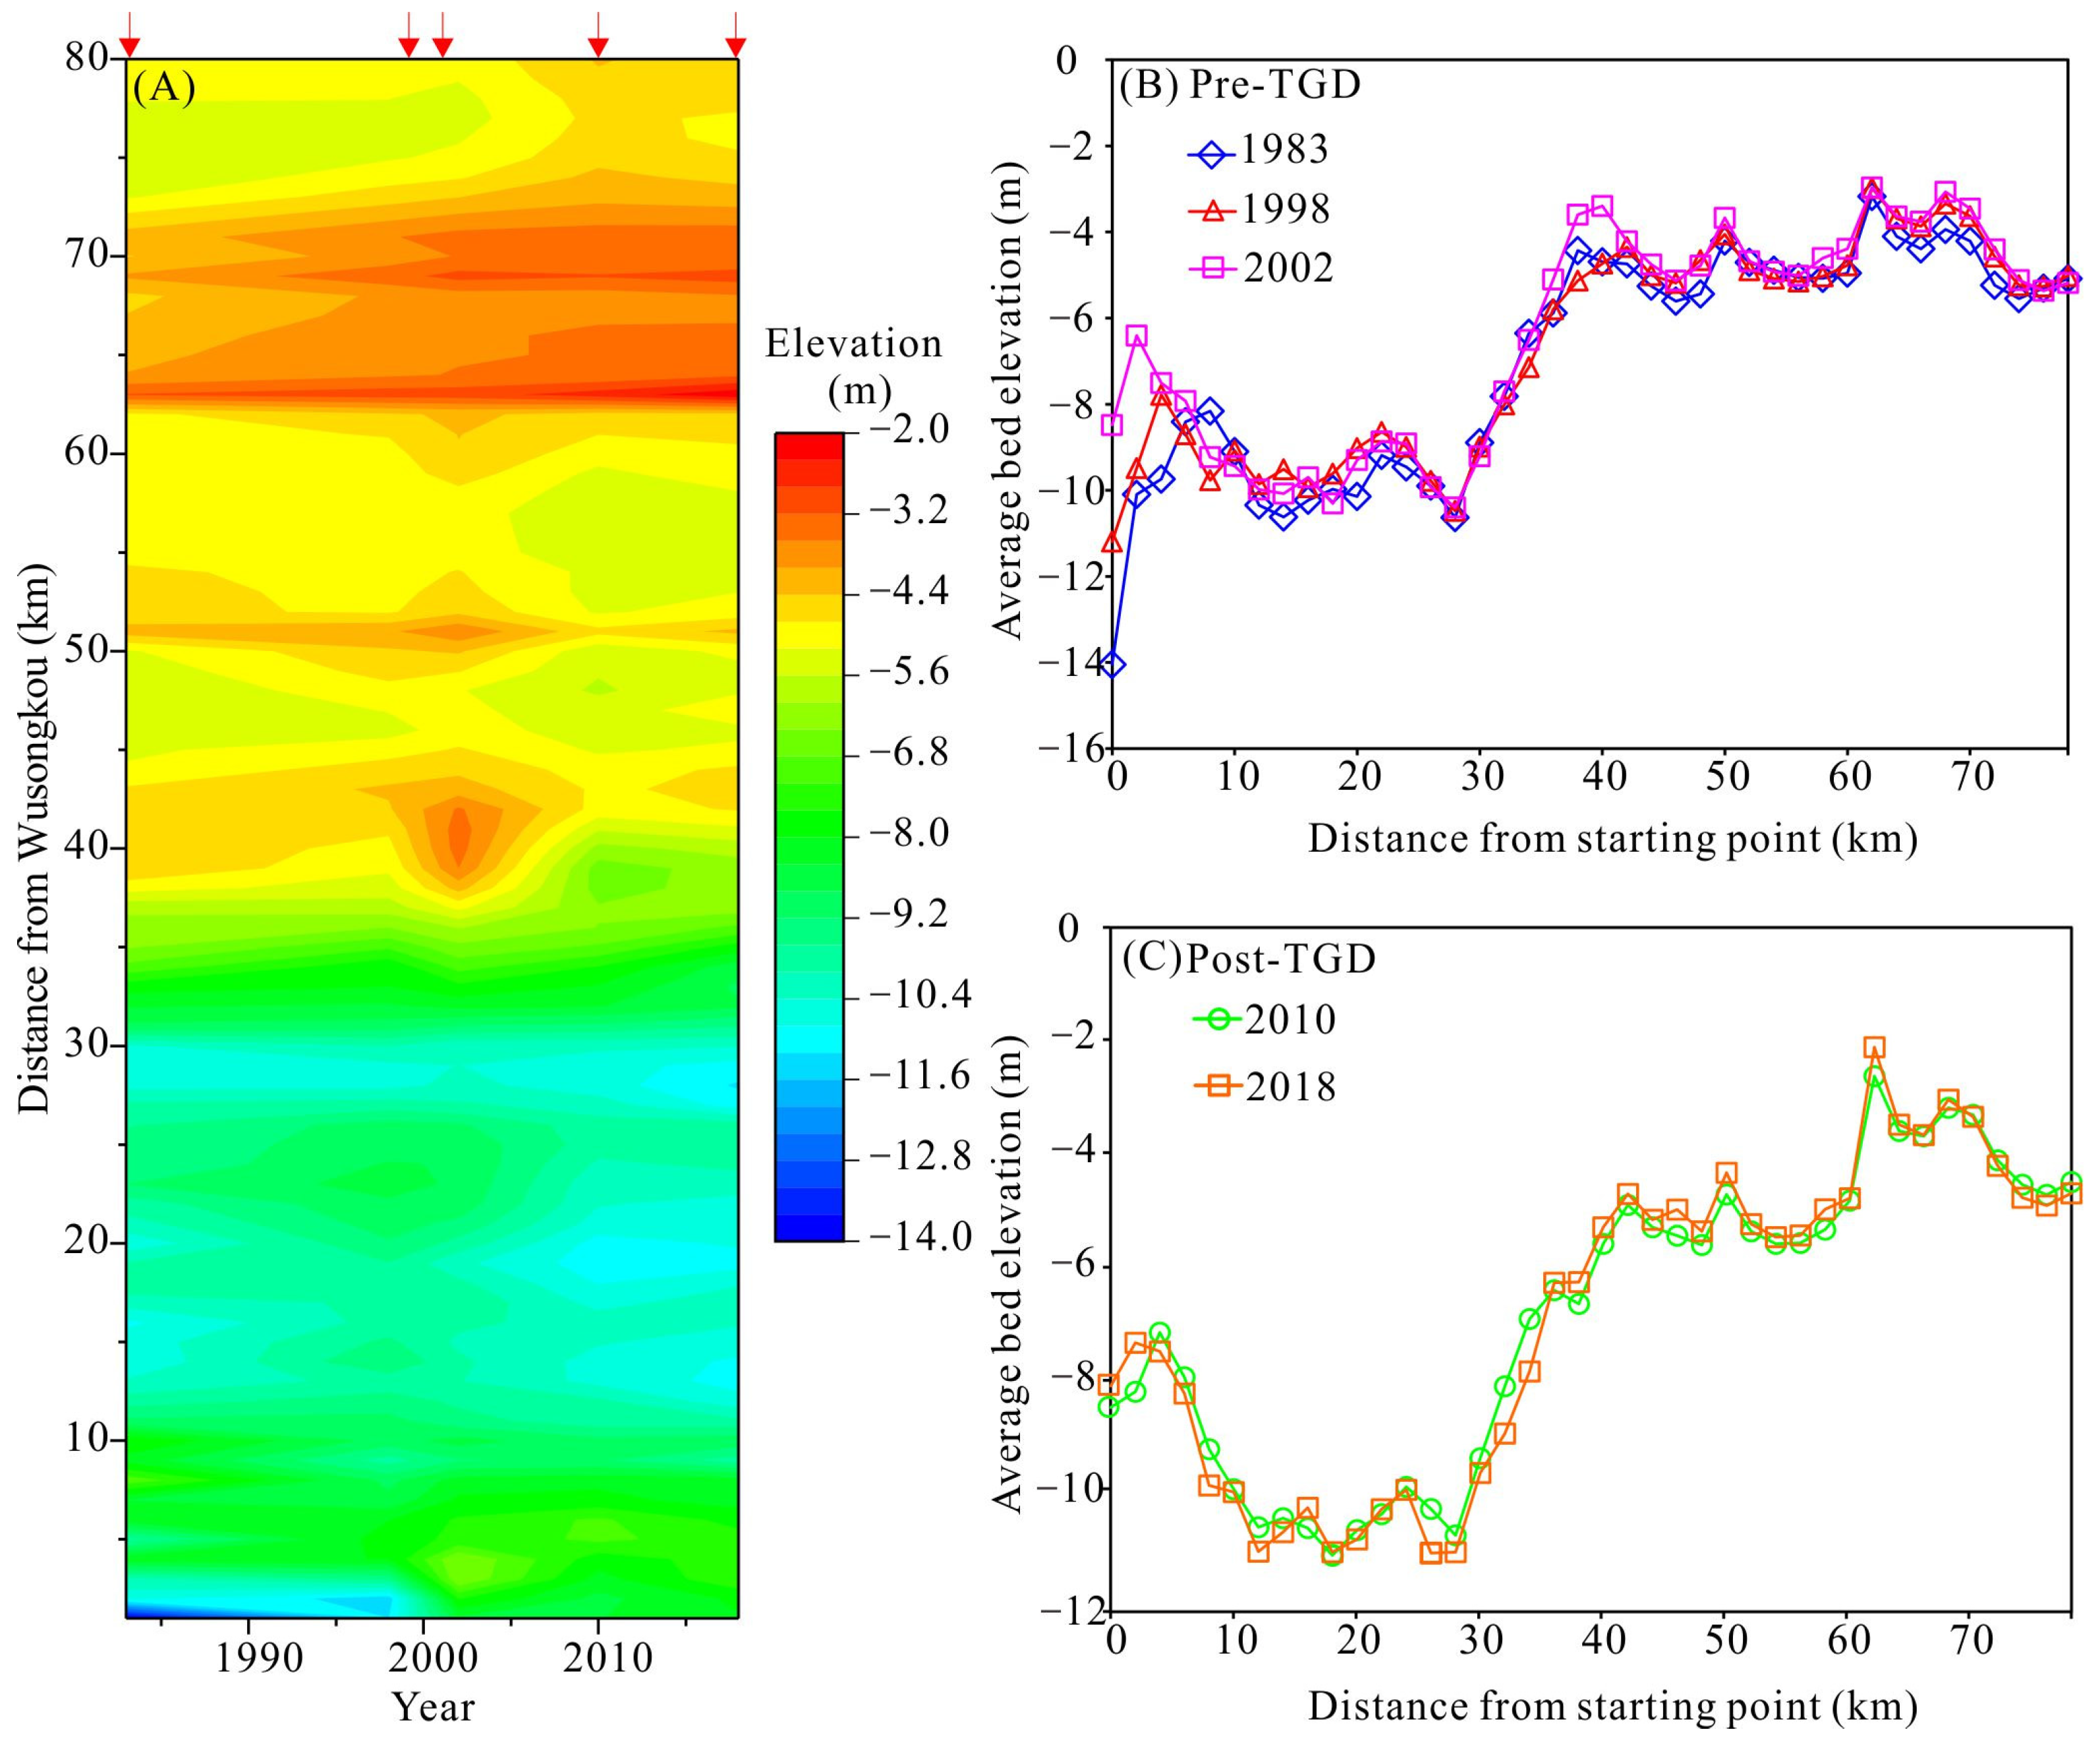
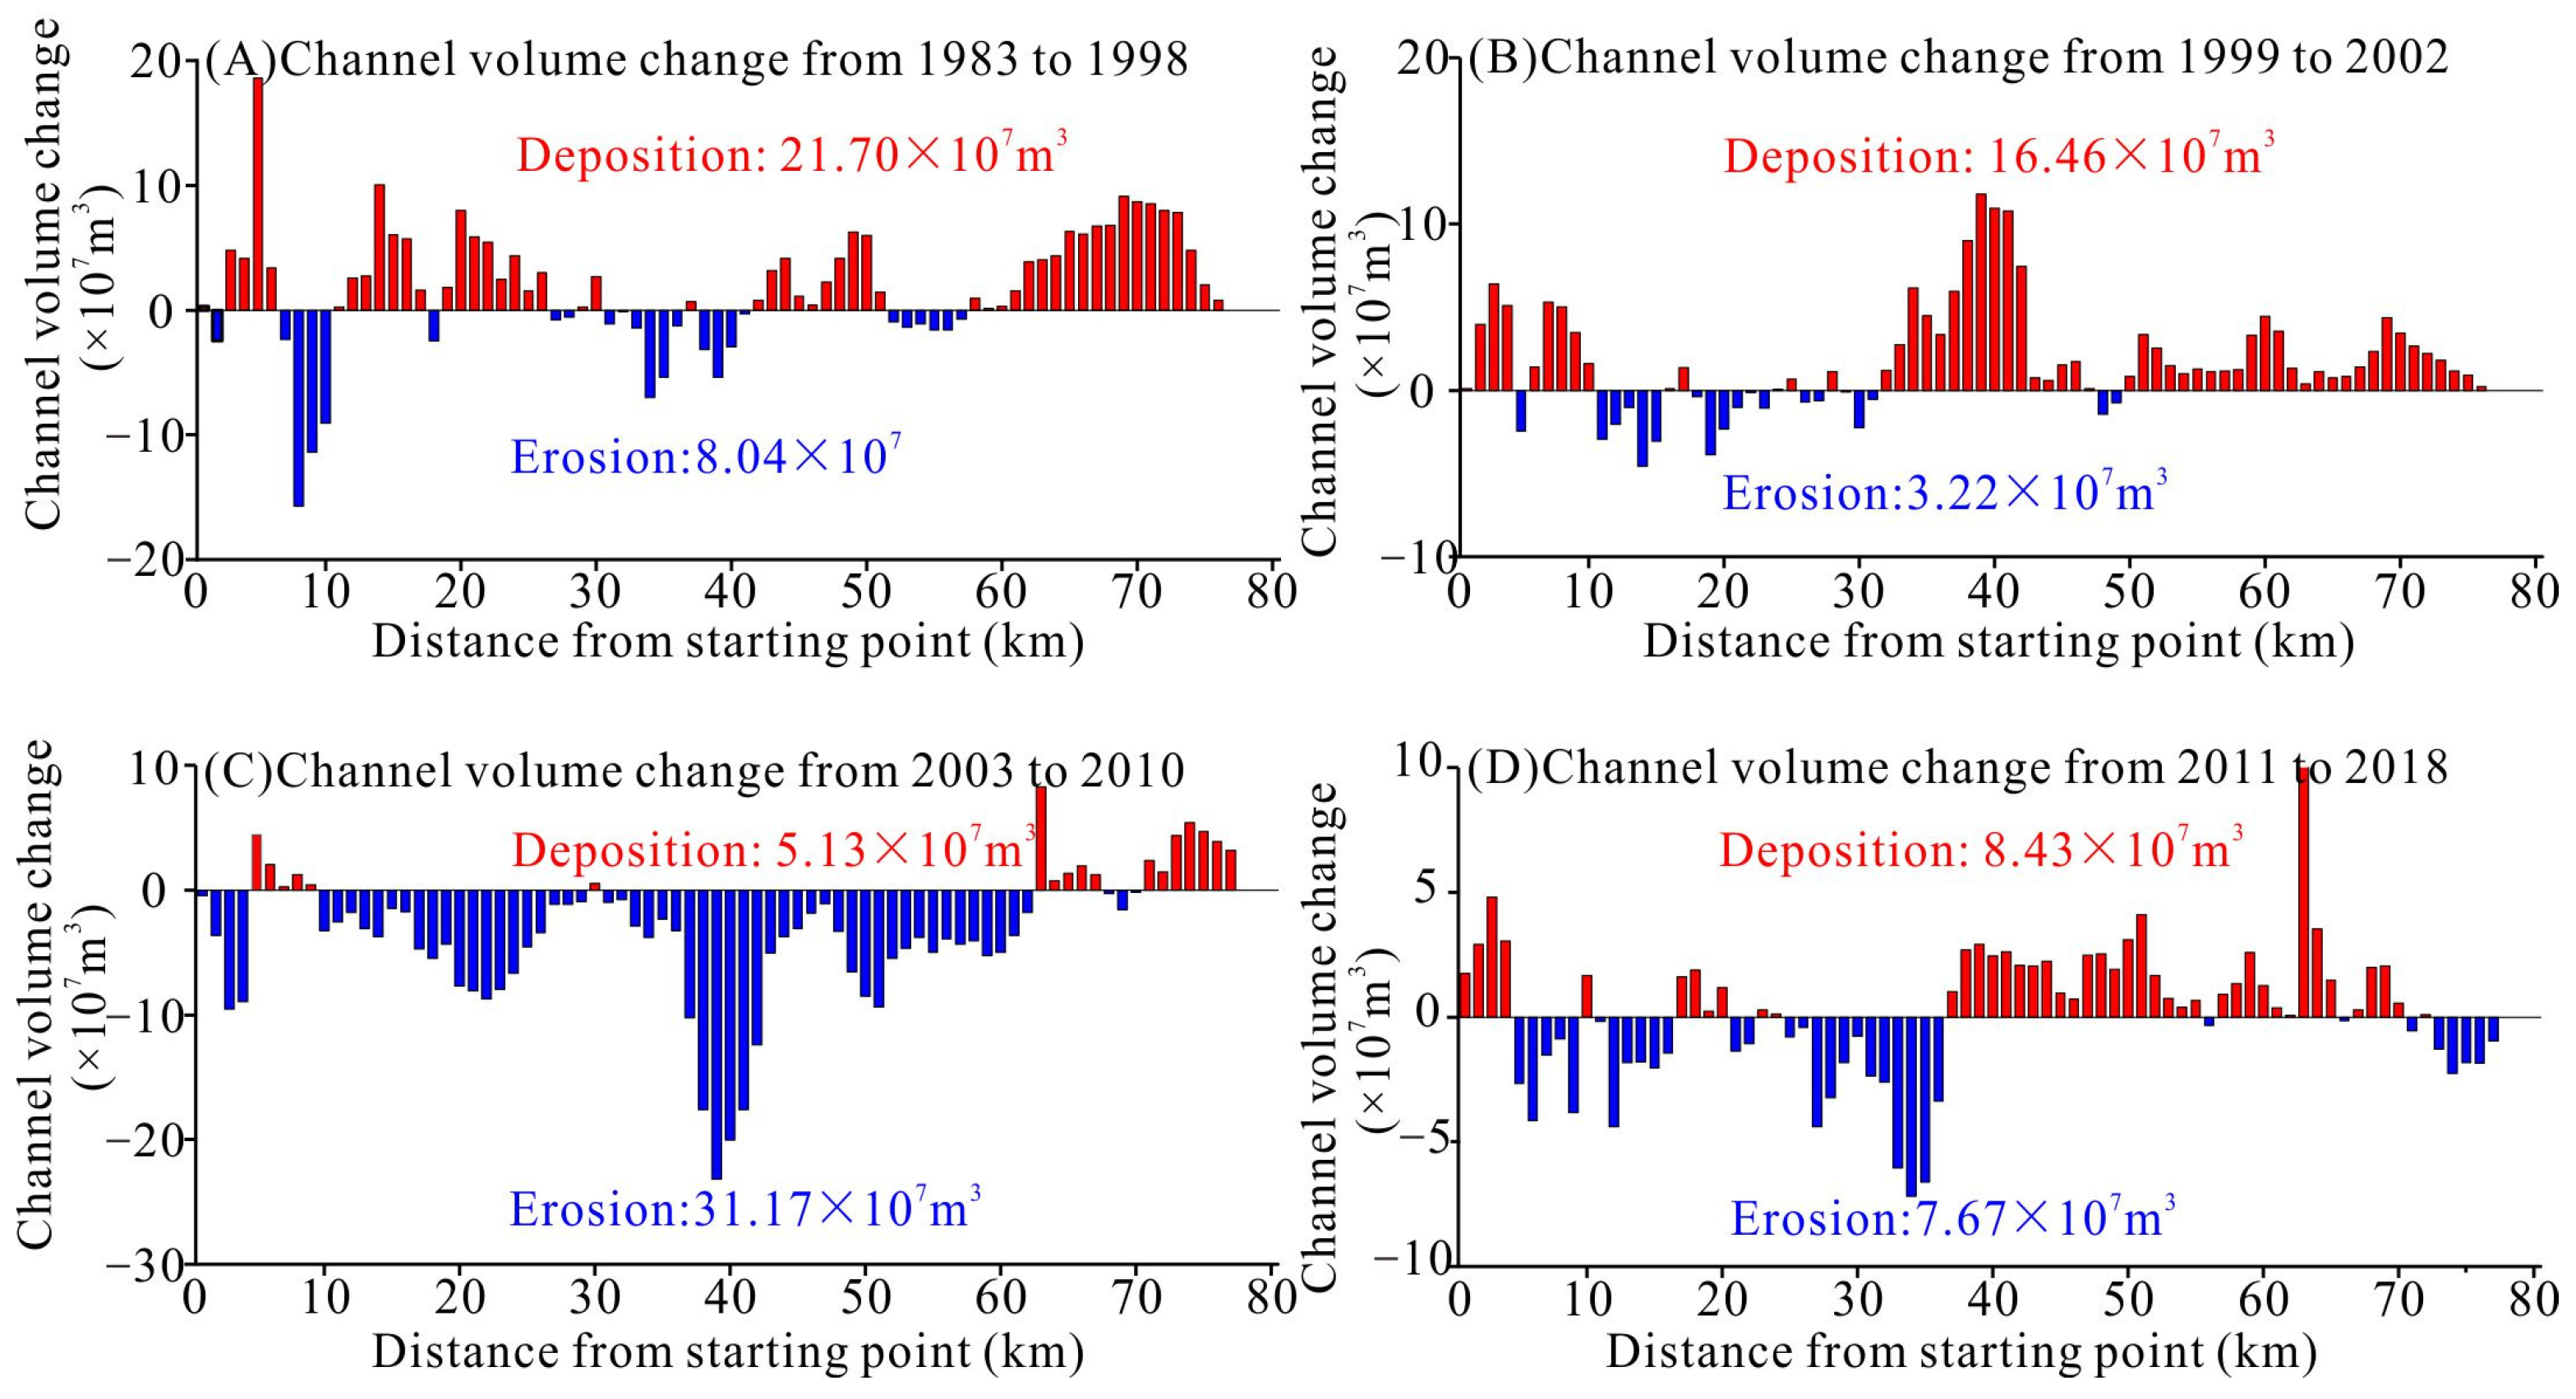
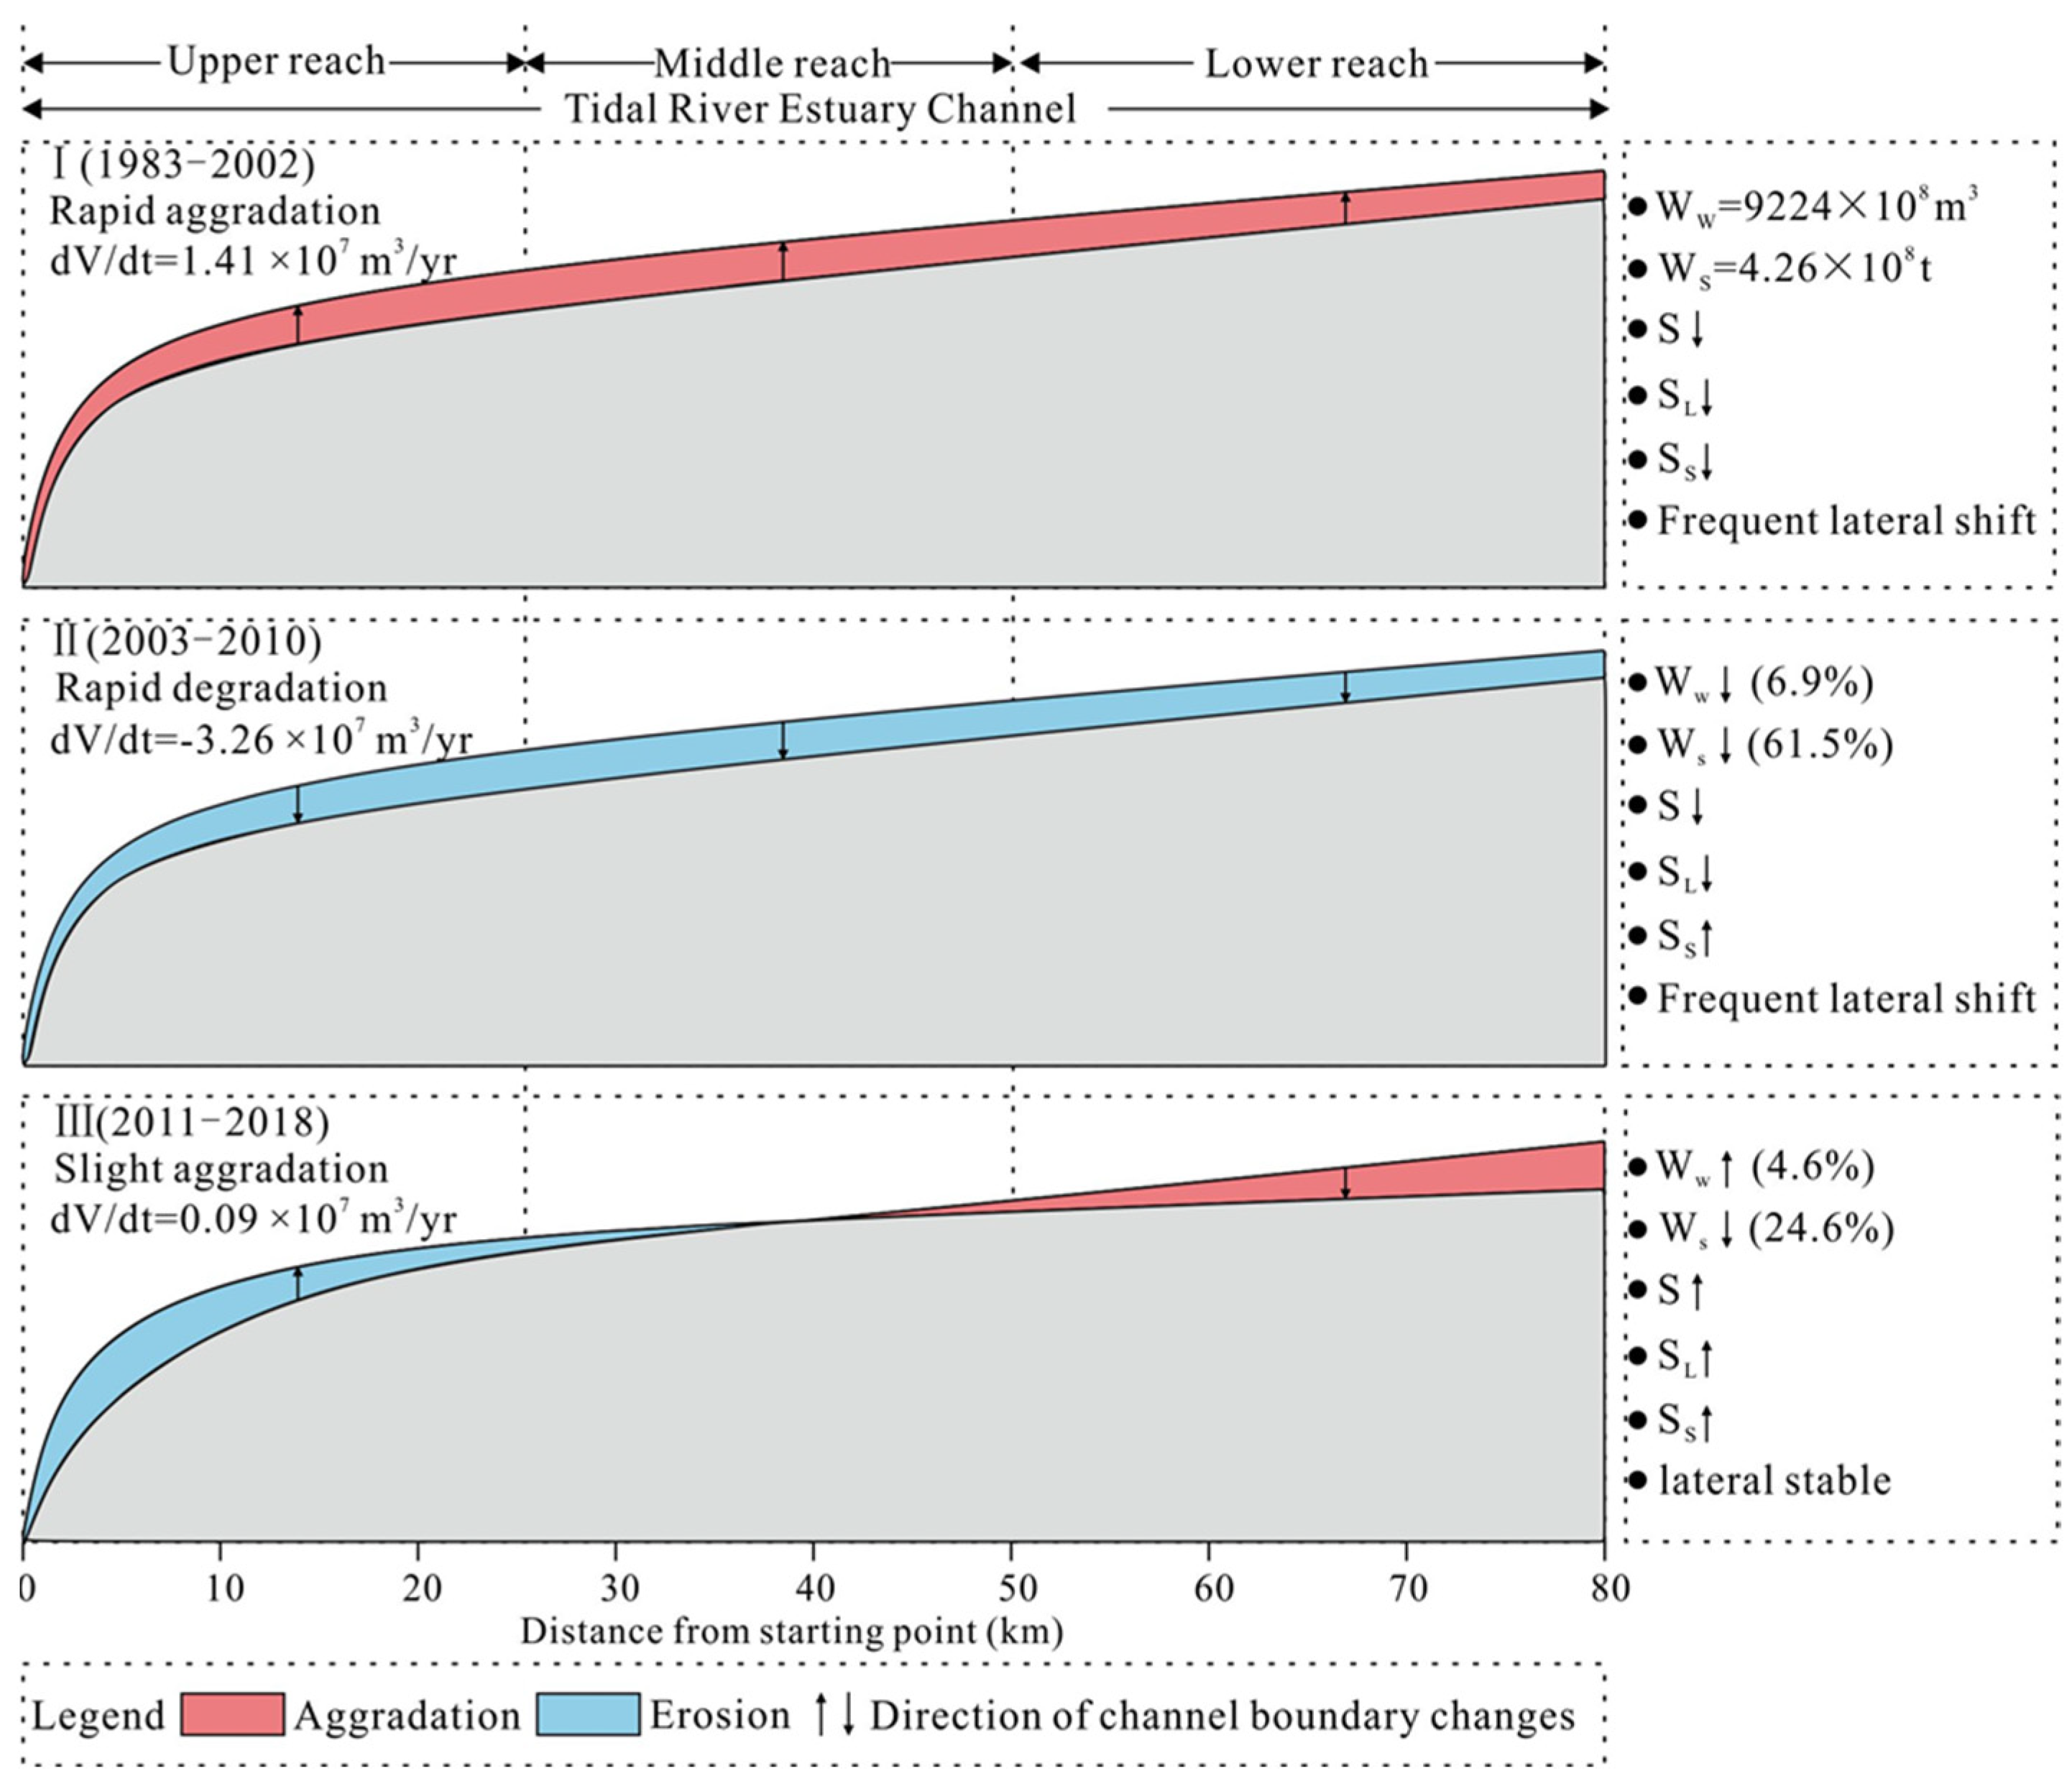
4.2. Spatiotemporal Variation of the SCSP Bed Elevation and the Riverbed Erosion and Deposition Patterns
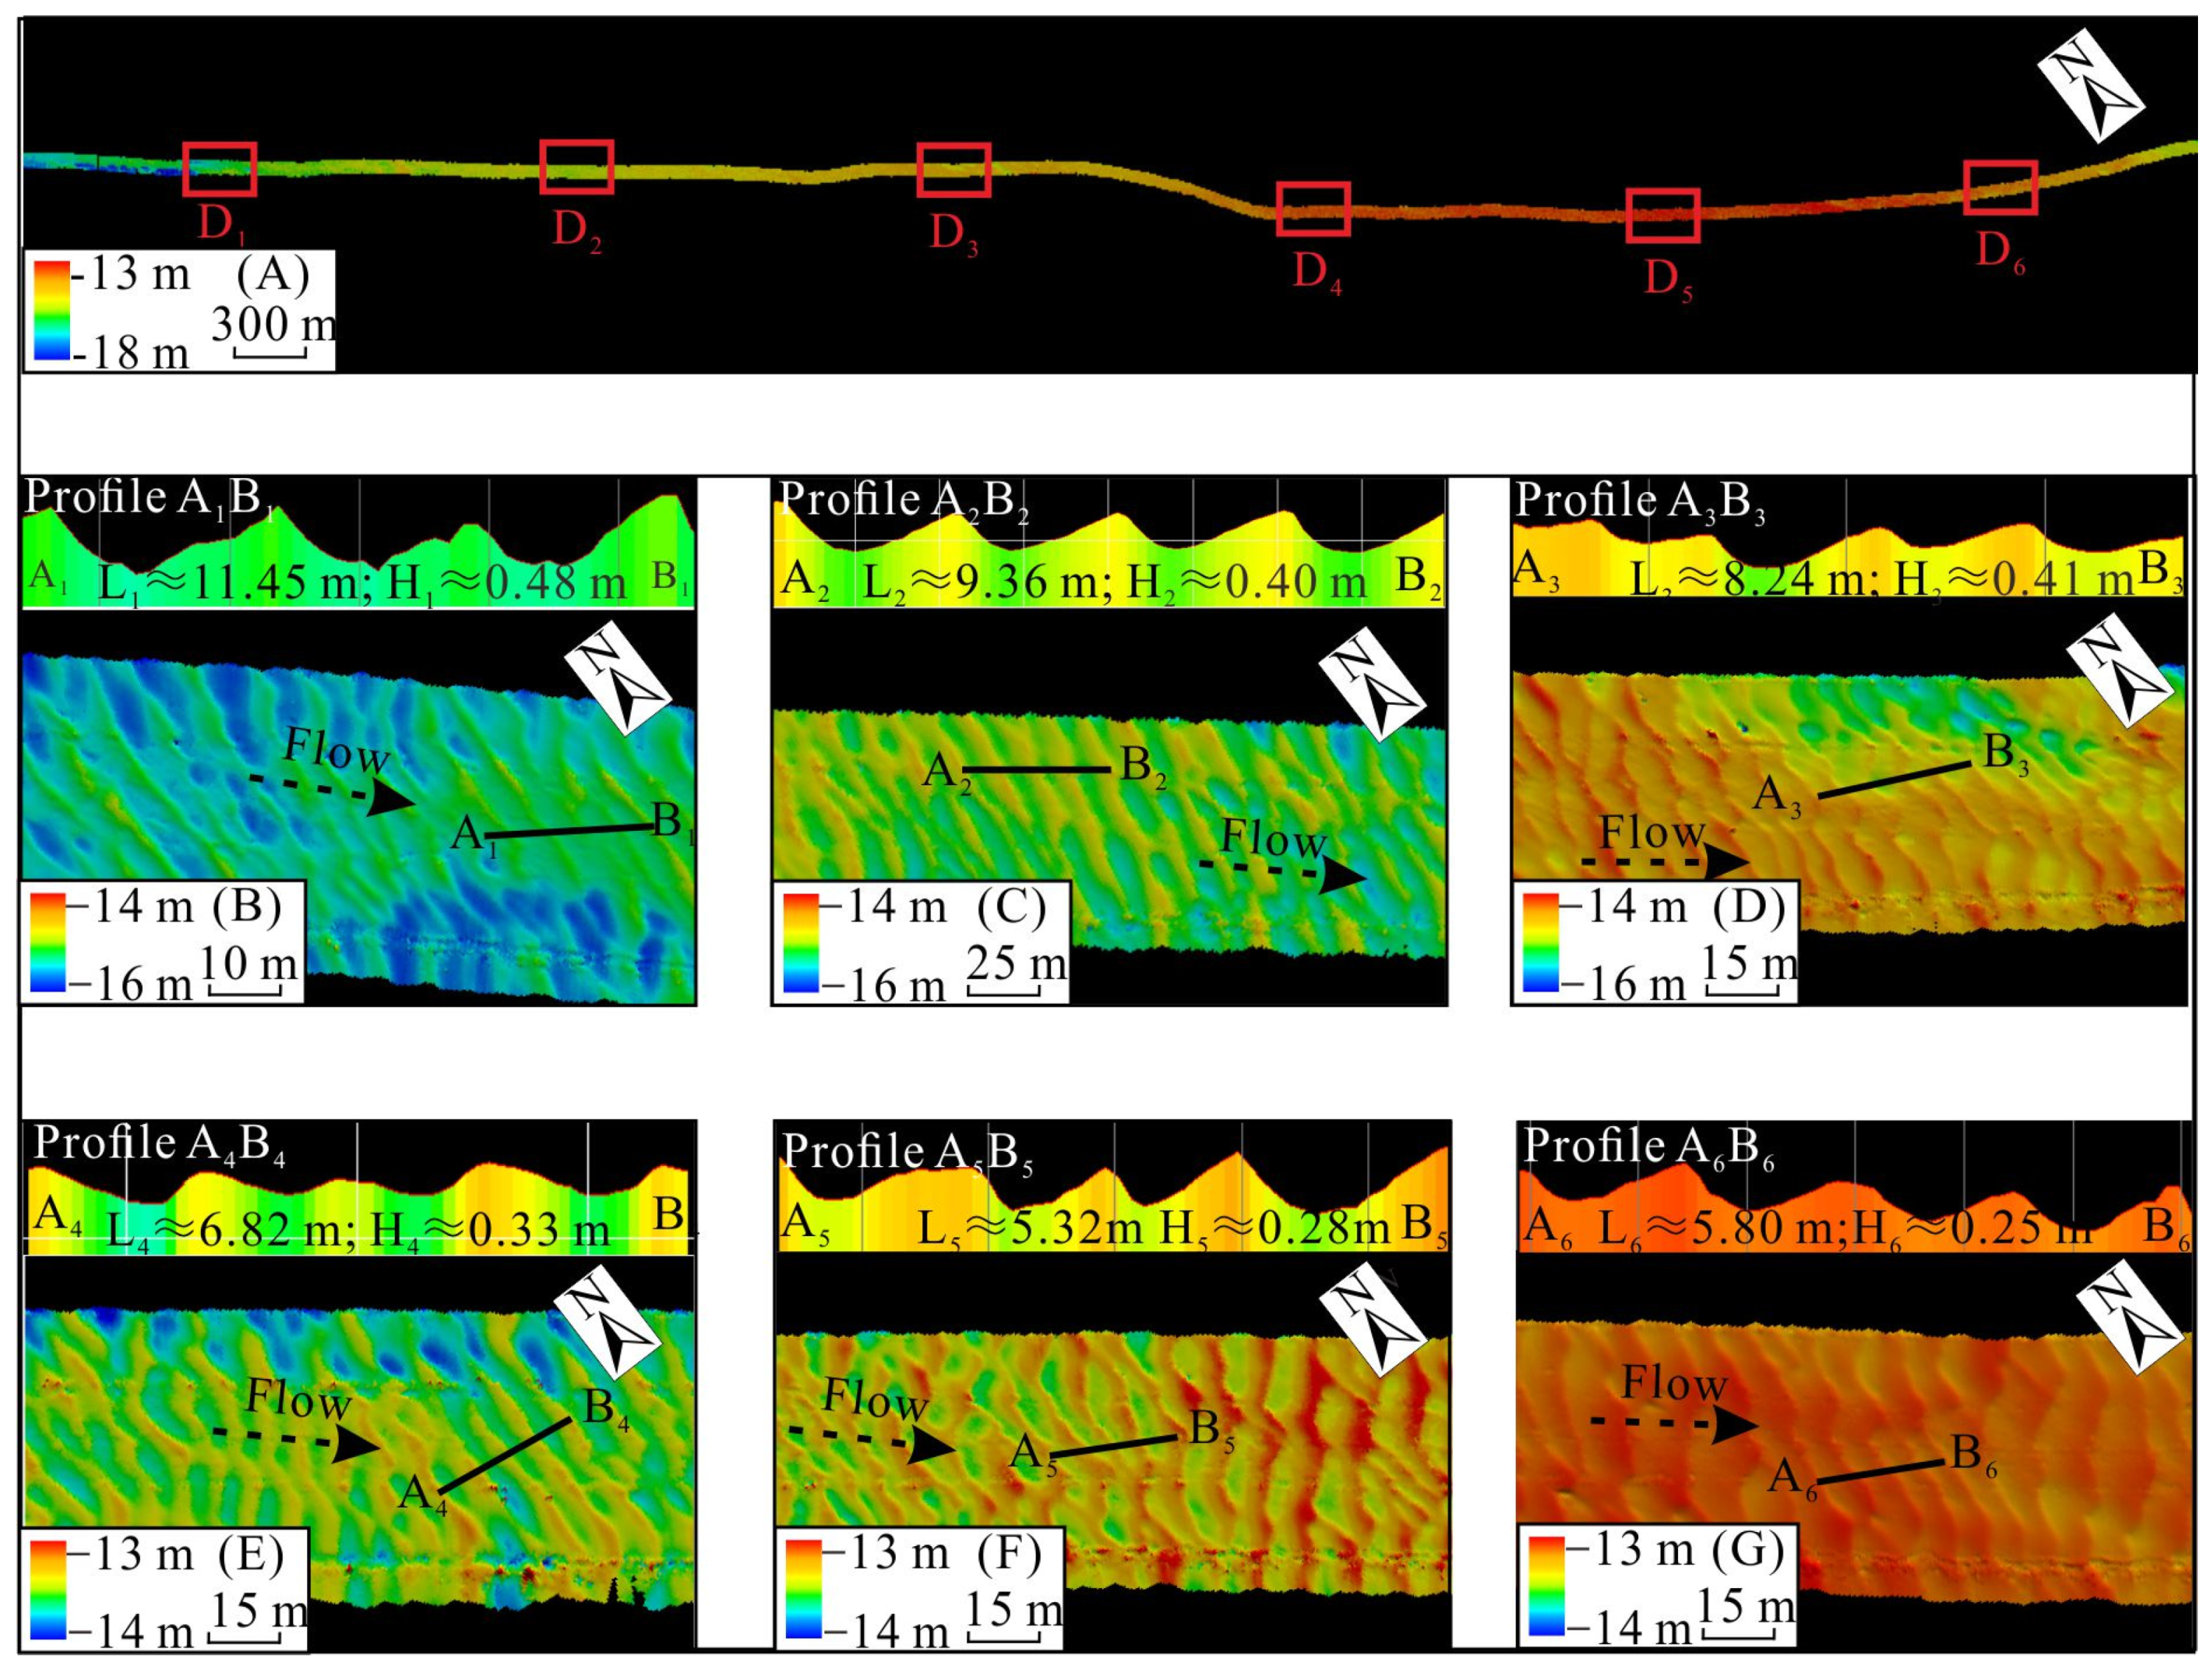
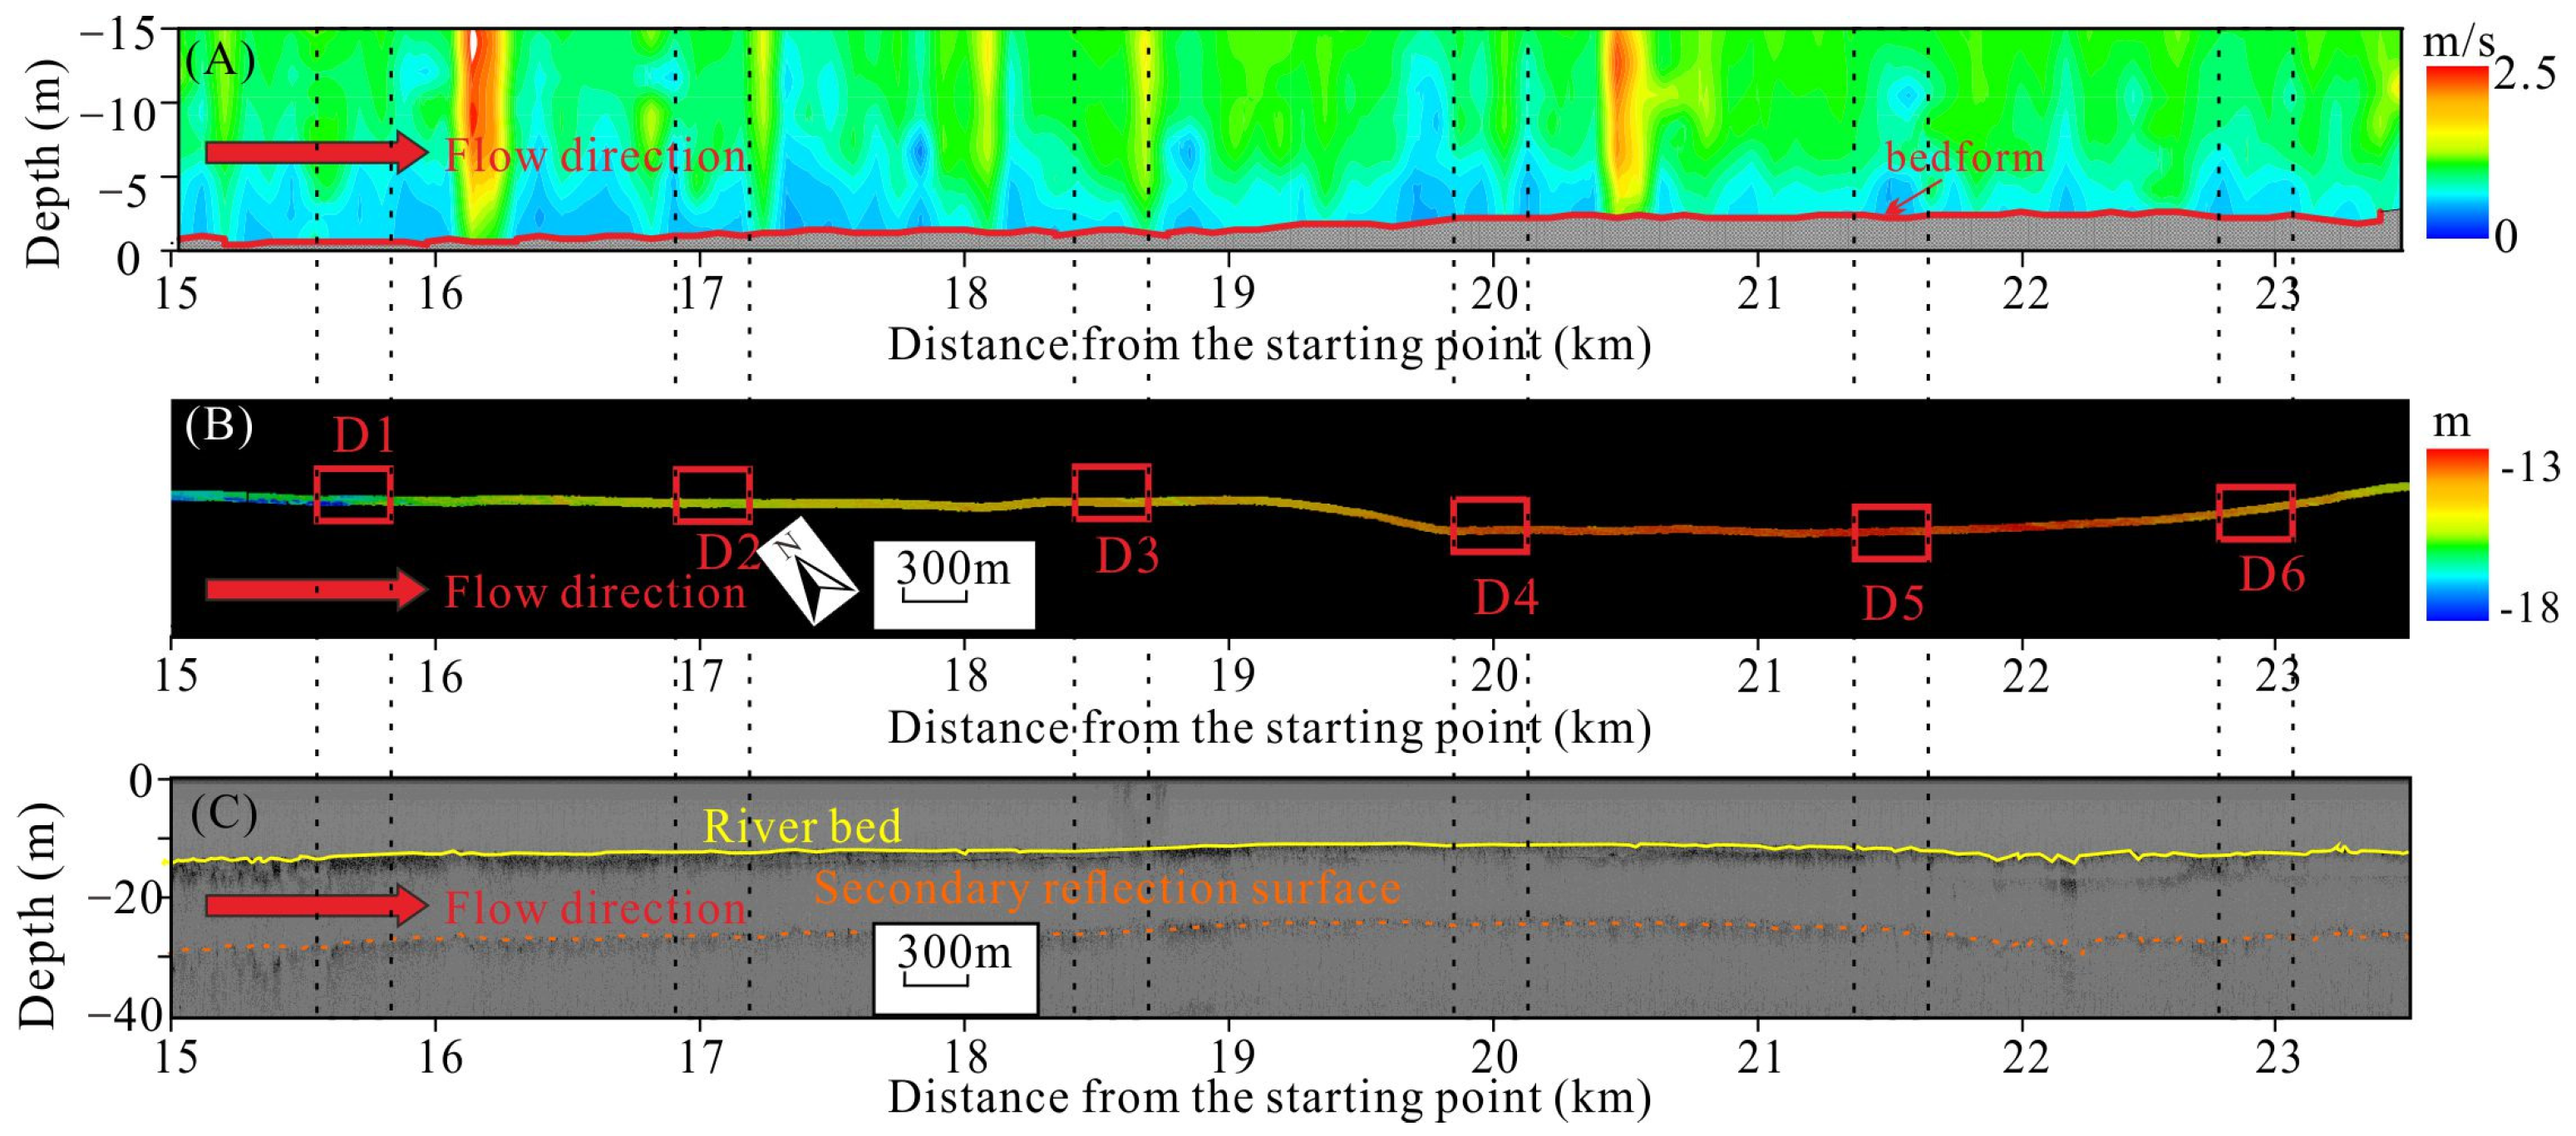
4.3. Bed Microtopography along the Channel Thalweg in the South Channel
4.4. The Threshold Velocity of Dune and Bedload Transport Rate along the Channel Thalweg
5. Discussion
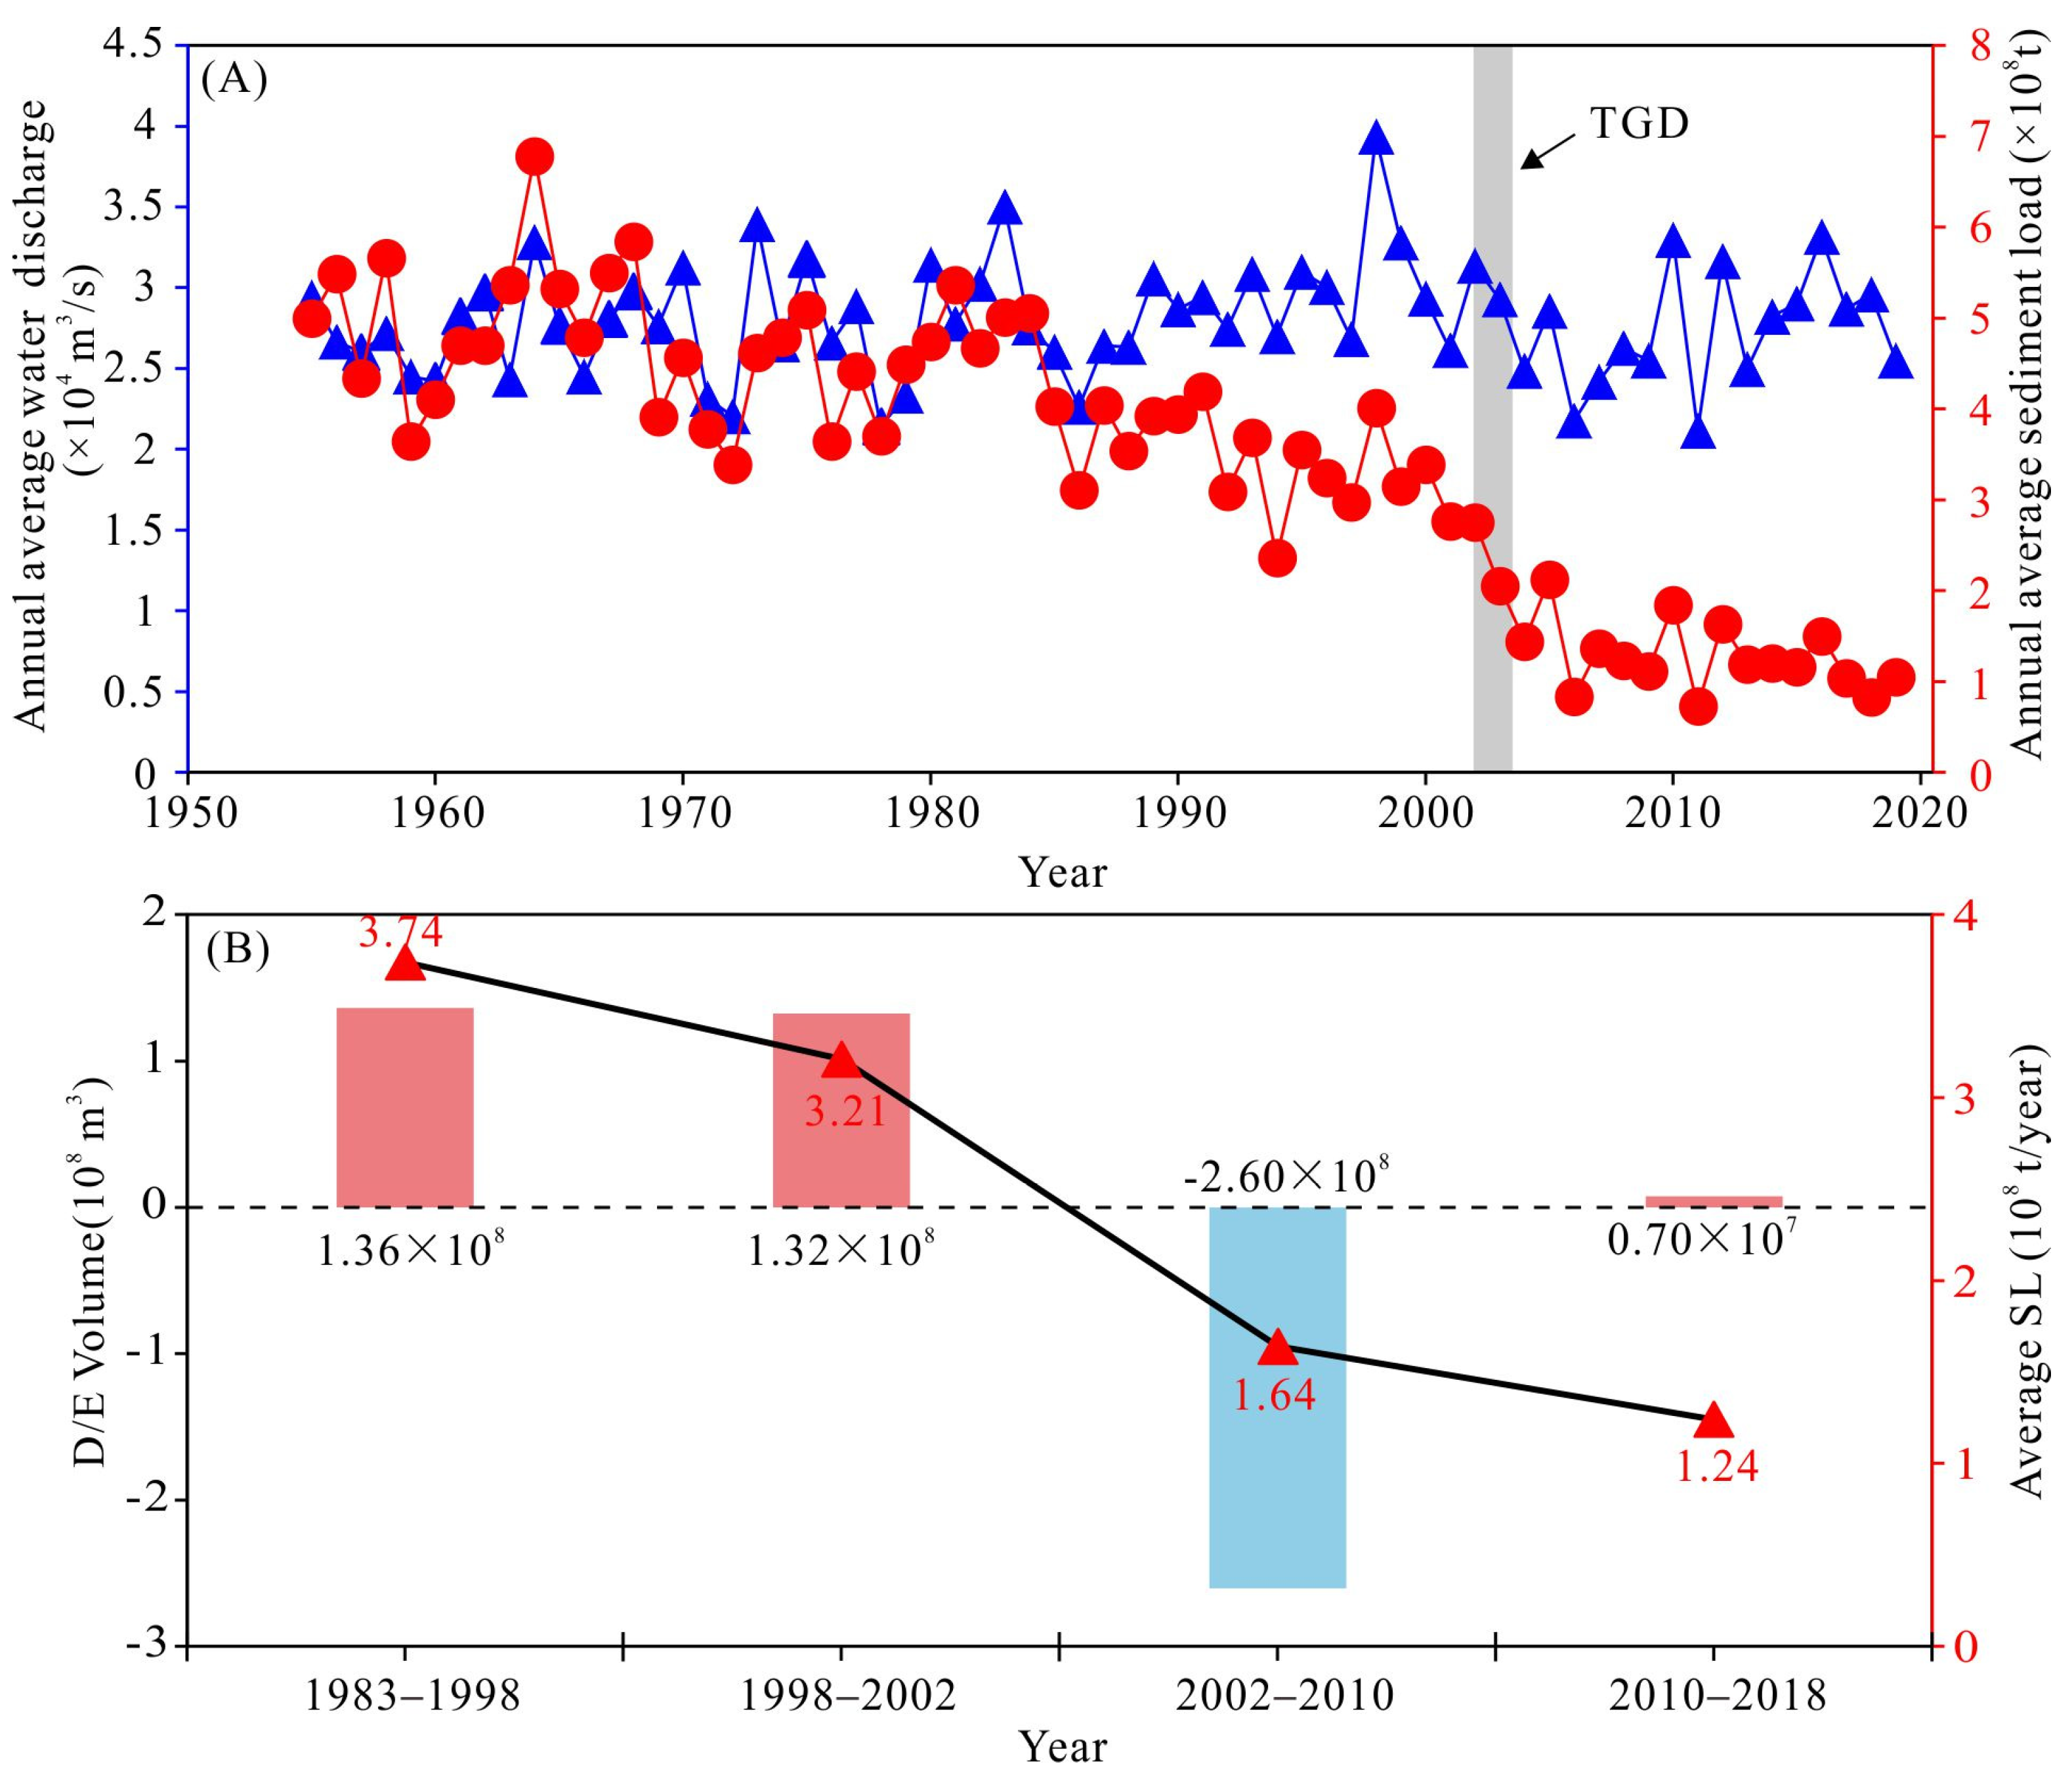
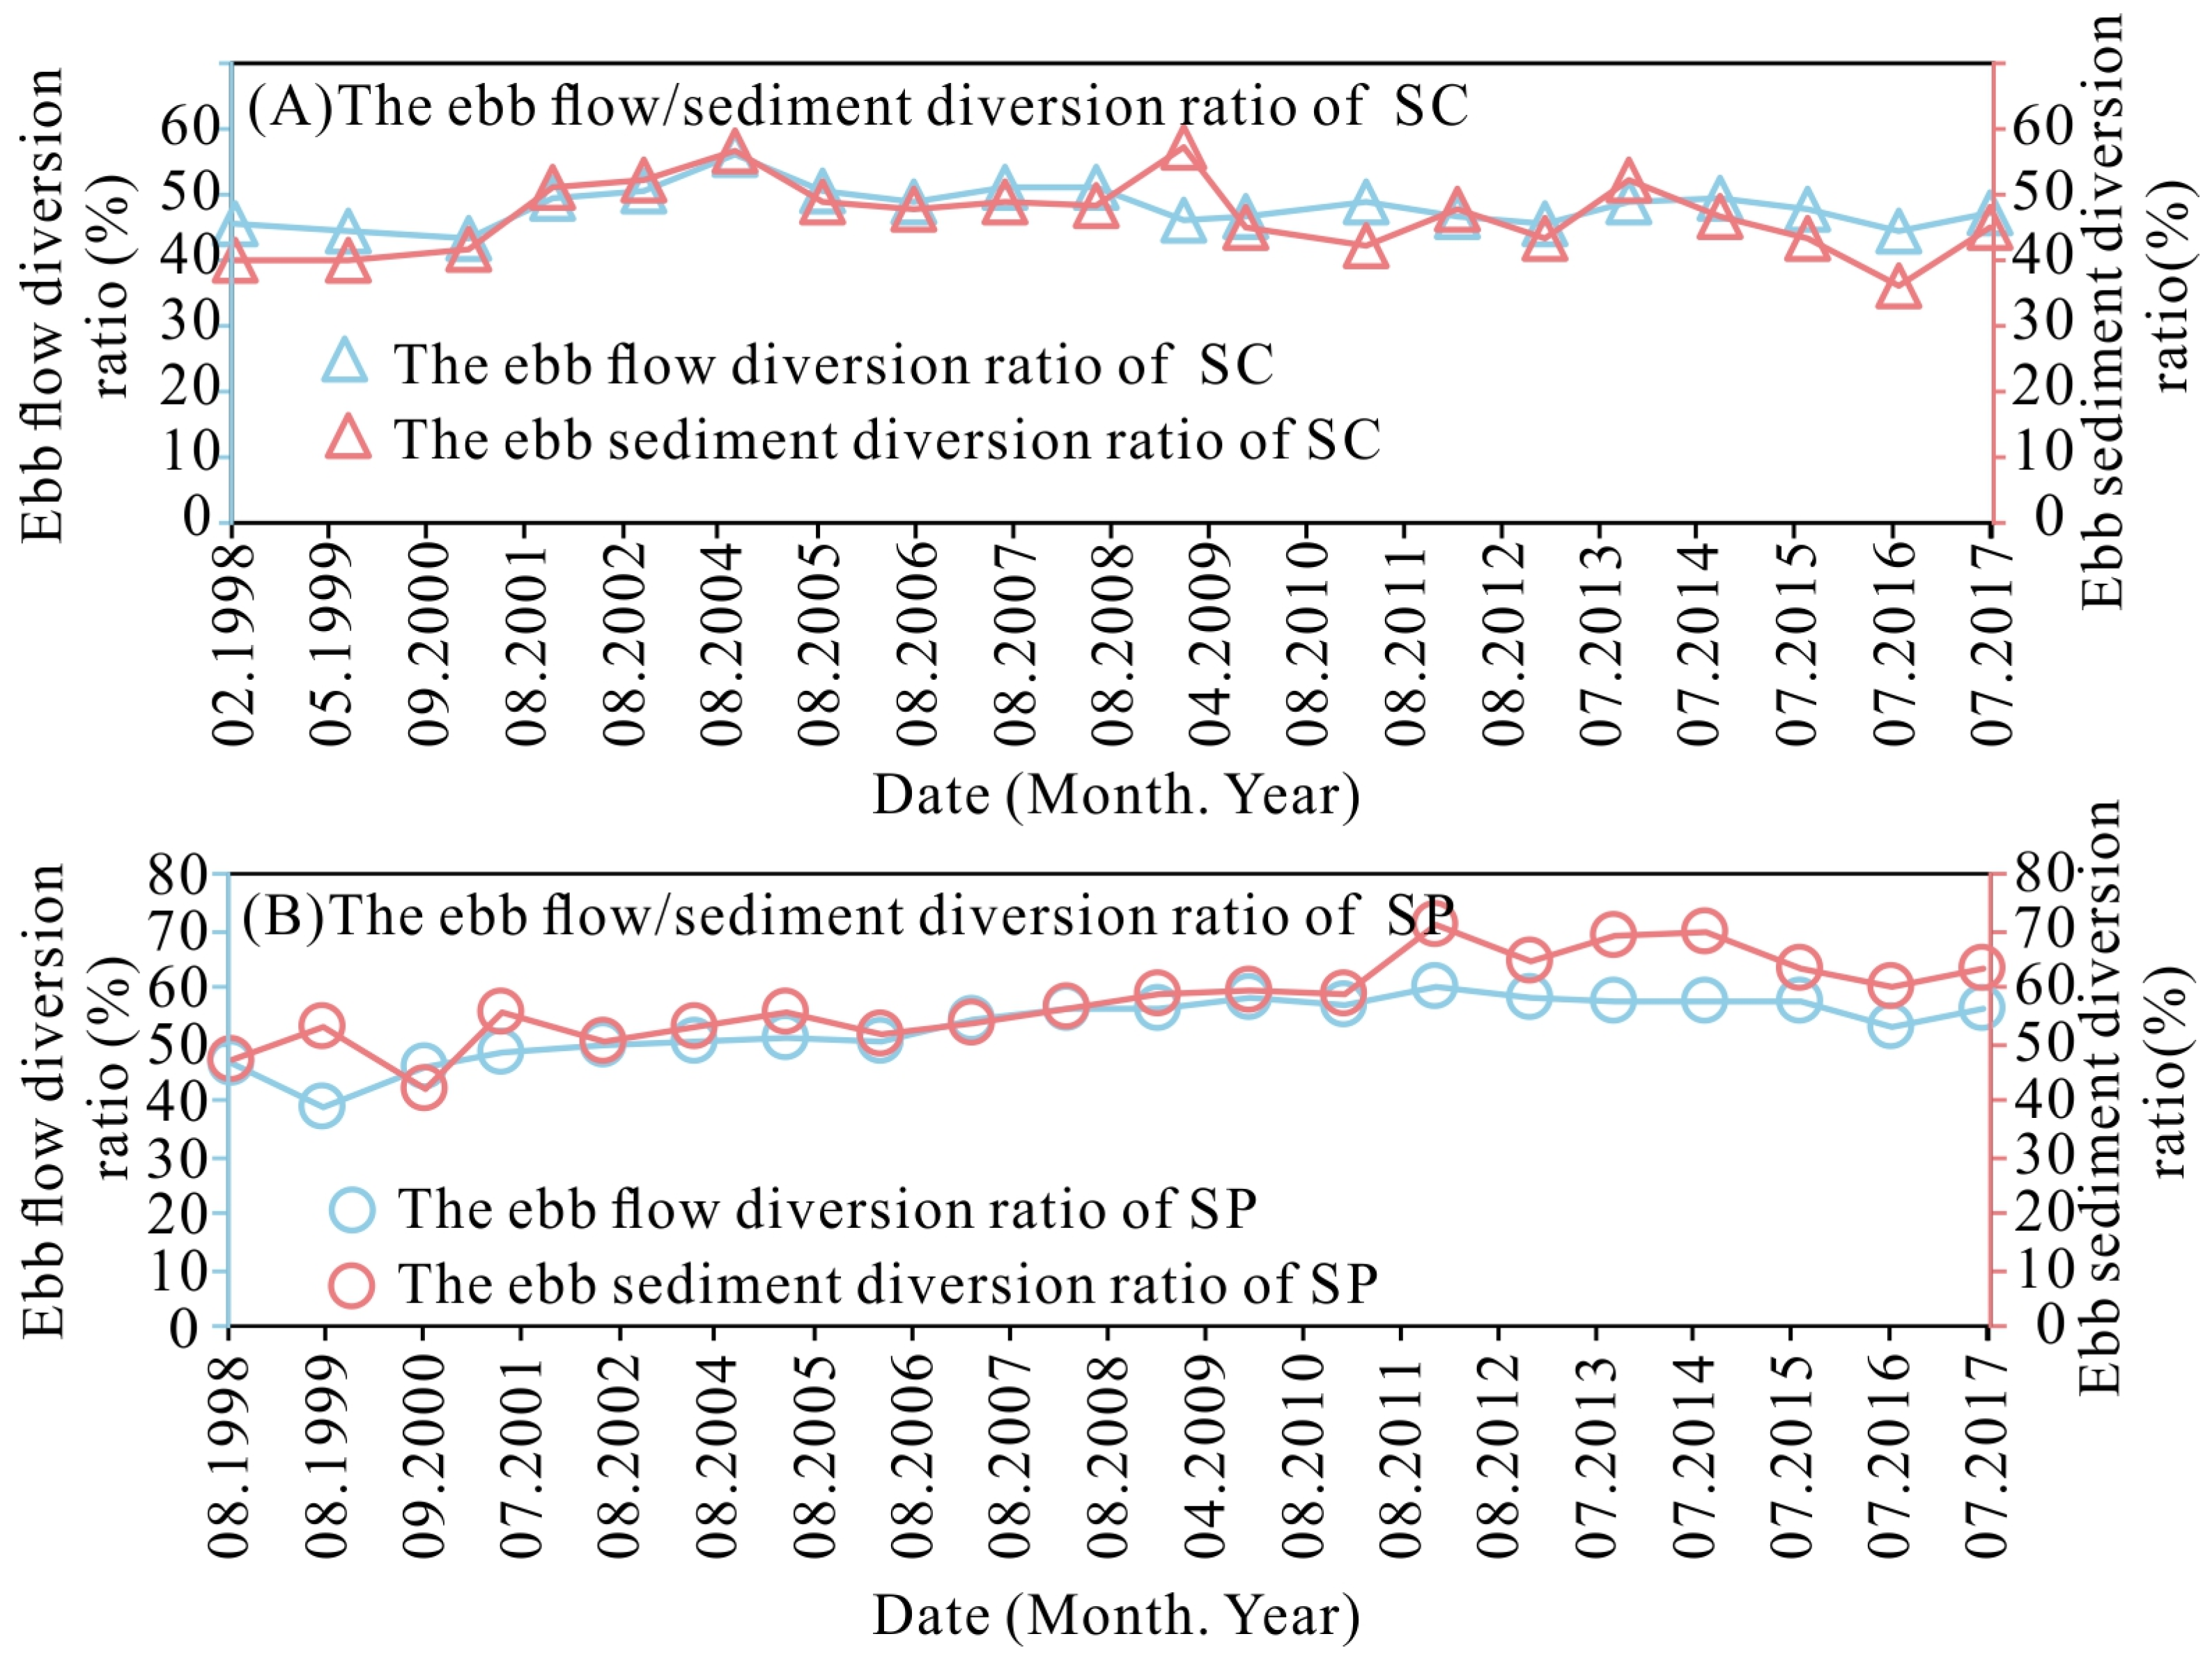
5.1. Impacts of Variations in Flow and Sediment Regimes
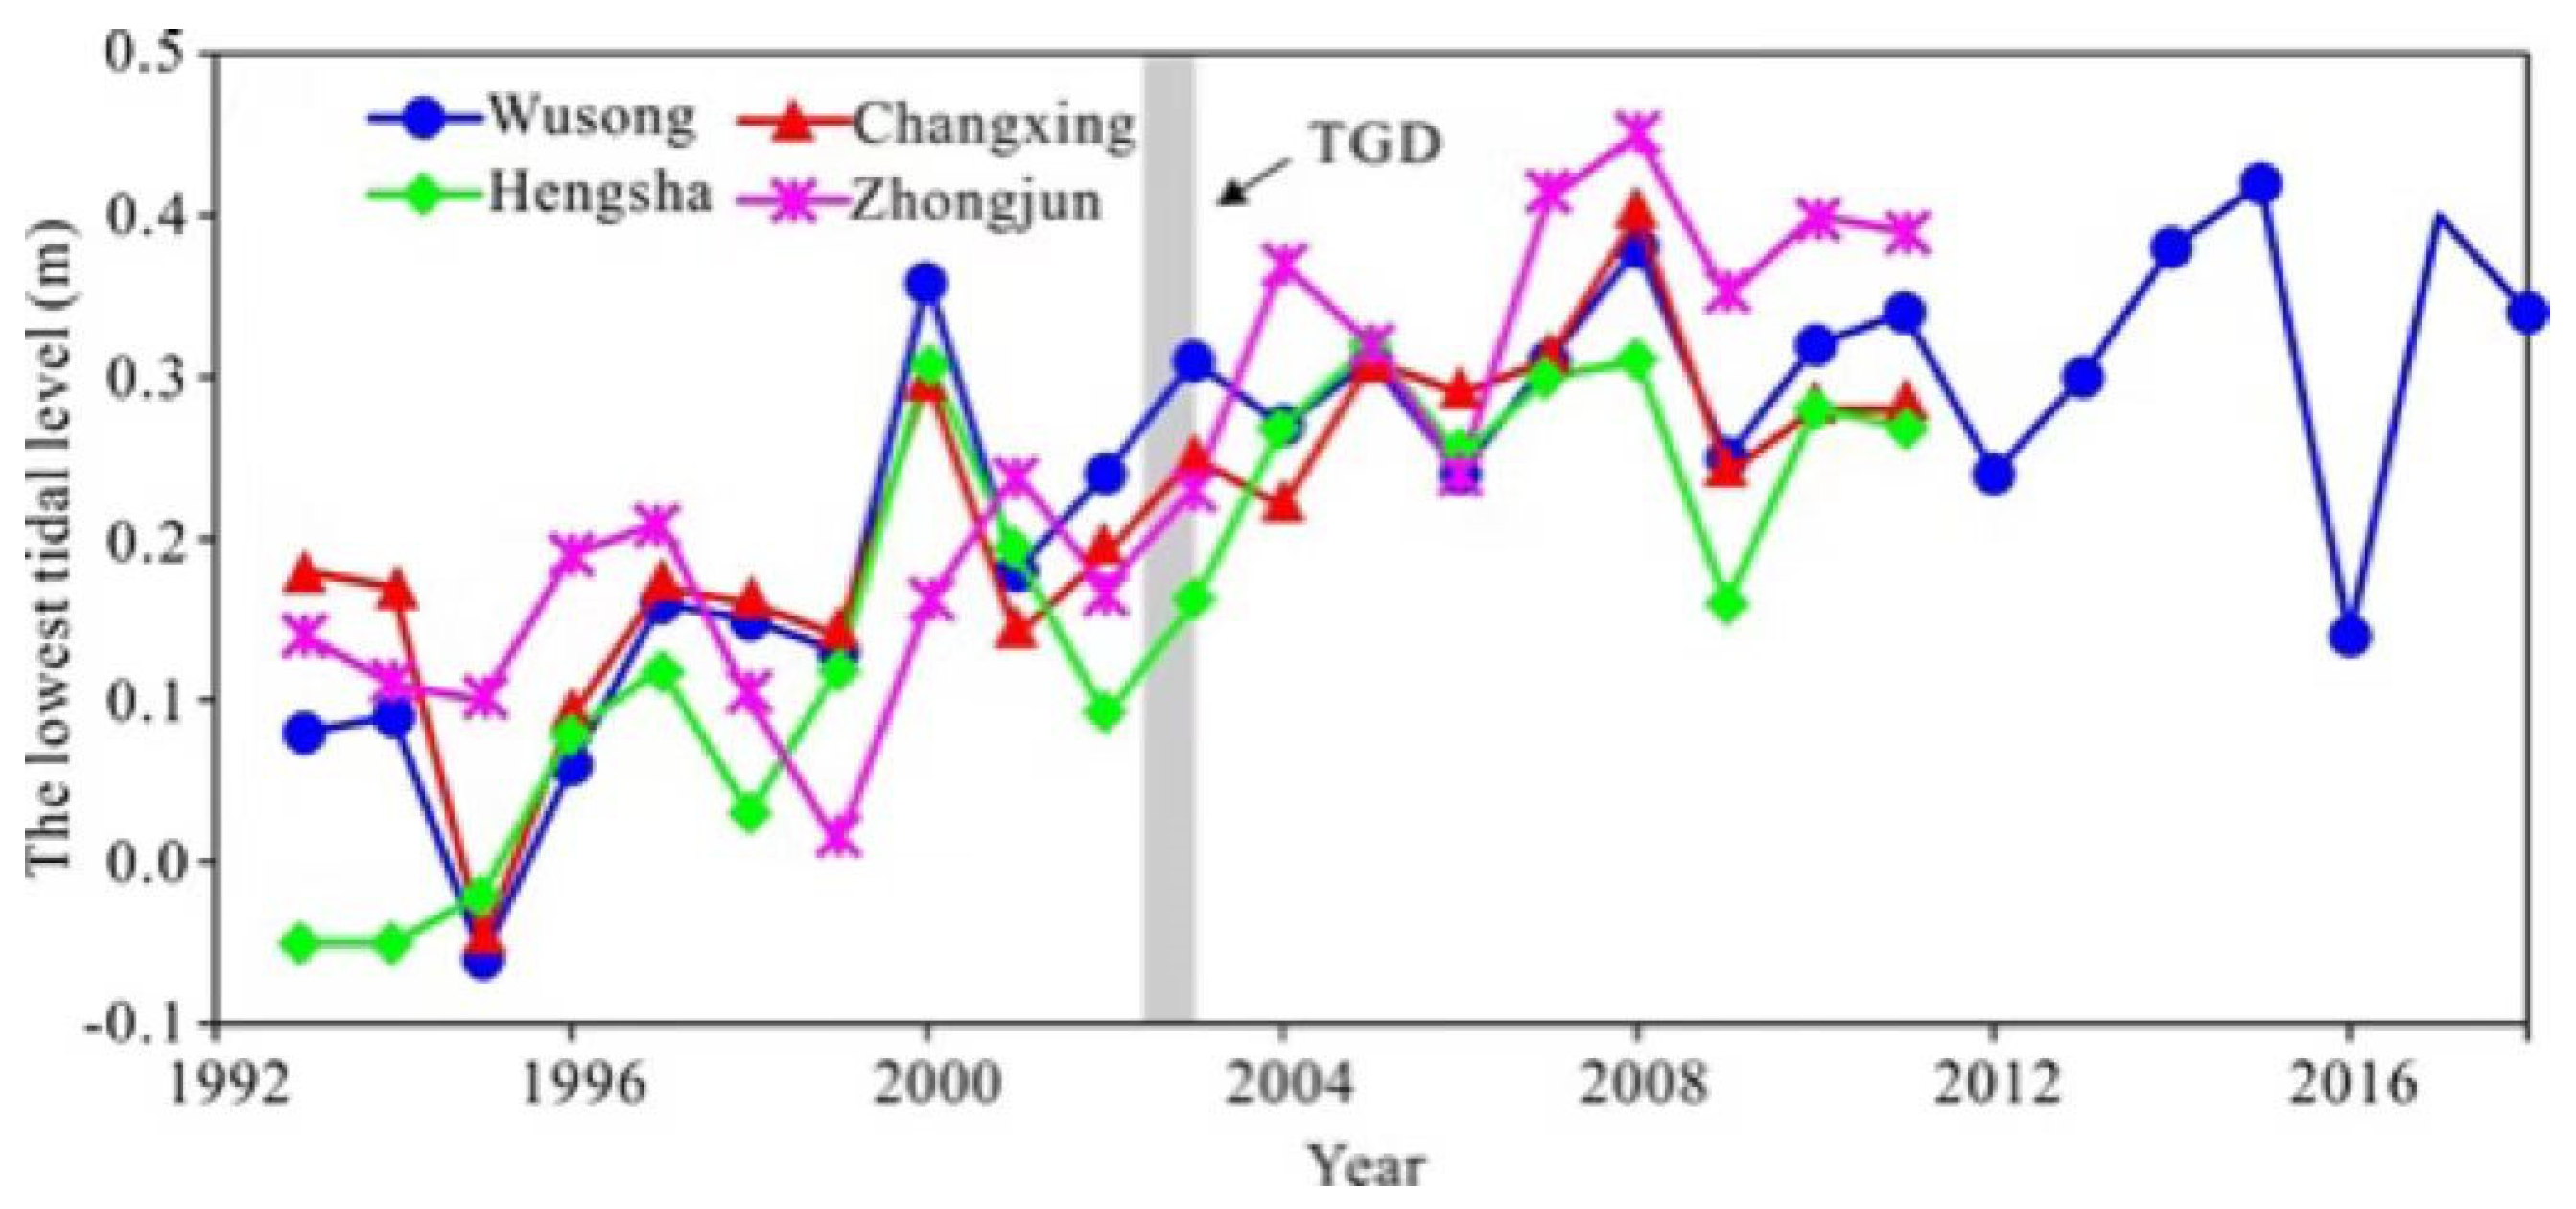
5.2. Impacts of Tidal Processes and Human Intervention
5.3. Relationship between Dune Development and Channel Morphodynamics
5.4. Implication for Other Deltaic Channels
6. Conclusions
Author Contributions
Funding
Data Availability Statement
Acknowledgments
Conflicts of Interest
References
- Walling, D.E.; Fang, D. Recent trends in the suspended sediment loads of the world river. Glob. Planet. Chang. 2003, 39, 111–126. [Google Scholar] [CrossRef]
- Nilsson, C.; Reidy, C.A.; Dynesius, M.; Revenga, C. Fragmentation and flow regulation of the world’s large river system. Science 2005, 308, 405–408. [Google Scholar] [CrossRef] [PubMed] [Green Version]
- Meade, R.H.; Moody, J.A. Causes for the decline of suspended-sediment discharge in the Mississippi River system, 1940–2007. Hydrol. Process. 2010, 24, 35–49. [Google Scholar] [CrossRef]
- Zheng, S.W.; Xu, Y.J.; Cheng, H.Q.; Wang, B.; Xu, W.; Wu, S.H. Riverbed erosion of the final 565 kilometers of the Yangtze River (Changjiang) following construction of the Three Gorges Dam. Sci. Rep. 2018, 8, 11917. [Google Scholar] [CrossRef] [PubMed]
- Wang, B.; Xu, Y.J. Estimating bed material fluxes upstream and downstream of a controlled large bifurcation—The Mississippi-Atchafalaya River diversion. Hydrol. Process. 2020, 34, 2864–2877. [Google Scholar] [CrossRef]
- Xu, W.; Cheng, H.Q.; Zheng, S.W.; Jiang, Y.H.; Zhou, Q.P.; Yang, G.Q.; Yan, H.Z. Riverbed deformation and its response to human intervention on the lower reaches of the Yangtze River. River Res. Appl. 2022, 38, 222–234. [Google Scholar]
- Tejedor, A.; Longjas, A.; Zaliapin, I.; Foufoula-Georgiou, E. Delta channel networks: 1. A graph-theoretic approach for studying connectivity and steady state transport on deltaic surfaces. Water Resourse Res. 2015, 51, 3998–4018. [Google Scholar] [CrossRef]
- Nienhuis, J.H.; Ashton, A.D.; Giosan, L. Littoral steering of deltaic channels. Earth Planet. Sci. Lett. 2016, 453, 204–214. [Google Scholar] [CrossRef] [Green Version]
- Syvitski, J.P.M.; Kettner, A.J.; Overeem, I.; Hutton, E.W.H.; Hannon, M.T.; Brakenridge, G.R.; Day, J.; Vorosmarty, C.; Saito, Y.; Giosan, L.; et al. Sinking deltas due to human activities. Nat. Geosci. 2009, 2, 681–686. [Google Scholar] [CrossRef]
- Nittrouer, J.A.; Viparelli, E. Sand as a stable and sustainable resource for nourishing the Mississippi river delta. Nat. Geosci. 2014, 7, 350–354. [Google Scholar] [CrossRef]
- Jiang, C.; Pan, S.Q.; Chen, S.L. Recent morphological changes of the Yellow River (Huanghe) submerged delta: Causes and environmental implications. Geomorphology 2017, 293, 93–107. [Google Scholar] [CrossRef]
- Zheng, S.W.; Cheng, H.Q.; Lv, J.S.; Li, Z.J.; Zhang, L. Morphological evolution of estuarine channels influenced by multiple anthropogenic stresses: A case study of the north channel, Yangtze estuary, China. Estuarine Coast. Shelf Sci. 2020, 249, 107075. [Google Scholar] [CrossRef]
- Dai, Z.J.; Fagherazzi, S.; Mei, X.F.; Gao, J. Decline in suspended sediment concentration delivered by the changjiang (Yangtze) River into the east China sea between 1956 and 2013. Geomorphology 2016, 268, 123–132. [Google Scholar] [CrossRef] [Green Version]
- Shi, S.; Cheng, H.Q.; Xuan, X.N.; Hu, F.X.; Yuan, X.T.; Jiang, Y.H.; Zhou, Q.P. Fluctuations in the tidal limit of the Yangtze River estuary in the last decade. Sci. China Earth Sci. 2018, 61, 1136–1147. [Google Scholar] [CrossRef]
- Kennish, M.J. Coastal saltmarsh systems in the U.S.: A review of anthropogenic impacts. J. Coast. Res. 2001, 17, 731–748. [Google Scholar]
- Maloney, J.M.; Bentley, S.J.; Xu, K.; Obelcz, J.; Georgiou, I.Y.; Miner, M.D. Mississippi River subaqueous delta is entering a stage of retrogradation. Mar. Geol. 2018, 400, 12–23. [Google Scholar] [CrossRef]
- Fu, Y.T.; Chen, S.L.; Ji, H.Y.; Fan, Y.S.; Li, P. The modern Yellow River Delta in transition: Causes and implications. Mar. Geol. 2021, 436, 10746. [Google Scholar] [CrossRef]
- Wu, Z.; Milliman, J.D.; Zhao, D.; Cao, Z.; Zhou, C. Geomorphologic changes in the lower Pearl River Delta, 1850–2015, largely due to human activity. Geomorphology 2018, 314, 42–54. [Google Scholar] [CrossRef]
- Ji, H.Y.; Chen, S.L.; Pan, S.Q.; Xu, C.L.; Jiang, C.; Pan, Y.S. Morphological variability of the active Yellow River mouth under the new regime of riverine delivery. J. Hydrol. 2018, 564, 329–341. [Google Scholar] [CrossRef]
- Tang, M.; Xu, Y.J.; Xu, W.; Wang, B.; Cheng, H.Q. Three-decadal erosion and deposition of channel bed in the Lower Atchafalaya River, the largest distributary of the Mississippi River. Geomorphology 2018, 380, 107638. [Google Scholar] [CrossRef]
- Yang, S.L.; Milliman, J.D.; Li, P.; Xu, K.H. 50,000 dams later: Erosion of the Yangtze River and its delta. Glob. Planet. Chang. 2011, 75, 14–20. [Google Scholar] [CrossRef]
- Dai, Z.; Liu, J.T.; Wei, W.; Chen, J. Detection of the Three Gorges Dam influence on the Changjiang (Yangtze River) submerged delta. Sci. Rep. 2014, 4, 6600. [Google Scholar] [CrossRef] [PubMed] [Green Version]
- Luan, H.L.; Ding, P.X.; Wang, Z.B.; Ge, J.Z. Process-based morphodynamic modeling of the Yangtze Estuary at a decadal timescale: Controls on estuarine evolution and future trends. Geomorphology 2017, 290, 347–364. [Google Scholar] [CrossRef]
- Wang, B.; Xu, Y.J. Decadal-scale riverbed deformation and sand budget of the last 500 km of the Mississippi River: Insights into natural and river engineering effects on a large alluvial river. J. Geophys. Res. Earth Surf. 2018, 123, 874–890. [Google Scholar] [CrossRef]
- Li, S.; Xu, Y.J.; Ni, M. Drastic changes in sediment, nutrients and major ions in the world largest Reservoir: Effects of damming and reservoir operation. J. Clean. Prod. 2021, 318, 128601. [Google Scholar] [CrossRef]
- Xie, Q.; Yang, J.; Lundström, T.S. Sediment and morphological changes along Yangtze River’s 500 km between Datong and Xuliujing before and after Three Gorges Dam commissioning. Sci. Rep. 2021, 11, 13662. [Google Scholar] [CrossRef]
- Wu, S.H.; Cheng, H.Q.; Xu, Y.J.; Li, J.F.; Zheng, S.W. Decadal changes in bathymetry of the Yangtze River Estuary: Human impacts and potential saltwater intrusion. Estuar. Coast. Shelf Sci. 2016, 182, 158–169. [Google Scholar] [CrossRef] [Green Version]
- Zhou, X.Y.; Dai, Z.J.; Mei, X.F. The multi-decadal morphodynamic changes of the mouth bar in a mixed fluvial-tidal estuarine channel. Mar. Geol. 2020, 429, 106311. [Google Scholar] [CrossRef]
- Zhu, B.Y.; Li, Y.T.; Yue, Y.; Yang, Y.P.; Liang, E.H.; Zhang, C.; Borthwick, A.G.L. Alternate erosion and deposition in the Yangtze Estuary and the future change. J. Geogr. Sci. 2020, 30, 145–163. [Google Scholar] [CrossRef] [Green Version]
- Yang, S.L.; Zhang, J.; Dai, S.B.; Li, M.; Xu, X.J. Effect of deposition and erosionwithin the main river channel and large lakes on sediment delivery to the estuary of the Yangtze River. J. Geophys. Res. Earth Surf. 2007, 112, F02005. [Google Scholar] [CrossRef] [Green Version]
- Chen, J.Y.; Yun, C.X.; Xu, H.G.; Dong, Y.F. The developmental model of the Chang Jiang River estuary during last 2000 years. Acta Oceanol. Sin. 1979, 4, 103–111. (In Chinese) [Google Scholar]
- Cheng, H.Q.; Kostaschuk, R.; Shi, Z. Tidal currents, bed sediments, and bedforms at the South Branch and the South Channel of the Changjiang (Yangtze) estuary, China: Implications for the ripple-dune transition. Estuaries 2004, 27, 861. [Google Scholar] [CrossRef]
- Wu, S.H.; Cheng, H.Q.; Xu, Y.J.; Li, J.F.; Zheng, S.W.; Xu, W. Riverbed micromorphology of the Yangtze River Estuary, China. Water 2016, 8, 190. [Google Scholar] [CrossRef]
- McKean, J.; Nagel, D.; Tonina, D.; Bailey, P.; Wright, C.W.; Bohn, C.; Nayegandhi, A. Remote Sensing of Channels and Riparian Zones with a Narrow-Beam Aquatic-Terrestrial LIDAR. Remote Sens. 2009, 1, 1065–1096. [Google Scholar] [CrossRef] [Green Version]
- Wheaton, J.M.; Brasington, J.; Darby, S.E.; Sear, D.A. Accounting for uncertainty in dems from repeat topographic surveys: Improved sediment budgets. Earth Surf. Process. Landf. 2010, 35, 136–156. [Google Scholar] [CrossRef]
- Van Rijn, L.C. Sediment transport, part III: Bed forms and alluvial roughness. J. Hydraul. Eng. 1984, 110, 1733–1754. [Google Scholar] [CrossRef]
- Li, J.H.; Jiang, E.H.; Zhang, B.M.; Zhang, Y. Stochastic analysis of threshold velocity of sediment particles. J. Sediment Res. 2012, 3, 15–20. (In Chinese) [Google Scholar]
- Shields, A. Application of Similarity Principles and Turbulence Research to Bed-Load Movement; Ott, W.P.; van Uchelen, J.C., Translators; Hydrodyn. Lab. Publ. 167, W.M. Keck Lab. of Hydraul. And Water Resour; California Institute of Technology: Pasadena, CA, USA, 1936. [Google Scholar]
- James, C.S. Prediction of entrainment conditions for nonuniform, noncohesive sediments. J. Hydraul. Res. 1990, 28, 25–40. [Google Scholar] [CrossRef]
- Zhang, R.J. Fluvial Sediment Dynamics; Water Conservancy and Hydropower Press: Beijing, China, 1998. [Google Scholar]
- Guo, X.J.; Cheng, H.Q.; Mo, R.Y.; Yang, Z.Y. Statistical characteristics and transport law of sand waves in the Yangtze Estuary. Acta Oceanol. Sin. 2015, 37, 148–158. [Google Scholar]
- Wengrove, M.E.; Foster, D.L.; Lippmann, T.C.; de Schipper, M.A.; Calantoni, J. Observations of bedform migration and bedload sediment transport in combined wave-current flows. J. Geophys. Res. Ocean. 2019, 124, 4572–4590. [Google Scholar] [CrossRef] [Green Version]
- Meyer-Peter, E.; Muller, R. Formulas for bed-load Transport. IAHSR 2nd Meeting. 1948, Volume 6, pp. 39–64. Available online: https://repository.tudelft.nl/islandora/object/uuid:4fda9b61-be28-4703-ab06-43cdc2a21bd7? (accessed on 1 January 2022).
- Einstein, H.A. The Bed Load Funciton for Sediment Transportation in Open Channel Flows; Technical Bulletins 156389; United States Department of Agriculture, Economic Research Service: Washington, DC, USA, 1950.
- Ackers, P.; White, W.R. Sediment transport new approach and analysis. J. Hydraul. Div. 1975, 101, 621–625. [Google Scholar] [CrossRef]
- Mei, X.F.; Dai, Z.J.; Wei, W.; Li, W.H.; Wang, J.; Sheng, H. Secular bathymetric variations of the north channel in the changjiang (Yangtze) estuary, China, 1880–2013: Causes and effects. Geomorphology 2018, 303, 30–40. [Google Scholar] [CrossRef]
- Zheng, S.W.; Cheng, H.Q.; Shi, S.Y.; Xu, W.; Zhou, Q.P.; Jiang, Y.H.; Zhou, F.N.; Cao, M.X. Impact of anthropogenic drivers on subaqueous topographical change in the Datong to Xuliujing reach of the Yangtze River. Sci. China Earth Sci. 2018, 61, 940–950. [Google Scholar] [CrossRef]
- Guo, L.C.; Su, N.; Townend, I.; Wang, Z.B.; Zhu, C.Y.; Wang, X.Y.; Zhang, Y.N.; He, Q. From the headwater to the delta: A synthesis of the basin-scale sediment load regime in the Changjiang River. Earth-Sci. Rev. 2019, 197, 102900. [Google Scholar] [CrossRef]
- Li, Y.M.; Zhang, G.A.; You, B.W.; Li, Z.H. Recent sediment characteristics and their impact factors in the Yangtze Estuary riverbed. Acta Geogr. 2019, 74, 178–190. (In Chinese) [Google Scholar]
- Saucier, R.T. Geomorphology and Quaternary Geologic History of the Lower Mississippi Valley; U.S. Army Engineer Waterways Experiment Station: Vicksburg, MS, USA, 1994. [Google Scholar]
- Cheng, H.Q.; Chen, J.Y.; Chen, Z.J.; Ruan, R.L.; Xu, G.Q.; Zeng, G.; Zhu, J.R.; Dai, Z.J.; Chen, X.Y.; Gu, S.H.; et al. Mapping sea level rise behavior in an estuarine delta system: A case study along the Shanghai coast. Engineering 2018, 4, 156–163. [Google Scholar] [CrossRef]
- Ollive, E.A.; Edmonds, D.A.; Shaw, J.B. Influence of floods, tides, and vegetation on sediment retention in Wax Lake Delta, Louisiana, USA. J. Geophys. Res. Earth Surf. 2020, 125, e2019JF005316. [Google Scholar]
- Gugliotta, M.; Saito, Y. Matching trends in channel width, sinuosity, and depth along the fluvial to marine transition zone of tide-dominated river deltas: The need for revision of depositional and hydraulic models. Earth Sci. Rev. 2019, 191, 93–113. [Google Scholar] [CrossRef]
- Luan, H.L.; Ding, P.X.; Wang, Z.B.; Yang, S.L.; Lu, J.Y. Morphodynamic impacts of large-scale engineering projects in the Yangtze River delta. Coast. Eng. 2018, 141, 1–11. [Google Scholar] [CrossRef]
- Sun, Y.; Li, B.; Yan, X.X.; Li, Y. Effect of north-south channel bifurcation control engineering on the north channel of Yangtze estuary. J. Sediment Res. 2018, 43, 33–38. (In Chinese) [Google Scholar]
- Yang, T.; Tao, J.F.; Zhang, C.K.; Liu, G.P. Analysis on annual variation of diversion ratio of flow andsediment in Yangtze River Estuary after regulation project. Yangtze River 2012, 43, 84–88. (In Chinese) [Google Scholar]
- Chen, D.; Dai, Z.J.; Xu, R.; Li, D.J.; Mei, X.F. Impacts of anthropogenic activities on the Changjiang (Yangtze) estuarine ecosystem (1998–2012). Acta Oceanol. 2015, 34, 86–93. [Google Scholar] [CrossRef]
- Jiang, C.J.; Li, J.F.; de Swart, H.E. Effects of navigational works on morphological changes in the bar area of the Yangtze River estuary. Geomorphology 2012, 139, 205–219. [Google Scholar] [CrossRef]
- Li, M.T.; Cheng, H.Q.; Zhou, F.N.; Wu, J.W.; Li, B.C. The effect to Sand Digging to bedfrom stability of the South Channel in the Changjiang River Mouth. Hydrogr. Surv. Charting 2011, 31, 54–57. (In Chinese) [Google Scholar]
- Xia, J.; Zhang, Y.; Xiong, L.; He, S.; Wang, L.; Yu, Z. Opportunities and challenges of the sponge city construction related to urban water issues in China. Sci. China Earth Sci. 2017, 60, 652–658. [Google Scholar] [CrossRef]
- Knaapen, M.A.F.; van Bergen Henegouw, C.N.; Hu, Y.Y. Quantifying bedform migration using multi-beam sona. Geo-Mar. Lett. 2005, 25, 306–314. [Google Scholar] [CrossRef] [Green Version]
- Hu, H.; Wei, T.Y.; Yang, Z.Y.; Hackney, C.R.; Parsons, D.R. Low-angle dunes in the changjiang (yangtze) estuary: Flow and sediment dynamics under tidal influence. Estuar. Coast. Shelf Sci. 2018, 205, 110–122. [Google Scholar] [CrossRef]
- Zheng, S.W.; Cheng, H.Q.; Wu, S.H. Discovery and implications of catenary-bead subaqueous dunes. Sci. China Earth Sci. 2016, 46, 18–26. [Google Scholar] [CrossRef]
- Wang, W.W.; Fan, F.X.; Li, C.G.; Yan, J. Activity of submarine sandwaves and seafloor erosion and deposition in the sea area to the southwest of Hainan Island. Mar. Geol. Quat. Geol. Geol. 2007, 27, 23–28. (In Chinese) [Google Scholar]
- Paarlberg, A.J.; Dohmen-Janssen, C.M.; Hulscher, S.J.M.H.; Termes, P.; Schielen, R. Modelling the effect of time-dependent river dune evolution on bed roughness and stage. Earth Surf. Process. Landf. 2010, 35, 1854–1866. [Google Scholar] [CrossRef]
- Wu, S.H.; Xu, Y.J.; Wang, B.; Cheng, H.Q. Riverbed dune morphology of the Lowermost Mississippi River—Implications of leeside slope, flow resistance and bedload transport in a large alluvial river. Geomorphology 2021, 385, 107733. [Google Scholar] [CrossRef]
- Wu, J.X.; Wanng, Y.H.; Cheng, H.Q. Bedforms and bed material transport pathways in the Changjiang (Yangtze) Estuary. Geomorphology 2009, 104, 175–184. [Google Scholar] [CrossRef]
- Zheng, S.W.; Cheng, H.Q.; Wu, S.H.; Shi, S.Y.; Xu, W.; Zhou, Q.P.; Jiang, Y.H. Morphology and mechanism of the very large dunes in the tidal reach of the Yangtze River, China. Cont. Shelf Res. 2017, 139, 54–61. [Google Scholar] [CrossRef]
- Unsworth, C.A.; Nicholas, A.P.; Ashworth, P.J.; Best, J.L.; Lane, S.N.; Parsons, D.R.; Sambrook Smith, G.H.; Simpson, C.J.; Strick, R.J.P. Influence of dunes on channel-scale flow and sediment transport in a sand bed braided river. J. Geophys. Res. Earth Surf. 2020, 125, e2020JF005571. [Google Scholar] [CrossRef]
- Zhan, Y.Z.; Yu, M.H.; Deng, J.Y.; Lu, J.; Huang, L.W. Research on variation law of wave height based on current in tension. J. Wuhan Univ. (Eng. Sci.) 2006, 4, 10–13. (In Chinese) [Google Scholar]
- Cheng, H.Q.; Li, M.T.; Zhou, T.Y.; Xue, Y.Z. High-resolution micro- topography movement in the Changjiang Estuary. China Ocean Eng. 2002, 20, 91–95. (In Chinese) [Google Scholar]
- Southard, J.B.; Boguchwal, A.L. Bed configurations in steady unidirectional water flows; Part 2. Synthesis of flume data. J. Sediment Res. 1990, 60, 658. [Google Scholar] [CrossRef]
- Luan, H.L.; Ding, P.X.; Wang, Z.B.; Ge, J.Z.; Yang, S.L. Decadal morphological evolution of the Yangtze Estuary in response to river input changes and estuarine engineering projects. Geomorphology 2016, 265, 12–23. [Google Scholar] [CrossRef]
- Zheng, S.; Han, S.; Tan, G.; Xia, J.; Wu, B.; Wang, K.; Edmonds, D.A. Morphological adjustment of the qingshuigou channel on the yellow river delta and factors controlling its avulsion. Catena 2018, 166, 44–55. [Google Scholar] [CrossRef]
- Anthony, E.J.; Brunier, G.; Besset, M.; Goichot, M.; Dussouillez, P.; Nguyen, V.L. Linking rapid erosion of the Mekong River delta to human activities. Sci. Rep. 2015, 5, 14745. [Google Scholar] [CrossRef] [Green Version]
- Tang, M.; Xu, Y.J.; Wang, B.; Xu, W.; Cheng, H.; Tsai, F.T.-C. Artificial bifurcation effect on downstream channel dynamics of a large lowland river, the Atchafalaya. Earth Surf. Process. Landf. 2022, 47, 540–552. [Google Scholar] [CrossRef]
- Törnqvist, T.E.; Bridge, J.S. Spatial variation of overbank aggradation rate and its influence on avulsion frequency. Sedimentology 2002, 49, 891–905. [Google Scholar] [CrossRef]
- Syvitski, J.P.M.; Saito, Y. Morphodynamics of deltas under the influence of humans. Glob. Planet. Chang. 2007, 57, 261–282. [Google Scholar] [CrossRef]


| Location | RK | H (m) | D50 (µm) | LD (m) | HD (m) | L/H | A | U (m/s) | GD (kg/s) | V0 (m/s) | Ks |
|---|---|---|---|---|---|---|---|---|---|---|---|
| D1 | 15.5 | 15.5 | 156 | 11.45 | 0.48 | 23.85 | 0.45 | 0.66 | 0.05 | 0.57 | 0.34 |
| D2 | 17.0 | 14.9 | 115 | 9.36 | 0.40 | 23.40 | 0.41 | 0.68 | 0.03 | 0.71 | 0.29 |
| D3 | 18.5 | 14.5 | 68 | 8.24 | 0.41 | 20.09 | 0.36 | 0.70 | 0.07 | 0.72 | 0.21 |
| D4 | 20.0 | 13.6 | 49 | 6.82 | 0.33 | 20.67 | 0.32 | 0.71 | 0.08 | 0.81 | 0.26 |
| D5 | 21.5 | 13.3 | 37 | 5.32 | 0.28 | 19.00 | 0.29 | 0.75 | 0.12 | 0.91 | 0.23 |
| D6 | 23.0 | 13.1 | 25 | 5.80 | 0.25 | 23.20 | 0.26 | 0.83 | 0.19 | 1.08 | 0.18 |
Publisher’s Note: MDPI stays neutral with regard to jurisdictional claims in published maps and institutional affiliations. |
© 2022 by the authors. Licensee MDPI, Basel, Switzerland. This article is an open access article distributed under the terms and conditions of the Creative Commons Attribution (CC BY) license (https://creativecommons.org/licenses/by/4.0/).
Share and Cite
Tang, M.; Cheng, H.; Xu, Y.; Hu, H.; Zheng, S.; Wang, B.; Yang, Z.; Teng, L.; Xu, W.; Zhang, E.; et al. Channel Bed Adjustment of the Lowermost Yangtze River Estuary from 1983 to 2018: Causes and Implications. Water 2022, 14, 4135. https://doi.org/10.3390/w14244135
Tang M, Cheng H, Xu Y, Hu H, Zheng S, Wang B, Yang Z, Teng L, Xu W, Zhang E, et al. Channel Bed Adjustment of the Lowermost Yangtze River Estuary from 1983 to 2018: Causes and Implications. Water. 2022; 14(24):4135. https://doi.org/10.3390/w14244135
Chicago/Turabian StyleTang, Ming, Heqin Cheng, Yijun Xu, Hao Hu, Shuwei Zheng, Bo Wang, Zhongyong Yang, Lizhi Teng, Wei Xu, Erfeng Zhang, and et al. 2022. "Channel Bed Adjustment of the Lowermost Yangtze River Estuary from 1983 to 2018: Causes and Implications" Water 14, no. 24: 4135. https://doi.org/10.3390/w14244135