Article

Potential of Computed Aided Facility Management for Urban Water Infrastructure with the Focus on Rainwater Management

1
Department of Vice-Rector for Quality and Investment Construction, VSB—Technical University of Ostrava, 17. Listopadu 2172/15, 708 00 Ostrava-Poruba, Czech Republic
2
Department of Urban Engineering, Faculty of Civil Engineering, VSB—Technical University of Ostrava, Ludvika Podeste 1875/17, 708 00 Ostrava-Poruba, Czech Republic
*
Author to whom correspondence should be addressed.
Water 2023, 15(1), 104; https://doi.org/10.3390/w15010104
Submission received: 8 November 2022 / Revised: 9 December 2022 / Accepted: 22 December 2022 / Published: 28 December 2022
(This article belongs to the Section Urban Water Management)

Abstract

:
This article focuses on the information modeling of buildings and its subsequent extension to the information modeling of cities, which can be considered as the main topics of the construction industry development. It offers new knowledge for city management, facility management and other fields of construction sector. Information modeling of buildings and cities creates a suitable basis for the creation of various simulations (acoustic, thermal, environmental influence, sunlight or the spread of pollution) and analyses. Simulations and results obtained from them can help us in the decision-making phase, they predict problems or unexpected situations during the life cycle of cities and buildings, and thus make it possible to prevent their occurrence. In the second part of the contribution, an innovative model, the so-called R-WIM, is presented. BIM modeling methods were used for the research and extended to the public environment. The expansion of the public environment digitization enables to obtain a sufficient amount of information about the public space and then subsequently combine them with static weather data. This model deals with Urban Water Infrastructure with the focus on Rainwater Management and has been developed for the particular needs of individual municipalities in the process of solving problem situations associated with rainwater, which is very current due to climate change, and municipalities require appropriate tools to predict the behavior of rainwater so that various compensatory measures can be created.

1. Introduction

In recent years, the digitization of the construction industry has experienced a significant expansion in the form of information modeling (management) of buildings, which innovates the classical thinking about 3D, 4D, 5D and other dimensions of building projects. The transformation from 2D documentation into 3D model is only the foundation for its further use. This methodology can also be applied at the level of cities, which can be referred as city information management. Its task is not only to create a 3D digital information model of the city, but also to make information management more efficient and moreover to optimize management and operation processes. [1]
Well prepared 3D model enables to create many simulations on its basis. Although the information modeling of buildings assumes the possibility of usage its advanced functions, it is still not sufficiently widespread and applied in practice. Simulations can provide us with a lot of information that are generally overlooked or considered as less important.
A number of simulations can be applied into 3D models of buildings and cities. Interior simulations are mainly used nowadays. These take into account the internal design of buildings, designs of its technical and technological equipment, layout, typology, etc. On the other hand, the exterior simulations work with the building envelope, its shape and dimensions, the relief of the terrain or the final location in space. This article focuses on exterior simulations of city built-up areas and its sub-parts.

Municipal Facility Management

A city consists of a large number of elements, users, technologies, buildings, communications and other parts that have different life cycles and different principles of operation. Unlike classic buildings, where the lifespan can range from 60 to 100 years, cities have hundreds or thousands of years, after which maintenance must be carried out to maintain smooth and efficient operation. The main idea behind urban facility management is to improve the quality of the physical environment; create employment opportunities, ensure the safety of residents and ensure the involvement of urban citizens in the design and management of services in the urban environment.
Urban facility management is an intermediary discipline that fills a gap in the thinking of city management concepts. From the definition of facility management is known that the center of property management and operation of buildings, cities and public space must always be a person, i.e., the resident/user of the city. By ensuring comfort, services, integrity, and other basic aspects, residents can be involved into the management and development of cities. Comprehensive research shows that the development of urban areas is closely linked to an understanding of the economic sustainability development. The key to increase citizens’ motivation to participate in urban governance leads from a better understanding of the environment and the needs of inhabitants [1,2].
To extend the current areas of facility management knowledge (strategic, tactical and operational level) effectively to the management of cities, we need to expand them by: spatial planning, data modeling, business models such as PPP, financial and multi-criteria optimization models, social infrastructure in dynamic development, forecasting methods, demographic models, communication methods, spatial statistical methods, and visualization methods. For this new methods and tools based on theories needs to be developed: value orientation, sustainability, motivation of owners and users, community engagement, behavioral changes and resilience.
Modern society requires modern buildings and modern cities which will operate with the lowest possible use of resources, use modern technologies and allow users to participate in their entire life cycle. The urban facility management approach solves problems by acting as a mediator between various interests of stakeholders in the built environment and ensuring that social value is integrated with economic and environmental interests. The development of better-maintained buildings and spaces between them can improve citizen satisfaction, as well as create new opportunities through Smart facility management approaches at the urban scale, thus in line with Smart Cities concepts. Digitization of services on a city scale is still underutilized [3,4].

2. Materials and Methods

The classic perception of facility management focuses on the management and operation of individual buildings and adjacent areas. If we look at all the services that facility management covers, we find that it can also be applied to the city administration. Applicability to the urban environment with the development of technologies, sustainable development strategies and Smart Cities concepts is necessary.

2.1. Management and Data Work

Systems for facility management called as CAFM (Computer Aided Facility Management) and other supporting applications are usually database-based solutions that can absorb a large amount of data collected from a wide range of processes (especially for cities) during the entire municipal life cycle [5,6].
In these systems, there is a comprehensive overview of managed assets (static data) and facility management processes/services (dynamic data). Modern and innovative systems can collect data from other sources, i.e., without the need to put data into the system manually. Other used sources are the previously mentioned digital information models of cities, public databases (real estate cadastre) or backbone systems of cities (ERP).
From foreign studies, it can be found that with the correct use of some of the CAFM systems, up to 30% savings in operating costs could be achieved. This value has to be taken individually and for each software implementation separately [7].
Modern CAFM systems tend to be modular. The modularity of this systems allows to choose only those areas that really interest users. Modules can be, for example: management and administration of areas, lease relationships, infrastructure, buildings and equipment, inventory of movable assets, management of addresses, costs, budgets, contracts, document management, warehouse management, area cleaning, waste management, connection with CAD and GIS systems, etc. Other important elements of the system can be: fleet management, help desk, time planning, financial project management, simulation of unexpected events, material records and others. [8]
The goal of deploying CAFM systems is in particular: the maximum possible reduction of operating costs, focus on quality, whether of services or the environment, focus on mutual relationships between the 5Ps and optimization of their links, extension of the life of managed assets through regular maintenance and control, standardization of data in the software environment and the rules for their insertion, which results in greater overview and easier retrieval of data, internal policy in terms of costs, distribution of activities and overall management, overview of documentation and their subsequent management, assignment and easy tracing, benchmarking, prevention of unexpected events, and also permanently Sustainable Development.
Quality records of data on managed property or territory is a basic prerequisite for the efficiency and economy of subsequent activities. The quality level of records is a very important element in any property or territory management. Records should be uniform, complete, clear, high-quality and standardized. Uniformity and standardization allow easy comparison and data control.

2.2. Connection of CAFM with Municipal Databases

From the above-mentioned descriptions of these information tools for facility management, we can say that they form a clear record database of real estate in municipalities. The records themselves are very clear and easy to use in these systems. CAFM systems have a basis in property records, however, their main component is a whole series of subsequent modules, which are intended for efficient management and operation, primarily focused on individual facility management processes.
Current CAFM systems offer the possibility of connecting a database with a CAD/BIM and GIS environment. With this connection, we can easily search for registered properties or areas of interest on the map, analyze their position in relation to the city or evaluate the subsequent development of the city.
Another part is the assignment of documents and contracts associated with objects or land. Powerful tools also have documentation management in their modules. If we carry out activities related to maintenance, repairs or urban development, we have the option to assign, for example, contracts with suppliers, audit reports, protocols, records and other types of documents.
Of course, this is not a tool for 3D CAD/BIM modeling, but it can be utilized as one of the other ways of obtaining (processing) a 3D model, especially in situations where we do not have enough data available and the digital form is needed.
A point cloud can be one of the ways to obtain an identical model of the built-up area, or its image. As the name implies, there are many (up to billions) of points that are obtained by laser scanning of chosen object. CAD/BIM tools are subsequently able to create an identical image from these points.
Images obtained from the point cloud do not necessarily relate only to buildings, they can be used to very reliably capture, of terrain geometry, greenery or technical objects around the building, or create a complex and identical image of the entire city. This can be used very conveniently in simulations, due to its fast and very accurate method of obtaining a 3D model. However, it is very important to realize that point cloud only create an image of the given object or its surroundings, not a digital information model. The model must be inserted into the image afterwards [9,10,11,12].
Information modeling of cities (information management of cities) is primarily a digital, efficient, clear and comprehensive database of information and it is an incoming trend in the Smart City concept and sustainable urban development concept. There are many that offer 3D city models, however, they cannot be considered as information modeling. This platforms are based on interactive elements that can be easily edited which have descriptive information attached (preferably stored in one of the CAFM systems database).
The modeling principles of both BIM and CIM are very similar, nevertheless they differ in many ways. The basic element in urban information modeling (CIM), as in BIM, is a 3D model, information and the subsequent application of descriptive non-graphical data. However, they differ in the level of detail (LoD) and applicable information from the defined level of information (LoI) [13,14,15].

2.3. Information Modeling and Management of Cities

City Information Management/Modelling (CIM), is an extension to information modeling of buildings. The principles of these methods are very similar, nevertheless they differ in many ways. It is primarily a digital, efficient, clear and comprehensive database of information and enables the correct use of this data at the city level.
CIM goes a step further than BIM. It integrates information provided by BIM into wider urban planning and development. CIM is useful, not only for architects and designers in individual buildings, campuses and urban projects of any scale, as well as for city management. By connecting BIM and CIM, users are provided with interactive 3D models of buildings and cities enriched with information that can be analyzed in real time or other follow-up processes can be performed on them. The 3D city model can be used for simulations too.
The basic components that a city 3D model in a built-up area should include:
  • basic dimensions and shapes of buildings,
  • terrain relief, if it can affect individual simulations,
  • surroundings of buildings, including influential elements (greenery, technical equipment of the village, surrounding buildings, etc.),
  • the roughness of individual surfaces, if they can affect the simulation,
  • materials of individual surfaces, if they can affect the simulation.
For the city model is very important to maintain realistic shapes and size ratios of individual buildings, surroundings, greenery and other facilities, terrain and areas. At the CIM level, it is information about the simulated building, area or part of the building mainly. CIM goes beyond majority of BIM models and files, it brings references to infrastructure, public services, and in addition simulates how people move, behave and interact in the city.
Smart technologies, respectively CIM concept, are an important part of Smart Cities. Accompanying facilities are incorporated into road and public transport systems, commercial buildings, energy monitoring and waste management platforms. Smart buildings are part of increasingly intelligent cities that are able to collect their own data and use it to ensure their efficiency. The potential of CIM is still at the beginning of a long journey, but there is no doubt that it will play a significant role in city design and operation of future cities [16,17].
City information management includes a 3D model of the city, which can be connected with BIM (i.e., solitary constructions created by this methodology) and other data sources. These are essential information for the administration and maintenance of the city, leadership, communication with citizens, simulations and analyses, creation of strategies, budgets and planning. The CIM can contain all the data associated with the operation of the city and allows to combine and connect them with related software solutions (CAFM systems for municipalities).
There are many software solutions for 3D modeling of cities, which enable modeling. However, it is necessary to look at the issue in a broader context and with the possibilities of its further use. In order to use the model in the framework of city management, it is necessary to choose software that allows a much wider use, i.e., with the functionalities and possibilities of the BIM/CIM method.

3. Analysis

In this chapter, the authors present the process of creating a suitable map basis for subsequent simulations. The individual steps, advantages, disadvantages of using information modeling and the possibilities of its potential use are listed in the following text.

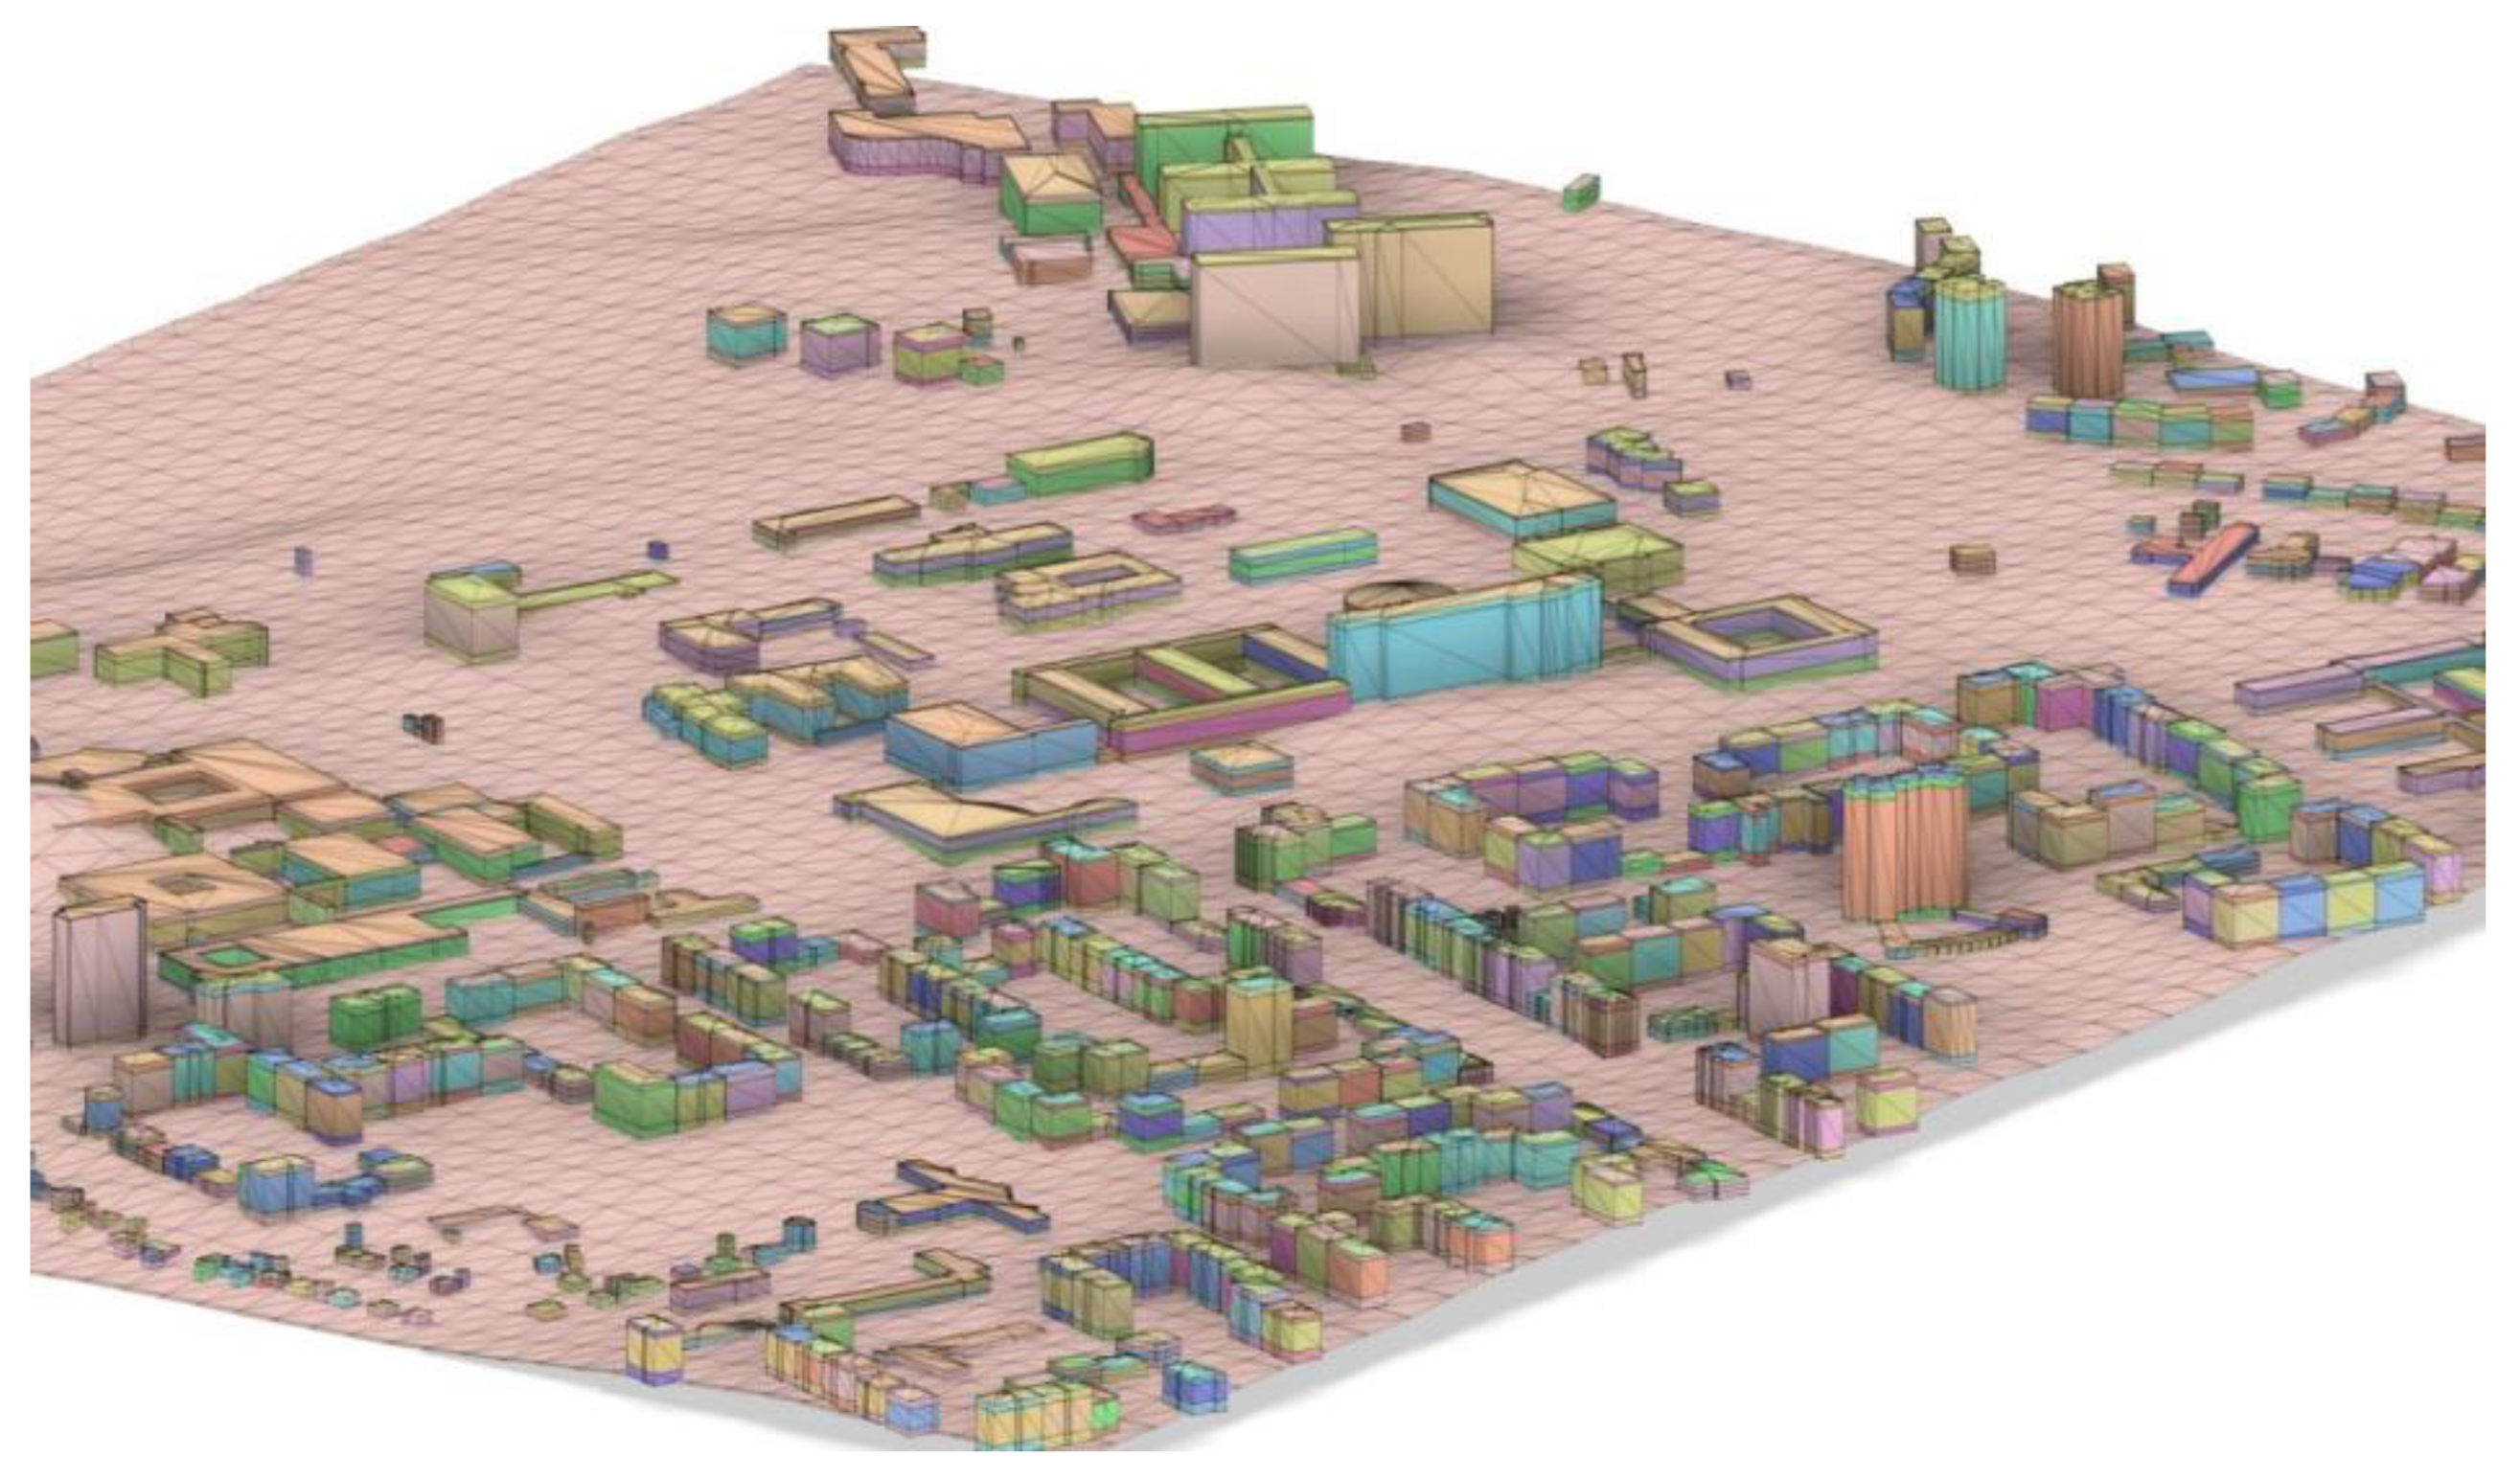
3.1. Processing of the 3D Information Model of the City

The model contains not only buildings on a certain scale, including their heights, but also traffic roads, pedestrian roads, parking areas and parking lots, green areas, crossings, public transport stops, civic amenities, and other elements of the city, which should be clearly marked in the map. The target is to create a real digital information model of the city for effective urban facility management.
Described model was created on the principle of the BIM method, where it uses a clear 3D display mainly. In contrast to 2D maps, this model is “living”, easily updated and with information contained within each part of the map and individual elements also applicable in urban facility management.
The interactive map model of the city has many possibilities of usage and application. Benefits of this approach include, for example:
  • well arranged 3D map of the city with the option of detailed zooming,
  • basis for planning the development of the city, urbanism and its architecture,
  • in one model several maps could be implemented—spatial plan, cadastral map, contour map and others,
  • monitoring the development of the city—based on the proper update of the model over time,
  • basis for analyzes and their evaluation,
  • database of information in the model, an overview of areas, their qualities and other properties of the relevant elements of the city,
  • maintenance management of individual urban elements,
  • effective management of waste management with connection to CAFM,
  • administration and maintenance of roads—roads, sidewalks, cycle paths,
  • the possibility of creating simulations,
  • localization of elements following the CAFM system or using levels.
Easy localization and filtering of city elements can take place without a connection to the facility management system. Individual elements are divided into layers according to the same character. The map model also gives us already calculated areas or volumes of elements.
The main difference between the use of CAD and GIS systems in city management is about access to data. Classical GIS systems work on the basis of maps from other institutions. In the case of 3D display, they are downloaded aerial photos, which are very often out of date, and their time delay between updates is very high. It cannot keep up with the rapid development of the city, and their use is not complete and efficient. A 3D model created in a CAD environment is undoubtedly a bit more time-consuming to create, but it can be updated, created, edited and modeled simultaneously with the needs and development of the city. The main disadvantage of the map model is the hardware requirement due to its scope. The main advantage of the GIS environment is the possibility of covering really large map areas without greater demands on computing power [1,18,19].

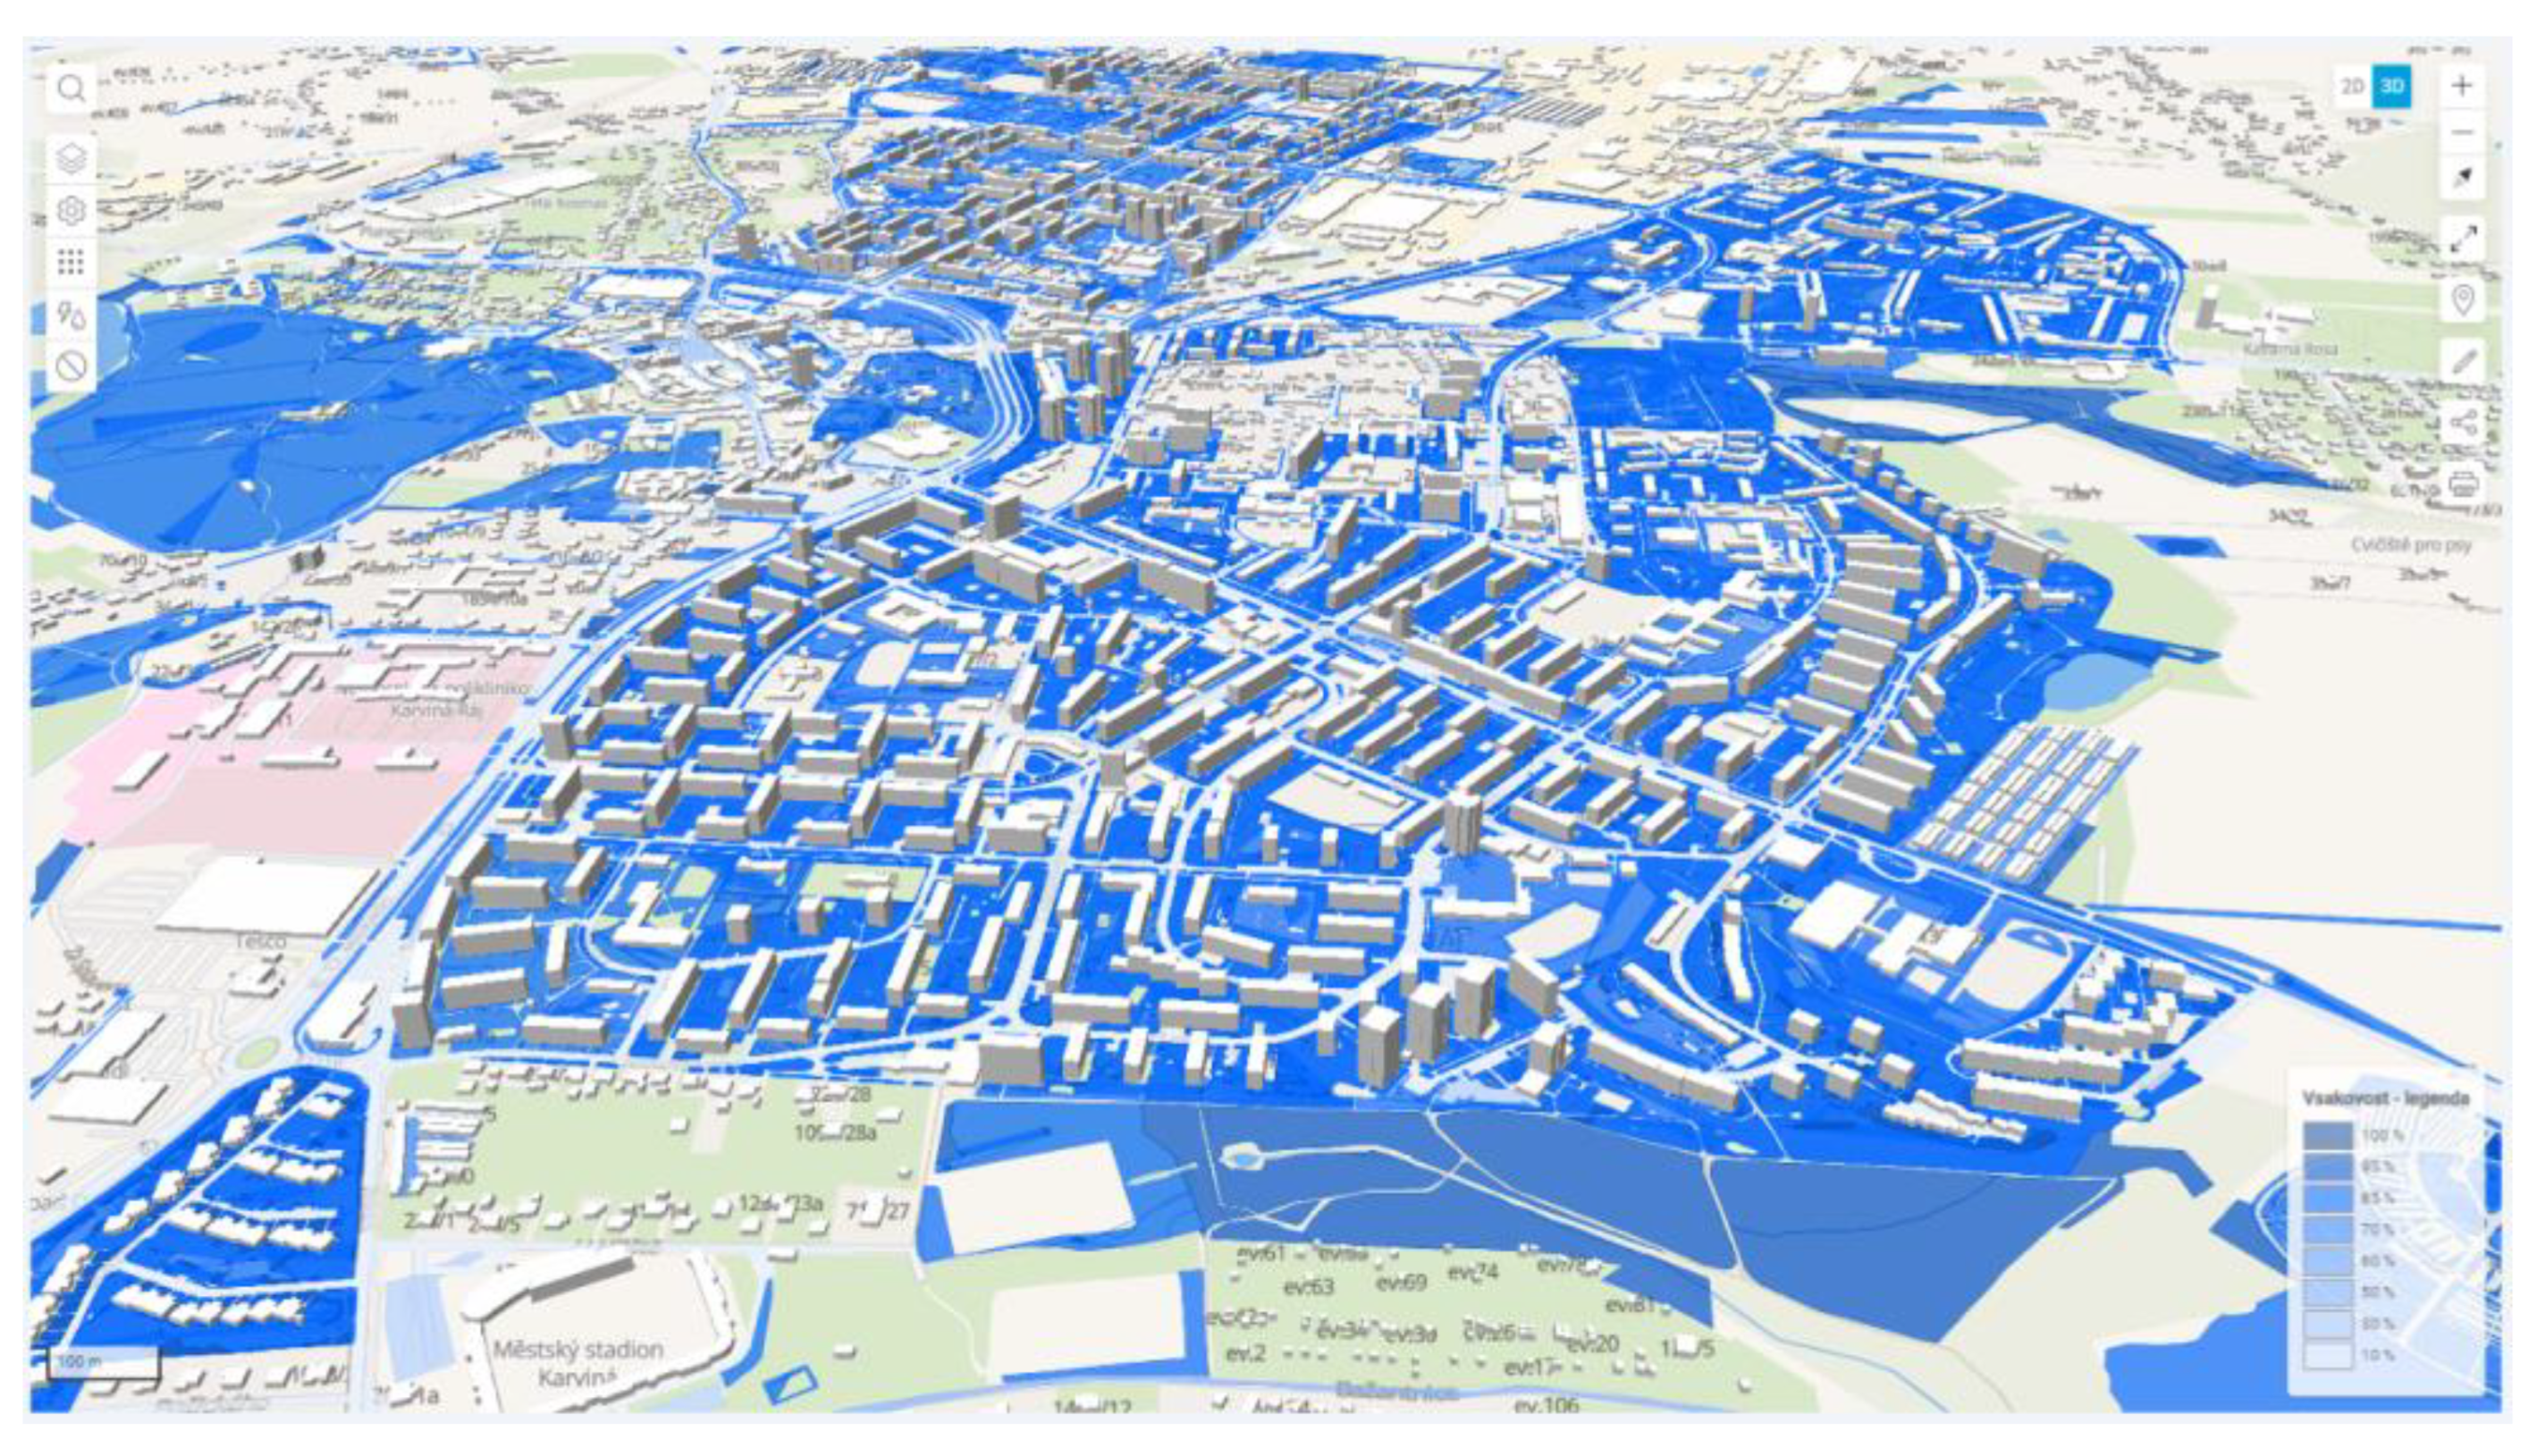
3.2. Map Model Creation

The digital information model of the city in 3D was created using ArchiCAD graphics software and includes all important elements in the graphical representation. The basic element for the map model creation was the acquisition of high quality background information on which the map model is based. A lot of descriptive information on individual elements can be found from internet sources, for example Czech Land Surveying and Cadastre Office webpage- viewing the real estate cadastre or from the websites of individual municipalities.
This method of a single space of all important maps and a map models allows to the relevant city management, or the relevant specific official, to choose what kind of background under the map model is needed—it offers very quick and easy switching between maps.
For urban facility management, the model was imported and further applied in the methodology of the city’s digital information model in the CAFM tool Urbido | City, which can present a 3D city, but this model shows information relevant to each building, communication or other urban element. Within its database users can easily analyze each element and evaluate them based on the principle of CAFM tools for general building management. This system is also linked to the real estate cadastre and other databases, which is essential for urban facility management.
In addition, this system can also place detailed building models in the GIS space, i.e., at their current position relative to the coordinate system, which standard CAD/BIM tools cannot perform They work only with virtual space, and mark the starting point coordinate.
Other software suitable for processing 3D models of the city are Autodesk tools, especially Civil 3D, Revit or InfraWorks. The Autodesk platform has been developing its products towards the digital information models of buildings and cities. This software can appropriately connect buildings, roads and other urban elements with the terrain, and therefore it is more suitable solution for the subsequent simulation.
The model is processed including object textures, which is of course not necessary for simulation. On the contrary, it can be beneficial for other uses, primarily in urban facility management, visualization and planning. This tool can generate a model in FBX or OBJ format, which is a more universal format for 3D models, usable in other software.
For simulation, the city model should be edited in software and in a format that allows further processing of the model. This results into the division of the model into areas and lines.
For simplicity, the model was cleaned up of complex communications and the size of elements, which significantly increased the file and the model itself, and this would not be suitable for further continuation in Autodesk CFD software, in which simulations were performed.
In this case, within the simplified model in OBJ format, the Autodesk CFD software was imported, in which the simulations were performed. There are many formats into which the model can be exported from various CAD/BIM tools (Fusion 360, ArchiCAD, SketchUp, Revit, etc.).
However, in order to successfully upload the model to the simulation system, it would be possible to modify it in various ways in several tools. Unfortunately, it turned out that the digital information model of the city, which is suitable for urban facility management and contains a large number of small parts, furniture, roads, bridges and other elements, is not easily usable for subsequent simulation. The model must be “cleaned-up” in various ways, see Figure 1, simplified and modified (attributes that are not related to a specific problem or simulation are removed from the model, only main attributes are highlighted and necessary information is given only to them; for example for our project the material or color of the drain is not important, what is important is its capacity and location, etc.). Simplifying the model is very important from two points of view. The first consideration is the size of the file and thus the proportional complexity of all subsequent processes. Another point of view is the proper formation of subsequent “mesh” (network) in the CFD (Computational fluid dynamics) simulation tool, which must be correctly generated.
Detailed simulations are very demanding on computing power and it is advisable to perform them using a supercomputer infrastructure. Higher detail of information and results, i.e., a finer and more detailed network of points that defines the simulated situation, increases the computational effort.

3.3. Methods of Calculations and Simulations of Substance Diffusion over a 3D Model

Many simulations can be performed on the model. Results and the utility value depend on several factors: the details of the model, whether we have the building placed in the real built environment or not, information about materials, structural solutions or internal layout and climatic conditions.
Simulations could be divided into several categories and compartmentalize them according to the type or phase of the life cycle of the building/city in which the simulation is performed. Simulations can be simply divided into indoor and outdoor simulations.
In this contribution, authors focus on exterior simulations only.
Exterior simulations are focused on the outdoor environment and the surroundings of buildings. Simulations of this type usually work with climatic conditions, traffic or the influence of the surroundings on buildings in general. Examples of external simulations may include: Sunlight/shading, Air diffusion, Temperature, People movement, Traffic, Statics, Acoustics, Fire and smoke, Floods.
There are many possibilities how to use obtained simulation results. They are depended on the type of simulation, the level of complexity, the complexity of the calculation, as well as on the individual situation and simulation. Many of simulations listed above are already commonly used in practice. However, there are many simulations whose value is underestimated and condemned depending on the time or financial demands. However, these simulations také place in the BIM concept.
If we want to know the behavior of buildings or built-up areas throughout their life cycle, predict problems which may arise, know possible risks or all costs associated with implementation, operation and disposal, many of these simulations must inevitably become an integral part of construction practice.

3.4. Benefit for the Field of Civil Engineering

The evolution of the already applied BIM method is the expansion of CIM concept, i.e., city information management. The current approach of virtual buildings is still about looking into the interior of buildings, with no regard for the surroundings. CIM’s conceptual task is to connect GIS and BIM, i.e., geographic information systems and building information management. The goal is to place BIM in space and time with all important links to its surroundings and other partial BIM models of buildings. But CIM goes much further. It is also about the connection with the smart grid and the people who live in cities. The smart grid sensor network can serve as a relevant basis for data collection about current situations in cities, campuses or territorial units.
Simulations are still underutilized, despite the fact that they may be the greatest contribution to civil engineering science. By demonstrating their benefits, we can ensure that this area continues to be developer for example in engineering, where detailed and regular simulations are commonly practiced.
The usage in practice can be divided into two according to the method of use: hard and soft use.
The use itself can be technological, i.e., the use of methods, procedures and models from replacing 2D GIS systems by complex 3D models or directly digital information models of cities in the CIM concept, as well as complex Smart City technologies, CAFM systems (e.g., Urbido), systems for simulations (e.g., ANSYS Fluent, Autodesk CFD, openFOAM, etc.) mobile solutions and the associated advantages and benefits for society and cities.
Soft use, that is connected with human resources and potential across city structures from strategical, tactical, operative management, as well as the city users. Emphasis should be placed on greater connection between city users and city management in the areas of city development and planning. As a result, users can form a sort of living sensor network, sharing and reporting real-time situations and incidents anywhere in the city.

4. Optimization of Management and Maintenance of the Water Supply Infrastructure

The process of water management infrastructure optimalization can be defined as the blending of different areas, which aim is to make the operation more efficient. The first area is made up by the methods of Facility Management, which helps the state of knowledge of a chosen element in relation to its management, maintenance and operation. These facts form the so-called superstructure and addition of knowledge about a exact infrastructural object, which is given mainly within the individual types of its documentation (project, operational, accounting, auditing, administrative, etc.). The goal of optimization is to ensure economical and falure-free operation with minimal costs and maximum benefits. This goal is more necessary within urban infrastructures, which are often on the verge of technical collapse due to their worn-out construction and technical condition. A reactive, often completely improvised approach to maintenance, and the absence of financial reserves or support from the state or the European Union negatively contributes to the worsening condition. It is appropriate to focus not only on large-scale modernization or renovation of buildings, but also on technical equipment in the area, which is one of the key sources of the fact that individual buildings can subsequently be operated and used as proposed by the designer in the project documentation during the preparation and implementation of the investment.
Everything created by construction and assembly technology is designed and realized by a person in order to use and operate it. This fact is not took into account during the first conceptual considerations of the future investment. Nevertheless, due to poor operation and neglected care, there are partial or even complete restrictions in the systems for drinking water supply or drainage of waste water from the urbanized area. The challenges are more complicated than simply operational issues, and involve lack of investments: aging assets caused by low rehabilitation rates, water losses in water pipes, unwanted inflows in sewer systems, pollution from overflows or frequent flooding, may be caused by poor operation, but also by wrong technical options and low investments
Optimization processes are often very complicated and lengthy, especially due to the scale of infrastructural constructions, however, despite this fact, they must not be left behind. Their long-term neglect or postponement can lead to fatal consequences in the urbanized area, therefore the optimization needs to be solved gradually [20].

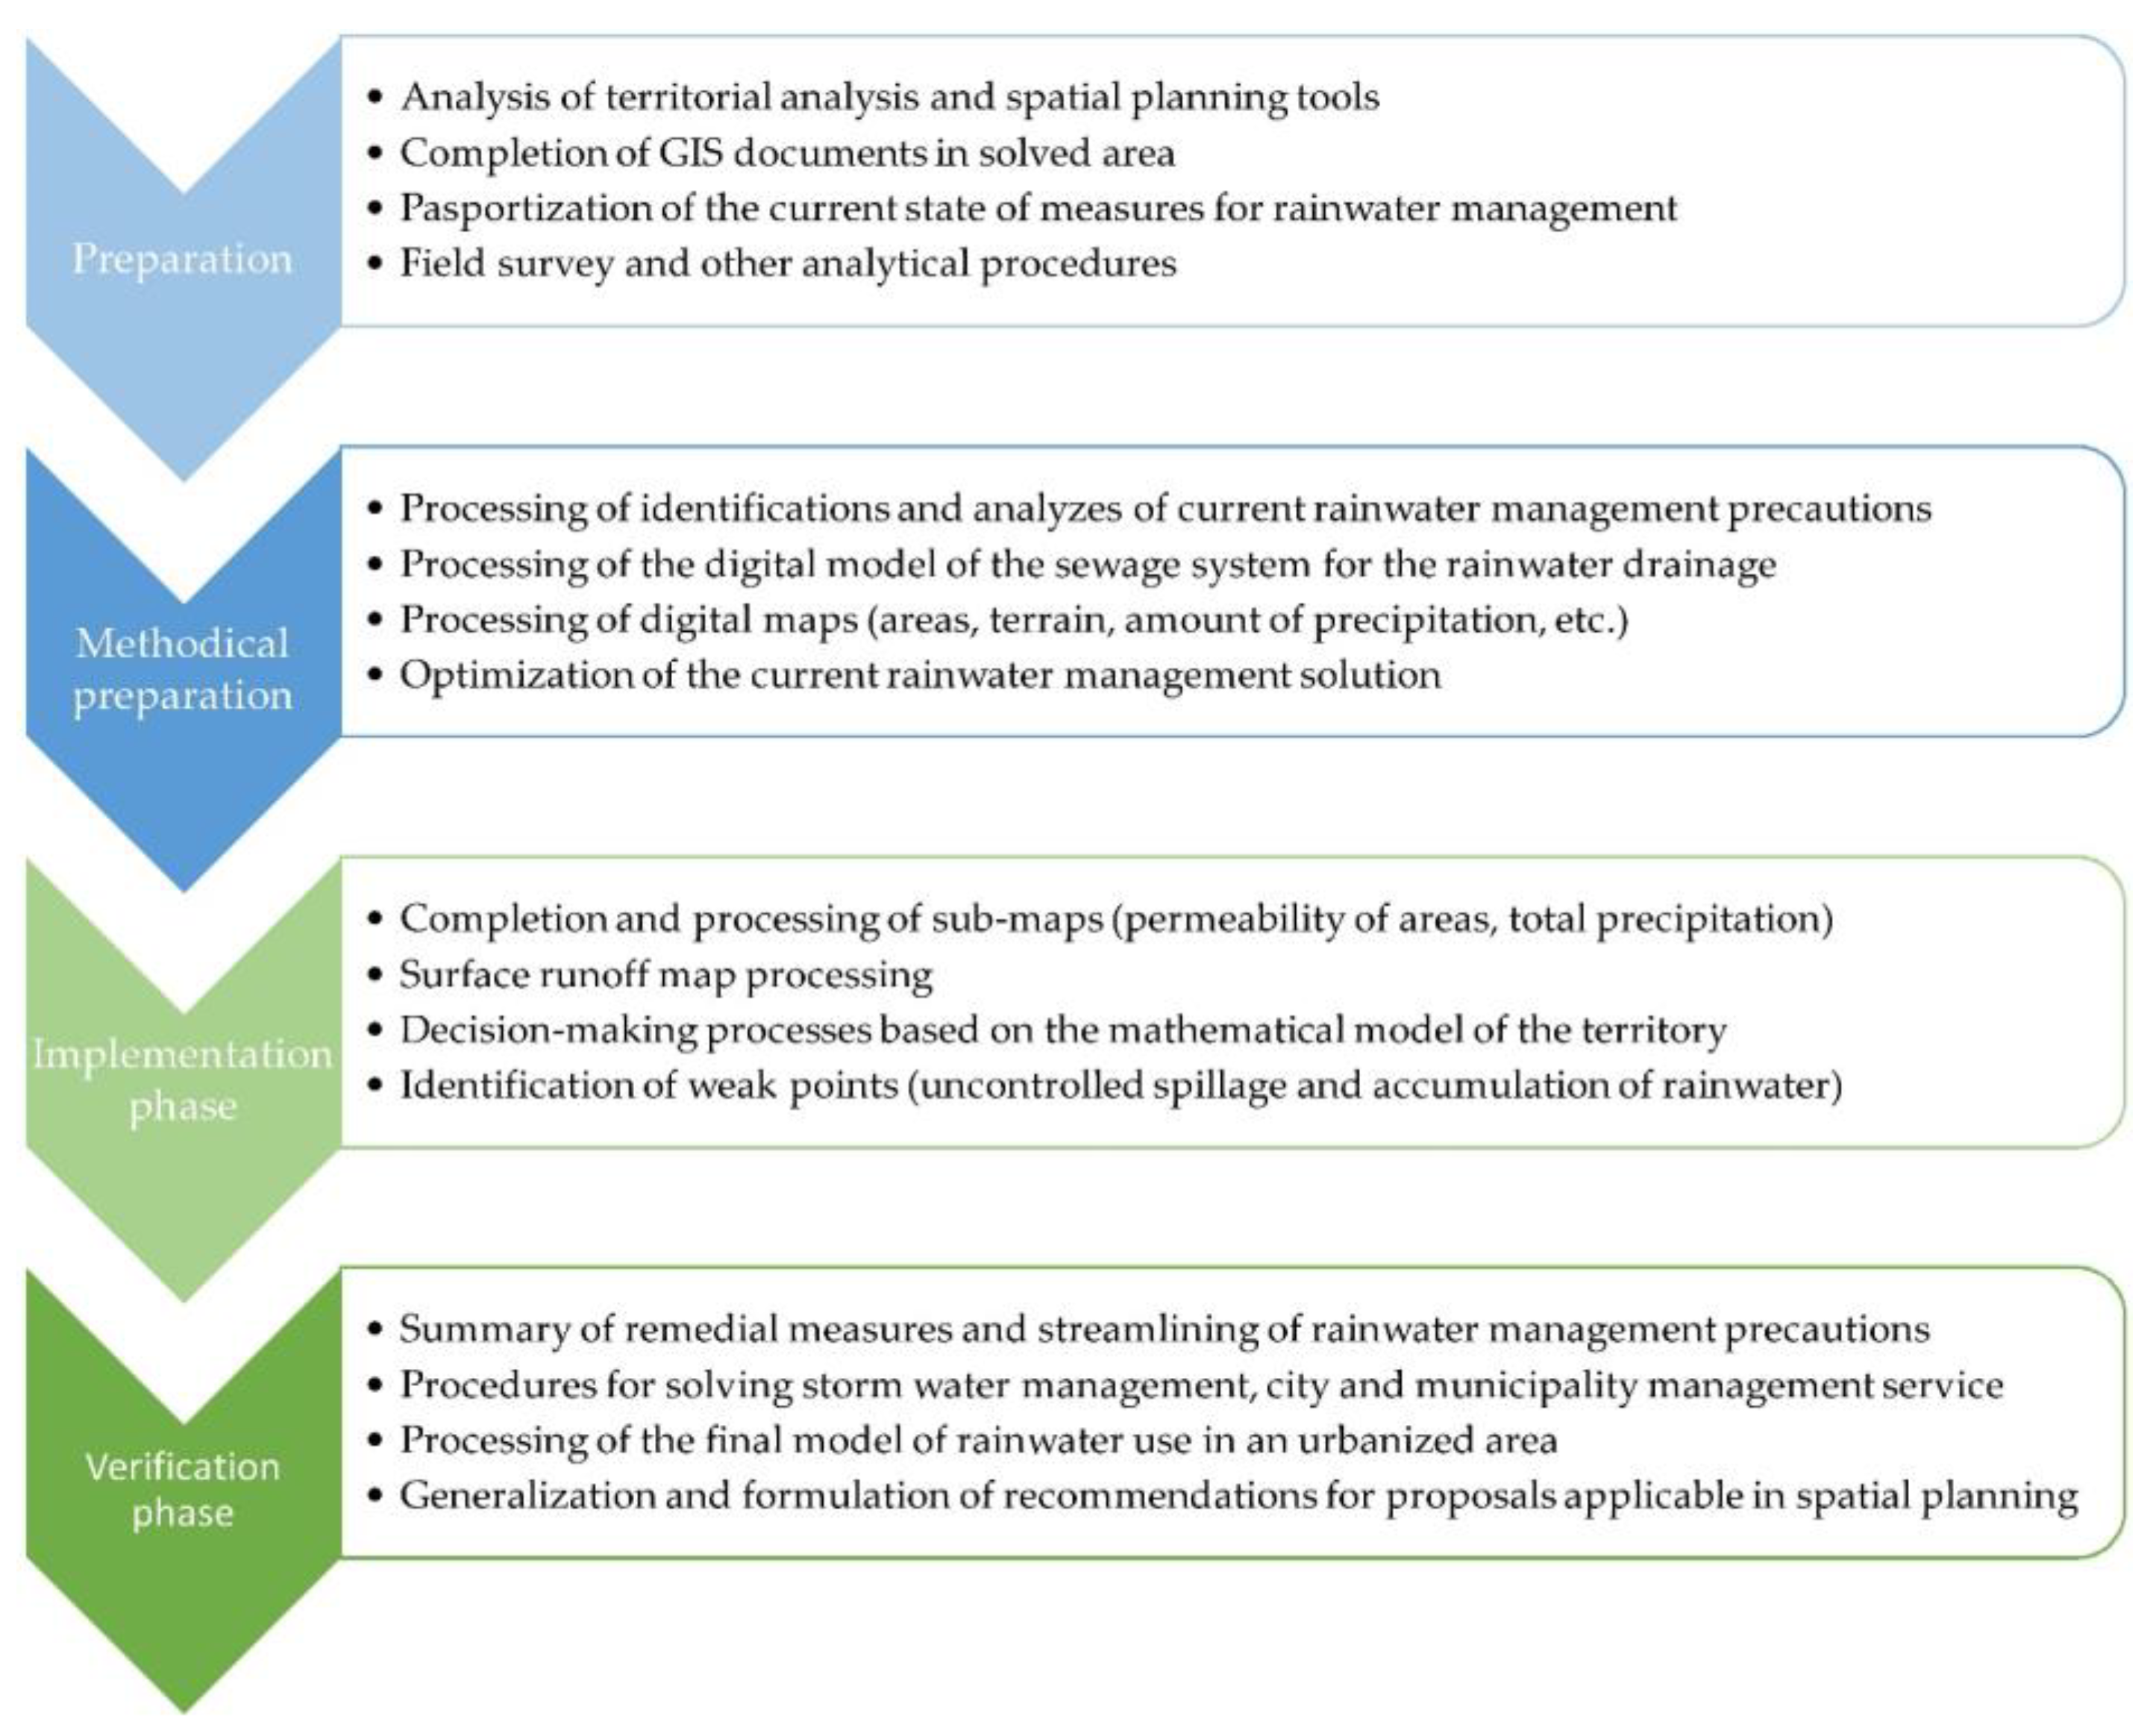
4.1. The Process of Regulation—Correction of the Administration, Maintenance and Operation of the Urban Water Management Infrastructure

The issue of regulation, or corrective measures in the maintenance, management and operation of urban water management infrastructures is a management process that is based on extensive database. This correction is often the result of a long-time period of processing, understanding and evaluating of individual systems and their sub-parts. Regulation itself, or the correction process, can be understood as the fulfillment of activities or errors that originate from individual previous steps (analysis and identification → evaluation) and which lead to the prospective result of optimization (effective management) of individual systems and processes related to them. Remedial measures within the urbanized area can be found, among others, in two areas:
  • Information modeling in public space with a focus on infrastructure
  • Strategy of smart management of rainwater in the urbanized area
These two areas comprehensively solve the issue of operation, management and maintenance of urban water management infrastructure, i.e., issues connected with drinking water supply systems, sewage systems and the issue of rainwater management within the urbanized area of municipalities and cities.

4.2. Information Modeling in Public Space with a Focus on Urban Infrastructure

Information modeling in public space is a process that fulfills the requirements for sustainable territorial development which requires perfect data sharing. The information modelling process focuses on the issue of the Digital Technical Map (DTM) of the Czech Republic expansion with data sets with the aim of creation a comprehensive information model of public space especially with a focus on technical and transport infrastructure. Currently, the issue of information modelling in public space of settlements, as one of suitable tools for the sustainable development of settlements, is not promoted systematically among the individual professions closely affected by it. This situation becomes due to the lack of regulations within the territorial development of settlements.
The goal of the information modeling process is to bring closer the purpose and possibilities of using DTM and BIM in the process of introducing digitization into the Czech construction industry and their use in the management and operation of water supply constructions. Notions such as DTM or BIM are today very often discussed by professionals in all sectors of the construction industry. Logically, it can be deduced that by precise combination of DTM and BIM, it is easy to achieve high-quality management and maintenance of water supply systems, as well as of other infrastructural buildings, primarily thanks to clear and structured data recording and its visualization using a 3D graphic model.
All innovations depend not only on innovative technologies, but also on an environment in which the sharing information, data, communication and mutual cooperation is the key point. An interdisciplinary approach to the solution of information modelling in public space of settlements enables the evaluation of several dimensions of the innovation ecosystem in the public space. Complex information modeling solutions and connections with geographic systems, economic, social and environmental elements of the infrastructure mean an active input into the field of innovation ecosystems.
The whole process focuses on innovative approaches of information modeling and pushes this developing area towards the Digital Map of the Czech Republic and the built environment. The issue of information modelling using other elements such as economics, sociology and environmental approaches is still an unexplored area, both from the point of view of software and functional connection and interconnection of common data in order to increase the effectiveness of individual solutions. This area will also be developed within the approval processes of construction procedures. The novelty is also evidenced by the connection to the Digital Technical Map of the Czech Republic, which is still in the process of creation. Information modelling is an issue that is still primarily concerned with the “interior” of buildings solved in virtual environment. The location of buildings in a specific space and their connection to the transport and technical infrastructure are areas that have not been sufficiently described and applied in practice within the limits of information modelling. In the future, the current information modelling solution may come across precisely in the area of connection with GIS and the infrastructure of settlements, therefore it is very appropriate to describe and identify the correct data and model solutions, which will be verified on specific examples and widely applicable in public space. This issue should be pointed from more sides, i.e., from the point of view of information models and suitable data sources in right formats and structures. Within the process of IM in the public space, the effort to apply new philosophies and new approaches to information and data sharing is crucial.

4.3. Strategy for Smart Stormwater Management in Urbanized Areas

The strategy of smart rainwater management in the urbanized area of cities and settlements can also be referred to as “Rain—Water Information Management (Modelling)”, abbreviated as “R-WIM”. It is a tool focused on the identification and analysis of the weak points of the urbanized area, which need to be addressed as a part of minimizing the impact of climate change, but especially on the proposal of corrective measures for the controlled slowdown of surface runoff of rainwater. The purpose of this tool is to improve the efficiency of rainwater management in the environmental area in settlements and provision of operative solutions to stormwater and droughts. The main goal is to design a controlled slow down (retardation) of the surface runoff of rainwater in an urbanized area, in the form of easily maintainable surface infiltration and retention facilities supplemented with greenery, or by replacing impermeable paved surfaces with permeable ones. The sub-goals of the R-WIM instrument are to growth the volume of underground water level and the consequent reduction of potential risks arising from climate change. Within the tool, it is also possible to carry out analyzes and predictions important for smart management of the urbanized area [21,22].
Climate change on Earth has already been confirmed and proven many times. The cause of this change is, among other things, human settlements, characterized by a large amount of paved surfaces that do not support the natural cycle of water and this phenomena changes the microclimatic conditions of settlements. Rainwater falling on the paved surface is drained as quickly as possible to the public sewer network and subsequently away from the urbanized area. For this reason, the natural rainwater infiltration into underground layers or their evaporation is significantly affected. However, the combination of the influence of climate change and the degree of urbanization in larger cities and towns has already progressed into the situation when the population is increasingly facing periods of drought or flash floods on the other hand. This fact is caused by the absence of an effective strategic plan, which would specify how to effectively use and link the individual sub-steps aimed at rainwater management so that they mutually form a unified and easily sustainable whole. The R-WIM tool is aimed at solving problems within the territory as a whole, while it is partly based on already known findings, which it appropriately supplements and solves in a wider context. Current territorial analysis and master plans do not address this area, however, some municipalities perceive this fact and welcome the processing of this issue.

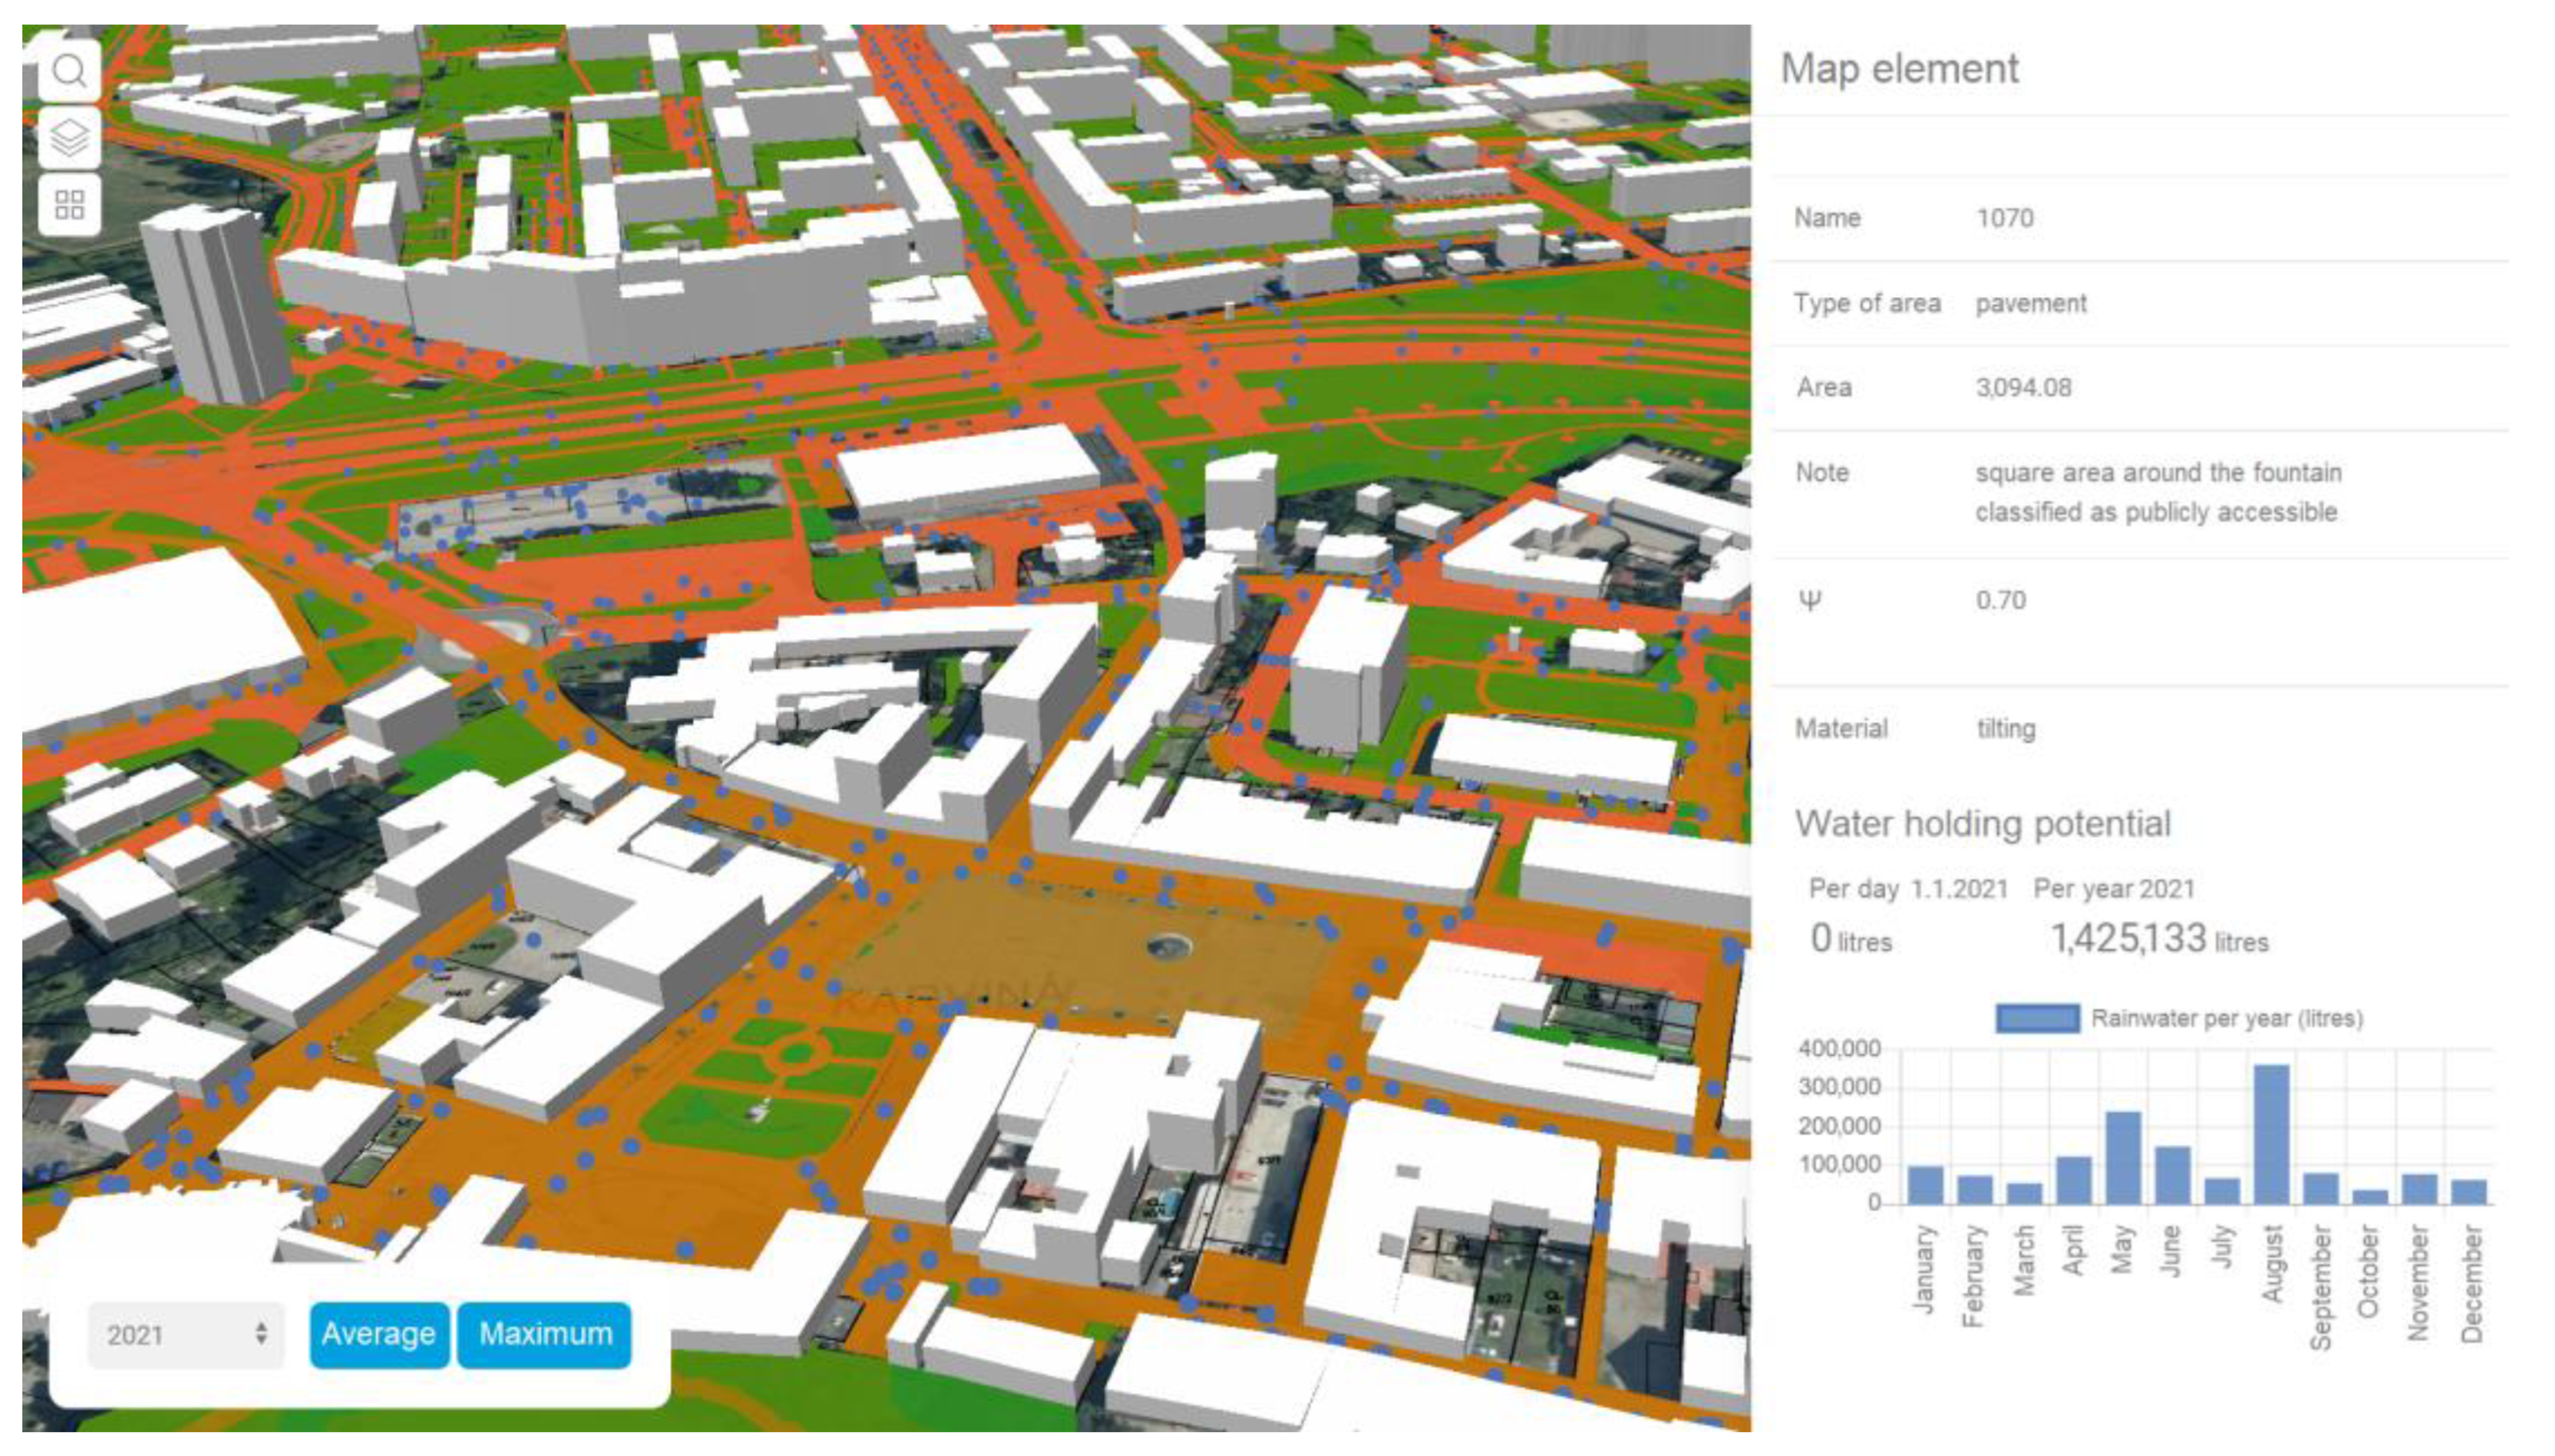
4.4. Methods and Materials for R-WIM Model Creation

The basic input analysis for the creation of the R-WIM model was the determination of the amount of rainwater that falls on different types of surfaces that are located in an urbanized environment. Proposals for appropriate measures for rainwater management always are dependent on the amount of rainwater, which determines the required capacity or scope of the given measure. The determination of the rainwater volume is dealt with, among other things, the technical standard Rainwater absorption equipment. The dominant part of the calculation states with the determination of the so-called reduced dimension of the drained areas from which the rainwater are drained, while this reduced area is calculated according to the formula:
Ared = ∑ni=1 Ai ∗ ψi [m2]
where:
Ared: total reduced dimension of the drained areas 1 to n,
Ai: the dimension of the drained areas [m2],
ψ: coefficients of precipitation surface water runoff, see Table 1,
n: the number of drained areas of a certain type.
For the calculation of the reduced dimension of the drained areas Ared, the runoff coefficient ψi is important, which depends on the permeability of the given surface or its material and it is determined in the range from 0 to 1. The value 1 represents an absolutely impermeable (usually non-absorbent) surface, on the contrary the value 0 represents the maximal surface absorption, see Table 1. After the determined size of the so-called reduced areas, the amount of rainwater drained from the reduced area can be calculated according to the formula number 2, while the coefficient qs, representing the so-called standard rain intensity, is essential for the calculation. This intensity represents the amount of precipitation water typical for a given location per unit of time, generally the unit is given in l/s/ha and within the Czech Republic it ranges approximately between 110 and 140 l/s/ha. The total amount of rainwater within the given drained area is determined by following formula:
Qcel = Ared * qs [l/s]
where:
Qcel: the total amount of discharged rainwater [m2],
Ared: total reduced dimension of the drained areas 1 to n,
qs: intensity of standard rain of the considered periodicity in the given territory [l/s/ha].
Table 1. Coefficients of precipitation surface water runoff ψ (source: authors according to technical standard Rainwater absorption equipment).
Type of Drained Surface (Type of Surface Treatment)Surface Slope
to 1%from 1% to 5%over 5%
Coefficients of Precipitation Surface Water Runoff ψ
Roofs with a permeable upper layer (vegetated roofs)from 0.4 to 0.7 *from 0.4 to 0.7 *from 0.5 to 0.7 *
Roofs with a layer of gravel over an impermeable surfacefrom 0.7 to 0.9 *from 0.7 to 0.9 *from 0.8 to 0.9 *
Roofs with an impermeable top layer1.01.01.0
Roofs with an impermeable top layer with an area greater than 10 000 m20.90.90.9
Asphalt and concrete surfaces, pavements with solid joints0.70.80.9
Paving with sand joints0.50.60.7
Adjusted gravel areas0.30.40.5
Unimproved and undeveloped areas0.20.250.3
Communication created by the grass blocks0.20.30.4
Communication created by the infiltration blocks0.20.30.4
Parks, playgrounds 0.10.150.2
Grassed area 0.050.10.15
* According to the thickness of the permeable upper layer (as the thickness of the permeable upper layer increases, the runoff coefficient of precipitation surface water decreases to the indicated lower limit value).
The type of surface (material) has a great influence on surface runoff (soaking on a grassy surface is definitely diametrically different from the way it soaks on a surface made of asphalt or concrete). The slope of the terrain, which was also taken into account when developing the model, also contributes to the speed of the surface runoff.
In addition to calculating the amount of rainwater, it was necessary to secure the following documents from the data administrator:
  • Graphical sources:
    • Cadastral map
    • Passport of communications
    • Passport of green public spaces
    • Sewage passport (mainly street drains)
    • Passport of parking areas
    • Digital terrain model
    • Height chart for digital technical map (geodetically oriented height points)
  • Other non-graphical sources:
    • Rainfall totals for the years 2011–2021 (data by the Czech Hydrometeorological Institute, or data from individual rain gauge stations in the localities addressed)
    • Numbers/surface legend for passports (information about the type of surface—pavement, granite cubes, asphalt, grass, gravel, etc.)
    • Coefficients of precipitation surface water runoff
In the initial phase of the project solution, an extensive analysis of dimensions and location of individual areas and surfaces was processed (Table 2). According to this analysis, the classification of individual areas (mentioned above) was ensured and the corresponding runoff coefficient was assigned to each.
As integral part of the research, other possible solutions and attributes were also analyzed. For example, the solution within the framework of modeling on the plots of private owners has also been analyzed. Nevertheless the orientation on the solution was rejected, because data on individual plots are not sufficiently available for the model’s needs. Therefore, the research was mainly concerned with public space, as the issue of managing rainwater is dealt with by law (Building Act, Water Act, Water Supply and Sewerage Act). In those laws it is mentioned that all private plot must each private owner deal with stormwater by himself and on his property. Rainwater from private plots does not flow to the territory that has been addressed.
Furthermore, we analyzed the parameters of street drains (the drain has a given design capacity, i.e., the amount of water that one drain can hold per unit of time; generally the design parameter describes that classic drain can serve a maximum of 400 m2 area). The absorption rates will be reduced by the operating coefficient (a lower real absorption rate caused by operating circumstances) in further calculations that we will subsequently implement.
Due to its complexity, the presented model can be used not only for localization of weak spots, i.e., places where rainwater is retained (these spots must be addressed by designing measures for rainwater management), but also the R-WIM process can also be used to optimize the sewer network (all sewer networks are overloaded in general). The model will therefore make it possible to find places where there is the greatest load on the sewer network and subsequently make it possible to propose rainwater drainage measures in these places. The benefit is then the possibility of relieving the wastewater treatment plant in the event of heavy rainfall.
The novelty of the R-WIM tool is primarily due to the processing of basic (input) models, which can be processed in the form of interconnected layers, including connections to various data environments (e.g., real estate cadastral data, Czech Hydrometeorological Institute data), or possibly supplemented with other algorithms ensuring calculations and analyzes (calculations of surface runoff depending on the type of surface and the coefficient of runoff for definite surface). The essence of the R-WIM tool is therefore to make rainwater management more efficient within an urbanized area. The actual processing of rainwater management with the use of R-WIM takes place in four subsequent time phases, as shown in Figure 2.
One of the key outputs of the R-WIM tool are interactive maps of the urbanized area with a representation of runoff conditions. These maps form a comprehensive basis for processing the analysis and management of rainwater in the urbanized area, while the individual maps are processed in the form of interconnected layers. By combining partial map data (base map of areas, maps of terrain morphology, drainage networks, permeability of areas, or maps of total precipitation), the resulting interactive Surface Runoff Map could be created, which will determine problematic territories, e.g., where rainwater accumulates, etc.
Nevertheless, for urban areas, without a good calibrated model simulating the hydraulic performance of overland flow, inlets, urban sewers and their interactions, realistic flooding results are not possible, and softwares are available for that purpose.
This specialized maps, especially individual sub-maps, form one of the starting materials for solving rainwater management issues. Working with map documents and their processing has a significant influence on the creation of the resulting measures in the implementation and verification phase of the R-WIM solution. Individual maps can form basic research in a picked area (from analysis of the current state), and create the basis of which other improvement measures can be implemented. However, the most important is the resulting specialized interactive map, which forms the basic graphic basis for processing and solving corrective measures in elected urbanized area.
In Figure 3. a sample of another sub-map is presented, depicting an interconnected map environment, in which, for example, the color difference of individual areas is designated. Each color presents a different type of surface. This data is taken from the real estate cadastral database and may be further supplemented and expanded.
An environment containing a database with a wide range of functionalities forms the superstructure of these map documents, see Figure 4. On the picture is shown the output linked to the previous Figure 3, where the individual attributes can be adjusted, scaled, balanced or modeled in different ways, and on this basis, effective measures for rainwater management can be evaluated and proposed. In Figure 4, we can see the attributes of the selected entity, which include in particular: material, precipitation total, area, surface type, etc.

5. Conclusions

Process of optimization play an important role in the management of the administration and maintenance of not only water management buildings, but also the construction industry in general. In today’s digital era, when almost every operator has at least basic software tools for data digitization and passportization and thus has huge amount of data available, which, however, are not often handled effectively and the data potential is not sufficiently utilized. In general, the optimization process means maximizing the use of all the database content (whether it is spatial data, e.g., DTM, as well as registry, descriptive or statistical data) for the purpose of streamlining the processes of management, maintenance and overall operation of buildings. These goals can be achieved at least with the use of general management tools, or Facility management, which collected data can be correctly and quickly analyzed, modified, edited and used for their further use [23,24,25,26].
The innovative trend in the construction industry is primarily digitization, which in this field directs current and future projects to use the BIM method. A number of worldwide publications and methodologies have already been created about this method; how to correctly apply and implement this method in the organization. However, They are oriented to individual buildings in detail rather than to the surroundings of the buildings.
One area that is still somewhat neglected in the construction industry is the creation of simulations. This is relatively demanding and financially expensive area, but with the development of technologies and the emerging of BIM method (and also CIM), which presupposes the creation of a 3D model, simulations will also become a common part of construction practice [27].
The main goal of the research was to comprehensively analyze the territory of the selected cities with regard to the forecast of the rainwater behavior on their territory. An extensive analysis of the dimensions and location of individual areas and surfaces was processed. On the basis of detailed spatial data, as well as data on the location of storm sewers, including their inlets, it was possible to start the modeling process of predicting the behavior of rainwater in the area. Critical points were thus revealed and corrective measures will be determined in the following project implementation process.
The subject of the research is therefore a very current topic. The authors became convinced especially in the process of obtaining the data. The addressed cities communicated very actively and their representatives acknowledged that such a project is very desirable for their further development. Only due to this open cooperation the creation of such an extensive model was possible, which the addressed municipalities will be able to use for planning their territorial development for free.
Orientation to the issue of rainwater is very important and therefore the authors of the presented model provide municipalities with a tool that makes it possible to effectively manage their public spaces. However, even the best developed model does not guarantee the optimization of territory management, but it is only up to the municipalities themselves how do they approach to this problem. For this reason, the processing of the model has been taken into account that it is necessary to create the user-friendly and simple to operate model. Frequent consultations with the municipalities, but also with the professional public enables the improvement of the model and ensure its appropriate, easy and quick implementation into practice. Considering that the municipalities are committed to using the output of the project, it is expected that it authors will be requested to process other elements of public spaces.

Author Contributions

N.S. and M.T. provided the conceptualization, funding acquisition, and data curation. M.F. provided the methodology, software, and visualization. F.K. provided writing (review and editing), visualization, and resources. S.E. provided writing—original draft, supervision, validation, and resources. All authors have read and agreed to the published version of the manuscript.

Funding

This work was supported by the Technology Agency of the Czech Republic—grant number SS03010146 “Research and application of Water Information Management as a strategy of smart rainwater management in urban areas of the Moravian-Silesian Region”.

Data Availability Statement

Not applicable.

Conflicts of Interest

The authors declare no conflict of interest. The funders had no role in the design of the study; in the collection, analyses, or interpretation of data; in the writing of the manuscript, or in the decision to publish the results.

References

  1. Blanchet, C.; Castaing, C.; Beaufils, M.; Emmanuel, D. GeoBIM (MINnD) Use Case on an Infrastructure Acoustic Study: Feedback on the Use of CityGML and InfraGML 2017. Available online: https://portal.opengeospatial.org/files/?artifact_id=75554 (accessed on 28 March 2019).
  2. Kuda, F.; Teichmann, M.; Proske, Z.; Szeligova, N. Modern approaches of facility management in the management and maintenance of underground services. In Proceedings of the SGEM2017. 17th International Multidisciplinary Scientific GeoConference 2017: Ecology and Environmental Protection, Albena, Bulgaria, 27 June–6 July 2017. [Google Scholar] [CrossRef]
  3. Rogelj, V.; Bogataj, D. Social infrastructure of Silver Economy: Literature review and Research agenda. IFAC Pap. 2019, 52, 2680–2685. [Google Scholar] [CrossRef]
  4. Tichy, T.; Broz, J.; Smerda, T.; Lokaj, Z. Application of Cybersecurity Approaches within Smart Cities and ITS. In Proceedings of the 2022 Smart City Symposium Prague (SCSP), Prague, Czech Republic, 26–27 May 2022; pp. 1–7. [Google Scholar] [CrossRef]
  5. CAD cz. CAFM Systems. IT Support for Facility Management. Available online: http://www.cad.cz/pdmplm/7-2007/1311-cafm-systemy-it-podpora-facility-managementu.html (accessed on 31 October 2022).
  6. Ruzicka, J.; Tichy, T.; Hajciarova, E. Big Data Application for Urban Transport Solutions. In Proceedings of the 2022 Smart City Symposium Prague (SCSP), IEEE, Prague, Czech Republic, 26–27 May 2022; pp. 1–7. [Google Scholar] [CrossRef]
  7. IFMA. Facility Management. USA. Available online: http://www.ifma.org/ (accessed on 31 October 2022).
  8. Vyskocil, A.; Vlastimil, K.; Kuda, F. Management of Support Processes: Facility Management, 2nd ed.; Professional Publishing: Prague, Czech Republic, 2011; ISBN 978-80-7431-046-1. [Google Scholar]
  9. BIM Pilot #01: The Point Cloud Is Not a Model! BIM Pilot. 2016. Available online: http://www.bimpilot.cz/bimblog/category/RD%20Kl%C3%A1nova (accessed on 10 May 2015).
  10. Ochmann, S.; Vock, R.; Wessel, R.; Klein, R. Automatic reconstruction of parametric building models from indoor point clouds. Comput. Graph. 2016, 54, 94–103. Available online: http://linkinghub.elsevier.com/retrieve/pii/S0097849315001119 (accessed on 31 October 2022). [CrossRef] [Green Version]
  11. Ministry of Industry and Trade. Concept of BIM Czech Republic. 2017. Available online: https://www.mpo.cz/assets/cz/stavebnictvi-a-suroviny/bim/2017/10/Koncepce-zavadeni-metody-BIM-v-CR.pdf (accessed on 31 October 2022).
  12. Azhar, S. Building Information Modeling (BIM): Trends, benefits, risks, and challenges for the AEC industry. Leadersh. Manag. Eng. 2011, 11, 241–252. [Google Scholar] [CrossRef]
  13. Level of Development–LOD- as a Lifecycle BIM Tool. Areo Blog-Lifecycle BIM and Smart FM. 2016. Available online: http://blog.areo.io/level-of-development/ (accessed on 31 October 2022).
  14. Wei, X.; Bonenberg, W.; Zhou, M.; Wang, J.; Wang, X. The case study of BIM in urban planning and design. Adv. Intell. Syst. Comput. 2017, 600, 207–217. [Google Scholar] [CrossRef]
  15. Building Information Modelling (BIM). Loyd’s Register: Utilities and Building Assurance Schemes. 2016. Available online: http://www.lr.org/en/utilities-building-assurance-schemes/building-information-modelling/ (accessed on 31 October 2022).
  16. Townsend, A.M. Smart Cities: Big Data, Civic Hackers, and the Quest fot a New Utopia; W.W. Norton & Company: New York, NY, USA, 2014. [Google Scholar]
  17. Smith, D.; Tardif, M. Building Information Modeling: A Strategic Implementation Guide for Architects, Engineers, Constructors, and Real Estate Asset Managers; John Wiley & Sons: Hoboken, NJ, USA, 2009; ISBN 978-0-470-25003-7. [Google Scholar]
  18. Arroyo Ohori, K.; Diakite, A.; Krijnen, T.; Ledoux, H.; Stoter, J. Processing BIM and GIS models in practice: Experiences and recommendations from a GeoBIM project in the Netherlands. ISPRS Int. J. Geo Inf. 2018, 7, 311. [Google Scholar] [CrossRef] [Green Version]
  19. Eastman, C.M.; Eastman, C.; Teicholz, P.; Sacks, R.; Liston, K. BIM Handbook, A Guide to Building Information Modeling for Owners, Managers, Designers, Engineers, and Contractors; John Wiley & Sons: Hoboken, NJ, USA, 2011. [Google Scholar]
  20. Teicholz, E. Facility Design and Management Handbook; McGraw-Hill: New York, NY, USA, 2001. [Google Scholar]
  21. Teichmann, M.; Szeligova, N.; Kuda, F. Influence of Flash Floods on the Drainage Systems of the Urbanized Area. In Advances and Trends in Engineering Sciences and Technologies III, Proceedings of the of the 3rd International Conference on Engineering Sciences and Technologies (ESAT 2018), Tatranske Matliare, High Tatras Mountains, Slovak Republic, 12–14 September 2018; Taylor & Francis Group: London, UK, 2019; pp. 623–628. ISBN 978-0-367-07509-5. [Google Scholar]
  22. Tichy, T.; Broz, J.; Belinova, Z.; Kouba, P. Predictive diagnostics usage for telematic systems maintenance. In Proceedings of the 2020 Smart City Symposium Prague, Prague, Czech Republic, 25 June 2020. [Google Scholar] [CrossRef]
  23. Jisova, J.; Tichy, T.; Filip, J.; Navratilova, K.; Thomayer, L. The application of the latest territorial components for sustainable mobility in district cities. In Advances in Environmental Engineering; IOP Publishing: Bristol, UK, 2021. [Google Scholar] [CrossRef]
  24. Navratilova, K.; Tichy, T.; Fricke, A.; Woisetschlager, D.M.; Sedlak, J.; Ivasienko, P. Application of Mobility Hub for automatic parking in the city. In Proceedings of the 2021 Smart City Symposium Prague (SCSP), IEEE, Prague, Czech Republic, 25 June 2021; pp. 1–7. [Google Scholar] [CrossRef]
  25. Mahmoud, H.M.; Fayad, A.A.; Nassar, A.H. Investigating the Impact of Changing the Usage Type of Existing Structure Using BIM. Civ. Eng. J. 2022, 8, 1606–1621. [Google Scholar] [CrossRef]
  26. Albasri, N.A.H.; Al-Jawari, S.M.; Al-Mosherefawi, O.J. Prediction of Urban Spatial Changes Pattern Using Markov Chain. Civ. Eng. J. 2022, 8, 710–722. [Google Scholar] [CrossRef]
  27. Bujnak, M.; Pirnik, R.; Rastocny, K.; Janota, A.; Nemec, D.; Kuchar, P.; Tichy, T.; Lukasik, Z. Spherical Robots for Special Purposes: A Review on Current Possibilities. Sensors 2022, 22, 1413. [Google Scholar] [CrossRef] [PubMed]
Figure 1. Example—Section of the “cleaned” model of part of Ostrava for subsequent simulations (source: authors).
Water 15 00104 g001
Figure 2. Application process of the R-WIM tool (source: author).
Water 15 00104 g002
Figure 3. Application process of the R-WIM tool (source: authors).
Water 15 00104 g003
Figure 4. Demonstration of the database and functionalities expanding the map data for the use of R-WIM (source: authors).
Water 15 00104 g004
Table 2. Analysis of dimensions and location of individual areas and surfaces (source: authors).
Land TypeLand in Total [Number]Total Land Area [m2]
Parking areas833167,964.88
Areas of communications1.1781,026,397.64
Pavements1.675362,466.74
Vegetation surface element7.796354,523.39
Grassed areas13.0863,568,177.72
Disclaimer/Publisher’s Note: The statements, opinions and data contained in all publications are solely those of the individual author(s) and contributor(s) and not of MDPI and/or the editor(s). MDPI and/or the editor(s) disclaim responsibility for any injury to people or property resulting from any ideas, methods, instructions or products referred to in the content.

