
Ecological Risk Assessment and Source Analysis of Heavy Metals in the Soils of a Lead-Zinc Mining Watershed Area

1
College of Environmental Science and Engineering, Guilin University of Technology, Guilin 541004, China
2
Guangxi Collaborative Innovation Center for Water Pollution Control and Water Safety in Karst Area, Guilin 541004, China
3
College of Earth Science, Guilin University of Technology, Guilin 541004, China
*
Author to whom correspondence should be addressed.
Water 2023, 15(1), 113; https://doi.org/10.3390/w15010113
Submission received: 24 November 2022
/
Revised: 21 December 2022
/
Accepted: 25 December 2022
/
Published: 29 December 2022
(This article belongs to the Section Ecohydrology)
Abstract
:In this study, concentrations of Cr, Mn, Pb, Cu, Zn, As, Cd, Sb, and Fe were determined in soils of a Pb-Zn mine watershed in northern Guangxi, China, for ecological risk assessment and source analysis. The atomic fluorescence spectrometry and ICP-OES were used to determine concentrations of heavy metals (HMs), and the total amount of Mn, Cu, Zn, As, Cd, and Pb exceeded the limit. Among them, the weak acid extractable fraction (F1) state masses of Pb, Mn, and Zn accounted for a higher ecological risk. The study area was divided into three distinct areas: highest concentrations of HMs were distributed in front of the Sidi River mountain (1# and 2#) and at the subterranean river entrance (5# and 6#), followed by the area along the river and the irrigated area of the river (3# and 4#), and the central highlands and southwestern parts had low concentrations (7# and 8#). The ecological risk assessment results indicate Cd is of extremely high ecological risk, Pb and Mn are of medium minor ecological risk, Zn is of minor ecological risk, and the rest have almost no impact on the eco-environment. The source apportionment results showed that Cu, Zn, Cd, Sb, and Pb were mainly controlled by anthropogenic activities, such as mining; Cr, Fe, and As were mainly influenced by natural processes, such as soil-forming parent rocks; and Mn is jointly controlled by mining and soil-forming parent rocks. This study can provide scientific guidance and technical support for soil risk control or remediation in mining areas.
1. Introduction
Mining and smelting processes frequently result in heavy metals (HMs) in tailings, slag, acid wastewater, and dust. This leads to the following processes: contamination of soil (via rainfall), water bodies, and the atmosphere [1,2]; accumulation in the soil; and absorption and enrichment of HMs by plants [3,4], which endangers human health [5,6]. The degree of environmental pollution caused by HMs in the soil is proportional to their total quantity and their speciation [7,8,9]. Extractable HMs are characterized by bioavailability, high toxicity, and high mobility [10,11]. The majority of HMs residues are located in the lattices of minerals and silicates, with high stability and weak bioavailability [12]. Therefore, it is crucial to determine the sources and occurrence types of HMs in order to conduct an objective, accurate, and effective evaluation of HM pollution in soils and to provide a scientific basis for reducing and mitigating soil pollution.
There are numerous methods for evaluating pollution levels and the ecological risk of HMs in soil, including the single-factor index evaluation method [13], comprehensive pollution index method [14], geoaccumulation index method (Igeo) [15], enrichment factor (EF) [16], potential ecological risk index (PERI) [17], and the Nemerow index [18]. The most used evaluation methods based on HM speciation include the ratio of the secondary to the primary phase (RSP) [19], toxicity characteristic leaching procedure (TCLP) [20], and risk assessment code (RAC) [21]. Chen et al. [22] evaluated heavy metals in agricultural soils in Taihu and Lihe watersheds using EF, PERI, and RAC, and the results showed that the degree of heavy metal accumulation was Cd > Pb > Zn > Cu > Ni > Cr, and the ecological risk of Cd was the most serious. Zeng et al. [23] used RSP to evaluate the pollution degree of Cd, Pb, and Cr in a smelting waste contaminated soil, and the result showed that RSP values of Cd, Pb, and Cr ranged from 13.05 to 54.28, 16.11 to 4.97, and 1.61 to 52.33, which indicated the soil was seriously contaminated.
Identifying the sources of soil HM contamination in soil is key to minimizing and mitigating soil pollution. Existing methods for identifying the sources of soil HMs are as follows: correlation analysis [24], principal component analysis (PCA) [25], cluster analysis (CA) [26], positive matrix factorization (PMF) [27], UNMIX model [28], lead stable isotopes [29], random forest (RF) [30], geographically weighted regression (GWR) [31], flag element ratio approach [32], and other qualitative and quantitative analysis methods. Wang et al. [33] investigated the sources of soil HMs using correlation analysis and PCA, and their findings indicated that Ba, Co, Cr, Ni, and V were primarily mainly derived from natural sources, whereas As, Cd, Cu, Pb, and Zn were primarily derived from anthropogenic sources. Lu et al. [34] employed correlation analysis and PCA to demonstrate that mining activities had a substantial impact on the Zn, Cu, Cd, and Pb concentrations in soils in close proximity to a mining site. Jiang et al. [35] used correlation, PCA and cluster analysis to suggest that Cd, Zn and Pb in sediments of the Yitong River (urban section) mainly originated from industrial pollution and urban sewage discharge, Cu may be influenced by both natural processes and human activities, and Cr and Ni may originate more from natural processes. Using a single method to evaluate the level of HM pollution in soil within mining areas can only indicate the impact of HM pollution on the eco-environment and cannot provide a comprehensive qualitative and quantitative evaluation of the ecological effects of HMs in soils. Consequently, a risk assessment of HMs in soils was conducted to assess the ecological hazards of HMs from the perspectives of total HM content and bioavailability content.
The Guangxi Yangshuo Pb-Zn mine, located in the northeastern part of Yangshuo County, Guilin City, commenced mining activities in the 1950s, and a small flotation plant for beneficiation production was established in 1958 near the mine pit [36,37]. In the 1970s, excessive rainfall forced the collapse of a tailings pond, and the tailings entered the Sidi River, contaminating most of the farmland downstream of the Sidi Village. Lin [36] demonstrated that the total soil Cd content in this region was 24.5 mg·kg−1, the effective-state Cd was 7.79 mg·kg−1 in 1986, and all rice Cd levels were exceedingly high. Research by Hu et al. [38] demonstrated that a tailings pond collapse resulted in significant effective-state Pb, Zn, and Cd contamination and had distinct characteristics that manifested in different soil use types. The levels of Pb, Zn, Cu, and Cd in the surface soils of various land use types were significantly higher in the northwest than other parts. HM contamination levels gradually increased downstream along rivers, with low levels of HMs in areas farther away from rivers where anthropogenic activities have a greater impact [39,40,41,42]. Chen et al. [43] showed that the distribution of HMs in the soil of a basin displayed obvious zoning. The areas with high Mn, Cu, Zn, As, Cd, Sb, Hg, and Pb values were mainly situated along the Sidi River and in front of the Sidi River, whereas the central highland and southwest areas had the lowest concentration values of these elements. In contrast, areas with high Cr and Ni values were predominantly situated in the high ridges, but the low values were mainly distributed on both sides of the high ridge.
Some previous studies have been conducted on the distribution and risk assessment of heavy metals in this study area, but no targeted studies have been conducted on the total amount and morphology of soil heavy metals, and their sources remain unclear. Therefore, the purposes of this study are (1) to combine the distribution characteristics of soil heavy metals, select typical sites for collecting soil samples, and conduct total amount and morphological analysis of heavy metals; (2) to conduct ecological risk evaluation of total heavy metals using EF and PERI, and ecological risk evaluation of heavy metal morphology using RSP and RAC; and (3) to analyze the sources of heavy metals using multivariate statistical methods and other methods. This study can provide scientific basis for heavy metal risk evaluation and heavy metal pollution control of soil in mining areas.
2. Materials and Methods
2.1. Study Area
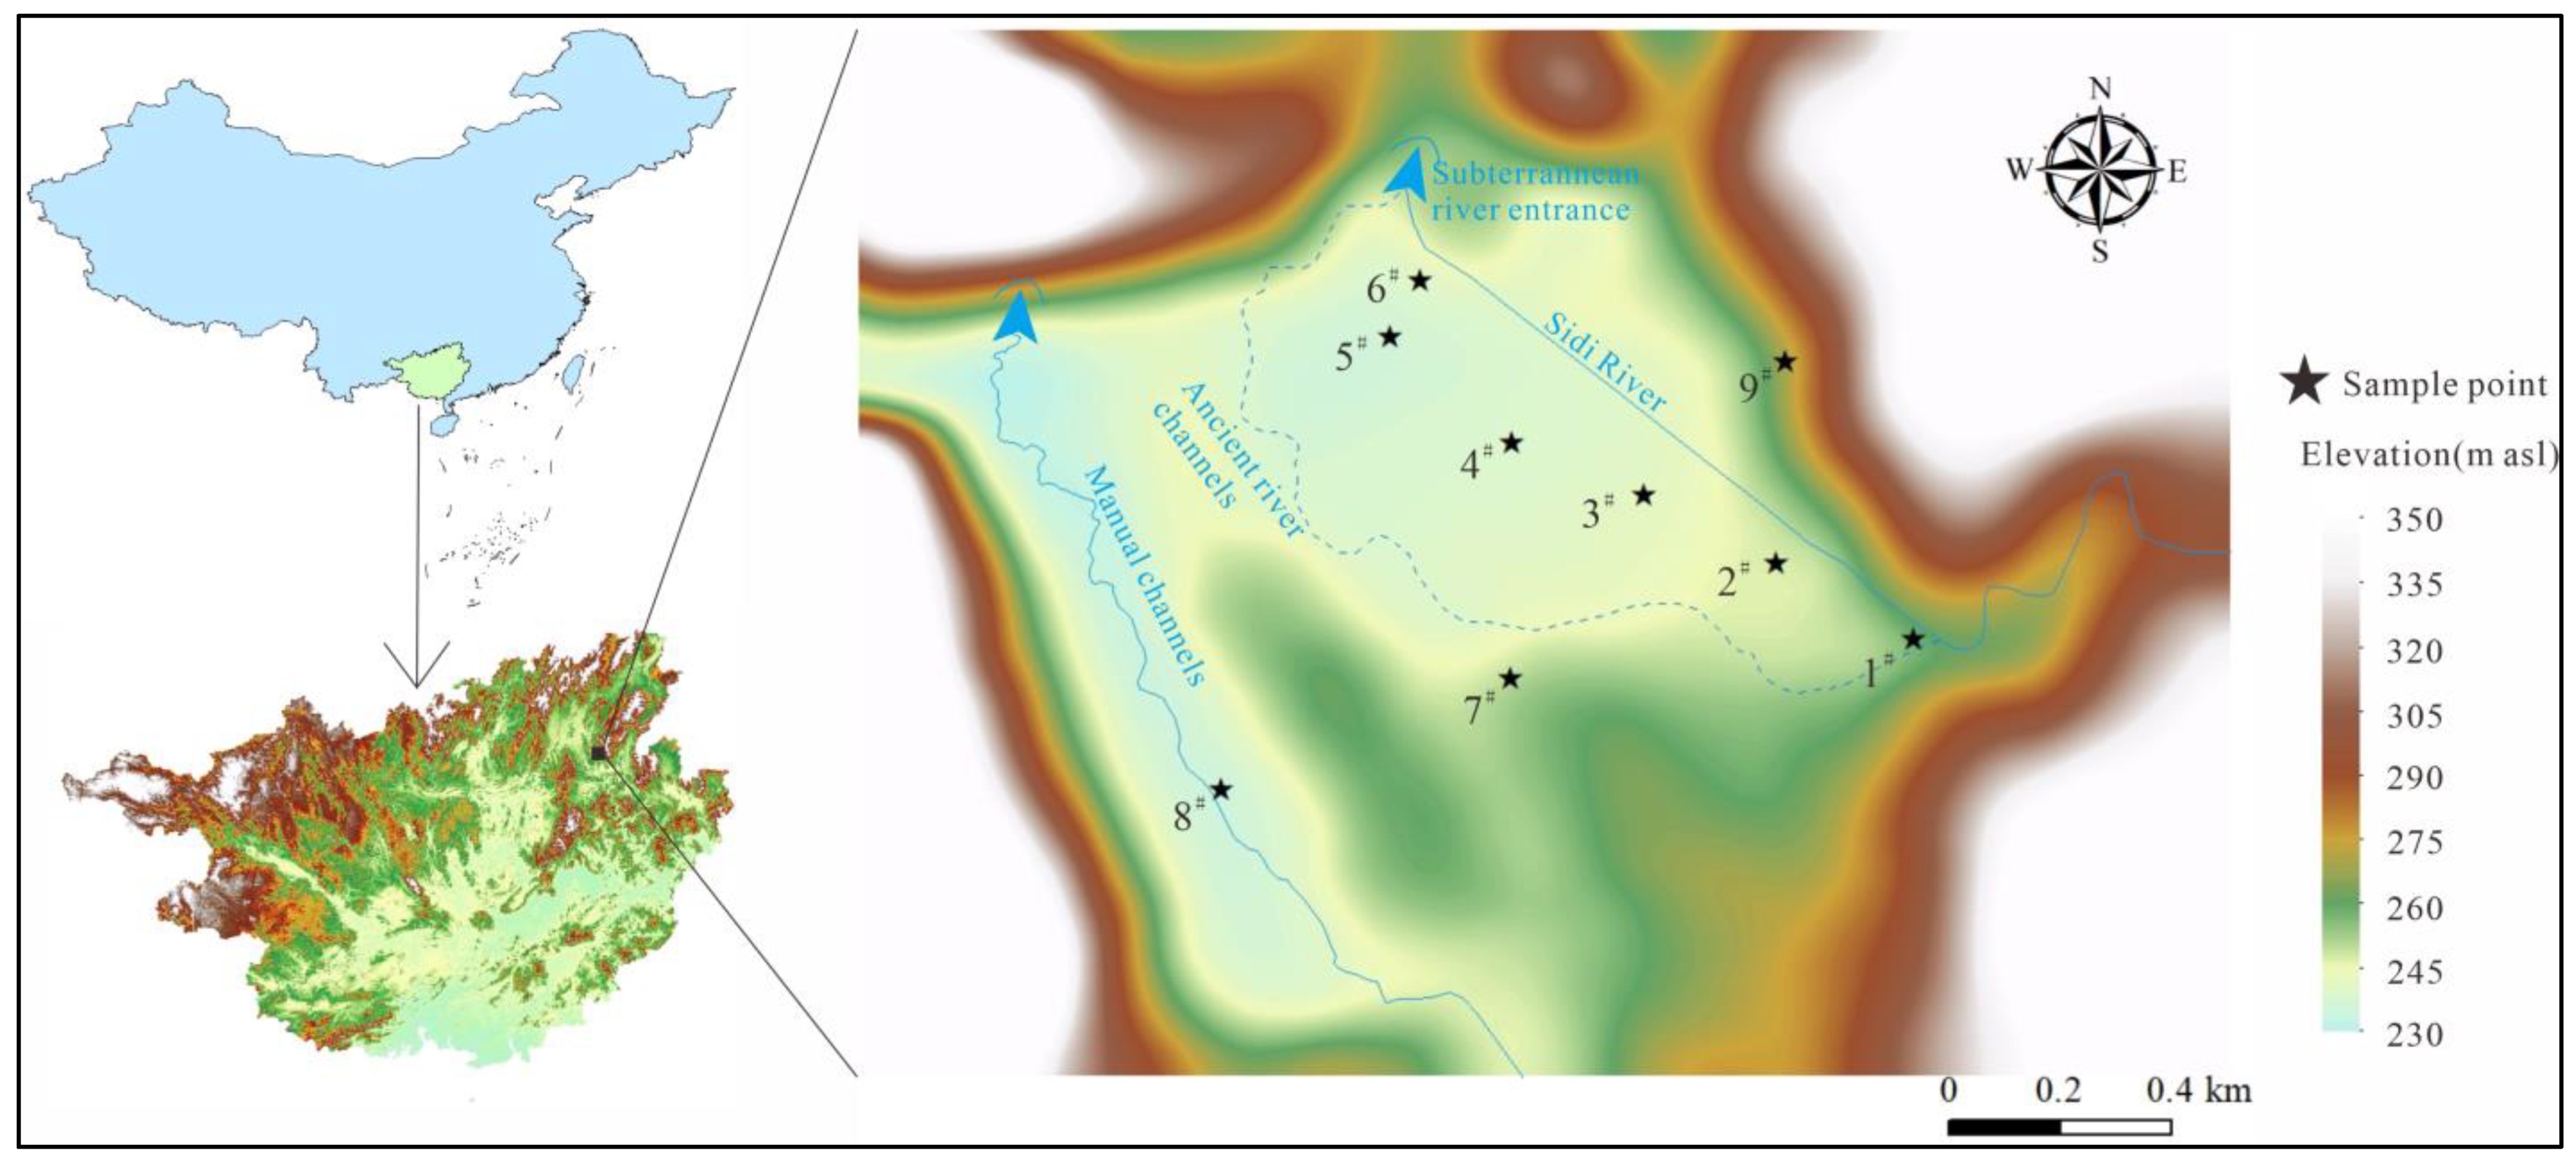
The study area was located in Sidi Village, Yangshuo County, with an average elevation of approximately 150 m asl. It has a subtropical monsoon climate with a mean annual temperature of 19.5 °C. The annual rainfall is approximately 1533 mm, with approximately 70% falling between April and August. The Sidi River, which originates in the upstream lead-zinc mining area, represents the only surface water flow in the study area (Figure 1). The Sidi River catchment area is approximately 14 km2 in extent, and there are mine drainage sinks in the mining area. Sidi Village is composed of alluvial floodplain deposits, and the thickness of the surface accumulation is approximately 5–30 m. Sidi Village is prone to erosion by the Sidi River and the transformation of farmland, and its topography is elevated in the center and low to the east and west. The highland area in the center of Sidi Village is primarily a residential area and railway line, whereas the east and west sides are primarily farmland. The predominant soil types in Sidi Village are sandy and yellow loam. The soil-forming parent rocks are predominantly carbonated rocks that are closely associated with the upstream source area.
2.2. Collecting, Processing, and Analyzing Samples
Nine sampling points were established in the study area and sampled during April 2022; their specific locations are shown in Figure 1. Sampling points 1#–6# were situated along the Sidi River. These locations included the alluvial floodplain accumulation layer, an area of continual scouring by the Sidi River, an area undergoing agricultural land leveling, and areas that underwent other anthropogenic transformations. Sampling site 7# was located in the highland district and represented the original alluvial floodplain deposit. Sampling site 8# was situated in the southwest highland district, and the substrate was carbonated rock affected by karst springs and irrigation from diversion channels. Sampling site 9# was located on the northeast slope of the study area, which only featured primitive soil weathering and no agricultural activities. Based on site conditions, the sampling point depth was 0–100 cm in 20 cm increments. Sampling point size was 10 m × 10 m, adopted in four parallel samples, mixed on-site, cleared of debris (i.e., roots and stones), and placed in sealed bags. Soil samples were naturally air-dried, ground, sieved (using a 2 mm nylon mesh), and stored in a new sealed bag.
As and Sb were extracted using aqua regia water bath digestion in the soil samples, weighed 0.5 g (accurate value 0.0001 g) of soil samples with 0.149 mm nylon mesh, and digested with 50% (v:v) aqua regia water bath. The specific operation steps can be seen in [44]. The remaining HMs contents were processed using HNO3-H2O2 digestion [45], then 0.5 g soil (accurate value 0.0001 g) sample with 0.149 mm nylon mesh was placed in a 150 mL conical flask and digested by an electric heating plate. Each sample was repeated three times. The fugitive forms of HMs were determined using an improved BCR [46]. As and Sb contents were determined using atomic fluorescence spectrometry (AFS-9700, Haiguang Instrument, Chengdu, China), whereas the Cd, Pb, Cu, Zn, Fe, Mn, and Cr concentrations were determined using ICP-OES (Opetima 7000DV, Perkin Elmer, Waltham, MA, USA) [47]. Quality control was performed using Chinese standard soil substances (GBW07404, Institute of Geophysical and Geochemical Exploration, Chinese Academy of Geological Sciences) and blanks. All chemicals and reagents for experiments were of analytical regrade (AR), except nitric acid (guaranteed reagent (GR), 99%), hydrochloric acid (GR, 99%), and ammonium acetate (GR, 99%). All solutions were prepared in ultrapure water (Milli-Q Direct 8, Millipore, Burlington, MA, USA). Two sets of parallel samples were prepared for each sample, and the results were expressed as mean values. The recovery of HMs ranged from 91.1% to 113.3%, and the results were acceptable [48].
2.3. Pollution Analysis and Ecological Risk Assessment
The soil HMs contamination levels and ecological risk were evaluated using EF, PERI, RSP, and RAC. The contamination and ecological risk level criteria are listed in Table 1.
2.3.1. Enrichment Factor (EF)
The EF is used to judge the pollution degree of heavy metals in sediments [16]. The content of Fe in soil and sediment is high, which is not easily disturbed by external factors [49]. It is usually used as the basic value in the calculation of enrichment factor. The specific calculation formula is as follows:
where Me is heavy metal content, Fe is iron content, (Me/Fe)s is sample content, and (Me/Fe)b is background content. The regional background values of Cr, Mn, Pb, Cu, Zn, As, Cd, Sb, and Fe are 82.66, 173.65, 20.79, 67.34, 17.04, 0.56, 5.08, 50.72, 50, and 200 mg·kg−1, respectively.
2.3.2. Potential Ecological Risk Index (PERI)
The PERI is used to assess the ecological risk of heavy metals in soils [17], including single factor potential ecological risk index and comprehensive potential ecological risk index, and the calculation formula is as follows:
where Tir is the toxicity response coefficient of heavy metal i, Cd = 30, As = 10, Sb = 7, Pb = Cu = 5, Cr = 2, and Zn = Mn = 1, respectively [50,51]. Ci is the measured content of heavy metal i in the sample and Cin is the heavy metal content in the background.
PERI = ∑EI
2.3.3. Ratio of the Secondary to the Primary Phase (RSP)
The RSP is a method for determining element risk based on heavy metal speciation [19], and the calculation formula is as follows:
where Msec is heavy metal content of soil secondary phase (F1 + F2 + F3) and Mprim is the content of heavy metal in soil primary phase (F4).
2.3.4. Risk Assessment Code (RAC)
The RAC is a common method for the assessment of heavy metals in soil morphological classification and is used to determine the risk level of heavy metals based on F1 content [35,52]. The specific calculation formula is as follows:
where F1, F2, F3, and F4 are acid extractable, reducible, oxidizable, and residual heavy metals in soil, mg·kg−1.
2.4. Statistical Analysis of Data
The correlation analysis and principal component analysis (PCA) were performed using SPSS 26.0 (IBM, Armonk, NY, USA), and the plots were created with Origin 2022b (OriginLab 2022, Origin Lab, Wilton, ME, USA). Before performing PCA, the original data were standardized, KMO and Bartlett’s sphere tests were conducted, principal component analysis was used to extract components and varimax, and the calculation results only selected PC with characteristics greater than 1.
3. Results and Analysis
3.1. Spatial Distribution Characteristics of Soil Heavy Metals
3.1.1. Characteristics of the Total Distribution of Heavy Metals in Soils
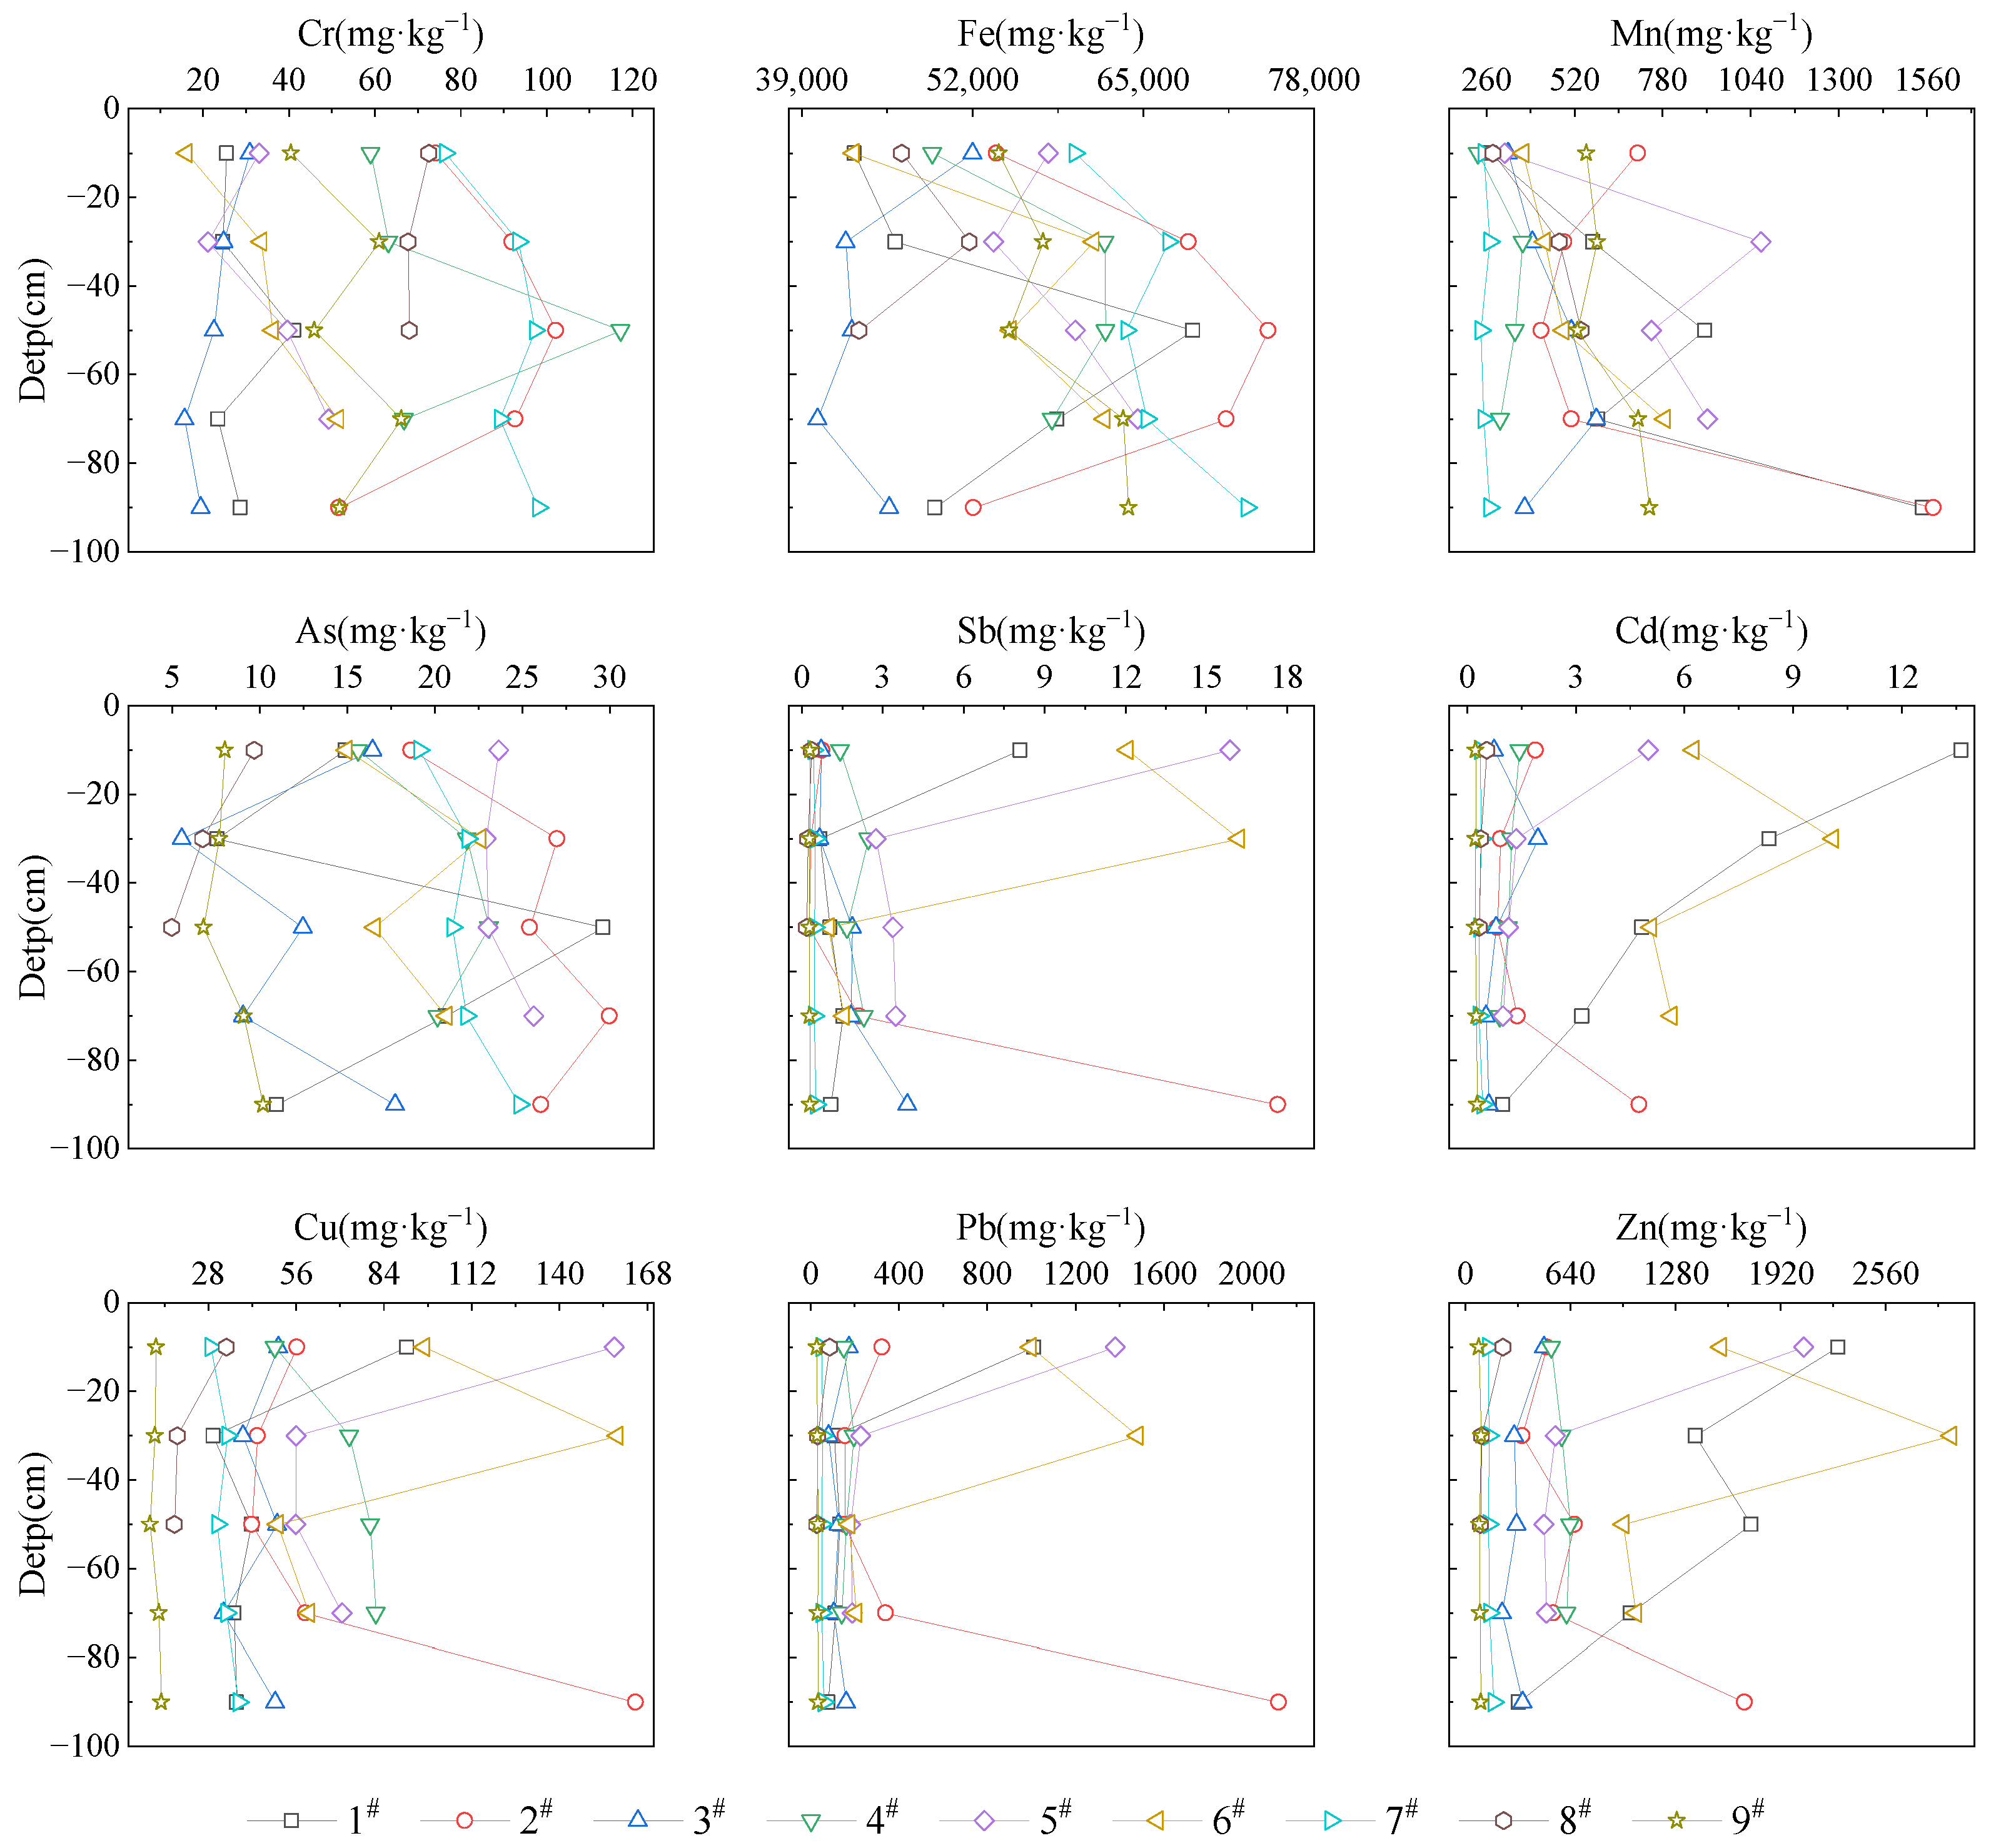
The statistical data for the HMs in soils within the study area are listed in Table 2. Figure 2 depicts the HM concentrations at all depths for each of the sampling sites. The mean values of Mn, Cu, Zn, As, Cd, and Pb were 226.95%, 252.92%, 972.25%, 101.92%, 401.26%, and 552.68% relative to the background values, respectively. The high coefficients of variation (1.65–1.05) for Pb, Sb, Cd, and Zn indicated that they were affected by external activities, resulting in uneven spatial distributions. Cr, Mn, and Cu were the next most abundant elements (0.51–0.72). Fe and As exhibited the smallest coefficients of variation (0.16–0.42) and were relatively uniform throughout the soils of the region.
In terms of horizontal distribution, Cr concentrations were particularly high at sampling points 2#, 7#, and 8#, with concentrations of 51.57–102.15 mg·kg−1. Fe concentrations were higher at sampling points 2#, 7#, and 9#, with concentrations of 53.81–74.50 g·kg−1. The Mn content was uniformly distributed at each sampling site, with concentrations of 319.35–648.01 mg·kg−1. The mean As concentration at sampling points 1#–7# within the floodplain fan area (19.73 mg·kg−1) was higher than that outside the floodplain fan area (sampling point 9#) (7.91 mg·kg−1). Figure 2 demonstrates that the concentrations of Pb, Zn, Cu, Cd, and Sb at sampling points 1#–6# were greater than those at sampling points 7#–9#, particularly in front of the Sidi River mountain (sampling point 1#) and near the entrance of the subterranean river (sampling points 5# and 6#), where the concentrations were higher than those in other areas; this is similar to the results of previous studies [42,43].
In the vertical distribution, the distribution of Cr, Fe, and As content at each sampling point was relatively uniform, and the coefficients of variation were mainly between 0.04 and 0.41. The Mn concentrations were the highest in sampling points 1# and 2# at −80 to −100 cm depth (1547.07 and 1578.36 mg·kg−1, respectively), followed by sampling points 5# and 6# at −60 to −80 cm depth (912.83 and 786.17 mg·kg−1, respectively). The content of Pb, Zn, Sb, Cd, and Cu in the river inflow and outflow areas of the study area gradually decreases with increasing depth: the concentrations are significantly greater at depths from 0 to −20 cm, with mean values of 1195.14, 2164.55, 6.98, 9.32, and 124.40 mg·kg−1, while at depths from −60 to −100 cm, they are only 126.23, 605.39, 2.02, 1.72, and 47.99 mg·kg−1; this showed that it accumulated mainly in the soil surface layer, and similar findings were found in a Pb-Zn mine in Guangxi, China [39].
In summary, it was determined that the Pb, Zn, Cu, Cd, As, and Sb concentrations were higher in the area (sampling points 1#–6#) subject to continuous scouring by the Sidi River and anthropogenic modifications, such as farmland leveling. The initial alluvial floodplain accumulation layer (sampling point 7#) had high Cr and Fe concentrations. The distribution of Mn was relatively uniform, and the Mn concentrations were higher in the area with primitive soil weathering and no agricultural activities (sampling point 9#).
3.1.2. Morphological Distribution Characteristics of Heavy Metals (HMs) in Soils
There were significant differences between the various HM types in the study area soils, as illustrated in Figure 3. Fe and Cr were mainly in the residual fraction (F4), accounting for 95.24–99.60% and 82.65–99.02% of the total, respectively. For Mn, F4 was predominant at sampling sites 4# and 7#, with 79.83–91.79% by mass. Mn was mainly in the reducible fraction (F2) at sampling sites 1#, 5#, and 9#, with a mass share of 59.48–88.60%. At sampling sites 2#, 3#, 6#, and 8#, F2 and F4 were mainly dominant, with mass percentages of 17.85–66.00% and 26.37–80.50%, respectively. Pb was mainly in the F4 at sampling sites 7# and 9#, accounting for 65.18–83.33%, whereas the remaining sampling sites were primarily in F2 and F4, accounting for 23.13–75.28% and 32.18–69.81%, respectively. Zn was mainly present in the weak acid extractable fraction (F1), with F2 and F4 at sampling sites 1# and 6#, accounting for 15.38–42.27%, 17.76–37.88%, and 19.47–54.07%, respectively, while it was mainly present in the F4 at the remaining sampling sites, accounting for 55.70–97.95%. The F4 was the main fugitive form of Cu in general (41.83–97.68%), while the oxidizable fraction (F3) dominated at sampling points 1#, 3#, 5#, 6#, and 9#, accounting for 10.47–38.12%.
The highest concentrations of extractable fraction (F1 + F2 + F3) (Ex) Pb, Zn, and Cu were found in the areas subject to continuous scouring by the Sidi River and anthropogenic modifications such as farmland leveling (sampling points 1#–6#), followed by the areas affected by irrigation from karst springs and diversion canals (sampling point 8#) and the area with primitive soil weathering and no agricultural activities (sampling point 9#). The lowest concentrations of Ex Pb, Zn, and Cu were found at the accumulation of primitive alluvial flood deposits (sampling point 7#). The Ex Mn was highest in the areas subject to continuous river scouring and anthropogenic modifications, such as farmland leveling (sampling points 1#–6#), and the area of primitive soil weathering without agricultural activities (sampling point 9#), followed by the area affected by karst springs and irrigation by diversion canals (sampling point 8#), and it was lowest in the area of primitive alluvial flood deposit accumulation (sampling point 7#). Fe and Cr had low Ex values across the study area.
HMs are present in different forms, and their harmful effects on organisms and the environment are different [7,8,9]. F1 is more mobile and translocatable and can be released in weakly acidic and neutral environments [54]. F2 generally refers to Fe-Mn oxide adsorption, as well as part of the HMs encapsulated by it; exclusive adsorption is stronger and is more quickly released under conditions of low redox potential or anoxia [12,55]. HMs present as F3 can form compounds with organic matter or precipitates with sulfides, which are often only released under conditions of high oxygen [56]. F4 is an HMs form endowed in the mineral lattice that is generally difficult to release [12,56]. Combined with the distribution characteristics of HM forms described in the previous section, the migratory capacity and bioavailability of Fe and Cr in the soils of the study area were low, and their impacts on the eco-environment were small. The Cu migration capacity and bioavailability were low and had a negligible effect on the eco-environment. Mn and Pb had a certain migration capacity and bioavailability, and they may be released when external conditions change, causing consequent harm to the environment. Zn had a considerable ecological impact owing to its high migration capacity and bioavailability.
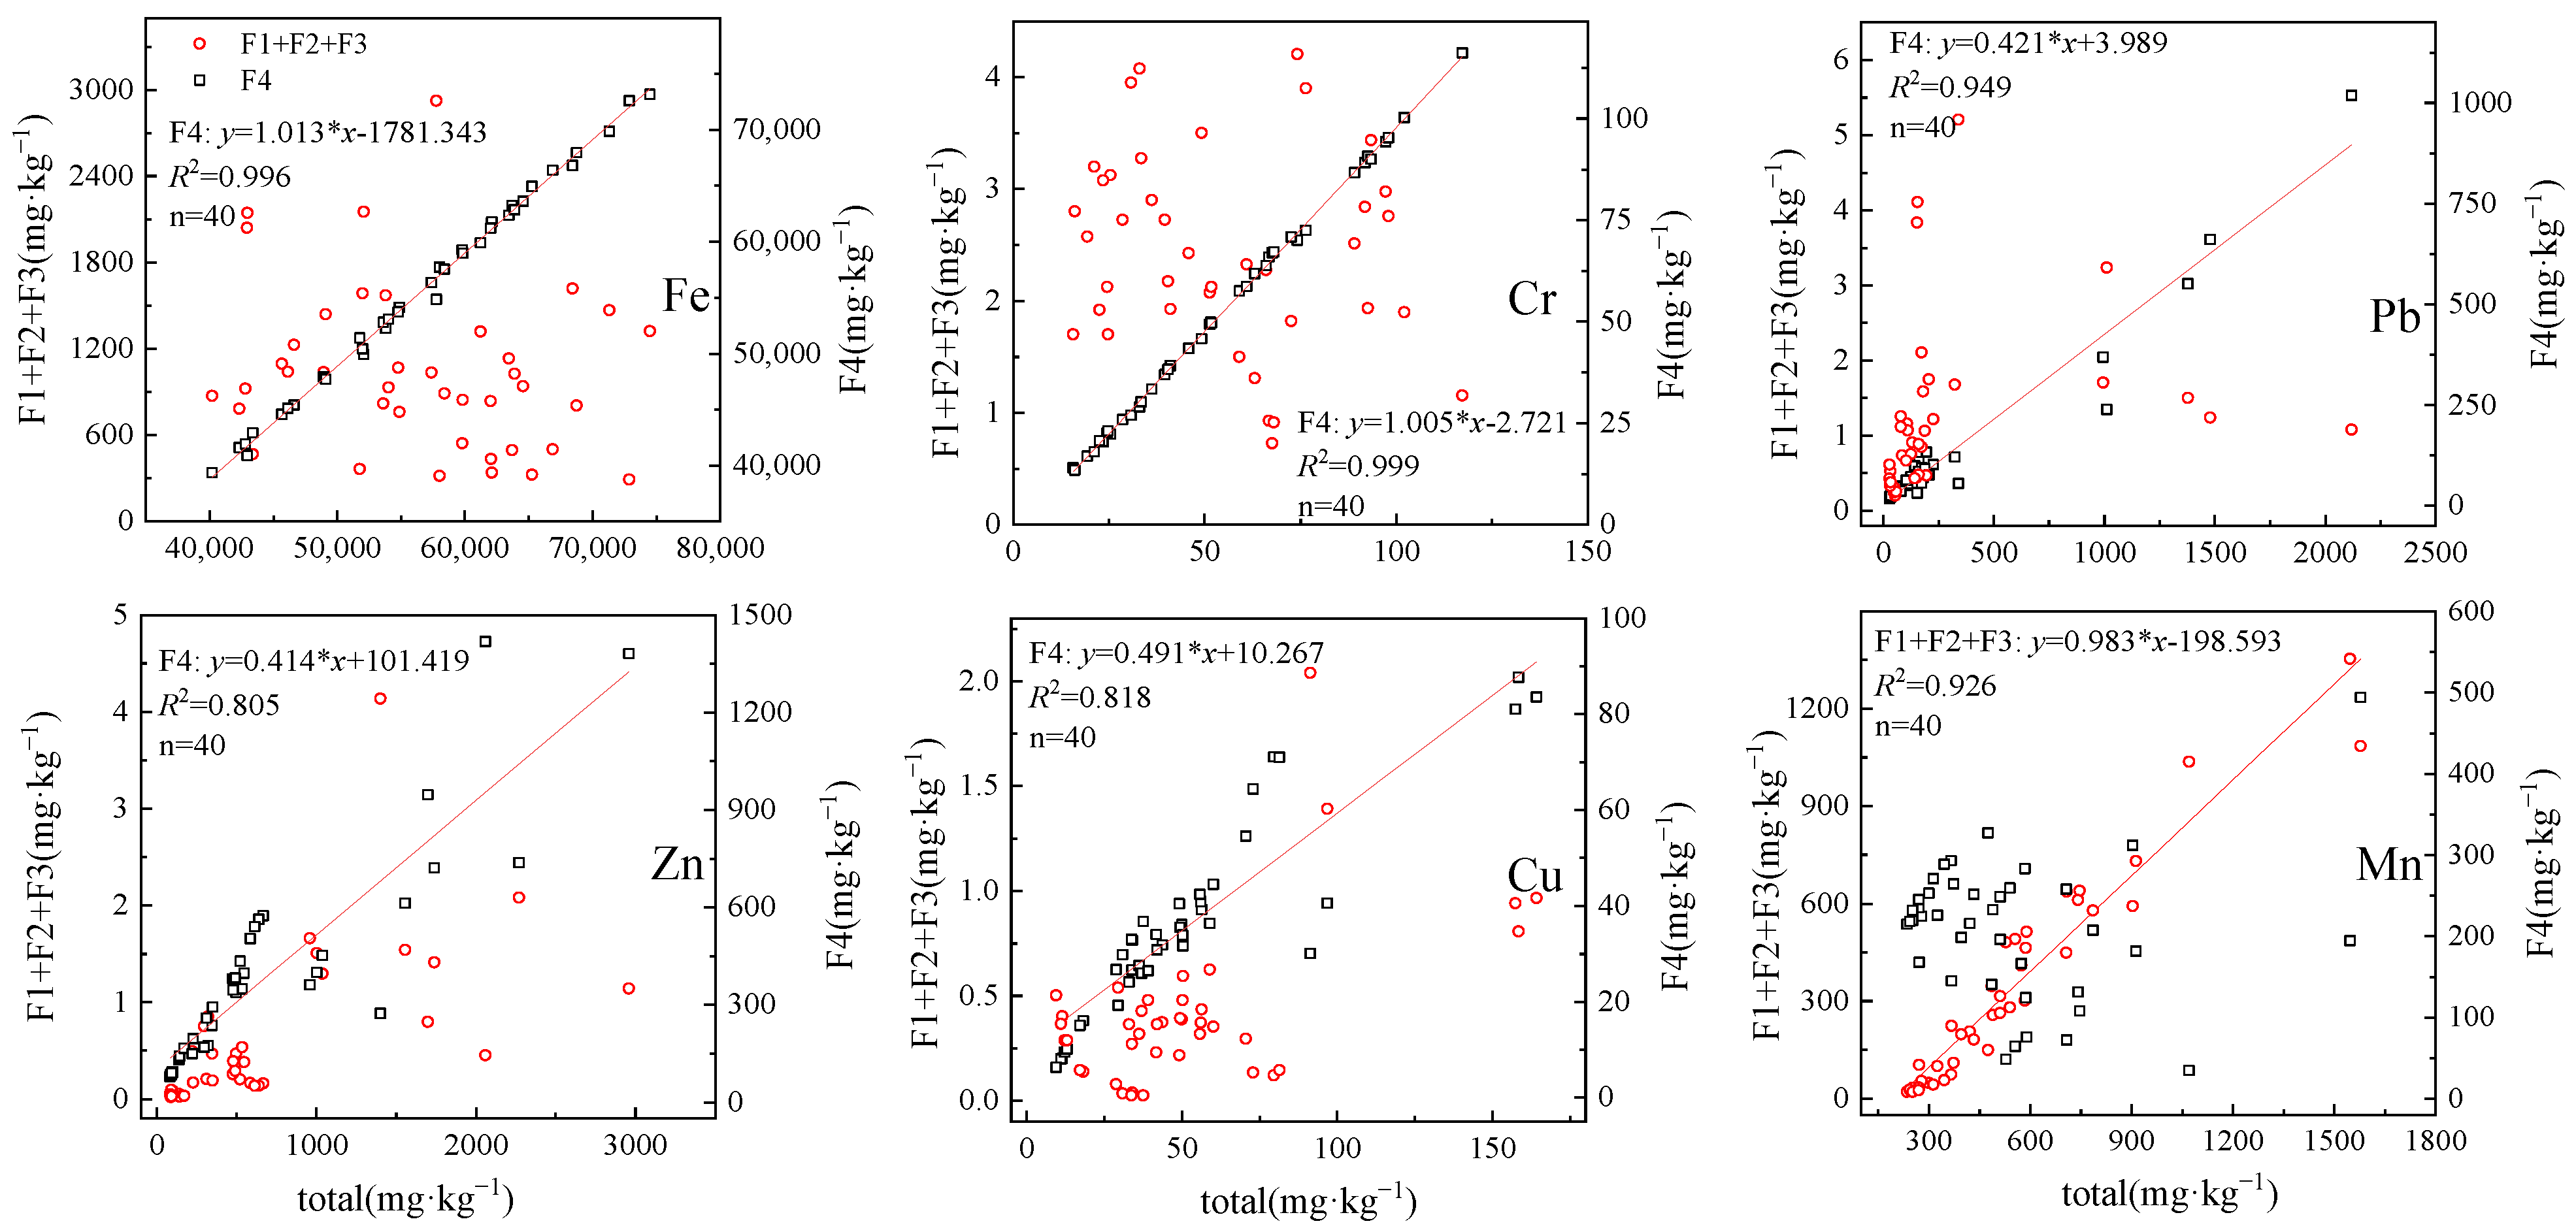
Soil HM morphology is impacted by several parameters, such as total HMs, pH, oxidation-reduction potential, soil texture, cation exchange, sulfur content, and organic matter content [11,57]. The results of the linear analysis of total soil HMs in the study area using the Ex and F4 are shown in Figure 4. The total Fe, Cr, Pb, Zn, and Cu concentrations were not significantly correlated with the Ex fraction. However, a significant correlation was observed between the total amount and F4, with R2 values of 0.996, 0.999, 0.949, 0.805, and 0.818 for Fe, Cr, Pb, Zn, and Cu, respectively. This indicates that the absorption of HMs (Fe, Cr, Pb, Zn, and Cu) into the soil mainly is primarily responsible for an increase in F4 contents, although the effects of these elements on bioavailability and transport capacity are limited, and their impact on ecological risk is minimal. In contrast, Mn was significantly correlated with the Ex overall, with an R2 value of 0.926, but was insignificantly correlated with F4. This indicated that an increase in the total amount of exogenous Mn in the soil induced an increase in Ex, which enhanced the bioavailability and migratory capacity of Mn and had a greater impact on ecological risk than other elements.
3.2. Analysis of the Level of HM Pollution in Soils and Risk Evaluation
3.2.1. Level of Soil HM Pollution
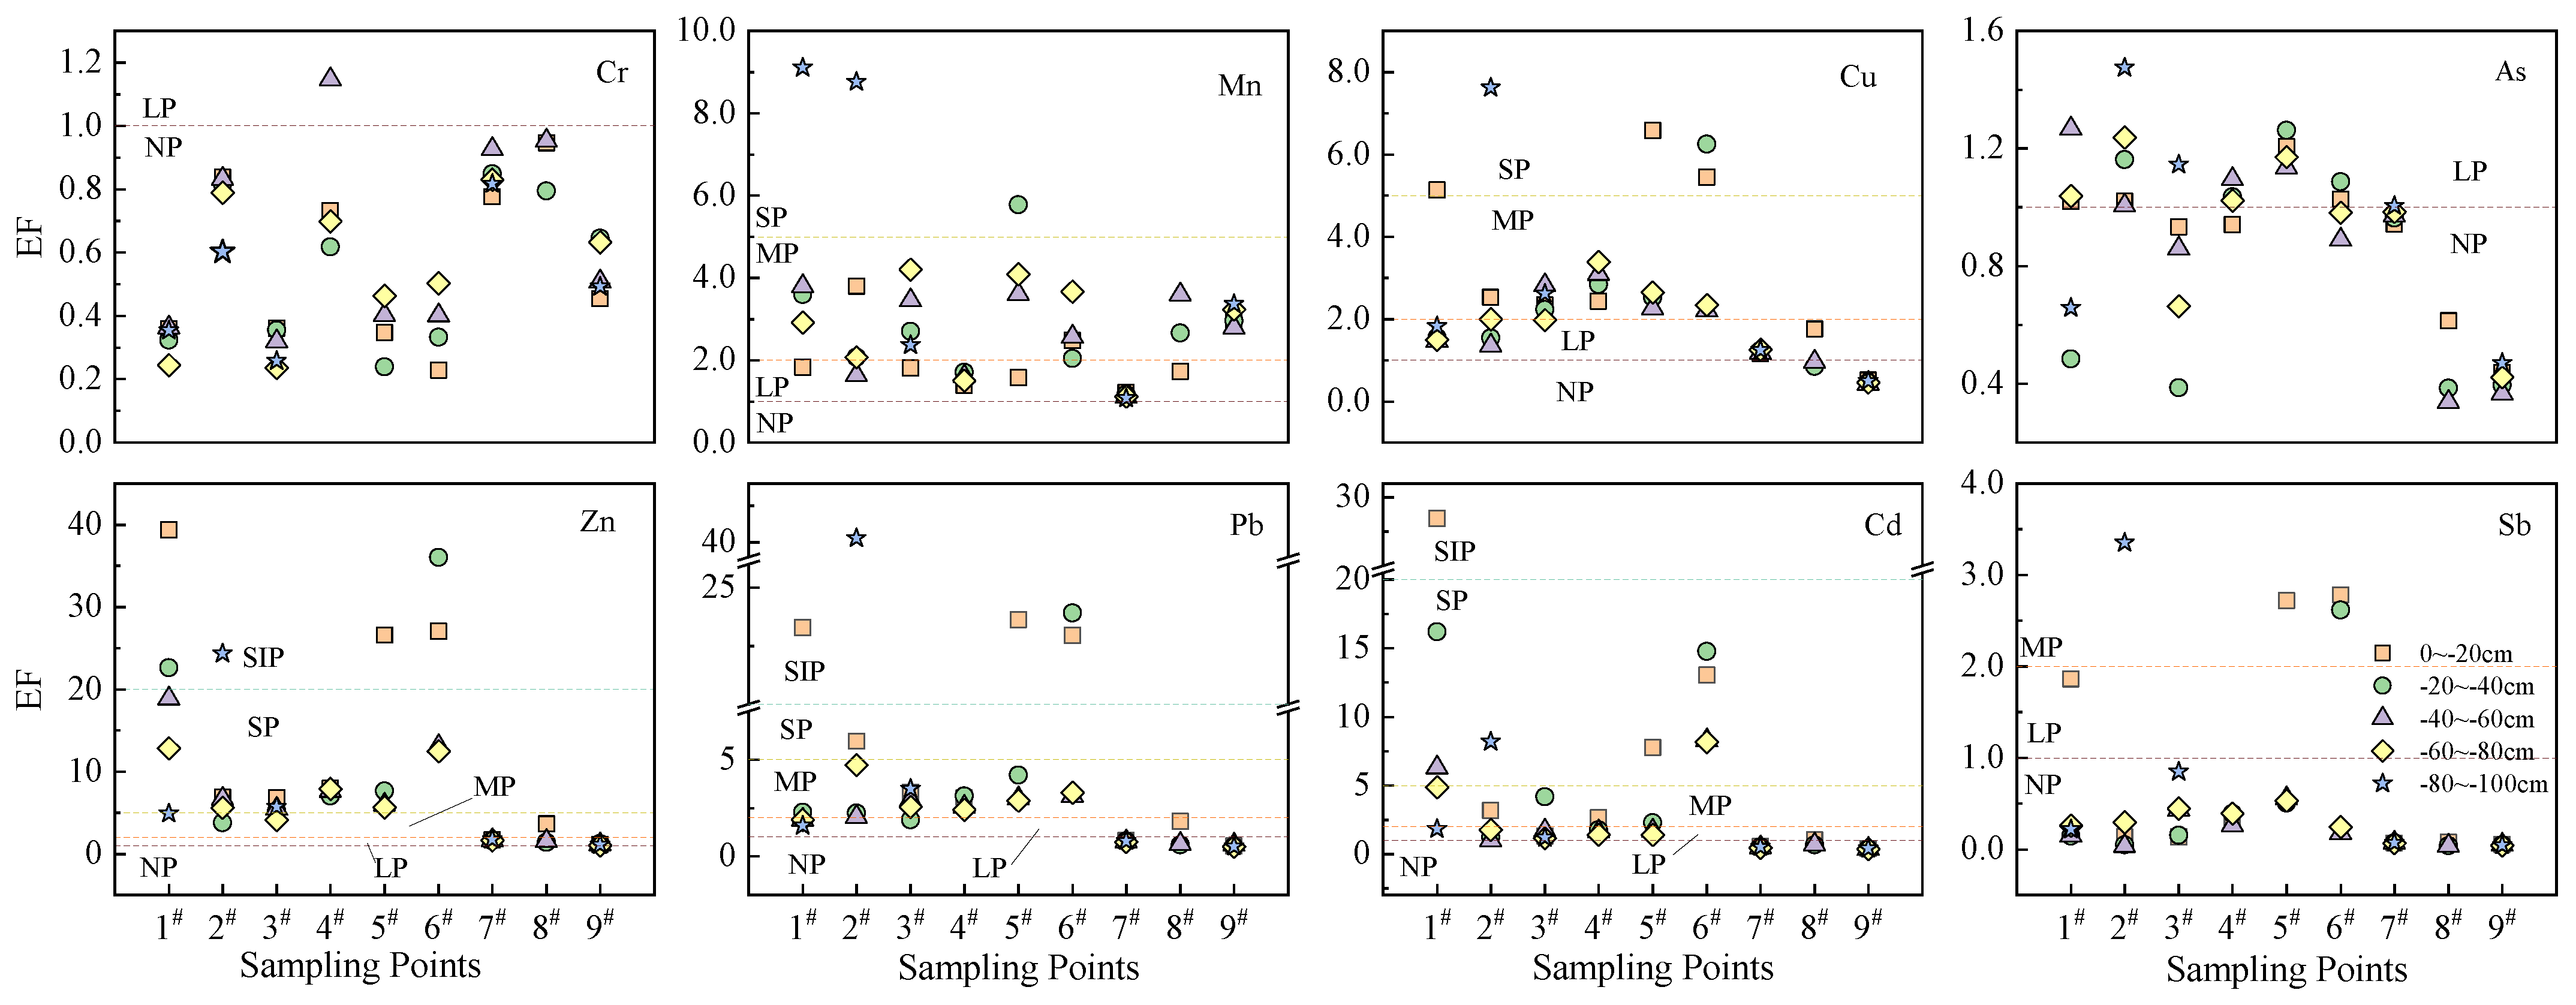
The EF method can be used to evaluate anthropogenic impacts on the environment based on reference metal concentrations with low variability in their fugacity state in the crust of the earth. The most commonly used reference metals for EF are Al, Mn, and Fe [58,59]. The reference metal used in this study was Fe. EF was used to analyze the contamination levels of Cr, As, Cu, Mn, Zn, Pb, Cd, and Sb in the soil profile (Figure 5). Most samples had an EF ≤ 1 for Cr, which was the contamination-free threshold for Cr. Most samples had EF values for Mn and Cu of 1.00–5.00, indicating low to moderate pollution levels. The EF value of As was 0.34–1.47, which is primarily at a level between no pollution and low pollution. All Zn samples had EF values greater than 1. The significant pollution level (>20.00) accounted for 15.0%, the severe pollution level (5.00 < EF ≤ 20.00) accounted for 45.0%, the moderate pollution level (2.00 < EF ≤ 5.00) accounted for 10.0%, and the slight pollution level (1.00 < EF ≤ 2.00) accounted for 30.0%; the pollution level was extensive and widespread across the study area. For Pb, EF values revealed that significant pollution levels (>20.00) accounted for 12.5%, high pollution levels (5.00 < EF ≤ 20.00) accounted for 2.5%, moderate pollution levels (2.00 < EF ≤ 5.00) accounted for 42.5%, and low to no pollution levels (1.00 < EF ≤ 2.00) accounted for 42.5%. The EF values of Cd exhibited a relatively uniform distribution at each pollution level. In 87.5% of the samples from the study area, the EF ≤ 1 for Sb. Horizontally, the EF peaks of the element of each sample were mainly distributed in front of the Sidi River and mountains and at the entrance of the subterranean river. The mean EF values for Zn, Cd, and Pb were 19.71 and 22.14, 11.52 and 11.06, and 6.19 and 13.32, respectively, with Zn displaying severe to significant pollution levels, and Cd and Pb indicating severe pollution levels; similar results were found in a mining impact area in Baotou, Inner Mongolia, China [60]. In the vertical distribution, the highest EF values of each element were primarily concentrated in the top 0–40 cm of the soil surface layer. The EF values of Cu, Zn, Pb, and Cd at depths of 0–20 cm at sampling point 1# were larger than 5, and the EF values of Mn, Cu, Zn, Pb, and Cd at depths of −20 to −40 cm at sampling point 6# were larger than 5, and the pollution levels were severe to significant.
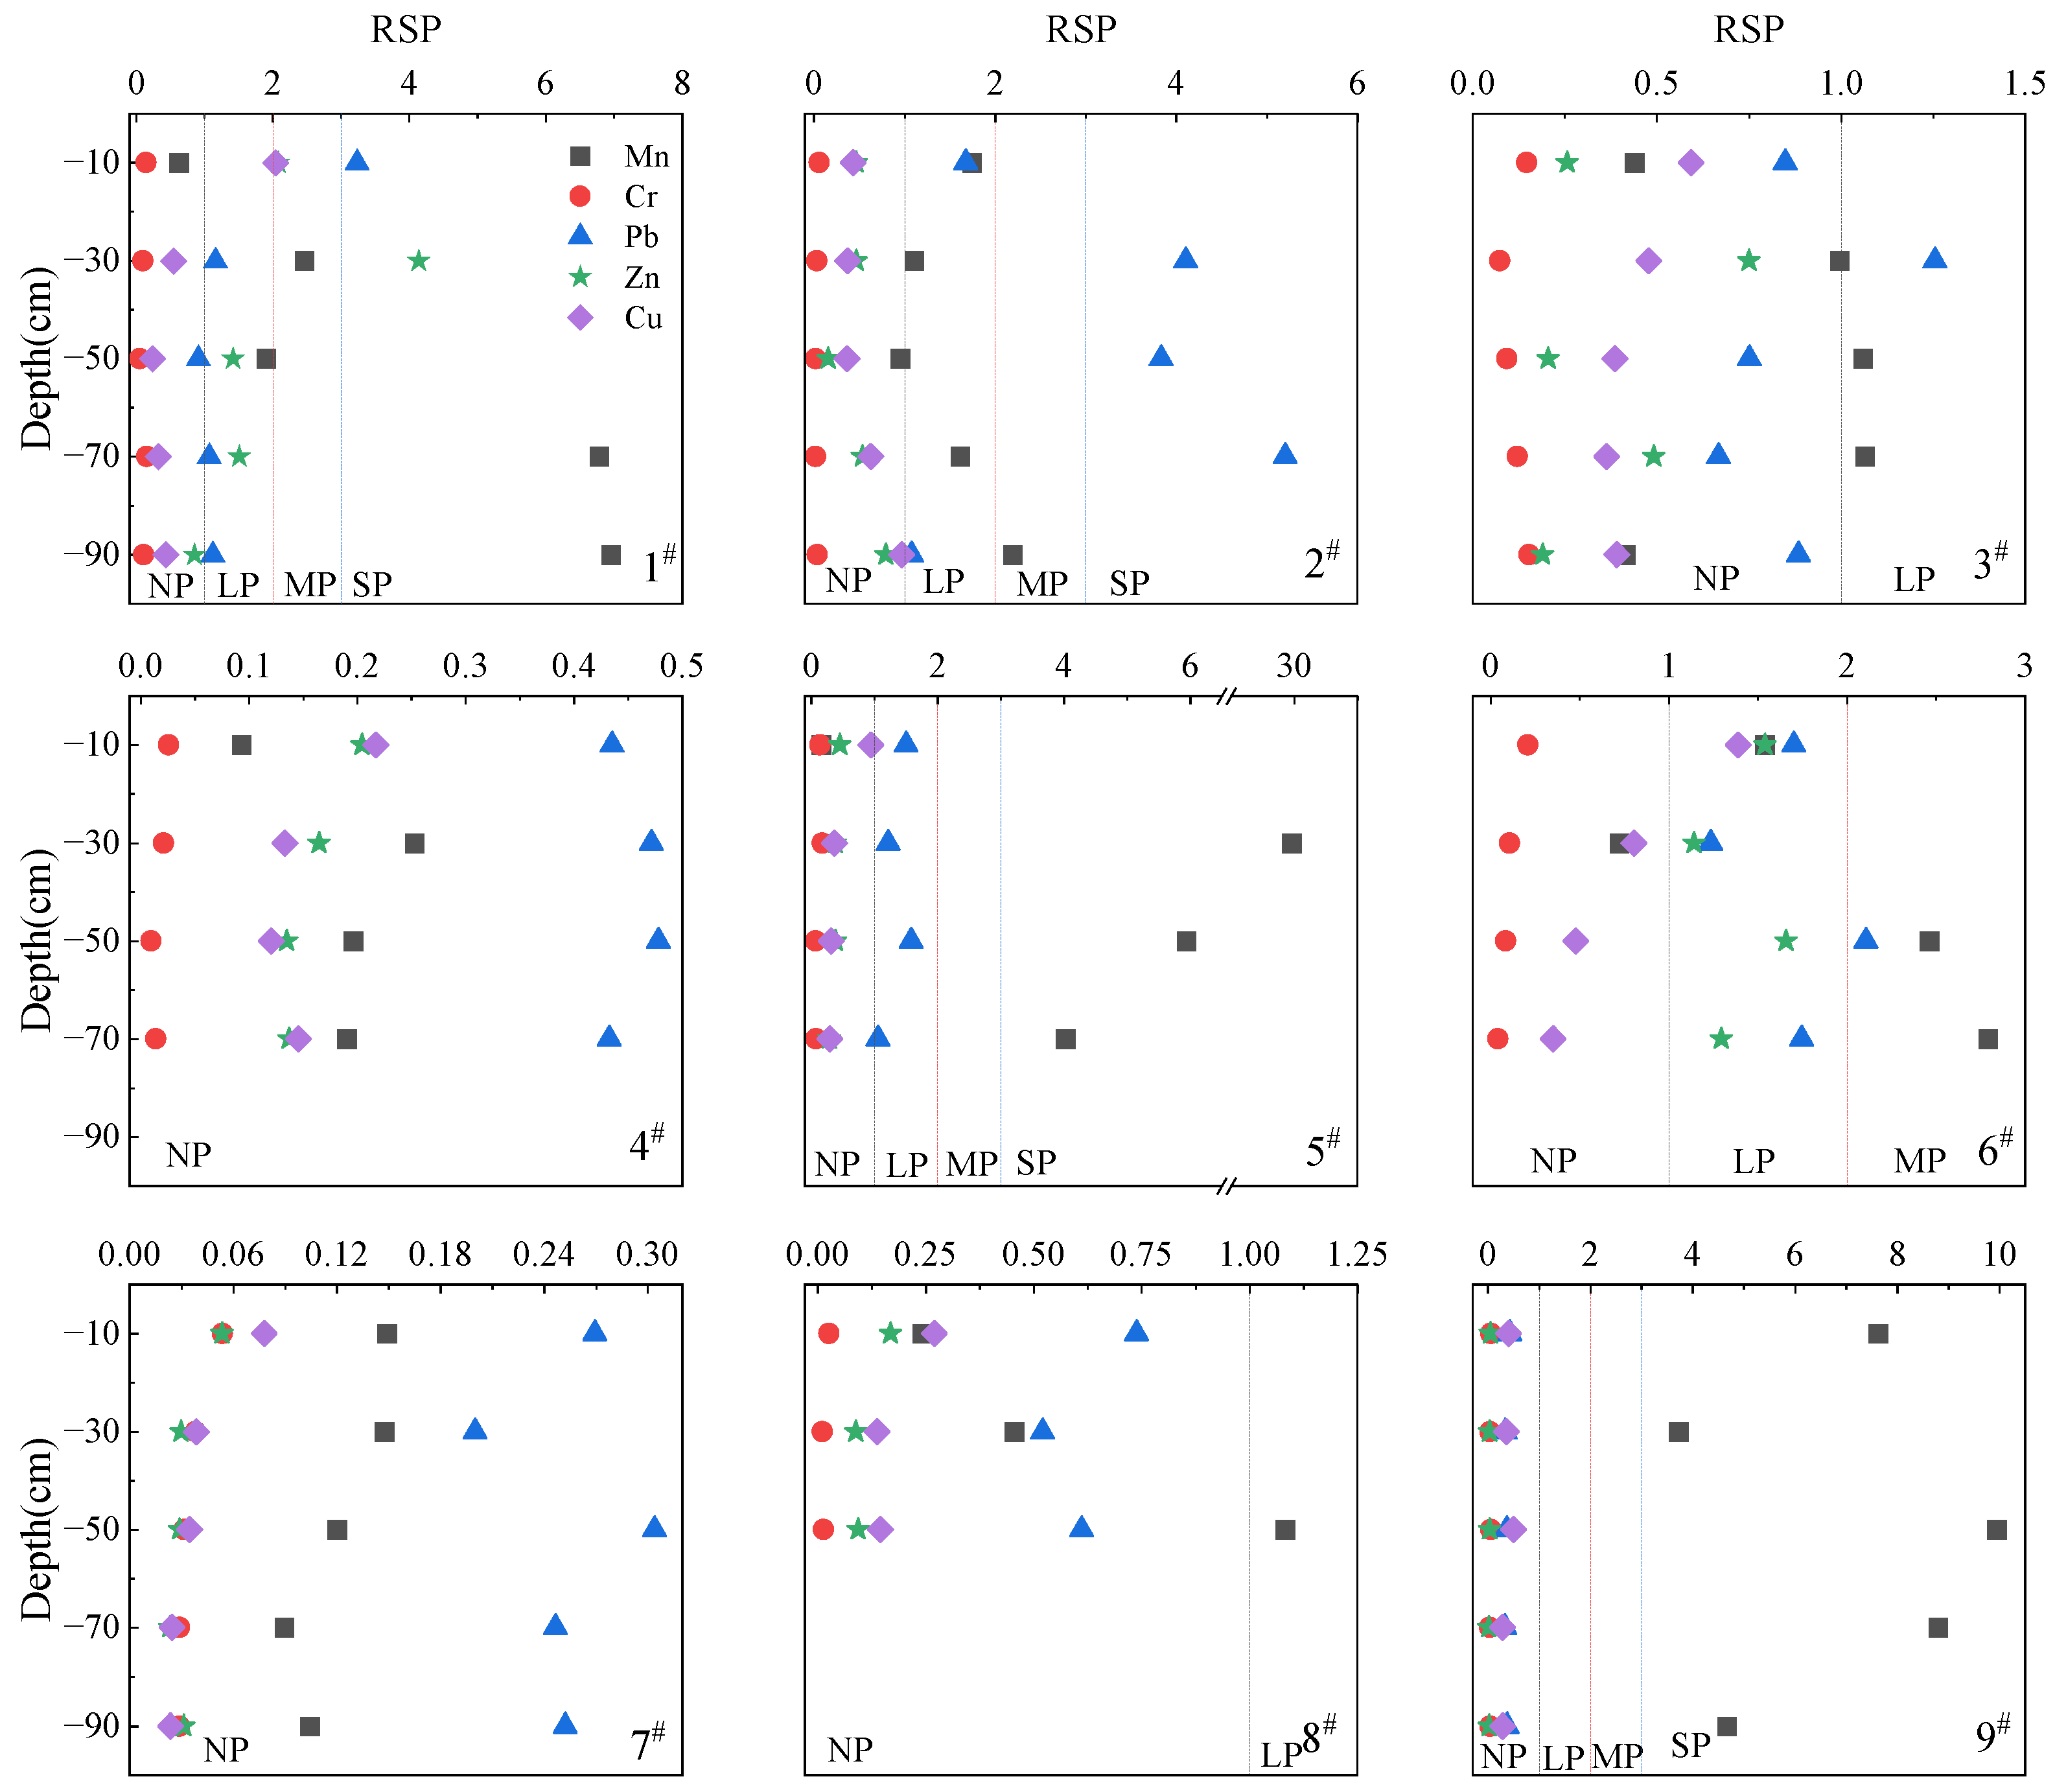
The results of the RSP contamination level analysis are shown in Figure 6. The RSP values of Cr and Cu in the study area were less than 1, indicating that there was no environmental pollution. Zn mainly indicated low levels of pollution (RSP values of 0.85–2.08) at sampling points 1# and 6#, and no pollution level (RSP < 1) at other sampling points. Pb indicated heavy pollution (RSP > 3) at depths of 0 to −20 cm at sampling point 1# and at depths of −20 to −80 cm at sampling point 2#. This showed light pollution levels (RSP of 0.91–2.11) at sampling points 1#, 5#, and 6#, and showed no pollution level (RSP < 1) at the rest of the sampling points and sampling depths. Mn showed heavy pollution levels (RSP > 3) at sampling point 1# at a depth of −60 to −100 cm, sampling point 5# at a depth of −20 to −80 cm, and sampling point 9# at a depth of 0 to −100 cm, and light-moderate pollution levels at sampling point 1# at a depth −20 to −60 cm, sampling point 2# at a depth of 0 to −100 cm, and sampling point 6# at a depth of 0 to −80 cm. Low to moderate pollution levels (RSP of 0.72–2.79) at the rest of the sampling points and depths showed no pollution level. These results indicate that the bioavailability and migratory transformation capacity of Pb and Mn in the study area were high, making them susceptible to environmental pollution.
Combining the results of the EF and RSP analyses, the study area can be divided into three regions based on their current state of pollution, with the most severe Pb, Zn, Cd, and Mn pollution occurring in front of the Sidi River mountain and the entrance of the subterranean river. The area along the Sidi River and the area irrigated by the Sidi River were moderately contaminated with HMs. The highland district, as well as its southwestern region, had relatively minor heavy metal contamination.
3.2.2. Ecological Risk Assessment of HMs in Soils
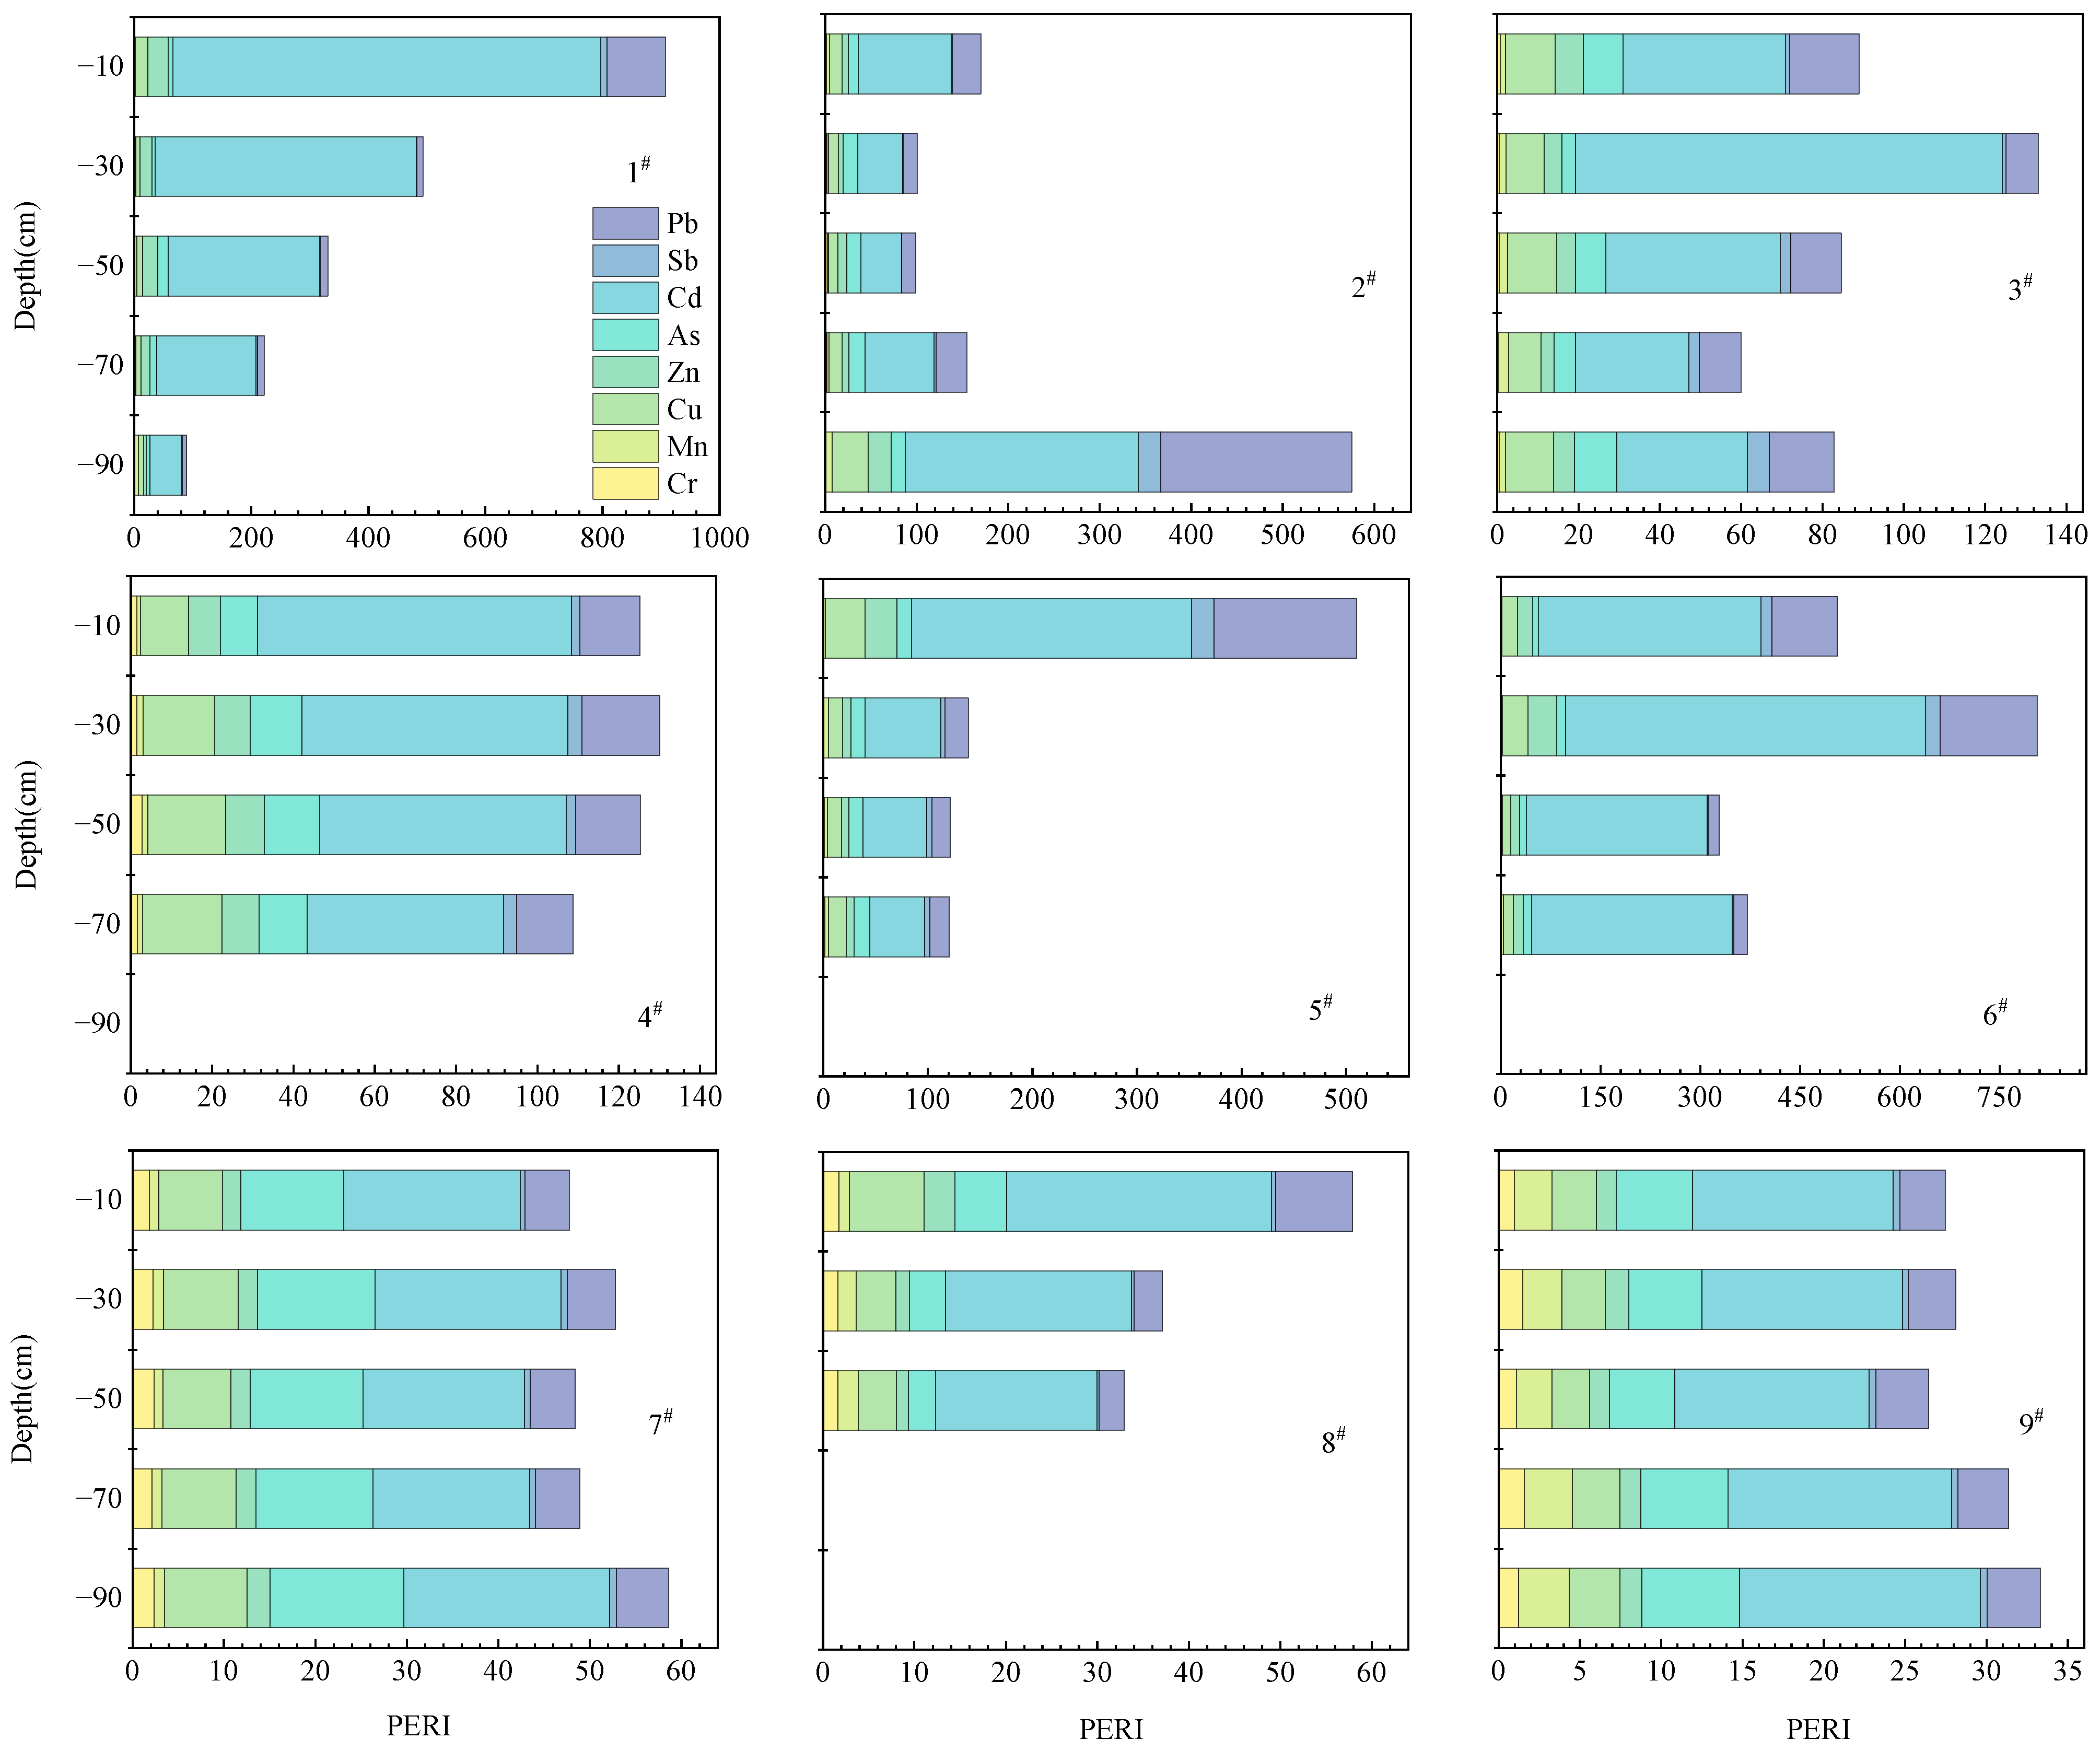
Figure 7 depicts the results of the ecological risk evaluation of the HMs using PERI. Individual heavy metal potential risk indices were arranged as follows: Cd > Pb > Cu > As > Zn > Sb > Mn > Cr. Cd was the most significant environmental risk factor. The PERI values of sampling points 3#, 4#, 7#, 8#, and 9# were all less than 160, indicating that their combined potential ecological risk was low; however, the Er values of sampling point 4# were 48–77, indicating a risk of Cd contamination. The mean PERI values of sampling points 1#, 2#, 5#, and 6# were 408, 220, 222, and 503, respectively, indicating a moderate-severe ecological risk, whereas the mean Er values of Cd for the same sampling points were 331, 104, 82, 113, and 362, respectively, indicating severe Cd pollution. From the vertical variation, it is mostly concentrated in the 0 to −40 cm soil surface layer, especially at a depth of 0 to −20 cm at sampling points 1# and 5# and −20 to −40 cm at sampling point 6#, where the PERI values reach 907, 510, and 806, indicating severe to extreme ecological risk. The Er values of Pb were 99, 135, and 145, which indicated significant ecological risks. The Er values of Cd were 730, 267, and 540, which indicated strong and very strong ecological risks; similar results were obtained from Amir’s study of agricultural soils around lead and zinc mining areas [61].
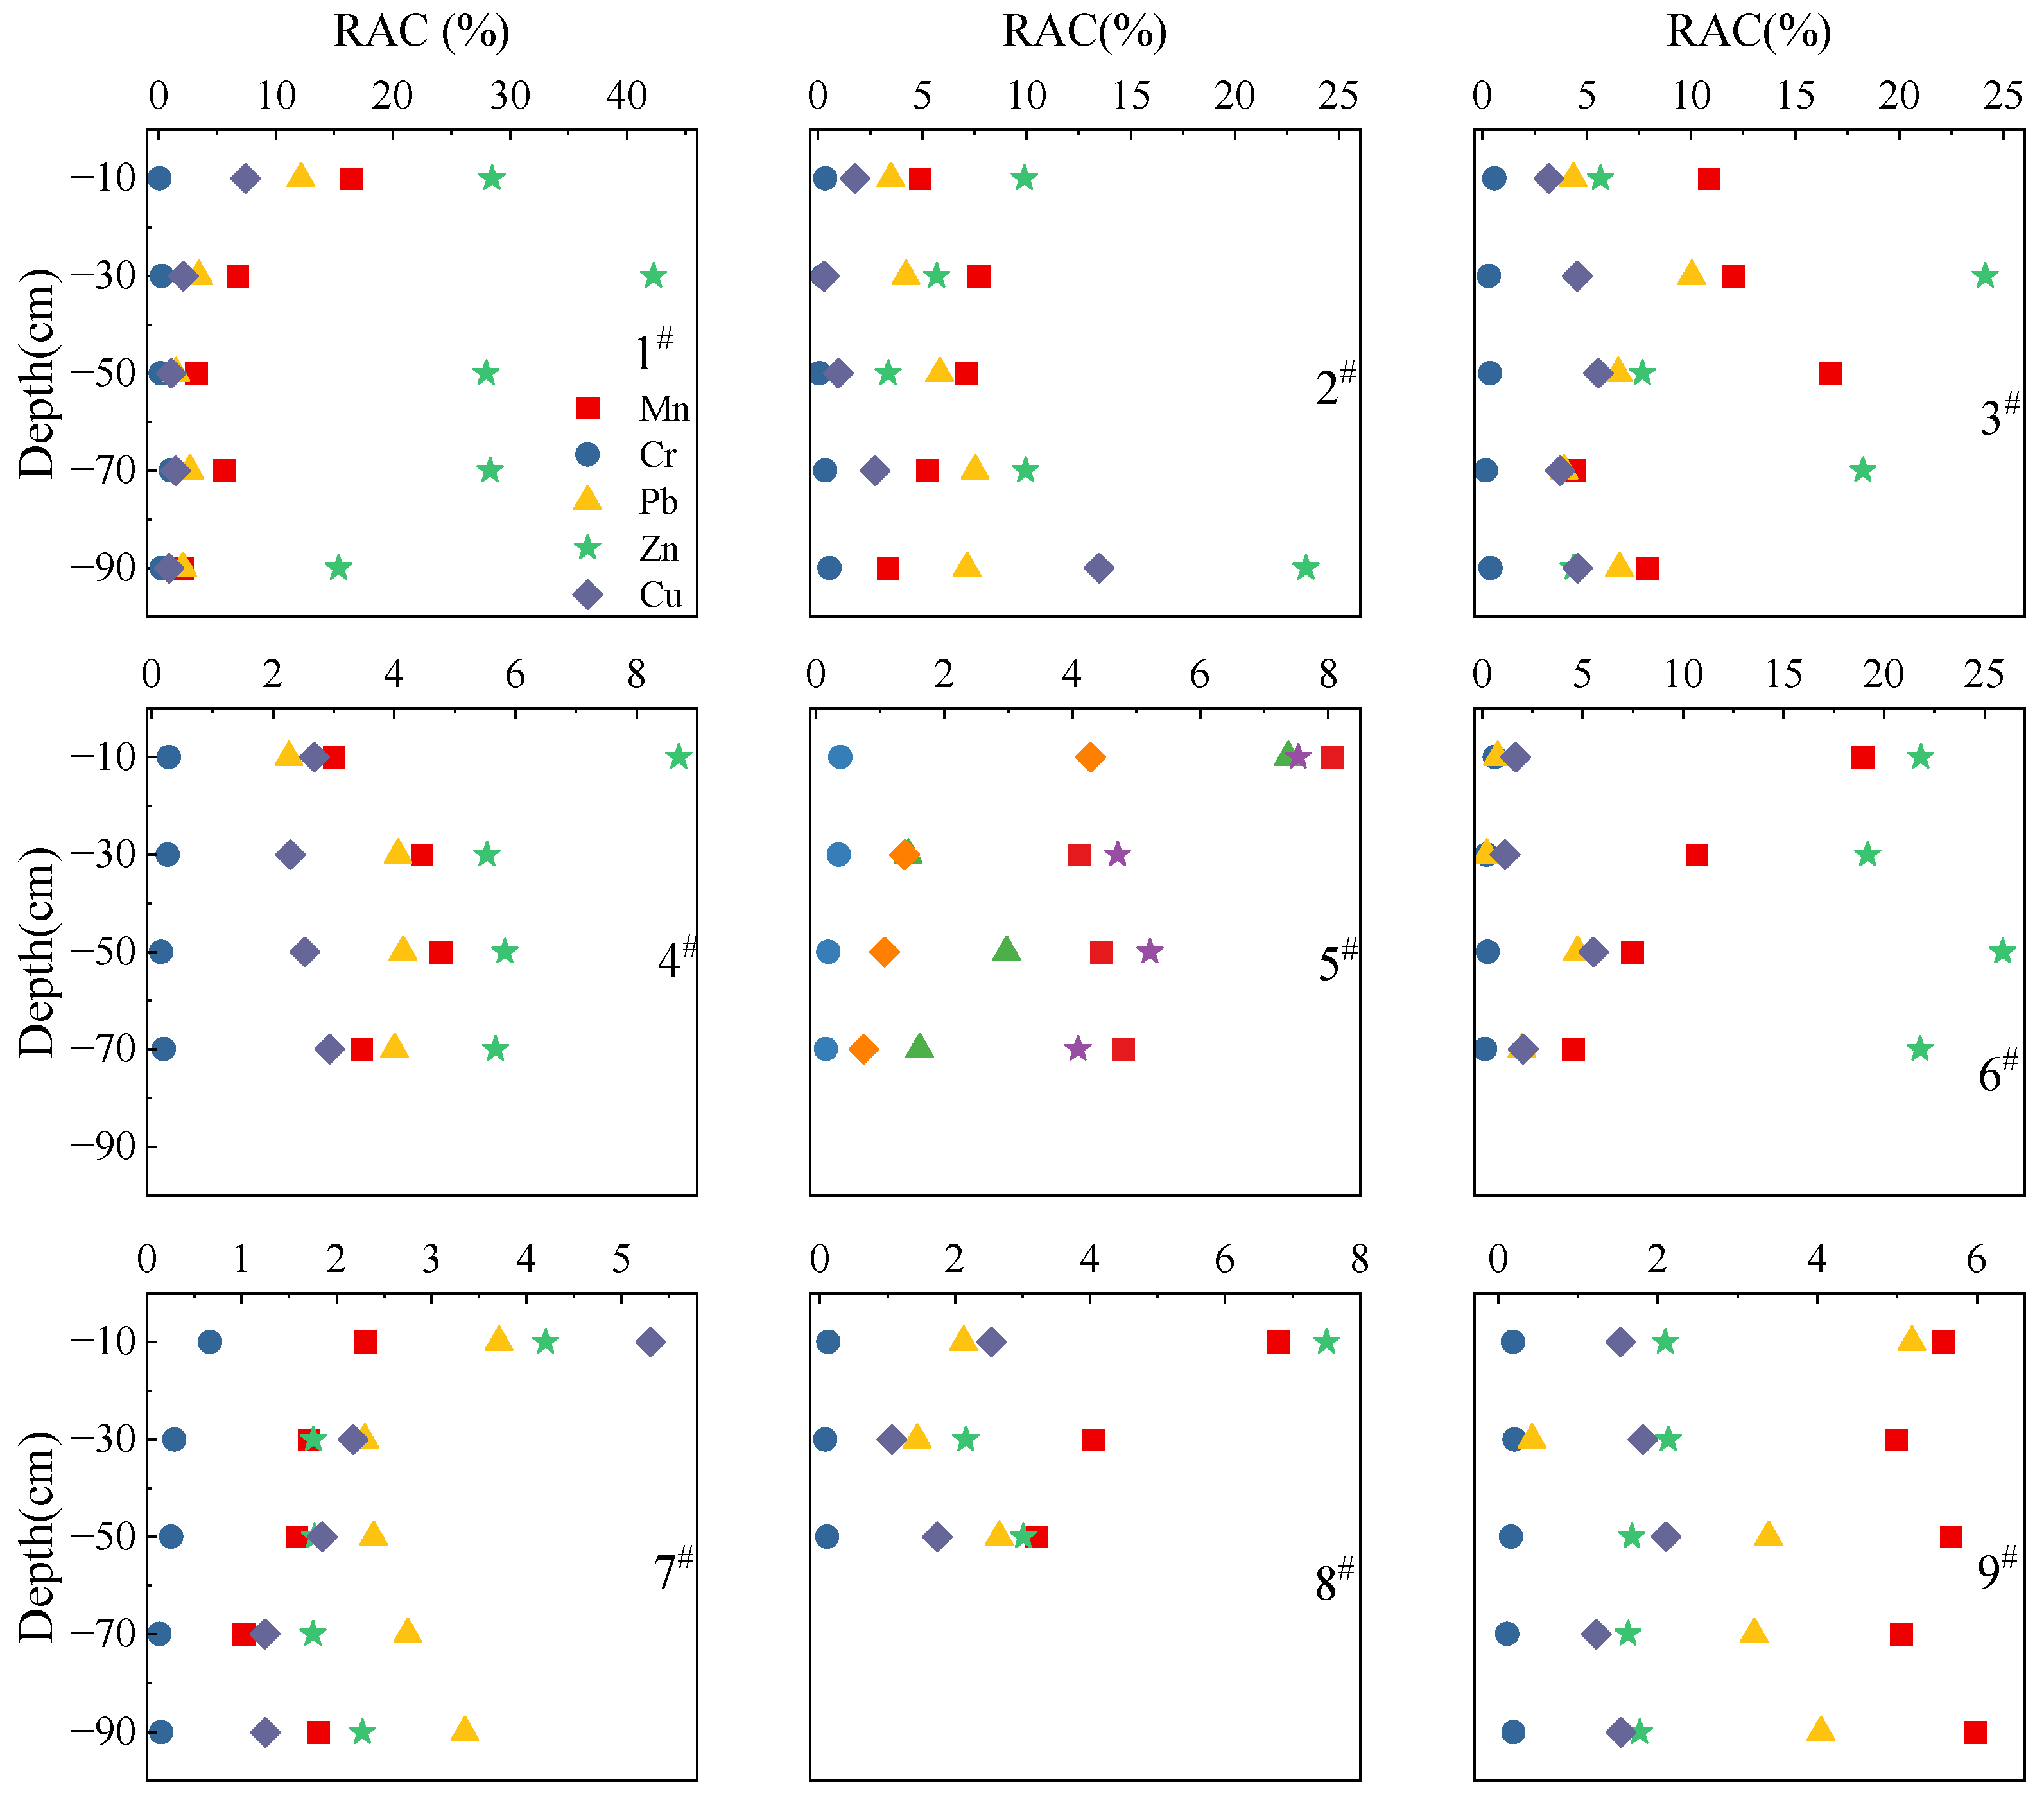
Figure 8 depicts the findings of the ecological risk assessment of HM forms using RAC. At all sampling points, the RAC values of Cr were less than 1%, indicating a low ecological risk of Cr. The RAC values for Cu and Pb were primarily between 1% and 10%, which represented low risk levels. The Cr values of Mn showed medium risk levels (10% < RAC < 30%) in the topsoil (0 to −60 cm) at sampling sites 1#, 3#, and 6#, but low risk levels (1% < RAC < 10%) at all other sampling points and depths. The Cr values of Zn predominantly exhibited medium risk levels (10% < RAC < 30%) at sampling sites 1#, 3#, and 6# and low risk levels (1% < RAC < 10%) at the remaining locations.
The findings of the combined PERI and RAC analyses showed the following. The Zn and Mn concentrations were much higher than the background values, and the F1 proportion was relatively high; however, the Zn and Mn toxicity response coefficients were 1, and the mean Er values were extremely low (i.e., 9.72 and 2.27), indicating low ecological risk. The mean of Pb concentrations was considerably higher than the background value, but the mean of Er values was lower at 27.63, and the RAC was mostly between 1% and 10%; thus, there was a certain degree of ecological risk. The mean values of Cu and As concentrations were higher than the background values, while the Er values were less than 40 (12.65 and 10.19), and the RAC values of Cu ranged from 1% to 10%, indicating low ecological risk. The mean values of Cr and Sb concentrations were lower than the background values, the Er values were only 1.32 and 3.82, and the F1 of Cr was less than 1%; thus, the ecological risk was low. The highest risk of Cd contamination was concentrated in front of the Sidi River mountain (sampling point 1#) and at the entrance of the subterranean river (sampling points 5# and 6#).
3.3. Analysis of Heavy Metal Sources
As seen in Section 3.1.1, the concentration and distribution of HMs in the soils of the study area are closely related to the Sidi River and the upstream Pb-Zn mines.
When an EF value is greater than 1.5, it indicates that HMs may have originated from anthropogenic activities, and an EF value less than 1.5 indicates that HMs mainly originated from natural processes, such as soil-forming parent rocks [62]. As shown in Figure 5, the EF values of both Cr and As were less than 1.5, indicating that they mainly originated from natural processes, such as soil-forming parent rocks. The EF of Sb was greater than 1.5 in the topsoil (0 to −20 cm) in front of the mountain of Sidi River (sampling point 1#) and at the entrance of Sidi River vadose (sampling points 5# and 6#), indicating that Sb in this area was mainly influenced by anthropogenic activities. The EF values of Pb, Zn, Cu, and Cd along the Sidi River (sampling points 1#–6#) were greater than 1.5, indicating that Pb, Zn, Cu, and Cd in this area were closely linked to anthropogenic activities. The EF of Mn was greater than 1.5 along the Sidi River (sampling points 1#–6#) and the area that had fewer irrigation impacts on the Sidi River (sampling points 8# and 9#), and the content of Mn was considerably higher than the background values in both areas, indicating that Mn was closely associated with anthropogenic activities and excessive quantities of soil-forming parent rocks in these two areas. The presence of many HMs (Cu, Cd, Sb, and Mn) during Pb-Zn mining suggested that the HMs (Pb, Zn, Cu, Sb, and Mn) in the area under the continuous influence of the Sidi River may have originated from the upstream Pb-Zn mine.
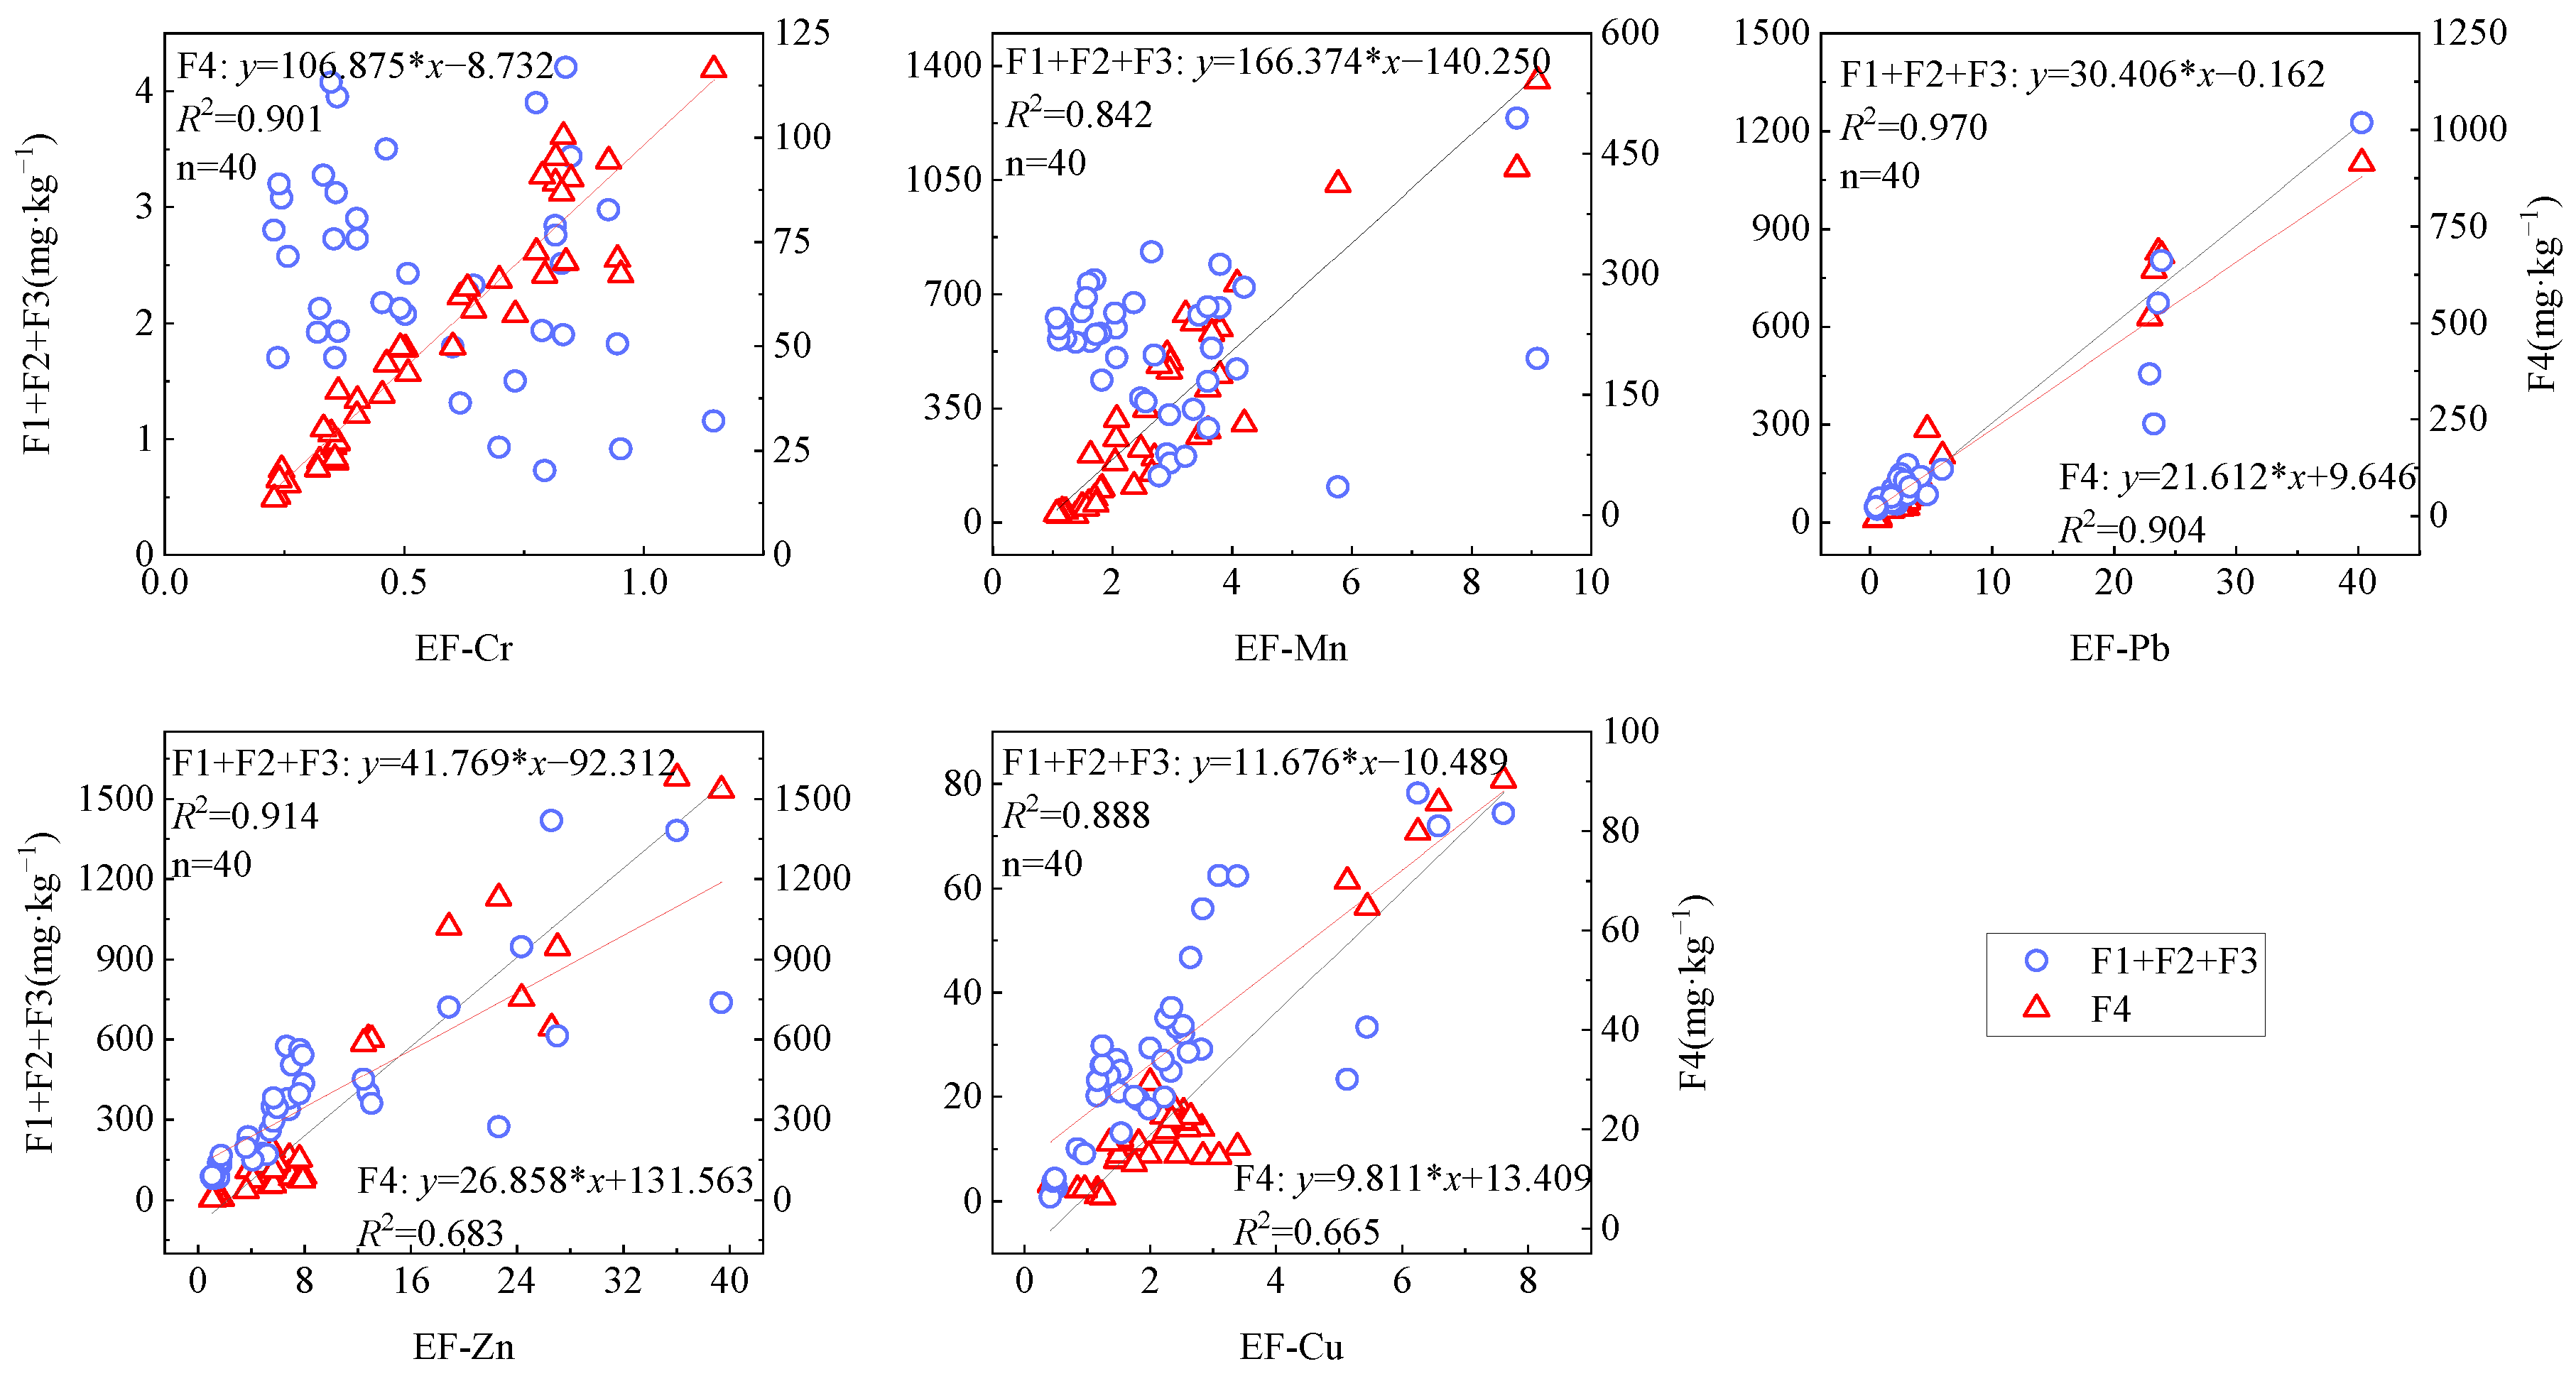
HMs presented in the Ex fraction were more influenced by anthropogenic factors than those present in the F4 [49]. EF can be linearly analyzed with the content of Ex and F4 to infer the source of contamination [49,63], as shown in Figure 9. As can be seen from Figure 9, the Ex values of Mn, Pb, Zn, and Cu were significantly correlated with EF, with R2 values of 0.842, 0.970, 0.914, and 0.888, respectively. This shows that Mn, Pb, Zn, and Cu were impacted by anthropogenic factors, and their main sources may be anthropogenic processes such as mining and agricultural activities. The F4 for Cr, Pb, Zn, and Cu similarly showed a high correlation with EF, with R2 values of 0.901, 0.904, 0.683, and 0.665, respectively. This indicated that natural processes, such as soil-forming parent rocks, may also be potential sources of Cr, Pb, Zn, and Cu.
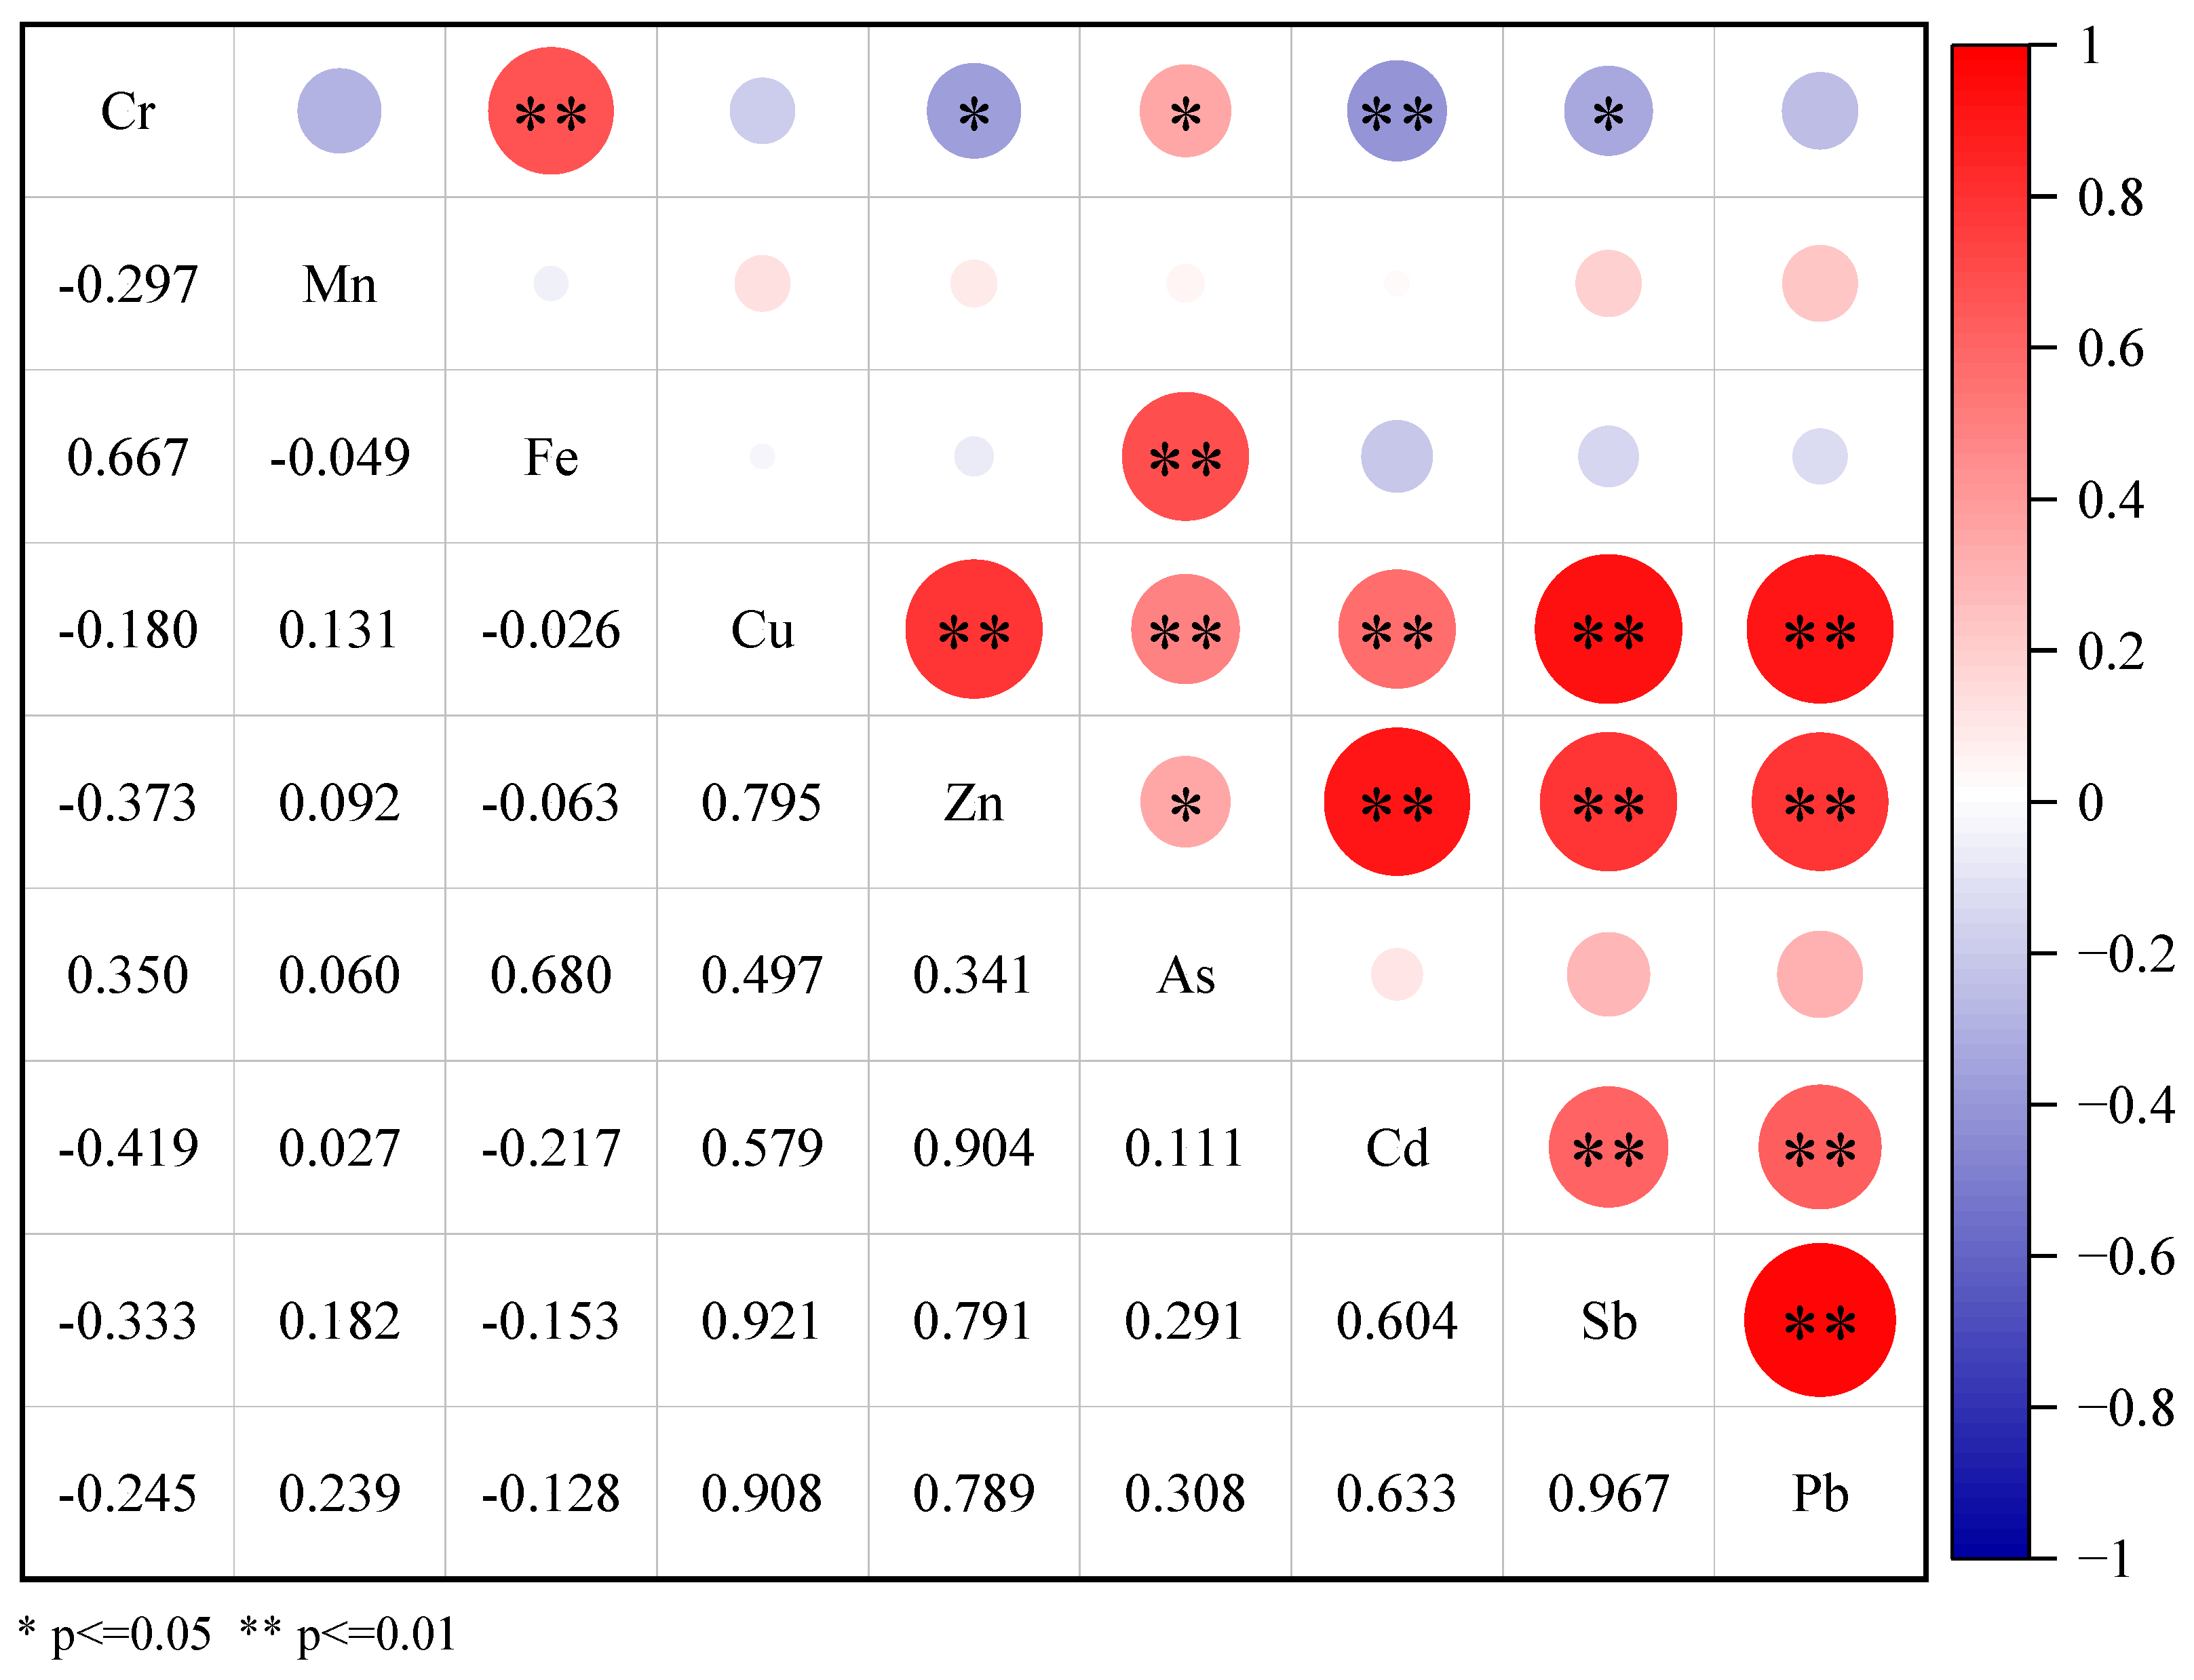
Pearson’s correlation analysis was used to further explain the relationship among each heavy metal element, and the results of the analysis are shown in Figure 10. Significantly positive correlations were found between Cr and Fe and Fe and As with correlation coefficients of 0.67 and 0.68, respectively, as well as Cr and As with a correlation coefficient of 0.35. This indicated a higher likelihood of having the same origin. The correlation coefficients between Cu, Zn, Cd, Sb, and Pb were high (0.58–0.97) and p < 0.01, indicating the possibility of a higher degree of homology. Negative correlations were found between Cr and Zn, Cd, and Sb, indicating that there was less possibility of homology or an antagonistic effect among them. The correlation coefficients between As and Cu and As and Zn were 0.50 and 0.34, respectively, and showed a horizontal (bilateral) correlation of 0.01 and 0.05, respectively. This showed that there was a certain possibility of homology between As and Cu and As and Zn, as well as the possibility of a compound origin.
PCA can reduce the number of influencing factors and assign weights to each factor in order to determine the sources of HMs in soil [34]. The results are presented in Table 3. Three principal components with eigenvalues greater than 1 were extracted, with eigenvalues of 4.482, 2.210, and 1.048. The cumulative contribution of the total variance was 86.004%, which reflects the majority of the information from the original data. The PC1 contribution was 49.801%, and the loadings of Cu, Zn, Cd, Sb, and Pb were 0.919, 0.930, 0.801, 0.941, and 0.938, respectively, indicating a high homology. Given that the Yangshuo lead-zinc mining and tailing areas were located upstream of the Sidi Village and that the area consisted of the alluvial deposits of the Sidi River, the source of the loosely deposited material was primarily from the upstream mining area. Consequently, PC1 was more likely to be associated with mining activities. The contribution of PC2 was 24.558%, while the loadings of Cr, Fe, and As were 0.762, 0.907, and 0.839, respectively. Fe is a naturally abundant element that is extensively distributed in river sediments or soils, is not easily influenced by anthropogenic activities, and can be regarded as representative of natural sources; thus, it can be presumed that PC2 is related to soil-forming parent rocks. The PC3 contribution was 11.645%, and the Mn loading was the highest (0.940). The Mn concentrations were much higher than the background values in Guangxi, were mostly associated with Pb-Zn ores, and Mn was a relatively stable element in the soil, indicating that Mn was mainly controlled by the upstream Pb-Zn ore and soil-forming parent rock. Therefore, PC3 was mostly attributable to the combined influence of mining and soil-forming parent rocks.
In summary, the outcomes of the three source-resolution methods were consistent. Cu, Zn, Cd, Sb, and Pb were mainly associated with anthropogenic activities such as mining. Cr, As, and Fe concentrations were mainly related to natural processes such as soil-forming parent rocks. In contrast, Mn was controlled by both mining and soil-forming parent rocks.
4. Conclusions
The Cu, Zn, As, Cd, Sb, and Pb concentrations in the soils of the study area exhibited significant differences in spatial distribution. The mean concentrations of Cu, Zn, As, Cd, Sb, and Pb at the front of the Sidi River mountain (sampling point 1#) and the entrance of the subterranean river (sampling points 5# and 6#) were 69.30, 1047.65, 21.07, 6.48, 3.35, and 452.98 mg·kg−1, respectively. Mean values of 22.43, 122.99, 13.22, 0.33, 0.34, and 43.08 mg·kg−1 for Cu, Zn, As, Cd, Sb, and Pb, respectively, were observed in the central highland area (sampling point 7#), southwest part (sampling point 8#), and the northeast side slope (sampling point 9#). Cr and Fe concentrations were higher in the highland area (sampling point 7#) with mean values of 90.87 mg·kg−1 and 65.71 g·kg−1, respectively. The Mn concentration was relatively uniformly distributed, with concentrations of 319.35–648.01 mg·kg−1.
The extractable fraction (F1 + F2 + F3) (Ex) varied for each HM type. The mean Ex values of Mn and Pb were 50.7% and 45.6%, respectively, with high bioavailability and migratory capacity, which had a significant impact on the eco-environment. The mean values of Zn and Cu were 26.5% and 25.9%, respectively, with average bioavailability and migratory capacity indicating a medium degree of impact on the eco-environment. Cr and Fe showed the smallest Ex values, with mean values of 6.2% and 1.9%, respectively, indicating weak bioavailability, migration capacity, and low ecological impact.
In accordance with the HM pollution risk index, the study area can be divided into three regions based on the results of the EF, RSP, PERI, and RAC analyses. The pollution is more severe in front of the Sidi River mountain and at the entrance of the subterranean river, whereas the area along the Sidi River and the irrigated area of the Sidi River were polluted to a lesser extent; the pollution was low in the highland district and the southwestern part of the study area. Among the single elements, Cd had the highest ecological risk. Pb and Mn contained high concentrations of F1 and posed a high ecological risk. Zn posed a low ecological risk.
The linear analysis of EF with Ex, EF, and F4 content revealed that Pb, Zn, Mn, and Cu were strongly influenced by anthropogenic processes. Pearson’s correlation analysis and PCA results indicated that Cu, Zn, Cd, Sb, and Pb were primarily controlled by anthropogenic activities such as mining, whereas Cr, Fe, and As were mainly influenced by natural processes such as soil-forming parent rocks. Mn was controlled by both mining and soil-forming parent rocks.
The results of this study show that the Yanghsuo lead-zinc mine has caused serious environmental pollution of the study area. The local government should further determine the main controlling factors for the sources and distribution of heavy metals in the soil. Local farmers are advised to change their farming practices in the highly polluted areas to reduce food crops cultivation in favor of cash crops and reduce or even refrain from planting food crops in front of the Sidi River mountain and near the entrance of the subterranean river, to reduce the risk of heavy metals to human health and protect the eco-environment.
Author Contributions
All authors contributed to the study conception and design. Methodology, M.C., Y.C. and Y.P.; software, X.W., Y.P. and K.D.; validation, Y.P. and M.C.; formal analysis, Y.P. and M.C.; investigation, X.W., K.D., M.C. and Y.P. The first draft of the manuscript was written by Y.P. and all authors commented on previous versions of the manuscript. All authors have read and agreed to the published version of the manuscript.
Funding
This work was supported by the Natural Science Foundation of Guangxi Province (Grant No. 2020GXNSFBA297050) and Specific Research Project of Guangxi for Research Bases and Talents (Grant No. AD19110046).
Data Availability Statement
The data presented in this paper are available on request from the corresponding author.
Acknowledgments
The authors thank the reviewers for providing valuable advice to help improve the paper.
Conflicts of Interest
The authors declare no conflict of interest.
References
- Cheng, X.; Drozdova, J.; Danek, T.; Huang, Q.; Qi, W.; Yang, S.; Zou, L.; Xiang, Y.; Zhao, X. Pollution assessment of trace elements in agricultural soils around copper mining area. Sustainability 2018, 10, 4533. [Google Scholar] [CrossRef] [Green Version]
- Wang, P.; Sun, Z.; Hu, Y.; Cheng, H. Leaching of heavy metals from abandoned mine tailings brought by precipitation and the associated environmental impact. Sci. Total Environ. 2019, 695, 133893. [Google Scholar] [CrossRef] [PubMed]
- Li, Z.; Ma, Z.; van der Kuijp, T.J.; Yuan, Z.; Huang, L. A review of soil heavy metal pollution from mines in China: Pollution and health risk assessment. Sci. Total Environ. 2014, 468–469, 843–853. [Google Scholar] [CrossRef] [PubMed]
- Xu, D.; Fu, R.; Liu, H.; Guo, X. Current knowledge from heavy metal pollution in Chinese smelter contaminated soils, health risk implications and associated remediation progress in recent decades: A critical review. J. Clean. Prod. 2021, 286, 124989. [Google Scholar] [CrossRef]
- Du, B.; Zhou, J.; Lu, B.; Zhang, C.; Li, D.; Zhou, J.; Jiao, S.; Zhao, K.; Zhang, H. Environmental and human health risks from cadmium exposure near an active lead-zinc mine and a copper smelter, China. Sci. Total Environ. 2020, 720, 137585. [Google Scholar] [CrossRef]
- Yang, Q.; Li, Z.; Lu, X.; Duan, Q.; Huang, L.; Bi, J. A review of soil heavy metal pollution from industrial and agricultural regions in China: Pollution and risk assessment. Sci. Total Environ. 2018, 642, 690–700. [Google Scholar] [CrossRef]
- Gabarron, M.; Zornoza, R.; Martinez-Martinez, S.; Munoz, V.A.; Faz, A.; Acosta, J.A. Effect of land use and soil properties in the feasibility of two sequential extraction procedures for metals fractionation. Chemosphere 2019, 218, 266–272. [Google Scholar] [CrossRef]
- Hu, B.; Guo, P.; Su, H.; Deng, J.; Zheng, M.; Wang, J.; Wu, Y.; Jin, Y. Fraction distribution and bioavailability of soil heavy metals under different planting patterns in mangrove restoration wetlands in Jinjiang, Fujian, China. Ecol. Eng. 2021, 166, 106242. [Google Scholar] [CrossRef]
- Jayarathne, A.; Egodawatta, P.; Ayoko, G.A.; Goonetilleke, A. Assessment of ecological and human health risks of metals in urban road dust based on geochemical fractionation and potential bioavailability. Sci. Total Environ. 2018, 635, 1609–1619. [Google Scholar] [CrossRef]
- Xiao, L.; Guan, D.; Peart, M.; Chen, Y.; Li, Q.; Dai, J. The influence of bioavailable heavy metals and microbial parameters of soil on the metal accumulation in rice grain. Chemosphere 2017, 185, 868–878. [Google Scholar] [CrossRef]
- Zhong, X.; Zhou, S.; Zhu, Q.; Zhao, Q. Fraction distribution and bioavailability of soil heavy metals in the Yangtze River Delta—A case study of Kunshan City in Jiangsu Province, China. J. Hazard. Mater. 2011, 198, 13–21. [Google Scholar] [CrossRef] [PubMed]
- Gleyzes, C.; Tellier, S.; Astruc, M. Fractionation studies of trace elements in contaminated soils and sediments: A review of sequential extraction procedures. TrAC Trends Anal. Chem. 2002, 21, 451–467. [Google Scholar] [CrossRef]
- Jorfi, S.; Maleki, R.; Jaafarzadeh, N.; Ahmadi, M. Pollution load index for heavy metals in Mian-Ab plain soil, Khuzestan, Iran. Data Brief. 2017, 15, 584–590. [Google Scholar] [CrossRef] [PubMed]
- Tomlinson, D.L.; Wilson, J.G.; Harris, C.R.; Jeffrey, D.W. Problems in the assessment of heavy-metal levels in estuaries and the formation of a pollution index. Helgoländer Meeresunters. 1980, 33, 566–575. [Google Scholar] [CrossRef] [Green Version]
- Muller, G. Index of geoaccumulation in sediments of the Rhine River. Geojournal 1969, 2, 108–118. [Google Scholar]
- Reimann, C.; Caritat, P. Intrinsic flaws of element enrichment factors (EFs) in environmental geochemistry. Environ. Sci. Technol. 2000, 34, 5084–5091. [Google Scholar] [CrossRef]
- Hakanson, L. An ecological risk index for aquatic pollution control. A sedimentological approach. Water Res. 1980, 14, 975–1001. [Google Scholar] [CrossRef]
- Huang, Y.; Chen, Q.; Deng, M.; Japenga, J.; Li, T.; Yang, X.; He, Z. Heavy metal pollution and health risk assessment of agricultural soils in a typical peri-urban area in southeast China. J. Environ. Manag. 2018, 207, 159–168. [Google Scholar] [CrossRef]
- Tang, S.; Liu, X.; Yang, K.; Guo, F.; Yang, Z.; Ma, H.; Liu, F.; Peng, M.; Li, K. Migration, Transformation Characteristics, and Ecological Risk Evaluation of Heavy Metal Fractions in Cultivated Soil Profiles in a Typical Carbonate-Covered Area. Environ. Sci. 2021, 42, 3913–3923. (In Chinese) [Google Scholar]
- Liu, Y.; Tang, Y.; Zhong, G.; Zeng, H. A comparison study on heavy metal/metalloid stabilization in Maozhou River sediment by five types of amendments. J. Soils Sediments 2019, 19, 3922–3933. (In Chinese) [Google Scholar] [CrossRef]
- Perin, G.; Craboledda, L.; Lucchese, M.; Cirillo, R.; Dotta, L.; Zanette, M.; Orio, A. Heavy metal speciation in the sediments of northern Adriatic Sea. A new approach for environmental toxicity determination. Heavy Met. Environ. 1985, 2, 454–456. [Google Scholar]
- Chen, L.; Wang, G.; Wu, S.; Xia, Z.; Cui, Z.; Wang, C.; Zhou, S. Heavy metals in agricultural soils of the Lihe River watershed, East China: Spatial distribution, ecological risk, and pollution source. Int. J. Environ. Res. Public Health 2019, 16, 2094. [Google Scholar] [CrossRef] [PubMed] [Green Version]
- Zeng, X.; Chen, Q.; Tan, Q.; Xu, H.; Li, W.; Yang, S.; Liu, D. Risk assessment of heavy metals in soils contaminated by smelting waste for the perspective of chemical fraction and spatial distribution. J. Environ. Eng. Landsc. Manag. 2021, 29, 101–110. [Google Scholar] [CrossRef]
- Chen, Y.; Shi, Q.; Qu, J.; He, M. A pollution risk assessment and source analysis of heavy metals in sediments: A case study of Lake Gehu, China. Chin. J. Anal. Chem. 2022, 50, 100077. [Google Scholar] [CrossRef]
- Zhang, Y.; Li, T.; Guo, Z.; Xie, H.; Hu, Z.; Ran, H.; Li, C.; Jiang, Z. Spatial heterogeneity and source apportionment of soil metal (loid) s in an abandoned lead/zinc smelter. J. Environ. Sci. 2023, 127, 519–529. [Google Scholar] [CrossRef]
- Mostert, M.M.; Ayoko, G.A.; Kokot, S. Application of chemometrics to analysis of soil pollutants. TrAC Trends Anal. Chem. 2010, 29, 430–445. [Google Scholar] [CrossRef] [Green Version]
- Cheng, W.; Lei, S.; Bian, Z.; Zhao, Y.; Li, Y.; Gan, Y. Geographic distribution of heavy metals and identification of their sources in soils near large, open-pit coal mines using positive matrix factorization. J. Hazard. Mater. 2020, 387, 121666. [Google Scholar] [CrossRef]
- Liao, S.; Jin, G.; Khan, M.; Zhu, Y.; Duan, L.; Luo, W.; Jia, J.; Zhong, B.; Ma, J.; Ye, Z. The quantitative source apportionment of heavy metals in peri-urban agricultural soils with UNMIX and input fluxes analysis. Environ. Technol. Innov. 2021, 21, 101232. [Google Scholar] [CrossRef]
- Luo, S.; Xue, Y.; Wang, L.; Cang, L.; Xu, B.; Ding, J. Source identification and apportionment of heavy metals in urban soil profiles. Chemosphere 2015, 127, 152–157. [Google Scholar] [CrossRef]
- Feng, R.; Zheng, H.; Gao, H.; Zhang, A.; Huang, C.; Zhang, J.; Fan, J. Recurrent Neural Network and random forest for analysis and accurate forecast of atmospheric pollutants: A case study in Hangzhou, China. J. Clean. Prod. 2019, 231, 1005–1015. [Google Scholar] [CrossRef]
- Huang, H.; Zhou, Y.; Liu, Y.J.; Xiao, L.; Li, K.; Li, M.Y.; Wu, F. Source Apportionment and Ecological Risk Assessment of Potentially Toxic Elements in Cultivated Soils of Xiangzhou, China: A Combined Approach of Geographic Information System and Random Forest. Sustainability 2021, 13, 1214. [Google Scholar] [CrossRef]
- Hong, N.; Zhu, P.; Liu, A.; Zhao, X.; Guan, Y. Using an innovative flag element ratio approach to tracking potential sources of heavy metals on urban road surfaces. Environ. Pollut. 2018, 243, 410–417. [Google Scholar] [CrossRef] [PubMed]
- Wang, Y.; Guo, G.; Zhang, D.; Lei, M. An integrated method for source apportionment of heavy metal(loid)s in agricultural soils and model uncertainty analysis. Environ. Pollut. 2021, 276, 116666. [Google Scholar] [CrossRef] [PubMed]
- Lu, J.; Lu, H.; Lei, K.; Wang, W.; Guan, Y. Trace metal element pollution of soil and water resources caused by small-scale metallic ore mining activities: A case study from a sphalerite mine in North China. Environ. Sci. Pollut. Res. Int. 2019, 26, 24630–24644. [Google Scholar] [CrossRef] [Green Version]
- Jiang, S.; Zhai, F.; Zhang, C.; Wang, M.; Shan, B. Speciation Distribution and Risk Assessment of Heavy Metals in Sediments fromthe Yitong River City Area. Environ. Sci. 2020, 41, 2653–2663. (In Chinese) [Google Scholar] [CrossRef]
- Lin, B. Study on cadmium Pollution of Soil—Crop in a Pb-Zn mining area of Guangxi. Chin. J. Soil Sci. 1997, 28, 235–237. (In Chinese) [Google Scholar]
- Qin, C.; Li, Y.; Wei, S.; Huang, G. analysis on present environmental situation and treatment model of tailing waste water in Yangshuo lead–zinc deposit. Min. Resour Geol. 2005, 107, 99–102. (In Chinese) [Google Scholar]
- Hu, Q.; Zhang, C.; Jin, Z.; Cao, J.; Li, Q. CanoIlical Correspondence Analysisfor Soil Properties and Heavy Metal Pollution from Pb-Zn MineTailings in Difkrent Land UseTypes. Rock Miner. Anal. 2014, 33, 714–722. (In Chinese) [Google Scholar]
- Kong, J.; Guo, Q.; Wei, R.; Strauss, H.; Zhu, G.; Li, S.; Song, Z.; Chen, T.; Song, B.; Zhou, T.; et al. Contamination of heavy metals and isotopic tracing of Pb in surface and profile soils in a polluted farmland from a typical karst area in southern China. Sci. Total Environ. 2018, 637–638, 1035–1045. [Google Scholar] [CrossRef]
- Li, Q.; Jin, Z.; Yang, R. Relationship between Soil Properties and Soil Enzyme Activities in Heavy Metal Contaminated Area Based on Canonical Correspondence Analysis: A Case Study of Sidi Village, Yangshuo. Trop. Geogr. 2014, 34, 14–19. (In Chinese) [Google Scholar]
- Song, B.; Tian, M.; Pang, R.; Zhou, L.; Wu, Y.; Zhong, X. Concentrations of Heavy Metal Contents in Soil and Citrus, and Citrus Industry Optimization Near a Lead andZinc Mine in Northern Guangxi. J. Ecol. Rural. Environ. 2019, 35, 1268–1273. (In Chinese) [Google Scholar]
- Zhang, Y.; Song, B.; Yang, Z.; Wang, F.; Zhou, L.; Zhou, Z.; Bin, J. Characteristics and remediation strategy of heavy-metal polluted agricultural soil near a lead and zinc mine in Guangxi. J. Agro-Environ. Sci. 2018, 37, 239–249. (In Chinese) [Google Scholar]
- Chen, M.; Pan, Y.; Huang, Y.; Wang, X.; Zhang, R. Spatial Distribution and Sources of Heavy Metals in Soil of a Typical Lead-Zinc Mining Area, Yangshuo. Environ. Sci. 2022, 43, 4545–4555. (In Chinese) [Google Scholar]
- Zhao, X.; Wei, Z.; Wang, J.; Li, Y.; Zhao, L.; Xia, X.; Jiang, X. Study on determination of As, Se, Sb, Hg and Bi in soil andsediment by ICP-MS with water bath. China Meas. Test 2021, 47, 61–69. (In Chinese) [Google Scholar]
- U.S. EPA. Method 3050B: Acid Digestion of Sediments, Sludges, and Soils; Revision 2; U.S. EPA: Washington, DC, USA, 1996.
- Rauret, G.; López-Sánchez, J.F.; Sahuquillo, A.; Rubio, R.; Davidson, C.; Ure, A.; Quevauviller, P. Improvement of the BCR three step sequential extraction procedure prior to the certification of new sediment and soil reference materials. J. Environ. Monit. 1999, 1, 57–61. [Google Scholar] [CrossRef]
- Liu, W.; Meng, Y.; Jin, B.; Jiang, M.; Lin, Z.; Hu, L.; Zhang, T. Distribution Characteristics and Ecological Risk Assessment of Heavy Metals in Surface Sediments of the North Canal Using ICP-OES. Spectrosc. Spectr. Anal. 2020, 40, 3912–3918. (In Chinese) [Google Scholar]
- Sundaray, S.K.; Nayak, B.B.; Lin, S.; Bhatta, D. Geochemical speciation and risk assessment of heavy metals in the river estuarine sediments—A case study: Mahanadi basin, India. J. Hazard. Mater. 2021, 186, 1837–1846. [Google Scholar] [CrossRef]
- Zhang, C.; Shan, B.; Tang, W.; Dong, L.; Zhang, W.; Pei, Y. Heavy metal concentrations and speciation in riverine sediments and the risks posed in three urban belts in the Haihe Basin. Ecotoxicol. Environ. Saf. 2017, 139, 263–271. [Google Scholar] [CrossRef]
- Islam, S.; Ahmed, K.; Masunaga, S. Potential ecological risk of hazardous elements in different land-use urban soils of Bangladesh. Sci. Total Environ. 2015, 512, 94–102. [Google Scholar] [CrossRef]
- Tang, Z.; Zhang, L.; Huang, Q.; Yang, Y.; Nie, Z.; Cheng, J.; Chai, M. Contamination and risk of heavy metals in soils and sediments from a typical plastic waste recycling area in North China. Ecotoxicol. Environ. Saf. 2015, 122, 343–351. [Google Scholar] [CrossRef]
- Isimekhai, K.A.; Garelick, H.; Watt, J.; Purchase, D. Heavy metals distribution and risk assessment in soil from an informal E-waste recycling site in Lagos State, Nigeria. Environ. Sci. Pollut. Res. 2017, 24, 17206–17219. [Google Scholar] [CrossRef] [PubMed]
- Wang, F.; Song, B.; Zhou, L.; Pang, R.; Zhang, Y.; Chen, T. Redistribution of heavy metal background in soil of Xijiang River Basin in Guangxi. Acta Sci. Circumstantiae 2018, 38, 3695–3702. (In Chinese) [Google Scholar]
- Li, X.; Thornton, L. Chemical partitioning of trace and major elements in soils contaminated by mining and smelting activities. Appl. Geochem. 2001, 16, 1693–1706. [Google Scholar] [CrossRef]
- Tessier, A.; Campbell, P.G.; Bisson, M. Sequential extraction procedure for the speciation of particulate trace metals. Anal. Chem. 1979, 51, 844–851. [Google Scholar] [CrossRef]
- Wang, Y.; Huang, Y.; Wang, S.; Xu, C. Chemical speciation of elements in sediments and soils and their sequential extraction process. Geol. Bull. China 2005, 24, 728–734. (In Chinese) [Google Scholar]
- Hou, D.; O’Connor, D.; Nathanail, P.; Tian, L.; Ma, Y. Integrated GIS and multivariate statistical analysis for regional scale assessment of heavy metal soil contamination: A critical review. Environ. Pollut. 2017, 231, 1188–1200. [Google Scholar] [CrossRef]
- Weissmannová, H.D.; Pavlovský, J. Indices of soil contamination by heavy metals–methodology of calculation for pollution assessment (minireview). Environ. Monit. Assess. 2017, 189, 616. [Google Scholar] [CrossRef]
- Zoller, W.H.; Gladney, E.; Duce, R.A. Atmospheric concentrations and sources of trace metals at the South Pole. Science 1974, 183, 198–200. [Google Scholar] [CrossRef]
- Pan, Y.; Li, H. Investigating Heavy Metal Pollution in Mining Brownfield and Its Policy Implications: A Case Study of the Bayan Obo Rare Earth Mine, Inner Mongolia, China. Environ. Manag. 2016, 57, 879–893. [Google Scholar] [CrossRef]
- Baghaie, A.H.; Aghili, F. Investigation of heavy metals concentration in soil around a PbZn mine and ecological risk assessment. Environ. Health Eng. Manag. J. 2019, 6, 151–156. [Google Scholar] [CrossRef] [Green Version]
- Jiao, W.; Niu, Y.; Niu, Y.; Hu, H.; Li, R. Spatial assessment of anthropogenic impact on trace metal accumulation in farmland soils from a rapid industrializing region, East China. Int. J. Environ. Res. Public Health 2018, 15, 2052. [Google Scholar] [CrossRef] [PubMed] [Green Version]
- Gao, L.; Wang, Z.; Li, S.; Chen, J. Bioavailability and toxicity of trace metals (Cd, Cr, Cu, Ni, and Zn) in sediment cores from the Shima River, South China. Chemosphere 2018, 192, 31–42. [Google Scholar] [CrossRef] [PubMed]
Figure 1.
Study area and sediment sampling sites.

Figure 2.
Comparison of HMs content in different sampling points and depths.

Figure 3.
Distribution characteristics of HMs in sampling points. (Note: F1: ratio of weak acid extractable fraction heavy metal to total heavy metal; F2: ratio of reducible fraction heavy metal to total heavy metal; F3: ratio of oxidizable fraction heavy metal to total heavy metal; F4: ratio of residual fraction heavy metal to total heavy metal).

Figure 4.
The linear relationship between the total amount of HMs and the extractable and residual fractions. (Note: the red dot in the figure represents the sum of F1 + F2 + F3; the small black square represents the value of F4).
Figure 4.
The linear relationship between the total amount of HMs and the extractable and residual fractions. (Note: the red dot in the figure represents the sum of F1 + F2 + F3; the small black square represents the value of F4).

Figure 5.
The degree of heavy metal pollution in the study area. (Note: different color lines represent EF values: 1, 2, 5, 20; NP: no pollution; LP: light pollution; MP: moderate pollution; SP: severe pollution; SIP: significant contamination; Orange squares represent sampling points with depths from 0 to −20 cm; green dots represent sampling points with depths from −20 to −40; purple triangles represent sampling points with depths from −40 to −60; yellow diamonds represent sampling points with depths from −60 to −80 cm; and blue pentagons represent sampling points with depths from −80 to −100 cm).

Figure 6.
The degree of heavy metal pollution in the study area. (Note: different color lines represent RSP values: 1, 2, 3; NP: no pollution; LP: light pollution; MP: moderate pollution; SP: severe pollution; SIP: significant contamination; the black square represents Mn, the red dot represents Cr, the blue triangle represents Pb, the green pentagram represents Zn, and the purple diamond represents Cu).

Figure 7.
Soil heavy metal contamination level and ecological risk assessment based on PERI.

Figure 8.
RAC-based assessment of soil heavy metal pollution levels and ecological risks. (Note: Red squares represent Mn, dark blue circles represent Cr, yellow triangles represent Pb, green pentagrams represent Zn, and purple diamonds represent Cu).
Figure 8.
RAC-based assessment of soil heavy metal pollution levels and ecological risks. (Note: Red squares represent Mn, dark blue circles represent Cr, yellow triangles represent Pb, green pentagrams represent Zn, and purple diamonds represent Cu).

Figure 9.
The EF and correlation of HMs in soil sediments in the study area. (Note: F1 + F2 + F3: light blue circle represents the sum of F1, F2, and F3 heavy metals; F4: the red triangle represents the content of F4 heavy metals).
Figure 9.
The EF and correlation of HMs in soil sediments in the study area. (Note: F1 + F2 + F3: light blue circle represents the sum of F1, F2, and F3 heavy metals; F4: the red triangle represents the content of F4 heavy metals).

Figure 10.
Correlation coefficient of HMs. (Note: indicates a significant correlation at the 0.01 level (bilateral); indicates significant correlation at the 0.05 level (bilateral); sample size n = 40).
Figure 10.
Correlation coefficient of HMs. (Note: indicates a significant correlation at the 0.01 level (bilateral); indicates significant correlation at the 0.05 level (bilateral); sample size n = 40).


Table 1.
Enrichment factor, potential ecological risk assessment index, risk assessment code, and ratio of the secondary phase and primary phase grading standards.
Table 1.
Enrichment factor, potential ecological risk assessment index, risk assessment code, and ratio of the secondary phase and primary phase grading standards.
| EF | PERI | RSP | RAC | ||||
|---|---|---|---|---|---|---|---|
| Threshold Interval | Pollution Level | Threshold Interval | Risk Level | Threshold Interval | Pollution Level | Threshold Interval/% | Risk Level |
| ≤1 | no polluting | Er < 40 | minor risks | RSP < 1 | no polluting | RAC < 1 | no risk |
| 1 < EF ≤ 2 | light pollution | 40 ≤ Er < 80 | medium risk | 1 ≤ RSP < 2 | light pollution | 1 ≤ RAC < 10 | low risks |
| 2 < EF ≤ 5 | moderate pollution | 80 ≤ Er < 160 | stronger risk | 2 ≤ RSP < 3 | moderate pollution | 10 ≤ RAC < 30 | medium risk |
| 5 < EF ≤ 20 | severe pollution | 160 ≤ Er <320 | strong risk | 3 ≤ RSP | severe pollution | 30 ≤ RAC < 50 | high risk |
| 20 < EF | significant contamination | Er ≥ 320 | extremely high risk | 50 ≤ RAC | extremely high risk | ||
| PERI < 150 | minor risks | ||||||
| 150 ≤ PERI < 300 | medium risk | ||||||
| 300 ≤ PERI < 600 | strong risk | ||||||
| 600 ≤ PERI | extremely high risk | ||||||
Note: Er in PERI is the single factor potential ecological risk index, and PERI is the combined potential ecological risk index.
Table 2.
Statistical table of HMs content in study area (n = 40).
| Cr | Mn | Fe | Cu | Zn | As | Cd | Sb | Pb | |
|---|---|---|---|---|---|---|---|---|---|
| mg/kg | mg/kg | g/kg | mg/kg | mg/kg | mg/kg | mg/kg | mg/kg | mg/kg | |
| Max | 117.34 | 1578.36 | 74.50 | 164.24 | 2958.40 | 29.97 | 13.64 | 17.66 | 2119.58 |
| Min | 15.67 | 235.00 | 40.21 | 9.49 | 82.40 | 4.98 | 0.22 | 0.17 | 27.85 |
| Average | 54.58 | 546.42 | 56.51 | 52.58 | 654.71 | 17.37 | 2.25 | 2.77 | 280.32 |
| Background | 82.66 | 173.65 | 50.20 | 20.79 | 67.34 | 17.04 | 0.56 | 5.08 | 50.72 |
| standard deviation | 28.03 | 313.05 | 9.30 | 37.80 | 688.36 | 7.27 | 3.03 | 4.57 | 458.04 |
| CV | 0.51 | 0.57 | 0.16 | 0.72 | 1.05 | 0.42 | 1.35 | 1.65 | 1.63 |
Note: heavy metal background values are from the literature [53].
Table 3.
Principal component analysis results of heavy metals (n = 40).
| Elements | PC1 | PC2 | PC3 |
|---|---|---|---|
| Cr | −0.416 | 0.762 | −0.153 |
| Mn | 0.223 | −0.139 | 0.940 |
| Fe | −0.166 | 0.907 | 0.100 |
| Cu | 0.919 | 0.225 | −0.004 |
| Zn | 0.930 | 0.040 | −0.164 |
| As | 0.339 | 0.839 | 0.137 |
| Cd | 0.801 | −0.160 | −0.284 |
| Sb | 0.941 | 0.032 | 0.025 |
| Pb | 0.938 | 0.073 | 0.061 |
| Eigenvalues | 4.482 | 2.210 | 1.048 |
| Contribution rate/% | 49.801 | 24.558 | 11.645 |
| Cumulative contribution rate/% | 49.801 | 74.359 | 86.004 |
Disclaimer/Publisher’s Note: The statements, opinions and data contained in all publications are solely those of the individual author(s) and contributor(s) and not of MDPI and/or the editor(s). MDPI and/or the editor(s) disclaim responsibility for any injury to people or property resulting from any ideas, methods, instructions or products referred to in the content. |
© 2022 by the authors. Licensee MDPI, Basel, Switzerland. This article is an open access article distributed under the terms and conditions of the Creative Commons Attribution (CC BY) license (https://creativecommons.org/licenses/by/4.0/).
Share and Cite
MDPI and ACS Style
Pan, Y.; Chen, M.; Wang, X.; Chen, Y.; Dong, K. Ecological Risk Assessment and Source Analysis of Heavy Metals in the Soils of a Lead-Zinc Mining Watershed Area. Water 2023, 15, 113. https://doi.org/10.3390/w15010113
AMA Style
Pan Y, Chen M, Wang X, Chen Y, Dong K. Ecological Risk Assessment and Source Analysis of Heavy Metals in the Soils of a Lead-Zinc Mining Watershed Area. Water. 2023; 15(1):113. https://doi.org/10.3390/w15010113
Chicago/Turabian StylePan, Yongxing, Meng Chen, Xiaotong Wang, Yudao Chen, and Kun Dong. 2023. "Ecological Risk Assessment and Source Analysis of Heavy Metals in the Soils of a Lead-Zinc Mining Watershed Area" Water 15, no. 1: 113. https://doi.org/10.3390/w15010113
Note that from the first issue of 2016, this journal uses article numbers instead of page numbers. See further details here.