

Risk-Informed Design of RCC Dams under Extreme Seismic Loading
Senior Technical Advisor for Dams and Hydraulic Structures, HDR Engineering, Inc., Suite 3400, Denver, CO 80220-4824, USA
Water 2023, 15(1), 116; https://doi.org/10.3390/w15010116
Submission received: 27 October 2022
/
Revised: 19 December 2022
/
Accepted: 21 December 2022
/
Published: 29 December 2022
(This article belongs to the Special Issue Soft Computing and Machine Learning in Dam Engineering)
Abstract
:The existing Scoggins Dam and reservoir are in Washington County, Oregon, and the title is held by the U.S. Bureau of Reclamation (Reclamation). Reclamation has previously identified dam safety concerns related to the existing embankment dam. Regional project sponsors, including Clean Water Services, have identified the need for expanded storage capacity in the reservoir to meet growing water demands and address water quality issues in the Tualatin River downstream of the dam. As part of efforts to resolve dam safety issues and increase the water storage in the reservoir, a comprehensive feasibility level design of a new 185-foot-high Roller Compacted Concrete (RCC) dam. Extraordinary seismic hazards have been identified in the region associated with the Cascadia Subduction Zone (CSZ). Further, any dam alternative carried forward for funding, final design, and construction will have to meet the Public Protection Guidelines (PPG) of Reclamation that require a formal quantitative risk analysis. A risk-informed design approach was adopted to configure the layout and cross-section properties of the dam. A multi-phase site characterization program and preliminary RCC mix design program were performed to support the design. In addition, models were developed, and an extensive suite of both (two-dimensional) 2D and (three-dimensional) 3D structural analyses were performed for seismic loadings with total durations of over 200 s, strong shaking of over 140 s, and peak ground accelerations of over 2 gravitational accelerations (g) (up to 50,000-year return period event). This paper describes the feasibility design configuration of the dam, including the seismic hazard characterization, structural analysis models, and seismic response modeling results. The expected performance of the dam relative to the risk-informed design criteria and Reclamation PPGs will be generally described.
1. Introduction
Hagg Lake reservoir, impounded by Scoggins Dam (Figure 1), is a key water resources facility for a range of water providers in Washington County, Oregon. The dam was completed in 1975. It is located on Scoggins Creek, about 5 miles (8 km) southwest of Forest Grove, Oregon and 25 miles (40.25 km) west of Portland, Oregon. The estimated existing storage capacity of Hagg lake is 53,640 acre-feet (>66,000,000 cubic meters [m3]) at the top of the current active conservation pool elevation of 303.5 feet (92.5 m). An enlarged reservoir has been under consideration as a central feature of the Tualatin Basin Dam Safety and Water Supply Joint Project. The new RCC dam holding the enlarged Joint Project reservoir presented in this paper would be located downstream of the existing embankment dam and have a maximum structural height of 180.5 feet (55 m), an increased storage capacity of up to 50,000 acre-feet (61,674,000 m3) and a total maximum storage of 103,640 acre-feet (127,838,000 m3).
The feasibility design described in this paper was based on the results of appraisal-level designs (Reclamation, FAC 09-01) [1], where the RCC dam concept was originally examined as a possible project that could address both dam safety and increased water supply project objectives. A straight gravity plan and cross-section were developed, structurally modeled, and then subjected to a full quantitative risk analysis (QRA). The QRA demonstrated that the gravity dam section could be designed to withstand the very large seismic hazards at the site and that some optimization would likely be possible. One of the most significant optimizations identified during the QRA was curving the dam in a plan to activate arch action during higher seismic events that could cause cracking and potential sliding of the dam. The corresponding cross-section and curved gravity alignment were verified during feasibility design based on a risk-informed design approach.
2. A Review of Seismic Design and Dam Safety Risk Analysis of Concrete Dams
Seismic design and analysis of existing or new concrete dams is a challenging task and requires consideration of multiple performance factors, including dam-foundation-water interaction, proper seismic analysis, and realistic modeling of nonlinear and damage behavior of concrete [2]. In the case of new concrete dams, consideration of material property variation with time and thermal effects must be incorporated into the design. While there has been tremendous research on the seismic “analysis” of existing concrete dams and hydraulic structures against natural hazards, there was limited attention on the seismic “design” of new dams [3], particularly in high seismic regions and for dams for which failure may impact large populations downstream of the reservoir.
Traditionally, concrete gravity dams have been designed by a force-based procedure [4,5]. In this method, the forces associated with the weight of the dam are obtained as a product of a seismic coefficient, and the weight of the portion of the dam being considered is statically applied to the dam. These forces were also combined with hydrostatic and simplified hydrodynamic pressures [6]. The main disadvantages of this method are that the dynamic characteristics of the dam and the applied ground motions are ignored.
Therefore, for new concrete dam design, a state-of-the-art method is needed to overcome the limitations of the traditional standards-based seismic design methods. This paper proposes the application of risk-informed design in concrete dam engineering. In the following sub-sections, a brief review of the literature is provided on (1) different design philosophies in earthquake engineering and (2) the evolution and application of risk-based procedures in dam engineering.
2.1. Seismic Design Philosophies
A key factor in the design process for modifying an existing or construction of a new concrete dam or major concrete hydraulic structure is the identification of design objectives and criteria. Over the past 30 to 40 years, there has been significant advancement of analysis capabilities, the widely accepted use of RCC for both rehabilitation of existing dams and design of new dams, and continuing development of different design methods utilizing advanced numerical modeling and updated codes, standards, and industry guidelines. Performance-based seismic design [7] allows for the desired level of seismic performance for the structural systems when they are subjected to a specific level of ground shaking. Multiple levels of ground shaking can be evaluated, with a different level of performance specified for each shaking level. Reliability-based seismic design [8] uses the mean values of the random system parameters as design variables and optimizes the objective function subject to pre-defined probabilistic constraints. Risk-based seismic design [9] uses safety as the main objective. A risk-based design considers composition, intended use, materials, actual use, environmental issues, and ultimate decommissioning of the structure. It can be complex, requiring knowledgeable teams and schedules that include risk analysis throughout the design process. More recently, the concept of resilience-based seismic design [10] has been introduced. It is the next generation of performance-based design procedures. In this approach, the interaction of the structure with local and regional communities is accounted for. The structure should not be considered alone but as part of a group of infrastructure requiring the use of a portfolio approach which provides for incorporation of regional loss analysis.
The implementation of the above-discussed design philosophies in concrete dam engineering is usually discussed within the so-called “shape optimization” task by Ramakrishnan and Francavilla [11]. It is an iterative procedure that combines advanced structural optimization theories with specific objective functions that are defined by engineers for the gravity or arch dams [12,13]. In some cases, the optimization algorithms are combined with machine learning methods to accelerate the design process and reduce the computational burden [14,15].
2.2. Risk-Informed Decision-Making (RIDM) in Dam Engineering
Risk can be defined as the “measure of the probability and severity of an adverse effect to life, health, property, or environment”. In the general case, risk is estimated by the combined consideration of loading scenario(s), the system (dam or structure) response to loading, and the associated consequence of failure [16]. The risk concept can be interpreted either as an individual risk or the overall risk of the system with different dimensions. Risk management encompasses activities related to making risk-informed decisions, prioritizing evaluations of risk, prioritizing risk reduction activities, and making program decisions associated with managing a portfolio of facilities.
Risk assessment is the process of deciding whether existing risks are tolerable and whether present risk control measures are adequate, and if not, whether alternative risk control measures are justified or should be implemented. Risk assessment incorporates the risk analysis and risk assessment phases. Tolerable risk means different things to different people and organizations. Some focus on economic risks to their companies or organizations (e.g., insurance, offshore oil, and gas), while others focus on the loss of life. Most of the regularities use a “risk curve” [17], either in the form of f-N or F-N chart.
The introduction and subsequent adoption of risk analysis into the dam safety community of practice in the United States was a complex journey [18]. While a complete treatment of this timeline is beyond the scope of this paper, notable milestones should be mentioned. First, a visionary look at risk related to dams was first introduced to the dam engineering community of practice in 1964 by Casagrande [19]. Following the failure of the Teton dam on June 5, 1976, the creation of federal dam safety guidelines was ordered by President Carter in 1977 [20]. In response to the Teton dam failure, Reclamation passed its own dam safety act in 1978 [21], and the Federal Emergency Management Agency (FEMA) was identified as the lead federal agency for oversight of dam safety in 1979 [22]. The combined 1978 Reclamation Act, along with the issue of the first federal guidelines for dam safety in 1979 [23], laid the groundwork for Reclamation’s pioneering use of risk for their dam safety program. The foundational tools for performing a risk analysis of dams were introduced in 1981 by Whitman based on research in the MIT Civil Engineering program [24]. Reclamation issued its first Public Protection Guidelines in 1997 [25]. Dam safety guidelines were subsequently issued by the U.S. Army Corps of Engineers (USACE) [26] and the Tennessee Valley Authority (TVA) [27] in 2011; a joint dam safety guideline for risk analysis by all federal agencies was issued by FEMA in 2015 [28], and most recently by the Federal Energy Regulatory Commission (FERC) in 2021 [29], promulgated regulations for dam safety risk analysis for all licensed hydropower projects with dams. Most state agencies in the United States are now considering the adoption of risk analysis guidelines for their dam safety programs.
A comprehensive review of the risk analysis of dams has been provided by Hariri-Ardebili [30] and Hariri Ardebili and Nuss [31]. Stedinger et al. [32] wrote a report explaining the concepts needed to perform a thorough probabilistic analysis of the dam safety issues. Bowles et al. [33] reviewed the relationship between the standard- and risk-based approaches for dam safety in the context of comprehensive risk management. Bowles [34] explains the step-by-step procedure for portfolio risk assessment of dams. Chauhan and Bowles [35] presented a framework for uncertainty analysis in dam safety risk assessment, including an approach to incorporating input uncertainties into the risk analysis model. Peyras et al. [36] proposed a method to support dam aging diagnosis and risk analysis that capitalizes on an expert’s knowledge and feedback. Smith [37] proposed a model for dam risk analysis based on Bayesian networks. Serrano-Lombillo et al. [38] proposed a technique to calculate incremental risks in the context of an event tree. Castillo-Rodrıguez et al. [39] proposed a variation of the combined risk analysis approach for complex dam-levee systems, which was based on the event tree analysis from multiple combinations of “load-system response-consequence” events. More recently, [40,41] combined the natural hazard-based assessment of dams with pandemic constraints and complex emergencies and presented the concept of a multi-risk-based framework for dam safety.
The use of risk analysis and assessment in dam safety, as summarized above, has been focused on the safety of existing dams and decisions to modify those dams to reduce risk to tolerable levels. USACE has recently issued some guidance related to risk-informed design [42]; however, this guidance is very high level, is focused on four high-level tolerable risk guidelines (TRGs), and is being mostly applied to existing dams and levees. Overall, USACE states that “the objective of risk-informed design is for risks to be tolerable for the final project, including the associated floodplain management practices”. To meet this objective, teams performing designs must demonstrate that the completed design configuration will meet USACE risk tolerance guidelines portrayed on f-N or F-N charts provided in ER 1110-2-1156 [43].
2.3. Objectives and Contributions
The objective of this paper is to present a framework for the risk-informed design of new RCC dams, particularly in high seismic hazard regions, that will provide adequate long-term safety when evaluated under Reclamation’s PPGs expressed on Reclamation’s f-N chart. Such a design would also meet the Federal risk tolerance guidelines [28] as well as the similar guidelines of the USACE, TVA, and FERC. In a high seismic region such as the northwestern United States, including the location of Scoggin’s dam, this was a very challenging task. Early structural modeling as part of an appraisal-level design provided an indication that the cross-section of the dam would need substantial adaptation from a traditional gravity section, and the configuration of the dam would need to be changed to a curved gravity dam to result in adequate structural response and overall level of dam safety. To meet Reclamation’s dam safety guidelines, a set of four design criteria were established against which the design configuration of the dam would be developed and subsequently evaluated. By meeting those criteria, the design team was confident that the design would have tolerable safety risks based on a full Quantitative Risk Analysis (QRA) performed by an experienced risk estimating cadre under the supervision of a well-qualified and experienced risk analysis facilitator at the completion of the feasibility design. Having tolerable risks would mean that a substantial redesign of the dam would not be needed and that the feasibility level design could be compared to a companion design of modifications to the existing embankment dam for the purpose of making a final decision on the preferred project configuration to move forward into the final design.
The contribution of this paper is that of a completed feasibility design of a new RCC dam in a high seismic hazard region for which a full QRA completed by an experienced risk estimating team showed the design would meet federal dam safety guidelines for tolerable risk. The four risk-informed design criteria established as the basis for the design are believed to have much broader applicability within the dam safety community of practice for other new RCC dams and/or major hydraulic structures in high seismic regions with high potential life loss consequences if failure were to occur.
3. The Proposed Concept of Risk-Informed Design for New RCC Dams
The adoption of risk analysis as the framework for dam safety in the United States is challenging engineers to understand how existing facilities will respond to a large range of static, hydrologic, and seismic loading conditions. Risk analysis must consider the response of the reservoir system (including the dam, spillway, outlet works, and foundation treatments) for a wide range of loadings up to and including the onset of damage states, progressive damage development, and ultimately failure of the structure while at the same time considering the consequences of dam failure as first suggested by Casagrande in 1965 [19].
As will be shown, the northwest United States is a region of very large potential earthquakes associated with the CSZ capable of generating M9 earthquakes with unprecedented ground motion intensity and duration. To meet the requirements of risk-informed dam safety and design, engineers must understand the potential consequences of dam failure (life loss and other economic and environmental impacts), develop models, perform analyses, and adopt designs for seismic loadings beyond the range of documented loadings that have occurred at existing dams around the world. Hence, significant judgment is required in interpreting the results of modeling for which there is limited to non-existent calibration of the models to the actual performance of existing dams under very high loading conditions.
The concept of risk-informed design, as presented in this paper, requires adopting design criteria for four distinct performance domains: (1) where the linear (undamaged) response is expected, (2) where the onset of non-linear behavior (initiation of damaged states) occurs, (3) where an acceptable and limited amount of damage and related performance of the damaged structure will occur at the extreme end of loadings that risk analysis requires to be considered, and (4) where a final damage state for which the post-earthquake performance of the dam and appurtenant structures would be acceptable and not result in catastrophic failure and loss of life consequences.
4. Regional Seismic Hazards
Seismic hazards at the Scoggins site have been developed by Reclamation through site-specific evaluations. The hazard is generated from three separate potential sources, including (1) local (crustal) faults such as the Gales Creek fault system, (2) intraplate, and (3) intraslab. The intraplate and intraslab hazards are associated with the CSZ off the Oregon coast.
4.1. Probabilistic Seismic Hazards
Example hazards from the probabilistic seismic hazard assessment (PSHA) at the Scoggins dam site are summarized in Table 1. The table includes the return period and corresponding estimated peak ground acceleration (PGA) associated with the CSZ events as well as the total hazard PGA at the site.
4.2. Representative Time Histories
Time histories for use in structural response analyses and evaluations were created for the Scoggins site by Reclamation in 2012 and published in a Technical Memorandum in 2013 [44]. Seed records were scaled to the conditional mean spectra (CMS) that matched the uniform hazard spectra from the PSHA at either a 0.2 s period (short period [SP]) or a 0.75 s period (long period [LP]). Both were performed expecting SP motions to be more detrimental on rigid structures (RCC dam, spillway, outlet works) and LP motions to have a more detrimental effect on the embankment alternative being evaluated for the project. For the RCC dam structural analyses, one-time history was developed to represent an event produced by a Gales Creek Fault system rupture (Record MYG008 from the M7.2 f2005 Miyagi-Oki earthquake) and scaled to the SP CMS with a duration of about 40 s. Other seed records were considered from either the 2011 M9.0 Tohoku interface earthquake or as synthetic records matching the SP or LP CMS. These records represented an M9.0 interface earthquake having a total duration of over 240 s (period of strong shaking from 100 to 120 s) and included x, y, and z ground motion components. Ultimately, a synthetic time history SRCH10-SP, along with the MYG008 motions, were used in the structural evaluation of the RCC dam. Example ground motion components and Husid plots for the SRCH10-SP 10 k-year event with a peak PGA of 1.36 g are shown in Figure A1 in Appendix A.
5. Risk-Informed Design Criteria
Ferguson et al. [45] introduced the risk-informed design approach adopted for the ongoing designs of three new RCC dams that will be located in Oregon and Washington, where seismic hazards from the CSZ are critical design criteria for the layout and cross-sections of the dams.
The risk-informed design approach as evolved over a series of planning level studies and has been substantially influenced by the author’s and HDR’s experience with Federal (including Reclamation’s) standards-based design guidance as well as Risk-Informed Decision-Making (RIDM) guidance that has evolved in the United States since the late 1990s. In addition, the approach has evolved based on an understanding of (1) potential failure modes (PFMs) and related system response event trees used for quantitative risk analysis of concrete gravity dams (Reclamation/USACE Best Practices, 2019, Chapter E-3) on several large concrete dams, (2) understanding of uncertainties associated with the estimation of loading frequencies, (3) estimation of the range and corresponding uncertainty associated with material properties for the dams and foundation materials at each site, and (4) the potential for strength degradation and changes to water pressures on critical potential failure surfaces.
The general risk-informed design approach for the Scoggins RCC replacement dam (sometimes referred to as Option 3 in the project alternatives evaluation) included separate but related seismic performance criteria. RIDM takes the important step of considering consequences of dam failure that are not typically considered as part of standards-based design, except the dam’s general hazard classification. Under RIDM, a high-hazard dam that could result in higher levels of life loss upon failure requires consideration of higher seismic loading. For example, a high-hazard dam that could result in the loss of 1 to 10 lives would consider seismic loading of up to 1 in the 10,000-year event. For higher life loss potential, the structure response must be evaluated for earthquakes with higher estimated recurrence intervals to assess risks fully. Based on experience performing full QRA, with either earthquake or hydrologic loading partitions that help identify that the maximum risk partition has been evaluated, it has become common to evaluate earthquakes with estimated recurrence intervals of 20,000 to 50,000 years. The maximum risk partition is typically associated with loading partitions that are less than these recurrence intervals, confirming that the design achieves an adequate level of risk against failure. For the Scoggins dam, the risk evaluation was complicated by the fact that estimated life loss consequences for the existing dam were much higher (over 100) than for the new downstream RCC dam. The new downstream dam would require the acquisition of a sawmill facility and a few residences. Once completed, the downstream dam would have estimated life loss consequences of about 10 or an order of magnitude lower. In order to compare the options, the same design criteria used for the evaluation of the option to modify the existing dam was used for the RCC dam and included the earthquakes with up to a 50,000-year return period.
Based on experience with the earlier appraisal-level structural analyses and design development, a set of risk-informed design criteria was adopted for the Scoggins RCC dam feasibility design. Results of the appraisal level design full quantitative risk analysis suggested that such criteria would result in risk estimates that would be acceptable under Reclamation’s PPGs (2011). The design criteria were as follows:
5.1. #1 Elastic Response for 500- to 1000-Year Seismic Events
- No cracking of the concrete;
- No sliding of the RCC dam.
5.2. #2 Linear-Elastic Transitioning to Possible Localized Non-Linear Response with Limited Damage Beginning to Occur between the 1000- and 5000-Year Seismic Events
- Limited cracking of the concrete permitted, but not permitted to crack through the section for the 1000-year event;
- No sliding of the RCC dam for the 1000-year event.
5.3. #3 Non-Linear Response, Moderate Damage, and Post-Earthquake Stability for Events Larger Than 5000-Year Return Periods—Earthquake Events with Estimated Recurrence Intervals of up to 1 in 50,000 Years Were Evaluated
- Cracking through the section allowed with the estimated extent and location of damage within the dam being judged acceptable;
- Sliding of any section of the dam limited to less than about 2 to 4 feet of estimated displacement;
- Sensitivity analysis for higher and lower friction angles on any identified planes of sliding to inform risk analysis.
5.4. #4 Post-Seismic Stability Factor of Safety (FOS) > 1.0
- Predicted for all loading conditions, including the damage from the 10,000- and 50,000-year events when a reasonable lower bound residual friction angle of 35 degrees is assumed for the planes of sliding, and full uplift (drains assumed inoperable) is applied linearly along the sliding plane as a full normal operating reservoir at the upstream heel of the dam and tailwater at the toe of the dam.
6. Structural Model and Modeling Approach
Structural analyses supporting the feasibility design included the development of both 2D and 3D structure finite element models. A curved gravity configuration was adopted for the feasibility design based in part on the results of appraisal design structural modeling and QRA evaluations previously described. A plan and profile view of the dam and a typical non-spillway-overflow cross-section through the dam at the maximum structural height section is shown in Figure A2 in Appendix B. A cross-section through the dam that was developed to meet the risk-informed design criteria described in Section 5 is shown on Figure A3 in Appendix B.
The 3D structural analysis model included 28 monoliths. All monoliths are 50 feet (15.24 m) wide except the monolith containing the low-level outlet facility in the lower left abutment area that has a width of 100 feet (30.48 m). Dam monoliths would be formed by transverse contraction joints (TCJs) expected to control the behavior of the dam, including the potential for cracking and movement of monoliths during an earthquake event. The 2D models of the dam were developed late in the structural analysis process to further evaluate the potential for cracking in the upper portion of the dam that were indicated by the 3D analyses results of the 50,000-year, long-duration earthquake time histories.
The 3D and later 2D analysis models were developed in LS-DYNA (version 11.0). These models can consider both linear-elastic and non-linear structural behavior (both material models and contact surfaces) and the loading conditions during which a change from linear-elastic to non-linear behavior is likely to occur. The initial 3D model included provisions for non-linear behavior using specific contact surfaces where cracking and/or sliding was expected to occur, including the dam–foundation contact and along TCJs between the dam monoliths. The type of LS-DYNA contact used included “Tiebreak with Friction” for the dam/foundation contact and “Sliding with Friction” for the TCJs. Study cases were included as part of the 3D seismic response analyses where the non-linear behavior along the dam foundation contact was prohibited so that locations within the dam could be identified where overstressing, potential cracking, and damage would begin to occur. As the analysis work continued, additional contact surfaces were added to the 2D model of a central monolith exhibiting maximum seismic response (overstressing) so that the potential for cracking in the upper portion of the dam could be evaluated.
6.1. Model Descriptions including Provisions for Non-Linear Response
The 3D structural analyses included three major components: the foundation, the reservoir, and the dam, which includes voids for the outlet works, sluiceways, and drainage gallery in the dam. The model was built in accordance with Reclamation’s state-of-practice for non-linear analysis for concrete dams [46] and is shown in Figure 2. The model extends 7400 feet (2255.5 m) in the north–south (cross-canyon) direction, 6500 feet (1981.2 m) in the east–west direction (upstream-downstream), and is roughly 1000 feet (304.8 m) deep.
A plan and exploded isometric view looking at the downstream face of the dam in the model is shown in Figure 3.
A cross-section of the 2D model established through monolith 15 is shown in Figure 4. The upper portion of Figure 4a shows a general view, including the maximum non-overflow section, foundation, and reservoir, and Figure 4b shows a close-up view of the cross-section showing locations where contact elements were included in the 2D model at the dam-foundation contact and in the upper portion of the dam at the base of the chimney section.
The foundation in the 3D model was represented by a combination of 200-foot by 200-foot by 40-foot-deep (61 m by 61 m by 12.2 m) coarser mesh blocks except in the immediate vicinity of the dam where 200-foot (cross-canyon) by 50-foot (upstream-downstream) by 40-foot-deep (61 m by 15.24 m by 12.2 m) blocks were used to facilitation establishment of the dam-foundation contact.
The reservoir was simulated at the normal maximum operating level of elevation, 303.5 feet (92.5 m). The reservoir geometry was dictated by the planned maximum reservoir level, dam limits, and foundation geometry. For short-duration earthquakes, the reservoir was modeled using the LS-DYNA elastic fluid material model and reduced integrated brick elements with an hourglass Type 2 that yielded the lowest undesirable hourglass energy and allowed the water to flow with sliding of the dam and without loss of the reservoir force at the end of the earthquake. Significant problems with the elastic fluid model elements were experienced for long-duration earthquakes. Attempts were made to resolve the issue with the longer-duration earthquakes related to element distortion, including remeshing and increasing the stiffness of reservoir elements near the bank of the reservoir. Subsequently, in consultation with Reclamation modeling experts, it was agreed that the reservoir portion of the model would be changed to a linear elastic material with a Poisson’s ratio of 0.4999 and a modulus of elasticity of 189.7 psi (pound-force per square inch) (1.31 MPa) consistent with Reclamation guidance [46]. With changes, the model for all long-duration earthquake loadings was run until a time of about 142 s when runs stopped due to insufficient memory. A restart run for a selected case was completed and verified that simulations up to 142 s were capturing the maximum displacement response of the dam consistent with the Arias intensity variation with time.
Contact surfaces in the 3D model were used to evaluate the interaction between the dam monoliths, the dam monoliths and foundation, the dam and the reservoir, and the reservoir and foundation. All contacts were defined per the Reclamation’s State-of-Practice guidelines [46].
A global damping value (or Rayleigh) damping equal to 1.8 was used in the analysis during the application of static loads, including the maximum reservoir loading. Once the initial static loading condition was completed, the static loading prescribed foundation boundary conditions were replaced with a non-reflecting boundary and static reaction forces. The three-component earthquake traction loadings were applied at the base of the model, and the mass damping was reduced to near zero (0.001) and remained at this level during the application of seismic loads. Energy dissipation was limited to that which would occur at the non-linear contact surfaces and foundation and reservoir radiation damping. The sufficiency of this approach was evaluated and verified in a test model that applied an impulse load during an intermediate stage of loading. The natural period and damping of the dam were estimated at 0.33 s and 6.6%, respectively. Further, the application of increasing load in the last stage of the test model verified that both overturning and sliding failure at the base of the dam could be captured by the model.
6.2. Material Properties
The foundation properties used in the 3D and 2D models were estimated characteristics values based on the evaluation of the results of three phases of site characterization and expert judgment. A summary of the characteristic properties developed from the results of lab testing, downhole and surface geophysical testing, and rock mass classification of rock core samples is provided in Table 2.
The target unconfined compressive strength selected for the feasibility-level structural analyses of the dam cross-section was based on results of appraisal-level structural analysis results as well as feasibility-level RCC mix design studies of both an on-site sandstone aggregate source and an off-site quarry source. Both the on-site and off-site sources were found to provide both coarse and fine aggregate materials that would meet acceptable quality requirements for the RCC. Because of the uncharacteristic cross-section properties, including the sloping upstream face and relatively flat downstream slope of the dam, and considering the suitability of the on-site sandstones for use in the construction of the dam, a zoned cross-section was selected, allowing for materials having different specified strengths and an expected overall construction cost reduction. The inside of the dam would be constructed of material with lower specified strength than the outer surfaces of the dam.
To inform the risk analysis of the dam, analyses were performed using the target strengths of the RCC at one year of age as well as the anticipated long-term strength of these materials (greater than 10 years of age). The following 1-year design strengths were considered in the development of engineering properties used in the structural analyses:
- Outer Zone: 2400 psi (16.55 MPa)
- Inner Zone: 1800 psi (12.41 MPa)
The average concrete density from the test mixes for the inner and outer zones along with structural concrete for the outlet works, are summarized in Table 3. The modulus of elasticity of concrete material is dependent on age, strength, and aggregate types. The modulus values selected for the structural analyses based on the target one-year unconfined compressive strength targets are summarized in Table 4. Estimated Tensile strengths along with the estimated shear strength of the target RCC materials, are summarized in Table 5 and Table 6.
RCC materials continue to gain strength over time resulting in higher compressive and tensile strength capacity. To inform the risk analyses for the feasibility design configuration, several study cases were evaluated with what were judged to be reasonable “long-term” strength properties (properties after about 10 years of age), including:
- Dam/foundation contact tensile strength: 150 psi;
- Basal joint shear strength (prior to cracking): ϕ (friction angle) = 55 deg., c (cohesion) = 150 psi [1.03 MPa].
The material properties of the RCC materials were developed not only from the mix design studies but from published sources. Splitting and direct tensile, as well as shear strength testing, was not performed as part of the mix design studies; rather, the assignment of those strengths from published sources was judged to be sufficient for the feasibility design. Such testing will be considered during the subsequent final design work if structural analyses indicate that it is warranted.
A summary of the contact surface properties used for each contact surface in the 3D model is summarized in Table 7.
6.3. Cracking Potential in the Upper Portion of the Dam
The seismic loading potential at the Scoggins site is extraordinary. The seismic loading being considered for the feasibility design is unprecedented for any concrete dam in the world (Weiland, 2021, personal communication [47]). Consequently, it was important to consider the potential for cracking and adverse response at other locations within the dam as part of the quantitative risk analysis of the feasibility design. For purposes of feasibility design, this hazard was judged to be in the upper portion of the dam (base of the chimney section), consistent with noted cracking case histories such as Hsingfengkiang Dam, China (1962); Koyna dam, India (1967); and Sefed-Rud Dam, Iran (1990). The use of non-linear material models to inform potential cracking locations in the dam was considered, but it was decided to defer those analyses to a later stage of project development.
The two additional contact surfaces were added to the upper portion of the 2D model of monolith 15 to evaluate the potential preference for cracking to develop. In general, except as noted below, the contact surfaces were oriented to be consistent with crack formation at Koyna dam but adapted for RCC construction methods. The horizontal surface labeled as 3 in Figure 4 corresponds to the typical orientation of one-foot-thick horizontal lift surfaces and generally aligns with the maximum principal stresses (Z-stresses) observed near the upstream face and into the central portion of the dam cross-section. The inclined contact shown as contact surface 2 in Figure 4 was intended to represent cracking that could initiate from the downstream face of the dam. While this surface was extended through the entire section of the dam, the likelihood of such a crack forming through the entire section was judged to be extremely low (see discussion below). It was included to fully understand and describe the potential behavior of the upper portion of the dam, particularly the potential for upstream movement of the curved gravity section.
Cracking initiates and develops in response to the orientation of the major principal stresses. Results of both the 3D and 2D structural analysis models show that the major principal stresses orient parallel to the upstream and downstream faces of the dam. For larger earthquakes, the major stresses begin to cycle between tension and compression. It is tensile stresses resulting from the movement of the dam crest in either the upstream or downstream directions that cause the initiation and progression of cracking.
While there is a potential for both horizontal and inclined crack surfaces to develop in the upper portions of conventional concrete dams, the method of RCC dam construction suggests a predominant likelihood for horizontal cracking along lift surfaces verses the development of inclined cracks across the RCC layers through intact materials. If a crack initiates through intact concrete materials in various lifts due to principal stress orientations (e.g., cracks initiating from the downstream face of the dam), it is likely that the crack formation would be influenced by lift surface properties as the crack propagates, and the crack would likely take on a stair-stepped and eventually a bi-linear configuration toward the center of the section where principal stress orientation begins to provide a preference for the development of tension perpendicular to the lift surfaces. In fact, cracking from the upstream face of the dam would likely initiate at a lifting surface and follow that surface until the crack intersects any cracks developing from the downstream face. With strong enough and long enough shaking, a continuous crack with an approximate bi-linear configuration could develop through the cross-section. Such a bi-linear configuration is shown at the bottom of Figure 4. The possible bi-linear crack forms the bottom of the block labeled as Part 4, shown in the light tan color.
Both Chopra and Chakrabarti (1973) [48] and Nuss et al. (2012) [49] note that the cracking at the Koyna dam that occurred at the base of the dam’s chimney section was horizontal from both the upstream and downstream faces. Physical (Mridha and Maity, 2014 [50]) and numerical models of crack propagation with SFEM methods (Wang et al., 2015) [51] indicate a preference for bi-linear crack configuration.
An additional consideration in the evaluation of potential cracking-related failure modes in the upper portion of the dam cross-section would be the contribution of side forces on moveable blocks. The TCJs are very rough, and any movement upstream or downstream would have to overcome some element of roughness along the TCJs. Movement in the downstream direction would likely encounter increasing resistance to deformation as the radial monolith joints engage and arch action is mobilized. For blocks moving in the upstream direction of the curved gravity configuration of the dam, the TCJs would likely offer an initial significant amount of side resistance. However, if enough movement occurs, the TCJs could begin to open with a reduction and possible full elimination of side resistance unless enhanced roughness was introduced in the TCJ construction.
6.4. Model Setup and Calibration
Static and dynamic loads were applied in LS-DYNA using multiple load curves. Gravity and uplift loads were applied on the same load curve, ramped up from zero to full force at 2 s, given 1 s of quiet time before earthquake loads began at 3 s into the model runs. Full gravity and uplift loads were held constant until the end of the runs.
Gravity was applied to all the dam and reservoir elements to achieve a steady static stress state before seismic loads were applied. This avoided any unfavorable behavior in the foundation and unrealistic foundation settlement. Hydrostatic loads were generated against the upstream face of the dam as the gravity load of the reservoir was applied. Uplift pressures were applied along opposite faces of the foundation contact surface using element face pressures and a load curve. Water pressures along the contact could not be implemented from the reservoir block in the model. Silt loads were not considered in the analysis.
For the feasibility analyses, construction sequencing and thermal analyses were not performed as it was anticipated that initial stresses within the dam would not control the dam’s behavior during seismic loading. To confirm that rigorous modeling of initial stress conditions was not required, an evaluation of three alternative normal loading models (application of self-weight and normal reservoir hydrostatic pressures relative to the activation of vertical contact elements between the monoliths) was completed. These analyses confirmed that the time when activation of vertical contact between the dam monoliths occurred did not significantly influence initial stresses and the estimated seismic response along the contact at the base of the dam or the vertical monolith joints.
Full hydrostatic pressure was assumed at the upstream heel of the dam, and tailwater pressure was assumed at the downstream toe for all structural analyses. The uplift pressure varied linearly from full head to tailwater head when a gallery was not present in the monolith (upper abutment locations). At locations where a gallery was present, a drain efficiency of 65% was used for normal and earthquake loading conditions. Uplift pressure values at nodal contact points were calculated using an excel spreadsheet, and these pressures were applied as non-uniform pressure on the slave and master surfaces. For the flood loading (reservoir elevation 312 feet) and post-earthquake loading conditions, a 0% drain efficiency was assumed.
The LS-DYNA dynamic analysis of the foundation-dam-reservoir system used the traction time history at the base of the model as input. In accordance with Reclamation guidelines for non-linear analysis of concrete dams [46], a non-reflecting foundation boundary at the sides and base of the foundation materials with a shear velocity of 1000 m per second was applied. Through an iterative deconvolution process, an estimated factor of 0.55 was applied to the input ground motions provided by Reclamation based on estimated foundation stiffness properties to reproduce the target input motions and site response spectrum at the foundation surface (base of the dam) beneath the maximum section location. Deconvolution was verified through analyses with two additional foundation models.
All production models for the structural analyses were mainly different in material parameters and earthquake input motions. For all production models, the static loading, including the weight of the dam and reservoir water (but not the foundation weight) as well as uplift pressures, were applied during the initial time step of zero to 2 s. This was followed by a silent time of one second after the earthquake traction load was then applied at the base of the model. The earthquake load was continued until a time sufficient to capture the maximum responses of the dam. For the long-duration earthquakes, it was found that the maximum permanent displacements and stresses were captured within the first 142 s of the time history. For the short-duration earthquakes, maximum permanent displacements were captured within the first 20 to 25 s.
6.5. Model Study Cases
A total of 20 study cases were outlined for seismic response analysis with the 3D model. The study cases are listed in Table A1 in Appendix C. Eighteen of these study cases were completed. The first three study cases represented a range of planned static analyses that were subsequently combined into a single analysis. Because the 3D model did not provide a direct indication of the stability FOS, supplemental 2D analyses (excluding consideration of arch stresses that may have developed) of the full range of monolith heights were completed.
As can be seen in Table A1, the study cases evaluated static loading conditions of the maximum reservoir level and ground motions from three earthquake recurrence intervals, including 5000-, 10,000-, and 50,000-year events. Short-duration and long-duration events were completed for each of the recurrence intervals, and base case RCC strength (one-year target strengths), as well as long-term RCC strengths, were also considered. Post-earthquake analyses were completed assuming degraded strengths of ϕ = 35° and c = 100 psi [0.69 MPa] before full crack development and ϕ = 35° and c = 0 after crack development was completed to bound the estimates of monolith deformations (maximum possible under worst-case assumptions) and to verify that movement of the monoliths stopped at the end of the earthquake loading. Finally, uplift loads on the dam/foundation contact were considered, including full functionality (65% reduction) during the earthquake, as well as ranging from fully functional to non-functional following the earthquake (post-earthquake study cases).
Additional 2D study cases were added during a later stage of the structural modeling work. This 2D model and related study cases were designed to inform the potential for cracking and displacements in the upper portions of the dam during large and long-duration earthquake events. A total of 10 study cases with various combinations of contact restraint, material strengths along the contact surfaces, and earthquake loads were completed. The study cases are summarized in Table A2 in Appendix C. The 2D modeling was used in lieu of using the large 3D model in the interest of time. Similar to using non-linear material models, the use of the large 3D model for evaluation of cracking potential in the upper portion of the dam was deferred to a later stage in the design process when additional time and resources would be available, and the results of the initial discrete crack and 2D results (including applied radial shear resistance as described below) could be used to inform the requirements for more rigorous computational approaches.
As was expected, deformations predicted with the initial 2D modeling approach were substantially higher than predicted by the 3D model for similar strength assumptions and earthquake loads. This difference was attributed primarily to the inability of the 2D model to incorporate shear strength along the TCJs, and the development of arch stresses and transfer of arch loads that will substantially influence the performance of the dam, particularly downstream displacements that engage the vertical monoliths joints and initiate arch load transfer. Subsequently, the 2D model was modified to include components of radial shear resistance on the TCJs based on the 3D modeling analysis results. The components of radial shear resistance were conservatively estimated and then incorporated into the 2D model (lower than the actual 3D model indicates will occur with downstream movements). With this change, the total deformations estimated by the 2D model were similar to the 3D model estimates.
The 2D study cases ranged from full linear elastic with all contact surfaces tied (Case 1 with bond strength assumed as 1 × 10²⁰ psi [6.9 × 10¹⁷ MPa]) to various combinations of tied base, lift surface, and inclined contact surfaces and combinations of untied contact tensile and shear strength assumptions. Study cases 3, 4, and 5 considered all contact surfaces untied with both best estimate and long-term tensile and shear strength assumptions along the lift surfaces or, in the case of the inclined contact, intact tensile and shear strength. Case 10 allowed only the inclined contact surface to crack. As previously noted, this case was judged to be extremely unlikely to occur but run to inform the risk estimators.
7. Model Results
7.1. Static Analyses
Overall, the evaluation of model contact forces and gravity analyses indicated that no nonlinearity (sliding) would occur at the dam-to-foundation interface. All monoliths would have a sufficient sliding FOS (>1.5), assuming a sliding friction angel of 45 degrees, zero cohesion, and 65% foundation drain efficiency. The minimum FOS values occur under the maximum sections of the dam with a base elevation of 130 feet (39.6 m) or less. Further, all monoliths would have a FOS greater than 1.2 for post-earthquake conditions assuming that the sliding friction angle degraded to 35 degrees, foundation drains were not functional under the dam, and full reservoir uplift pressure was applied under the entire base of the monolith.
Static analyses were also evaluated for normal reservoir operations and a reservoir elevation of 310.5 feet (94.9 m; PMF loading), assuming that a large enough earthquake had occurred at the site to cause cracking through the entire base of the dam and enough sliding to result in some strength degradation and loss of foundation drain function. The results of these analyses are summarized in Table 8. Sliding FOS for friction angles of 45 and 35 degrees in combination with a range of selected cohesion values are also shown in this table. These strength combinations indicated sliding stability FOS values equal to 3.0 and 4.0, while for the PMF loading, the FOS values are equal to 2.0 and 2.7.
Figure 5 shows a summary of the 2D gravity analysis results for sliding FOS for a normal maximum reservoir elevation (303.5 feet [92.5 m]) and a very large flood (pool elevation to 312 feet [95.1 m]), a base friction angle of 45 degrees and the full range of monolith heights along the axis of the dam. The sliding FOS values increase at higher elevations supporting the previous assertion that the minimum FOS values are beneath the maximum sections of the dam. Subjected to static loading, the proposed dam has tremendous reserve strength if arch action is ever mobilized, demonstrating the benefit of curing the dam.
The LS-DYNA dynamic analyses indicate that once sliding initiates, the net resultant of forces along the vertical contacts of the maximum height monoliths near the center of the dam mobilizes a resultant upstream–downstream horizontal force. For a one-foot-thick section of a dam, the average equivalent shear stress of 0.15 psi (0.001 MPa) acts on the vertical sides. A post-earthquake gravity analysis considering half of this estimated side shear stress, a residual friction angle of 35 degrees with no cohesion, and a uniform reservoir pressure along the entire length of the cracked base indicates that maximum height monoliths of the dam have a minimum FOS of 1.2.
7.2. 3D Seismic Response Analyses
Based on work completed during the appraisal design phase, it was clearly demonstrated that the plan and cross-section requirements for the dam were going to be controlled by seismic loading response. The study cases were run and evaluated to verify that the proposed cross-section would meet the risk-informed design criteria and have failure risks that would meet Reclamation’s Public Protection Guidelines (2011) [52]. The following critical PFMs for the dam were identified as driving the design and risk estimates:
- Sliding of the dam at the dam to foundation interface or along a lower lift (just above the foundation contact) that yields to a large displacement between adjacent monoliths or instability of one or more monoliths;
- Overstressing during the earthquake leading to cracking and sliding in the upper part of the dam with significant degradation (rubbilizing) of the concrete along vertical monolith joints.
The study case analyses summarized in Table A1 and Table A2 (Appendix C) formed the basis for assessing these PFMs and completing a full QRA of the proposed dam. Modeling results for different combinations of earthquake loadings and dam-to-foundation interface strength were carefully reviewed to evaluate stress time histories and estimated monolith displacements, identifying critical time steps and locations with the model corresponding to the maximum response of the dam. The analyses were further reviewed at those specific time snapshots and locations when the structure displacement and stress responses were the highest values.
A set of common points along the crest of the dam were used to plot and then select the range of estimated displacements. An example of a deformed shape of the dam following a 5000-year, short-duration (MYG008) earthquake event and assumed 1-year material properties for the RCC is shown in Figure 6. The representative crest nodal points (A through H) established for the comparative evaluation of crest displacement are also shown in this figure. The black dots represent the original location of the nodal points relative to the deformed shape of the dam. Nodes A–C, D–F, and G–I are left abutment, central valley, and right abutment response locations, respectively.
An example of a plot of the estimated displacement for each of the A through I nodal points is shown in Figure 7. The displacements are total absolute displacements of the monoliths above the foundation contact. Relative displacements of the monoliths are estimated by comparing the total displacements of adjacent monoliths. The accumulated nodal point displacements are an indication of the monoliths that cracked through the base (A through G) verses those that did not crack (H and I) for the assumed material properties. For example, Nodes A through G show some accumulated displacements at the end of the earthquake ranging from a little to less than 1 inch (<2.54 cm) for Node G to as much as 4 inches (10.16 cm) for Node B. Cracking through the base of the dam would have occurred in all monoliths represented by these nodes for displacements to have developed. However, the accumulated displacement of nodes H and I in the upper right abutment was zero inches indicating that cracking through the base of the monolith at those locations likely did not occur.
Table A3 and Table A4 in Appendix C contain summaries of the estimated displacements for the base case and long-term strength assumptions for the MYG008 Short Duration, and SRCH10 Long Duration (CSZ) ground motions, respectively. Displacement estimates are also shown for both the post-earthquake 10,000-year and 50,000-year events when the dam to foundation joint shear strength of only ϕ = 35° and c = 100 psi (0.69 MPa) uncracked) and ϕ = 35° and c = 0 (cracked base) were used in the model. As previously noted, these values were provided to the risk estimating team to help bind the estimated displacement relative to the shear strength assumptions. As can be seen, cracking and sliding of some monoliths occurs for the 5000-year earthquake events assuming the 1-year tensile and shear strength properties for the RCC. However, no cracking and sliding of any monoliths occurred for the 5000-year and 10,000-year earthquakes and only occurred for the 50,000-year earthquakes when the long-term strengths were used. Hence, the feasibility design plan and cross-section of the dam are robust and linear-elastic performance would be expected for events equal to or greater than the 10,000-year earthquakes as the materials in the dam strengthen over time.
LS-DYNA has an important shear strength limitation that makes the estimated displacement results conservative. Specifically, once the dam cracks through the contact surface, the strength can only be simulated with a friction angle and zero cohesion. The estimated shear strength of the contact should consider some component of cohesion or increased friction upon cracking but prior to any significant sliding when roughness or asperities along the cracked surface make and important contribution to the shear strength. Degradation of the shear strength down to a value of 35 degrees occurs as deformations along the crack surface take place. Accounting for the process of strength degradation from an initial value of 55 degrees down to 35 degrees would more realistically represent actual displacements that would be smaller than those provided in Table A3 and Table A4 when strength degradation is not accounted for and once the section cracks, the shear strength is immediately reduced to 35 degrees.
A comprehensive summary of the estimated base cracking, representative maximum tensile stress conditions in the monoliths, estimated maximum tensile stresses that occurred in the RCC adjacent to the monolith TCJs (vertical joints), and the maximum estimated differential movement between two monoliths is presented in Table A5 and Table A6 in Appendix C for the base case and long-term strength assumptions and for the MYG008 Short Duration, and SRCH10 Long Duration (CSZ) ground motions, respectively. These tables include a set of columns in the center that indicate the monolith numbers where the maximum estimated tensile stress excursions occurred, the tensile stress excursion range, the number of excursions indicated by the model results, and the estimated damage conditions that would develop. The estimated damage condition is a qualitative description assigned to guide the risk assessment on the type (if any) of seepage or discharge response that might occur. Figure 8 generally illustrates how the values in these tables were developed for each of the study cases for the same short-duration 5000-year earthquake (MYG008). The location of the various nodes plotted in Figure 8 is along the upstream face of Monolith 15, as shown in Figure 9. The figure shows the maximum stress response (tensile stress of about 250 psi) occurs at about 12 s for this combination of earthquake and material properties that occurred at node J along the upstream face of monolith 15 just below the chimney section.
The maximum responses (tensile stresses) included in Table A5 (Appendix C) occurred in Monoliths 24 and 25 and between Monoliths 22 and 23 (near crest node A) in the left abutment area, as illustrated in Figure 10. The insert in the lower right of Figure 10 shows a typical plot of principal stresses along the downstream face of the dam in the left abutment of the dam at a monment in time of the earthquake time history when the maximum stress response occurred.
The estimated limits of tensile strength of the RCC parent materials, as well as bonded lift surfaces at one year, are shown in Figure 10. The estimates of the one-year and long-term RCC tensile strengths were similarly added to all stress plots at nodes selected for evaluation where maximum stress response occurred. This allowed for the identification of the number of tensile stress excursions exceeding the estimated tensile strength of the RCC that occurred. These number of excursions were then used to assess cracking and concrete damage that would likely occur qualitatively.
In addition to the issues of monolith cracking, displacement, and tensile stresses that could result in cracking and damage within the dam, an overall evaluation of the structural modeling results focused on the following considerations relative to the risk-informed design criteria:
- Up to what level of earthquake will the structure behavior be linear, and when/where will the onset of cracking/damage and non-linear behavior begin with no large overstressing or significant damage to the dam?
- What and where are the maximum stresses and the potential for damage within the structure for larger earthquakes? The evaluation results lead to the decision to develop a simple 2D model for capturing the cracking/displacement failure mode within the RCC dam structure.
- What are the maximum estimated non-linear displacement and expected relative monolith displacements at the end of larger earthquakes?
- Post-earthquake performance and stability of the dam.
7.3. Cracking in the Upper Portion of the Dam
Stresses indicated by the 2D model results suggest that cracking will develop, and sliding will first occur at the base of the dam near the foundation contact. For the best case estimated 1-year strength of the RCC, cracking and sliding along the base of the dam for some monoliths begins to occur for the 500-year return period earthquakes. However, assuming the long-term strength properties of the RCC, only the 50,000-year event for both the short and long-duration earthquakes causes cracking and sliding to occur along the base of the dam. For the longer-duration earthquakes, the model results also indicated a potential for cracking and some sliding on a continuous crack through the dam near the base of the chimney section for earthquakes greater than the 10,000-year event when base cracking and sliding did not occur in the model. For the 10,000-year earthquake and restraint at the base of the dam (no cracking and sliding), a limited number of stress excursions occurred in the maximum height monoliths that exceeded the estimated one-year tensile strength of the RCC. Based on the number of these excursions, as well as consideration of the long-term strength of the RCC, the excursions were judged not to be significant enough to cause cracking initiation.
Crest cracking and sliding near the chimney section of the dam were indicated for earthquake events with a 50,000-year return period with or without base sliding and regardless of the RCC material properties. This became the driving failure mode of concern for the risk analysis. The models simulating the potential for cracking and sliding at both the crest and base of the dam did not show meaningful overstressing at other zones within the cross-section. Stresses within the dam are significantly reduced when a basal crack develops at or near the dam and foundation contacts.
Based on an evaluation of the principal tensile stress orientations and magnitude from the 3D model results, as previously discussed, two possible crack surfaces were selected for simulation in the 2D model, as shown in Figure 4. Because of the slopes of both the upstream and downstream faces of the dam, the most likely orientation of the cracks at initiation would be perpendicular to the faces of the dam. Each initiating crack would slope in opposite directions toward the center of the dam. For the downstream face, the crack inclination was estimated to be dipping between 30 and 42 degrees from horizontal toward the reservoir. For the upstream face, the crack inclination was estimated to be dipping about 15 to 22 degrees from the horizontal toward the downstream toe of the dam.
The two contact surfaces were evaluated in different ways to confirm the potential for cracking and potential deformations along a continuous crack. Two of three combinations were judged as likely based on the RCC lift surface construction method, the orientation of principal stresses, and information on cracking from the Koyna dam case history and both physical and FEM model studies of the Koyna dam cracking incident:
- Cracking along a continuous horizontal lift surface (Contact 3 on Figure 4);
- Cracking along a bi-modal surface, including a lifting surface from the upstream face to the center of the dam and an inclined crack from the downstream face to the center of the dam (a combination of cracking on the upstream half of Contact 3 and the downstream half of Contact 2 forming the tan colored block shown on Figure 4).
As previously noted, one study case was completed of a crack along the continuous inclined Contact 2 surface to inform the risk analysis. The likelihood of this continuous cracked surface developing was judged to be very remote but presented to the risk team to provide a severe upper bound of potential crest block deformations. It was judged to be very remote by the structural analysis team because principal tensile stress orientations rotate through the structure to an orientation that parallels the upstream face of the dam, and there is just not enough stress of the needed orientations that would cause such a crack to develop through the entire cross-section of the dam.
Initially, the analyses with the 2D model showed significantly higher deformations than the 3D model due to the lack of monolith side forces in the 2D model. To increase confidence in the 2D model results, as previously noted, radial stresses consistent with vertical monolith joint stresses mobilized in the 3D model were added to the 2D model. Once these stresses were considered, the deformations estimated by the 2D model became similar to those estimated by the 3D model. This is illustrated by the results presented in Table 9 for the 2D Study Case 3 analyses. The first row shows the estimated base and crest displacements when no radial (TCJ) side stress was used. To obtain the relative crest displacement, the base displacement is subtracted from the crest displacement, as shown in the fourth column of the table.
The second row in the table showed the estimated displacements when a conservative amount of side shear stress was added to the 2D model. The third row summarizes the estimated displacements of the entire monoliths in the left abutment, center valley section, and right abutment areas of the 3D model. The 2D model of Monolith 15 represents a monolith in the center valley area of the 3D model. When the side shear was added, the estimated base displacement of 12 inches (30.48 cm) from the 2D model compares with an estimated displacement of 6 inches (15.24 cm) in the center monolith from the 3D model. Further adjustment of the side shear stresses was not performed, believing that the 2D model estimates with a limited amount of side shear stress (less than actually predicted by the 3D model) were reasonable and slightly conservative when evaluating the issue of cracking and displacements that may occur in the upper portion of the dam for this loading condition.
For comparison purposes, the results of Study Case 5 with the MYG008-50k earthquake and long-term strengths are shown in Table 10. As can be seen by comparing the results in this table with Table 9, increases in shear strength with time do not impact the potential for the structure to crack through the dam section at either the base or crest but significantly reduces the displacements that would occur.
The results of analyses of the 2D model for the long-duration SRCH10-50k earthquake with long-term strengths are summarized in Table 11. These results showed that the base sliding of the adjusted 2D model with side shear stress produced displacements that were close to the calculated sliding from the 3D model. Similar to the comparison of the long-term strength, short-duration earthquake results above, cracking through the crest and crest sliding of about half of the estimated base sliding is possible. The importance of including side friction in the 2D model to account for arch action once cracking develops is clearly indicated by the results in Table 11.
Overall, the 2D model results for simulations with side shear stress generally confirmed the potential for cracking in the upper portion of the dam for the 50,000-year earthquake events. Cracking through the upper portion of the dam may also occur for the 10,000-year earthquake events but only when the base case (1-year) strengths were used. Generally, crest displacements were predicted to be about one-half of base sliding displacements when the crest section cracks through the entire section. These estimates of behavior were believed to be conservative. The 3D model results indicated that the radial shear stresses along the TCJ surfaces near the dam crest are larger than the average TCJ radial shear stress used in the 2D analyses.
The 2D modeling also confirmed that the primary direction of sliding of the dam crest is downstream when cracking through the section is either along a lifting surface, or the bi-linear surface described above occurs, and the reservoir is full. For the base case (1-year) strengths crest and the long-duration earthquake (SRCH10-50k), deformations ranged from less than a foot for the bi-linear crack configuration to about 3.5 feet (1.07 m) for a continuous crack along a horizontal lift surface. Estimated crest deformations ranged from a few inches for the bi-linear crack configuration to just over 1 foot for a continuous crack along a lifting surface when long-term strengths and the long-duration (SRCH10-50k) earthquake were evaluated.
When the model was allowed to crack along both the Contact 3 and Contact 2 surfaces without any restraint, a bounding (worst-case result with a very low likelihood of occurrence) showed that the small wedge of RCC material between the Contact 2 and 3 surfaces (Part 2 on Figure 4b) in the upstream portion of the dam developed and moved upstream between 2 and 6 feet while the remainder of the upper portion of the dam (Parts 3 and 4 on Figure 4b) moved downstream along the horizontal lift surface. Because the section of the dam is 47 feet wide at the crack locations, the net deformations between the upper portion of the dam (Parts 3 and 4) and the Part 2 wedge in excess of 20 to 23 feet (6.1 to 7 m) would have to occur in order for any sort of upstream toppling failure to occur. The analysis further indicated that the crest of the dam (Parts 3 and 4) was stable following even the largest and long duration 50,000-year earthquake event. These results were considered conservative as the 2D model did not consider the effect of increasing side restraint that would occur as downstream deformations engage increasing arch resistance to sliding.
8. Risk Analysis Results
The original appraisal-level design team risk analysis for the new RCC dam configuration was conducted in 2016 and considered only seismic-related PFMs for a straight-axis gravity dam cross-section with flatter upstream and downstream slopes. The results of that risk analysis were below Reclamation’s risk tolerance guidelines. However, there were a number of ideas for optimization of the dam section that could further improve the safety of the dam and increase confidence in the risk estimate results. One important idea from the appraisal-level risk analysis was to curve the gravity dam axis in order to mobilize arch action that would reduce estimated sliding displacements. It was further believed that curving the dam axis would allow for some reduction in the upstream and downstream slope requirements resulting in possible cost reductions for the construction of the dam.
The feasibility design configuration (see Appendix B) included a curved gravity plan configuration for the dam and reduced upstream and downstream slopes. For the feasibility-level design risk analysis completed in later 2019, a total of 18 PFMs, including seismic (structural and geologic hazard), static, and hydrologic, were described, discussed, and evaluated. Full quantitative risk analyses following the best practices for dam and levee safety risk analyses [52] were performed. Risks were estimated by a joint HDR-Reclamation team for three primary risk-contributing PFMs. Details of the risk analyses, including failure mode event trees and nodal analyses, are beyond the scope of this paper. However, the overall results are instructive relative to the conceptual framework for risk-informed designs presented in this paper. The total Annual Failure Probability (AFP) was estimated to be 1.7 × 10⁻⁵ and is nearly an order of magnitude below Reclamation’s Public Protection Guideline value for AFP [53]. The total Annualized Life Loss (ALL) risk (1.4 × 10⁻⁴) is also nearly one order of magnitude below the guideline value for ALL. The feasibility design level risk estimates are summarized in Table 12.
The risk results were considered conservative. The confidence was somewhat low, and uncertainties were moderate to high regarding the performance of the upper portion of the dam for the 10,000-year and 50,000-year events under PFM6. Likewise, because of the way the ground motions were developed for the short-duration and long-duration events, summing the risk from both durations for a single PFM may have overestimated the total risk. Similarly, the consequence estimated for crest failure modes would likely be far less than breach discharge resulting from the breach of a full monolith which was not accounted for in the Total ALL estimate. PFM 6 contributed 64% of the total mean AFP and 92% of the total mean ALL.
Verifying the risk of the proposed layout and cross-section of the dam was an important step in the feasibility design. The quantitative risk analysis provided not only confirmation of the safety of the new RCC dam configuration but important input that further optimization of the configuration may be possible during the final design.
9. Conclusions and Recommendations
The 3D and 2D structural models developed for the feasibility design configuration of the new Scoggins RCC dam demonstrated that the section was robust and would provide a level of safety that would be acceptable under the Reclamations Public Protection Guidelines [52]. Further, the results of the risk analysis for the feasibility design configuration validated the four-component risk-informed design criteria that were used in developing the feasibility design.
Specifically, the following was found related to the risk-informed design criteria established for the feasibility design of the dam:
9.1. #1 Elastic (Linear) Response for 500- to 1000-Year Seismic Events
- No cracking of the concrete;
- No sliding of the RCC dam.
Structural Analysis Results
The response of the structure is related to the strength properties of the RCC. The RCC properties will increase with time, and two study cases were evaluated, including (1) base material properties (1-year target strengths), and (2) long-term properties (estimated 10-year strengths). For the base case material properties, linear elastic behavior is expected for earthquakes with recurrence intervals between 1000 and 5000 years. For the long-term material properties, linear elastic behavior is expected for earthquakes with recurrence intervals between 5000 and 10,000 years. No cracking of the concrete or sliding of the dam is expected in the linear elastic performance range for the dam.
9.2. #2 Linear-Elastic Transitioning to Possible Localized Non-Linear Response with Limited Damage Beginning to Occur between the 1000- and 5000-Year Seismic Events
- Limited cracking of the concrete permitted, but not permitted to crack through the section for the 1000-year event;
- No sliding of the RCC dam for the 1000-year event.
Structural Analysis Results
The structural analyses confirmed that the transition into localized non-linear response with limited damage is a function of the RCC material strength. For the base material properties, this transition is expected between the 1000- and 5000-year earthquake events. By the time the structure is 10 years old, the transition is expected to occur for earthquakes ranging from 5000- to 10,000-year events. No sliding of the dam at any location occurs for a short or long duration 1000-year event for any of the assumed material properties.
9.3. #3 Non-Linear Response, Moderate Damage, and Post-Earthquake Stability for Events Larger Than 5000-Year Return Periods
- Cracking through the section may be allowed depending on analysis results and the estimated extent and location of damage within the dam;
- Sliding resultant of any section of the dam limited to less than about 2 to 4 feet of estimated displacement;
- Sensitivity analysis for higher and lower friction angles on any identified planes of sliding to inform risk analysis.
Structural Analysis Results
The non-linear response was indicated beginning at an earthquake event having a recurrence interval as low as the 1000- to 5000-year when base case (1-year) strength parameters are used. The non-linear response was not indicated in the analyses for the 10,000-year earthquake loading when the long-term strength parameters were used corresponding to the expected RCC strength at about 10 years and beyond. Cracking and sliding displacements will have a preference to develop along the base of the dam with the potential for cracking and sliding at a location near the chimney section for an earthquake recurrence interval between 10,000 and 50,000 years. The occurrence and magnitude of cracking and displacements estimated are directly related to both the strength properties of the RCC and the duration of earthquake loading. Estimated displacement for the larger events where non-linear behavior is initiated is generally less than the specified design criteria.
Overall, the dam is expected to perform well for the full range of earthquakes considered in the structural analyses.
9.4. #4 Post-Seismic Stability FOS > 1.0
- Predicted for all loading conditions, including the 10,000- and 50,000-year events, when a reasonable lower bound residual friction angle of 35 degrees is assumed for the planes of sliding, and full uplift is applied linearly along the sliding plane as a full reservoir at the upstream heel of the dam and tailwater at the toe of the dam.
Post-Seismic Stability Analysis Results
A post-earthquake gravity analysis with the 2D model considering a small component of side shear stress, a residual friction angle of 35 degrees along a basal sliding plane, and uniform reservoir pressure along the entire length of the cracked base yielded a minimum FOS of 1.2. For all study cases, the design configuration results in a dam that will remain stable following all earthquake events considered in the analyses. Maximum displacements of 2 to less than 4 feet (0.61 to <1.22 m) were estimated for the maximum height sections with the 3D model for the 50 k, long-duration earthquake and base (1-year) material properties. Further analysis of the dam crest cracking potential with the 2D model estimated maximum potential displacements of 2 to 4 feet in the downstream direction for the most likely crack configuration. For a worst-case (very low probability) continuous crack sloping in the upstream direction, model simulations indicate a maximum upstream displacement potential for a small wedge of RCC material of 2 to 6 feet for the 50k, long-duration earthquake. The likelihood of a toppling or overtopping event resulting from the cracking and sliding of the dam near the crest is considered remote.
Funding
The research summarized in this paper was funded by Clean Water Services as part of engineering studies to develop the RCC dam configuration presented in this paper. No other external funding was provided.
Data Availability Statement
Not applicable.
Acknowledgments
The following people made important contributions to the feasibility design of the Option 3 RCC dam, summarized in this paper.
- Clean Water Services: Tom VanderPlaat and John Dummer.
- U.S. Bureau of Reclamation: Roman Koltuniuk, Randall Kuzniakowski, Derek Wittwer, Jason Schneider, Jennifer Huggins, Walt Heyder, Bryan Simpson, Dom Galic, Dave Gillette, Lindy Johnson, Tara Schenk McFarland.
- HDR Contributors: John Charlton, Andrew Little, and John Ballegeer for site characterization; Andrew Little, Jeff Allen, and Tatro and Hines for RCC Mix Designs; Farzad Abedzadeh, Phoebe Purcell, and Kevin Gribble for Structural Modeling; Dan Osmun, Bill Fiedler, Elena Sossenkina, and Stephanie Williams for Risk Analyses.
The author would also like to express appreciation for Amin Hariri-Ardebili for his input and review of the section titled “A Review of Seismic Design and Dam Safety Risk Analysis of Concrete Dams.” Portions of this paper were first published for the 2022 Annual Conference of the United States Society on Dams [54] titled “Risk Informed Design of a New Scoggins RCC Dam, Oregon Under Extreme Seismic Loading”.
Conflicts of Interest
The author declares no conflict of interest.
Appendix A
Figure A1.
Example SRCH10-SP seeded and spectrum matched 10 k-year ground motions, and Husid Plot considered during Feasibility Design Structural Analyses. Vertical lines on Husid Plot represent the time required to build from 5% to 95% of the Arias intensity [44]. The H1 component considered representative of upstream-downstream loading, and H2 as representative of cross-canon loading.

Appendix B
Figure A2.
Scoggins RCC Dam: (a) Plan layout; (b) Profile (looking downstream). Stationing and elevation scales are in feet. Reference to notes on these figures are related to notes provided on the feasibility design drawings and have not been included here.
Figure A2.
Scoggins RCC Dam: (a) Plan layout; (b) Profile (looking downstream). Stationing and elevation scales are in feet. Reference to notes on these figures are related to notes provided on the feasibility design drawings and have not been included here.

Figure A3.
Representative maximum (non-overflow) cross-section of the Scoggins RCC Dam.

Appendix C

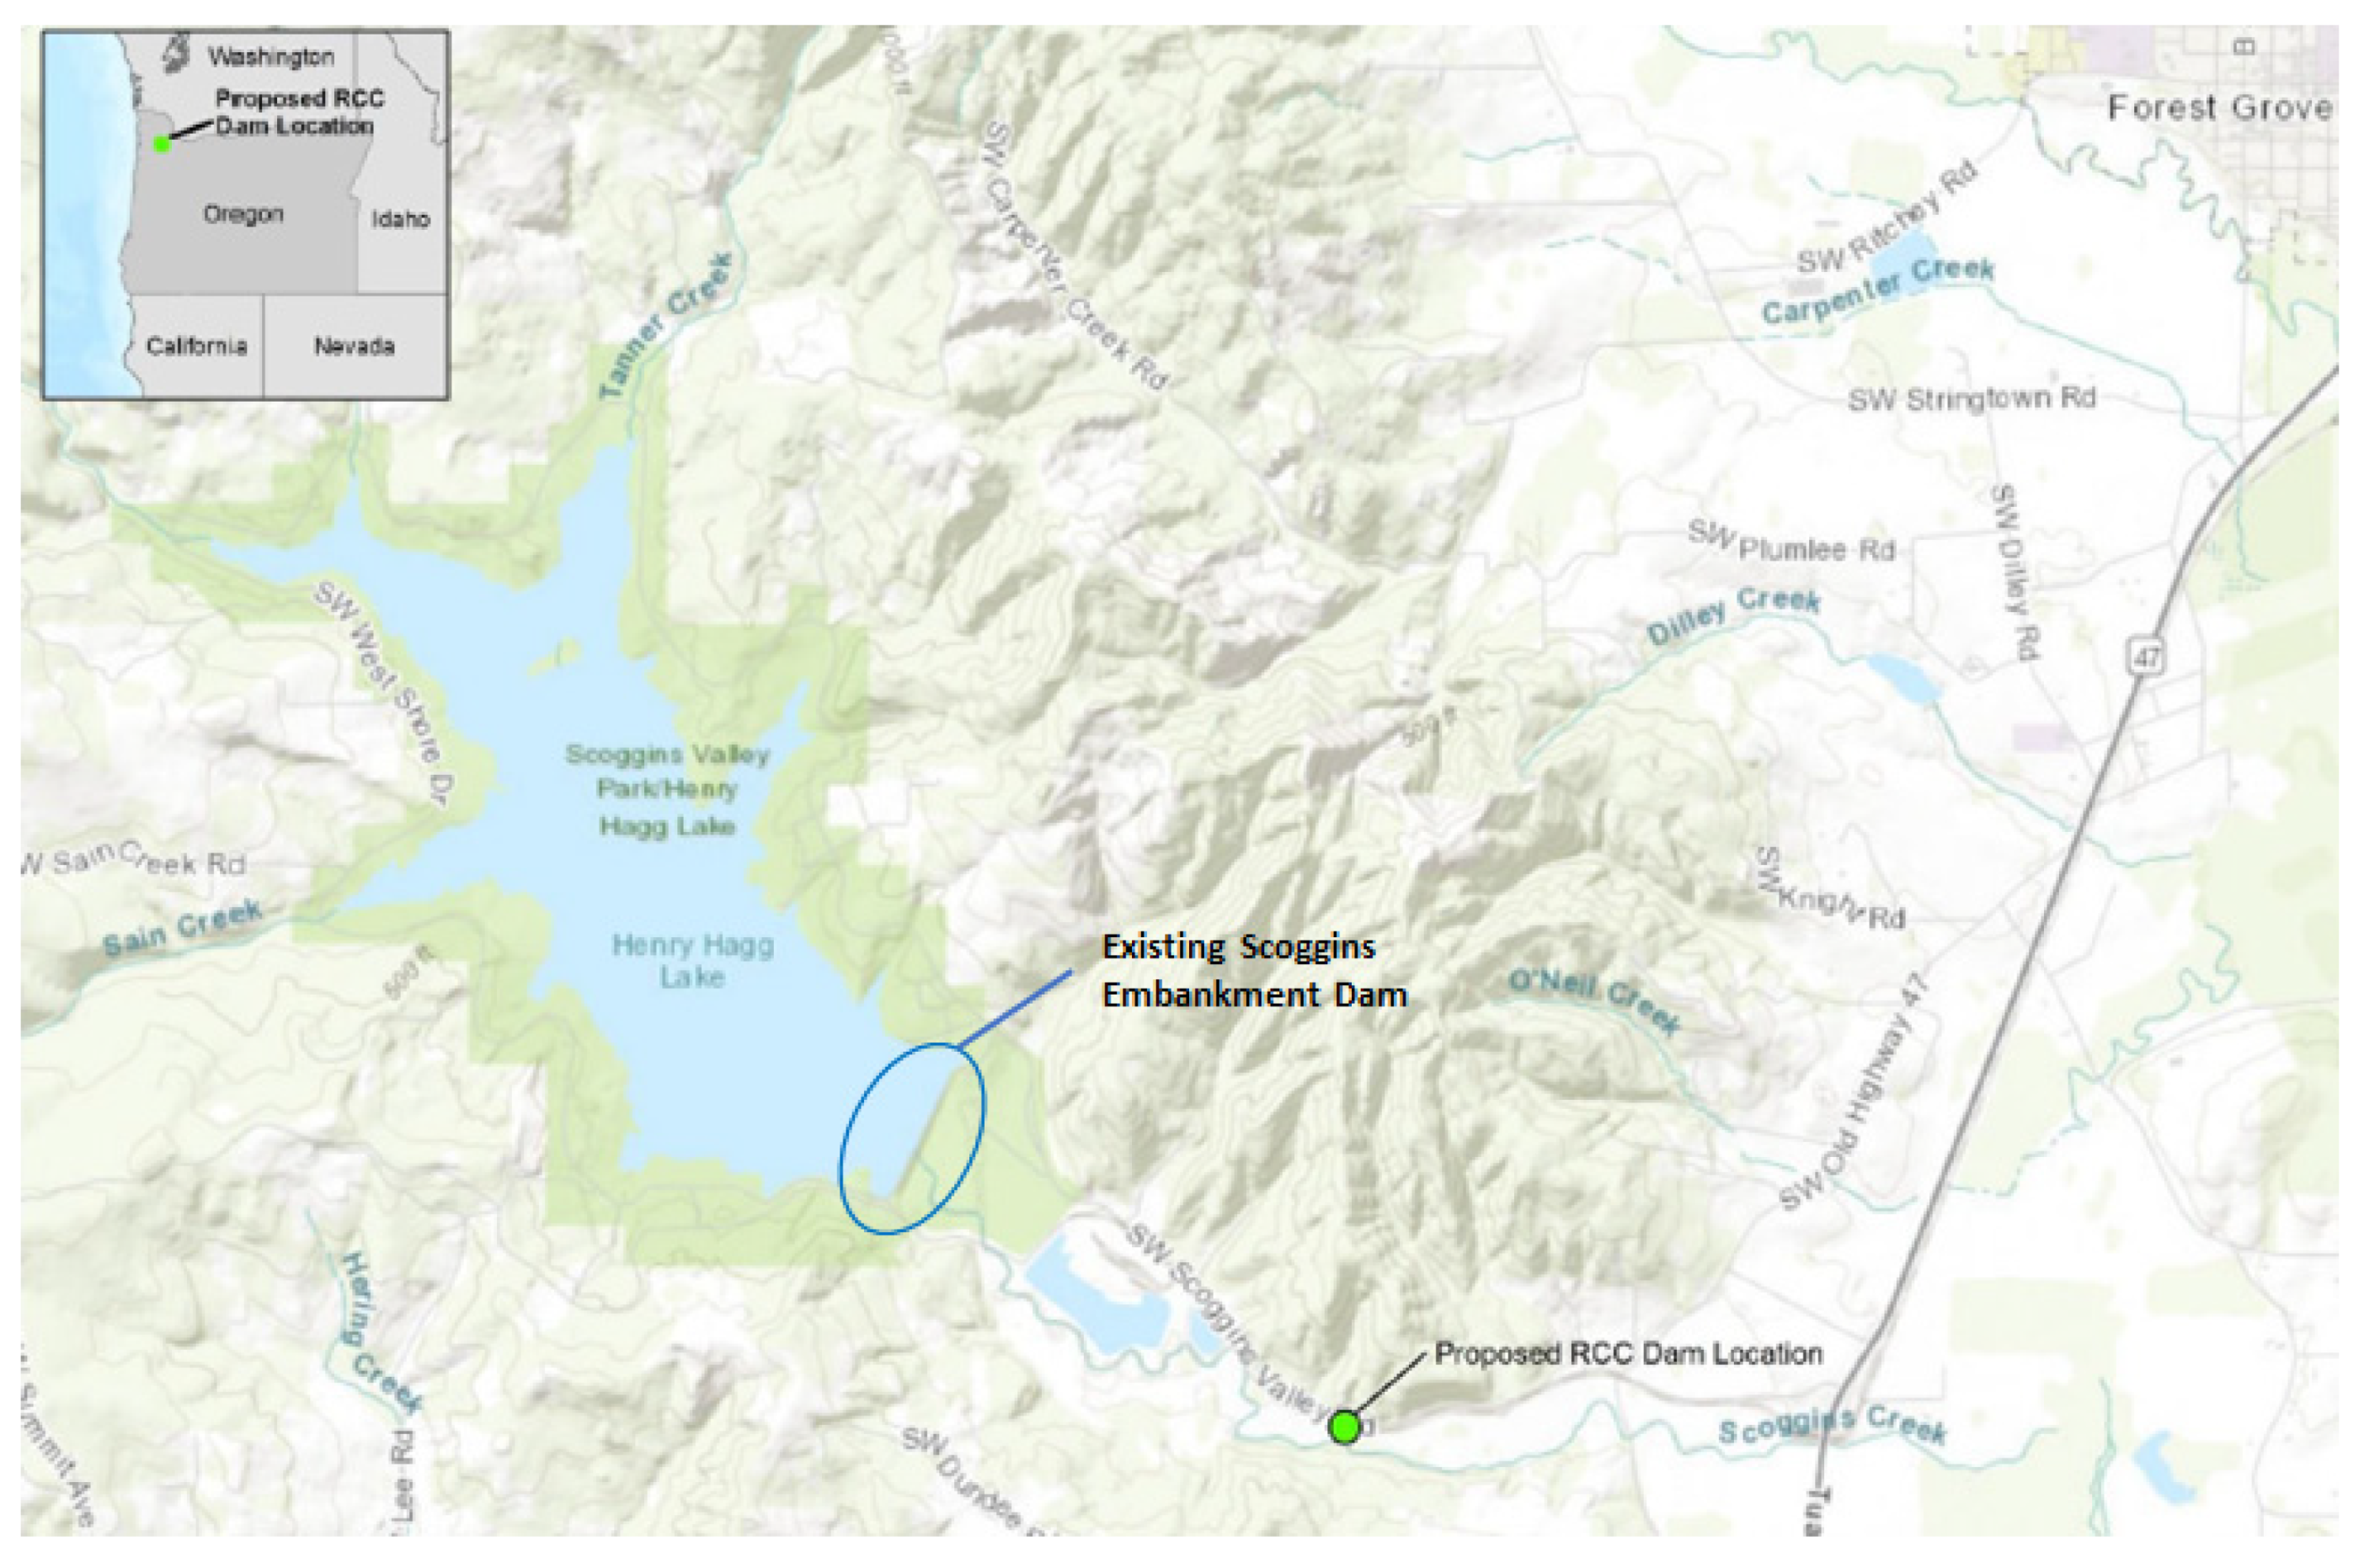
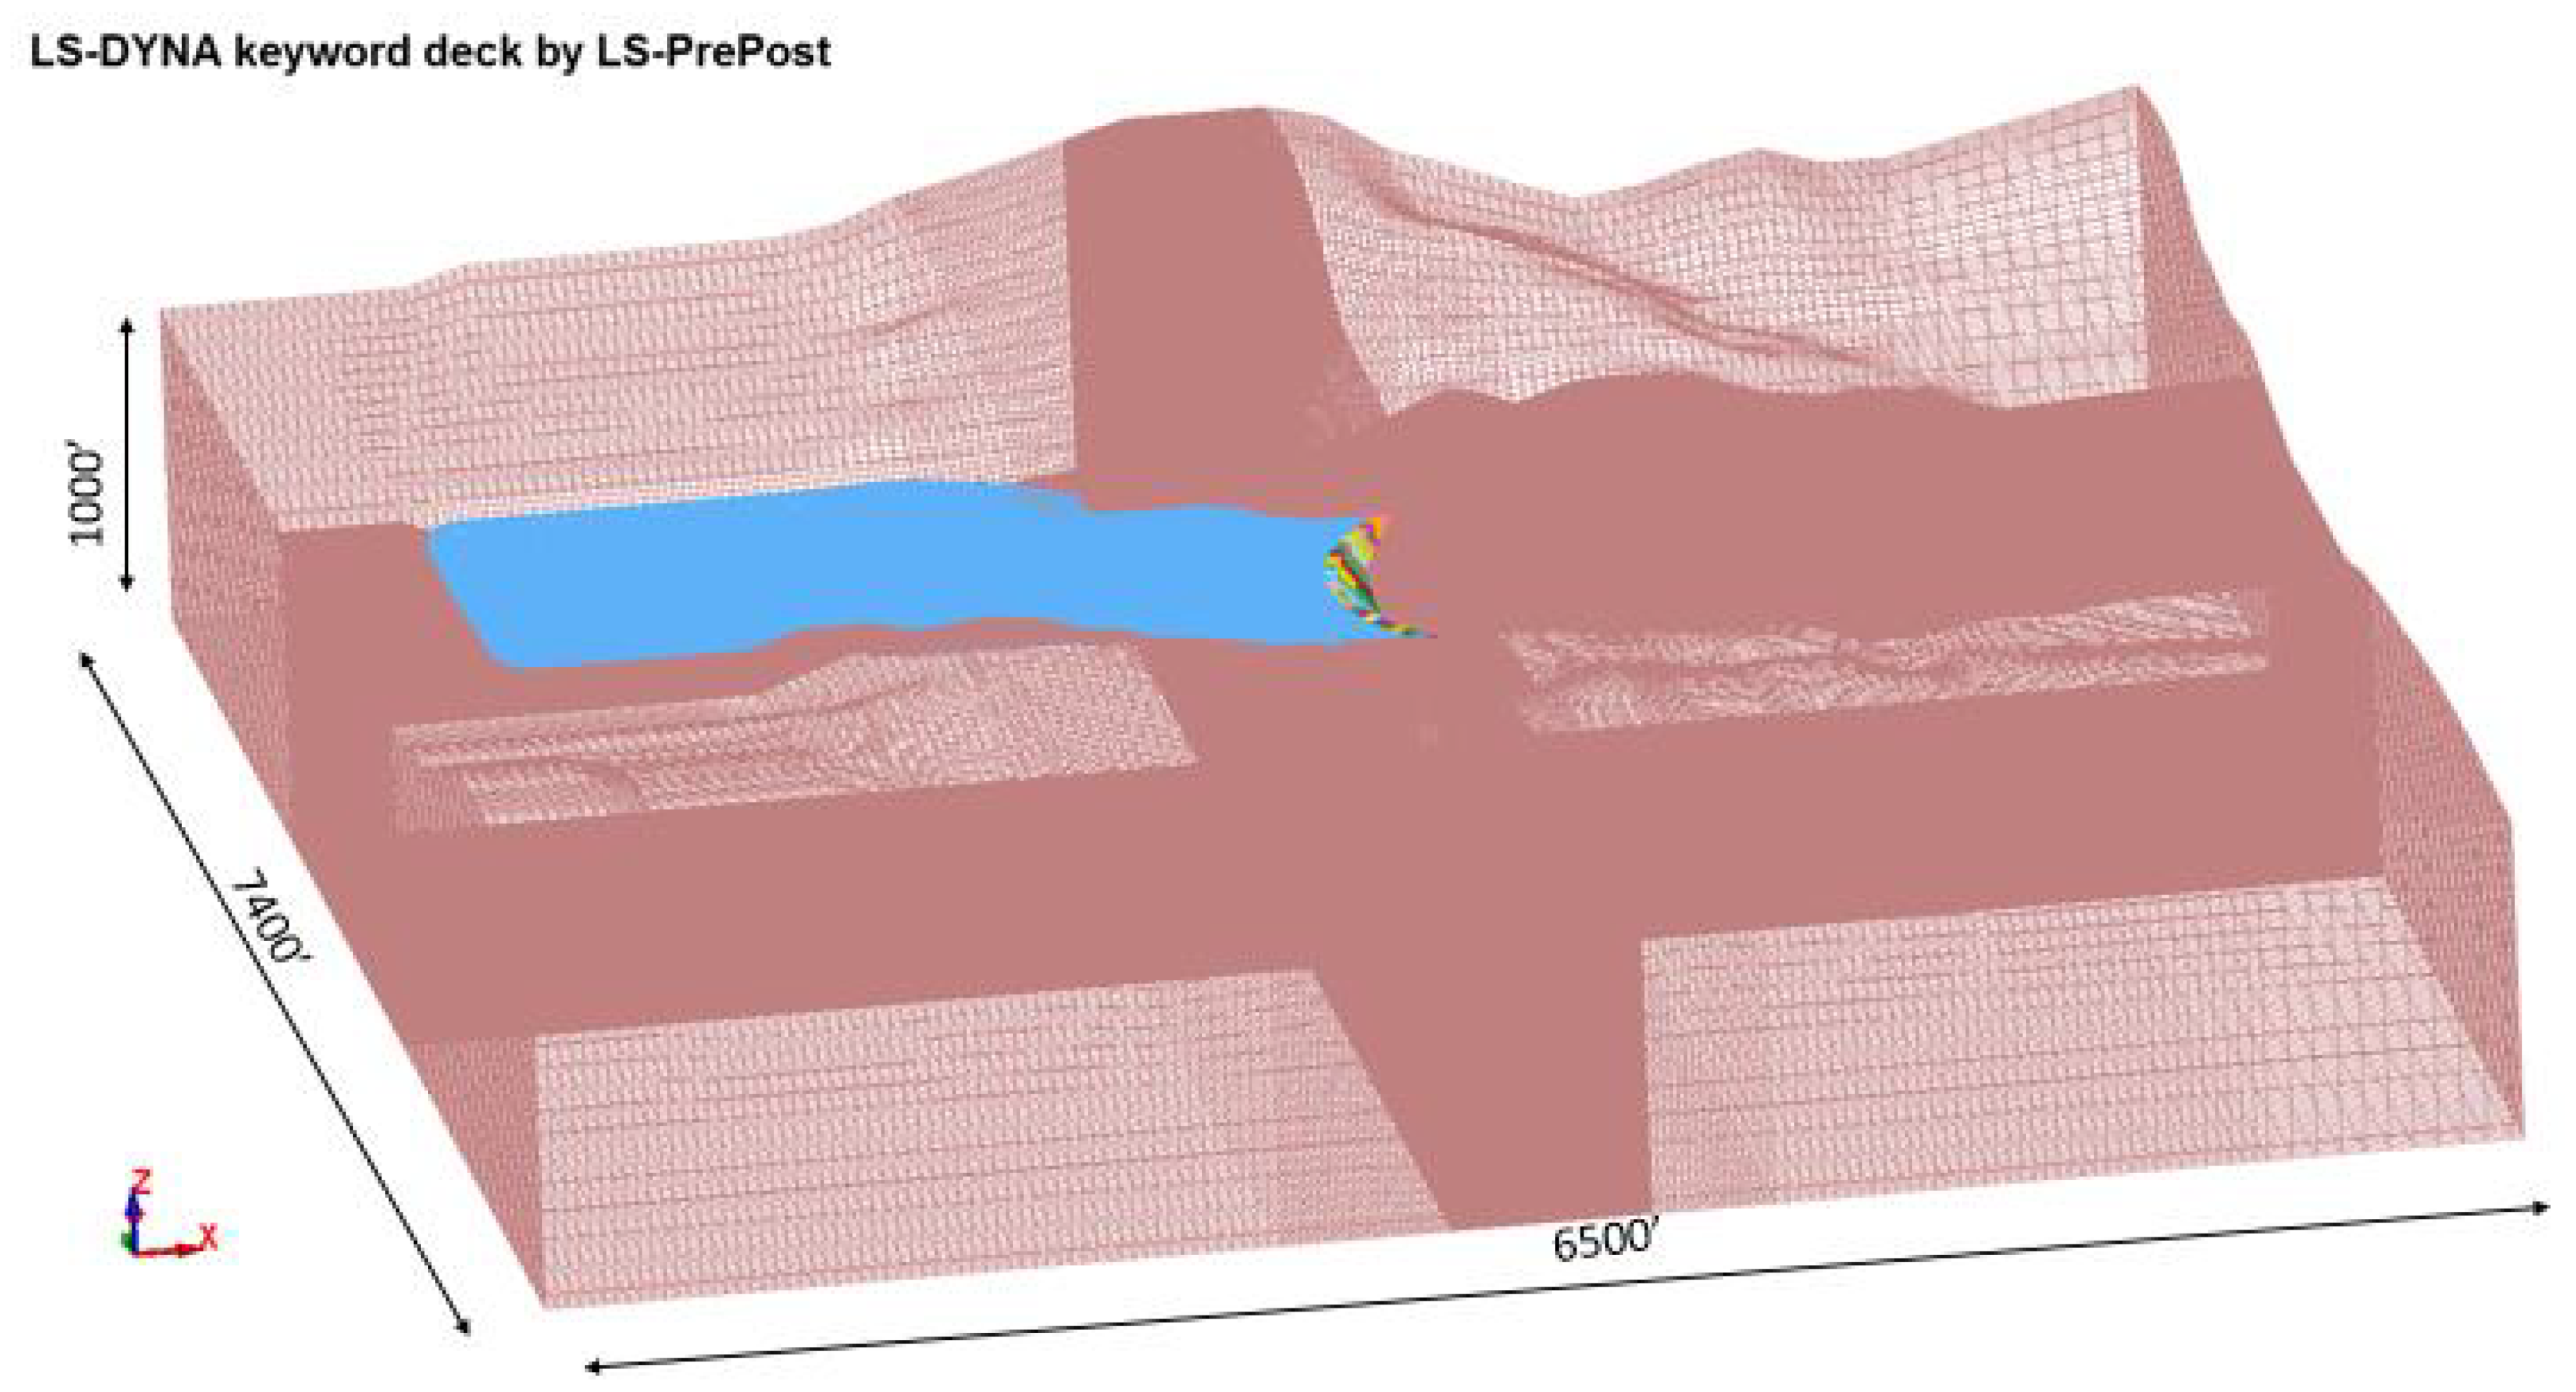
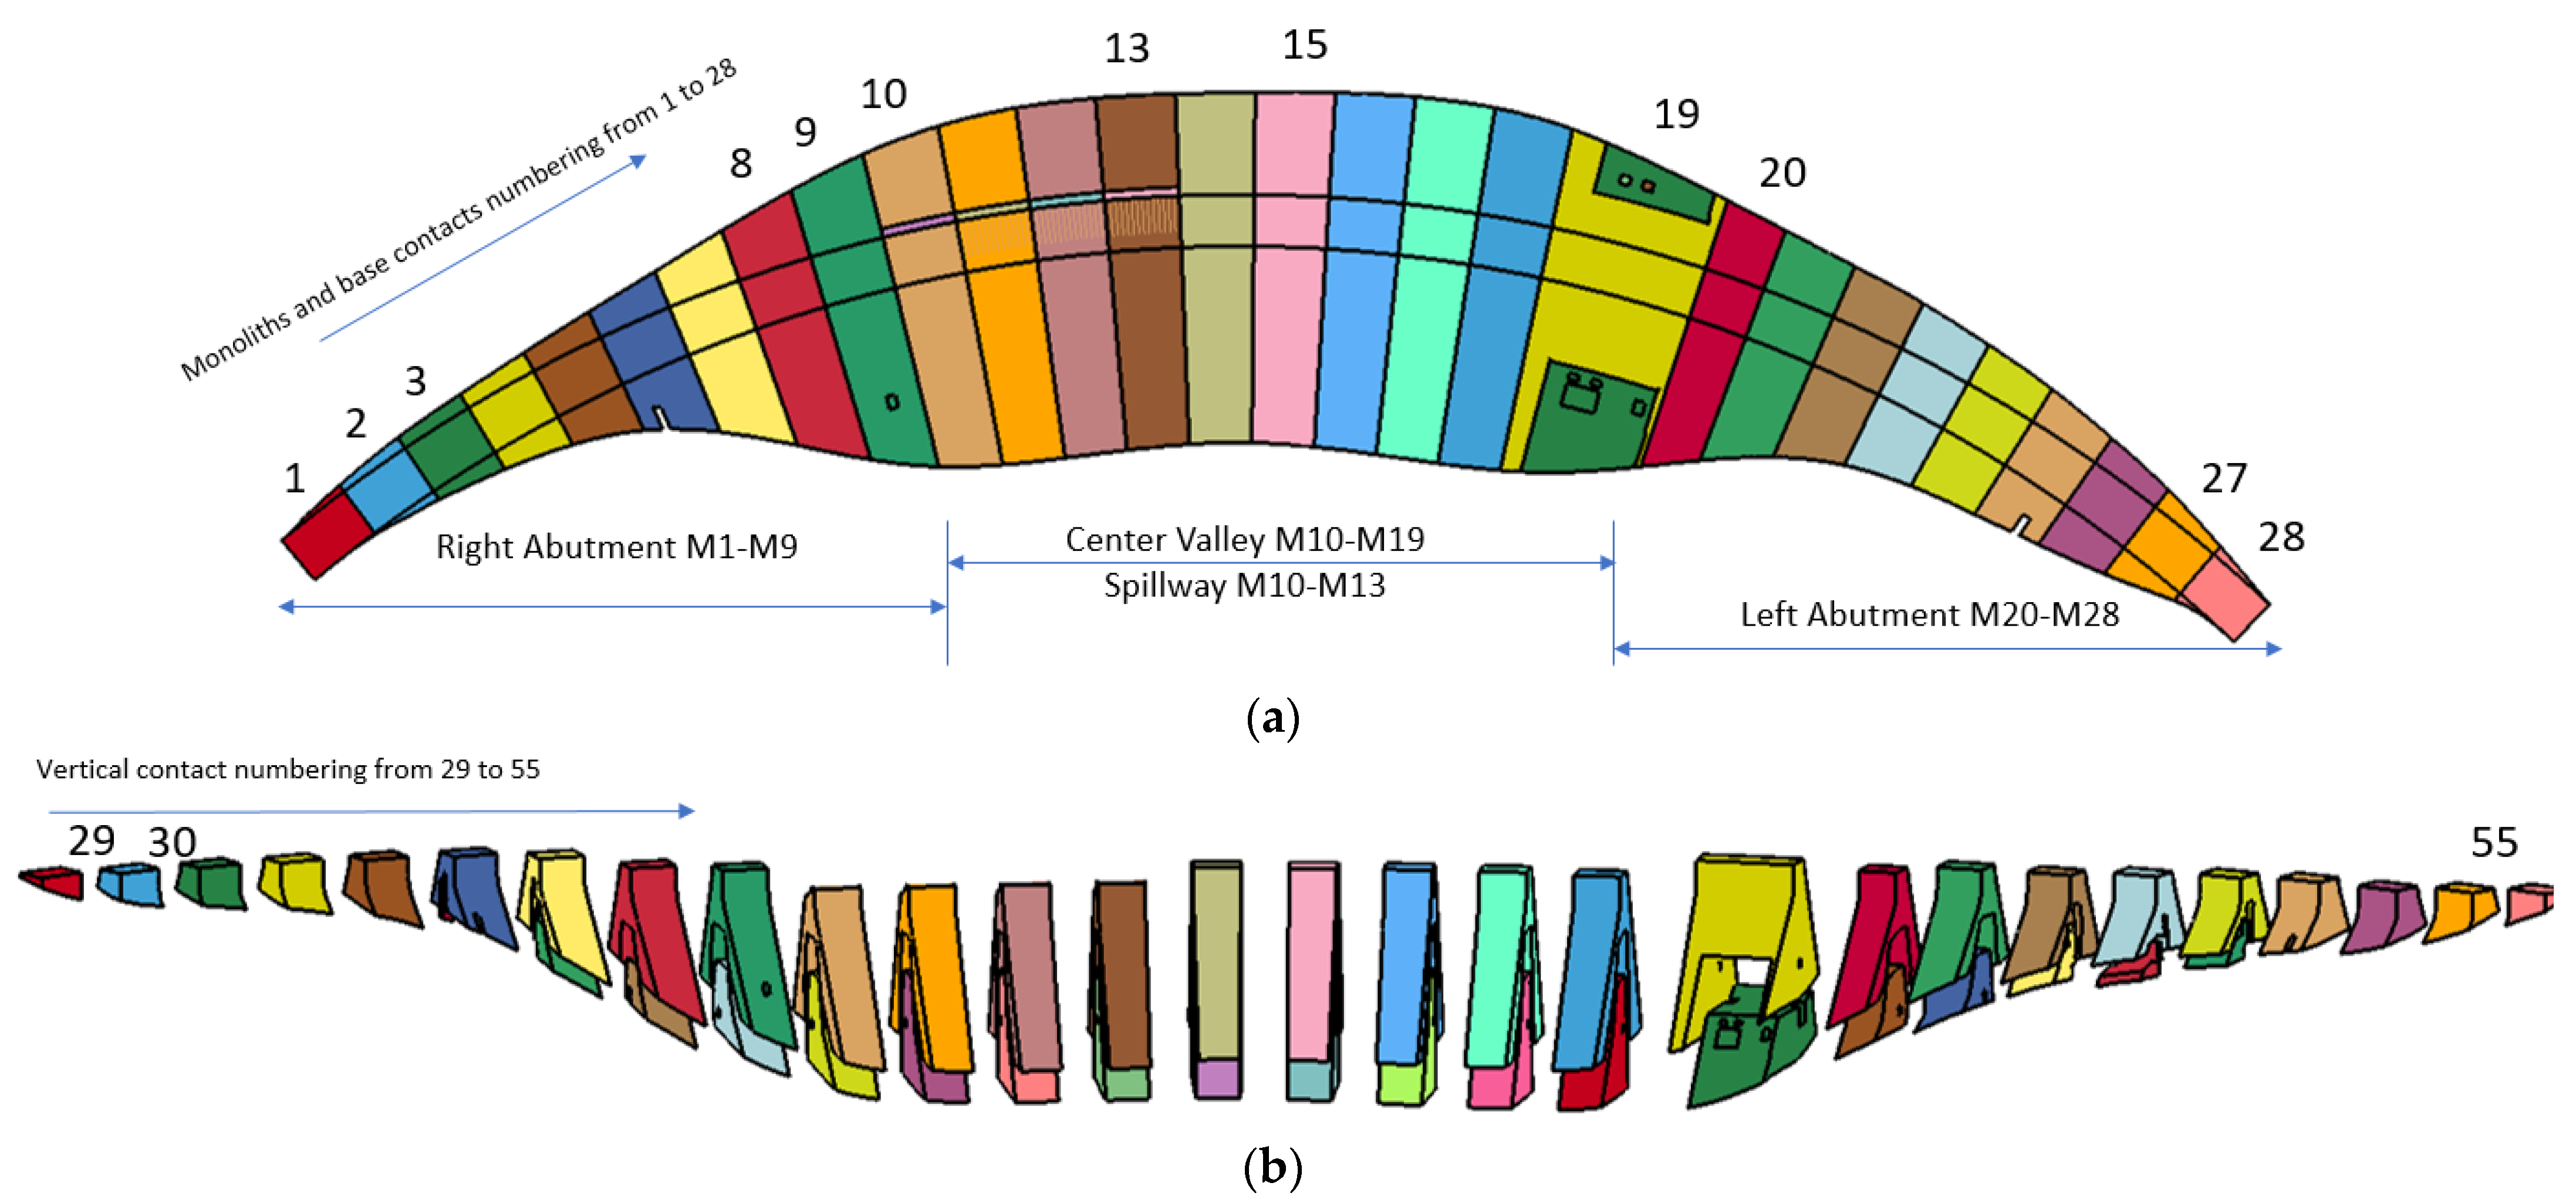
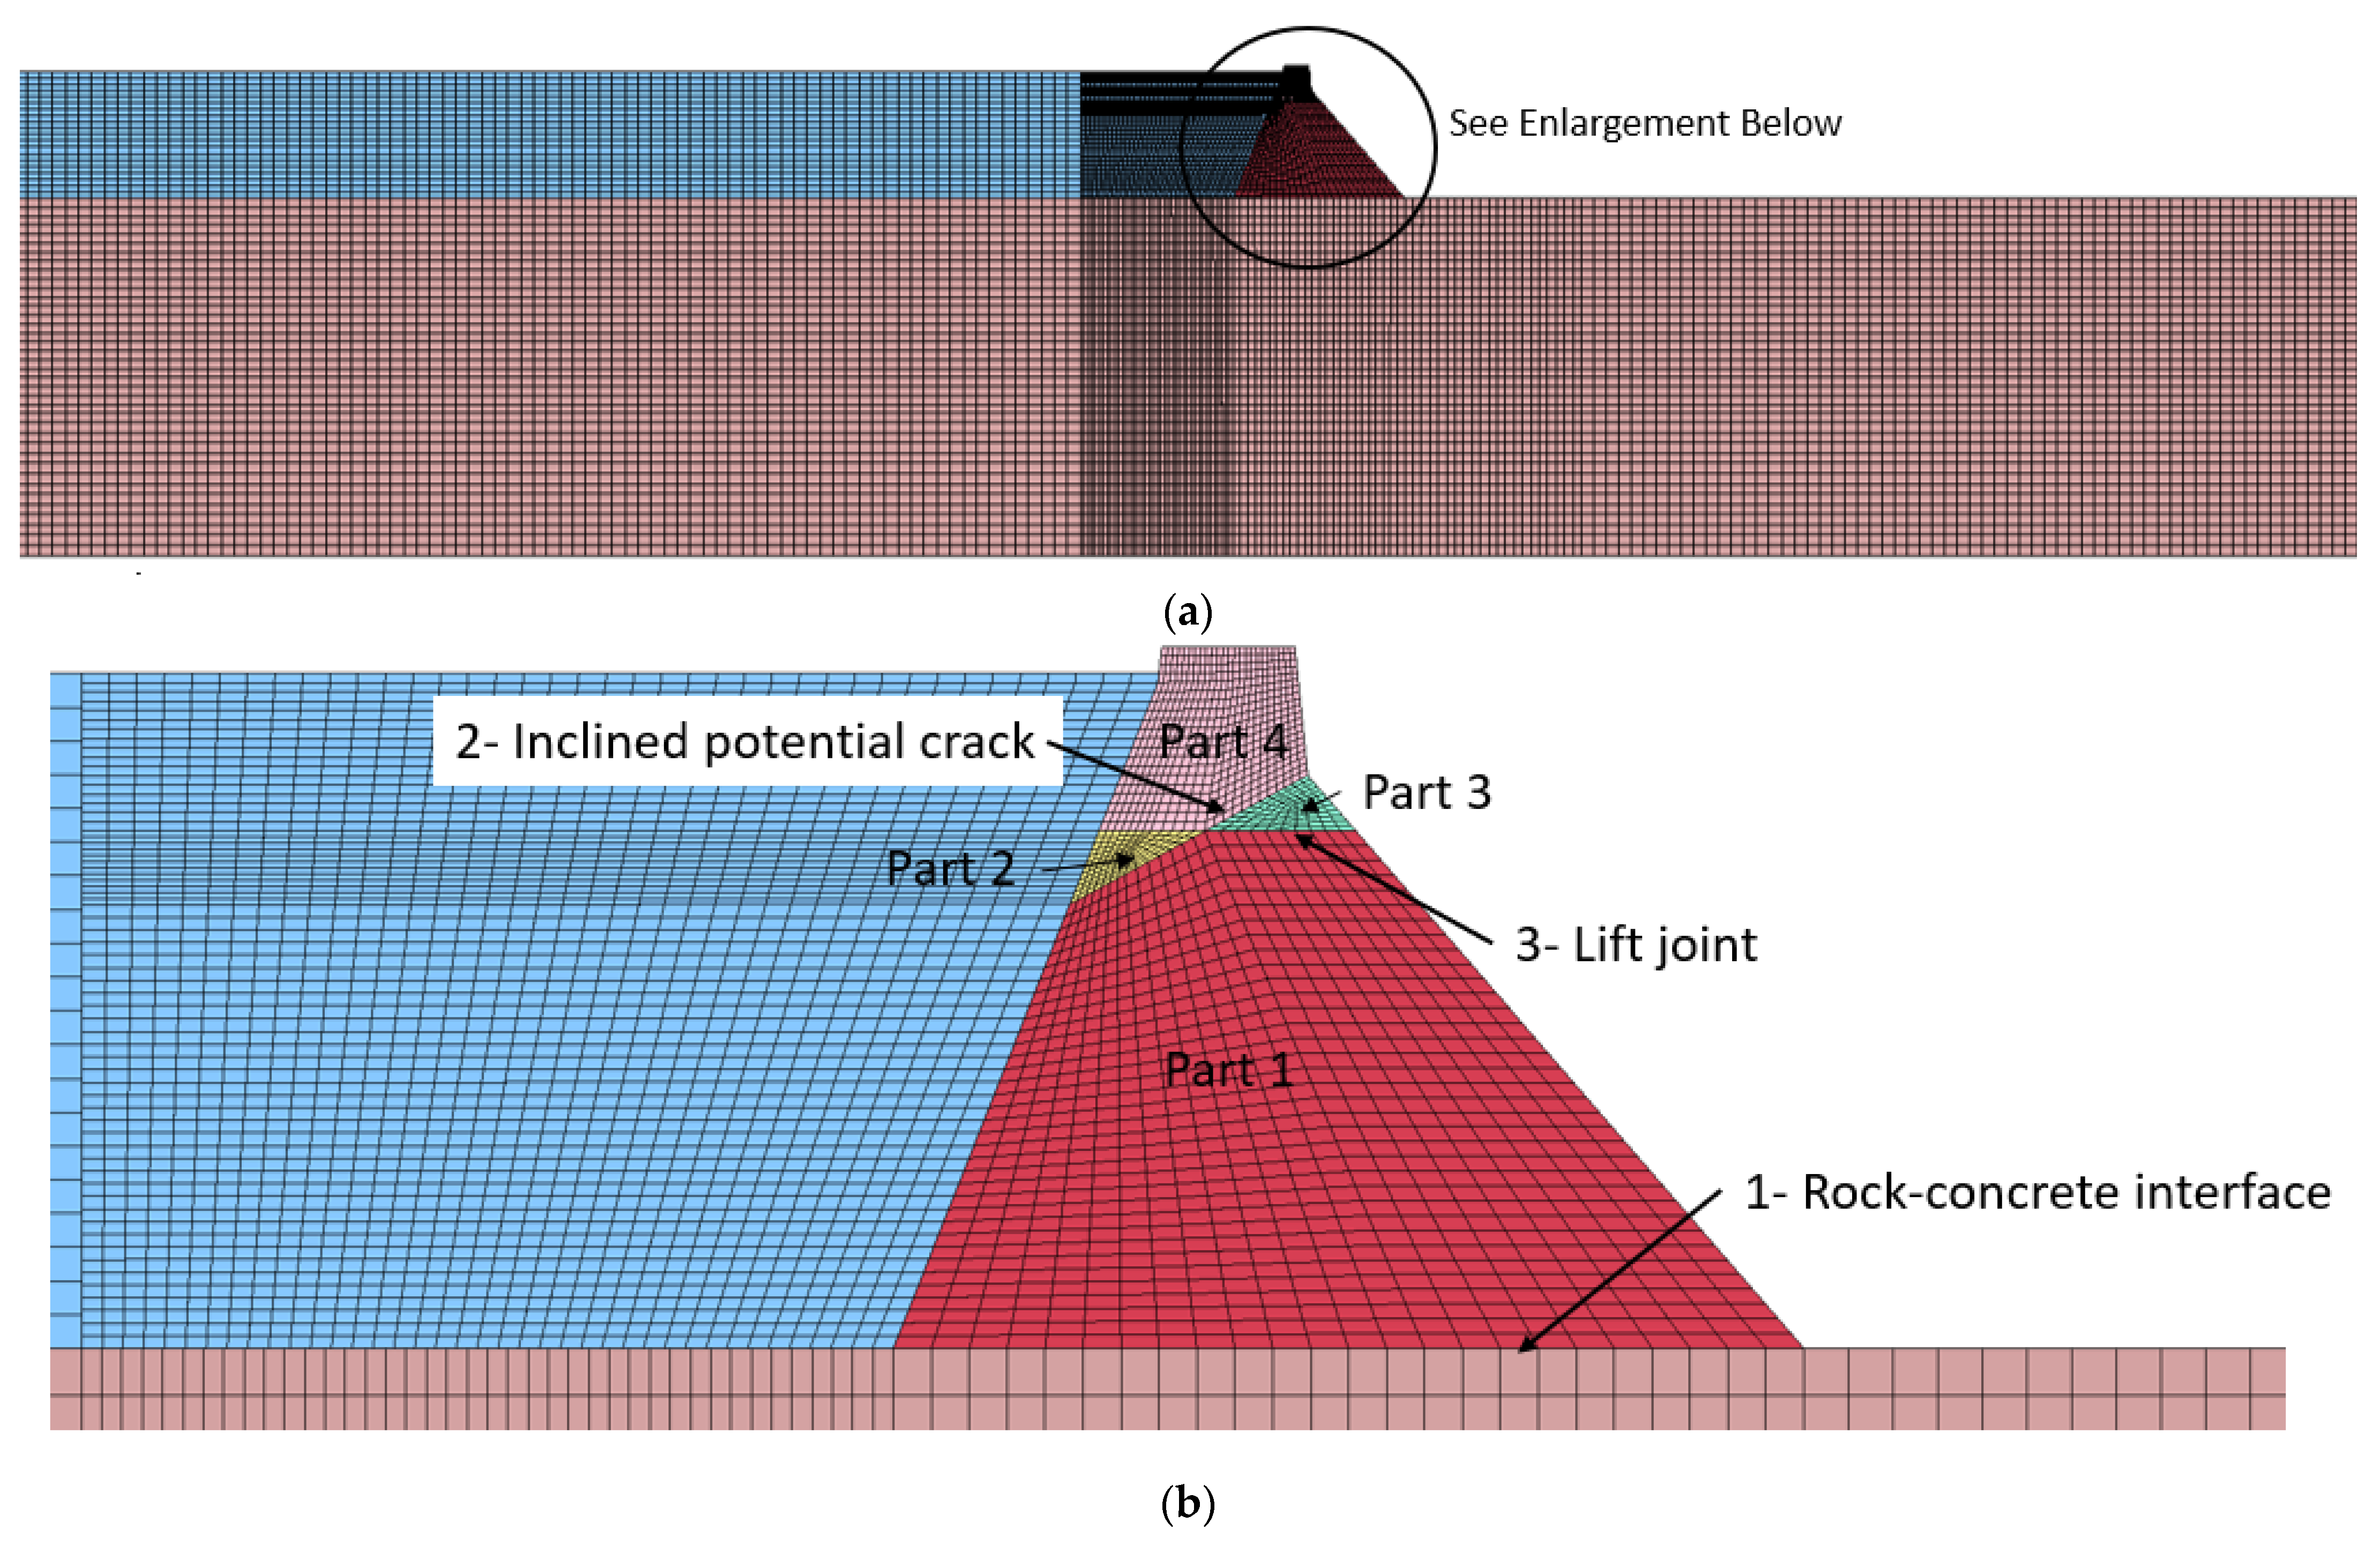
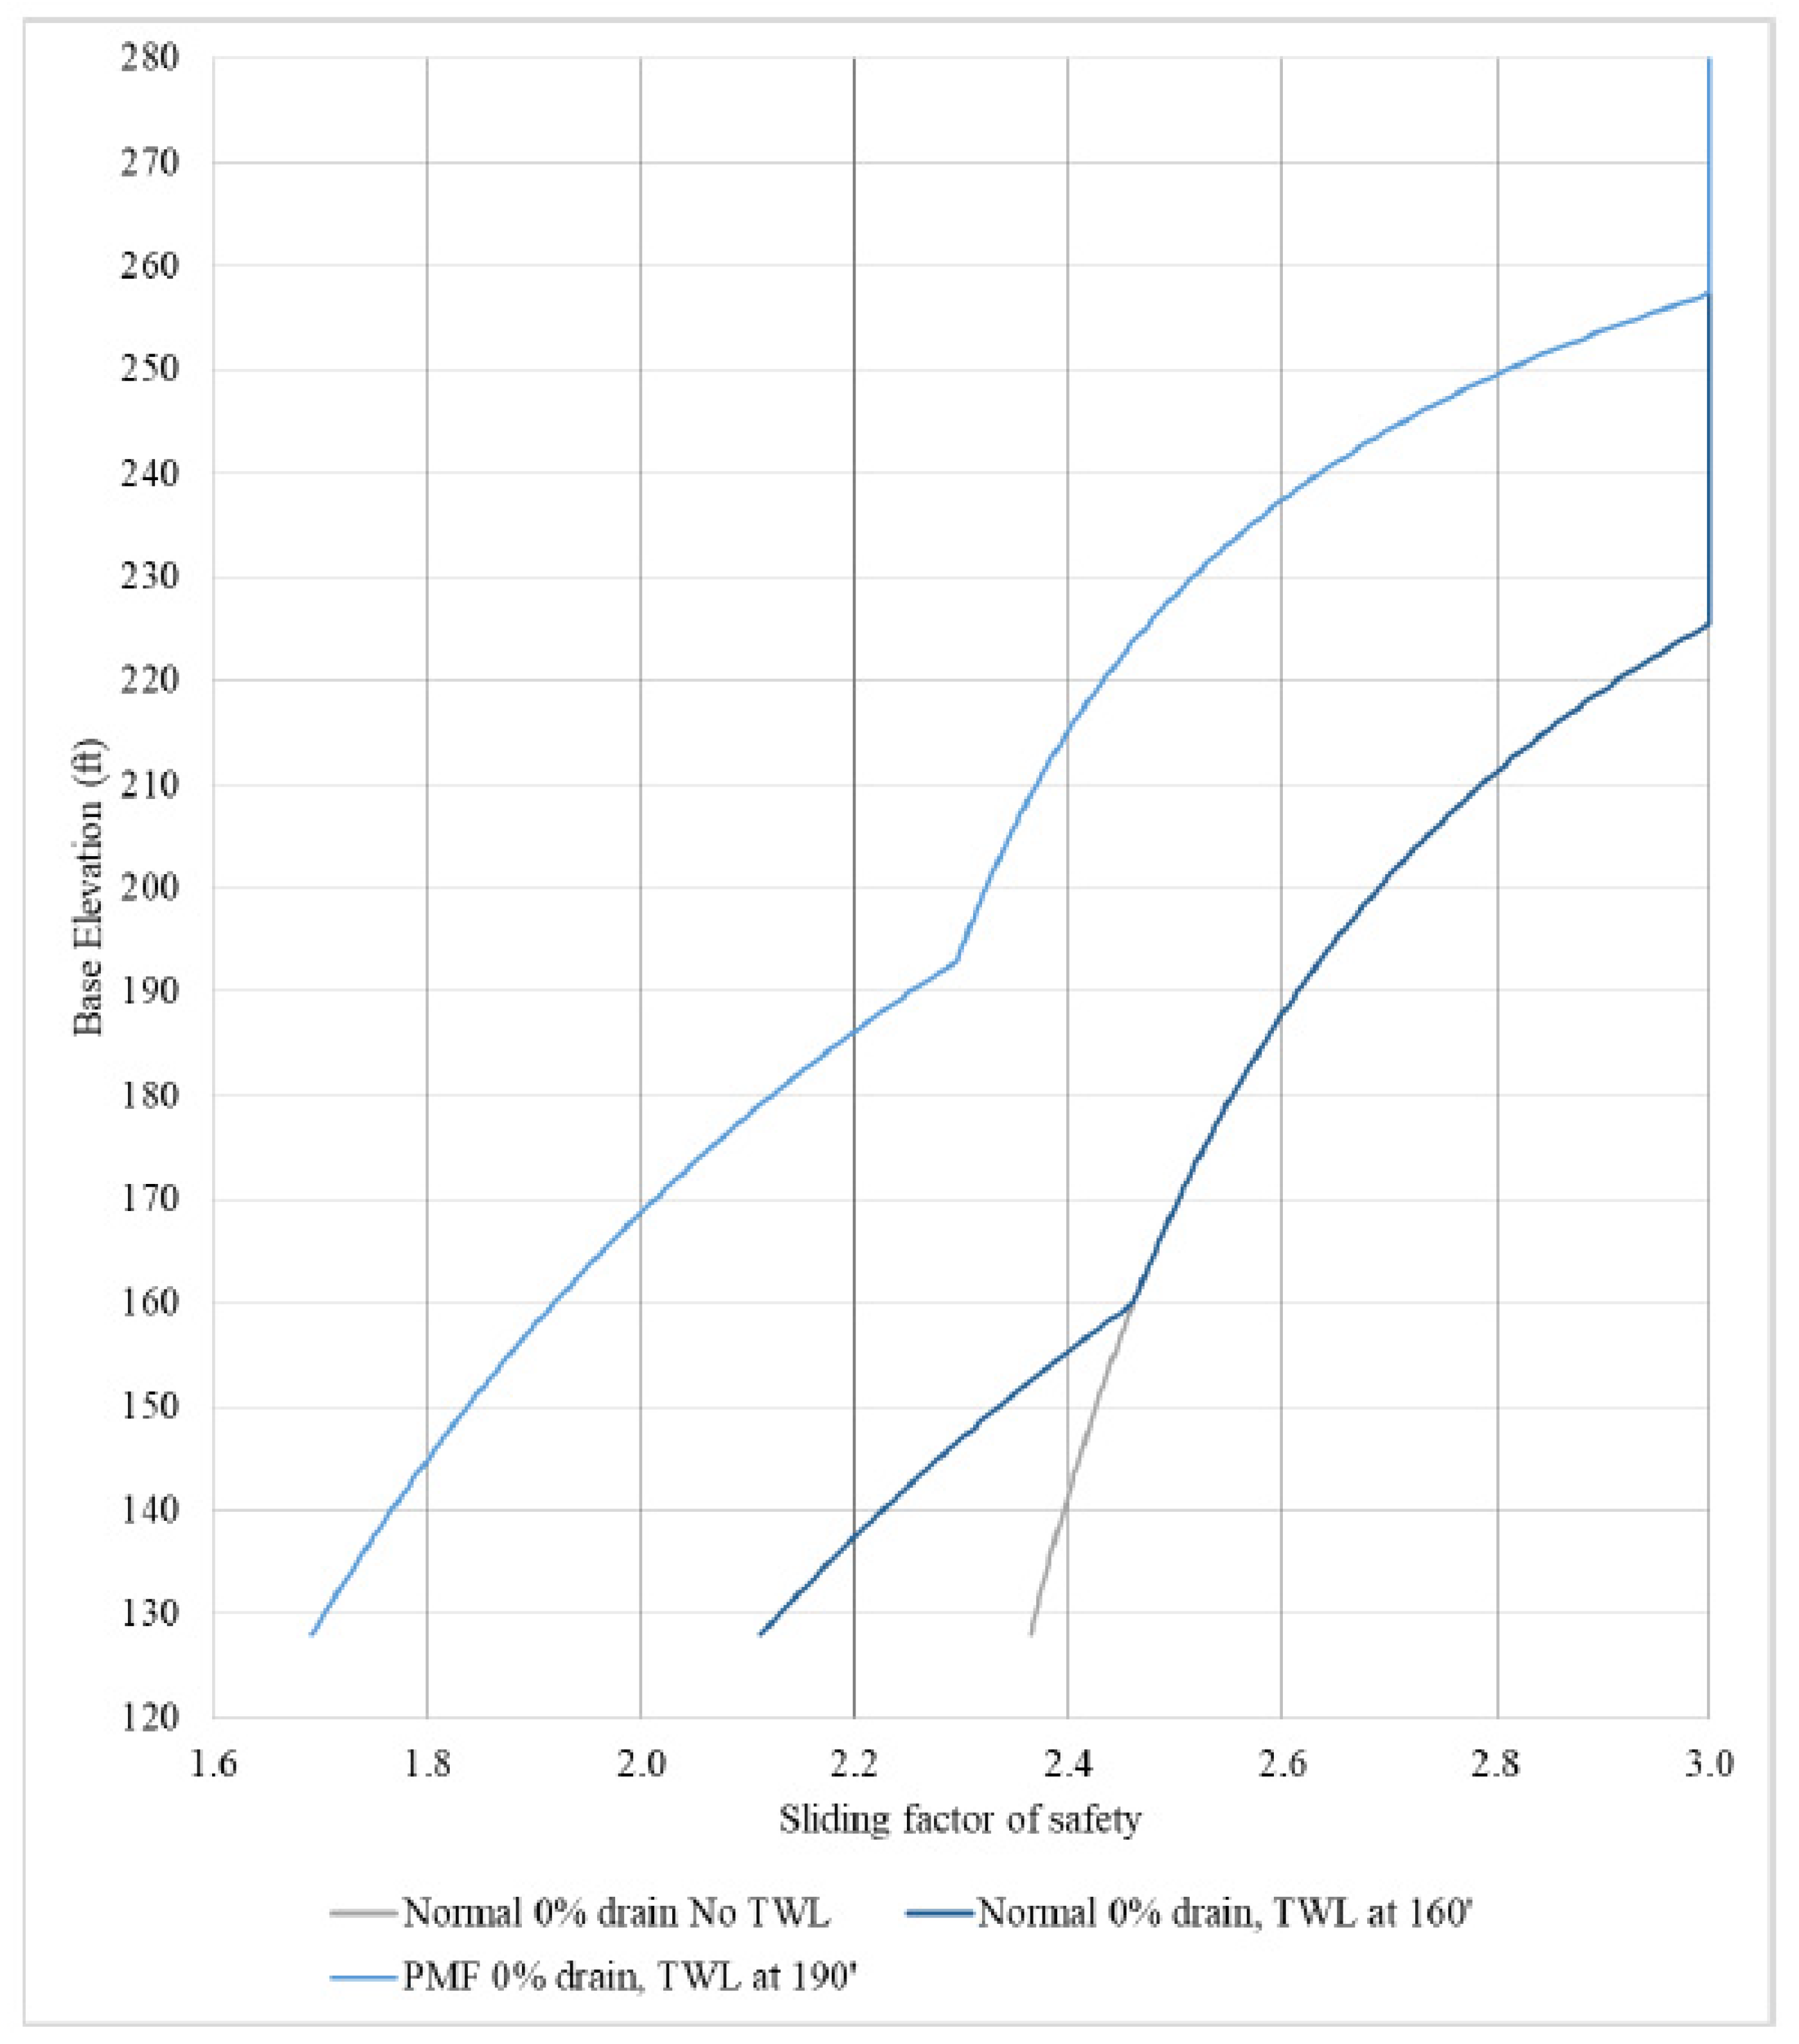
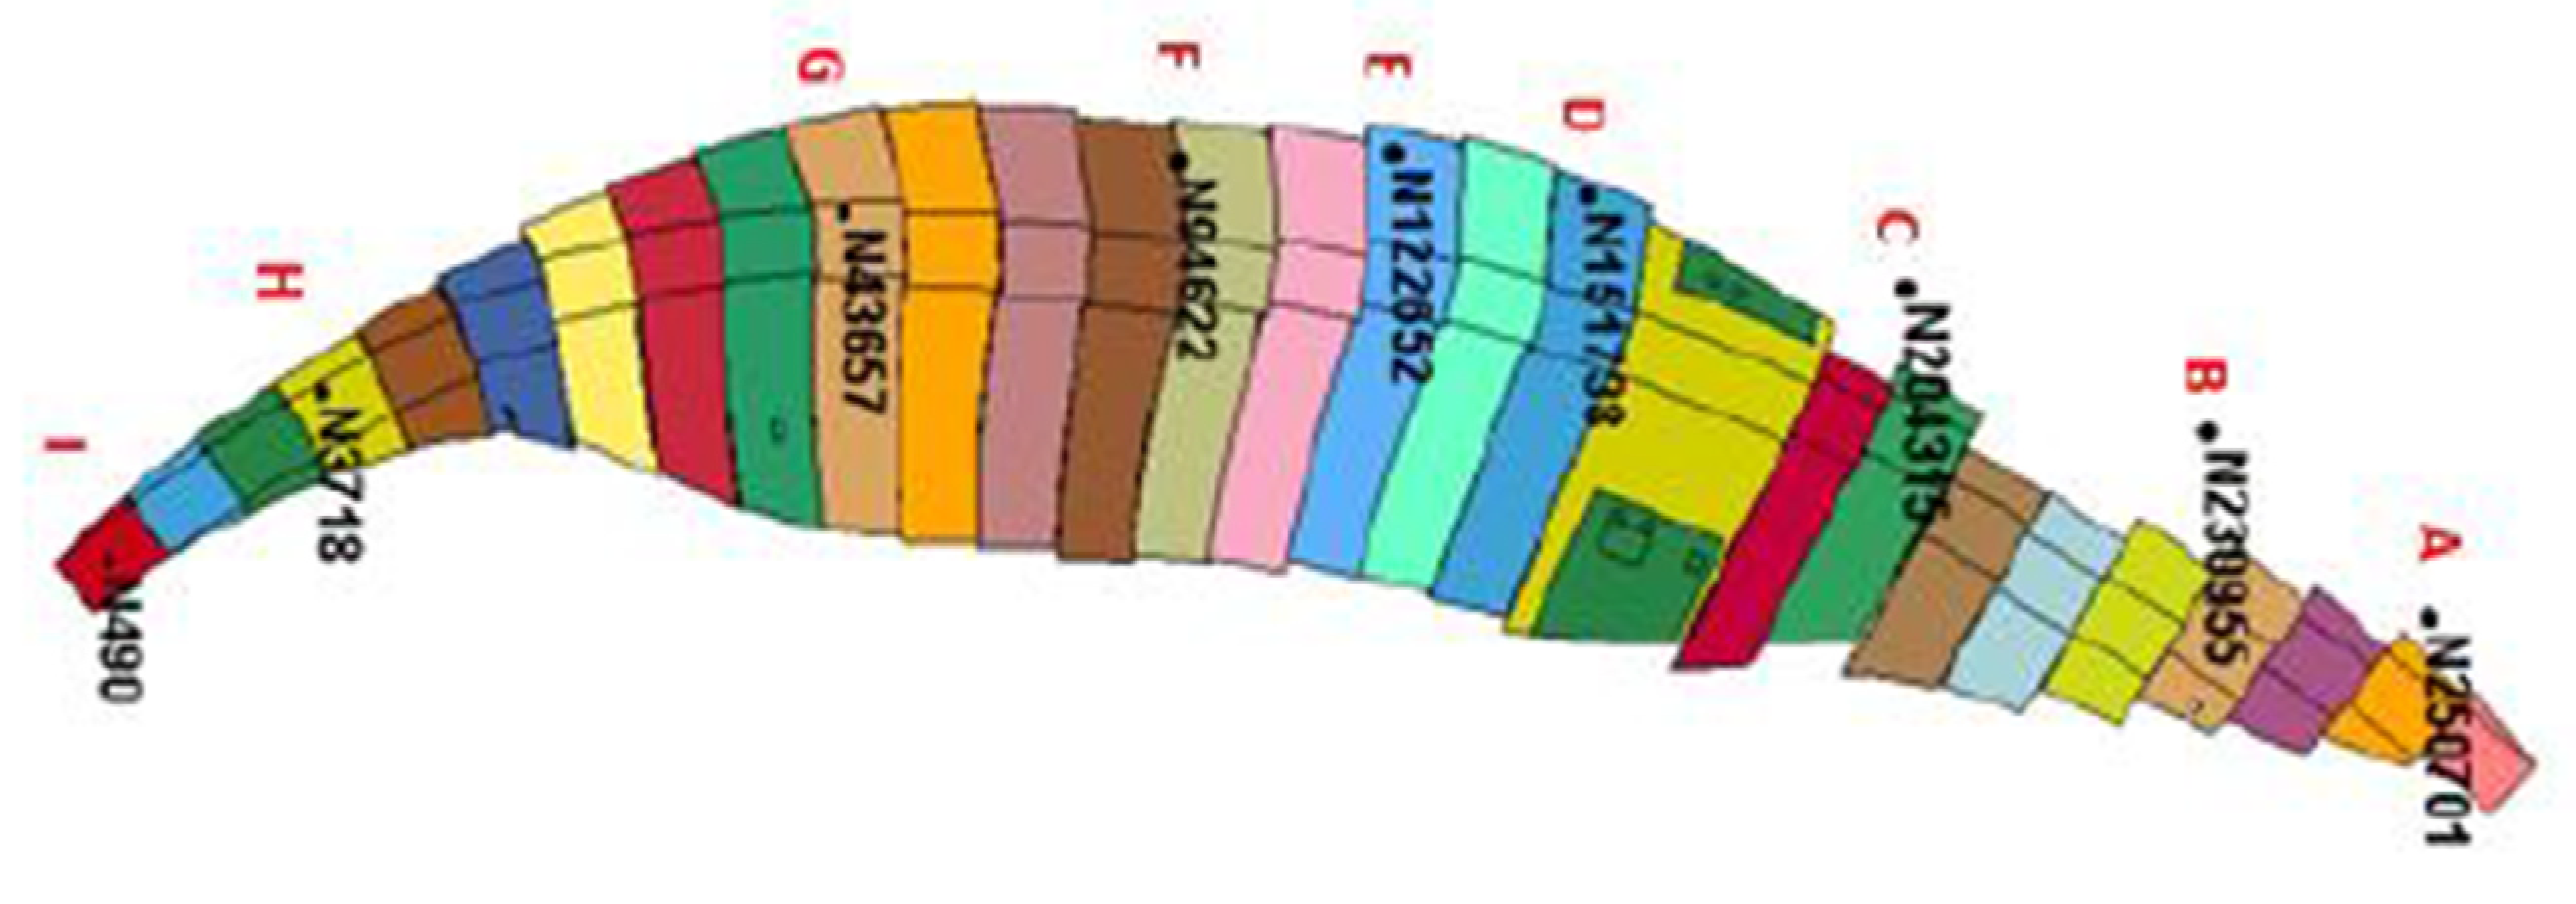
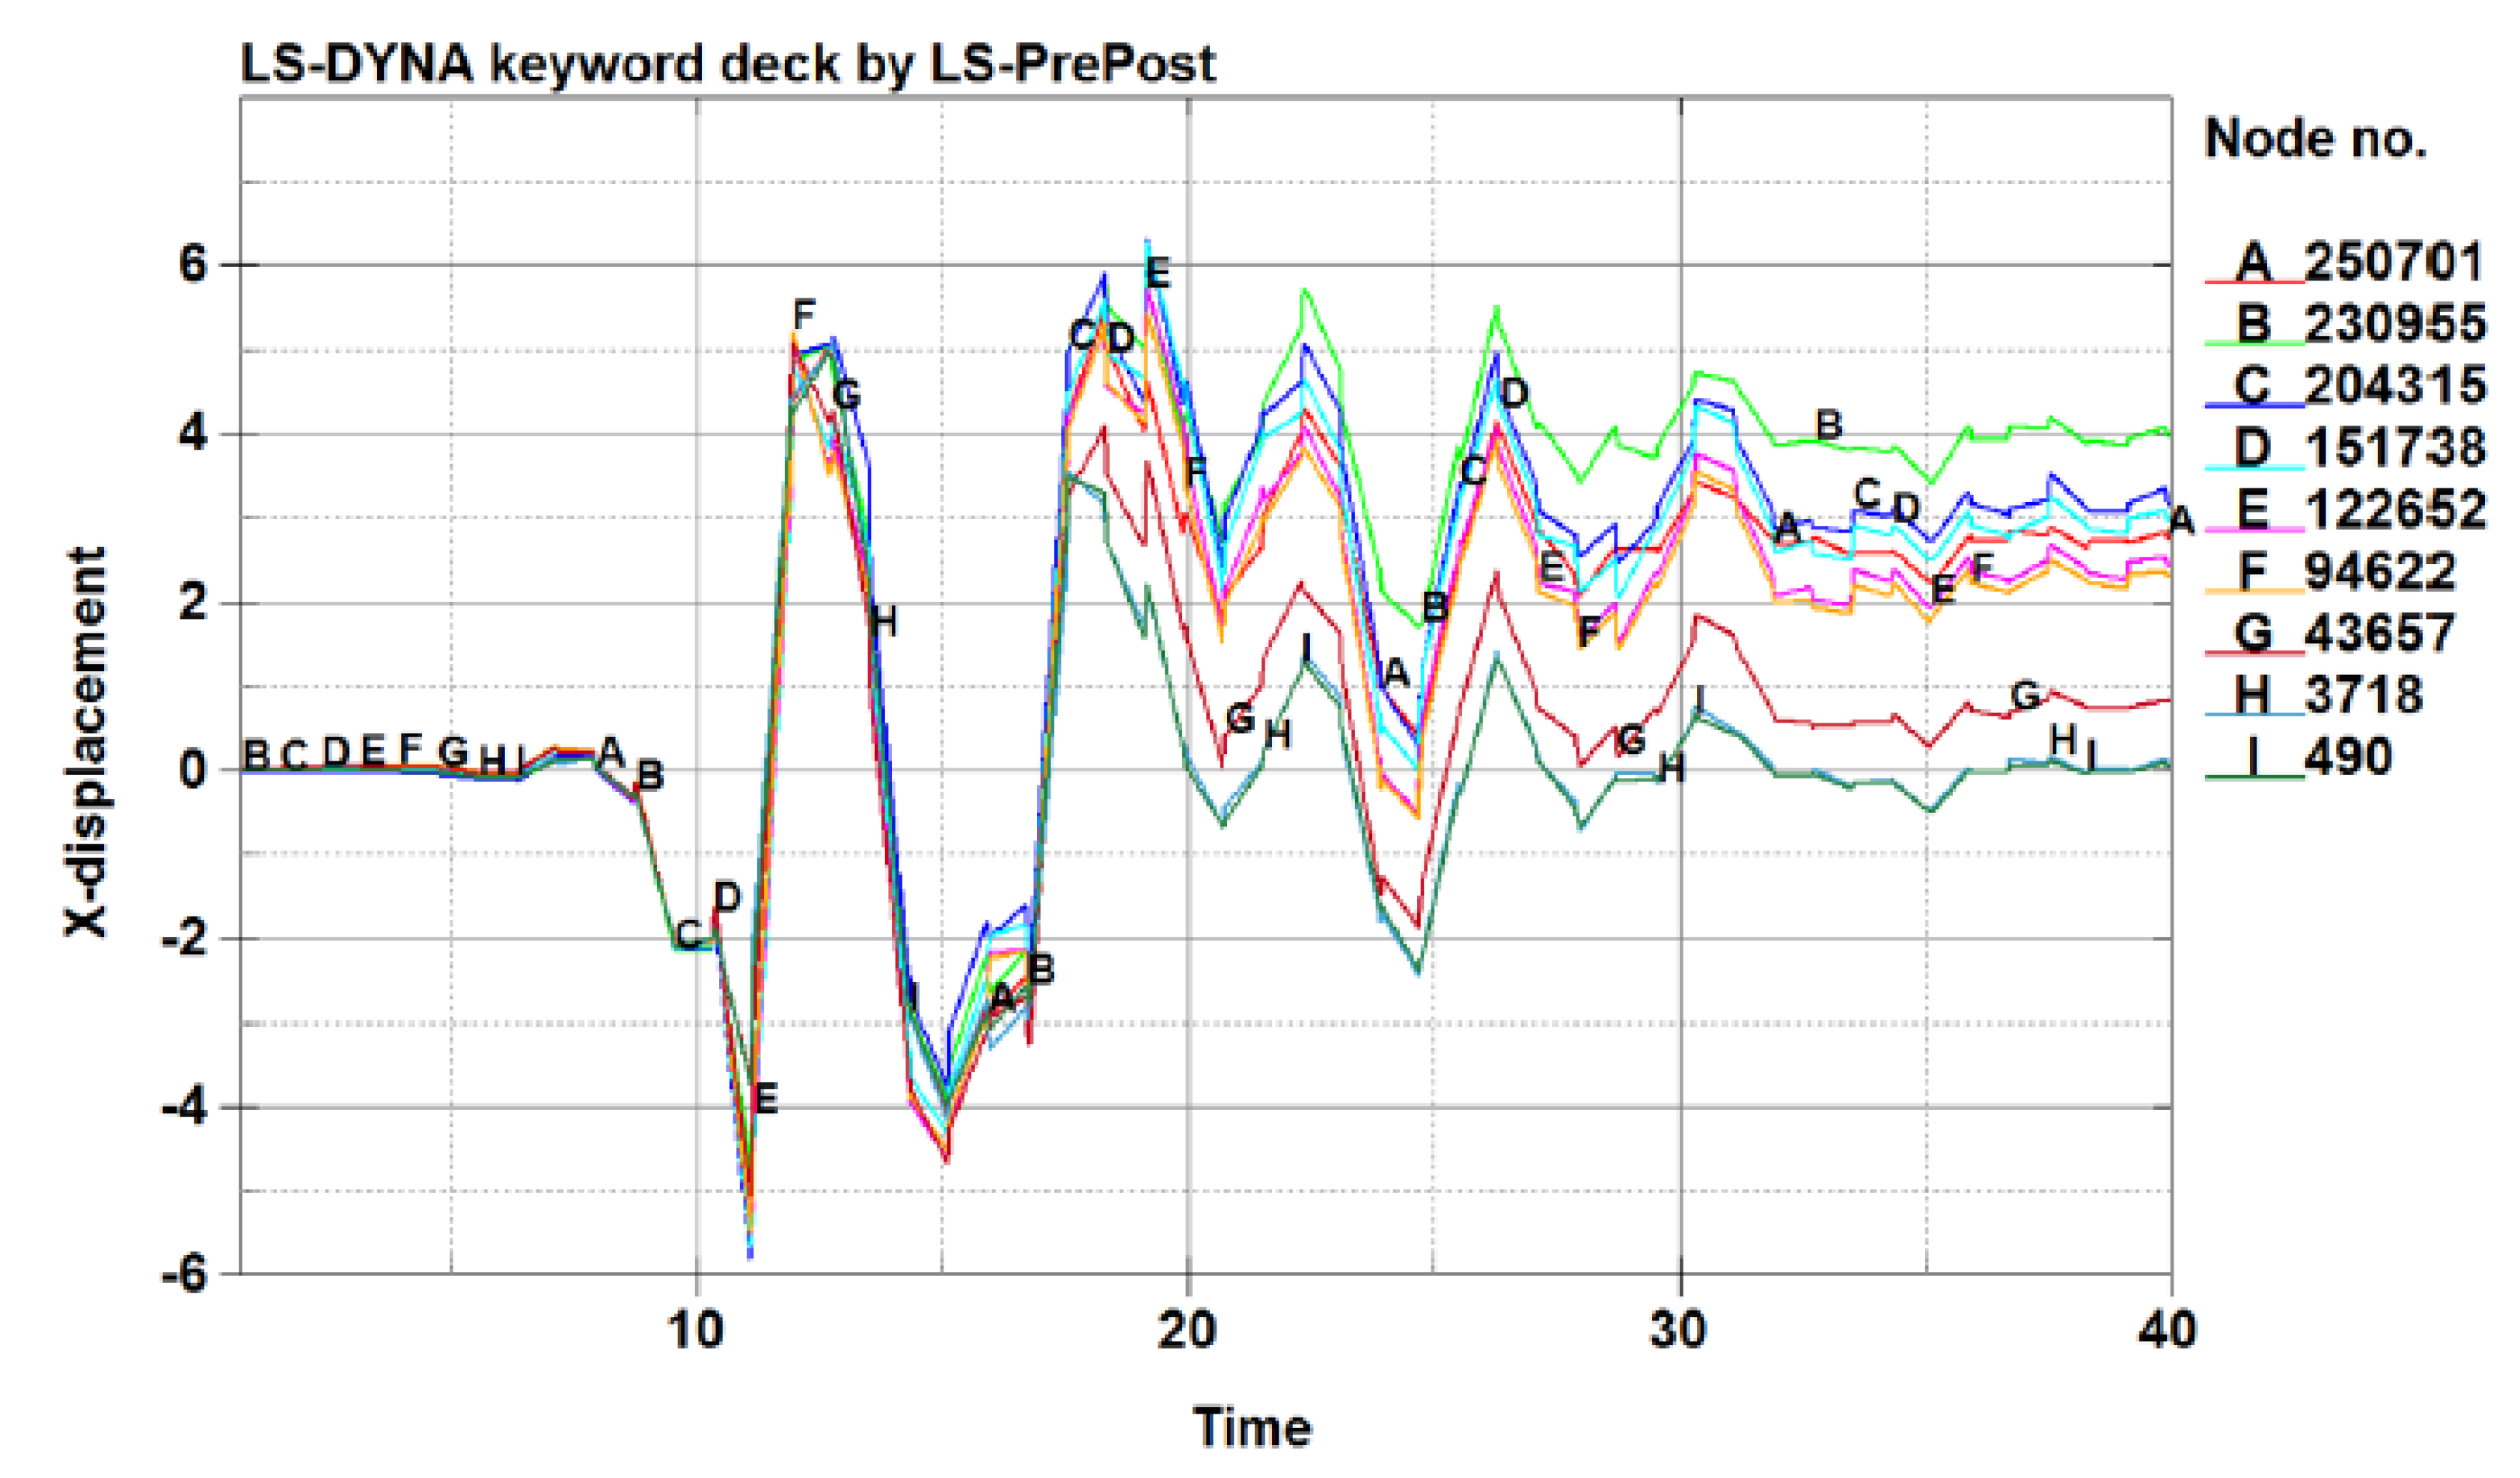
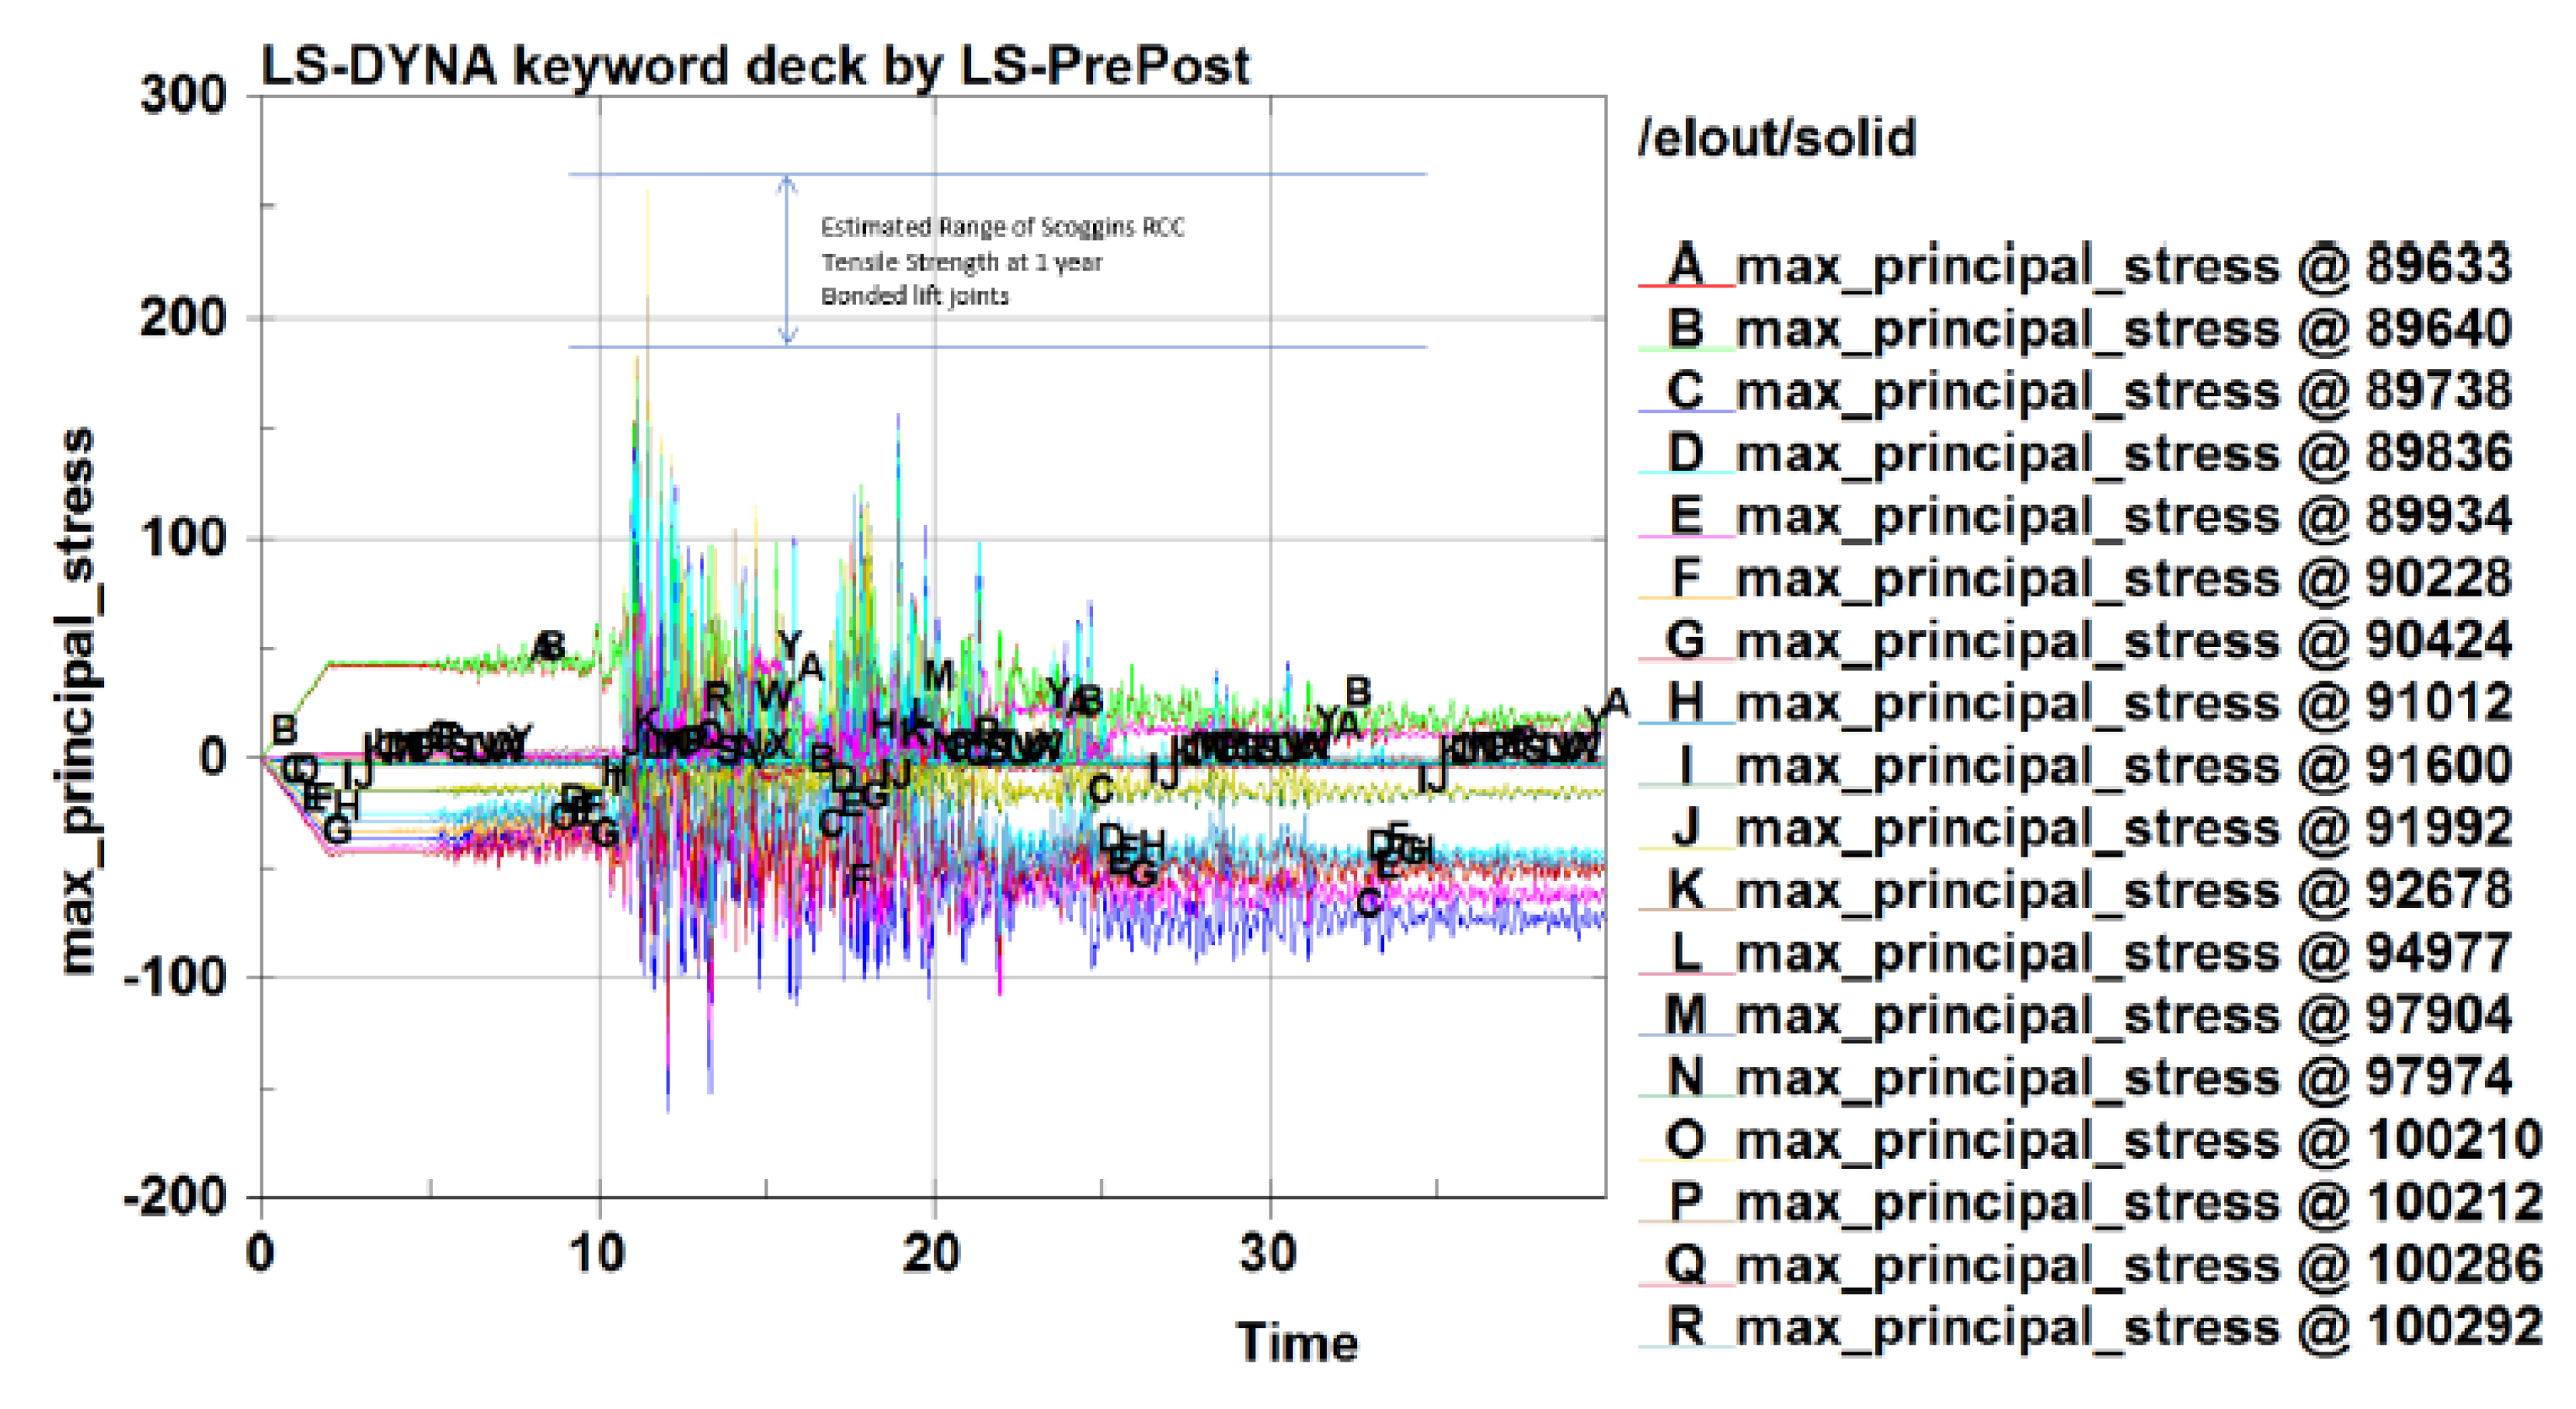
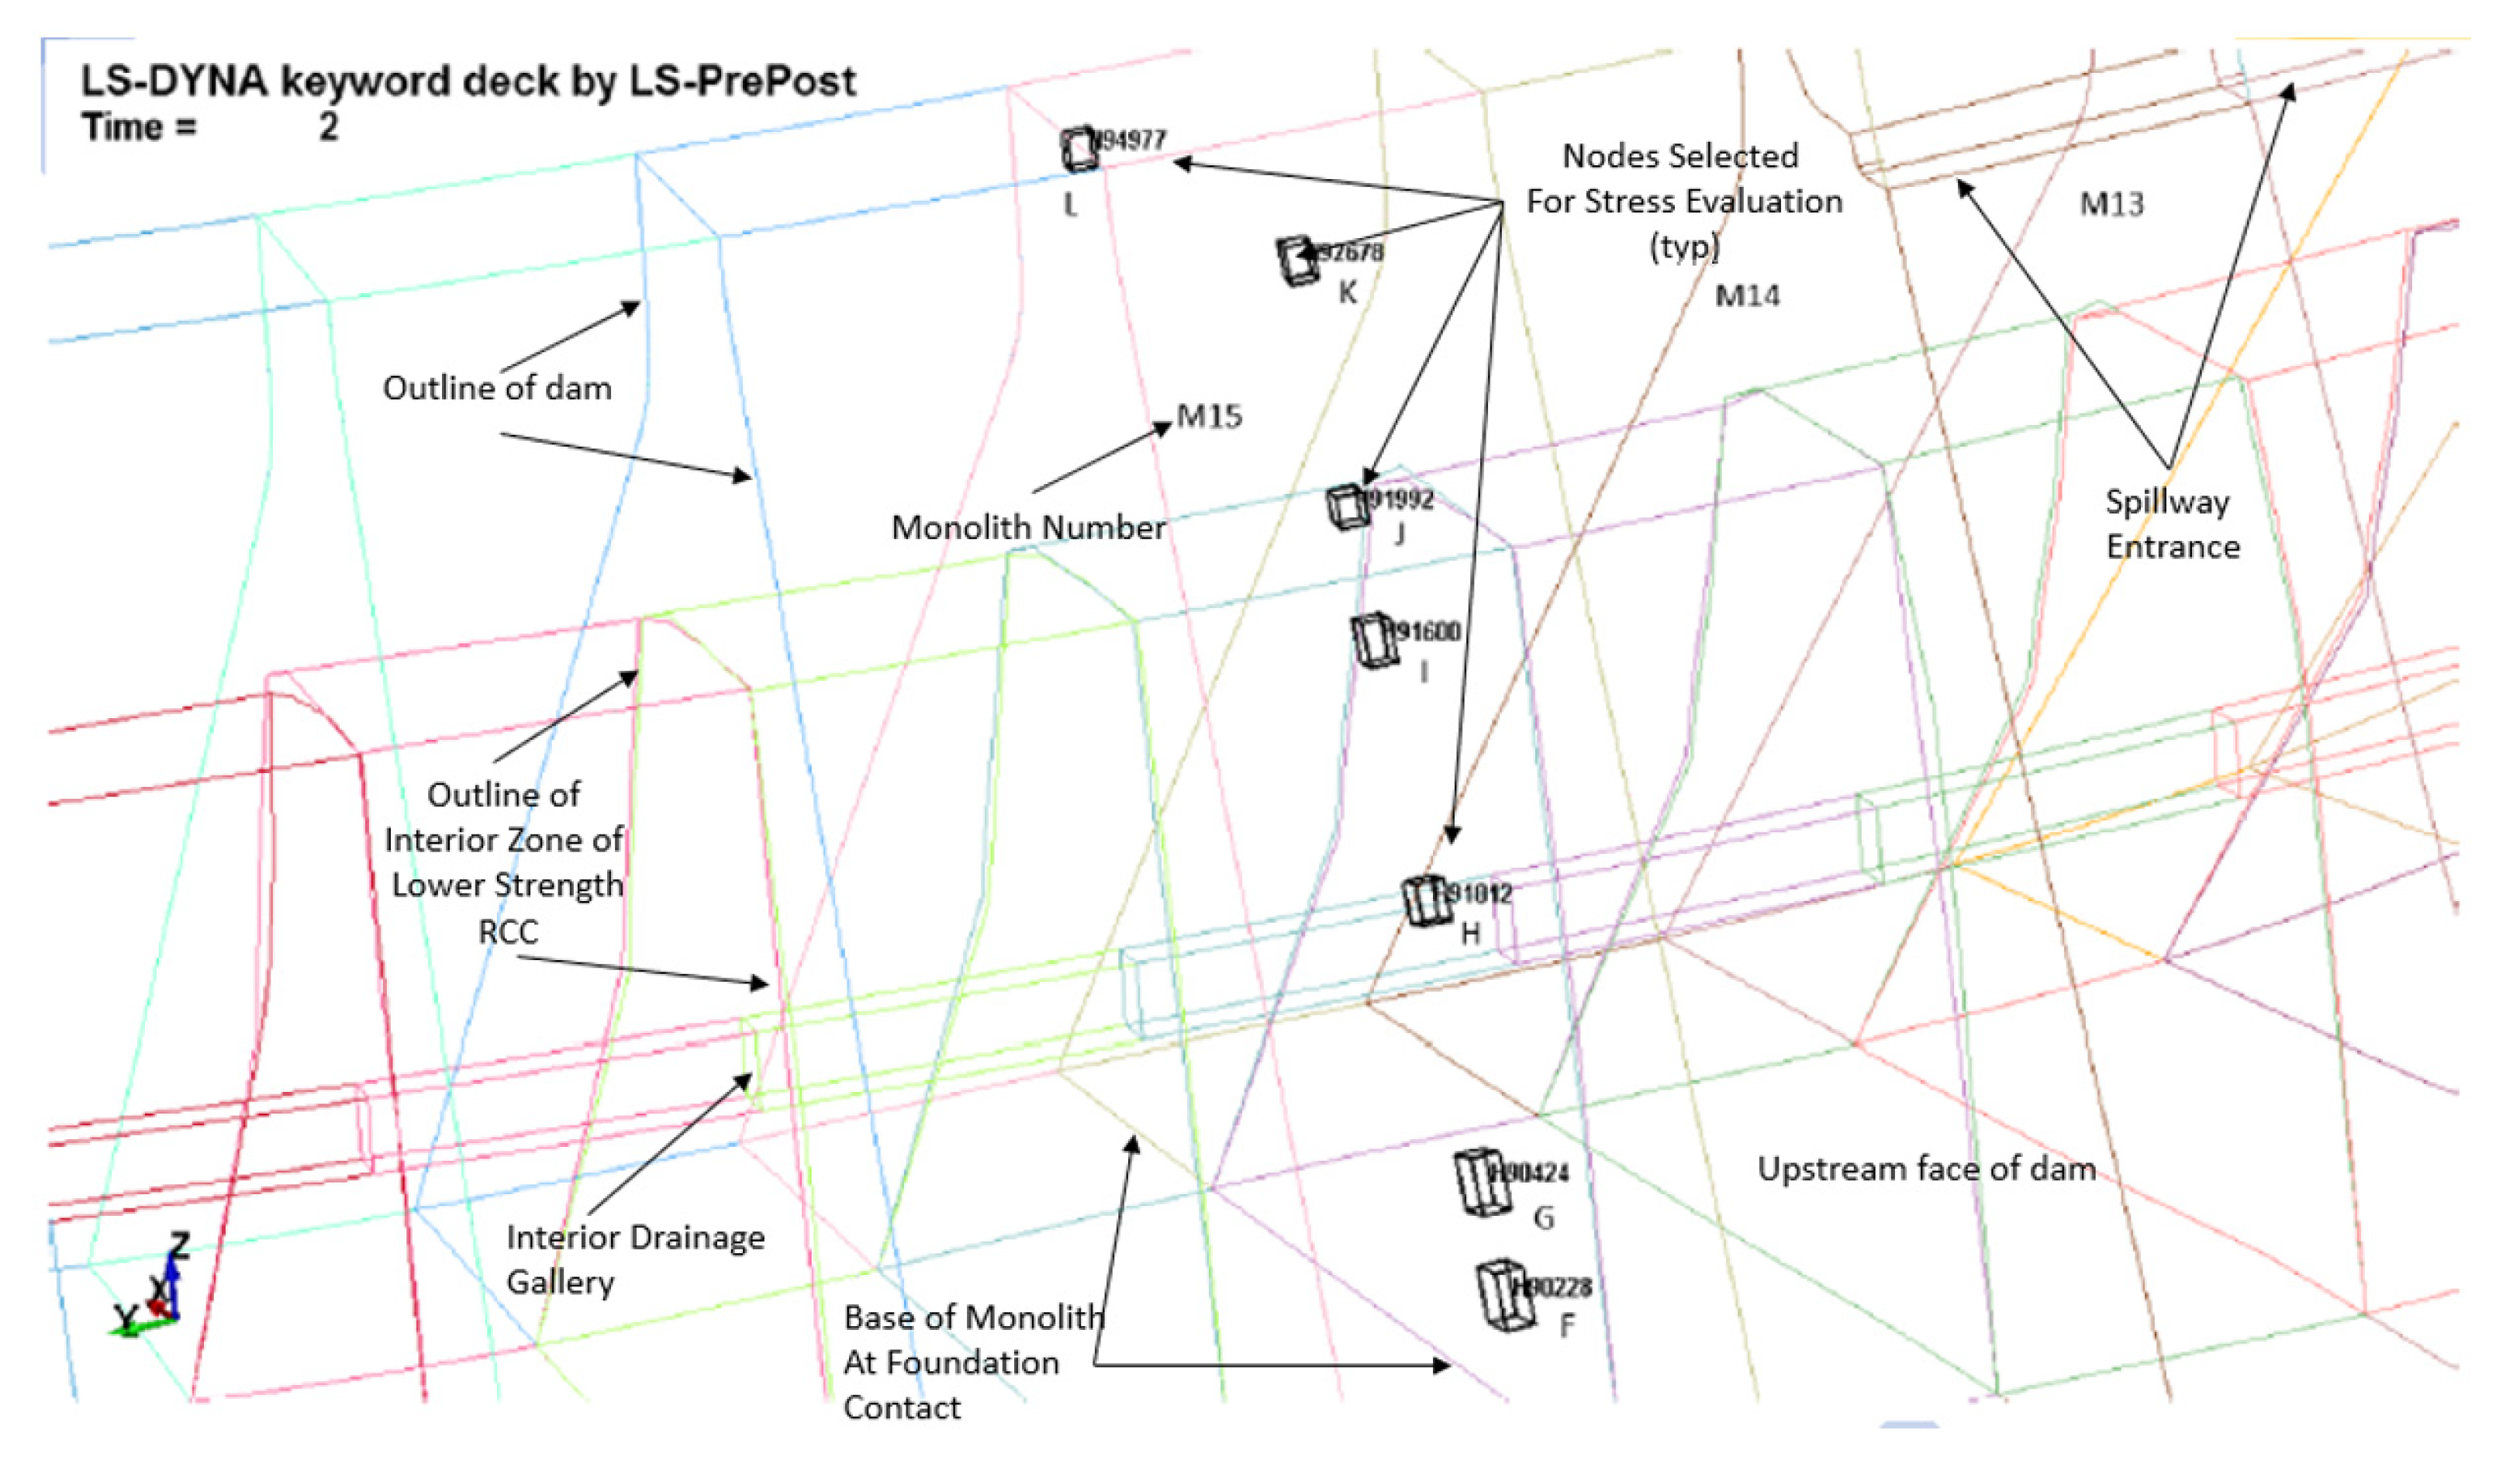
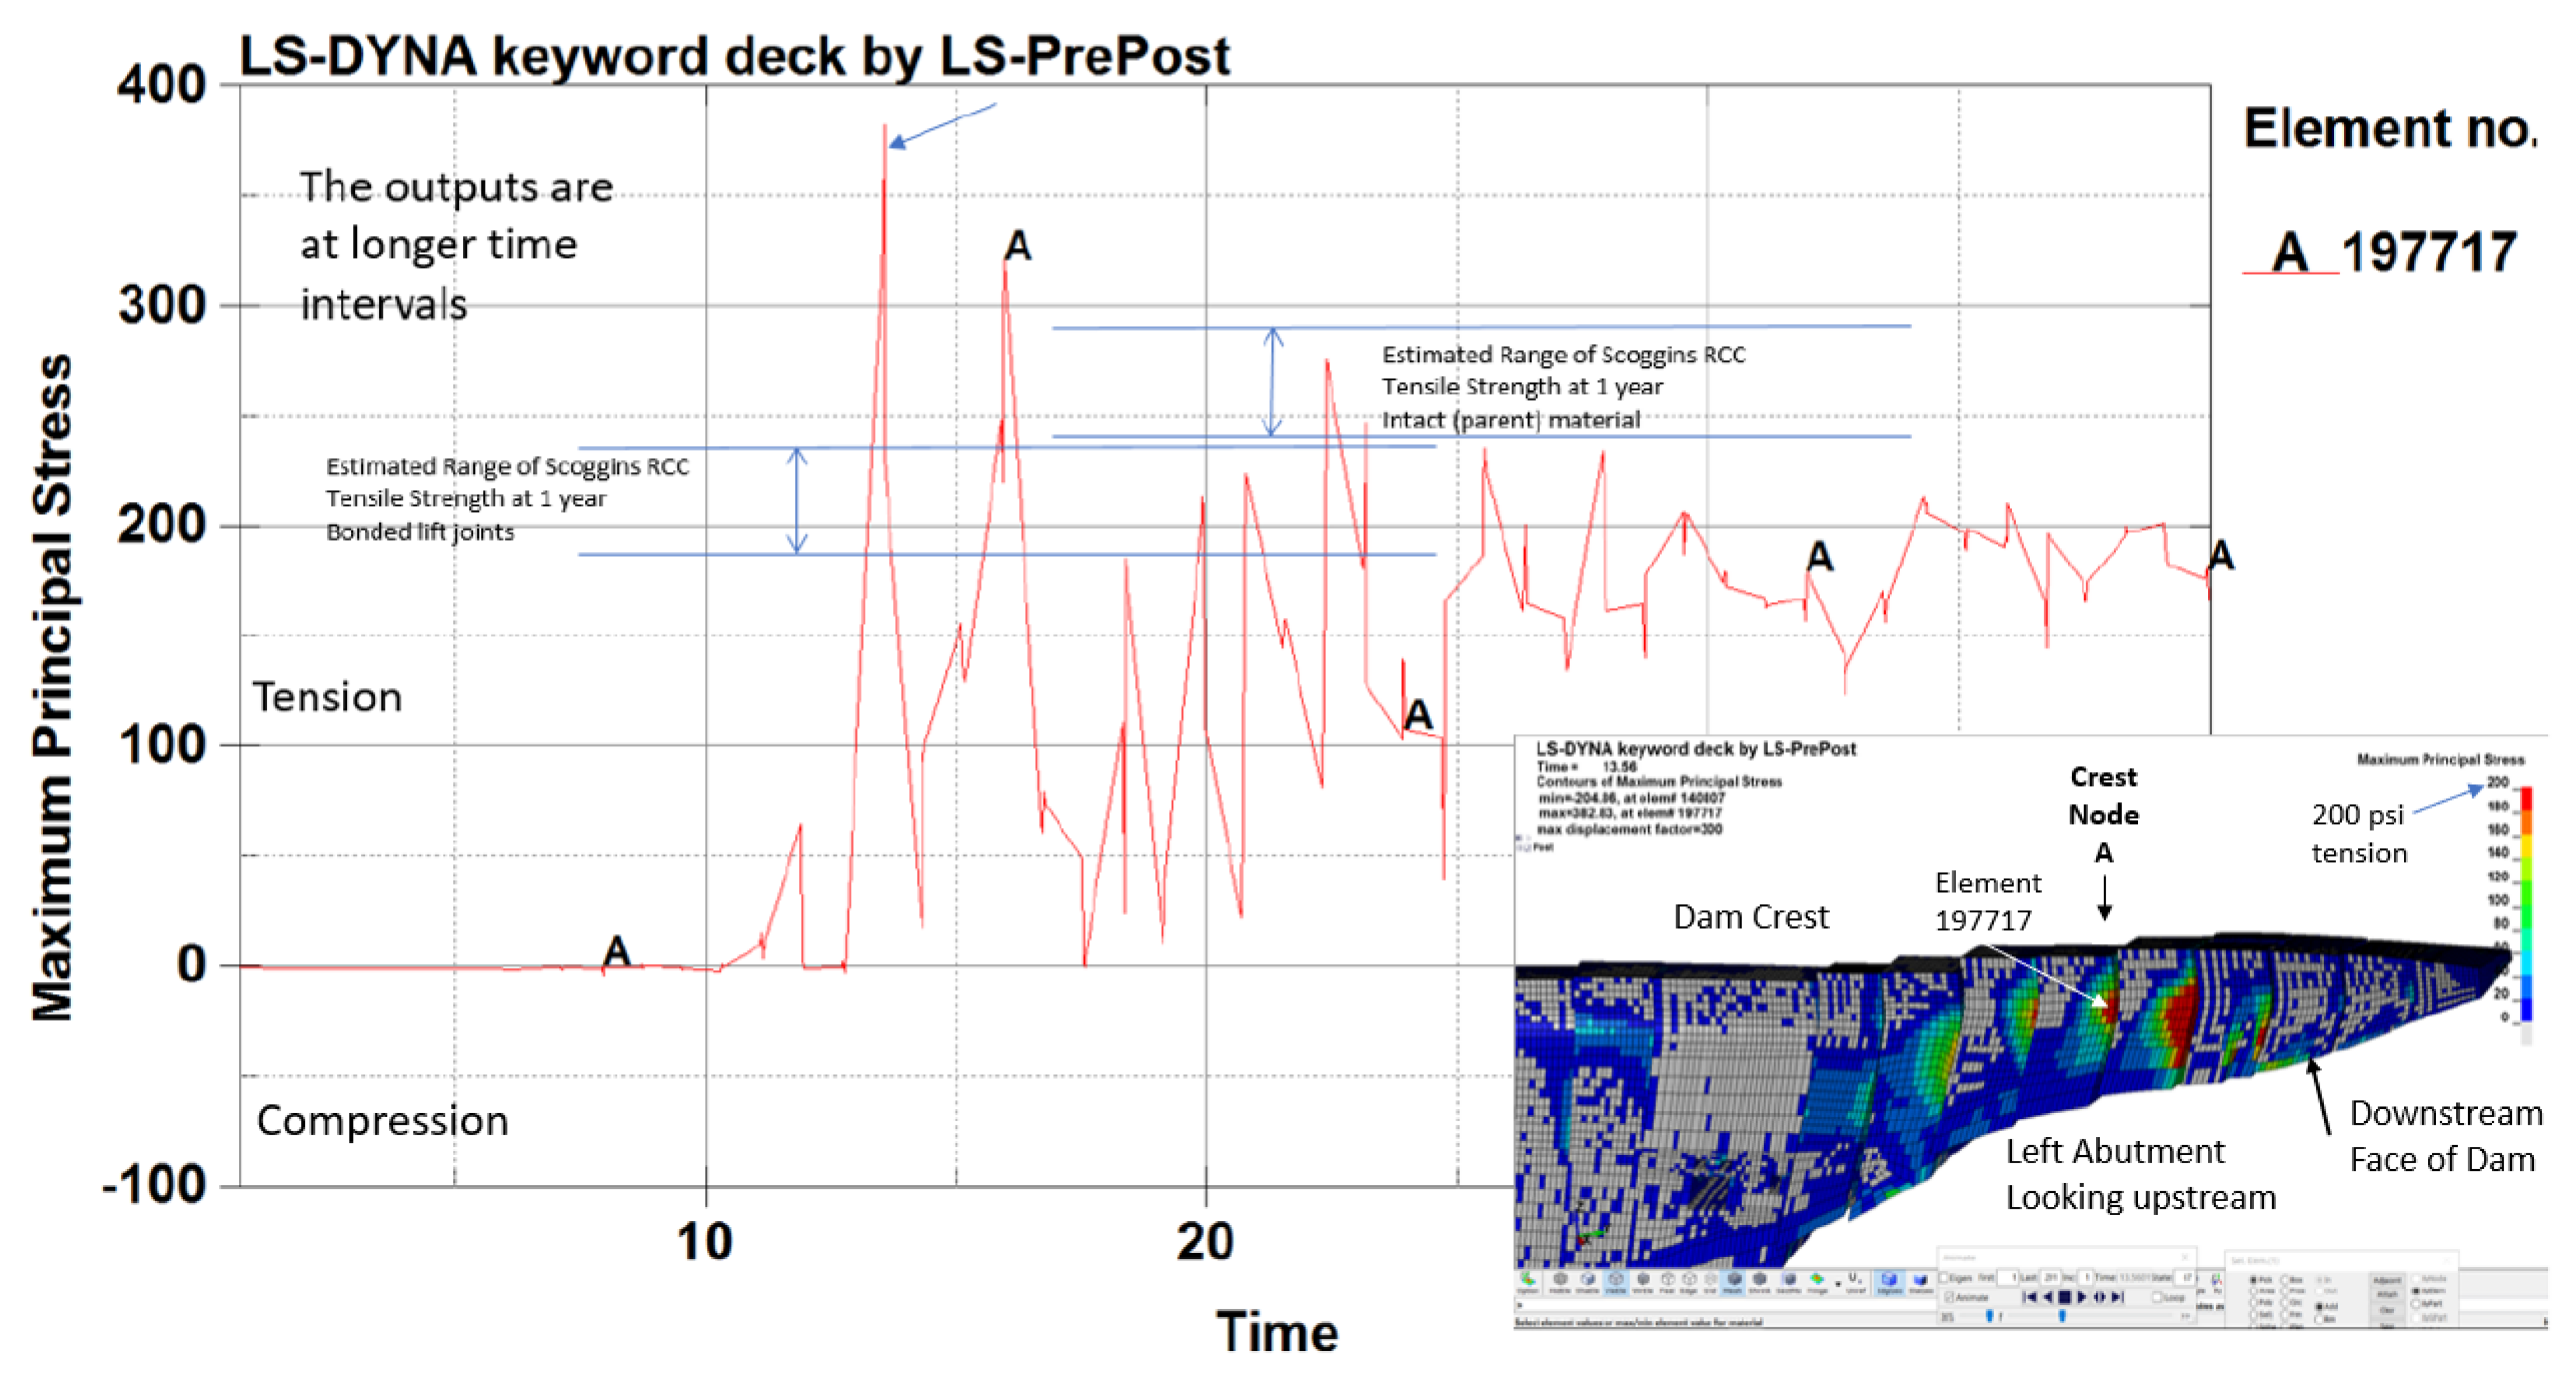
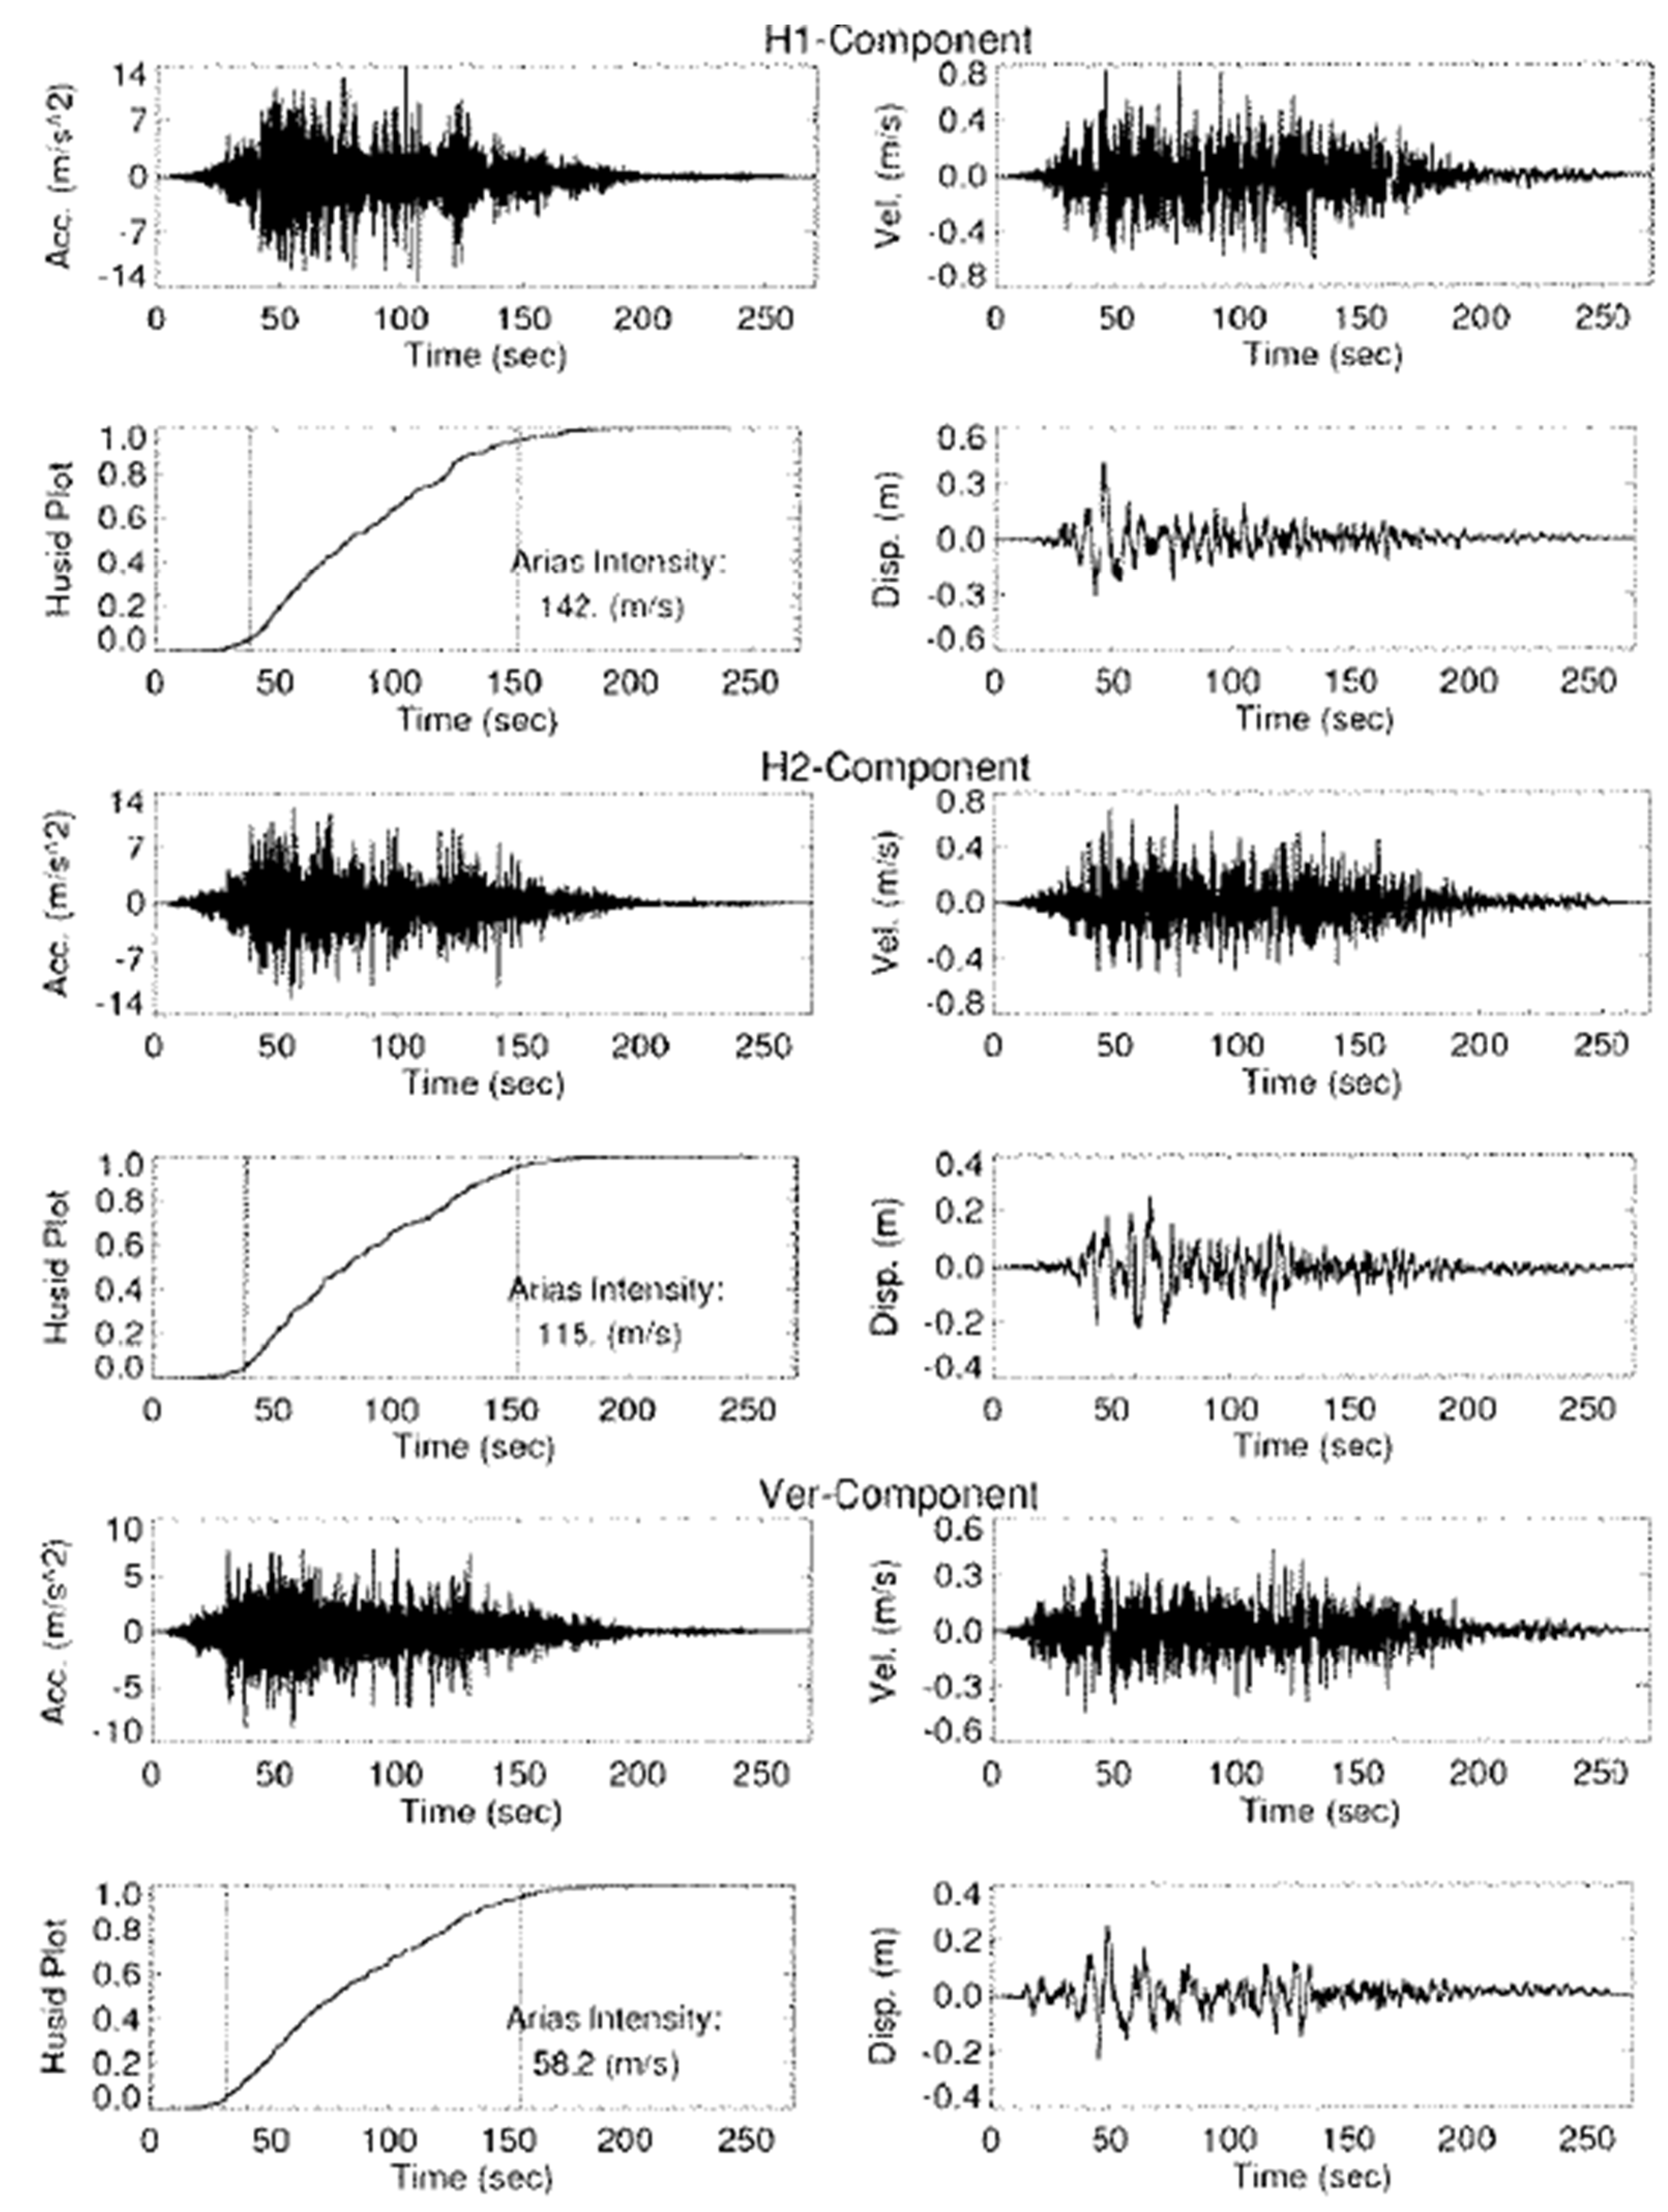
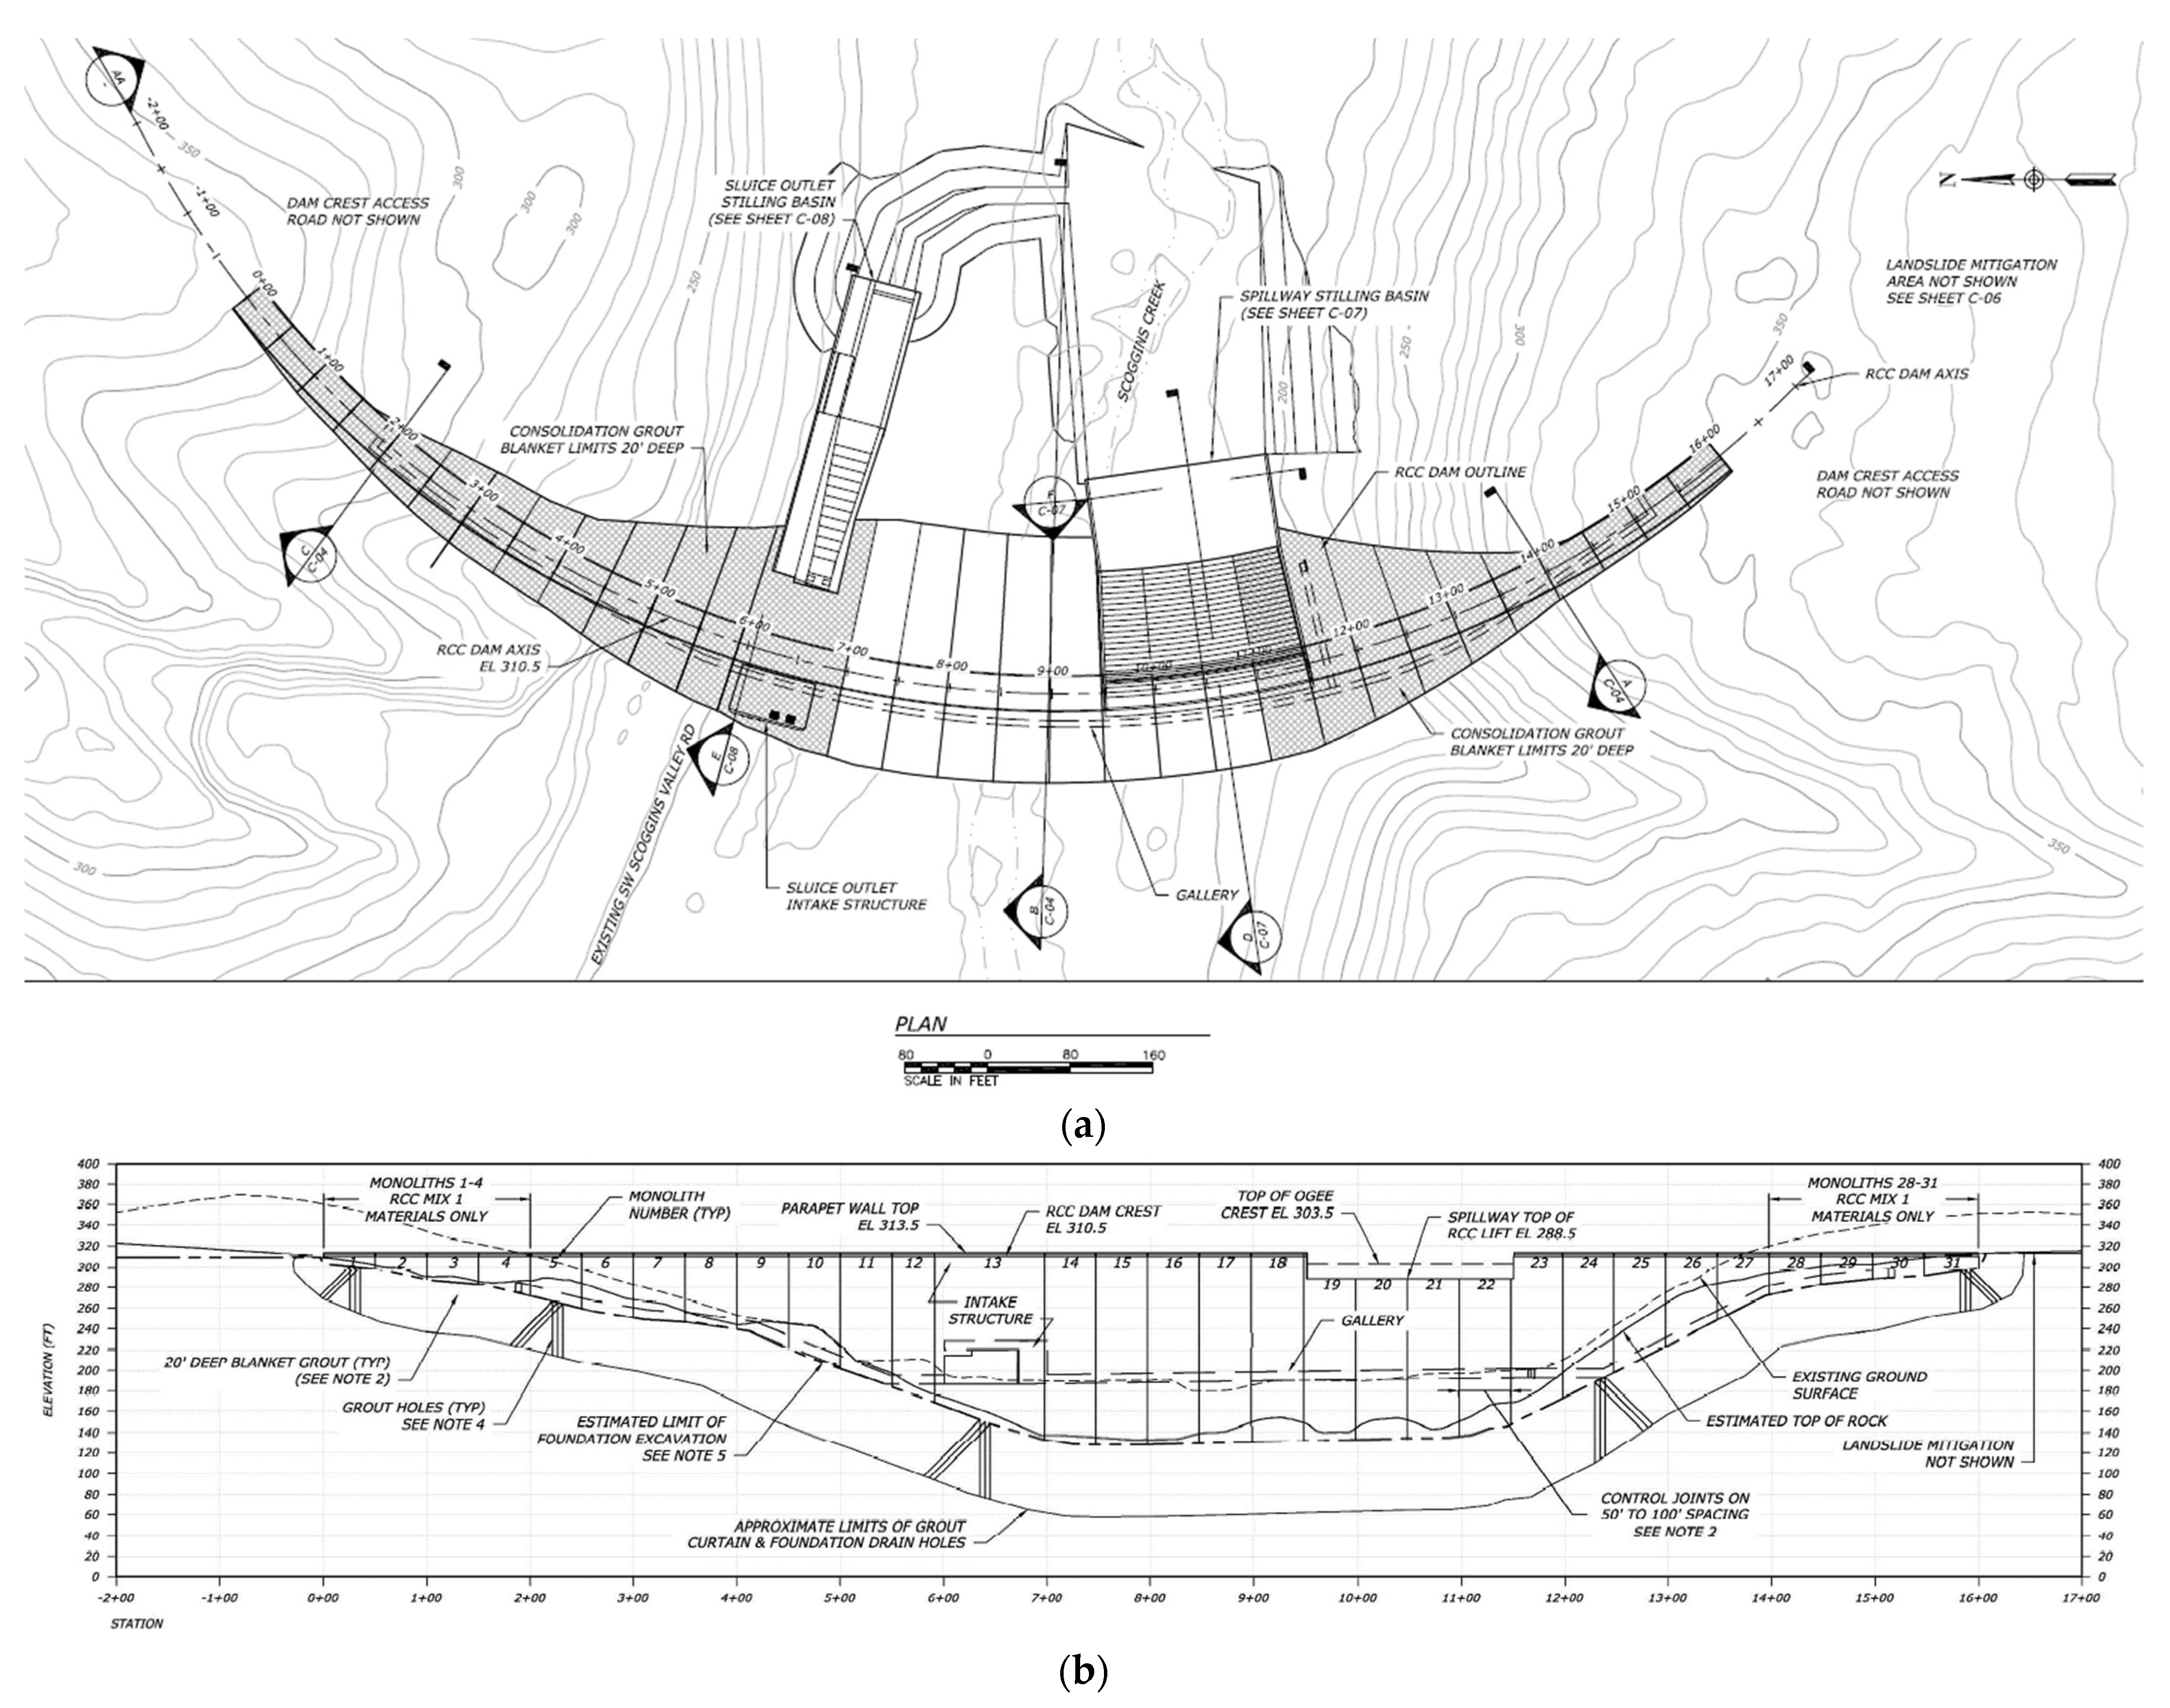
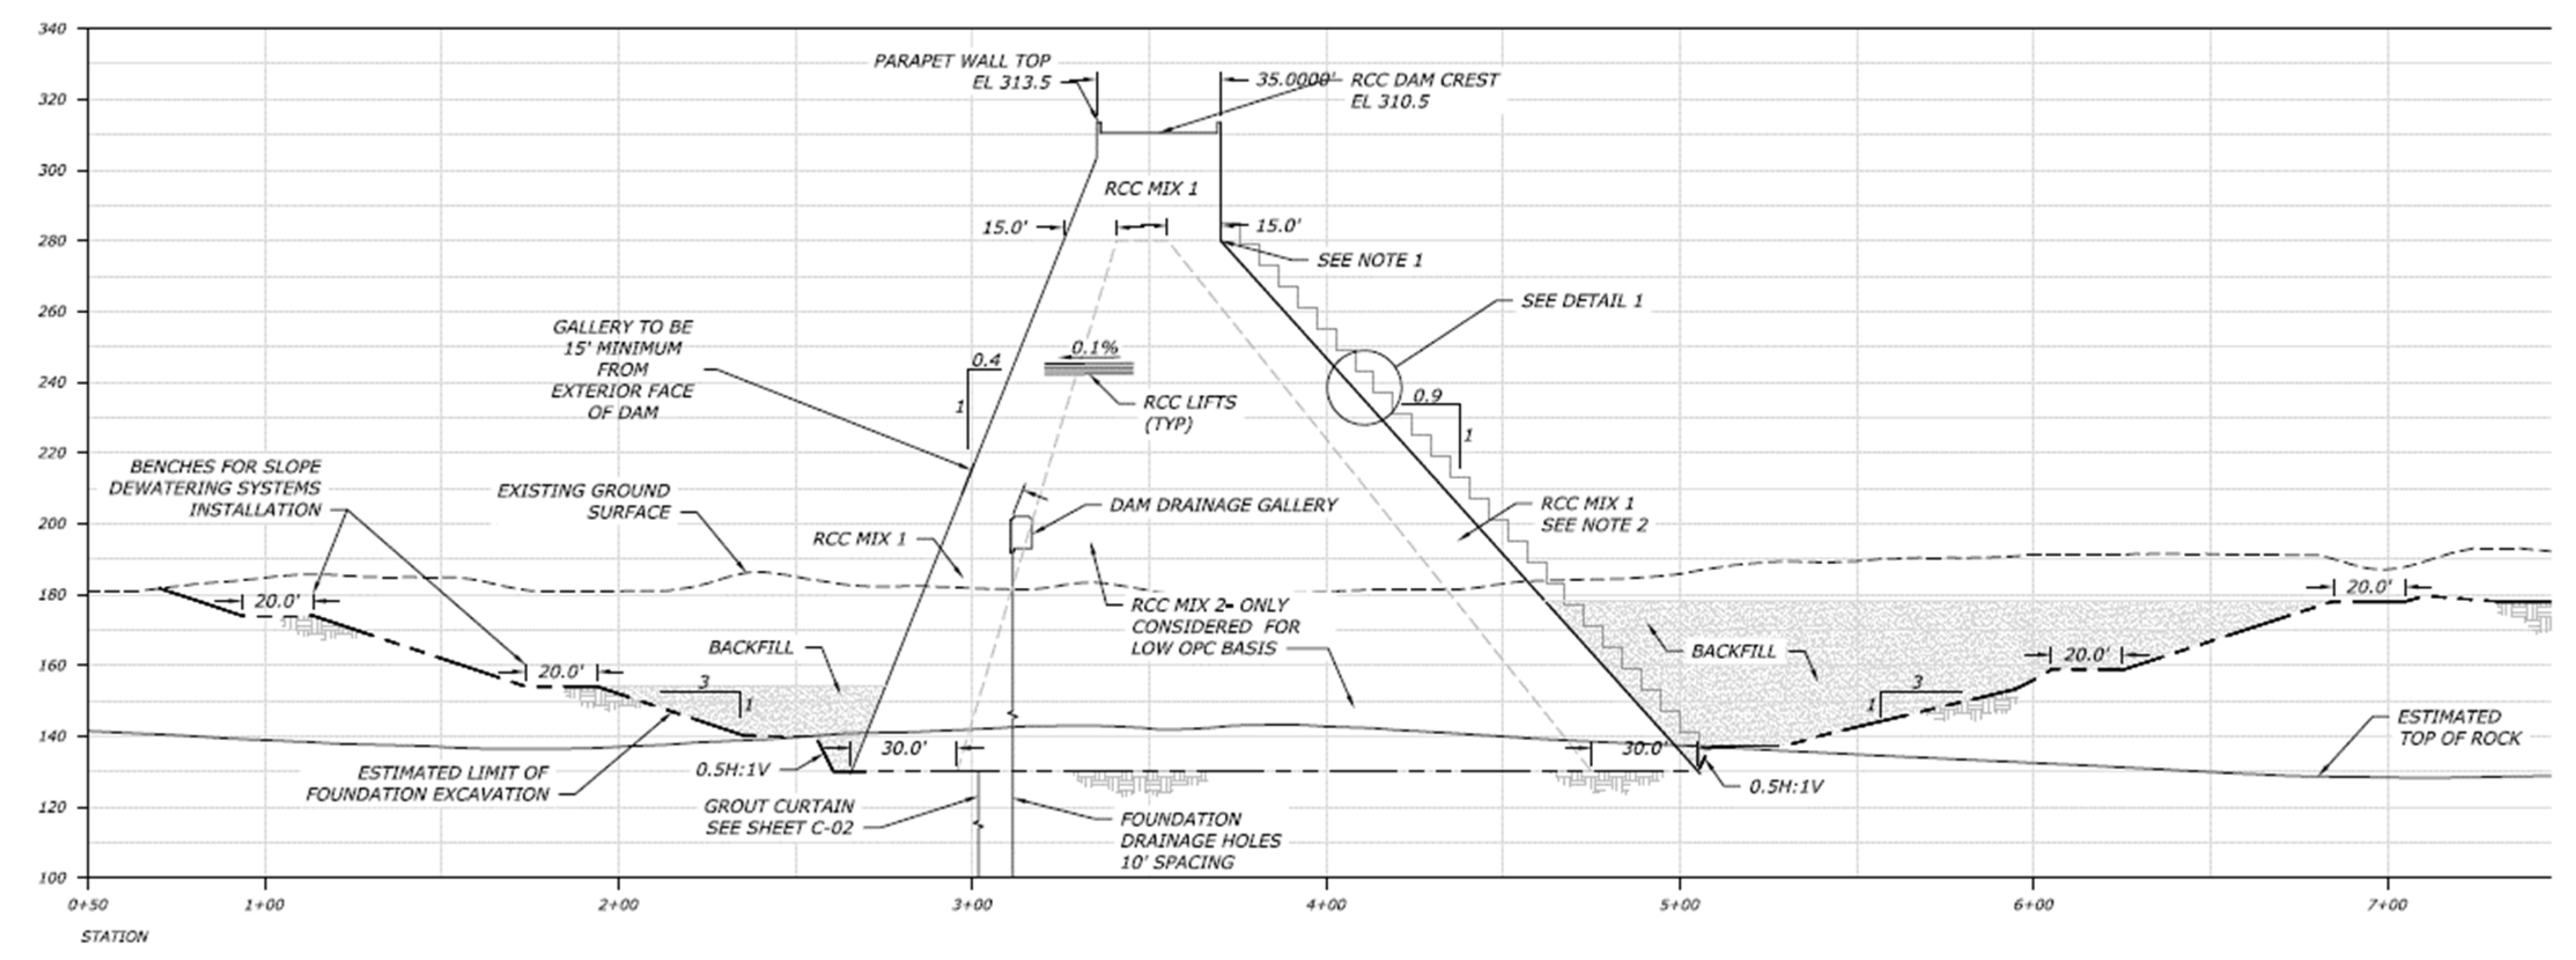
Table A1.
Summary of study cases using 3D model to support risk analysis.
| No. | Load Case Name | RCC Strength Parameters | Loading Conditions | Foundation Drain Efficiency | Comments | ||||||||
|---|---|---|---|---|---|---|---|---|---|---|---|---|---|
| Base Case 3 | Long-Term 4 | Post Earthquake 5 | Abutment Contact Strength Adjustment 6 | Gravity | Earthquake Recurrence Interval (yr.) | S.D. Motion MYG008 7 | L.D. Motion SRCH10 (SP) 8 | Post-Earthquake | Fully Operational, 65% | Non-Operational, Full Uplift 9 | |||
| 1 | Static—maximum normal reservoir | X | X | N/A | X | Model used to check damping response. Model also runs to failure by increasing fluid weight to inform risk analysis and failure mode description. Uplift pressure distribution based on 65% drain efficiency. | |||||||
| 2 | Static—PMF reservoir | X | X | N/A | X | ||||||||
| 3 | Static—PMF with degraded contact strength and uplift | X | N/A | X | Foundation/ RCC contact joint strength set at 40 degrees. Study case performed shows results of post-earthquake evaluations, indicating potential for dam movement for events with less than 1000-year return period. | ||||||||
| 4 | Seismic | X | 10,000 | X | X | Study case helped identify problems with the shape of the dam/foundation contact. All model runs subsequently completed with adjusted abutment contact strength. | |||||||
| 5 | Seismic | X | X | 10,000 | X | X | |||||||
| 6 | Seismic | X | X | 10,000 | X | X | Simulation performed to test an alternative non-linear concrete strength model. Not part of risk analysis simulations until further evaluation of study case 5 results is completed. | ||||||
| 7 | Seismic | X | X | 10,000 | X | X | |||||||
| 8 | Seismic/Post Earthquake | See Comment | X | X | 10,000 | X | X | X—during EQ | X—following EQ | Running model with phi = 35 and c = 100 as concrete shear strength degrading to phi = 35 and c = 0 once basal crack develops. These parameters used for full duration of EQ. Represents worst-case deformations for assumed loading conditions. Cracked monoliths at end of EQ represent post-EQ stability, with contact strength of 35 degrees and modified uplift with drains non-operational. | |||
| 9 | Seismic | X | X | 10,000 | X | X | Model run completed in 144 s, capturing majority of estimated deformations. Running with elastic element adjusted to have water properties for the reservoir portion of the model mesh. | ||||||
| 10 | Seismic | X | X | 50,000 | X | X | |||||||
| 11 | Seismic | X | X | 50,000 | X | X | |||||||
| 12 | Seismic/Post Earthquake | See Comment | X | X | X | 50,000 | X | X | X—during EQ | X-following EQ | Running model with phi = 35 and c = 100 as concrete shear strength degrading to phi = 35 and c = 0 once basal crack develops. These parameters used for full duration of EQ. Represents worst-case deformations for assumed loading conditions. Cracked monoliths at end of EQ represent post-EQ stability, with contact strength of 35 degrees and modified uplift with drains non-operational. | ||
| 14 | Seismic | X | X | 50,000 | X | X | |||||||
| 15 | Seismic | X | X | 5000 | X | X | |||||||
| 16 | Seismic | X | X | 5000 | X | X | |||||||
| 17 | Seismic/Post Earthquake | See Comment | X | X | 5000 | X | X | X—during EQ | X-following EQ | Running model with phi = 35 and c = 100 as concrete shear strength degrading to phi = 35 and c = 0 once basal crack develops. These parameters used for full duration of EQ. Represents worst-case deformations for assumed loading conditions. Cracked monoliths at end of EQ represent post-EQ stability, with contact strength of 35 degrees and modified uplift with drains non-operational. | |||
| 18 | Seismic | X | X | 5000 | X | X | |||||||
| 19 | Seismic | X | X | 1000 | X | X | |||||||
| 20 | Seismic | X | 1000 | X | X | ||||||||
Note(s): 3 For Base Case simulations, RCC strength based on zoned configuration with outer material having 1-year fc = 2400 psi and inner zone having 1-year fc = 1800 psi. Tensile strength assumed as 100 psi, cracked but undeformed surface with friction angle = 45 degrees and cohesion = 100 psi. 4 For long-term conditions, RCC strength modeled as tensile strength = 150 psi, and shear strength with friction angle = 55 deg. and cohesion = 150 psi. Cracked but undeformed surface with Friction angle = 45 degrees. 5 Post-EQ simulation run with basal joint friction angle only of 35 degrees. 6 Full uplift assuming inoperable drains corresponds to triangular uplift distribution from full reservoir head at upstream heal to tailwater at downstream toe. 7 S.D. is short-duration motion corresponding to Gales Creek Interslab rupture event that generated maximum dam response during appraisal design simulations. 8 L.D. is long-duration motion corresponding to Cascadia Subduction Zone rupture event. While long duration, motions represent short-period ground motion record that generated maximum dam response during appraisal design simulations. 9 Notes: c = cohesion, EQ = earthquake, fc = unconfined compressive strength, H = horizontal, N/A = not applicable, No. = Number, PMF = Probable Maximum Flood, pcf = pounds per cubic foot, phi = friction angle, psi = pound-force per square inch, RCC = Roller Compacted Concrete, SP = short period, V = vertical, yr. = year. The colored cells represent the different earthquake return intervals considered in the structural analyses.
Table A2.
Study cases of contact element strengths for 2D structural model analyses.
| Study Case No. | Base Contact Properties | Inclined Contact Properties | Lift Joint Properties | Comments on Contacts | ||||||
|---|---|---|---|---|---|---|---|---|---|---|
| Tensile Strength (Psi) | Shear Strength—Cohesion (psi) | Shear Strength—Friction Coefficient | Tensile Strength (psi) | Shear Strength—Cohesion (psi) | Shear Strength—Friction Coefficient | Tensile Strength (psi) | Shear Strength—Cohesion (psi) | Shear Strength—Friction Coefficient | ||
| 1 | 1 × 10²⁰ (tied) | 1 × 10²⁰ (tied) | 10.0 (tied) | 1 × 10²⁰ (tied) | 1 × 10²⁰ (tied) | 1 × 10²⁰ (tied) | 1 × 10²⁰ (tied) | 1 × 10²⁰ (tied) | 1 × 10²⁰ (tied) | All bonded |
| 2 | 1 × 10²⁰ (tied) | 1 × 10²⁰ (tied) | 1 × 10²⁰ (tied) | 250 | 250 | 1.0 | 150 | 150 | 1.0 | Bonded at the base |
| 3 | 100 | 100 | 1.0 | 250 | 250 | 1.0 | 150 | 150 | 1.0 | Typical strength, low |
| 4 | 150 | 150 | 1.43 | 250 | 250 | 1.0 | 250 | 250 | 1.0 | All high |
| 5 | 150 | 150 | 1.43 | 150 | 150 | 1.43 | 150 | 150 | 1.43 | Typical, long term |
| 6 | 100 | 100 | 1.00 | 1 × 10²⁰ (tied) | 1 × 10²⁰ (tied) | 1 × 10²⁰ (tied) | 1 × 10²⁰ (tied) | 1 × 10²⁰ (tied) | 1 × 10²⁰ (tied) | Sliding base only |
| 7 | 100 | 100 | 1.00 | 150 | 150 | 1.43 | 150 | 150 | 1.43 | Crest contacts high |
| 8 | 1 × 10²⁰ (tied) | 1 × 10²⁰ (tied) | 1 × 10²⁰ (tied) | 1 × 10²⁰ (tied) | 1 × 10²⁰ (tied) | 1 × 10²⁰ (tied) | 150 | 150 | 1.0 | Horizontal joint only |
| 9 | 1 × 10²⁰ (tied) | 1 × 10²⁰ (tied) | 1 × 10²⁰ (tied) | 150 | 150 | 1.43 | 150 | 150 | 1.0 | Cracked intact concrete friction on inclined joint |
| 10 | 1 × 10²⁰ (tied) | 1 × 10²⁰ (tied) | 1 × 10²⁰ (tied) | 150 | 150 | 1.0 | 1 × 10²⁰ (tied) | 1 × 10²⁰ (tied) | 1 × 10²⁰ (tied) | Bilinear crack strength at upstream |
Note(s): 1 × 1020 = Tied (Bonded) Contact. psi = pound-force per square inch, The colored cells represent the very high strength assumption applied to contact surfaces so they would function as “tied” and not enter non-linear behavior.
Table A3.
Summary of study case results for risk analysis—Columns 3 through 8 show estimated monolith downstream deformations in inches (feet)—MYG008 (short duration local/interslab ground motion). Column 2 shows the seismic load partition range used in the Risk Analysis for which the representative ground motion return period (shown in Column 1) was used to assess the performance of the dam.
| Representative Ground Motion Return Period | Applicable Load Partition Range (Years) | Study Case No. | Notes | ||||||
|---|---|---|---|---|---|---|---|---|---|
| Left Monoliths | Central Monoliths | Right Monoliths | Post-Earthquake | ||||||
| Base Material Properties | Long-Term Material Properties | Base Material Properties | Long-Term Material Properties | Base Material Properties | Long-Term Material Properties | Base Material Properties | |||
| 1000—year | 800 to 3000 | 0 (0) | 0 (0) | 0 (0) | FOS > 1.0 | Model behaves linearly, no base cracking or sliding. | |||
| 5000—year | 3000 to 8000 | 3–4 (0.25–0.33) | 0 (0) | 1–3 (0.08–0.25) | 0 (0) | 0 (0) | 0 (0) | ||
| 5000—year | 3000 to 8000 | 6–9 (0.5–0.75) 1 | 4–6 (0.33 to 0.5) 1 | 0–2.5 (0–0.21) 1 | FOS > 1.0 | Model base cracks with sliding in center valley and left abutment areas. Right abutment Monoliths 1–4 remained uncracked and undeformed, suggesting linear behavior. Worst case deformation estimate for residual friction angle of 35 degrees once contact is cracked. Post-EQ FOS > 1.0. | |||
| 10,000—year | 8000 to 25,000 | 6–9 (0.5–0.75) | 0 (0) | 3–5 (0.25–0.42) | 0 (0) | 1–3 (0.08–0.25) | 0 (0) | Results for Base Material Properties. | |
| 10,000—year | 8000 to 25,000 | 11–20 (0.92–1.67) | 12–15 (1–1.25) | 11–13 (0.92–1.08) | FOS > 1.0 | Model base cracks with sliding in center valley and left abutment areas. Right abutment Monoliths 1–4 remained uncracked and undeformed, suggesting linear behavior. Worst case deformation estimate for residual friction angle of 35 degrees once contact is cracked. Post-EQ FOS > 1.0. | |||
| 50,000—year | >25,000 | 11–14 (0.92–1.12) | 2.5–6 (0.2–0.5) | 7.5–10 (0.63–0.83) | −1–3 (−0.08–0.25) | 8–10 (0.67–0.83) | 0 (0) | Note Monolith M19 (outlet works) in lower left abutment moves total of 2.5 inches downstream. Differential movement between M19 and M20 < 9 inches. | |
| 50,000—year | >25,000 | 15–40 (1.25–3.33) | 18–26 (1.5–2.17) | 24–26 (2–2.17) | FOS > 1.0 | Model base cracks with sliding in center valley and left abutment areas. Right abutment Monoliths 1–4 remained uncracked and undeformed, suggesting linear behavior. Worst case deformation estimate for residual friction angle of 35 degrees once contact is cracked. Post-EQ FOS > 1.0. | |||
Note(s): 1 These estimated deformations are for case where earthquake was run with contact cohesion c = 100 psi but friction angle at residual strength (phi = 35 degrees) from the beginning of earthquake. Notes: FOS = Factor of Safety
Table A4.
Summary of study case results for risk analysis—Columns 3 through 8 show estimated monolith deformations in inches (feet)—SRCH10 (long duration CSZ ground motion). Column 2 shows the seismic load partition range used in the Risk Analysis for which the representative ground motion return period (shown in Column 1) was used to assess the performance of the dam.
| Representative Ground Motion Return Period | Applicable Load Partition Range (Years) | Study Case No. | Notes | ||||||
|---|---|---|---|---|---|---|---|---|---|
| Left Monoliths | Central Monoliths | Right Monoliths | Post-Earthquake FOS | ||||||
| Base Material Properties | Long-Term Material Properties | Base Material Properties | Long-Term Material Properties | Base Material Properties | Long-Term Material Properties | Base Material Properties | |||
| 1000—year | 800 to 3000 | 0 (0) | 0 (0) | 0 (0) | |||||
| 5000—year | 3000 to 8000 | +15 (1.25) | 5–9 (0.42–0.75) | 5–6 (0.42–0.5) | |||||
| 10,000—year | 8000 to 25,000 | 19–22 (1.58–1.83) | 10–24 (0.83–2) | 17–25 (1.42–2.08) | Model run to 144 sections of total 200-s duration. Deformations for time > 144 s expected to be minimal. Moreover, for this initial case, the foundation strength parameters at the contact were not adjusted to account for adverse (downstream sloping) excavation surface, so deformations in abutments are higher than expected when strong abutment adjustment is made. | ||||
| 50,000—year | >25,000 | 18–30 (1.5–2.5) | 18–51 (1.5–4.25) | 35 (2.92) | Displacements are at time = 144 s. | ||||
Note(s): FOS—Factor of Safety.
Table A5.
Summary of study case results for risk analysis—monolith stresses and damage estimated from 3D model—MYG008 (short duration local/interslab ground motion). Column 2 shows the seismic load partition range used in the Risk Analysis for which the representative ground motion return period (shown in Column 1) was used to assess the performance of the dam.
| Representative Ground Motion Return Period | Applicable Load Partition Range (Years) | Strength Assumptions 1 | Base Cracking Through | Representative Maximum Stress Condition—Monoliths | Monolith Contraction Joint Conditions Following Earthquake | Other Comments | ||||||||
|---|---|---|---|---|---|---|---|---|---|---|---|---|---|---|
| Left Monoliths | Central Monoliths | Right Monoliths | Monolith Number(s) | Estimated Maximum Tensile Stress Excursion Range (psi) 2 | Number of Excursions | Estimated Damage Condition through Monolith 3 | Monolith Contraction Joint Numbers 4 | Estimated Maximum Tensile Stress Adjacent to TCJ (psi) | Estimated Maximum Differential Movement (Inches) 5 | Estimated Damage to Monolith Contraction Joints | ||||
| 1000 | 800–3000 | BC | N | N | N | 19–20 | 190–210 (Z) 180–240 (P) | 2 3 | ND ND | 19–20 | 210 | 0 | ND | Dam in linear elastic range, monolith joints remaining in contact. |
| 5000 | 3000–8000 | BC | Y | Y | N | 24–25 | 190–380 (P) | 3 | OC | 22–23 | >242 | <2 inches (M21–M22) | LCI | |
| LT | N | N | N | 9 | 260–400 (P) | 3 | OC | 7–8, 8–9, 9–10 | 390–410 | 0 | LCI | |||
| PEQ | Y | Y | N | 15 | 125–150 (P) | 4 | ND | <5 inches (M21–M22) | LCI | |||||
| 10,000 | 8000–25,000 | BC | Y | Y | Y | 14 | 210–230 (P) | 3 | ND | 14–15, 15–16, | 200–230 | <5 inches (M21–M22) | ND | |
| LT | N | N | N | 14, 15 | 240–415 (P) | 3 | OC | 13–14, 14–15, 15–16, 16–17, 17–18 | 200–415 | 0 | LCI–MCI | |||
| PEQ | Y | Y | Y | 14, 15, 16 | 200–224 (P) | 1 | ND | 13–14, 14–15, 15–16, 20–21 | <240 | <8 inches (M21–M22) | ND | |||
| 50,000 | >25,000 | BC | Y | Y | Y | 4, 5, 6, 7, 20 | 240–500 (P) | 6 | LCI | 5–6, 6–7, 15–16, 16–17 | 250–500 | <9 inches (M19–25) and (M4–M9) | LCI—MCI | |
| LT | Y | Y | N | 14, 15, 16, 17 | 240–500 (P) | 9 | LCI-MCI | 15–16, 16–17, 17–18 | 240–500 | <3 inches (M4–M5) | LCI—MCI | |||
| PEQ | Y | Y | Y | 15, 16, 17 | 240–280 (P) | 3 | OC | 15–16, 16–17, 17–18 | 240–310 | <7 inches (M19–M25) | OC—LCI | |||
Note(s): 1 Basal Joint Strength Cases: Base Strength Case (BC): Dynamic tensile strength 100 psi, shear strength (intact/bonded joint) phi = 45 deg. c = 100 psi, un-bonded joint phi = 45 deg. c = 0 psi. Long-term Strength Case (LT): dynamic tensile Strength = 150 psi, Shear Strength (intact/bonded joint) phi = 55 deg. C = 155 psi, un-bonded joint phi = 55 deg. c = 0 psi. Post-earthquake Case (PEQ): phi = 35 deg. c = 0 psi. Intact RCC Materials (horizontal lifts): For USC = 2400 psi, intact dynamic tensile strength 234 psi, shear strength (intact bonded joint) phi = 45 deg. c = 100 psi, un-bonded joint phi = 45 deg. c = 0 psi. For USC = 1800 psi, intact dynamic tensile strength 192 psi, shear strength (intact bonded joint) phi = 45 deg. c = 100 psi, un-bonded joint phi = 45 deg. c = 0 psi. Intact RCC Materials (cross-lift shear): For USC = 2400 psi, intact dynamic tensile strength = 292 psi, shear strength (intact) phi = 55 deg. c = 155 psi, crack phi = 55 deg., c = 0 psi. For USC = 1800 psi, intact dynamic tensile strength = 242 psi, shear strength (intact) phi = 55 deg. c = 155 psi, crack phi = 55 deg. c = 0 psi. 2 (Z) vertical tensile stress for comparison to the horizontal lift surface dynamic tensile strength range of 192 to 234 psi. (P) is principal tensile stress for comparison to the intact RCC dynamic tensile strength range of 242 to 292 psi. 3 Expected Damage Categories: ND—No damage. OC—Onset of cracking. LCLL—Limited localized cracking along lift/joint line. LCI—Limited cracking/damage through Intact RCC crossing lift/joint lines. MCLL—Moderate cracking along lift/joint line; crack does not penetrate entire cross-section but may introduce some water pressures into the dam. MCI—Moderate localized cracking/damage of intact RCC crossing lift/joint lines. SCLL—Severe cracking along lift/joint line penetrating entire cross-section. SCI—Severe cracking/damage in larger area of dam cross-section. 4 Monolith Transverse Contraction Joint (TCJ) Numbers are indicated by the monolith numbers on each side of the joint. For example, CJ number 4–5 is the joint between monoliths M4 and M5. 5 Maximum differential is at end of earthquake.
Table A6.
Summary of study case results for risk analysis—monolith stresses and damage estimated from 3D model—SRCH10 (long duration CSZ ground motion). Column 2 shows the seismic load partition range used in the Risk Analysis for which the representative ground motion return period (shown in Column 1) was used to assess the performance of the dam.
| Representative Ground Motion Return Period | Applicable Load Partition Range (Years) | Strength Assumptions 1 | Base Cracking Through | Representative Maximum Stress Condition—Monoliths | Monolith Contraction Joint Conditions Following Earthquake | Other Comments | ||||||||
|---|---|---|---|---|---|---|---|---|---|---|---|---|---|---|
| Left Monoliths | Central Monoliths | Right Monoliths | Monolith Number(s) | Estimated Maximum Tensile Stress Excursion Range (psi) 2 | Number of Excursions | Estimated Damage Condition through Monolith 3 | Monolith Contraction Joint Numbers 4 | Estimated Maximum Tensile Stress Adjacent to TCJ (psi) | Estimated Maximum Differential Movement (Inches) 5 | Estimated Damage to Monolith Contraction Joints | ||||
| 1000 | 800–3000 | BC | N | N | N | 15 | 100–115 (P) | 4 (P) | ND | 12-13 | 0 | ND | ||
| 5000 | 3000–8000 | BC | Y | Y | Y | 15, 16 | 190–295 (P) | 3 (P) | ND—OC | 19-20 | 480–780 (P) | <8 inches (M21–M22) | LCI—MCI | |
| LT | ||||||||||||||
| PEQ | ||||||||||||||
| 10,000 | 8000–25,000 | BC | Y | Y | Y | 11, 12, 18, 19, 23, 24 | 200–380 (Z) 290–410 (P) | 1–5 (Z) 12 (P) | OC—LCI | 290–410 (P) | <10 inches (M21–M22) | LCI—MCI | ||
| LT | ||||||||||||||
| PEQ | ||||||||||||||
| 50,000 | >25,000 | BC | Y | Y | Y | 15 | 250–450 (P) | 13 | MCI | 6-7, 7-8 | 300–390 (P) | <10 inches (M6–M7, or M7–M8) | MCLL—MCI | |
| LT | ||||||||||||||
| PEQ | ||||||||||||||
Note(s): 1 Basal Joint Strength Cases: Base Strength Case (BC); Dynamic tensile strength 100 psi, shear strength (intact/bonded joint) phi = 45 deg., c = 100 psi, un-bonded joint phi = 45 deg. c = 0 psi. Long-term Strength Case (LT); dynamic tensile Strength = 150 psi, Shear Strength (intact/bonded joint) phi = 55 deg., c = 155 psi, un-bonded joint phi = 55 deg. c = 0 psi. Post-earthquake Case (PEQ); phi = 35 deg. c = 0 psi. Intact RCC Materials (horizontal lifts); For USC = 2400 psi, intact dynamic tensile strength 234 psi, shear strength (intact bonded joint) phi = 45 deg., c = 100 psi, un-bonded joint phi = 45 deg., c = 0 psi. For USC = 1800 psi, intact dynamic tensile strength 192 psi, shear strength (intact bonded joint) phi = 45 deg., c = 100 psi, un-bonded joint phi = 45 deg., c = 0 psi. Intact RCC Materials (cross-lift shear); For USC = 2400 psi, intact dynamic tensile strength = 292 psi, shear strength (intact) phi = 55 deg., c = 155 psi, crack phi = 55 deg., c = 0 psi. For USC = 1800 psi, intact dynamic tensile strength = 242 psi, shear strength (intact) phi = 55 deg., c = 155 psi, crack phi = 55 deg. c = 0 psi. 2 (Z) vertical tensile stress for comparison to the horizontal lift surface dynamic tensile strength range of 192 to 234 psi. (P) is principal tensile stress for comparison to the intact RCC dynamic tensile strength range of 242 to 292 psi. 3 Expected Damage Categories: ND—No damage. OC—Onset of cracking. LCLL—Limited localized cracking along lift/joint line. LCI—Limited cracking/damage through Intact RCC crossing lift/joint lines. MCLL—Moderate cracking along lift/joint line; crack does not penetrate entire cross-section but may introduce some water pressures into the dam. MCI—Moderate localized cracking/damage of intact RCC crossing lift/joint lines. SCLL—Severe cracking along lift/joint line penetrating entire cross-section. SCI—Severe cracking/damage in larger area of dam cross-section. 4 Monolith Transverse Contraction Joint (TCJ) Numbers are indicated by the monolith numbers on each side of the joint. For example, CJ number 4–5 is the joint between monoliths M4 and M5. 5 Maximum differential is at end of earthquake.
References
- U.S. Bureau of Reclamation. FAC 09-01 Directives and Standards for Cost Estimating. 15 October 2007. Available online: https://www.usbr.gov/recman/fac/fac09-01.pdf (accessed on 19 December 2022).
- Chopra, A. Earthquake analysis of arch dams: Factors to be considered. J. Struct. Eng. 2012, 138, 205–214. [Google Scholar] [CrossRef] [Green Version]
- Saouma, V.E.; Hariri-Ardebili, M.A. Aging, Shaking, and Cracking of Infrastructures: From Mechanics to Concrete Dams and Nuclear Structures; Springer-Nature: Cham, Switzerland, 2021. [Google Scholar]
- U.S. Bureau of Reclamation. Design of Gravity Dams; Technical Report; U.S. Bureau of Reclamation: Denver, CO, USA, 1976.
- U.S. Army Corps of Engineers. Gravity Dam Design; Technical Report EM 1110-2-2200; Department of the Army: Washington, DC, USA, 1995. [Google Scholar]
- Chopra, A.K. Earthquake Engineering for Concrete Dams: Analysis, Design, and Evaluation; John Wiley & Sons: Hoboken, NJ, USA, 2020. [Google Scholar]
- Priestly, M. Performance based seismic design. Bull. N. Z. Soc. Earthq. Eng. 2000, 33, 325–346. [Google Scholar] [CrossRef] [Green Version]
- Collins, K.R.; Wen, Y.K.; Foutch, D.A. Dual-level seismic design: A reliability-based methodology. Earthq. Eng. Struct. Dyn. 2016, 45, 1451–1471. [Google Scholar] [CrossRef]
- Sinković, N.L.; Brozovič, M.; Dolšek, M. Risk-based seismic design for collapse safety. Earthq. Eng. Struct. Dyn. 1996, 25, 1433–1467. [Google Scholar] [CrossRef]
- Cimellaro, G.P.; Renschler, C.; Bruneau, M. Introduction to resilience-based design (rbd). In Computational Methods, Seismic Protection, Hybrid Testing and Resilience in Earthquake Engineering; Springer International Publishing: Cham, Switzerland, 2015; pp. 151–183. [Google Scholar]
- Ramakrishnan, C.; Francavilla, A. Structural shape optimization using penalty functions. J. Struct. Mech. 1974, 3, 403–422. [Google Scholar] [CrossRef]
- Akbari, A. Sadoughi. Shape optimization of structures under earthquake loadings. Struct. Multidiscip. Optim. 2013, 47, 855–866. [Google Scholar] [CrossRef] [Green Version]
- Zhang, M.; Li, M.; Ma, X. Isogeometric shape optimization of high RCC gravity dams with functionally graded partition structure considering hydraulic fracturing. Eng. Struct. 2019, 179, 341–352. [Google Scholar] [CrossRef]
- Wang, Y.; Liu, Y.; Ma, X. Updated kriging-assisted shape optimization of a gravity dam. Water 2021, 13, 87. [Google Scholar] [CrossRef]
- Abdollahi, A.; Amini, A.; Hariri-Ardebili, M. An uncertainty–aware dynamic shape optimization framework: Gravity dam design. Reliab. Eng. Syst. Saf. 2022, 222, 108402. [Google Scholar] [CrossRef]
- Altarejos-Garcia, L.; Escuder-Bueno, I.; Serrano-Lombillo, A.; de Membrillera-Ortuno, M. Methodology for estimating the probability of failure by sliding in concrete gravity dams in the context of risk analysis. Struct. Saf. 2012, 36–37, 1–13. [Google Scholar] [CrossRef]
- Gardoni, P.; Murphy, C. A scale of risk. Risk Anal. 2014, 34, 1208–1227. [Google Scholar] [CrossRef] [PubMed]
- Ferguson, K.A. The History of Dam Safety Governance including Risk Analysis in the US. In Proceedings of the FEMA National Dam Safety Program Technical Webinar, Online, 16–19 February 2021. [Google Scholar]
- Casagrande, A. Role of the “Calculated Risk” in Earthwork and Foundation Engineering, The Terzaghi Lecture. J. Soil Mech. Found. Div. Proc. Am. Soc. Civ. Eng. 1965, 4, 1–40. [Google Scholar]
- Jimmy Carter, Memorandum to the Heads of Certain Federal Agencies on Dam Safety, 23 April 1977, Online by Gerhard Peters and John T. Woolley, The American Presidency Project. Available online: https://www.presidency.ucsb.edu/node/243672 (accessed on 19 December 2022).
- Public Law 95-578 Reclamation Dam Safety Act. 2 November 1978. Available online: https://www.usbr.gov/ssle/sodactasamended.pdf (accessed on 19 December 2022).
- Executive Order 12148, FEMA and the National Dam Safety Program. Available online: https://fas.org/agency/dhs/fema/EO12148.htm (accessed on 19 December 2022).
- Association of State Dam Safety Officials. FEMA P-93, Federal Guidelines for Dam Safety; ASDSO: Lexington, KY, USA, 1979. [Google Scholar]
- Whitman, R.V. Evaluating Calculated Risk in Geotechnical Engineering. ASCE J. Geotech. Eng. 1984, 110, 143–188. [Google Scholar] [CrossRef]
- U.S. Bureau of Reclamation. Guidelines for Achieving Public Protection in Dam Safety Decision Making; U.S. Department of Interior, Bureau of Reclamation: Denver, Colorado, USA, 1997.
- Department of the Army, U.S. Army Corps of Engineering. Safety of Dams—Policy and Procedures; ER 1110-2-1156; Department of the Army: Washington, DC, USA, 2011. [Google Scholar]
- Tennessee Valley Authority. TVA-SPP-27.0 Dam Safety; Tennessee Valley Authority: Knoxville, TN, USA, 2011. [Google Scholar]
- Federal Emergency Management Agency. Federal Guidelines for Dam Safety Risk Management; P-1025; FEMA: Washington, DC, USA, 2015. [Google Scholar]
- Federal Energy Regulatory Commission. Dam Safety Regulations; Federal Energy Regulatory Commission: Washington, DC, USA, 2021. [Google Scholar]
- Hariri-Ardebili, M. Risk, reliability, resilience (R3) and beyond in dam engineering: A state-of-the-art review. Int. J. Disaster Risk Reduct. 2018, 31, 806–831. [Google Scholar] [CrossRef]
- Hariri-Ardebili, M.; Nuss, L. Seismic risk prioritization of a large portfolio of dams: Revisited. Adv. Mech. Eng. 2018, 10, 1687814018802531. [Google Scholar] [CrossRef] [Green Version]
- Stedinger, J.; Heath, D.C.; Thompson, K. Risk Analysis for Dam Safety Evaluation: Hydrologic Risk; Technical Report; Army Engineer Institute for Water Resources: Fort Belvoir, VA, USA, 1996. [Google Scholar]
- Bowles, D.S.; Anderson, L.R.; Glover, T.F. A role for risk assessment in dam safety management. In Proceedings of the 3rd International Conference Hydropower, Trondheim, Norway, 30 June–2 July 1997; Volume 97. [Google Scholar]
- Bowles, D. Advances in the practice and use of portfolio risk assessment. In Proceedings of the ANCOLD 2000 Conference on Dams, Melbourne, Australia, 12–17 March 2001; pp. 21–32. [Google Scholar]
- Chauhan, S.S.; Bowles, D.S. Dam safety risk assessment with uncertainty analysis. In Proceedings of the Australian Committee on Large Dams Risk Workshop, Launceston, Australia, 13–15 October 2003. [Google Scholar]
- Peyras, L.; Royet, P.; Boissier, D. Dam ageing diagnosis and risk analysis: Development of methods to support expert judgment. Can. Geotech. J. 2006, 43, 169–186. [Google Scholar] [CrossRef]
- Smith, M. Dam risk analysis using Bayesian networks. In Proceedings of the Engineering Conferences International, Lillehammer, Norway, 18–21 June 2006. ECI Symposium Series. [Google Scholar]
- Serrano-Lombillo, A.; Escuder-Bueno, I.; de Membrillera-Ortuño, M.G.; Altarejos-Garcia, L. Methodology for the calculation of annualized incremental risks in systems of dams. Risk Anal. 2011, 31, 1000–1015. [Google Scholar] [CrossRef]
- Castillo-Rodriguez, J.T.; Needham, J.T.; Morales-Torres, A.; Escuder-Bueno, I. A combined risk analysis approach for complex dam-levee systems. Struct. Infrastruct. Eng. 2017, 13, 1624–1638. [Google Scholar] [CrossRef]
- Hariri-Ardebili, M.A. Living in a multi-risk chaotic condition: Pandemic, natural hazards and complex emergencies. Int. J. Environ. Res. Public Health 2020, 17, 5635. [Google Scholar] [CrossRef]
- Hariri-Ardebili, M.A.; Lall, U. Superposed natural hazards and pandemics: Breaking dams, Foods, and COVID-19. Sustainability 2021, 13, 8713. [Google Scholar] [CrossRef]
- U.S. Army Corps of Engineers. Interim Approach for Risk-Informed Designs for Dam and Levee Projects. Engineering and Construction Bulletin No. 2019-15. 8 October 2019. Available online: https://www.wbdg.org/ffc/dod/engineering-and-construction-bulletins-ecb/usace-ecb-2019-15 (accessed on 19 December 2022).
- U.S. Army Corp of Engineers. ER 1110-2-1156, Safety of Dams—Policy and Procedures. 31 March 2014. Available online: https://www.publications.usace.army.mil/Portals/76/Publications/EngineerRegulations/er_1110-2-1156.pdf (accessed on 19 December 2022).
- U.S. Bureau of Reclamation. Updated Ground Motions for Scoggins Dam, Technical Memorandum 86-68330-2012-26; U.S. Bureau of Reclamation: Washington, DC, USA, 2013.
- Ferguson, K.A.; Osmun, D.W.; Abedzadeh, F.; Anderson, S.; Moen, K. Risk Informed Design of Large Concrete (RCC) Dams in High Seismic Hazard Regions. In Proceedings of the United States Society on Dams (USSD) Annual Conference, Miami, FL, USA, 30 April–4 May 2018. [Google Scholar]
- U.S. Bureau of Reclamation. State-of-Practice for the Nonlinear Analysis of Concrete Dams; Technical Service Center: Denver, CO, USA, 2013.
- Weiland, M.; (Chair of the International Commission On Large Dams [ICOLD] Committee on Seismic Aspects of Dam Design, Zurich, Switzerland); Ferguson, K.A.; (HDR Engineering, Inc, Senior Technical Advisor for Dams and Hydraulic Structures, Denver, CO, USA). Personal communication, 2021.
- Chopra, A.K.; Chakrabarti, P. The Koyna Earthquake and the Damage to Koyna Dam. Bull. Seismol. Soc. Am. 1973, 63, 381–397. [Google Scholar] [CrossRef]
- Nuss, L.K.; Matsumoto, N.; Hansen, K.D. Shaken but not Stirred, Earthquake Performance of Concrete Dams. In Proceedings of the 2012 Annual Conference, United States Society on Dams, New Orleans, LA, USA, 23–27 April 2012. [Google Scholar]
- Mridha, S.; Maity, D. Experimental Investigation on Nonlinear Dynamic Response of Concrete Gravity Dam-Reservoir System. Eng. Struct. 2014, 80, 289–297. [Google Scholar] [CrossRef]
- Wang, G.; Lu, W.; Zhou, C.; Zhou, W. The Influence of Initial Crack on the Crock Propagation Process of Concrete Gravity Dam-Reservoir-Foundation Systems. J. Earthq. Eng. 2015, 19, 991–1011. [Google Scholar] [CrossRef]
- U.S. Bureau of Reclamation; U.S. Army Corps of Engineers. Best Practices in Dam and Levee Safety Risk Analysis. 2019. Available online: https://usbr.gov/ssle/damsafety/risk/BestPractices/Chapters/1-BestPracticesCover.pdf (accessed on 19 December 2022).
- U.S. Bureau of Reclamation. Interim Dam Safety Public Protection Guidelines, A Risk Framework to Support Dam Safety Decision-Making; Bureau of Reclamation: Denver, CO, USA, 2011.
- Ferguson, K.A.; Vanderplaat, T.; Dummer, J. Risk Informed Design of a New Scoggins RCC Dam, Oregon Under Extreme Seismic Loading. In Proceedings of the United States Society on Dams Annual Conference, San Diego, CA, USA, 10–14 April 2022. [Google Scholar]
Figure 1.
Project location map.

Figure 2.
3D Isometric View of Scoggins RCC Dam LSDYNA Model. Brown color represents abutment and foundation materials, blue shows limits of reservoir included in the model and the curved and colored item in middle of figure is the proposed dam.
Figure 2.
3D Isometric View of Scoggins RCC Dam LSDYNA Model. Brown color represents abutment and foundation materials, blue shows limits of reservoir included in the model and the curved and colored item in middle of figure is the proposed dam.

Figure 3.
Scoggins RCC Dam LSDYNA Model: (a) plan view; (b) exploded isometric view. Plan and outer profile view colors represent different monoliths in the dam. Inner color shown on profile represents the inner zone of RCC materials with different material properties.
Figure 3.
Scoggins RCC Dam LSDYNA Model: (a) plan view; (b) exploded isometric view. Plan and outer profile view colors represent different monoliths in the dam. Inner color shown on profile represents the inner zone of RCC materials with different material properties.

Figure 4.
2D Model through monolith 15 showing: (a) dam, foundation, and reservoir; (b) close-up of cross-section showing contact elements at rock (foundation)—concrete interface, potential inclined crack, and lift joint crack at the base of the chimney section. The brown elements represent the foundation bedrock, blue represents the reservoir and the four colors in the dam cross-section represent the different parts of the dam produced by the contact surfaces with the model (labeled 1, 2 and 3).

Figure 5.
Graphical depiction of gravity analysis results for static loading sliding factor of safety (base friction of 45 degrees).
Figure 5.
Graphical depiction of gravity analysis results for static loading sliding factor of safety (base friction of 45 degrees).

Figure 6.
Plan view of dam showing deformed shape (magnification factor of 300) following the 5000-year MYG008 Earthquake. One-year strength parameters. Different colors represent different monoliths within the dam. Letters A through I represent the nodal displacement plot locations shown in Figure 7. Corresponding nodal numbers used to obtain displacement plots from model are listed adjacent to the letters A through I.

Figure 7.
Plot of crest node displacement for the 5000-year, short-duration earthquake (MYG008) and 1-year strength parameters. (x-displacement is in inches, and time scale is in seconds. On the vertical axis, positive displacement is movement downstream, and negative (−) is movement upstream).
Figure 7.
Plot of crest node displacement for the 5000-year, short-duration earthquake (MYG008) and 1-year strength parameters. (x-displacement is in inches, and time scale is in seconds. On the vertical axis, positive displacement is movement downstream, and negative (−) is movement upstream).

Figure 8.
Example stress response of various nodes along the upstream face of monolith 15 during the 5000-year Short Duration MYG008 Earthquake. Max_principal_stress shown on vertical axis is in psi (145 psi = 1 MPa). Note that positive stress on the vertical axis is tension, and negative stress on this axis is compression. Units of the horizontal scale are seconds.

Figure 9.
Location of nodal points along the upstream face of monolith 15 corresponding to stress response plot in Figure 8. Different colored lines in the plot represent the boundaries of the monoliths formed by the TCJs in the dam model. Perspective is looking from the reservoir toward the upstream face of the dam.

Figure 10.
Plot of maximum stress response in vicinity of Crest Node A during the 5000-year, short-duration earthquake. (note stress plot in lower right are tensile in psi units. 145 psi = 1 MPa). The principal stresses shown on the vertical axis are in psi. Positive numbers represent tension and negative numbers represent compression.

Table 1.
Probabilistic seismic hazards at the Scoggins Dam Site.
| Return Period (Years) | CSZ Events (g) | Total Hazard PGA (g) |
|---|---|---|
| 500 | 0.16 | 0.37 |
| 1000 | 0.40 | 0.55 |
| 5000 | 0.95 | 1.08 |
| 10,000 | 1.25 | 1.36 |
| 50,000 | 2.00 | 2.08 |
Note(s): g = gravitational acceleration.
Table 2.
Foundation material properties.
| Material Properties | Assigned Value |
|---|---|
| Average Bedrock Density (y) | 145 lb/ft3 (6.94 kpa) |
| Rock Mass Deformation Modulus (E) | 1.00 × 10⁶ lb/in2 (6895 MPa) |
| Poisson’s Ratio (v) | 0.32 |
| Shear Wave Velocity (Vs) | 3500 ft/s (1067 m/s) |
| P-Wave Velocity (Vp) | 6800 ft/s (2073 m/s) |
Note(s): ft/s = feet per second, lb/ft3 = pounds per cubic feet, lb/in2 = pounds per square inch, m/s = meters per second, MPa = megapascals, kpa = kilopascals.
Table 3.
Density of concrete for monoliths and structures.
| Type of Concrete | SS | SB | BB |
|---|---|---|---|
| (Pounds per Cubic Foot—lb/ft3 [kpa]) | |||
| RCC Outer Zone (2400) | 138 [6.61] | 145 [6.94] | 150 [7.18] |
| RCC Inner Zone (1800) | 137 [6.56] | 145 [6.94] | 150 [7.18] |
| Structural Concrete | N/A | 145 [6.94] | 150 [7.18] |
Note(s): N/A = not applicable, SS = blend of sandstone coarse and fine aggregate, SB = blend of sandstone coarse and basalt fine aggregate, BB = blend of basalt coarse and fine aggregate.
Table 4.
Modulus of elasticity and Poisson’s ratio for the monoliths.
| Type of Concrete | Young’s Modulus (E) | Poisson’s Ratio (v) |
|---|---|---|
| RCC Outer Zone (2400) | 2.61 × 10⁶ lb/in2 (17,995 MPa) | 0.20 |
| RCC Inner Zone (1800) | 2.32 × 10⁶ lb/in2 (15,996 MPa) | 0.20 |
| Structural Concrete | 4.07 × 10⁶ lb/in2 (28,062 MPa) | 0.20 |
Table 5.
Summary of estimated tensile strength of RCC materials for structural analyses and evaluation of modeling results.
Table 5.
Summary of estimated tensile strength of RCC materials for structural analyses and evaluation of modeling results.
| Name | Lower Bound Psi (MPa) | Upper Bound Psi (MPa) |
|---|---|---|
| Static Tensile Strength (Intact RCC) | 160 [1.103] | 195 [1.344] |
| Dynamic Tensile Strength (Intact RCC) | 242 [1.668] | 292 [2.013] |
| Static Tensile Strength (Principal stresses oriented perpendicular to RCC lift surfaces—80% of intact) | 128 [0.882] | 156 [1.076] 1 |
| Dynamic Tensile Strength (Principal stresses oriented perpendicular to RCC lift surfaces—150% of static adjusted for lift joints) | 192 [1.324] | 234 [1.613] 2 |
Note(s): 1 80% applied to intact RCC strength to account for lift joints. 2 150% of the static tensile strength adjusted for lift joints.
Table 6.
Summary of estimated shear strength of RCC materials for structural analysis and evaluation of modeling results.
Table 6.
Summary of estimated shear strength of RCC materials for structural analysis and evaluation of modeling results.
| Feature | Intact Shear Strength—Base Case | Intact Shear Strength—Long-Term Case | Cracked but Undeformed Shear Strength | Residual Shear Strength |
|---|---|---|---|---|
| Intact RCC | Phi = 45 deg., c = 100 psi [0.69 Mpa] | Phi = 55 deg., c = 150 psi [1.03 MPa] | ||
| Bonded Lift Joint | Phi = 45 deg., c = 100 psi | Phi = 55 deg., c = 150 psi | ||
| Un-bonded Lift Joint | Phi = 45 deg. | Phi = 35 deg. |
Note(s): deg. = degrees.
Table 7.
Contact Surfaces used in the 3D Finite Element Model.
| Name of Contact Surface | Type of LS-DYNA Contact Used | Shear Bond Strength (Cohesion) (lb/in2) | Normal Bond (Tensile) Strength (lb/in2) | Initial (Intact) Friction Angle (Degrees) | Residual Friction Angle after Sliding Initiates (Degrees) |
|---|---|---|---|---|---|
| Dam/Foundation | Tiebreak with Friction | 100 to 250 3 | 100 to 250 3 | 45 (long-term of 55 also used) 2 | 35 |
| Dam/Water | Tied | Tied | Tied | N/A | |
| Foundation/Water | Tied | Tied | Tied | N/A | |
| TCJs 4 | Sliding with Friction | N/A | N/A | 45 1 |
Note(s): 1 This is a conservative but commonly used value for TCJs in structural modeling. 2 The foundation contact strength neglects the expected rough contact found during construction. 3 0.69 to 1.72 MPa. 4 TCJs = Transverse Contraction Joints.
Table 8.
Summary of static gravity analyses for increased uplift and reduced contact strength assumptions.
Table 8.
Summary of static gravity analyses for increased uplift and reduced contact strength assumptions.
| Case | Reservoir (Feet [m]) | Tailwater (Feet) | Drain Efficiency | Compression at Base | Friction (deg.) | Cohesion (psi [MPa]) | Sliding FOS |
|---|---|---|---|---|---|---|---|
| Normal | 303.5 [92.5] | 160 | 0% | 100% | 45 | 0 | 2.09 |
| 35 | 0 | 1.46 | |||||
| 45 | 25 [0.17] | 3.0 | |||||
| 35 | 42 [0.29] | 3.0 | |||||
| 35 | 70 [0.48] | 4.0 | |||||
| PMF | 310.5 [94.6] | 192 | 0% | 100% | 45 | 0 | 1.7 |
| 35 | 0 | 1.19 | |||||
| 45 | 9 [0.06] | 2.0 | |||||
| 35 | 24 [0.17] | 2.0 | |||||
| 35 | 45 [0.31] | 2.7 |
Table 9.
2D Study Case 3, estimated permanent displacements for the MYG008-50k Earthquake using base case (one-year) strengths.
Table 9.
2D Study Case 3, estimated permanent displacements for the MYG008-50k Earthquake using base case (one-year) strengths.
| Side Shear Stress (psi) | Base Displacement (Inches [cm]) | Crest Displacement (Inches [cm]) | Relative Crest Displacement (Inches [cm]) |
|---|---|---|---|
| 0 | 19 [48.26] | 42 [106.68] | 42 − 19 = 23 [58.42] |
| 0.25 [0.002 MPa] | 12 [30.48] | 26 [66.04] | 26 − 12 = 14 [35.56] |
| 3D analysis (left, center, right) | 14, 6, 10 [35.6, 15.2, 25.4] | — | 0 |
Table 10.
2D Study Case 5, estimated permanent displacements for the MYG008-50k Earthquake using long-term strengths.
Table 10.
2D Study Case 5, estimated permanent displacements for the MYG008-50k Earthquake using long-term strengths.
| Side Shear Stress (psi) | Base Displacement (Inches [cm]) | Crest Displacement (Inches [cm]) | Relative Crest Displacement (Inches [cm]) |
|---|---|---|---|
| 0 | 13 [33] | 28 [71.1] | 28 − 13 = 15 [38.1] |
| 0.25 [0.002 MPa] | 8 [20.3] | 12 [30.5] | 12 − 8 = 4 [10.2] |
| 3D analysis (left, center, right) | 6, 3, 0 [15.2, 7.6, 0] | — | 0 |
Table 11.
Permanent displacements for the SRCH10-50k Earthquake, long-term strengths.
| Side Shear Stress (psi) | Base Displacement (Inches [m]) | Crest Displacement (Inches [m]) | Relative Crest Displacement (Inches [m]) |
|---|---|---|---|
| 0, Case 3 | 147 [3.73] | 280 [7.11] | 280 − 147 = 133 [3.38] |
| 0, Case 6 | 186 [4.72] | — | 0 |
| 0.25, Case 5 [0.002 MPa] | 33 [0.84] | 46 [1.17] | 46 − 33 = 13 [0.33] |
| 3D analysis (left, center, right) | 38, 51, 85 [0.97, 1.3, 2.16] | — | 0 |
Table 12.
Summary of risk analysis results for the new Scoggins RCC Dam.
| Potential Failure Mode | AFP (Annual Failure Probability) | Estimated Mean Loss of Life | ALL (Annualized Life Loss Risk) |
|---|---|---|---|
| PFM 5—Seismic sliding and instability at the RCC/foundation contact: limited release failure, short duration | 3.05 × 10⁻⁷ | 1 | 3.05 × 10⁻⁷ |
| PFM 5—Seismic sliding and instability at the RCC/foundation contact: catastrophic failure, short duration | 1.80 × 10⁻⁷ | 12 | 2.07 × 10⁻⁶ |
| PFM 5—Seismic sliding and instability at the RCC/foundation contact: limited release failure, long duration | 5.22 × 10⁻⁶ | 1 | 5.22 × 10⁻⁶ |
| PFM 5—Seismic sliding and instability at the RCC/foundation contact: catastrophic failure, long duration | 2.42 × 10⁻⁷ | 12 | 2.78 × 10⁻⁶ |
| PFM 6—Seismic sliding and instability at the base of the chimney section: catastrophic failure, short duration | 3.52 × 10⁻⁶ | 12 | 4.04 × 10⁻⁵ |
| PFM 6—Seismic sliding and instability at the base of the chimney section: catastrophic failure, long duration | 7.33 × 10⁻⁶ | 12 | 8.43 × 10⁻⁵ |
| PFM 11—Left abutment rock block instability: limited release failure | 2.33 × 10⁻⁸ | 1 | 2.33 × 10⁻⁸ |
| PFM 11—Left abutment rock block instability: catastrophic failure | 1.60 × 10⁻⁸ | 11 | 1.84 × 10⁻⁷ |
| Total Risk | 1.68 × 10⁻⁵ | 8 (weighted loss of life) | 1.35 × 10⁻⁴ |
Disclaimer/Publisher’s Note: The statements, opinions and data contained in all publications are solely those of the individual author(s) and contributor(s) and not of MDPI and/or the editor(s). MDPI and/or the editor(s) disclaim responsibility for any injury to people or property resulting from any ideas, methods, instructions or products referred to in the content. |
© 2022 by the author. Licensee MDPI, Basel, Switzerland. This article is an open access article distributed under the terms and conditions of the Creative Commons Attribution (CC BY) license (https://creativecommons.org/licenses/by/4.0/).
Share and Cite
MDPI and ACS Style
Ferguson, K.A. Risk-Informed Design of RCC Dams under Extreme Seismic Loading. Water 2023, 15, 116. https://doi.org/10.3390/w15010116
AMA Style
Ferguson KA. Risk-Informed Design of RCC Dams under Extreme Seismic Loading. Water. 2023; 15(1):116. https://doi.org/10.3390/w15010116
Chicago/Turabian StyleFerguson, Keith A. 2023. "Risk-Informed Design of RCC Dams under Extreme Seismic Loading" Water 15, no. 1: 116. https://doi.org/10.3390/w15010116
Note that from the first issue of 2016, this journal uses article numbers instead of page numbers. See further details here.