
Groundwater Vulnerability and Potentially Toxic Elements Associated with the Iron Mining District of Ouixane (Northeast of Morocco)

 , , , and
Abstract
:1. Introduction
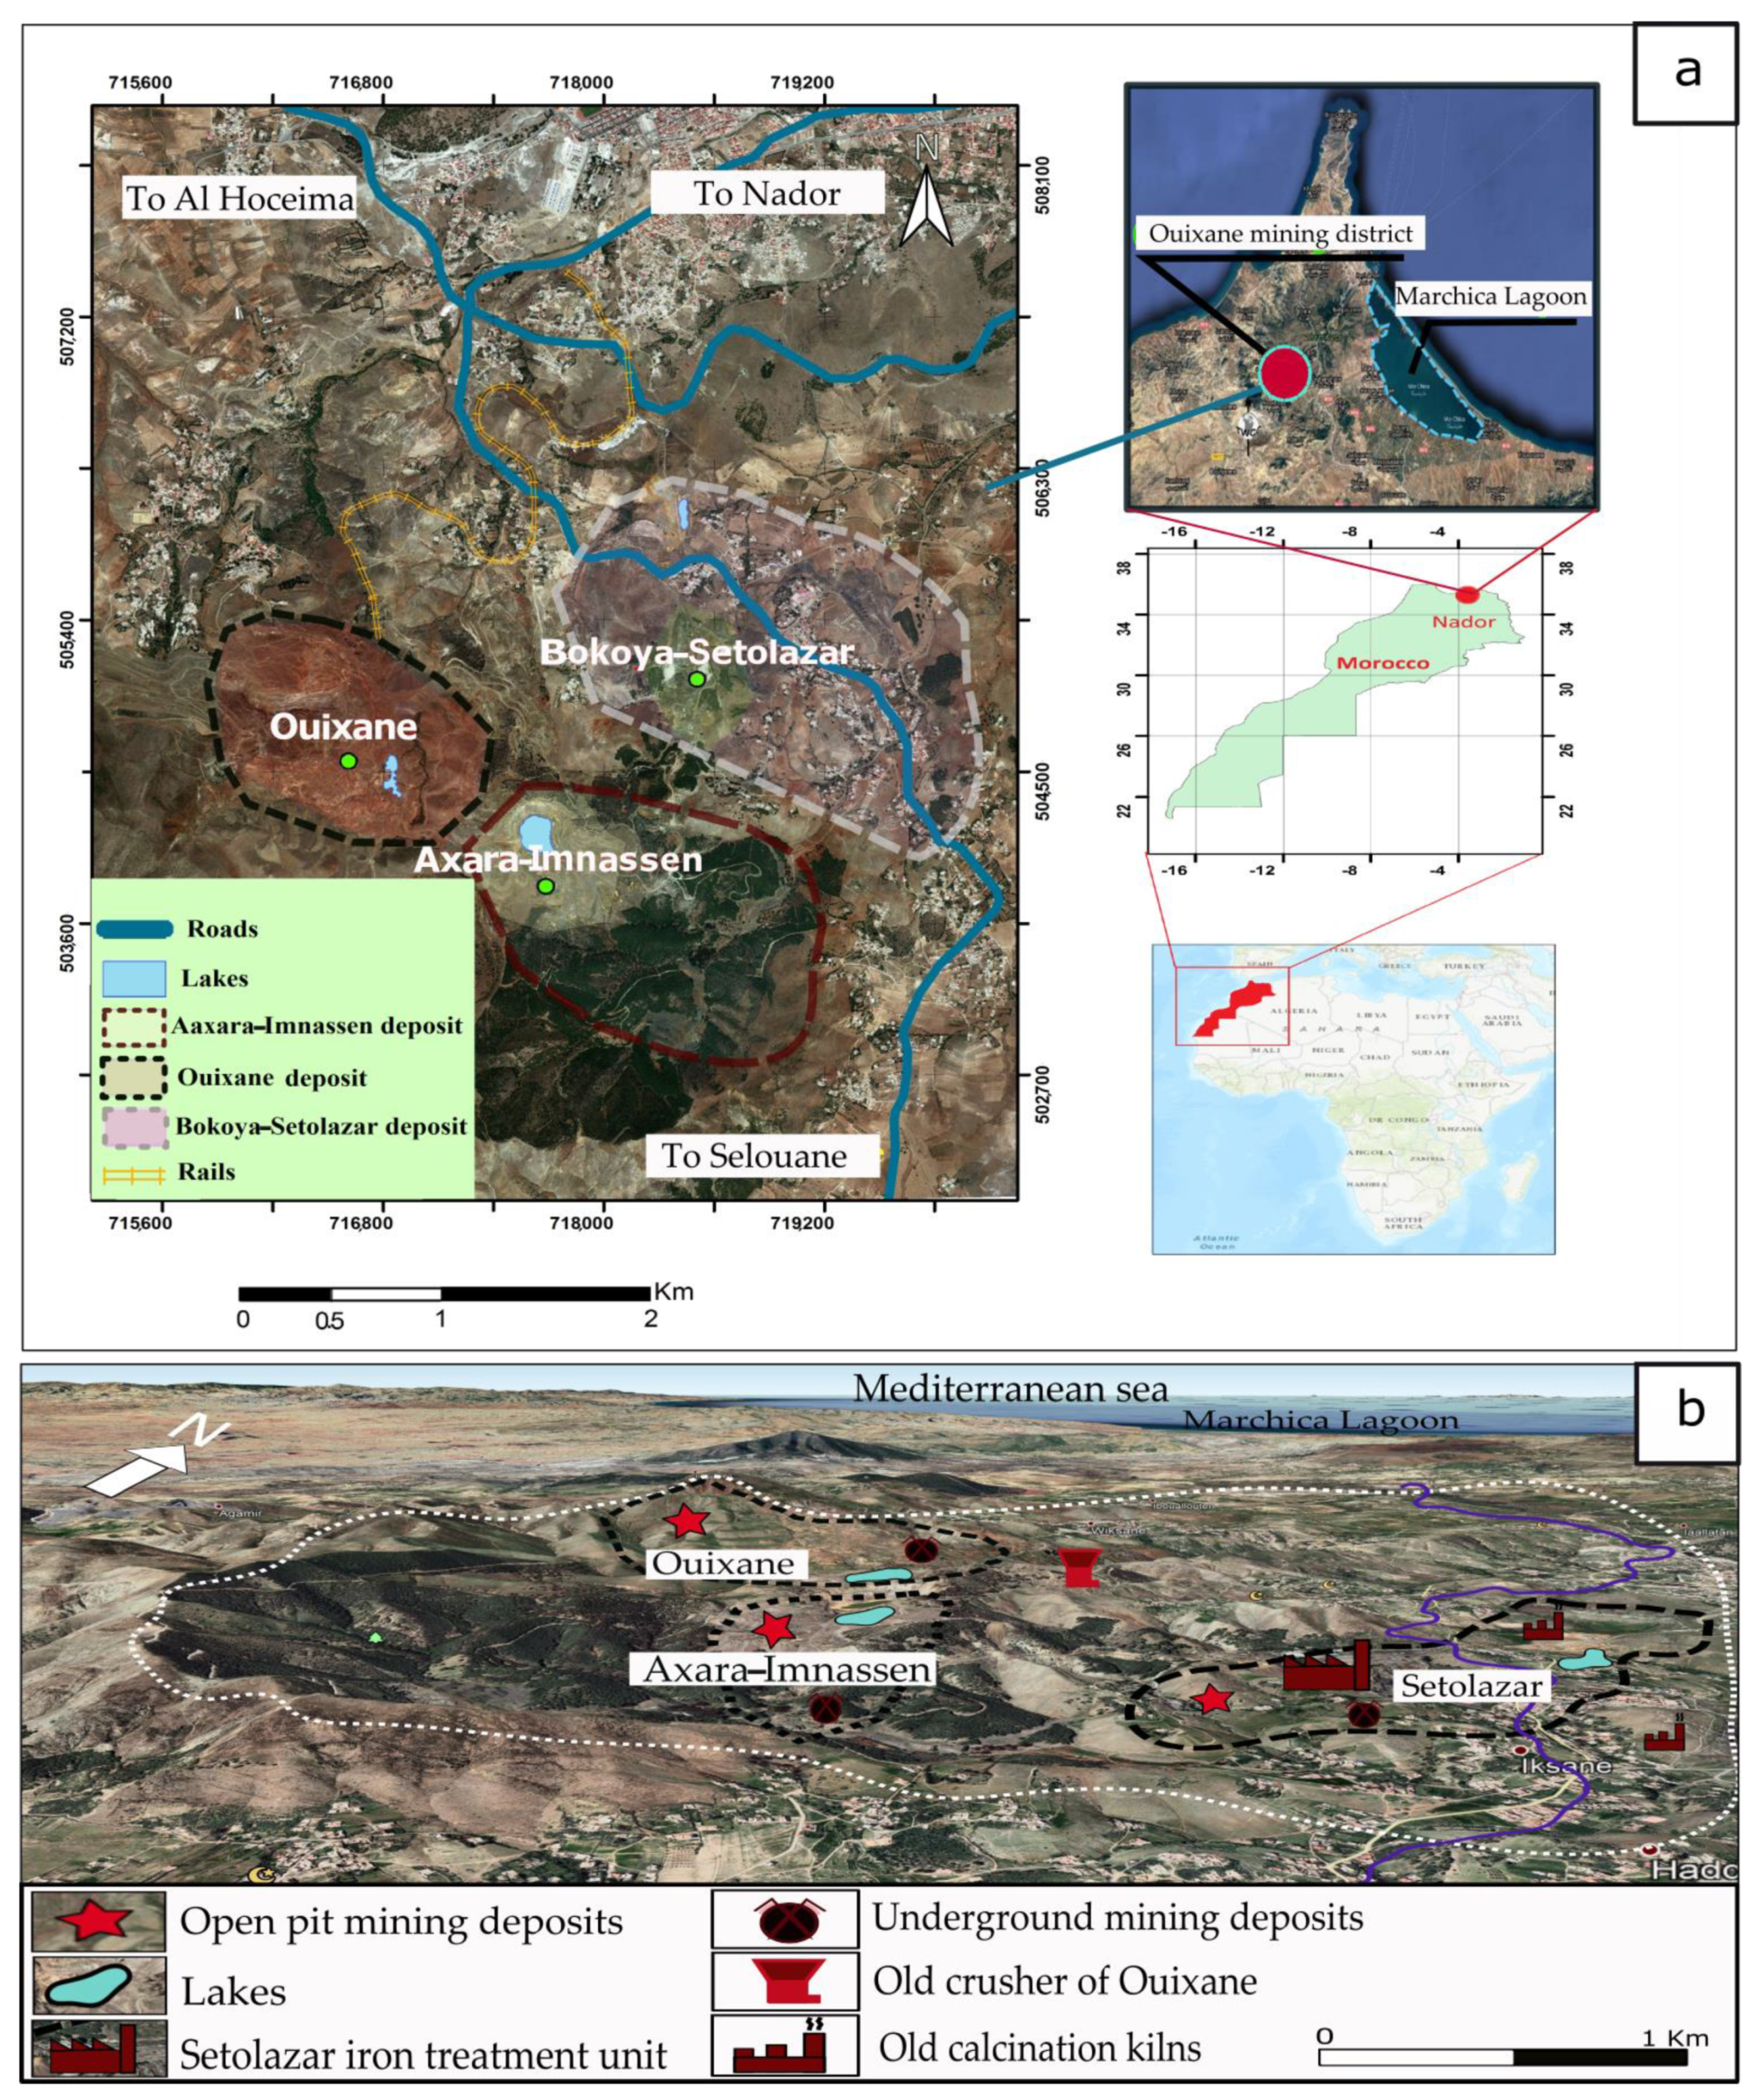
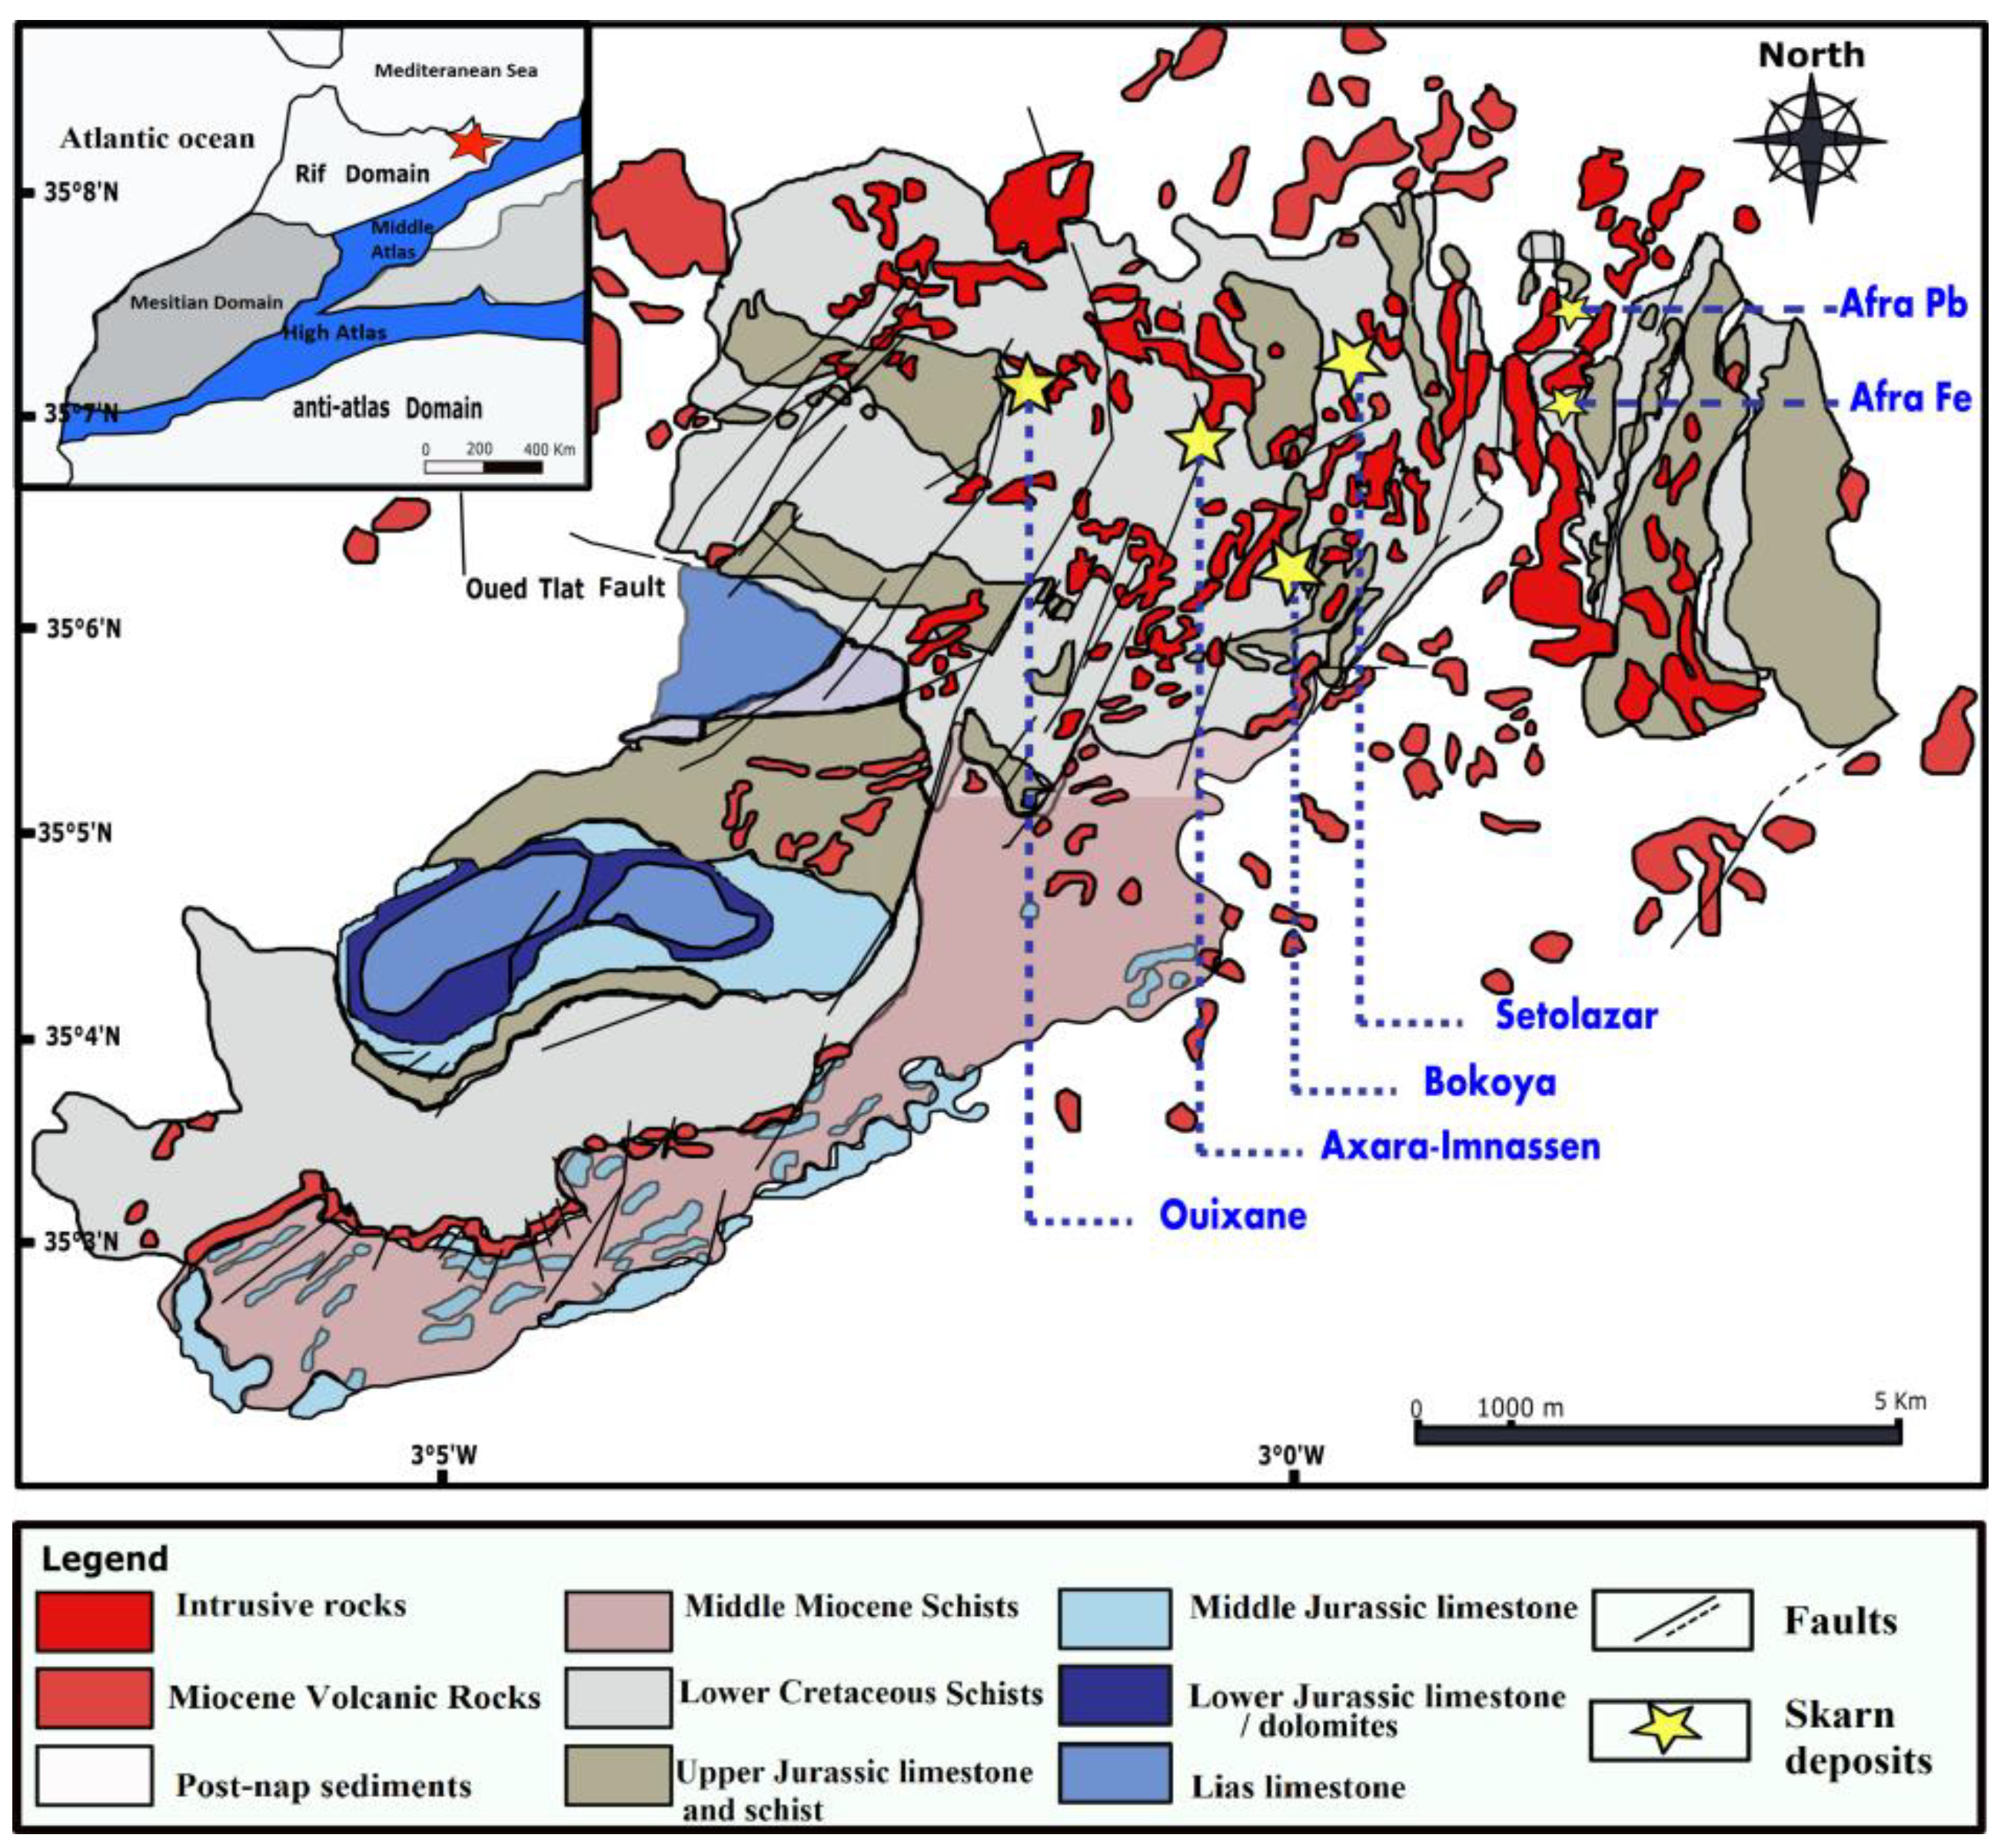
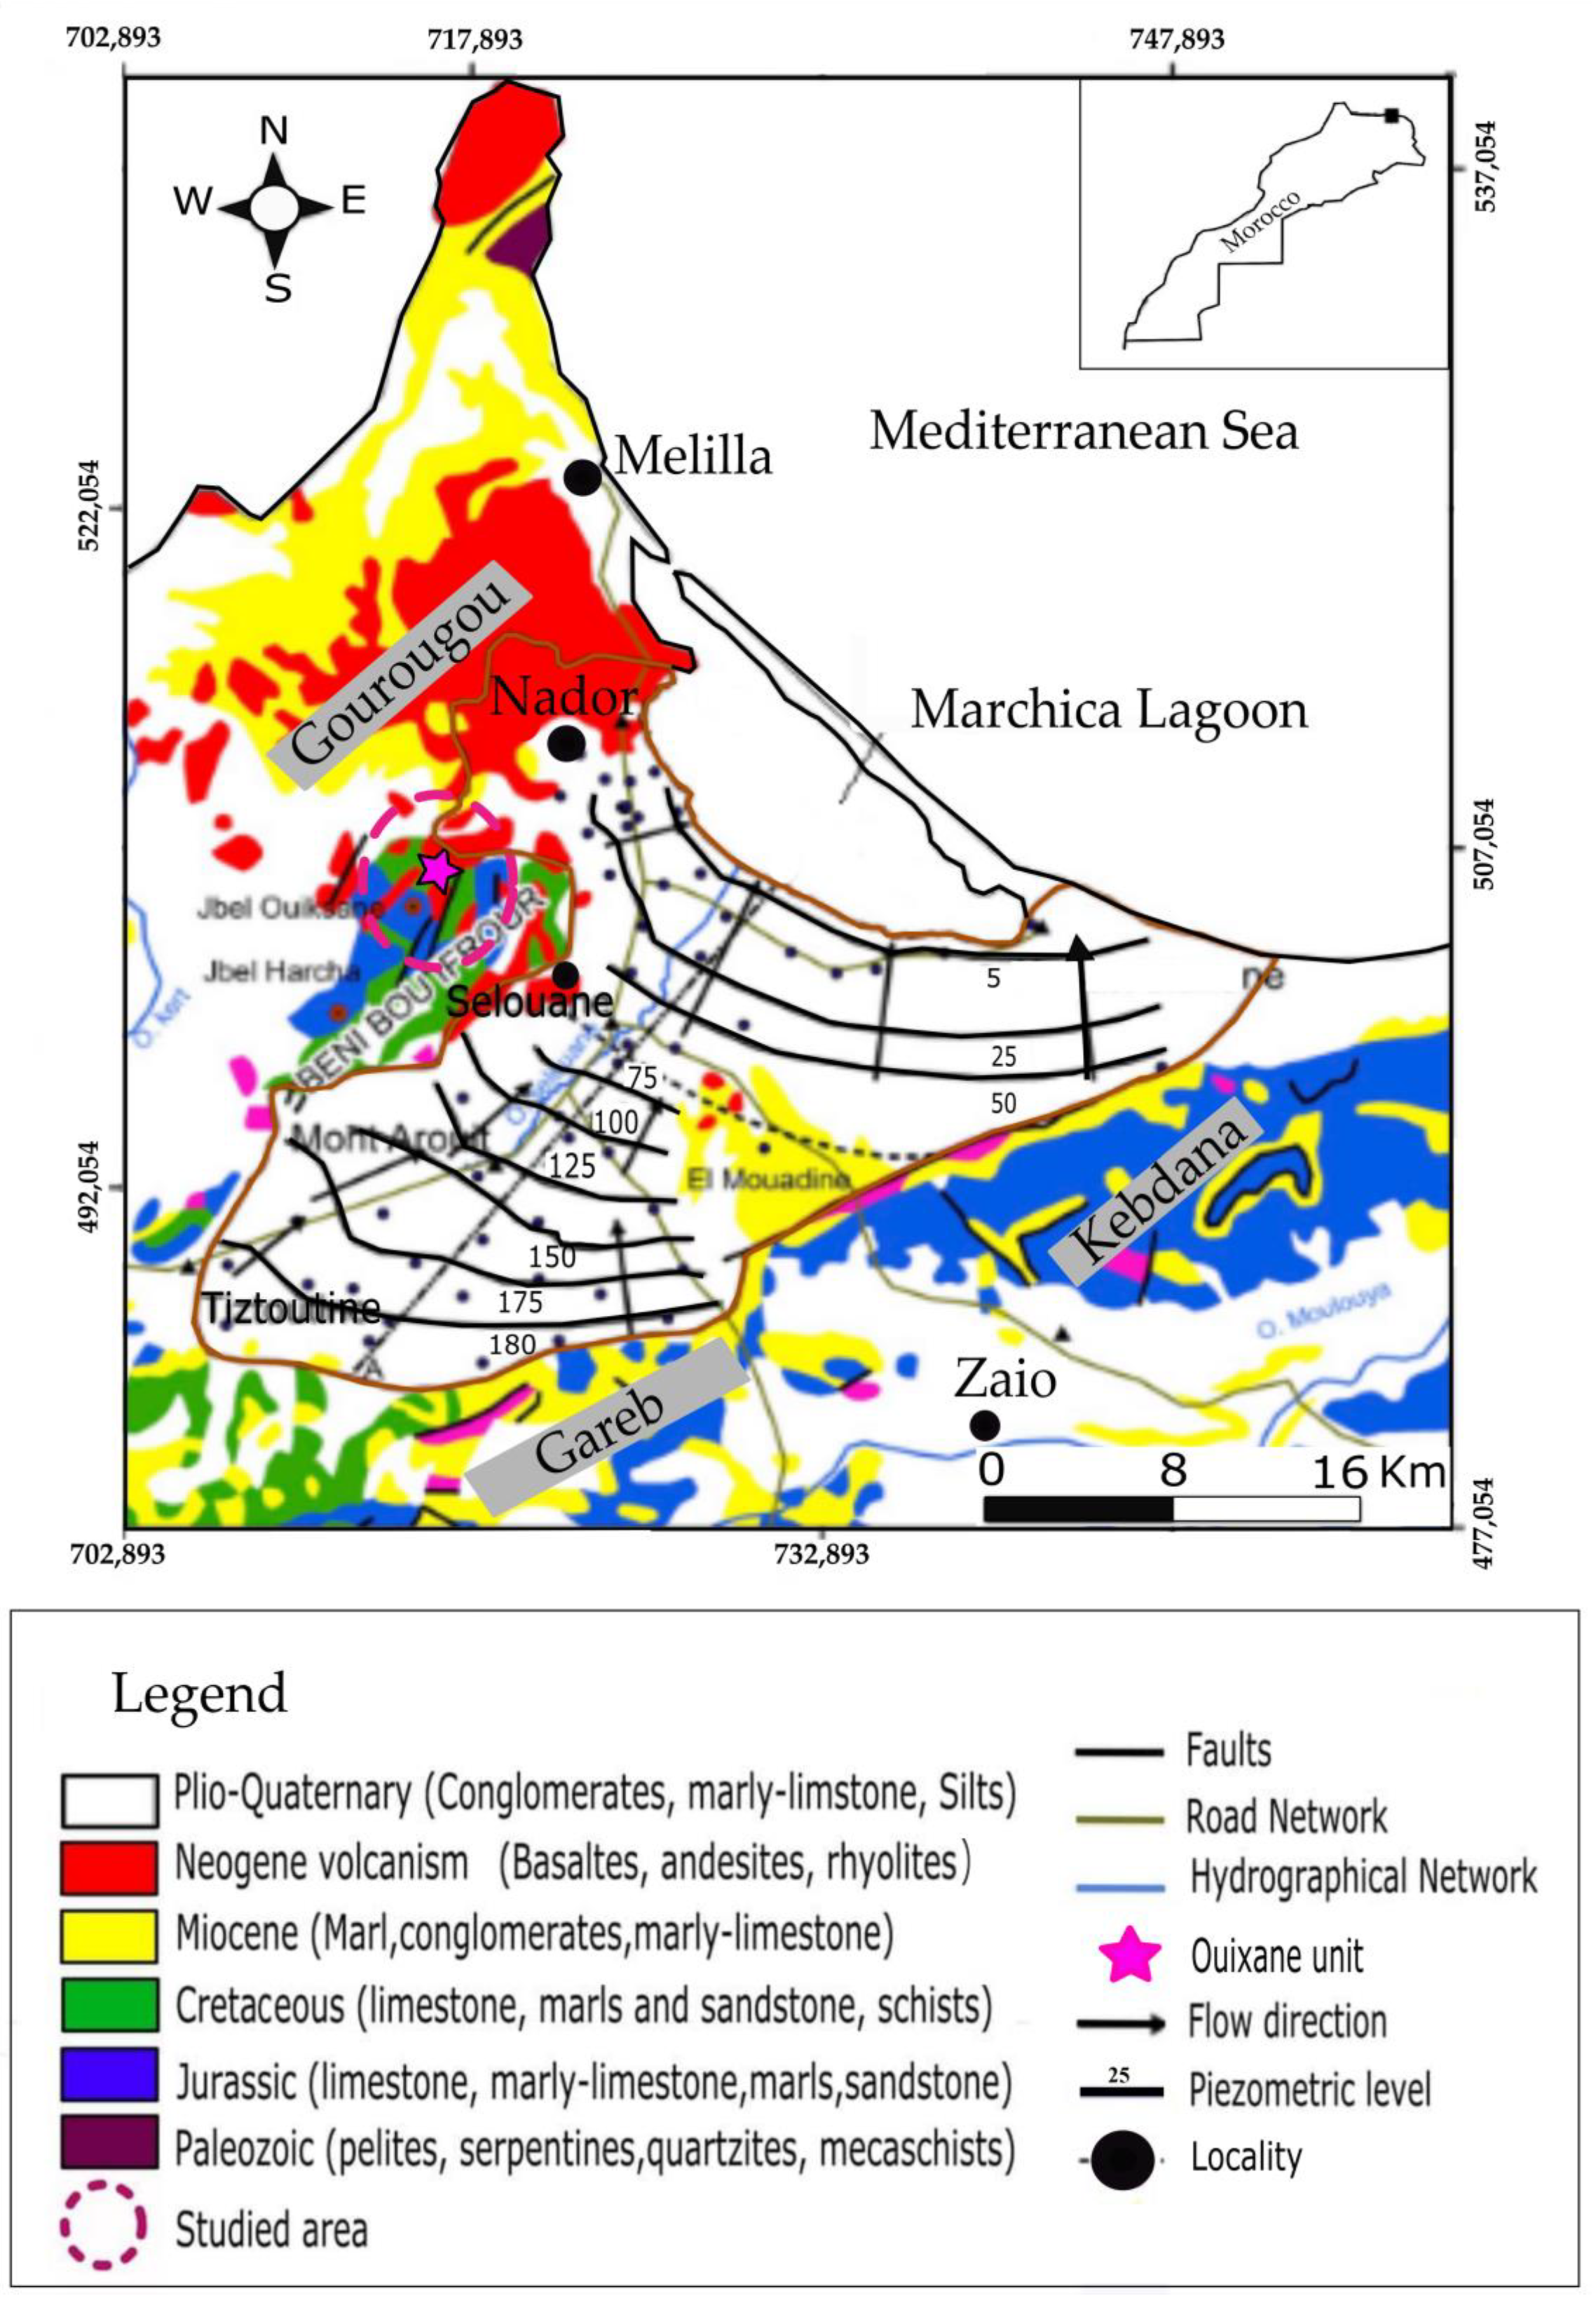
2. Study Area
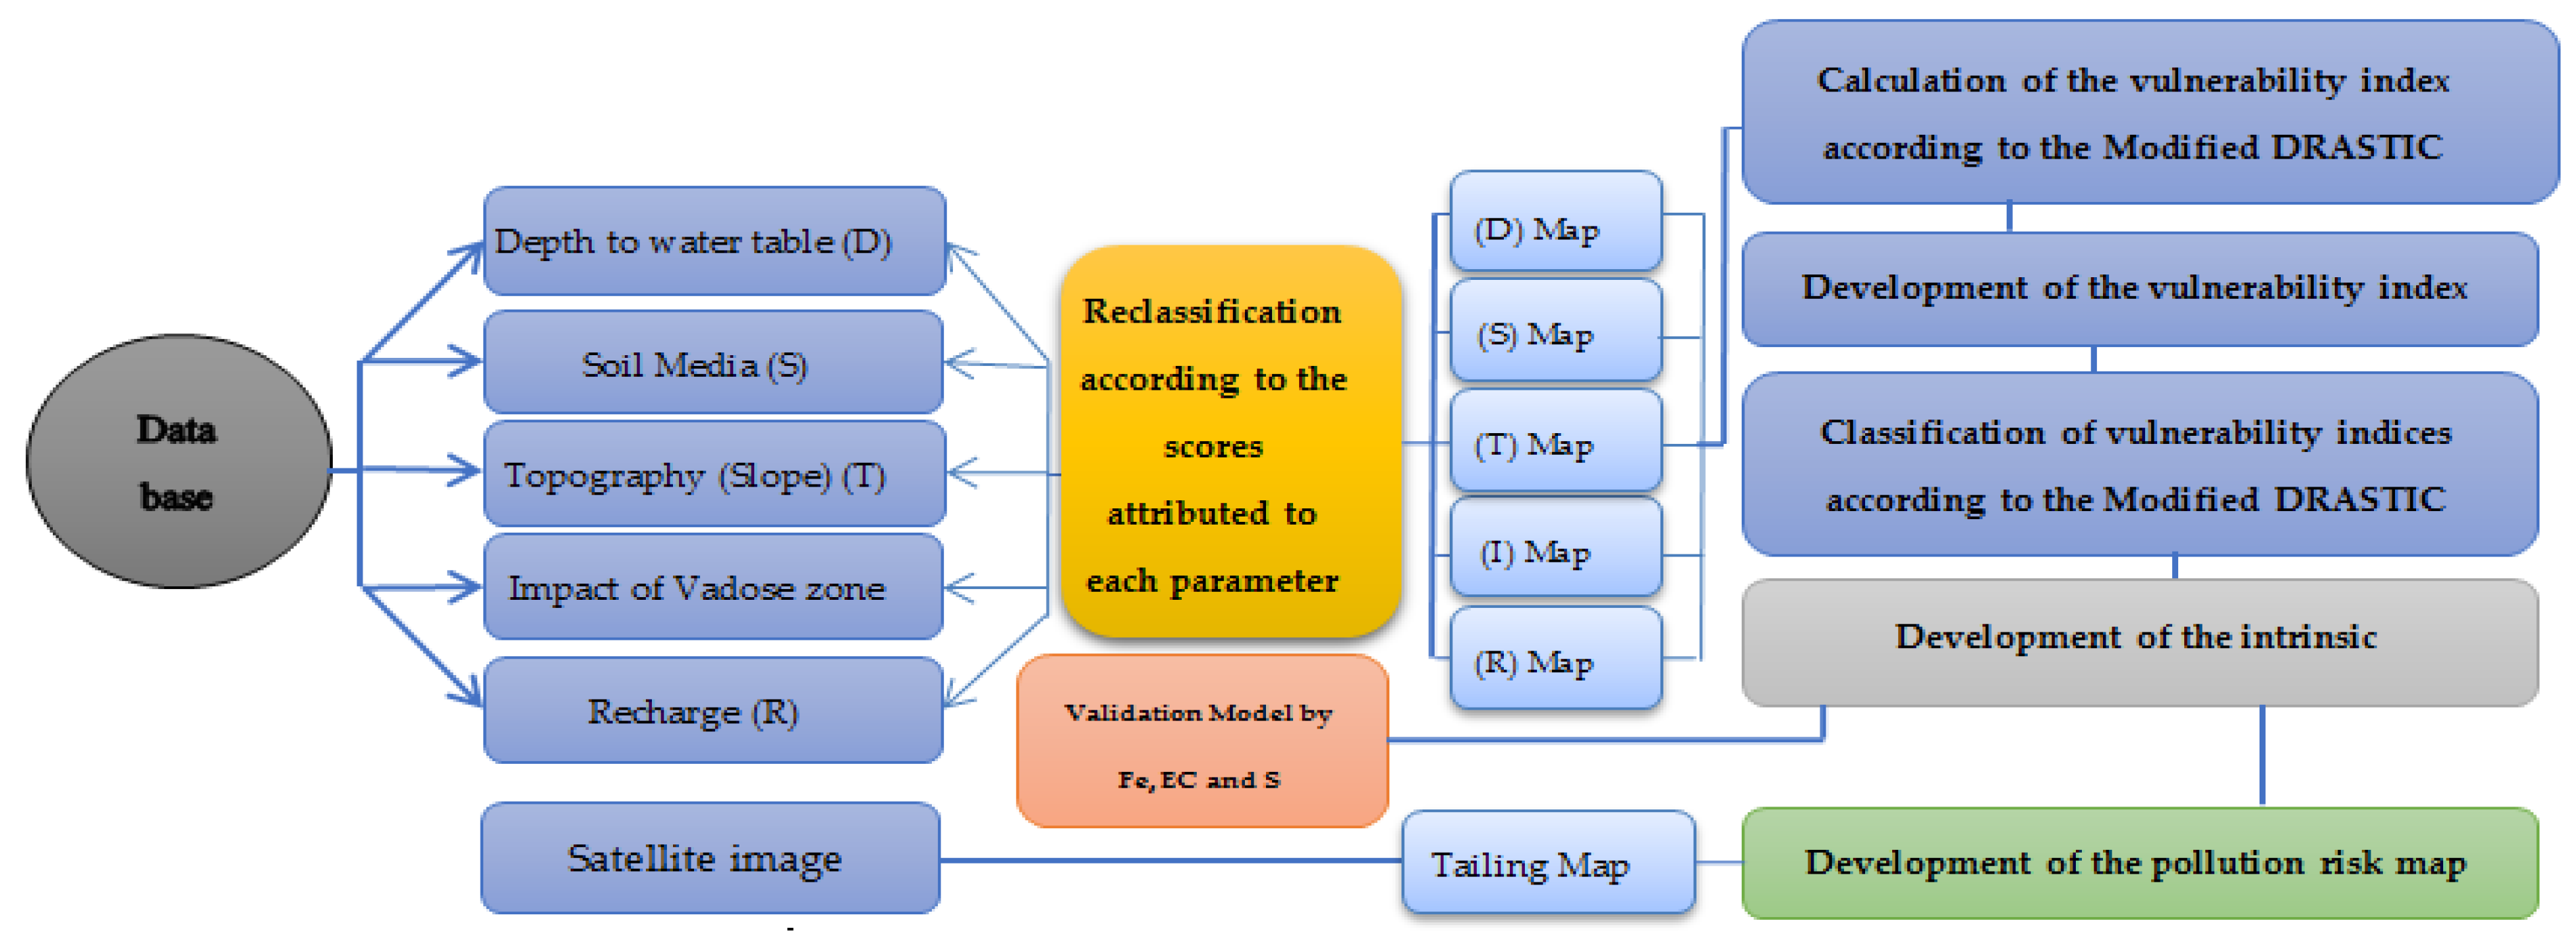
3. Materials and Methods
3.1. Uses of GIS Application
3.2. Groundwater Vulnerability Assessment

| Parameters | Range | Score (Rating) | Weight |
|---|---|---|---|
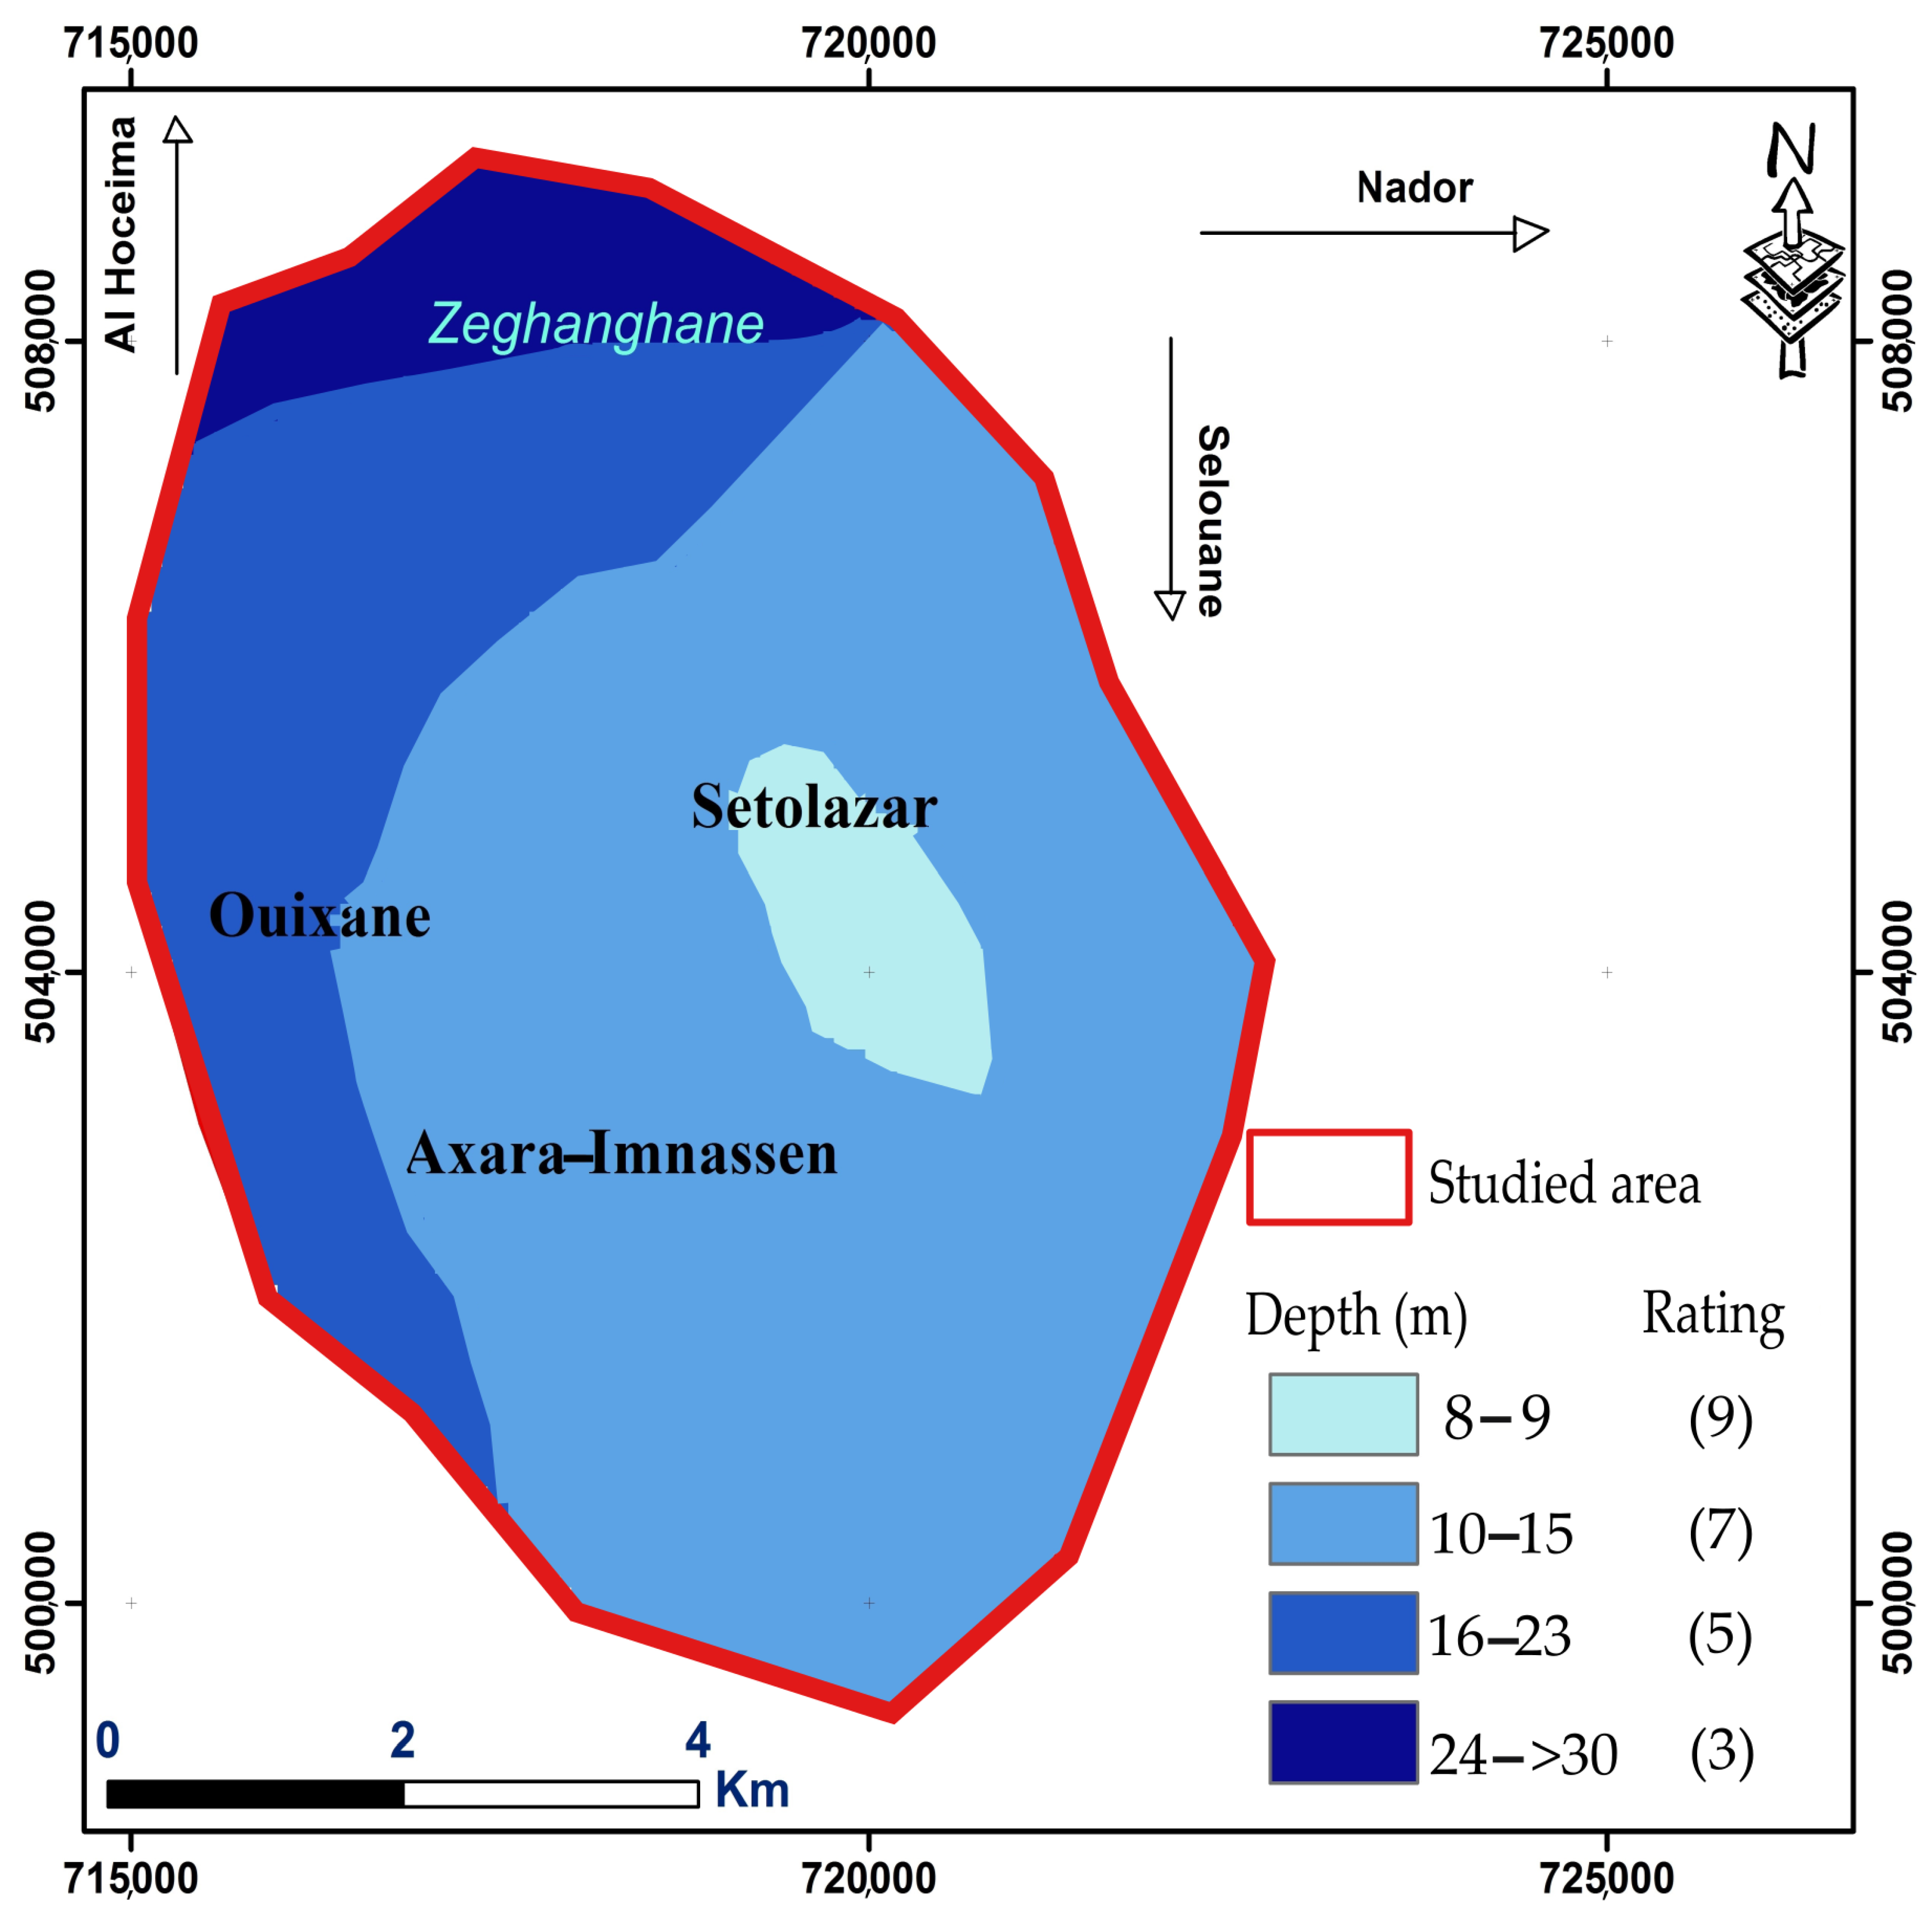
| D (m) | 0–1.5 | 10 | 5 |
| 1.5–4.5 | 9 | ||
| 4.5–9 | 7 | ||
| 9–15 | 5 | ||
| 15–23 | 3 | ||
| 23–30 | 2 | ||
| >30 | 1 | ||
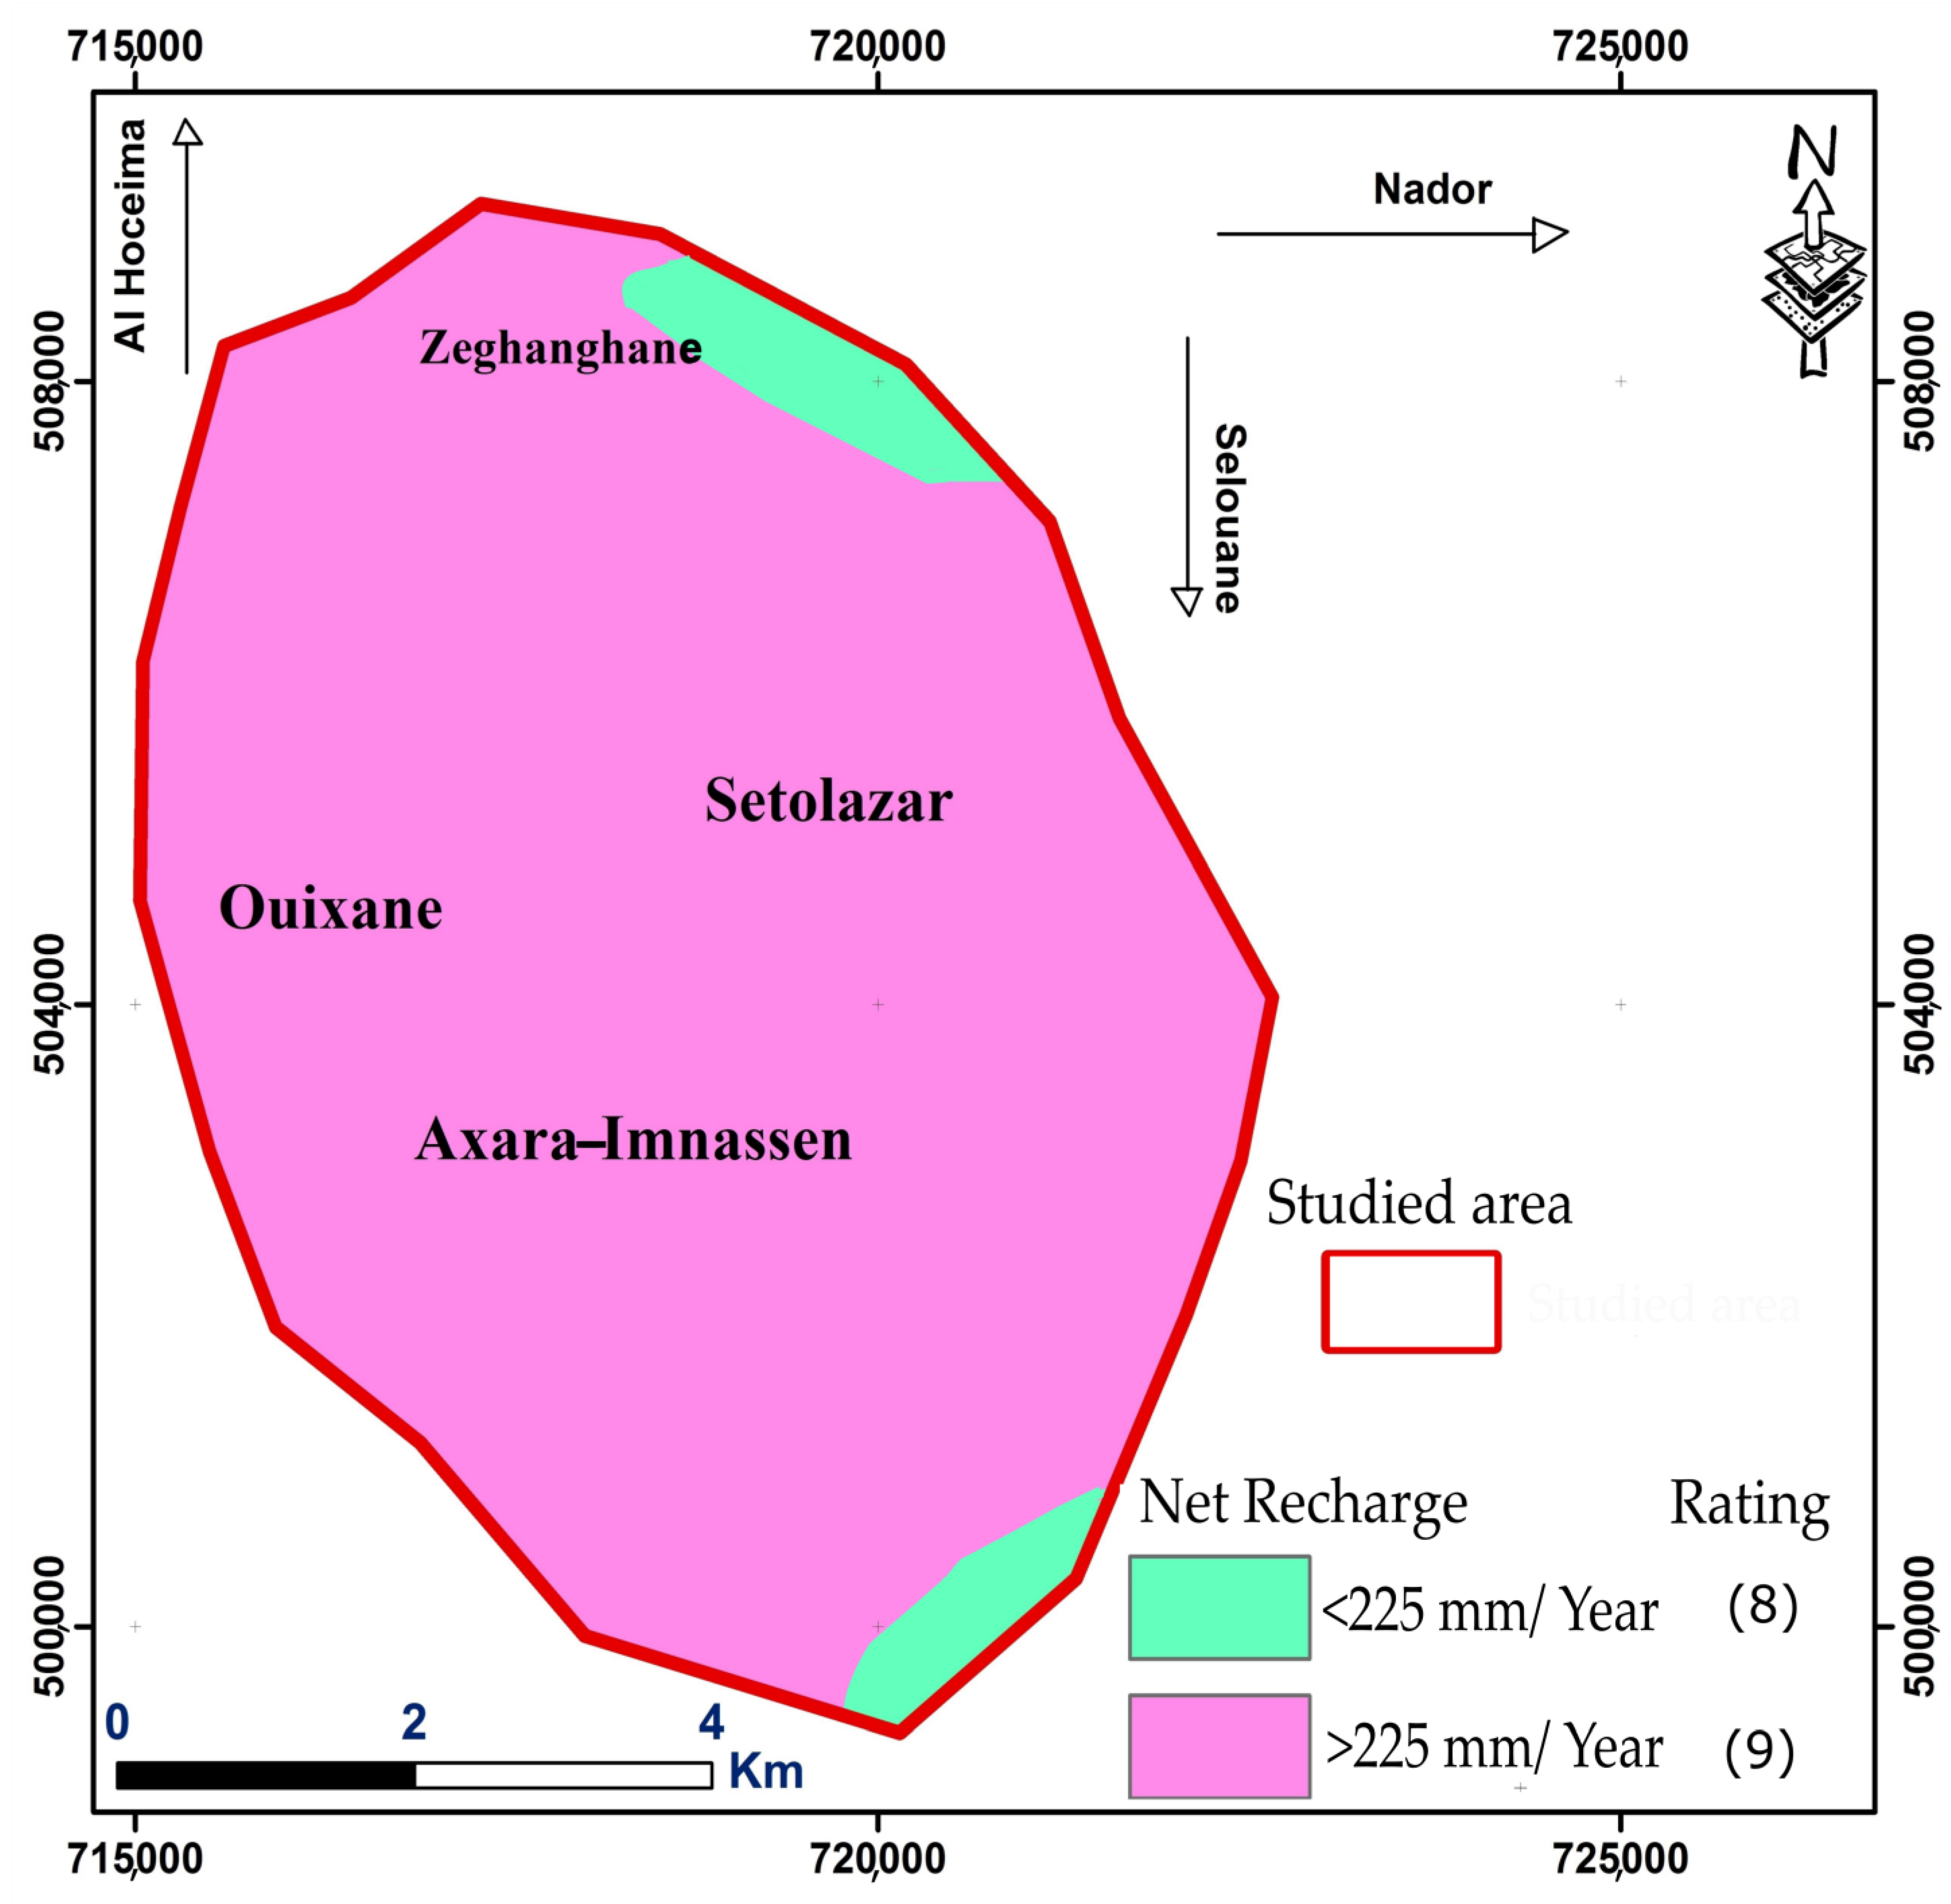
| R (mm) | 0–50 | 1 | 4 |
| 50–100 | 3 | ||
| 100–175 | 6 | ||
| 175–225 | 8 | ||
| >225 | 9 | ||
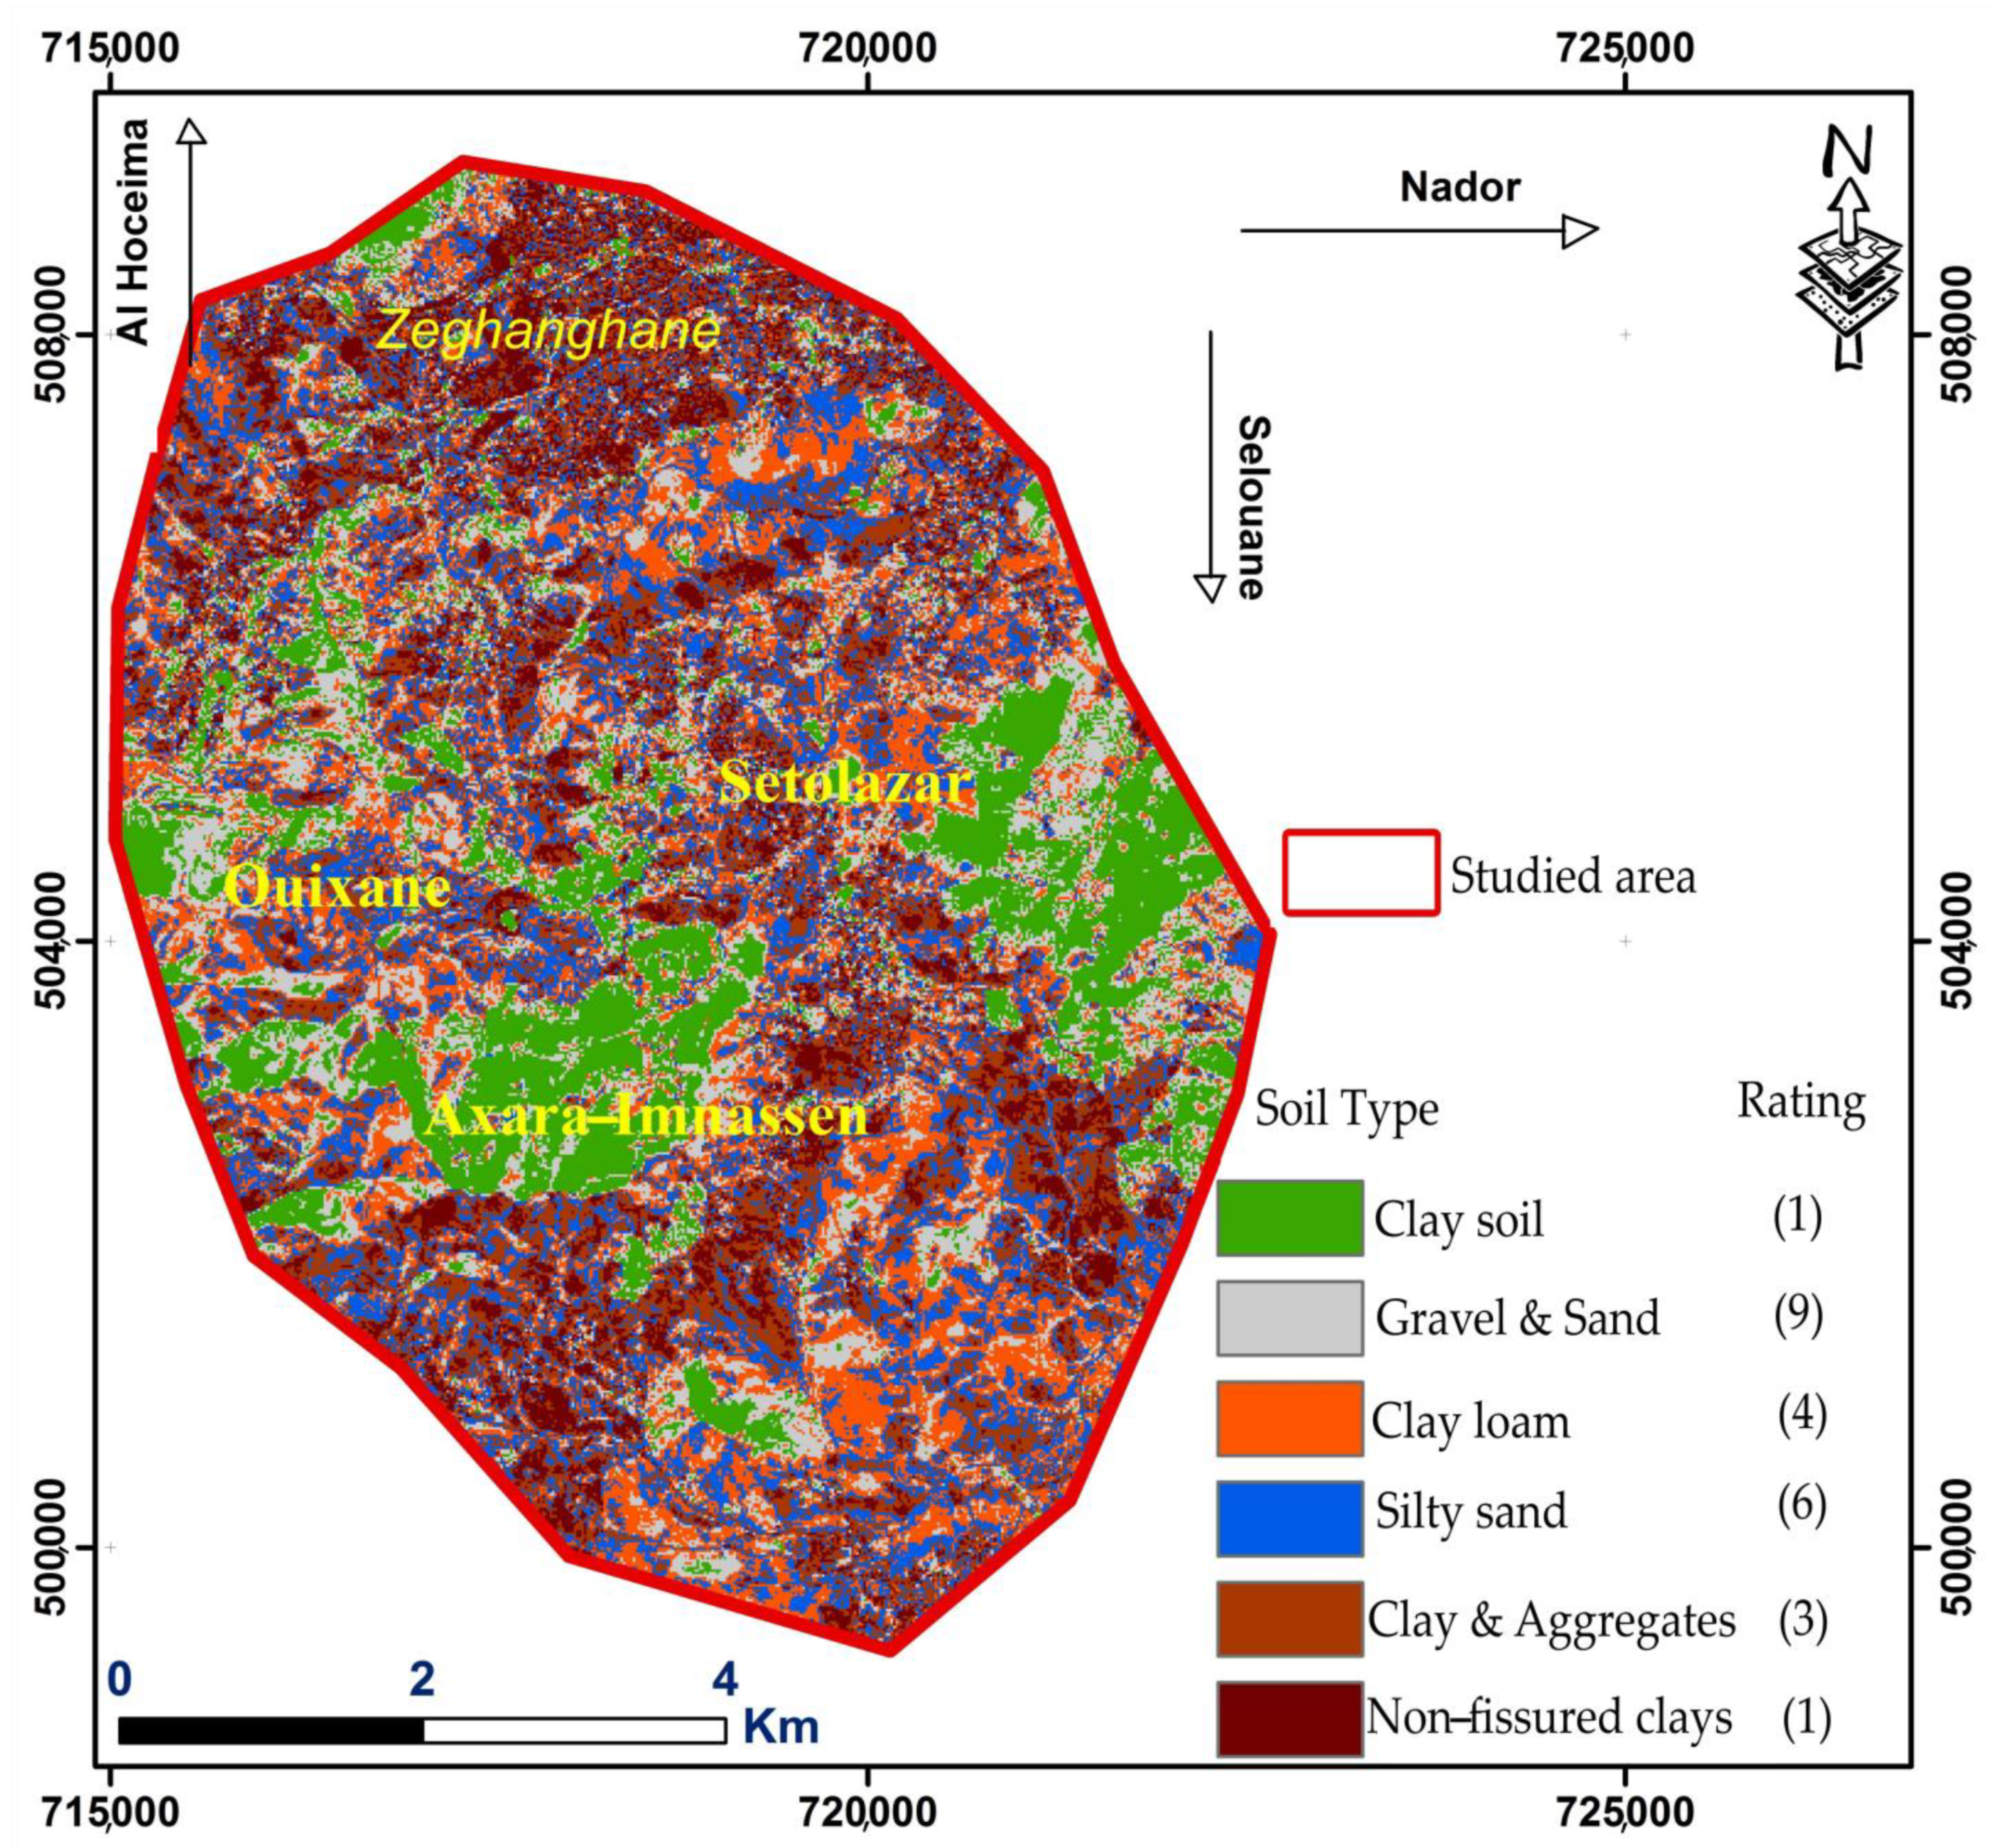
| S | None-gravel | 10 | 2 |
| Sand | 9 | ||
| Sandy-loam | 6 | ||
| Loam | 4 | ||
| Silty-loam | 3 | ||
| Clay | 1 | ||
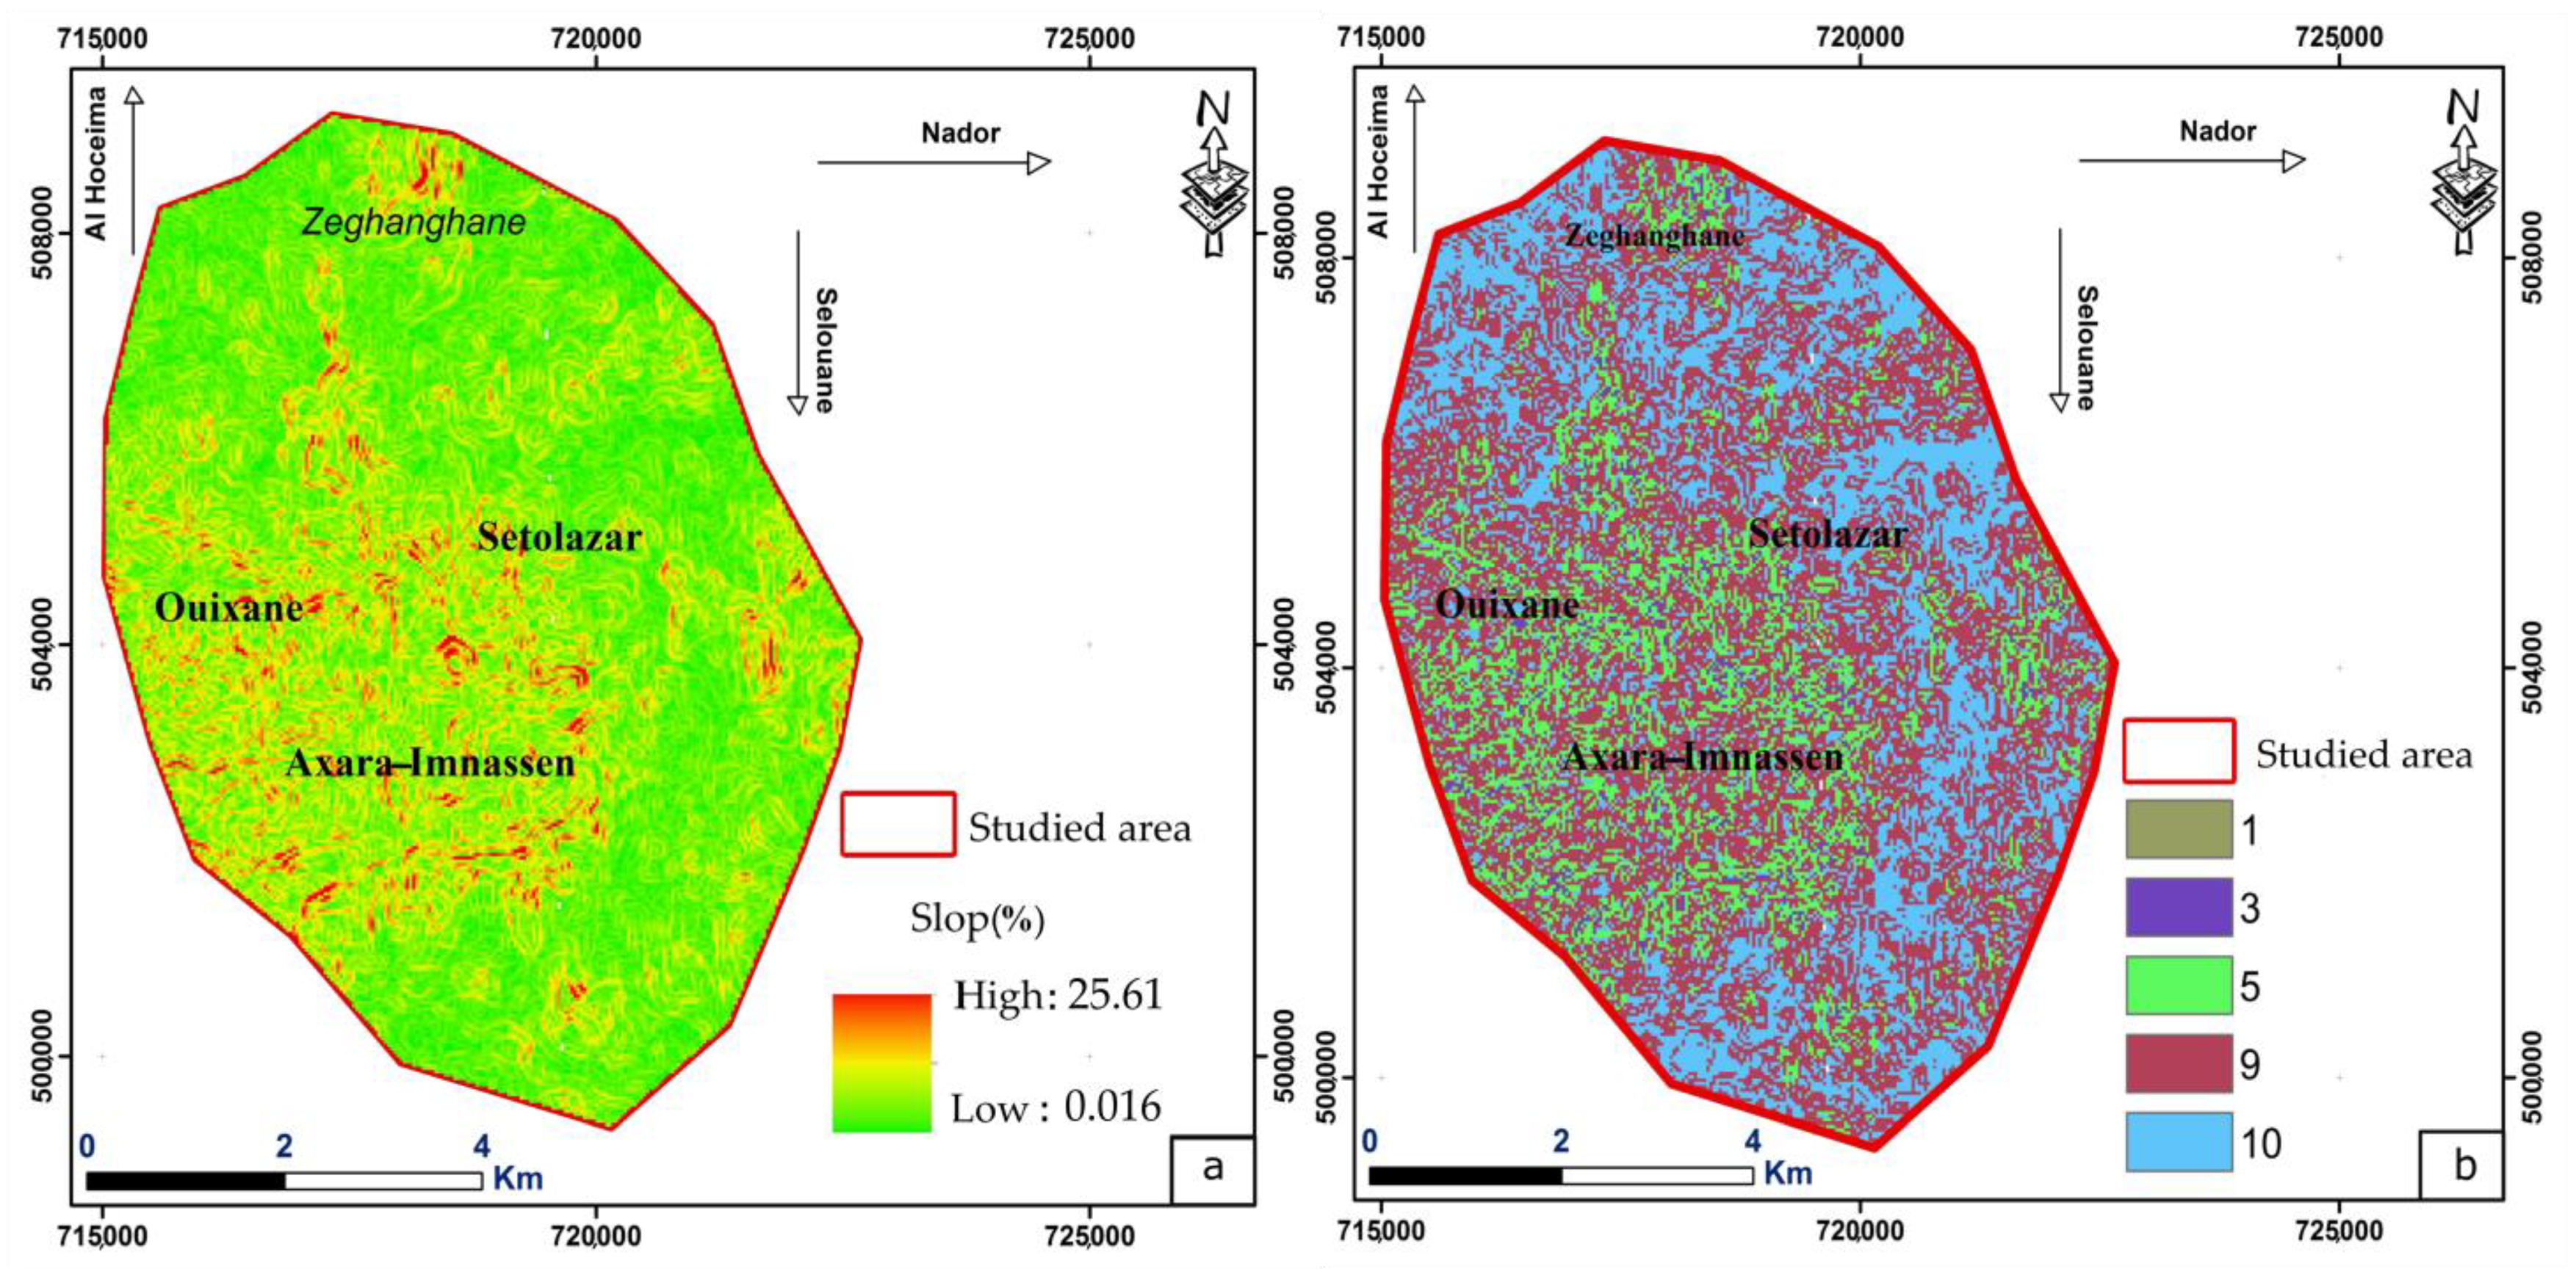
| T (%) | 0–2 | 10 | 1 |
| 2–6 | 9 | ||
| 6–12 | 5 | ||
| 12–18 | 3 | ||
| >18 | 1 | ||
| I | Silt, clay, and shale | 2 to 6 | 5 |
| Limestone | 2 to 5 | ||
| Sandstone | 2 to 7 | ||
| Sand, gravel with silt, and clay passage | 4 to 8 | ||
| Sand and gravel | 4 to 8 | ||
| Basalt | 2 to 10 | ||
| Karstic limestone | 8 to 10 |
3.3. Development of Groundwater Vulnerability Map and Risk Map
3.4. Sensibility Analysis
3.5. Model Validation
4. Results and Discussion
4.1. Vulnerability Map
4.1.1. Depth to Water Table (D)
4.1.2. Net Recharge (R)
4.1.3. Soil Media (S)
4.1.4. Topography (T)
4.1.5. Impact of the Vadose Zone (I)
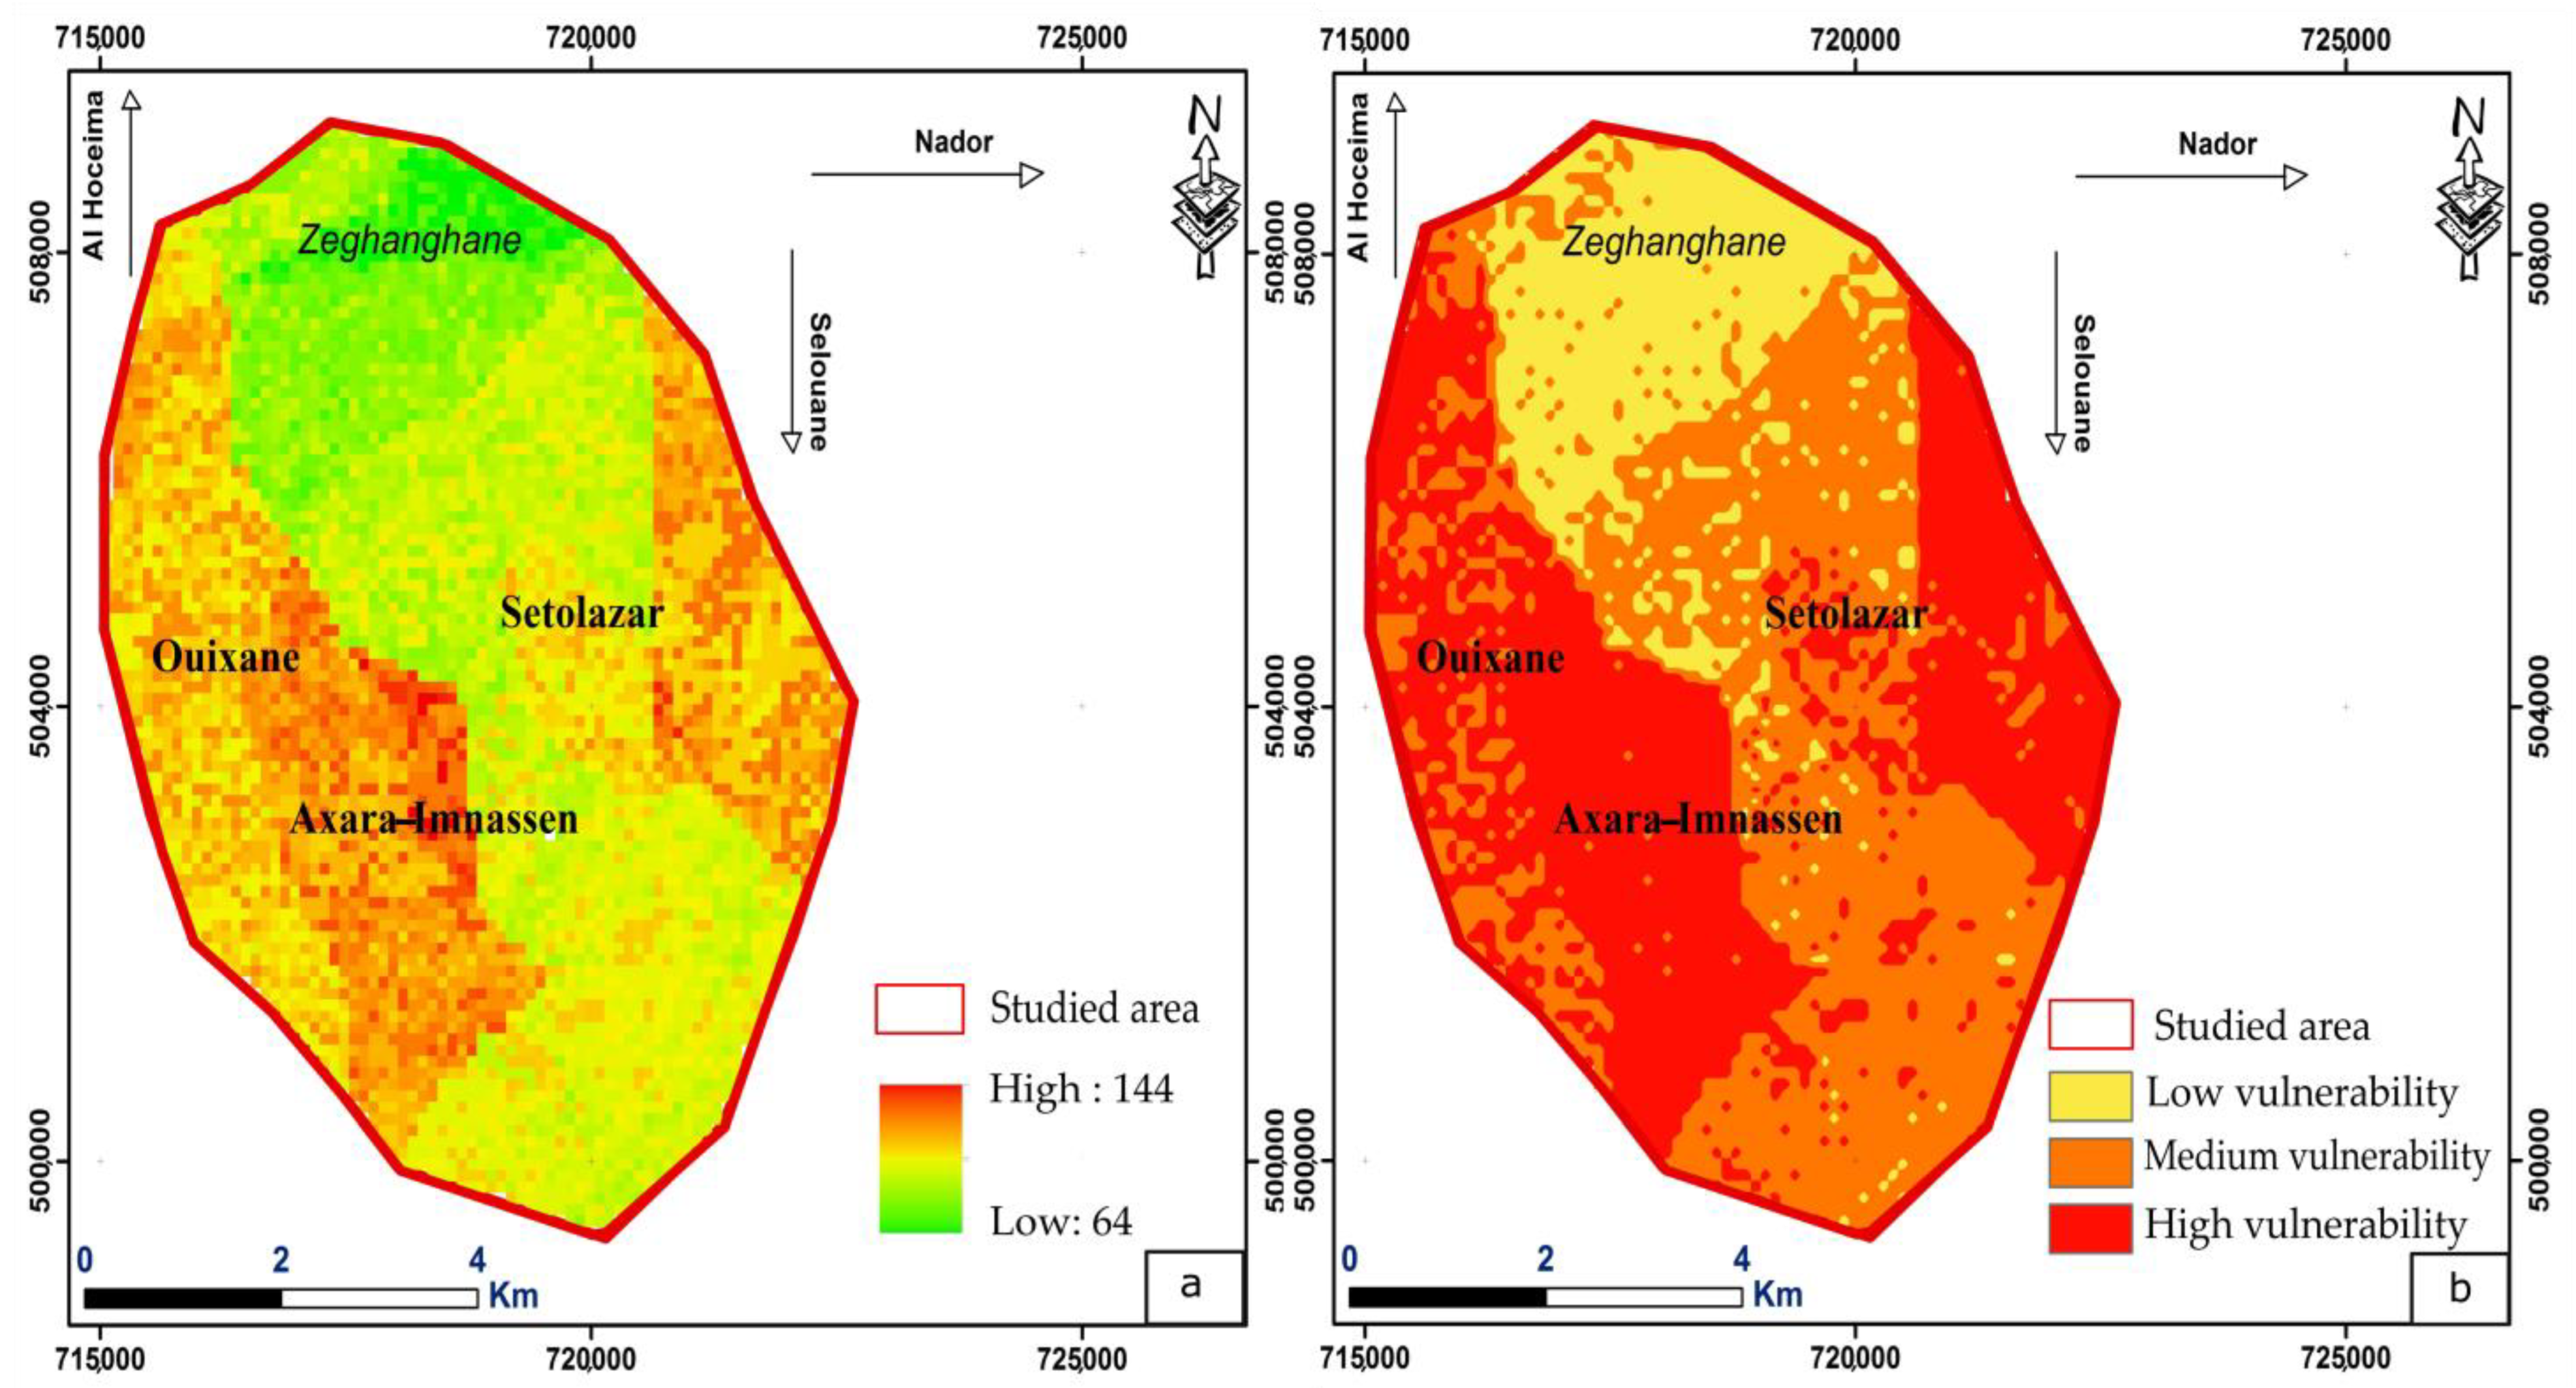
4.1.6. Groundwater Vulnerability Index Map (Vi)
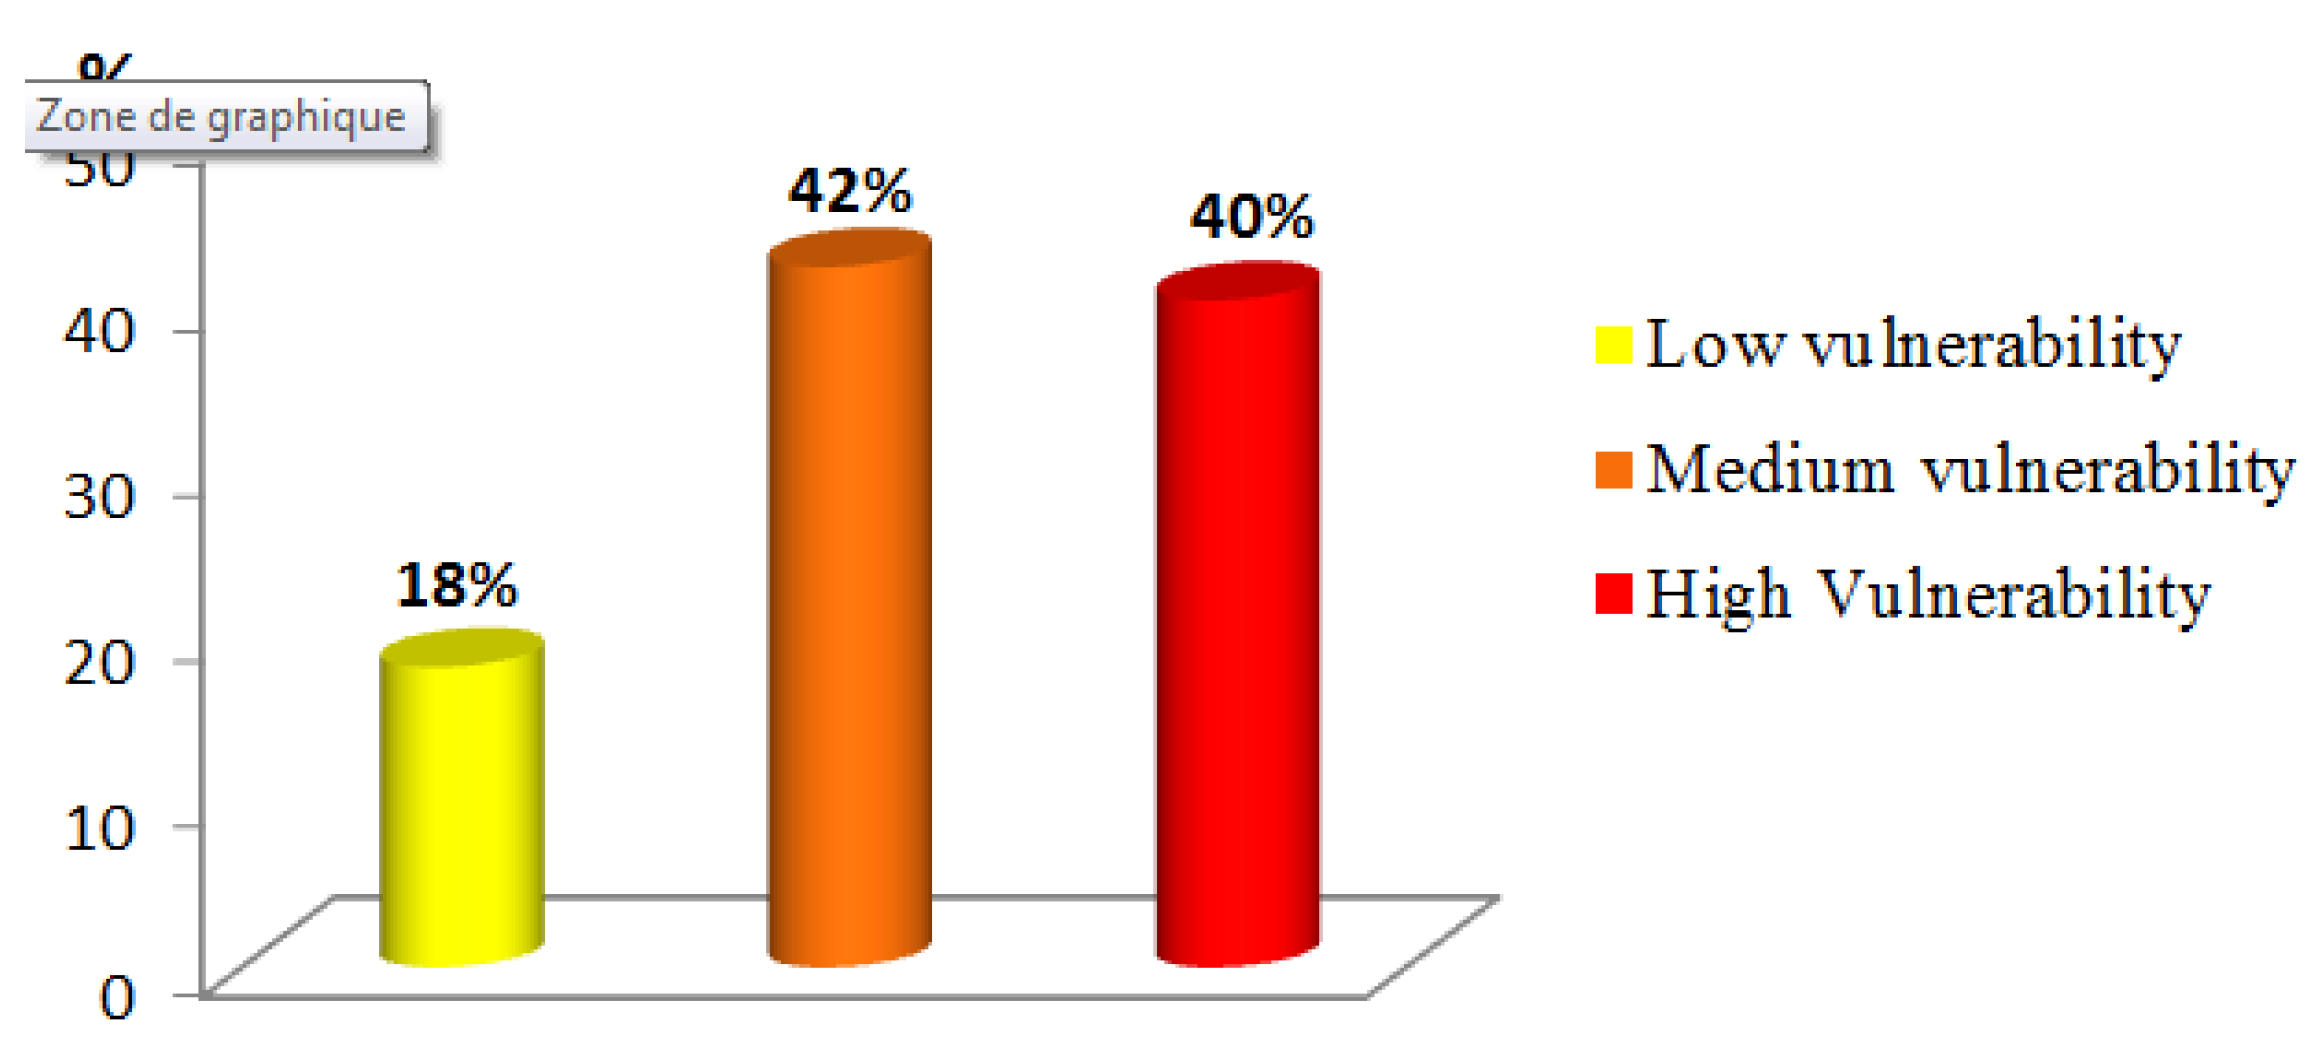
4.1.7. Groundwater Vulnerability
4.1.8. Model Validation and Sensitivity Analysis
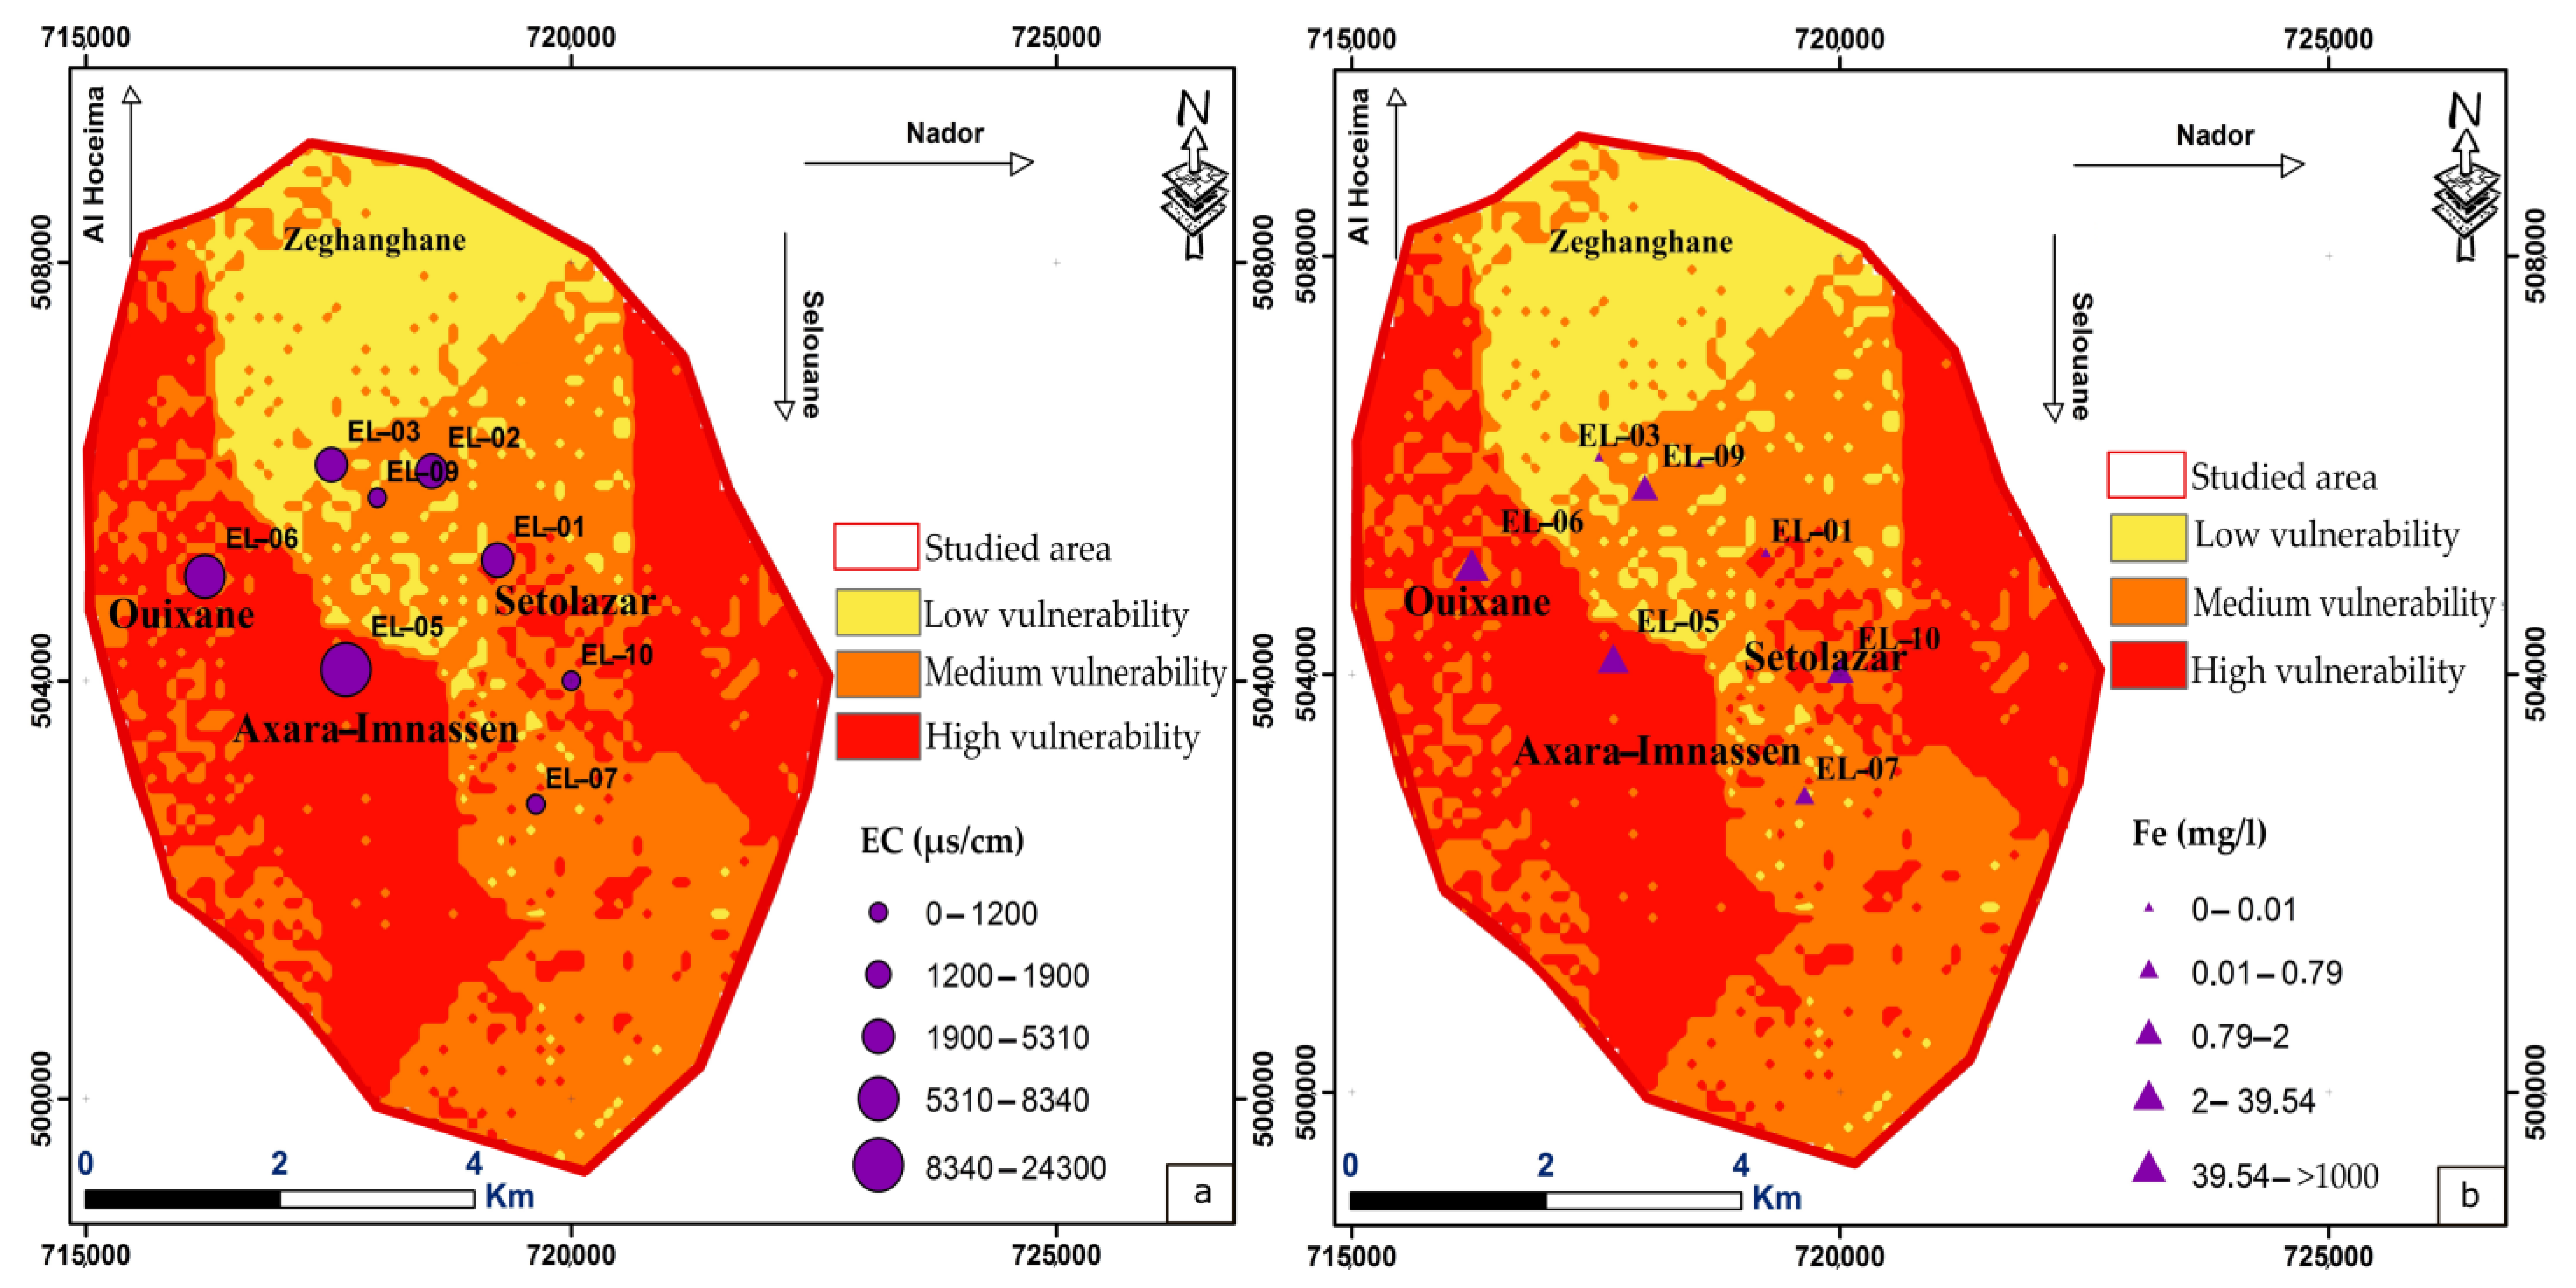
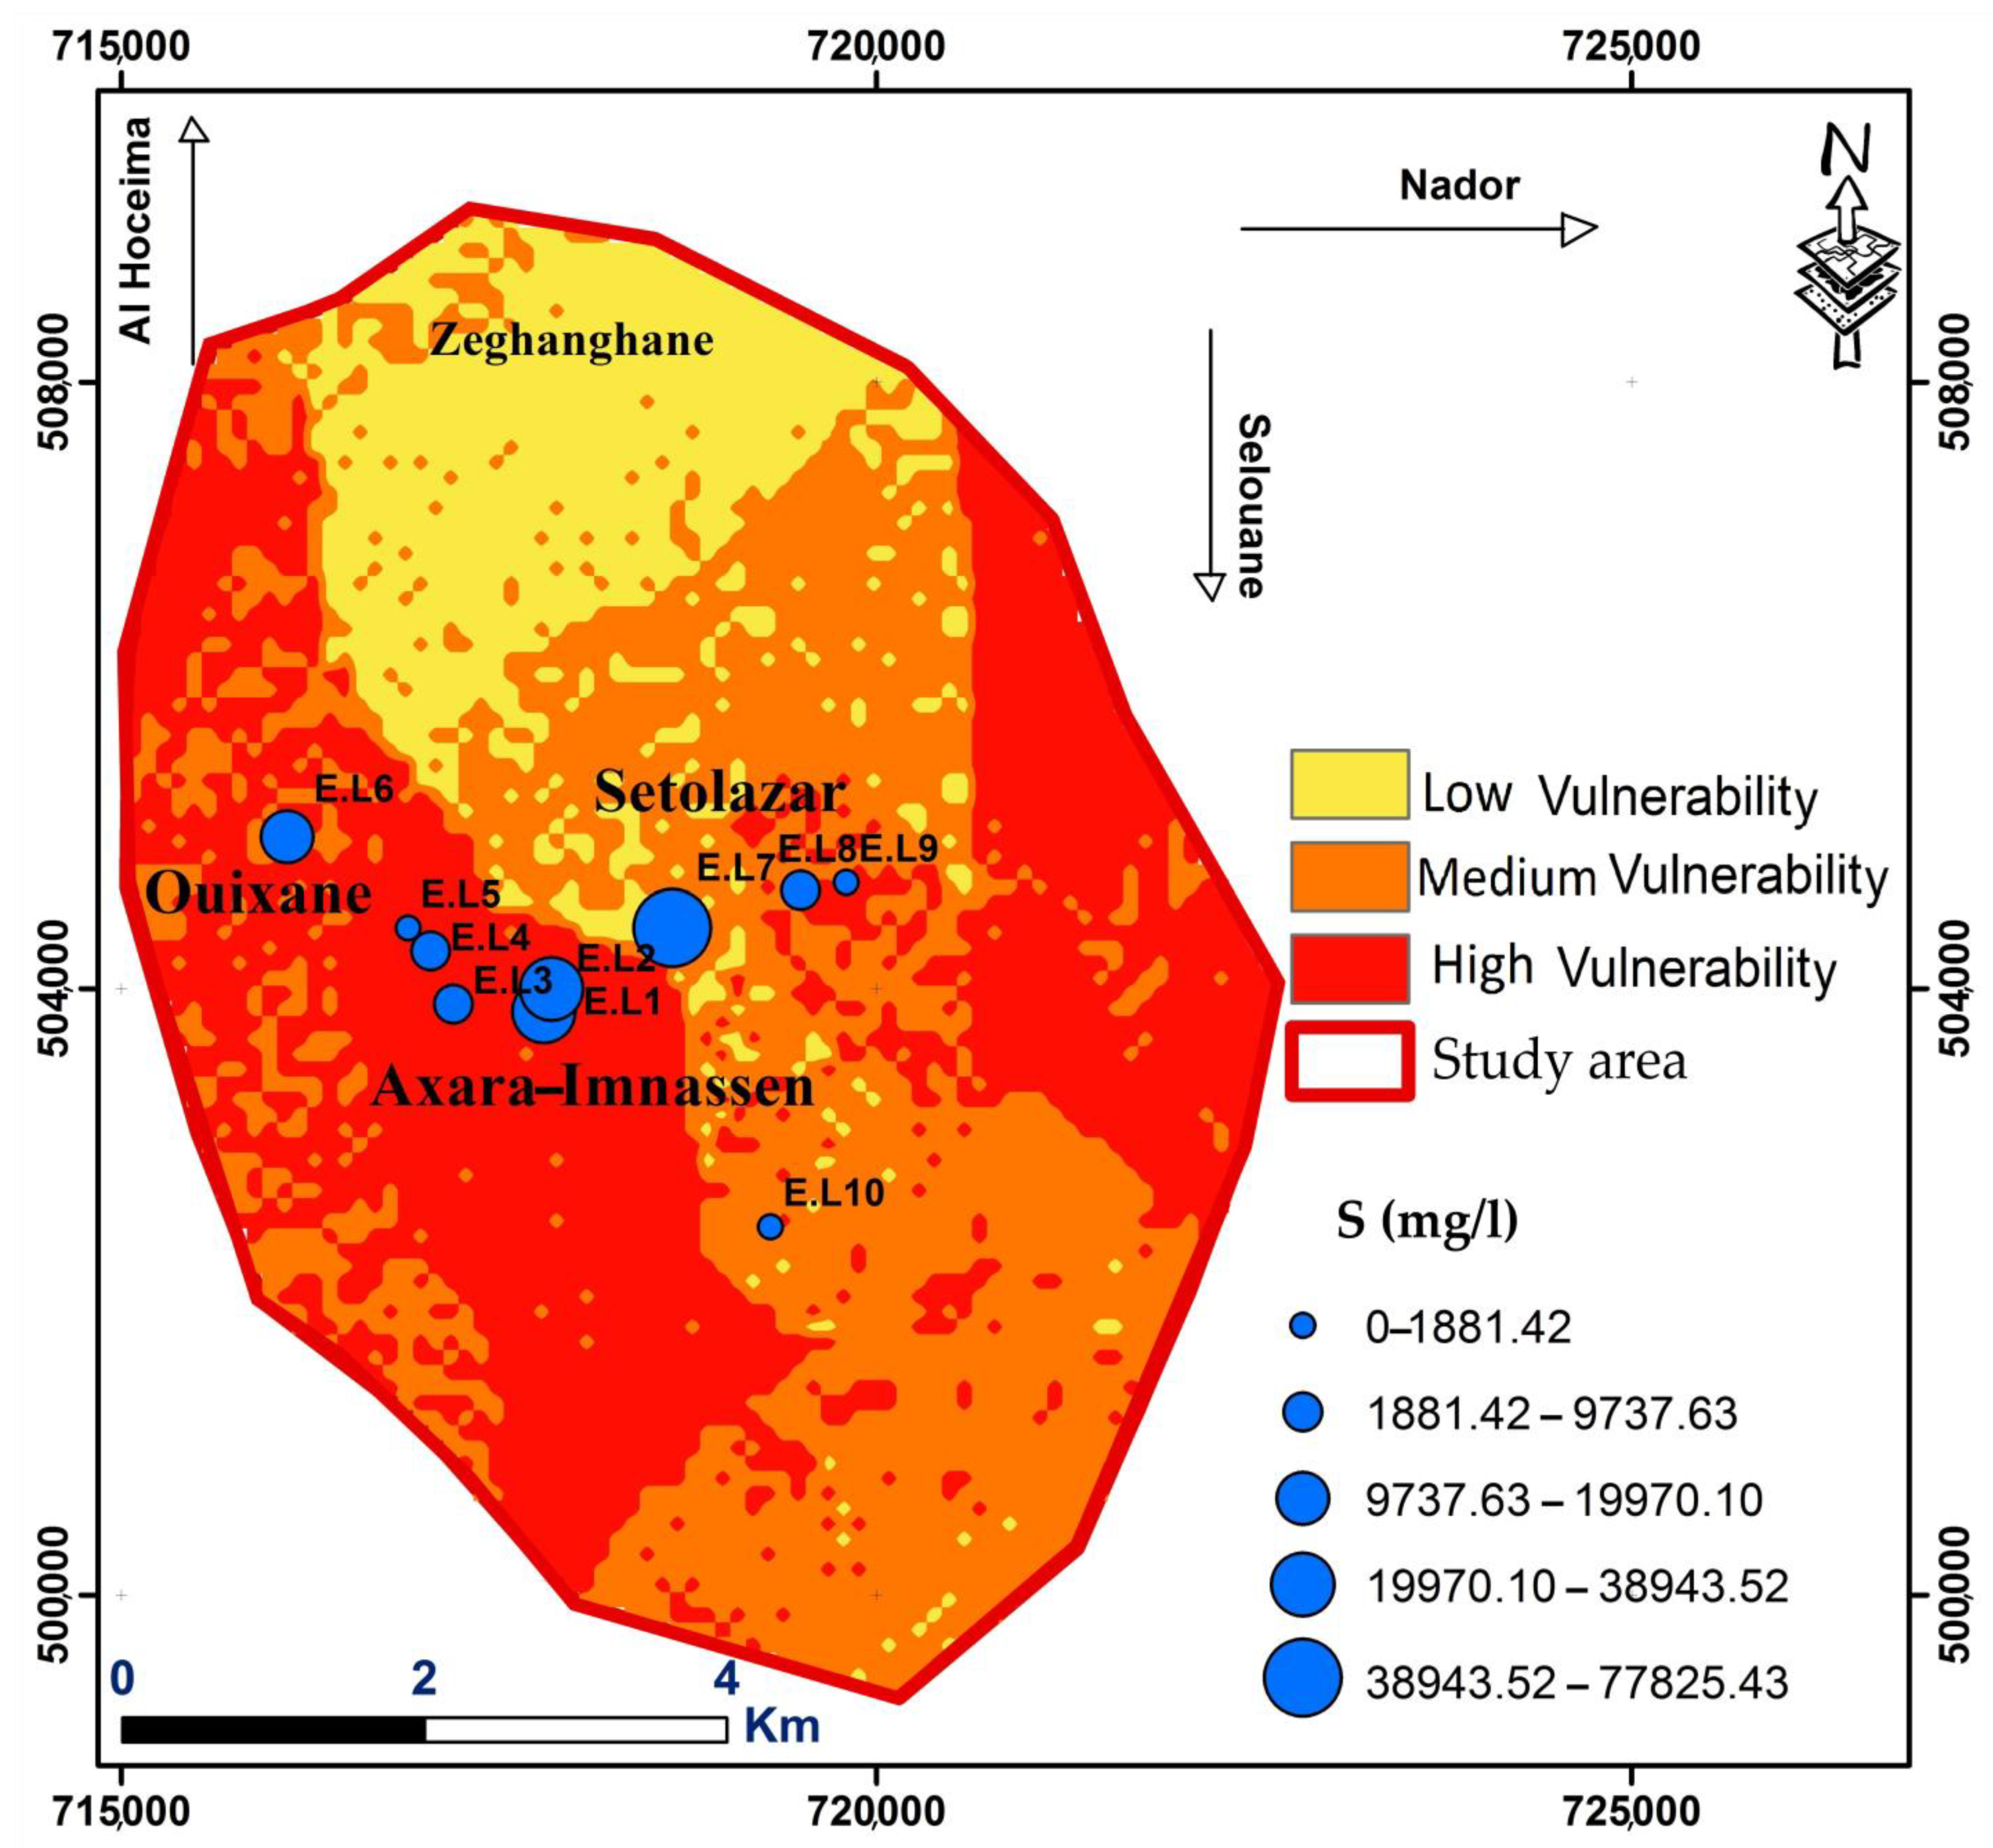
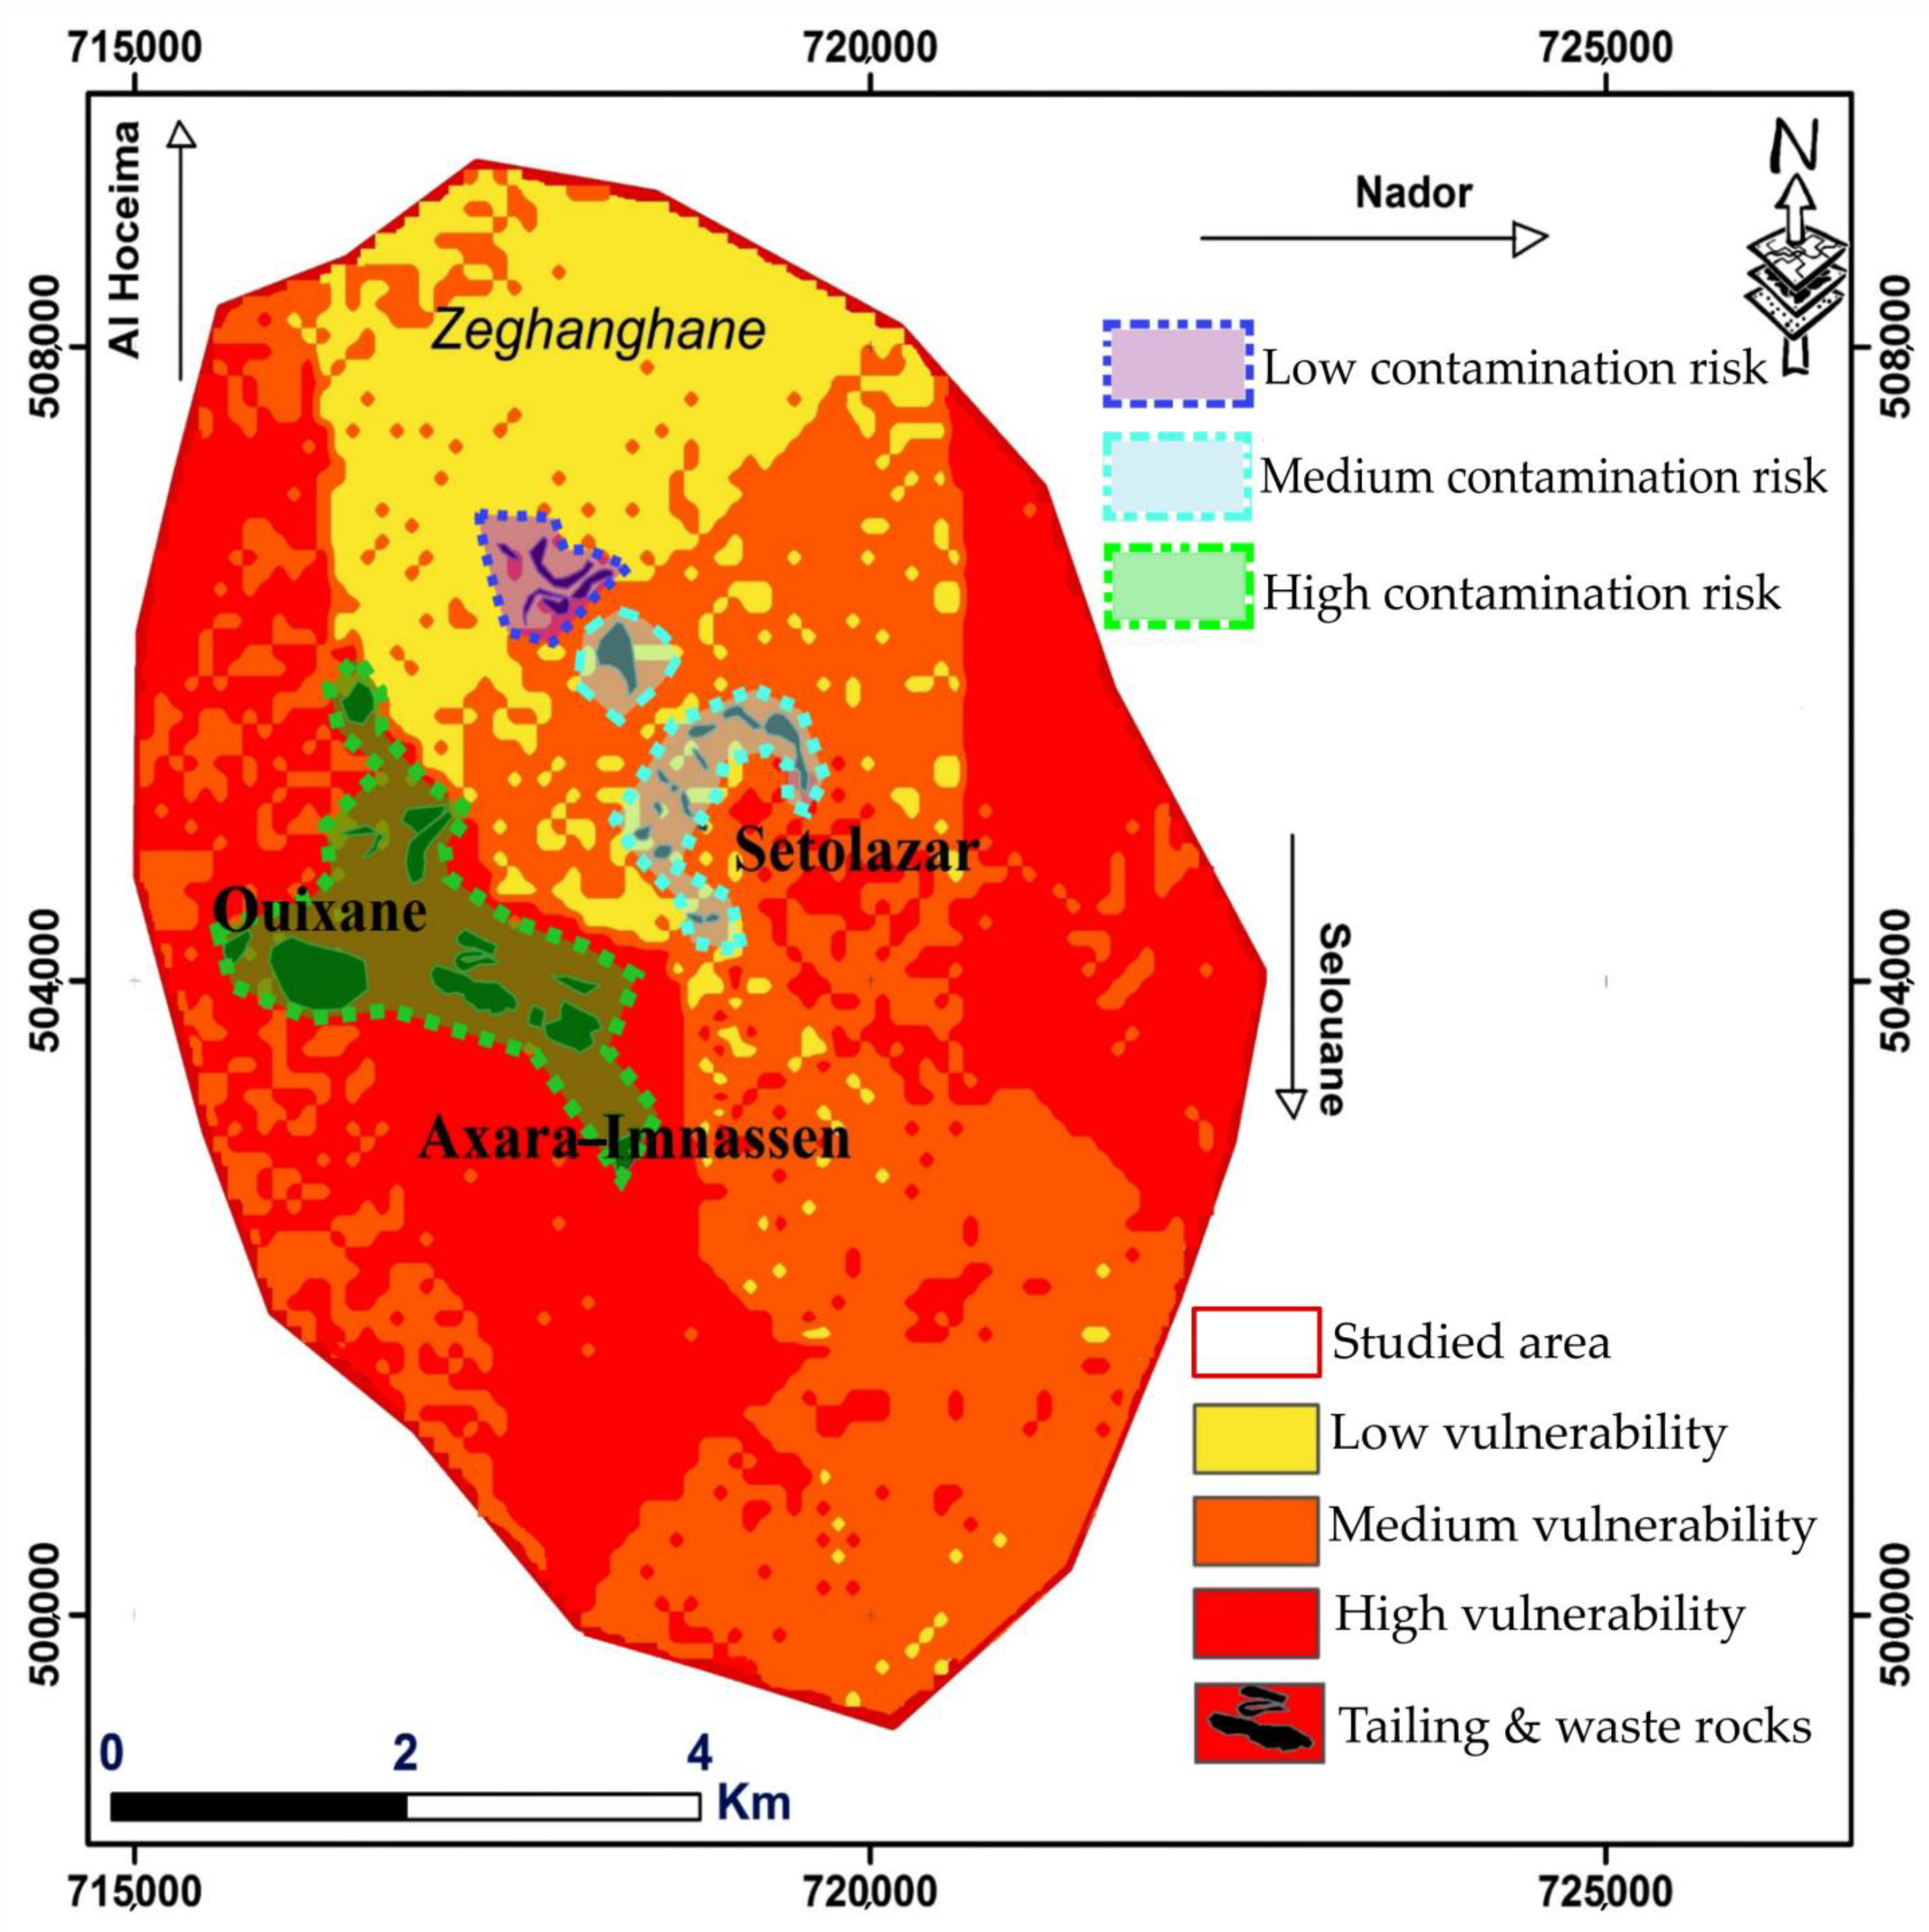
4.2. Groundwater Vulnerability Risk
5. Conclusions
- (1)
- Mapping of vulnerability zones, which is a decisive tool for identifying priority areas for intervention;
- (2)
- Study of the spatial distribution of the pollution sources (such as heavy metal contamination) on the one hand, and of the vulnerability zones on the other, which is decisive for the identification of high-risk contamination sites and therefore supports the management of mining waters pollution risks;
- (3)
- Identification of parameters involving vulnerability, which are crucial for a targeted intervention on these parameters to control the spread of mining contamination.
Author Contributions
Funding
Institutional Review Board Statement
Informed Consent Statement
Data Availability Statement
Conflicts of Interest
References
- Wang, X.; Cui, L.; Li, J.; Zhang, C.; Gao, X.; Fan, B.; Liu, Z. Water quality criteria for the protection of human health of 15 toxic metals and their human risk in surface water, China. Environ. Pollut. 2021, 276, 116628. [Google Scholar] [CrossRef] [PubMed]
- Guo, X.X.; Liu, H.T.; Zhang, J. The role of biochar in organic waste composting and soil improvement: A review. Waste Manag. 2020, 102, 884–899. [Google Scholar] [CrossRef] [PubMed]
- Khafouri, A.; Talbi, E.H.; Abdelouas, A. Assessment of Heavy Metal Contamination of the Environment in the Mining Site of Ouixane (North East Morocco). Water Air Soil Pollut. 2021, 232, 398. [Google Scholar] [CrossRef]
- Jabrane, R. Etudes Génétiques de la Minéralisation en fer de Nador (Maroc Nord Oriental). Ph.D. Dissertation, Université Libre de Bruxelles, Bruxelles, Belgium, 1993. [Google Scholar]
- Kerchaoui, S. Etude Géologique et Structurale du Massif des Beni Bou Ifrour (Rif Oriental, Maroc). Ph.D. Dissertation, Université de Paris-Sud, Paris, France, 1985. [Google Scholar]
- Chamrar, A.; Oujidi, M.; El Mandour, A.; Jilali, A. 3D geological modeling of Gareb-Bouareg basin in northeast Morocco. J. Afr. Earth Sci. 2019, 154, 172–180. [Google Scholar] [CrossRef]
- Rhazi, M.E.; Hayashi, K.I. Mineralogy, geochemistry, and age constraints on the Beni Bou Ifrour skarn type magnetite deposit, northeastern Morocco. Resour. Geol. 2002, 52, 25–39. [Google Scholar] [CrossRef]
- Lebret, N. Contexte Structural et Métallogénique des Skarns à Magnétite des Beni Bou Ifrour (Rif Oriental, Maroc). Apports à L’évolution Géodynamique de la Méditerranée occidentale. Ph.D. Dissertation, Université d’Orléans, Orléans, France, 2014. [Google Scholar]
- Lakrim, M.; Mesrar, L.; El Aroussi, O.; Lahrach, A.; Beaabidate, L.; Garouani, A.; Chaouni, A.; Tabyaoui, H.; Jabrane, R. Impact study of Mining waste of The Nador mine on the Environment (North-Eastern of Morocco). Revue LJEE 2011, 18, 78–94. [Google Scholar]
- Bouabdellah, M.; Jabrane, R.; Margoum, D.; Sadequi, M. Skarn to Porphyry-Epithermal Transition in the Ouixane Fe District, Northeast Morocco: Interplay of Meteoric Water and Magmatic-Hydrothermal Fluids. In Mineral Deposits of North Africa; Bouabdellah, M., Slack, J., Eds.; Springer: Cham, Switzerland, 2016. [Google Scholar] [CrossRef]
- Benidire, L.; Pereira, S.I.A.; Loqman, S.; Castro, P.M.L.; Boularbah, A. Physical, Chemical, and Microbiological Characterization of Kettara Mine Tailings, Morocco. Soil Syst. 2022, 6, 23. [Google Scholar] [CrossRef]
- Azzeddine, K.; El Hassan, T. Assessment of Metallic Contamination of Water Resources in the Area around the Abandoned Mining Site of Ouixane (North East Morocco). In Proceedings of the 4th Edition of International Conference on Geo-IT and Water Resources 2020, Al-Hoceima, Morocco, 11–12 March 2020; pp. 1–6. [Google Scholar]
- Fang, Z.; Liu, Z.; Zhao, S.; Ma, Y.; Li, X.; Gao, H. Assessment of Groundwater Contamination Risk in Oilfield Drilling Sites Based on Groundwater Vulnerability, Pollution Source Hazard, and Groundwater Value Function in Yitong County. Water 2022, 14, 628. [Google Scholar] [CrossRef]
- El Rhazi, M. Mineralogy, Geochemistry, and Age Constraints on the Beni Bou Ifrour Skarn Type Magnetite Deposit, Northeastern Morocco. Ph.D. Dissertation, Tohoku University, Sendai, Japan, 2002. [Google Scholar]
- Lyazidi, R.; Hessane, M.A.; Moutei, J.F.; Bahir, M.; Ouhamdouch, S. Management of water resource from semi arid area by elaborating database under GIS: Case of Gareb-Bouareg aquifer (Rif, Morocco). Arab. J. Geosci. 2019, 12, 352. [Google Scholar] [CrossRef]
- El Yaouti, F.; El Mandour, A.; Khattach, D.; Benavente, J.; Kaufmann, O. Salinization processes in the unconfined aquifer of Bou-Areg (NE Morocco): A geostatistical, geochemical, and tomographic study. Appl. Geochem. 2009, 24, 16–31. [Google Scholar] [CrossRef]
- Nguyen, T.T.; Ngo, H.H.; Guo, W.; Nguyen, H.Q.; Luu, C.; Dang, K.B.; Liu, Y.; Zhang, X. New approach of water quantity vulnerability assessment using satellite images and GIS-based model: An application to a case study in Vietnam. Sci. Total Environ. 2020, 737, 139784. [Google Scholar] [CrossRef] [PubMed]
- Knouz, N.; Boudhar, A.; Bachaoui, E.M.; Saadi, C. Comparative approach of three popular intrinsic vulnerability methods: Case of the Beni Amir groundwater (Morocco). Arab. J. Geosci. 2018, 11, 281. [Google Scholar] [CrossRef]
- Aller, L.; Bennett, T.; Lehr, J.; Petty, R.J.; Hackett, G. DRASTIC: A Standardized System for Evaluating Groundwater Pollution Potential Using Hydrogeologic Settings; US Environmental Protection Agency: Washington, DC, USA, 1987; 455p. [Google Scholar]
- Benjmel, K.; Amraoui, F.; Aydda, A.; Tahiri, A.; Yousif, M.; Pradhan, B.; Abdelrahman, K.; Fnais, M.S.; Abioui, M. A multidisciplinary approach for groundwater potential mapping in a fractured semi-arid terrain (Kerdous Inlier, Western Anti-Atlas, Morocco). Water 2022, 14, 1553. [Google Scholar] [CrossRef]
- Gonçalves, V.; Albuquerque, A.; Almeida, P.G.; Cavaleiro, V. DRASTIC Index GIS-Based Vulnerability Map for the Entre-os-Rios Thermal Aquifer. Water 2022, 14, 2448. [Google Scholar] [CrossRef]
- Machiwal, D.; Jha, M.K.; Singh, V.P.; Mohan, C. Assessment and mapping of groundwater vulnerability to pollution: Current status and challenges. Earth-Sci. Rev. 2018, 185, 901–927. [Google Scholar] [CrossRef]
- Li, R.; Merchant, J.W. Modeling vulnerability of groundwater to pollution under future scenarios of climate change and biofuels-related land use change: A case study in North Dakota, USA. Sci. Total Environ. 2013, 447, 32–45. [Google Scholar] [CrossRef] [Green Version]
- Wang, J.; He, J.; Chen, H. Assessment of groundwater contamination risk using hazard quantification, a modified DRASTIC model and groundwater value, Beijing Plain, China. Sci. Total Environ. 2012, 432, 216–226. [Google Scholar] [CrossRef]
- Barbulescu, A. Assessing groundwater vulnerability: DRASTIC and DRASTIC-like methods: A review. Water 2020, 12, 1356. [Google Scholar] [CrossRef]
- El Hmaidi, A.; Talhaoui, A.; Manssouri, I.; Jaddi, H.; Ben-Daoud, M.; Kasse, Z.; El Ouali, A.; Essahlaoui, A. Assessment of the physicochemical water quality of the Moulouya River, Morocco, using the SEQ-Eau index. Environ. Monit. Assess. 2022, 194, 37. [Google Scholar] [CrossRef]
- Hasan, M.; Islam, M.A.; Hasan, M.A.; Alam, M.J.; Peas, M.H. Groundwater vulnerability assessment in Savarupazila of Dhaka district, Bangladesh—A GIS-based DRASTIC modeling. Groundw. Sustain. Dev. 2019, 9, 100220. [Google Scholar] [CrossRef]
- Aslam, R.A.; Shrestha, S.; Pandey, V.P. Groundwater vulnerability to climate change: A review of the assessment methodology. Sci. Total Environ. 2018, 612, 853–875. [Google Scholar] [CrossRef] [PubMed]
- Aswathi, J.; Sajinkumar, K.S.; Rajaneesh, A.; Oommen, T.; Bouali, E.H.; Binojkumar, R.B.; Rani, V.R.; Thomas, J.; Thrivikramji, K.P.; Ajin, R.S.; et al. Furthering the precision of RUSLE soil erosion with PSInSAR data: An innovative model. Geocarto Int. 2022, 1–22. [Google Scholar] [CrossRef]
- Thapa, R.; Mirsky, S.B.; Tully, K.L. Cover crops reduce nitrate leaching in agroecosystems: A global meta-analysis. J. Environ. Qual. 2018, 47, 1400–1411. [Google Scholar] [CrossRef] [PubMed]
- Shirazi, S.M.; Imran, H.M.; Akib, S. GIS-based DRASTIC method for groundwater vulnerability assessment: A review. J. Risk Res. 2012, 15, 991–1011. [Google Scholar] [CrossRef]
- Asfaw, D.; Mengistu, D. Modeling megech watershed aquifer vulnerability to pollution using modified DRASTIC model for sustainable groundwater management, Northwestern Ethiopia. Groundw. Sustain. Dev. 2020, 11, 100375. [Google Scholar] [CrossRef]
- Malakootian, M.; Nozari, M. GIS-based DRASTIC and composite DRASTIC indices for assessing groundwater vulnerability in the Baghin aquifer, Kerman, Iran. Nat. Hazards Earth Syst. Sci. 2020, 20, 2351–2363. [Google Scholar] [CrossRef]
- Wu, X.; Li, B.; Ma, C. Assessment of groundwater vulnerability by applying the modified DRASTIC model in Beihai City, China. Environ. Sci. Pollut. Res. 2018, 25, 12713–12727. [Google Scholar] [CrossRef]
- Babiker, I.S.; Mohamed, M.A.; Hiyama, T.; Kato, K. A GIS-based DRASTIC model for assessing aquifer vulnerability in Kakamigahara Heights, Gifu Prefecture, central Japan. Sci. Total Environ. 2005, 345, 127–140. [Google Scholar] [CrossRef]
- Tiwari, A.K.; Singh, P.K.; De Maio, M. Evaluation of aquifer vulnerability in a coal mining of India by using GIS-based DRASTIC model. Arab. J. Geosci. 2016, 9, 438. [Google Scholar] [CrossRef]
- Sidibe, A.M.; Xueyu, L. Heavy metals and nitrate to validate groundwater sensibility assessment based on DRASTIC models and GIS: Case of the upper Niger and the Bani basin in Mali. J. Afr. Earth Sci. 2018, 147, 199–210. [Google Scholar] [CrossRef]
- Jang, W.S.; Engel, B.; Harbor, J.; Theller, L. Aquifer vulnerability assessment for sustainable groundwater management using DRASTIC. Water 2017, 9, 792. [Google Scholar] [CrossRef] [Green Version]
- Kostyuchenko, Y.; Artemenko, I.; Abioui, M.; Benssaou, M. Global and Regional Climatic Modeling. In Encyclopedia of Mathematical Geosciences; DayaSagar, B., Cheng, Q., McKinley, J., Agterberg, F., Eds.; Springer: Cham, Switzerland, 2022. [Google Scholar] [CrossRef]
- Tekken, V.; Kropp, J.P. Climate-Driven or Human-Induced: Indicating Severe Water Scarcity in the Moulouya River Basin (Morocco). Water 2012, 4, 959–982. [Google Scholar] [CrossRef] [Green Version]
- Chitsazan, M.; Akhtari, Y. A GIS-based DRASTIC model for assessing aquifer vulnerability in Kherran Plain, Khuzestan, Iran. Water Resour. Manag. 2009, 23, 1137–1155. [Google Scholar] [CrossRef]
- Chaturvedi, M.C.; Srivastava, V.K. Induced groundwater recharge in the Ganges basin. Water Resour. Res. 1979, 15, 1156–1166. [Google Scholar] [CrossRef]
- Al-Abadi, A.M.; Al-Shamma’a, A.M.; Aljabbari, M.H. A GIS-based DRASTIC model for assessing intrinsic groundwater vulnerability in northeastern Missan governorate, southern Iraq. Appl. Water Sci. 2017, 7, 89–101. [Google Scholar] [CrossRef] [Green Version]
- Kazakis, N.; Voudouris, K.S. Groundwater vulnerability and pollution risk assessment of porous aquifers to nitrate: Modifying the DRASTIC method using quantitative parameters. J. Hydrol. 2015, 525, 13–25. [Google Scholar] [CrossRef]
- Souleymane, K.; Zhonghua, T. A novel method of sensitivity analysis testing by applying the DRASTIC and fuzzy optimization methods to assess groundwater vulnerability to pollution: The case of the Senegal River basin in Mali. Nat. Hazards Earth Syst. Sci. 2017, 17, 1375–1392. [Google Scholar] [CrossRef] [Green Version]
- Atiqur, R. A GIS based DRASTIC model for assessing groundwater vulnerability in shallow aquifer in Aligarh, India. Appl. Geogr. 2008, 28, 32–53. [Google Scholar] [CrossRef]
- Le, T.N.; Tran, D.X.; Tran, T.V.; Gyeltshen, S.; Lam, T.V.; Luu, T.H.; Nguyen, D.Q.; Dao, T.V. Estimating Soil Water Susceptibility to Salinization in the Mekong River Delta Using a Modified DRASTIC Model. Water 2021, 13, 1636. [Google Scholar] [CrossRef]
- Baghapour, M.A.; Fadaei Nobandegani, A.; Talebbeydokhti, N.; Bagherzadeh, S.; Nadiri, A.A.; Gharekhani, M.; Chitsazan, N. Optimization of DRASTIC method by artificial neural network, nitrate vulnerability index, and composite DRASTIC models to assess groundwater vulnerability for unconfined aquifer of Shiraz Plain, Iran. J. Environ. Health Sci. Eng. 2016, 14, 13. [Google Scholar] [CrossRef] [Green Version]
- Abiy, A.Z.; Melesse, A.M. Evaluation of watershed scale changes in groundwater and soil moisture storage with the application of GRACE satellite imagery data. Catena 2017, 153, 50–60. [Google Scholar] [CrossRef] [Green Version]
- Witkowski, A.J. Groundwater vulnerability: From scientific concept to practical application. Environ. Earth Sci. 2016, 75, 1134. [Google Scholar] [CrossRef] [Green Version]
- Abera, K.A.; Gebreyohannes, T.; Abrha, B.; Hagos, M.; Berhane, G.; Hussien, A.; Belay, A.S.; Van Camp, M.; Walraevens, K. Vulnerability Mapping of Groundwater Resources of Mekelle City and Surroundings, Tigray Region, Ethiopia. Water 2022, 14, 2577. [Google Scholar] [CrossRef]
- Lghoul, M.; Maqsoud, A.; Hakkou, R.; Kchikach, A. Hydrogeochemical behavior around the abandoned Kettara mine site, Morocco. J. Geochem. Explor. 2014, 144, 456–467. [Google Scholar] [CrossRef]
- Mabroum, S.; Moukannaa, S.; El Machi, A.; Taha, Y.; Benzaazoua, M.; Hakkou, R. Mine wastes based geopolymers: A critical review. Clean. Eng. Technol. 2020, 1, 100014. [Google Scholar] [CrossRef]


| Vulnerability Classes | Vulnerability Index |
|---|---|
| Very low | 27 < Vi ≤ 50 |
| Low | 50 < Vi ≤ 80 |
| Medium | 80 < Vi ≤ 110 |
| High | 110 < Vi ≤ 140 |
| Very high | 140 < Vi ≤ 166 |
| Parameters | Theoretical Weighting | Theoretical Weighting (%) | Effective Weighting (%) | |||
|---|---|---|---|---|---|---|
| Average | Minimum | Maximum | Standard Deviation | |||
| D | 5 | 29.41 | 28.85 | 23.44 | 31.25 | 32.27 |
| R | 4 | 23.53 | 32.69 | 50 | 25 | 7.07 |
| S | 2 | 11.76 | 8.85 | 3.13 | 12.50 | 15.25 |
| T | 1 | 5.88 | 5.38 | 1.56 | 6.94 | 9.62 |
| I | 5 | 29.41 | 27.47 | 15.63 | 31.25 | 32.04 |
Disclaimer/Publisher’s Note: The statements, opinions and data contained in all publications are solely those of the individual author(s) and contributor(s) and not of MDPI and/or the editor(s). MDPI and/or the editor(s) disclaim responsibility for any injury to people or property resulting from any ideas, methods, instructions or products referred to in the content. |
© 2022 by the authors. Licensee MDPI, Basel, Switzerland. This article is an open access article distributed under the terms and conditions of the Creative Commons Attribution (CC BY) license (https://creativecommons.org/licenses/by/4.0/).
Share and Cite
Khafouri, A.; Talbi, E.H.; Abdelouas, A.; Benjmel, K.; Antunes, I.M.H.R.; Abioui, M. Groundwater Vulnerability and Potentially Toxic Elements Associated with the Iron Mining District of Ouixane (Northeast of Morocco). Water 2023, 15, 118. https://doi.org/10.3390/w15010118
Khafouri A, Talbi EH, Abdelouas A, Benjmel K, Antunes IMHR, Abioui M. Groundwater Vulnerability and Potentially Toxic Elements Associated with the Iron Mining District of Ouixane (Northeast of Morocco). Water. 2023; 15(1):118. https://doi.org/10.3390/w15010118
Chicago/Turabian StyleKhafouri, Azzeddine, El Hassan Talbi, Abdessalam Abdelouas, Khalid Benjmel, Isabel Margarida Horta Ribeiro Antunes, and Mohamed Abioui. 2023. "Groundwater Vulnerability and Potentially Toxic Elements Associated with the Iron Mining District of Ouixane (Northeast of Morocco)" Water 15, no. 1: 118. https://doi.org/10.3390/w15010118