
Impacts of Grass Coverage and Arrangement Patterns on Runoff and Sediment Yield in Slope-Gully System of the Loess Plateau, China

1
Changjiang River Scientific Research Institute, Changjiang Water Resource Commission, Wuhan 430010, China
2
Research Center on Mountain Torrent Geological Disaster Prevention of Ministry of Water Resources, Wuhan 430010, China
3
State Key Laboratory of Hydraulics and Mountain River Engineering, Sichuan University, Chengdu 610065, China
*
Author to whom correspondence should be addressed.
Water 2023, 15(1), 133; https://doi.org/10.3390/w15010133
Submission received: 20 November 2022
/
Revised: 27 December 2022
/
Accepted: 28 December 2022
/
Published: 30 December 2022
(This article belongs to the Special Issue Flash Floods: Forecasting, Monitoring and Mitigation Strategies)
Abstract
:Both vegetation coverage rates and arrangement patterns have important influences on erosion. Very little previous research focuses on the impacts of spatial vegetation distribution patterns on erosion. The slope-gully system was taken as the research object, which is composed of a 5.0 m long hillslope with a slope gradient of 20° and a 3.0 m long gully slope with a gradient of 50°. A series of scouring experiments with two inflow discharges (3.2 L min−1, 5.2 L min−1) was carried out. The effects of the flow discharges, spatial grass arrangement patterns (US, MS, and DS represent the presence of grass covering on up-hillslope, middle-hillslope, and down-hillslope, respectively) and grass coverage rates (0%, 30%, 50%, 70%, and 90%) on runoff and sediment were studied in this paper. The results indicated that either runoff or sediment yielding was significantly decreased with the grass coverage rates increasing and with the variation of grass arrangement patterns on a hillslope. While grass coverage had more effectiveness in controlling erosion compared with runoff reduction, and DS can control erosion more effectively than US and MS erosion controlling. For the gully slope, erosion significantly increased with the grass coverage rates increasing no matter how the grass arrangement patterns on the hillslope. Therefore, both different grass coverage and different grass arrangement patterns have an influence on erosion processes; any research that only takes care of the single factor mentioned above is not enough to reveal the effects of grass on erosion. In the process of erosion control in the Loess Plateau, taking effective measures both on the hillslope and gully slope will be effective methods of reducing soil erosion.
1. Introduction
Soil erosion is a worldwide serious environmental problem for most farming lands in the world. It not only threatens the future development of agriculture and society but can also cause soil quality to decrease and land productivity to decline [1,2]. Particularly in the Loess Plateau of China, erosion amounts have increased with the loss of vegetation cover, where the area of soil loss reaches 43 × 104 km2, with an average annual soil loss of 3720 t km−2, at higher elevations. The amount of erosion has been reported to exceed even 10,000 t km−2 [3,4]. How to recover vegetation to effectively reduce soil loss has become an essential environmental issue and has attracted increasing attention over the recent several decades.
Vegetation coverage has an important role in effectively controlling soil erosion by runoff and improving the ecological environment, as has been demonstrated by many researchers [5,6,7,8,9,10]. The importance of vegetative coverage in reducing soil erosion has also been reported in a variety of literature [11,12]. With the Universal Soil Loss Equation (USLE), soil loss rates are hypothesized to be the highest on bare soil and to decrease linearly with the increase in soil surface coverage [13]. However, Rogers and Schumm reported that the relationship between vegetation coverage and erosion varied considerably rather than with a simple linear relationship, particularly for low-cover conditions [14]. Cerda also indicated that exponential functions existed between erosion levels and that linear models are not generally applicable through either field or laboratory experimental studies [15].
Different parts of vegetation (canopy, understory, and plant roots) typically have differing roles in regulating the surface hydrological processes, a factor that results in the variation of the erosive forces of rainfall [16]. In order to reveal the mechanism of the vegetation reducing water erosion, much research works has been conducted to separate the effects of the aboveground biomass or plant canopy from the belowground biomass in runoff and sediment flux reduction [17,18,19]. In addition, the fact that the spatial distribution or patterns of vegetation have the differing erosion reduction roles has come to be realized in many parts of the world in recent years [15]. A few studies have revealed that different spatial vegetation arrangements on slope divide the slope into runon and runoff areas, and then into erosion and deposition areas acting as sediment sources and sinks, respectively [20]. Neibling and Alberts [21] reported that grassland buffer zone decreased more than 90% sediment yielding on 5.0 m long slope, and over 91% of the sediment was deposited at 0.6 m grass buffer area from top of the slope. Dillaha [22] compared the effects of different slope gradients on sediment reduction while keeping other factors constant, and found that the slope gradient was inversely proportional to the sediment capture. Runoff sediment concentration flowing out of vegetation buffer zone is a function of runoff sediment concentration flowing into vegetation buffer strip and buffer strip width. All these studies demonstrated that different vegetation coverage and different vegetation spatial arrangement are effective for sediment decreasing, also provided the basic theory to reveal the mechanism of vegetation reducing soil erosion.
Although there has been much research on vegetation reducing erosion, impacts of different vegetation coverage and different vegetation arrangement patterns on the slope-gully system has rarely been reported. Due to the particularity of the Loess Plateau, from the up-slope boundary to the gully edges, both erosion forms and intensity have shown significant vertical zonation. Significant impacts of runoff from upper slope on down-slope sediment transport process [23,24,25]. Therefore, some researchers have recognized that hillslope and gully slope are the basic topography units of Loess Plateau, any research including alone hillslope or gully slope cannot response the actual erosion process of the entire erosion system [26,27,28]. In addition, since the middle of the last century, two crucial problems have aroused controversy in many scholars. There are two main points of contention. One is which section in the slope-gully system is the key erosion controlling area, if only restore hillslope vegetation can achieve the goal of soil erosion controlling effective? The other one is which of the two parts, the hillsolpe or gully slope is the main source of sediment yield? Both of the two controversies indicate that the related research is still lacking. So, the objective of present study are: (i) to assess the impact of grass coverage degrees and spatial arrangements on runoff and sediment yield both on hillslope and gully slope; (ii) to analyze the relative contribution of hillslope and gully side account for the total erosion on entire hillslope-gully system; (iii) to understand the validity of the policy on soil and water conservations in Loess Plateau.
2. Materials and Methods
2.1. Soil Sample Collection
The soil used in this study was collected from Zhengzhou, Henan province, China. The content of clay, silt and sand is 10.8%, 28.16%, and 61.04%, respectively. The soil is classified as Alfisol according to the U.S. Soil Taxonomy. The pH value of soil is 7.2. The natural consolidated soil has a bulk density about 1.3 g cm−3 and with an organic matter content of 1.93%. The soil texture information is listed in Table 1. The soil was taken from a cultivated land with a depth of 0–0.3 m, and the soil was evenly taken down along the top of the slope. Sufficient amount of soil was transported back to the laboratory for experiments. All the soil used in study was air-dried.
2.2. Experimental Setup
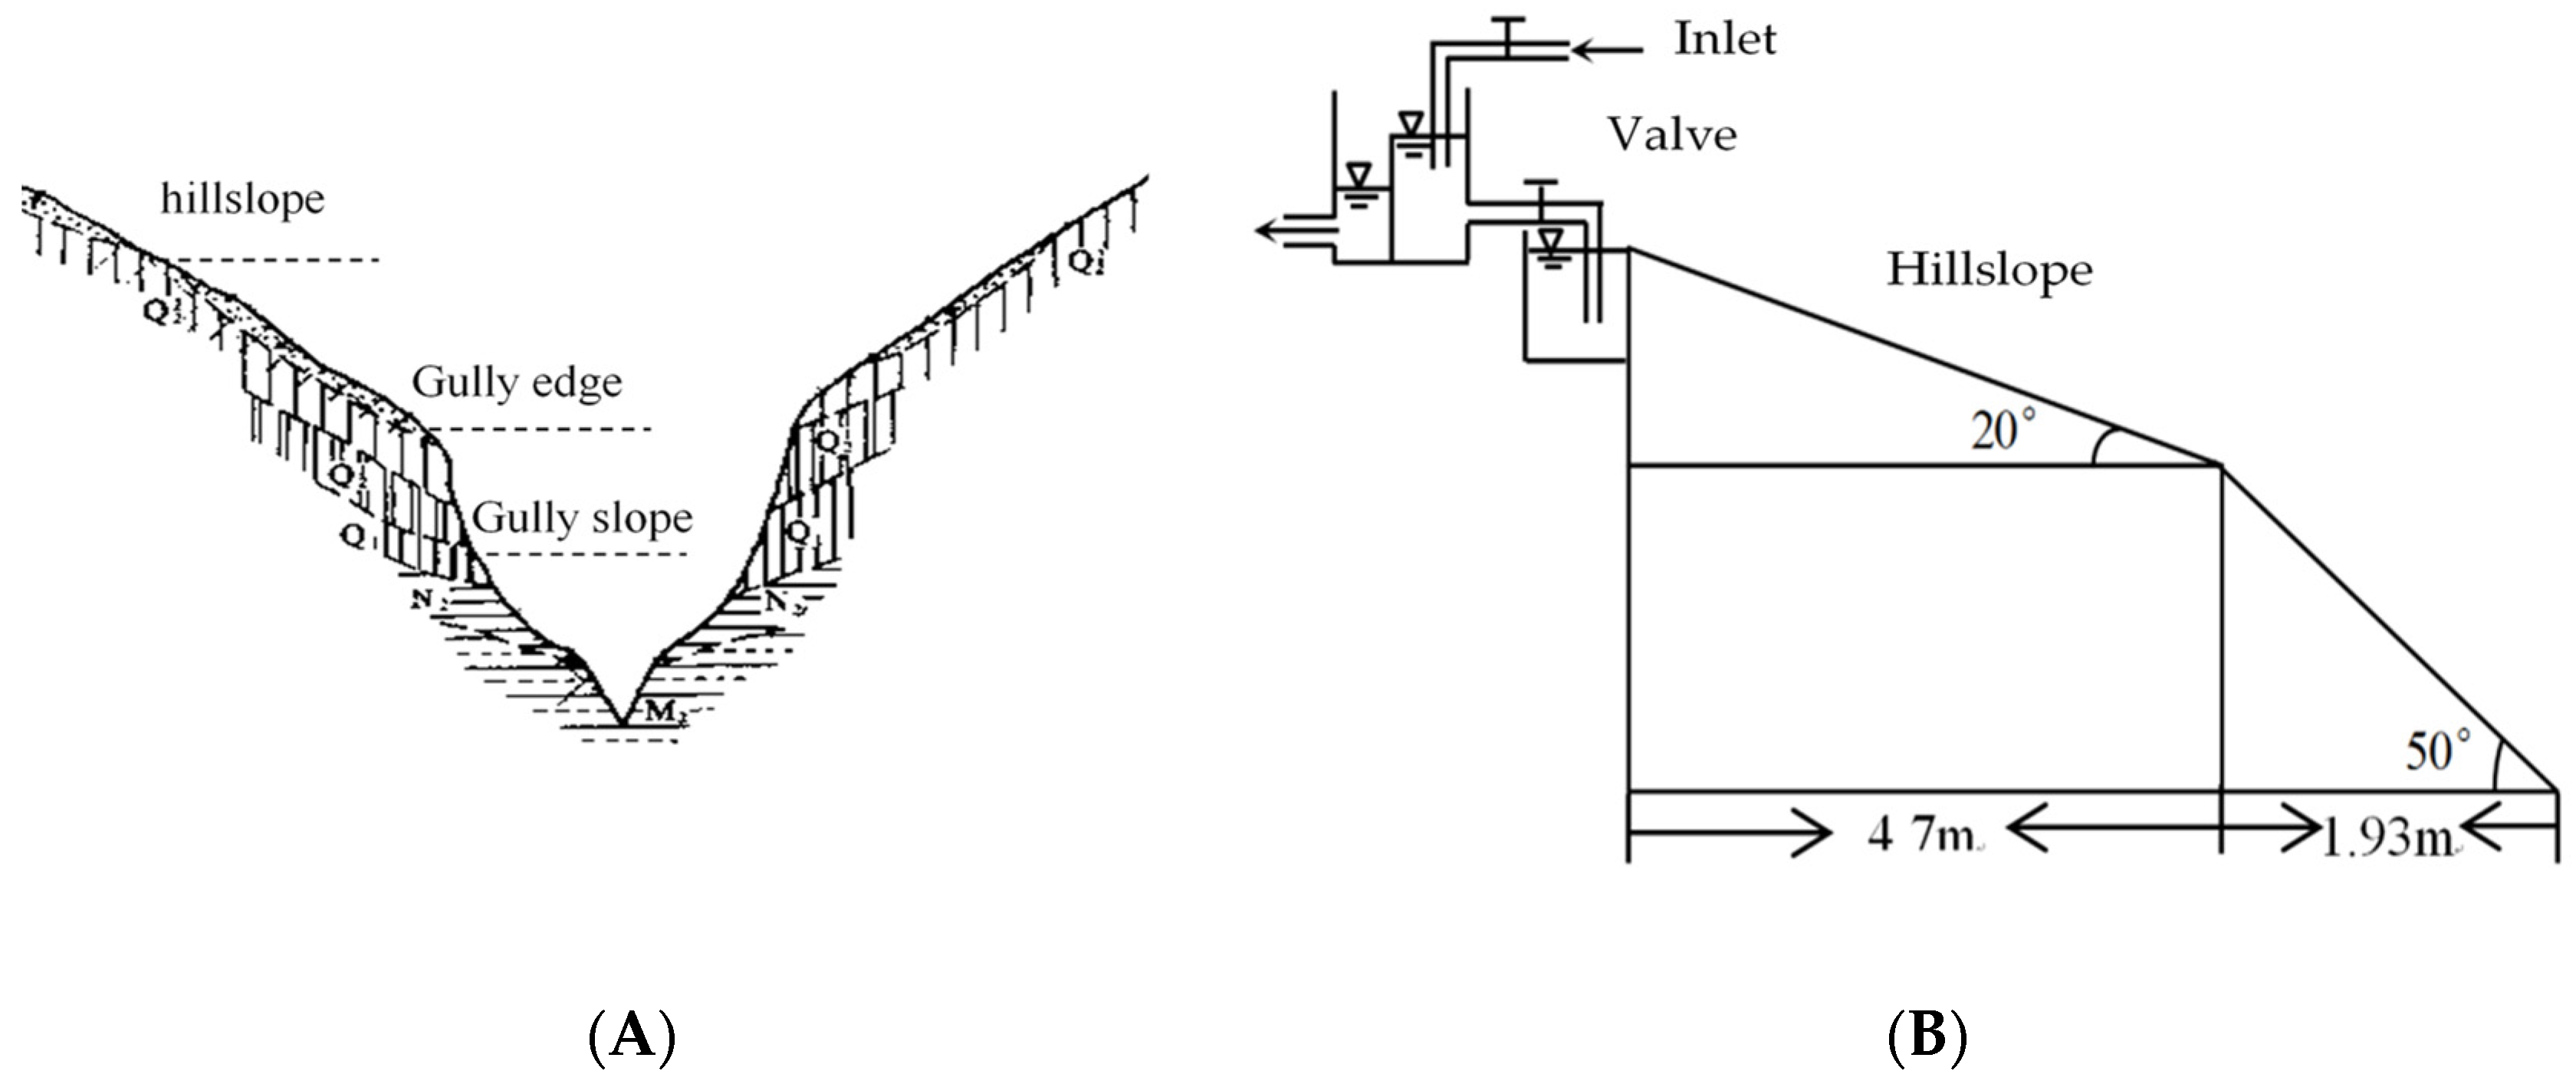
According to earlier investigation and statistics results gathered by Jiang et al. [29], from the top of the hillslope to the edge of the gully and the bottom of the gully, both the erosion forms and the intensity demonstrate significant vertical zonation. Most of the hillslope gradients are about 20°, while the slope gradients of the gully are dominantly between 40° and 60° [29]. The Chinese Soil and Water Conservation Law specified 25° as the maximum tillage gradient for prohibiting farming. The slope gradient of 20° is almost the maximum slope gradient for cultivation. Take the above factors into consideration, the hillslope gradient was set at 20°, which is also a general gradient for cultivated land on the study area. The gully slope gradient designed in this study was 50 °. According to the previous research, the length ratio of the hillslope to the gully slope was from 1.4 to 2.0, and the intermediate value of 1.67 was taken in this study. Therefore, the length of hillslope was 5.0 m, and the gully slope length was 3.0 m. The horizontal projection length of the hillslope and gully side are 4.7 m and 1.93 m, respectively (Figure 1).
The runoff scouring experiment was applied in this study. The constant water head is used to control the inflow discharge. Before each test, the inflow discharges were calibrated at the outlet of the soil box by using a flow meter. The two inflow discharges of 3.2 and 5.2 L min−1 were used in the present experiments.
2.3. Experiment Preparation and Procedure
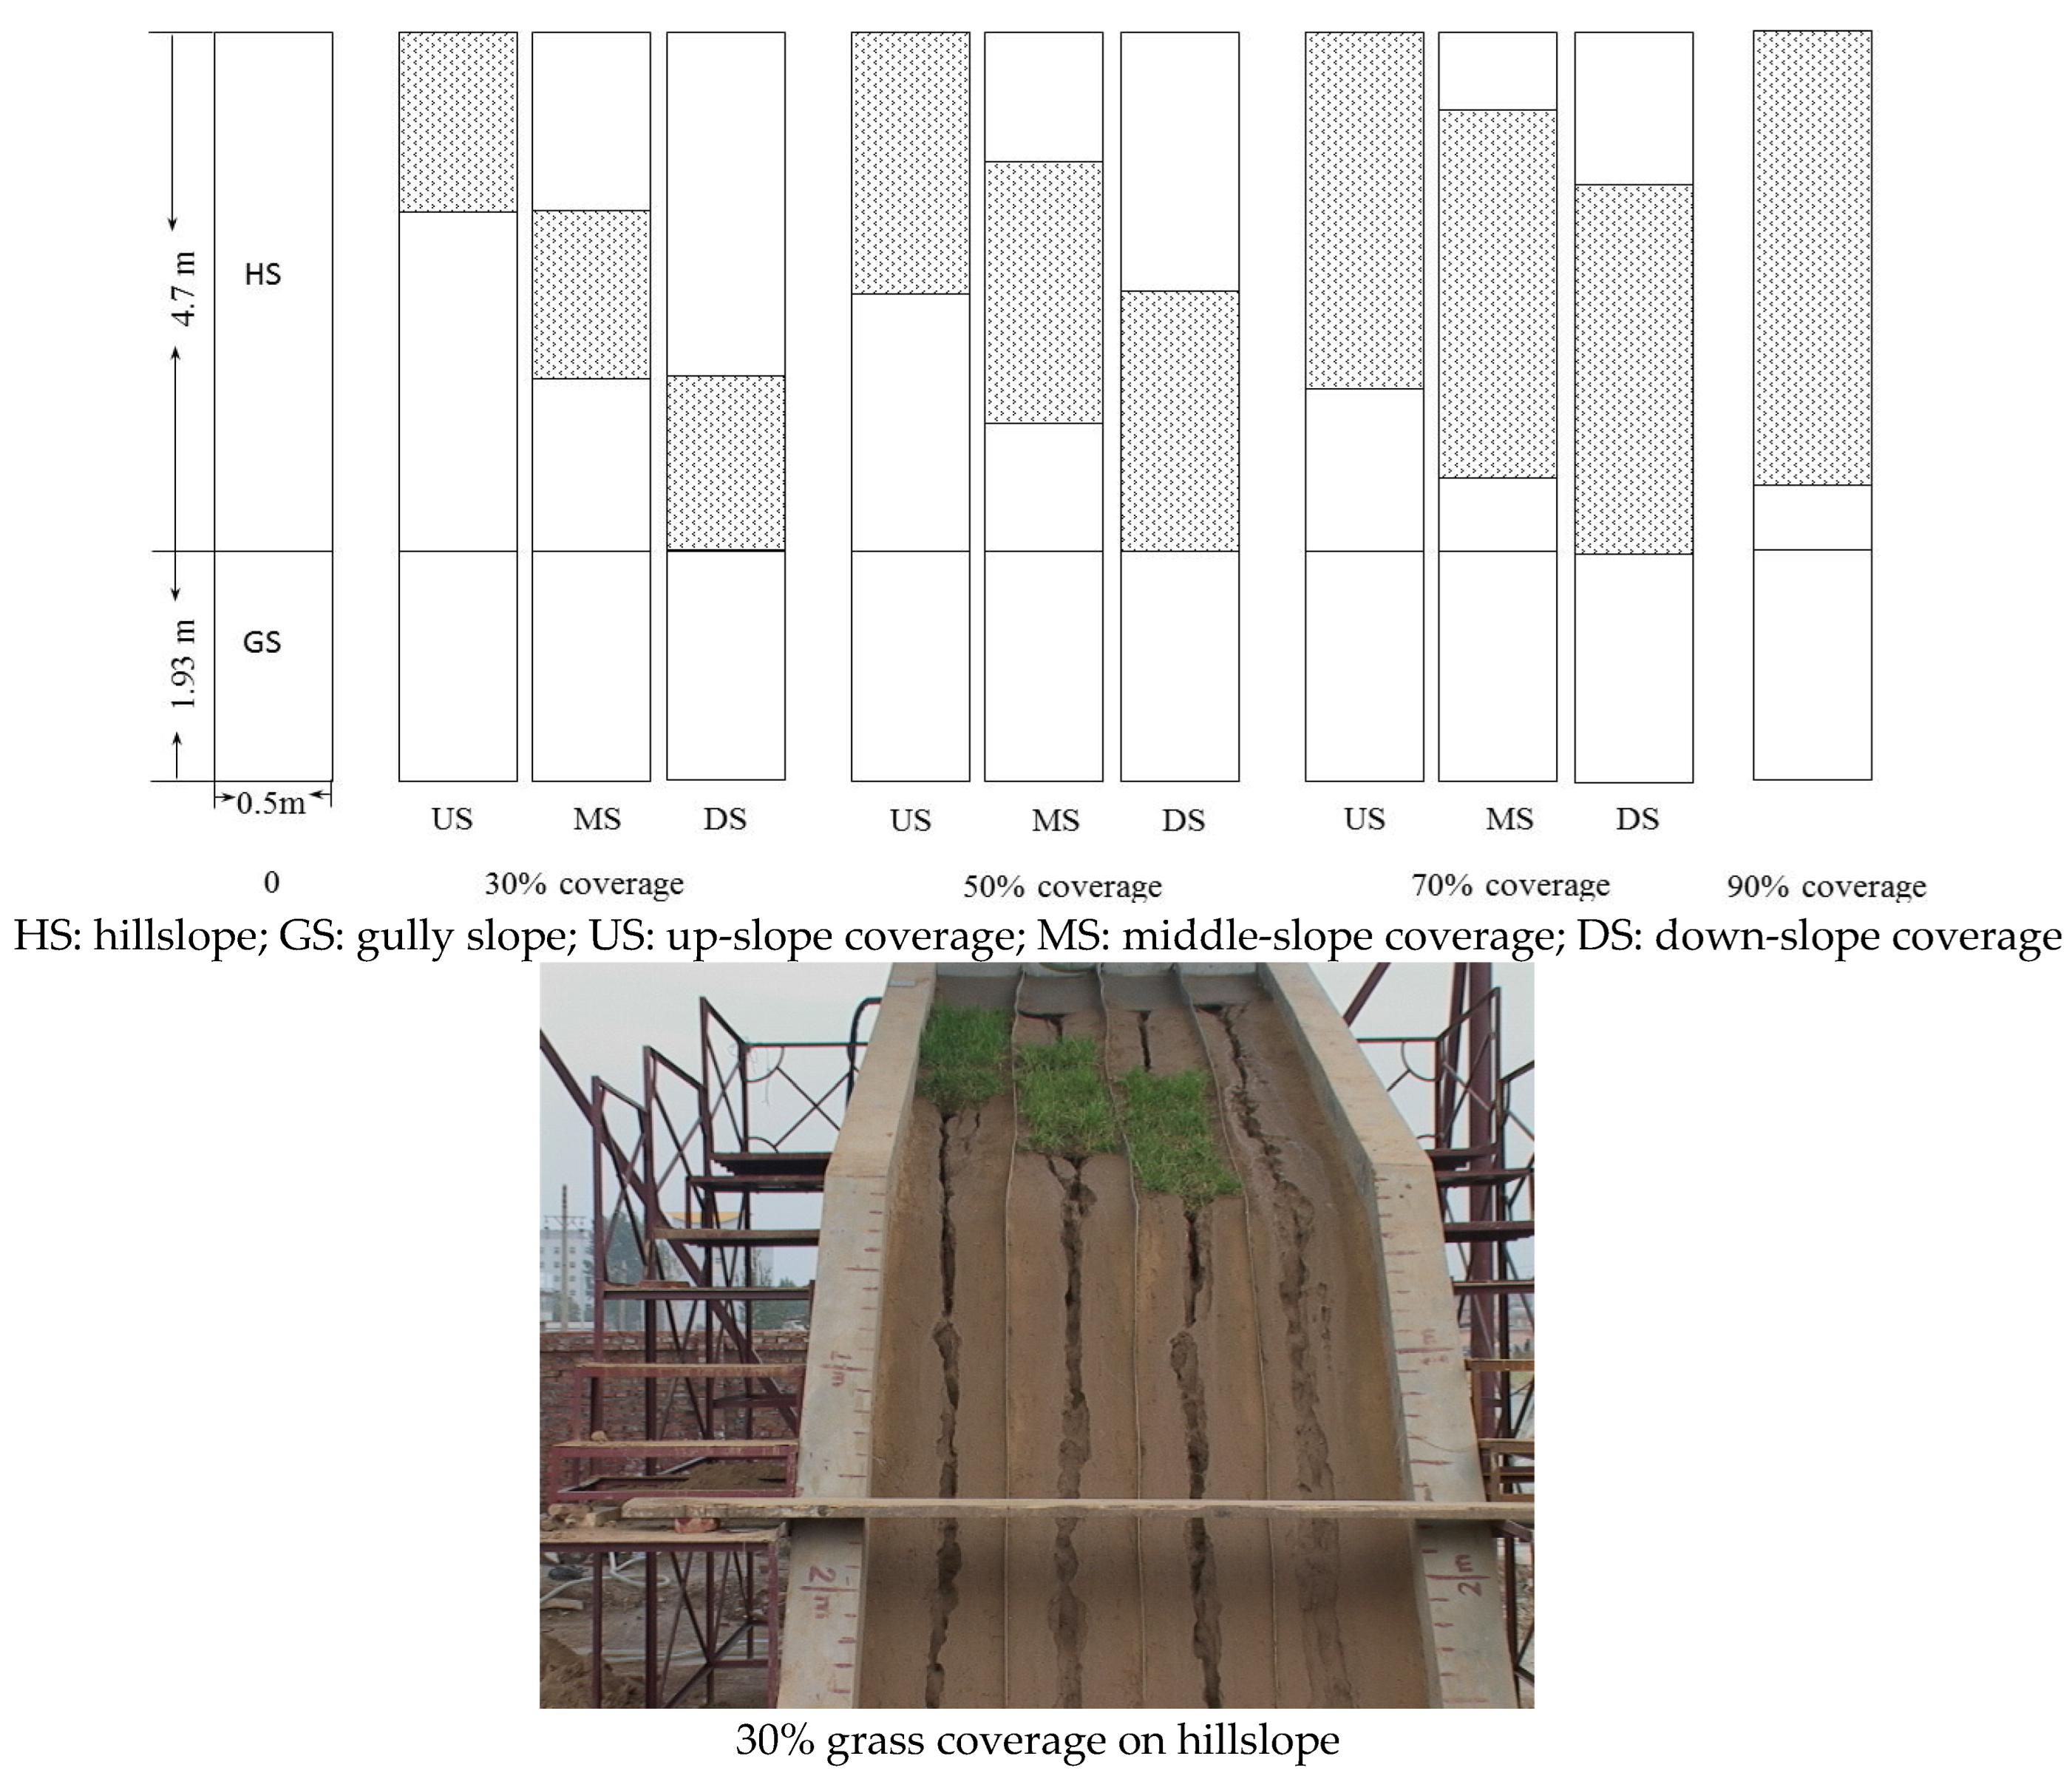
The soil box was 2.0 m width and 0.5 m depth. In order to ensure the consistency of the experimental conditions, the 2.0 m wide soil box is divided into four plots with the same width of 0.5 m by PVC board. Therefore, a control plot with no grass cover (CK), and three additional plots were constructed in order to stand for differing grass arrangement patterns on slope, which were then considered as the: up-slope (US), middle-slope (MS) and down-slope (DS), respectively (Figure 2).
Before experiments, all the soil used in the study passed through a 10 mm sieve and removed gravel, animal, and plant residues in order to ensure homogeneity. A layer of fine sand 0.1 m thick was laid at the bottom of the plot to simulate drainage conditions. The soil was put in successive layers of 0.1 m thickness, a total thickness of 0.3 m, and a bulk density of 1.35 g cm−3 was packed. Wild buffalograss (Buchloe dactyloides), which is a kind of native grass in the Loess Plateau, was selected as the target species. Sow the grass seeds into the plot to ensure that each plot's soil surface is covered with uniform grass. Each experimental plot used a similar planting density. The grass coverage rate is calculated by determining the amount of grass area, which accounts for the total hillslope surface area. It has been widely suggested that the critical coverage rate for vegetation affecting soil erosion is about 50% (Zhang et al., 2012). In order to minimize the number of experiments while ensuring that there are significant differences in erosion between different treatments, a 20% grass coverage rate interval was chosen. Consequently, experimental treatments that designed based on the above rules, while different grass arrangement patterns were designed in this study. In the present research, a total of 5 kinds of grass coverage rates were set, which were 0, 30%, 50%, 70%, and 90%, respectively. Except for 0% and 90% grass coverage rates, there were three spatial grass arrangement patterns, as mentioned above, on the hillslope of each plot, while there was no grass cover set up on the gully slope for each treatment. Two days before the experiment, each plot soil surface was pre-wetted uniformly by applying 20 mm/h rainfall intensity for 30 min to ensure the same soil water content. Therefore, we could keep the initial condition of every experiment as consistent as possible. The plot soil was repacked with new soil for the next experiment, and twice experiments were conducted for each inflow discharge that was applied for approximately half an hour.
For each scouring experiment, clear water was imported from the upper end of the plot. Considering that there have been many studies on light rain and moderate rain conditions in the past, this study focuses on erosion reduction under the slope grass arrangement for heavy rain conditions. Inflow discharge of 3.2 and 5.2 L·min−1 was selected. The inflow discharges correspond to the farmland runoff generated under the typical local rainstorms with rainfall intensities of 100 mm h−1 and 150 mm h−1. The experiments continued for about 20 min. During the experiment, runoff and sediment samples were collected continuously every minute with a 10 litters bucket, and the flow velocities were measured by using the dye tracing method. The time for the tracer traveling via a fixed distance (2.0 m) was recorded according to the color-front propagation. The measured time values mentioned above, multiplied by the theoretical value of 0.67, were used to calculate the runoff mean velocities. After the experiment, the sediment in sampling buckets was transferred to iron boxes and oven-dried at 105 °C for 24 h until a constant mass was achieved and weighed. To acquire the gully slope erosion, the rill length, rill width, and rill depth of each rill in the gully slope were measured by steel rule at intervals of 10 cm along the latitude of the gully slope.
2.4. Data Calculation and Analysis
The sediment reduction due to grass coverage rate (%) could be calculated using the following equation [12]:
where Sck is the sediment yield in the bared plot (Kg), and Sg is the sediment yield in the plot of different grass coverage rates and different grass arrangement patterns on the hillslope (Kg).
For runoff reduction due to grass coverage rate (%) calculations [12], the equation was
where Rck is the runoff generation in the bared plot (L), and Rg is the runoff generation in the plot of different grass coverage rates and different grass arrangement patterns with the hillslope condition (L).
According to the measurement of rill length, width, and depth, and taking the rill section to be rectangular, the rill volume and rill erosion can be calculated with the following equation:
where Mi is the erosion of any selected rill segment on the gully slope (Kg); is the average width of any selected rill segment on the gully slope (m); is the average depth of any selected rill segment on the gully slope (m); l is the actual selected rill length (m); ρ is the soil bulk density of gully slope (Kg·m−3).
Analysis of variance (ANOVA) was used to detect treatment effects on measured variables. Significant differences between treatments for runoff and soil loss rate were determined using the PLSD (Protected Least Significant Difference) procedure for a multiple range test at the 0.05 significance level. All tests were performed using the statistical program SPSS 17.0.
3. Results
3.1. Runoff and Sediment Reduction
Both the runoff and sediment yield of the slope-gully system under the different grass coverage rates and different grass arrangement patterns were summarized in Table 2 and Figure 3.
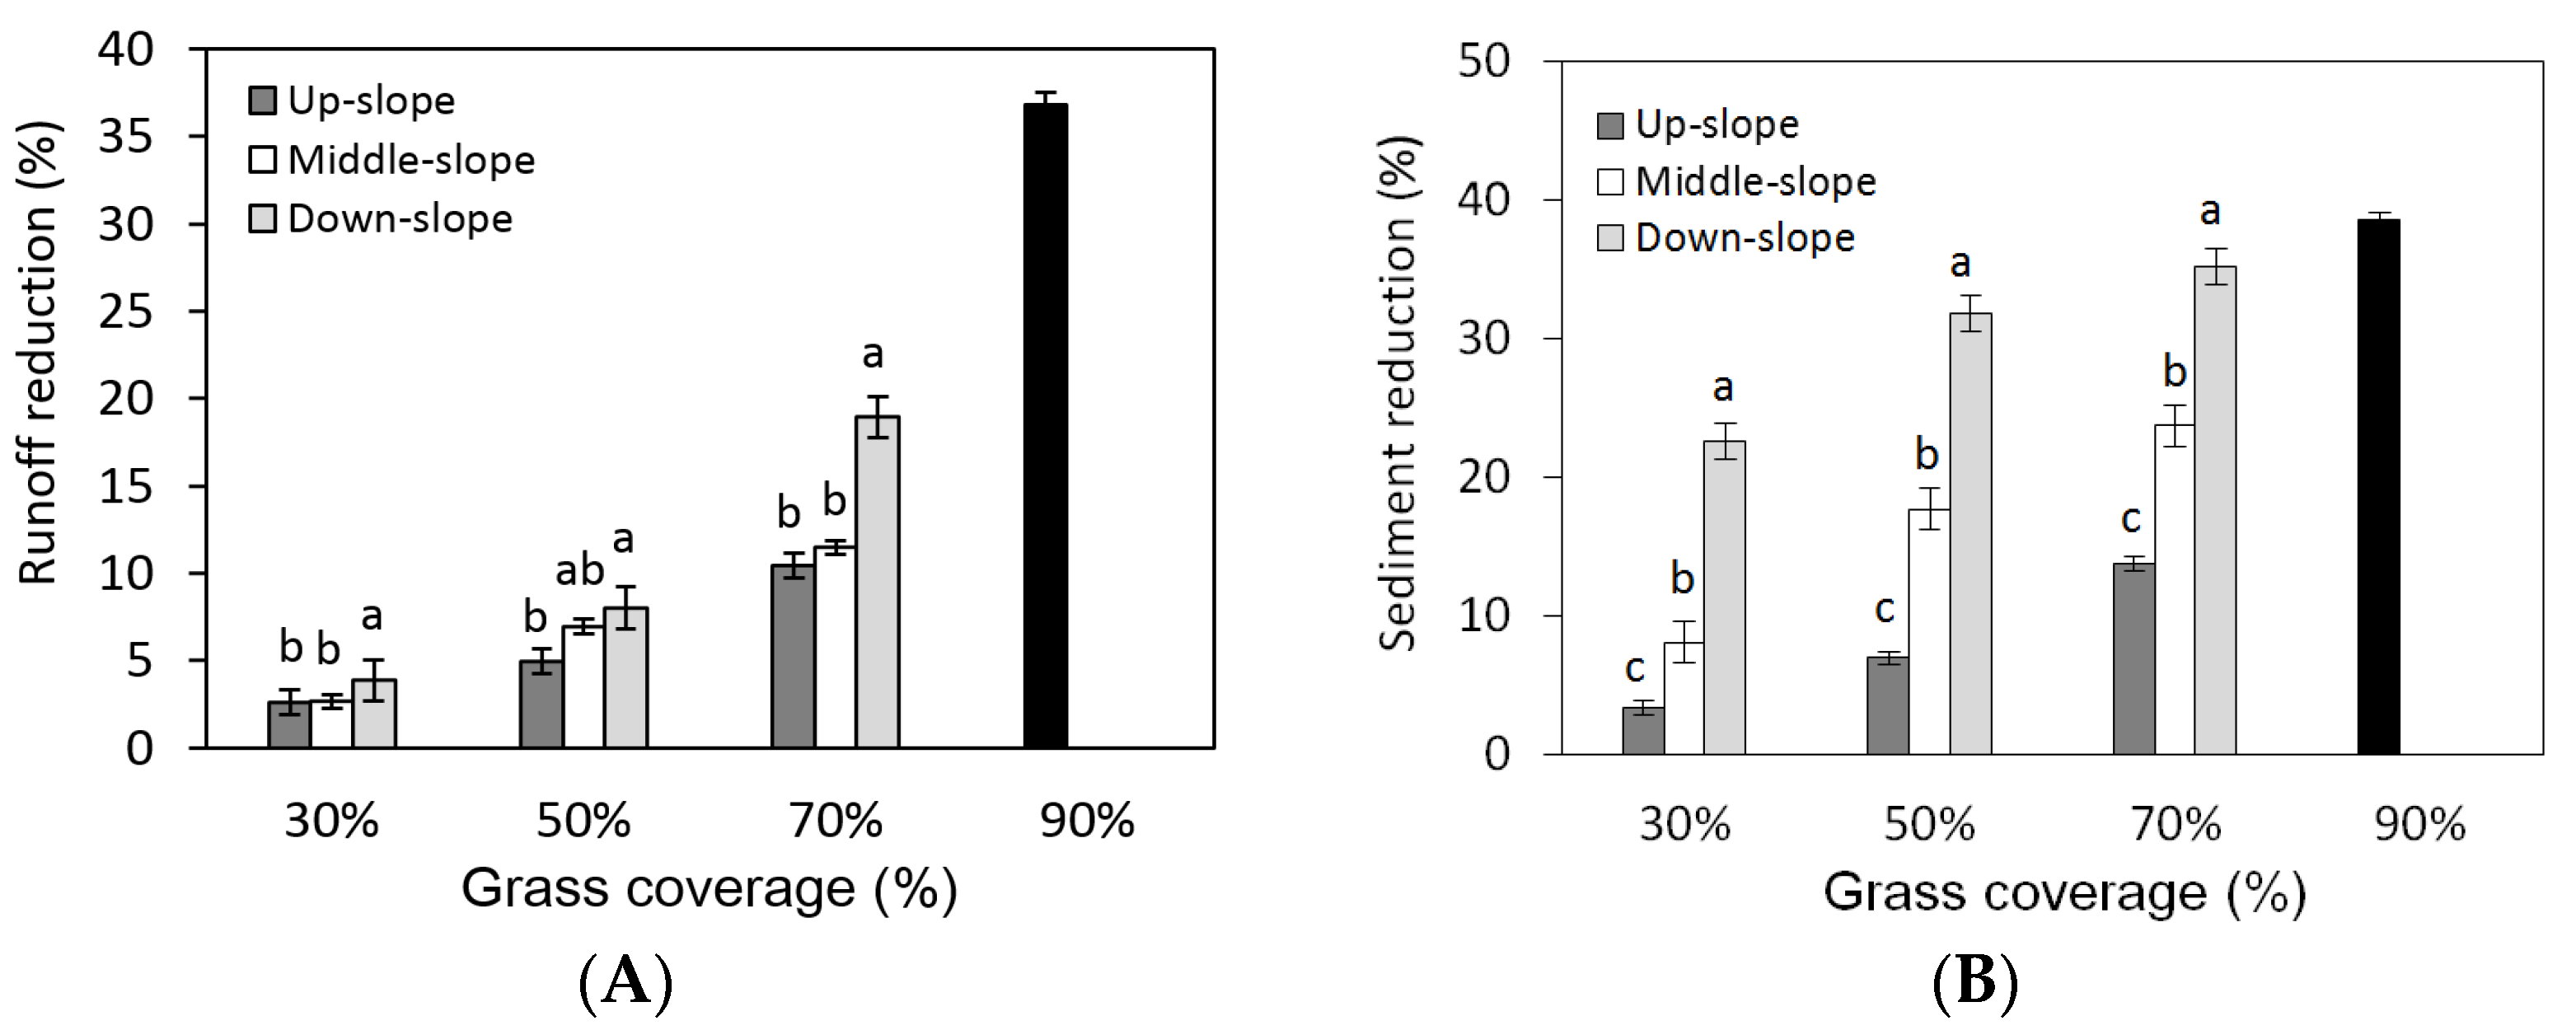
As can be observed in Table 1, either the runoff volume or the erosion mass was significant decreased with the grass coverage rates increasing and with the variation of grass distribution patterns on slope, indicating that both the grass coverage rates and the grass arrangement patterns have significant effect on runoff and sediment yield on slope-gully system. Runoff volume ranged from 43.08 to 68.17 L and erosion mass ranged from 16.46 to 26.80 Kg with the grass coverage rate decreasing from 90% to 0%, and runoff volume were reduced by approximately 3% to 36.8% and erosion mass were reduced by approximately 27.8% to 38.6% compared with the bare plot under the flow discharge 3.2 L·min−1 condition, respectively (Table 1, Figure 1).
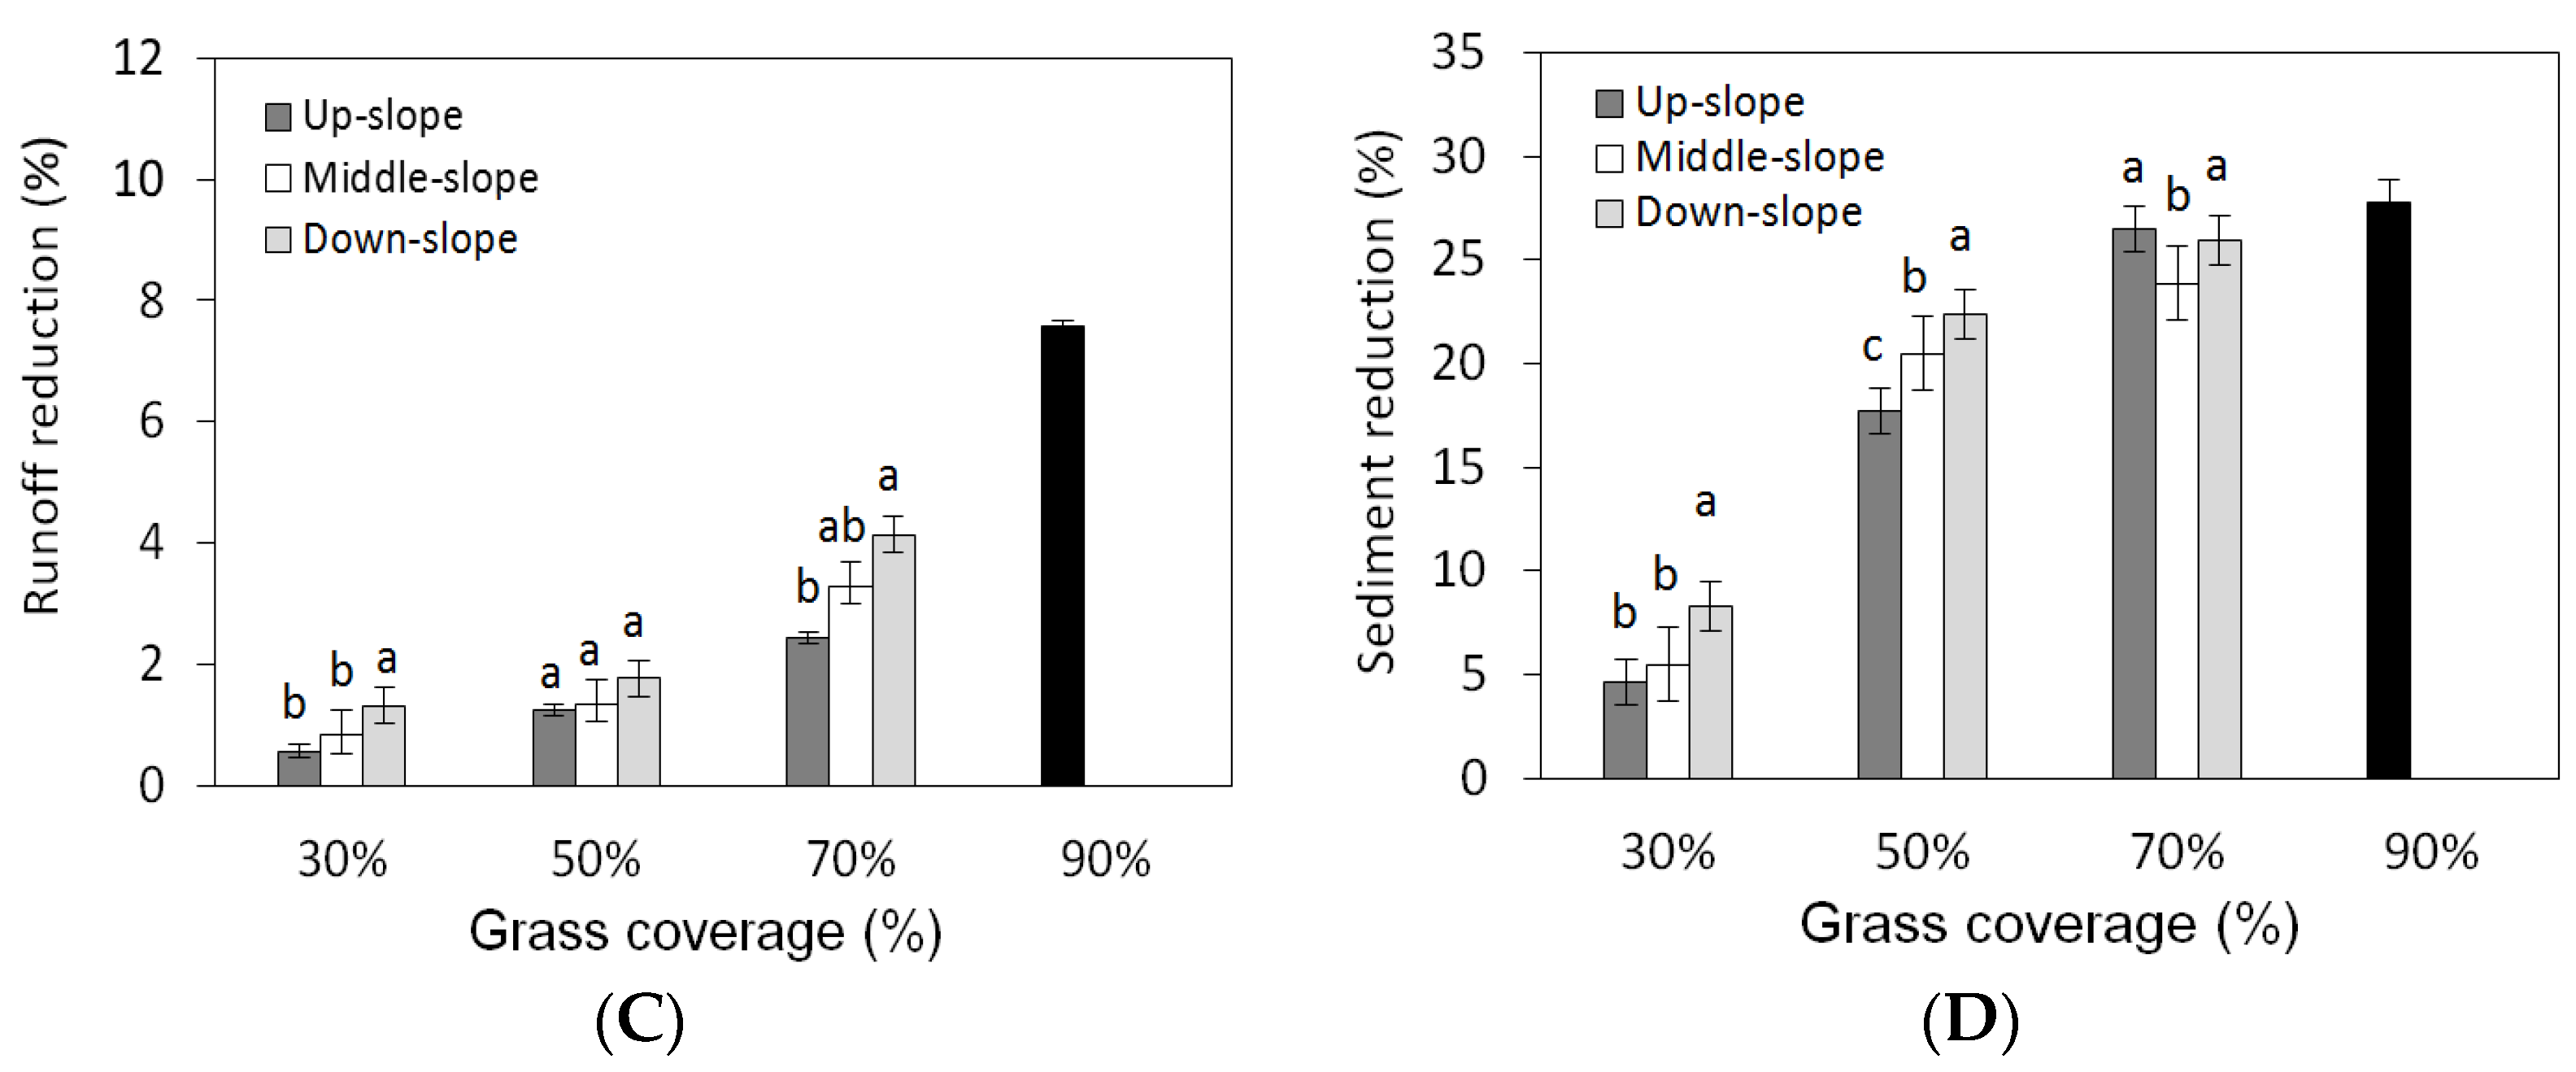
When the flow rate was 5.2 L min−1, the changing trend of runoff and erosion with the vegetation coverage rate from 90% to 0% was the same, but the role of reducing runoff and sediment by grass coverage rate was smaller than that under the flow discharge of 3.2 L·min−1. These indicated that grass was a very important factor in controlling soil erosion, for it could be observed that the runoff decreasing was lower than the rates of sediment reduction, indicating that the grass coverage had higher effectiveness in controlling soil erosion as compared to reducing runoff. As the grass coverage rate increased, sediment yields and runoff decreased dramatically. These results are consistent with the findings of other researchers who similarly found that vegetative cover significantly reduced runoff and sediment losses [11,30,31].
By comparing the rates of runoff and sediment reduction under the differing vegetation arrangement patterns on the slopes, it can be observed that the down-slope (DS) had the lowest runoff and greatest runoff reduction in comparison with the up-slope (US) and middle-slope (MS). However, no significant differences in runoff reduction were detected between the US and MS, although there exists a significant difference in the sediment reduction between the US and MS. In essence, these results indicated that the DS is more effective than either the US or MS in both soil and water conversation under these established experimental conditions.
3.2. Contributions of Hillslope and Gully Slope to Slope-Gully System
According to the results gathered by means of Equation (3), the erosion of the gully slope was calculated (Table 3). As the information in Table 3 indicates, there exists quite a difference between the flow discharge 3.2 L·min−1 and 5.2 L·min−1 for the gully slope erosion, as well as a large amount of additional erosion occurring on the gully slope with the flow discharge 3.2 L·min−1, while only a small amount of additional erosion occurs on the gully slope with the flow discharge 5.2 L·min−1. Under the flow discharge 3.2 L·min−1 conditions, the erosion mass of the gully slope has a range from 1.89 Kg (with no grass coverage on the hillslope) to 10.53 Kg (90% grass coverage on the hillslope), demonstrating a significant increase with the grass coverage rate increasing. In opposition, for the flow discharge 5.2 L·min−1, the erosion mass of the gully slope ranged from 16.26 Kg (with no grass coverage on the hillslope) to 23.93 Kg (30% grass coverage on the hillslope) and then fell to 17.95 Kg (90% grass coverage on the hillslope), demonstrating a significant decrease with the grass coverage rate increasing.
The grass arrangement patterns on hillslopes have a significant influence on gully slope erosion. By comparing the erosion of the gully slope under the different grass arrangement patterns on the hillslope, it is easy to see that the erosion from the gully slope for the DS condition had the lowest value in comparison with US and MS condition under the flow discharge 3.2 L·min−1, while the erosion from the gully slope for DS, MS and US condition has no obvious variation. The results above indicated that flow discharges, grass coverage rates, and grass arrangement patterns all affected the gully slope erosion. This supported Chen’s results, which showed that the runoff discharge and sediment concentration from the upper hillslope are the important factors impacting the sediment yielding on the gully slope [24].
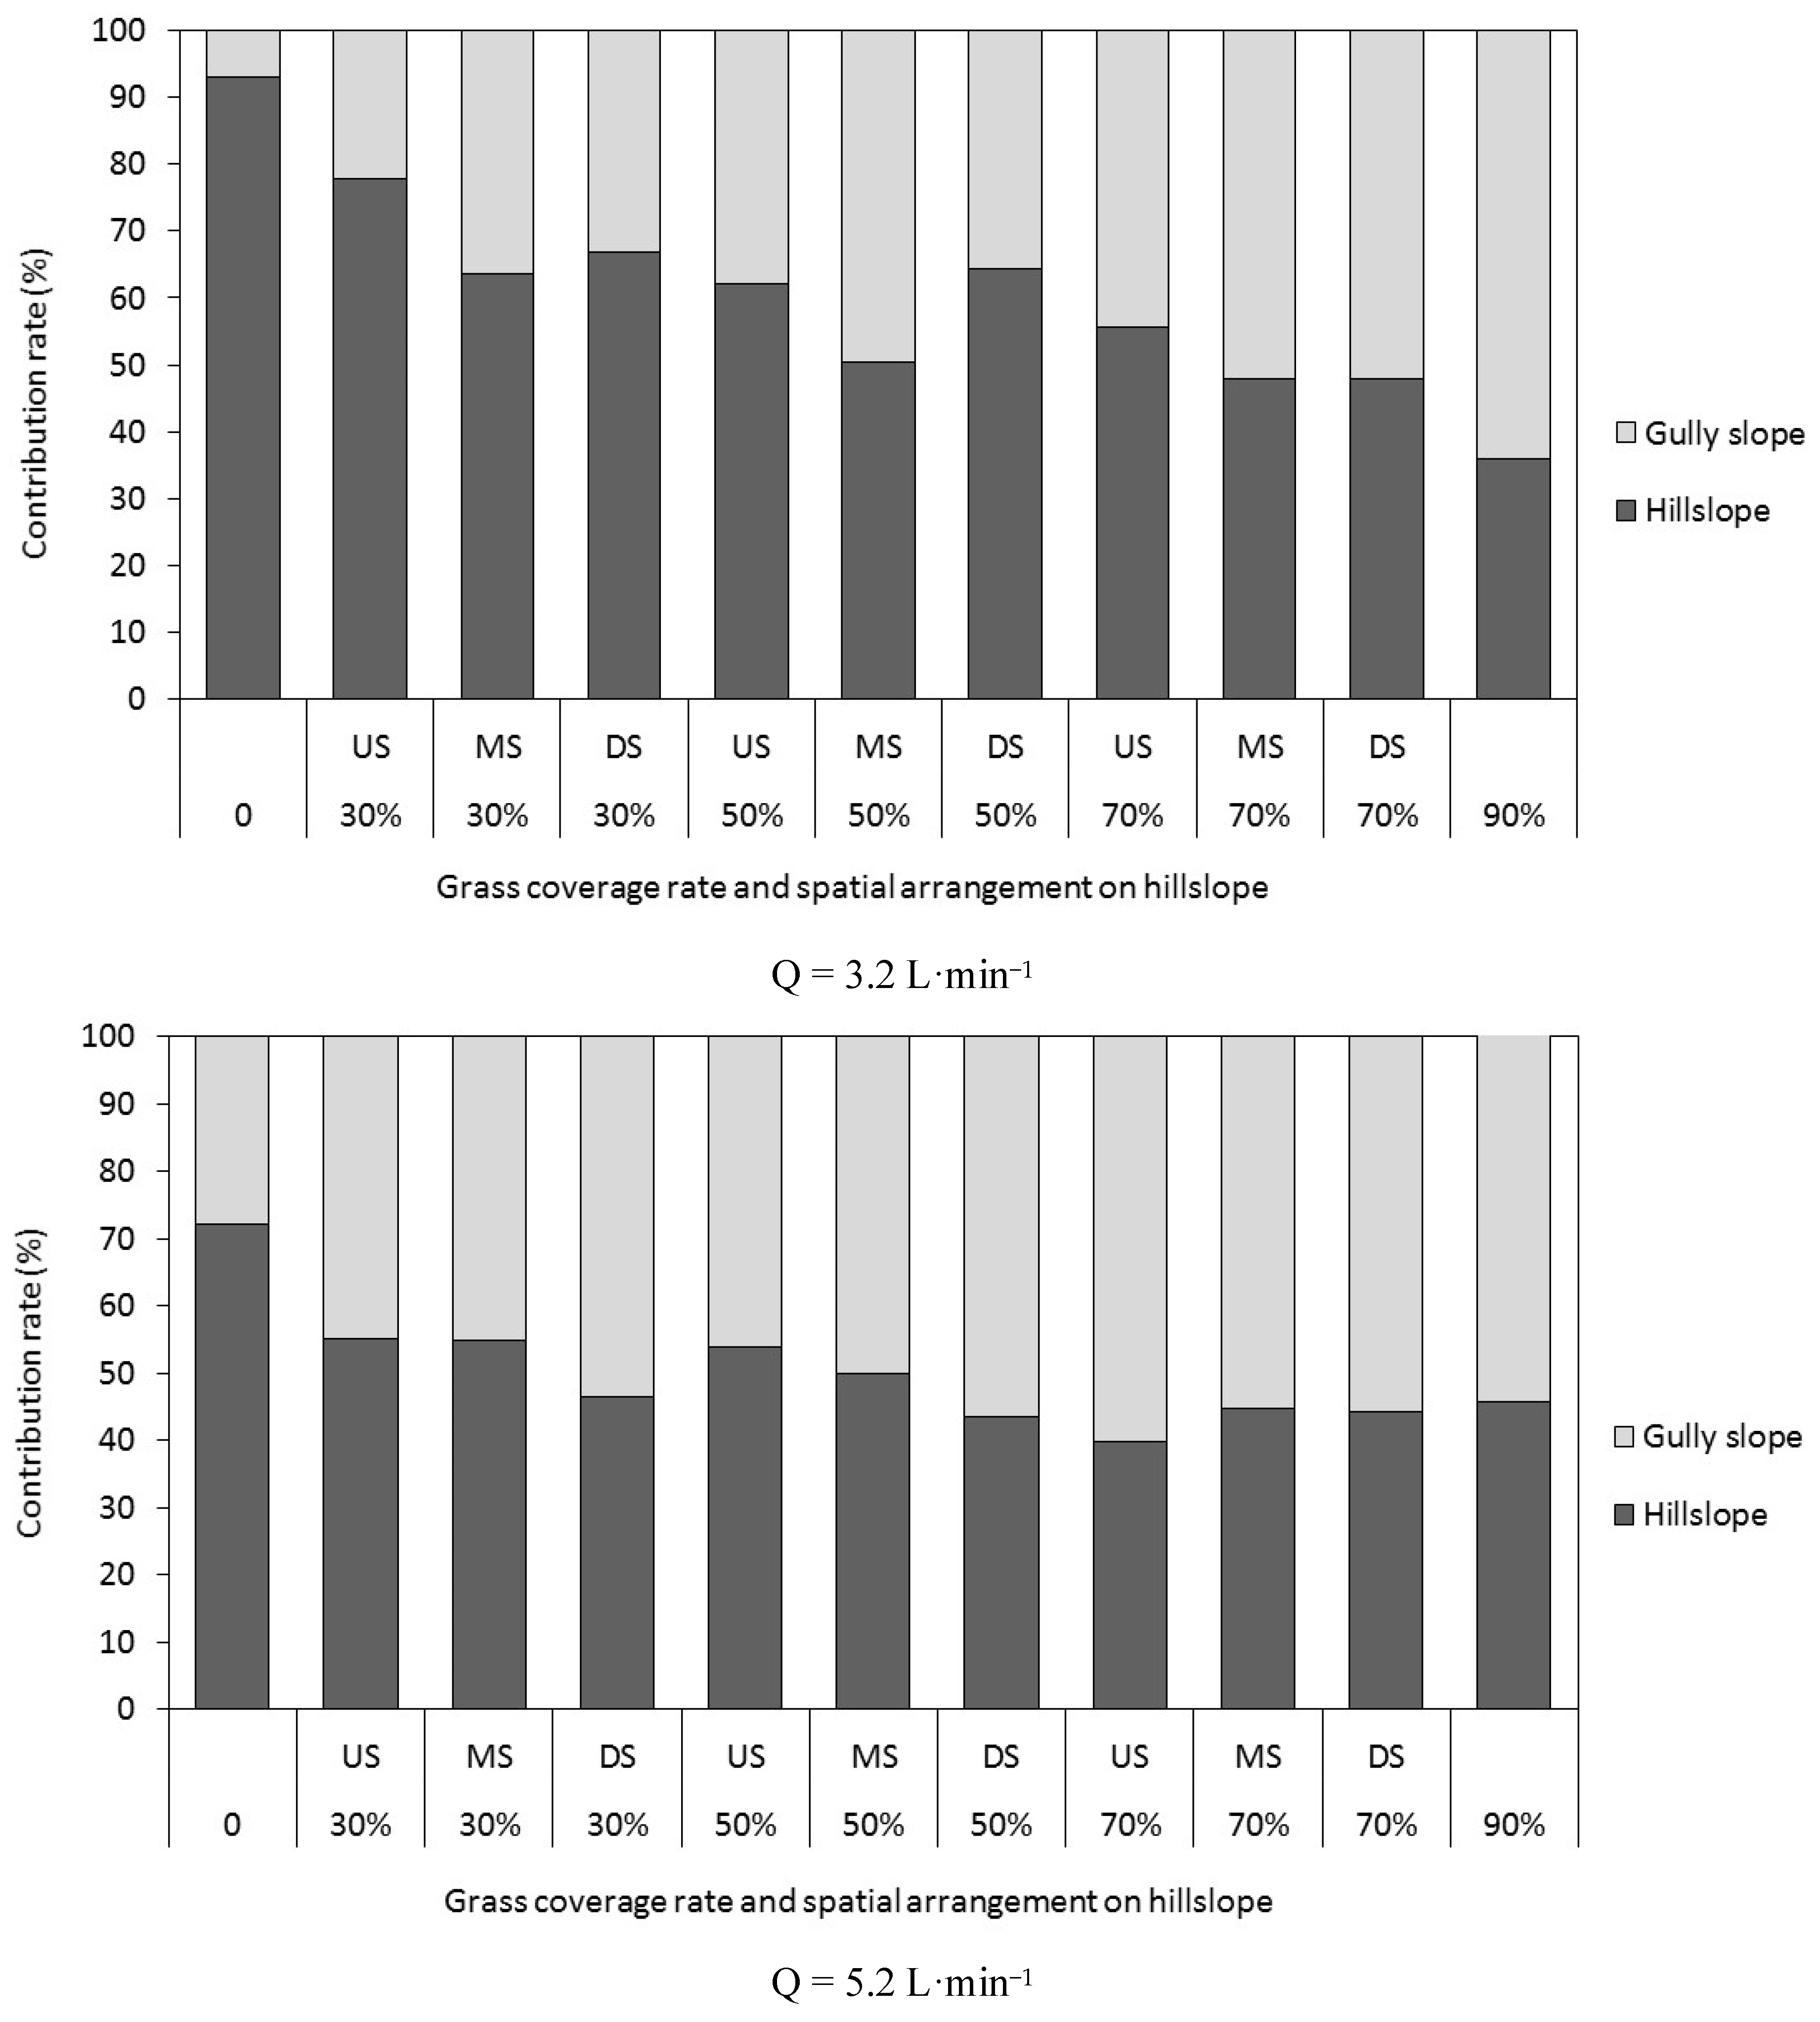
The percentage of the gully slope erosion accounts for the total erosion of the slope-gully system ranged from 7% to 64% under the flow discharge 3.2 L·min−1 and from 28% to 60% under the flow discharge 5.2 L·min−1, respectively (Figure 4). This indicated that flow discharge has an important effect on the relationship between hillslope erosion and gully slope erosion. Tang et al., Gong and Jiang, and Chen also researched slope-gully system erosion processes and analyzed the percentage of gully slope erosion accounting for the total erosion of the slope-gully system by using field plot measuring data, which indicated that the percentage of the gully slope erosion ranged between 32% and 80% [24,32,33]. Jiang further pointed out that the gully side area accounts for 53% of the total area condition. In the case of a rainstorm, the sediment yield from the gully slope evenly accounts for 62% of the total erosion [29]. Especially for high flow years, the ratio of gully side erosion accounted for the erosion of slope-gully system was 63%. In the present research, the gully side area accounts for about 40% of the total area of the slope-gully erosion system, and the average erosion of the gully side account for 40% of the total erosion for the flow discharge of 3.2 L·min−1 and 50% for the flow discharge of 5.2 L·min−1, respectively. The reason for the difference between the present study and Jiang’s research is that the present study was studied by scouring experiments. Under the natural rainfall condition, runoff actually increases with the increase in the down-hillslope position. The runoff detachment ability and soil loss on the gully slope will be greater than the above ratio. This indicates that further research is needed through rainfall experiments to accurately determine the location of severe erosion and the corresponding gull slope erosion percentage [26].
4. Discussion
4.1. Effects of Grass Coverage and Arrangements on Runoff and Sediment Reduction on Hillslope
The data of this study showed that the runoff and sediment yield on hillslopes are affected by slope grass coverage rates, grass arrangement patterns, and flow discharges. The flow discharges have a significant effect on the runoff and sediment yield, and the runoff and sediment yield increases with the increase in flow discharges. The effects of grass coverage rates on runoff were significantly different between 0% grass coverage rates and 70% and 90% grass coverage rates, while sediment yield was a significant difference under various grass coverage rates. The effects of grass arrangement patterns on runoff were not significant, but the effects on sediment yield were significant. The total runoff volumes have no obviously different among the three different grass arrangement patterns on the slope under the same grass coverage rates and the same flow discharges, but the sediment yield has distinct discrepancy among the three different grass arrangement patterns on the slope. The sediment yield on a hillslope with different grass arrangement patterns showed a trend of US > MS > DS. This is related to the fact that the greater the flow rate is, the smaller the change of the hydrodynamic parameters of the grass is, and the hydrodynamic parameters are an important factor in determining the erosion sediment yield. Therefore, the greater the flow rate is, the less the sediment reduction benefit is. Different grass coverage rates, the same grass arrangement patterns on hillslope sediment yield decrease with the increase in grass coverage rates.
In the last several decades, considerable studies have been conducted to evaluate the influence of vegetative coverage on soil erosion. The results suggested that soil erosion decreased with the vegetation coverage rates increasing [34,35]. In contrast, some other researchers indicated that soil erosion increased with the soil surface coverage rate increasing [36,37]. The above two contradictory results demonstrate that only researching the effect of vegetation coverage on erosion is not enough. The vegetation distribution patterns on the slope must be considered to reveal the relationship between the vegetation cover and erosion. In fact, a few studies have reported that the vegetation-patched patterns on the slope have a significant effect on erosion [15,20,38,39,40]. In our research, three factors (grass coverage, grass distribution patterns on slope, and flow discharges) were considered. The results showed that both grass coverage rates and grass arrangement patterns have significant influences on runoff and sediment yield on a hillslope. Compared with the effect of runoff reduction, grass coverage has better control affection on soil erosion. These results are consistent with previous researchers’ results that vegetative cover significantly reduced runoff and sediment losses [11,15,30,31].
4.2. Effects of Grass Coverage and Arrangements on Runoff and Sediment Reduction on Gull Slope
The results indicate that the influence of the hillslope grass coverage rates and arrangement patterns on the gully slope soil loss is greater than on runoff (Table 4). For the same grass coverage rate and the same grass arrangement patterns, the sediment yield of the gully slope increases with the flow discharges increasing. Under the same flow discharges, the sediment yield of the gully slope did not decrease with the increase in the grass coverage rates but showed an increasing trend. The erosion of the gully slope under the condition of a 90% grass coverage rate is larger than that of the gully slope without grass coverage.
Our results are contrary to those observed on vegetation plots [15,17]. These reported that sediment yield was negatively correlated with runoff rate in grassplots, and the runoff coefficient was negatively related to sediment concentrations on a Mediterranean hillslope with vegetation. The main reason for these differences is that the present study was conducted by using scouring experiments, while simulated rainfall experiments were used in both Pan’s and Cerda’s research. For the natural situation, when the rainfall experiment is used to study slope erosion, the runoff on the slope increases gradually along the downhill slope, and the runoff detachment capacity and erosion amount at the lower part of the slope also increases gradually. In the scouring experiment, the runoff on the slope decreased gradually along the slope due to infiltration, and the runoff detachment capacity and erosion amount in the lower part of the slope was less than those in the simulated rainfall experiment. Another reason for the difference between this study and Pan’s study is that the grass distribution patterns used in this study are different from Pan’s study. This study used different grass coverage rates and grass distribution patterns, while Pan’s study used uniform grass coverage. This indicates that both vegetation coverage and distribution patterns have significant effects on erosion. However, further rainfall experiments are needed to determine the most accurate impact of grass coverage and distribution patterns on erosion.
While for the gully slope of the whole slope-gully system, erosion significantly increased with the grass coverage rate increasing on the slope no matter how the grass arrangement patterns on the hillslope. These results are consistent with some previous research results that showed that soil erosion rates increased with soil surface coverage increasing [37,38]. This can be explained as follow: due to the particularity of the Loess Plateau, from up-slope to hillslope boundary, then to gully edges, erosion forms and intensity showed significant vertical zonation. Many researchers reported that runoff from upper slopes has an important effect on erosion and sediment transport processes on the down-slope. An increase in runoff sediment concentration from uphill leads to a decrease in erosion in the down-slope [24], and an increase in runoff from the up-slope leads to an increase in erosion in the down-slope.
Table 5 shows the relationship between the gully side erosion and various influencing factors. From Table 5, we can see that three factors (flow discharge, runoff sediment concentration from upper slopes, and runoff unit stream power from upper slope) significantly correlate with the gully side erosion (p < 0.05), but the relationship between the grass coverage rate and gully side erosion appeared has no obvious correlation. Due to the sediment concentration of runoff on the hillslope being inversely proportional to the hillslope grass coverage, sediment concentration on the end of the hillslope decreased with the grass coverage rate increasing. That is to say, the sediment concentration of inlet flow decreases with the grass coverage rate increasing on the hillslope. Under this situation, the greater difference between the runoff sediment concentration and the sediment transport capacity, the more detachment of the runoff and the erosion on the gully side is greater. The above results showed that the spatial scale of the research object must also be considered in studying the effect of grass coverage rate and the spatial distribution pattern on erosion. The above-mentioned previous research was performed on a uniform slope, and the slope gradient is gentle. Our present experiments were conducted on very steep slope gradients, and vegetation coverage rate variation widely (from 0% to 90%), and the most important difference is that present experiments were conducted on a complicated hillslope-gully system. The gully side erosion has no apparent decrease with the increasing of the vegetation coverage rate on the hillslope. On the contrary, the gully side erosion increased with the increasing vegetation coverage rate on the hillslope. So, the different vegetation coverage, different vegetation distribution pattern, and different spatial scale of the research object all have an influence on erosion; any research that only takes care of the single factor mentioned above is not enough to reveal the effect of vegetation on erosion.
Further analysis can be concluded that just implementing soil and water conservation measures on the hillslope of the slope-gully system can reduce the total erosion to some extent, but, reducing erosion is mainly focused on hillslope sections, for gully side, its erosion not only does not reduced but also has a greater amount of increasing. Therefore, in the process of practical soil erosion controlling, taking effective measures both on the hillslope and gully side will be effective methods of reducing soil erosion.
5. Conclusions
The runoff and sediment yield of the hillslope-gully system with five grass coverage rates and three arrangement patterns were studied by scouring experiments with two runoff discharges. Results showed that both grass coverage rates and grass distribution patterns have significant effects on runoff and sediment yield on slope-gully erosion systems. Grass coverage had more effectiveness in controlling soil erosion compared with runoff-reducing effectiveness. However, for the gully side of the slope-gully erosion system, erosion significantly increased with the grass coverage rate increasing on the slope, no matter how the grass distribution pattern on the hillslope. Therefore, the different grass coverage, different grass distribution pattern, and different spatial scale of the research object all have an influence on erosion; any research that only takes care of the single factor mentioned above is not enough to reveal the effect of grass on erosion.
Gully side erosion was significantly correlated with the flow discharge, runoff sediment concentration from upper slopes, and runoff unit stream power from the upper slope (p < 0.01), but the relationship between the grass coverage rate and gully side erosion appeared to have no obvious correlation. Just implementing soil and water conservation measures on the hillslope of the slope-gully system can reduce the total erosion to some extent, but reducing erosion is mainly focused on hillslope sections. Gully side erosion not only does not reduce but also has a greater amount of increase. Therefore, in the process of practical soil erosion controlling, taking effective measures both on the hillslope and gully side will be effective methods of reducing soil erosion.
Author Contributions
Conceptualization, W.D.; methodology, W.D.; formal analysis, W.D., X.W., X.M., and Z.Y.; data curation, G.Z.; writing—original draft preparation, W.D., X.W., and G.Z.; writing—review and editing, W.D. and X.W. All authors have read and agreed to the published version of the manuscript.
Funding
This research was funded by the National Key R&D Program of China (No. 2019YFC1510705-05, and No. 2017YFC1502500), the National Natural Science Foundation of China (No.41271303, 52109002), and the basic scientific research business fee of scientific research institutes of Changjiang Academy of Sciences (CKSF2019185/TB).
Acknowledgments
We thank the editor and reviewers for their useful feedback that improved this paper.
Conflicts of Interest
The authors declare no conflict of interest.
References
- Tang, K.L. Soil and Water Conservation in China; Science Press: Beijing, China, 2004; p. 845. (In Chinese) [Google Scholar]
- Zheng, F.L.; Stephen, D.M.; Huang, C.H.; Tanaka, D.L.; Darboux, F.; Liebig, M.A.; Halvorson, A.D. Runoff, soil erosion, and erodibility of conservation reserve program land under crop and hay production. Soil Sci. Soc. Am. J. 2004, 68, 1332–1341. [Google Scholar] [CrossRef]
- The Loess Plateau in Central China. In Ecological Restoration and Management; UNESCO Office Beijing; Tsinghua University Press: Beijing, China, 2006.
- Shi, H.; Shao, M.A. Soil and water loss from the Loess Plateau in China. J. Arid. Environ. 2000, 45, 9–20. [Google Scholar] [CrossRef] [Green Version]
- Linda, C.; Ferdinand, B.; Alain, P. Vegetation indices derived from remote sensing for an estimation of soil protection against water erosion. Ecol. Model 1995, 79, 277–285. [Google Scholar]
- Braud, I.; Vich, A.I.J.; Zuluaga, J.; Fornero, L.; Pedrani, A. Vegetation influence on runoff and sediment yield in the Andes region: Observation and modeling. J. Hydrol. 2001, 254, 124–144. [Google Scholar] [CrossRef]
- Michaelides, K.; Lister, D.; Wainwright, J.; Parsons, A.J. Vegetation controls on small-scale runoff and erosion dynamics in a degrading dryland environment. Hydrol. Process. 2009, 23, 1617–1630. [Google Scholar] [CrossRef]
- Zheng, F.L.; He, X.B. The effect of vegetation broken and recover on the soil erosion of the Loess Plateau. J. Soil Water Conserv. 2002, 7, 21–27. (In Chinese) [Google Scholar]
- Joseph, P.H. Influence of vegetation cover and crust type on wind-blown sediment in a semi-arid climate. J. Arid. Environ. 2004, 58, 167–179. [Google Scholar]
- Zhang, B.; Yang, Y.S.; Zepp, H. Effect of vegetation restoration on soil and water erosion and nutrient losses of a severely eroded clayey Plinthudult in southeastern China. Catena 2004, 57, 77–90. [Google Scholar] [CrossRef]
- Gyssels, G.; Poesen, J.; Nachtergaele, J.; Govers, G. The impact of sowing density of small grains on rill and ephemeral gully erosion in concentrated flow zones. Soil Tillage Res. 2002, 64, 189–201. [Google Scholar] [CrossRef]
- Zhou, Z.C.; Shangguan, Z.P. The effects of ryegrass roots and shoots on loess erosion under simulated rainfall. Catena 2007, 70, 350–355. [Google Scholar] [CrossRef]
- Boer, M.; Puigdefábregas, J. Effects of spatially structured vegetation patterns on hill-slope erosion in a semiarid Mediterranean environment: A simulation study. Earth Surf. Process. Landf. 2005, 30, 149–167. [Google Scholar] [CrossRef]
- Rogers, R.D.; Schumm, S.A. The effect of sparse vegetative cover on erosion and sediment yield. J. Hydrol. 1991, 123, 19–24. [Google Scholar] [CrossRef]
- Cerda, A. The effect of patchy distribution of Stipa tenacissima L. on runoff and erosion. J. Arid. Environ. 1997, 36, 37–51. [Google Scholar] [CrossRef]
- Vasquez, M.R.; Ventura, R.E.; Oleschko, K.; Hernández-Sandoval, L.; Parrot, J.F.; Nearing, M.A. Soil erosion and runoff in different vegetation patches from semiarid Central Mexico. Catena 2010, 80, 162–169. [Google Scholar] [CrossRef]
- Pan, C.Z.; Shangguan, Z.P.; Lei, T.W. Influence of grass and moss on runoff and sediment yield on sloped loess surfaces under simulated rainfall. Hydrol. Process. 2006, 20, 3815–3824. [Google Scholar] [CrossRef]
- Zhou, Z.C.; Shangguan, Z.P. Effect of ryegrasses on soil runoff and sediment control. Pedosphere 2008, 18, 131–136. [Google Scholar] [CrossRef]
- Baets, S.D.; Poesen JGyssels, G. Effects of grass roots on the erodibility of topsoils during concentrated flow. Geomorphology 2006, 76, 54–67. [Google Scholar] [CrossRef]
- Zhang, G.H.; Liu, G.B.; Zhang, P.C.; Yi, L. Influence of vegetation parameters on runoff and sediment characteristics in patterned Artemisia capillaris plots. J. Arid. Land 2014, 6, 352–360. [Google Scholar] [CrossRef]
- Neibling, W.H.; Alberts, E.E. Composition and yield of soil particles transported through sod strips. Am. Soc. Agric. Eng. 1979, 79, 2065. [Google Scholar]
- Dillaha, T.A.; Sherrard, J.H.; Lee, D.; Mostaghimi, S.; Shanholtz, V.O. Evaluation of vegetative filter strips as a best management practice for feedlots. J. Water Pollut. Control. Fed. 1988, 60, 1231–1238. [Google Scholar]
- Chen, H. Effects of rainfall characteristics and runoff from up slope on erosion and yield sediment. J. Soil Water Conserv. 1992, 6, 17–23. (In Chinese) [Google Scholar]
- Chen, H. Study on the Slope and Gully Erosion in a Watershed; China Meteorological Press: Beijing, China, 1993; pp. 166–179. (In Chinese) [Google Scholar]
- Zheng, F.L.; Huang, C.H.; Norton, L.D. Vertical hydraulic gradient and run-on water and sediment effects on erosion processes and sediment regimes. Soil Sci. Soc. Am. J. 2000, 64, 4–11. [Google Scholar] [CrossRef]
- Li, M.; Yao, W.Y.; Ding, W.F.; Yang, J.; Chen, J. Effect of grass coverage on sediment yield in the hillslope-gully side erosion system. J. Geogr. Sci. 2009, 19, 321–330. [Google Scholar] [CrossRef]
- Lei, A.L.; Tang, K.L. Retrospect and prospect for soil erosion studies of ridge-hill-gully side system. Bull. Soil Water Conserv. 1997, 17, 37–43. (In Chinese) [Google Scholar]
- Lei, A.L.; Tang, K.L.; Wang, W.L. Significant and character of conception of soil erosion chain. J. Soil Water Conserv. 2000, 14, 79–83. (In Chinese) [Google Scholar]
- Jiang, D.L.; Zhao, C.X.; Chen, Z.L. Preliminary analysis of runoff and sediment source of small watershed in the middle reaches of the Yellow River. Acta Geogr. Sin. 1966, 32, 20–36. (In Chinese) [Google Scholar]
- Castillo, V.M.; Martinez, M.M.; Albaladejo, J. Runoff and soil loss response to vegetation removal in a semiarid environment. Soil Sci. Soc. Am. J. 1997, 61, 1116–1121. [Google Scholar] [CrossRef]
- Benito, E.; Santiago, J.L.; Blas, D.E.; Varela, M. Deforestation of water-repellent soils in Galicia (NW Spain): Effects on surface runoff and erosion under simulated rainfall. Earth Surf. Process. Landf. 2003, 28, 145–155. [Google Scholar] [CrossRef]
- Tang, K.L.; Zheng, S.Q.; Xi, D.Q.; Sun, Q.F. Soil loss and treatment in sloping farmland in Xingzihe Watershed. Bull. Soil Water Conserv. 1983, 3, 43–48. (In Chinese) [Google Scholar]
- Gong, S.Y.; Jiang, D.Q. The soil loss and treatment in a small watershed in loess hilly area in the middle reaches of Yellow River. Sci. China 1978, 21, 671–678. (In Chinese) [Google Scholar]
- Wei, W.; Chen, L.D.; Fu, B.J.; Huang, Z.; Wu, D.; Gui, L. The effect of land uses and rainfall regimes on runoff and soil erosion in the semi-arid loess hilly area, China. J. Hydrol. 2007, 335, 247–258. [Google Scholar] [CrossRef]
- Zhou, Z.C.; Shangguan, Z.P. Modeling vegetation coverage and soil erosion in the Loess Plateau Area of China. Ecol. Model. 2006, 198, 263–268. [Google Scholar] [CrossRef]
- Ploey, D.J.; Savat, J.; Moeyersons, J. The differential impact of some soil factors on flow, runoff, creep, and rainwash. Earth Surf. Process. Landf. 1976, 1, 151–161. [Google Scholar] [CrossRef]
- Morgan, R.P.C.; Finney, H.J.; Lavee, H.; Merritt, E.; Noble, C.A. Plant cover effects in hillslope runoff and erosion: Evidence from two laboratory experiments. In Hillslope Processes; Abrahams, A.D., Ed.; Allen and Unwin: London, UK, 1986; pp. 77–96. [Google Scholar]
- Bochet, E.; Poesen, J.; Rubio, J.L. Mound development as an interaction of individual plants with soil, water erosion and sedimentation processes on slopes. Earth Surf. Process. Landf. 2000, 25, 847–867. [Google Scholar] [CrossRef]
- Zhang, G.H.; Liu, G.B.; Wang, G.L. Effects of canopy and roots of patchy distributed artemisia capillaris on runoff, sediment, and the spatial variability of soil erosion at the plot scale. Soil Sci. 2012, 177, 409–415. [Google Scholar] [CrossRef]
- Zhang, G.H.; Liu, G.B.; Wang, G.L. Effects of Caragana Korshinskii Kom. cover on runoff, sediment yield and nitrogen loss. Int. J. Sediment Res. 2010, 25, 245–257. [Google Scholar] [CrossRef]
Figure 1.
Schematic diagram of the hillslope-gully system of the Loess Plateau (A) and the soil box designing diagram (B).
Figure 1.
Schematic diagram of the hillslope-gully system of the Loess Plateau (A) and the soil box designing diagram (B).

Figure 2.
Schematic diagram of different grass coverage rates and different grass spatial arrangement patterns on soil box.
Figure 2.
Schematic diagram of different grass coverage rates and different grass spatial arrangement patterns on soil box.

Figure 3.
Runoff and sediment reduction of the slope-gully system under the different grass coverage, different grass spatial arrangement patterns, and different flow discharges (Mean values of the same letter in different columns are not significantly different at p = 0.05 level using the least significant difference method). (A) (Q = 3.2 L·min−1). (B) (Q = 3.2 L·min−1). (C) (Q = 5.2 L·min−1). (D) (Q = 5.2 L·min−1).


Figure 4.
Contributions of the hillslope and the gully side to erosion reductions of the slope-gully erosion system.
Figure 4.
Contributions of the hillslope and the gully side to erosion reductions of the slope-gully erosion system.


Table 1.
Soil basic information in this study.
| Soil Type | Soil Texture | Soil Particle-Size Distribution (g kg−1) | pH (H2O) | OM (%) | ||
|---|---|---|---|---|---|---|
| Sand | Silt | Clay | ||||
| Loessic soil | Sandy loam | 61.04 ± 7.14 | 28.16 ± 4.20 | 10.80 ± 3.90 | 7.2 ± 0.26 | 1.93 ± 1.23 |
Values represent means ± SD (standard deviation).
Table 2.
Runoff and sediment yielding on the slope-gully system under the different grass coverage and flow discharges.
Table 2.
Runoff and sediment yielding on the slope-gully system under the different grass coverage and flow discharges.
| Flow Discharge (L·min−1) | Grass Coverage (%) | Runoff (L) | Erosion (kg) |
|---|---|---|---|
| 3.2 | 0 | 68.17 a | 26.80 a |
| 30 | 66.08 b | 23.76 b | |
| 50 | 63.62 c | 23.10 c | |
| 70 | 58.89 d | 22.81 d | |
| 90 | 43.08 e | 16.46 e | |
| 5.2 | 0 | 115.24 a | 58.64 a |
| 30 | 114.39 a | 52.01 b | |
| 50 | 109.23 ab | 39.77 c | |
| 70 | 111.37 b | 35.83 d | |
| 90 | 103.30 c | 33.02 d |
Mean values of the same letter in the same columns are not significantly different at p = 0.05 level using the least significant difference method.
Table 3.
Gully slope erosion under the different flow discharges, different grass coverage rates, and different grass arrangement patterns.
Table 3.
Gully slope erosion under the different flow discharges, different grass coverage rates, and different grass arrangement patterns.
| VCR | FD | VDP | Erosion | VCR | FD | VDP | Erosion |
|---|---|---|---|---|---|---|---|
| (%) | (L·min−1) | (kg) | (%) | (L·min−1) | (kg) | ||
| 0 | 3.2 | 1.89 | 0 | 5.2 | 16.26 | ||
| 30 | 3.2 | Up-slope | 4.99 b | 30 | 5.2 | Up-slope | 23.93 b |
| Middle-slope | 6.98 a | Middle-slope | 23.79 b | ||||
| Down-slope | 6.87 a | Down-slope | 26.7 a | ||||
| 50 | 3.2 | Up-slope | 10.23 a | 50 | 5.2 | Up-slope | 21.25 a |
| Middle-slope | 11.93 a | Middle-slope | 18.6 b | ||||
| Down-slope | 6.51 b | Down-slope | 20.4 a | ||||
| 70 | 3.2 | Up-slope | 12.02 a | 70 | 5.2 | Up-slope | 22.99 a |
| Middle-slope | 12.5 a | Middle-slope | 19.36 b | ||||
| Down-slope | 10.01 b | Down-slope | 19.08 b | ||||
| 90 | 3.2 | 10.53 | 90 | 5.2 | 22.95 |
Mean values of the same letter in the same columns are not significantly different at p = 0.05. VCR: vegetation coverage rate; FD: flow discharge; VDP: vegetation distribution pattern.
Table 4.
Runoff and sediment yielding of hillslope under the different grass coverage and flow discharges.
Table 4.
Runoff and sediment yielding of hillslope under the different grass coverage and flow discharges.
| FD (L·min−1) | VCR (%) | VDP | Runoff (L) | Erosion (kg) | FD (L·min−1) | VCR (%) | VDP | Runoff (L) | Erosion (kg) |
|---|---|---|---|---|---|---|---|---|---|
| 3.2 | 0 | - | 68.79 | 24.91 | 5.2 | 0 | - | 115.05 | 42.38 |
| 30 | US | 67.83 a | 20.12 a | 30 | US | 114.41 a | 35.25 a | ||
| MS | 67.56 a | 15.67 b | MS | 113.50 a | 29.03 b | ||||
| DS | 65.21 a | 13.87 c | DS | 111.13 a | 24.30 c | ||||
| 50 | US | 61.64 a | 16.72 a | 50 | US | 106.87 a | 31.75 a | ||
| MS | 59.78 a | 12.12 b | MS | 103.76 a | 25.52 b | ||||
| DS | 59.56 a | 11.77 b | DS | 103.71 a | 23.79 c | ||||
| 70 | US | 56.85 a | 15.03 a | 70 | US | 111.58 a | 29.24 a | ||
| MS | 58.82 a | 11.49 b | MS | 108.19 a | 24.73 b | ||||
| DS | 58.13 a | 9.37 c | DS | 107.94 a | 21.08 c | ||||
| 90 | - | 56.98 | 5.93 | 90 | - | 90.81 a | 15.07 |
Mean values of the same letter in the same columns are not significantly different at p = 0.05. VCR: vegetation coverage rate; FD: flow discharge; VDP: vegetation distribution pattern.
Table 5.
The correlations between the gully slope erosion and effect factors.
| Gully Erosion | Unit Stream Power | Flow Discharge | Sediment Concentration | Grass Coverage Rate on Slope | |
|---|---|---|---|---|---|
| Gully erosion | 1 | 0.799 * | 0.91 * | −0.875 * | 0.447 |
| Unit stream power | 1 | 0.841 * | −0.825 * | −0.647 | |
| Flow discharge | 1 | −0.913 * | 0.314 | ||
| Sediment concentration | 1 | 0.719 * | |||
| Grass coverage rate on slope | 1 |
* Significant at 0.05 level.
Disclaimer/Publisher’s Note: The statements, opinions and data contained in all publications are solely those of the individual author(s) and contributor(s) and not of MDPI and/or the editor(s). MDPI and/or the editor(s) disclaim responsibility for any injury to people or property resulting from any ideas, methods, instructions or products referred to in the content. |
© 2022 by the authors. Licensee MDPI, Basel, Switzerland. This article is an open access article distributed under the terms and conditions of the Creative Commons Attribution (CC BY) license (https://creativecommons.org/licenses/by/4.0/).
Share and Cite
MDPI and ACS Style
Ding, W.; Wang, X.; Zhang, G.; Meng, X.; Ye, Z. Impacts of Grass Coverage and Arrangement Patterns on Runoff and Sediment Yield in Slope-Gully System of the Loess Plateau, China. Water 2023, 15, 133. https://doi.org/10.3390/w15010133
AMA Style
Ding W, Wang X, Zhang G, Meng X, Ye Z. Impacts of Grass Coverage and Arrangement Patterns on Runoff and Sediment Yield in Slope-Gully System of the Loess Plateau, China. Water. 2023; 15(1):133. https://doi.org/10.3390/w15010133
Chicago/Turabian StyleDing, Wenfeng, Xiekang Wang, Guanhua Zhang, Xi Meng, and Zhiwei Ye. 2023. "Impacts of Grass Coverage and Arrangement Patterns on Runoff and Sediment Yield in Slope-Gully System of the Loess Plateau, China" Water 15, no. 1: 133. https://doi.org/10.3390/w15010133
Note that from the first issue of 2016, this journal uses article numbers instead of page numbers. See further details here.