Article

Topographic Effects on Stratiform Precipitation Observed by Vertically Pointing Micro Rain Radars at Ridge and Valley Sites in the Liupan Mountains Area, Northwest China

1
CMA Cloud-Precipitation Physics and Weather Modification Key Laboratory, China Meteorological Administration Weather Modification Center, Beijing 100081, China
2
Key Laboratory for Meteorological Disaster Monitoring and Early Warning and Risk Management of Characteristic Agriculture in Arid Regions, Yinchuan 750002, China
*
Author to whom correspondence should be addressed.
Water 2023, 15(1), 134; https://doi.org/10.3390/w15010134
Submission received: 10 November 2022 / Revised: 20 December 2022 / Accepted: 27 December 2022 / Published: 30 December 2022
(This article belongs to the Section Hydrology)

Abstract

:
To investigate the topographic effects on precipitation in the Liupan Mountains Area of Northwest China, three micro rain radars, located at a ridge, west valley, and east valley in the area, respectively, were used to observe precipitation processes. By comparing the characteristics of stratiform precipitation at three sites, it was found that (i) the effective radar reflectivity and characteristic falling velocity of hydrometeors at the ridge and east valley were larger than those at the west valley; (ii) the diameter and density of solid hydrometeors at the ridge and east valley were slightly larger than those at the west valley; and (iii) there was also a higher occurrence frequency of larger graupel at the ridge. It is inferred that the precipitable water vapor at the ridge and east valley is richer than at the west valley, which leads to a larger aggregation efficiency and degrees of riming at the former than the latter. Besides, forced uplifting of water vapor over the mountain area around the ridge may play a part in topographic supercooling, which leads to enhanced riming of supercooled liquid water. The conclusions will contribute to a better understanding of the mechanisms of precipitation–terrain interactions in the area.

1. Introduction

Warm and humid air uplifted by mountains is a regular mechanism for the formation of precipitation. The topography of a region also has a significant influence on the falling zone and types of precipitation. Since mountain areas are uneven in their morphology and locations, the influence on cloud and precipitation processes cannot be ignored. Precipitation over mountainous areas is not isolated but interacts substantially with weather systems (i.e., deep convection, fronts, and cyclones) in the vicinity of the target area. In frontal cloud systems, the pole-ward flow of warm-sector air ahead of the system may rise easily over the terrain, resulting in a maximum of precipitating clouds, which leads to the maximum rainfall amount occurring on ridges and the minimum in valleys [1]. Orographic precipitation is an intrinsically transient phenomenon. Pre-existing weather disturbance plays an important role in its genesis, and the precipitation intensity can vary significantly during the process of a change in weather conditions [2]. The in-cloud temperature influences precipitation in two ways. First, at sub-zero temperatures, the Bergeron ice-phase mechanism may accelerate the formation of hydrometeors [3,4]. Second, falling snowflakes will melt to form rain [5,6]. Besides, the latent heat transferred in the melting process may alter the motion of the air [7]. Observations retrieved by vertically pointing radar (i.e., X-band and Ku-band VPR) during rainfall are different in the distribution and intensity of echoes as well as the derived vertical reflectivity profiles. Reflectivity profiles can be used to classify different rain types, investigate the features of the melting layer and explore the differences in precipitation intensity (e.g., [8,9]). When the effective reflectivity (Ze) of rainfall exceeds 30 dBZ (X-band Vertical Profile of Reflectivity (VPR)), there is an obvious rise in the slope of reflectivity close to the bright band (BB). Inspection of the VPR raw data shows that this phenomenon corresponds to the presence of pockets of intense reflectivity above the BB often seen over the most intense rain shafts. A reasonable cause for such pockets is that, in intense precipitation, updrafts could be immense enough to carry huge amounts of cloud liquid water from below the melting layer toward the snow above [8]. The collection of water droplets by snowflakes leads to riming and the genesis of graupel. If the updraft is immense enough and the temperature is several degrees below 0 °C, the water collected by the graupel remains above for a period of time, which makes the reflection of the graupel particles much higher than dry ice [8]. Precipitation growth caused by deposition remains in the melting layer. Wexler (1955) pointed out that the cooling of saturated air and resulting condensation by melting snow causes a 6% increase in hydrometeor mass and, hence, an increase in reflectivity. The magnitude of growth is assumed to be roughly equal in the layers above and below the melting layer [10]. Using the BB measured by micro rain radars (MRRs) at two sites in Korea, Cha et al. (2009) pointed out that the key factors leading to differences in precipitation intensity were the distinct snow particle densities at valley and ridge sites, which corresponded to various degrees of riming. Meanwhile, the forced uplifting of cloudy air over the mountain area around the ridge site could cause an orographic super-cooling effect that resulted in the enhanced riming of super-cooled cloud drops [9].
In the past few decades, a variety of coordinated field projects have been carried out to collect observational meteorological data in mountainous areas [11]. In Ningxia Hui Autonomous Region, China, a series of field experiments aimed at studying orographic precipitation over the Liupan Mountains area have been conducted since the year 2017. The purpose of these experiments is to collect a statistically robust set of observations in mid-latitude cyclones upstream of, over, and downstream of a mountain range, which may shed light on the mechanisms of how topography influences the atmospheric physical conditions and precipitation. The Liupan Mountains are located in the west of the Loess Plateau and are adjacent to the Qinghai-Tibet Plateau, Sichuan Basin, and Qinling Mountains (Figure 1). Owing to the combined action of mid-latitude baroclinic storm systems and the adjacent Qinghai-Tibet Plateau, orographic precipitation occurs frequently there. In summer, the airflows formed by the blocking effects of the Qinghai-Tibet Plateau carry a great quantity of warm and moist air toward the Liupan Mountains. Therefore, this area is an ideal place for researching cloud-precipitation mechanisms.
Radar observations are broadly used in studying orographic precipitation. For instance, Doppler radars are used in the measurement of vertical velocity. In fact, velocity measurements at vertical incidence depend on both the type of target observed and on the dynamics of the atmosphere [12]. A BB is an intense radar echo area related to the melting of hydrometeors in stratiform precipitation. In this study, observational data retrieved by high-altitude MRRs documenting stratiform precipitation events at three sites (Figure 2) were analyzed. A climatic overview of the Liupan Mountains area is provided in Section 2, along with an introduction to the geographical and meteorological background. Observations and methods are summarized in Section 3. In Section 4, the characteristics of stratiform precipitation at ridge and valley sites are summarized, including precipitation statistic, vertical structure, and hydrometeors that existed between the 0 °C and −4 °C isotherms, and the frequency differences and different characteristics over the valley and ridge sites compared, as well as the melting layer comparison at different sites, and the raindrop size distributions (RSDs) below the melting layer. The study’s conclusions are presented in Section 5. It is hoped that the conclusions will contribute to a better understanding of the mechanisms of precipitation–terrain interactions in the Liupan Mountains area. Furthermore, through weather modification techniques, the cloud water resources in this region could be developed to improve the local ecological environment as well as the nearby Yellow River Basin.

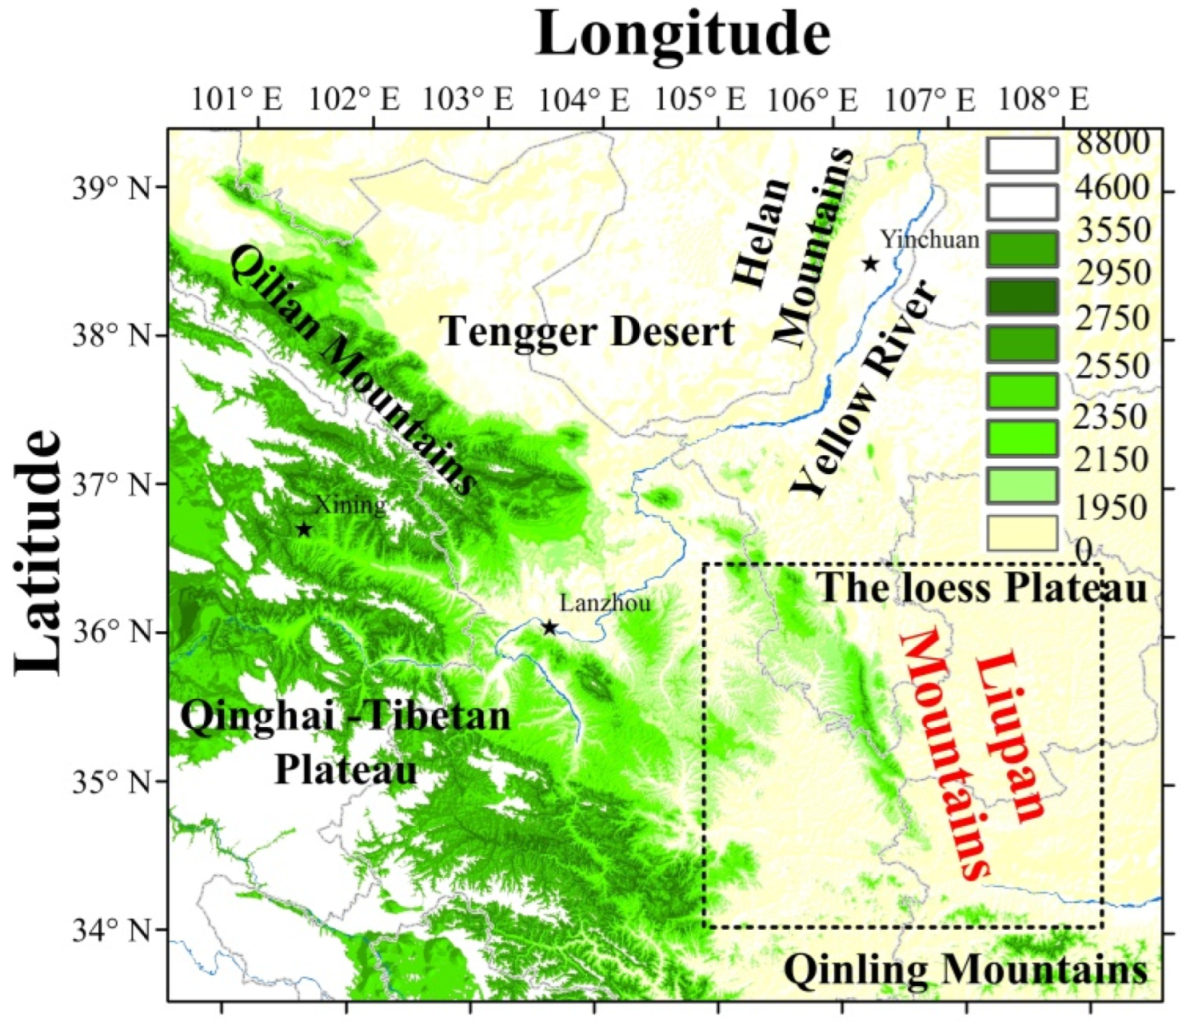
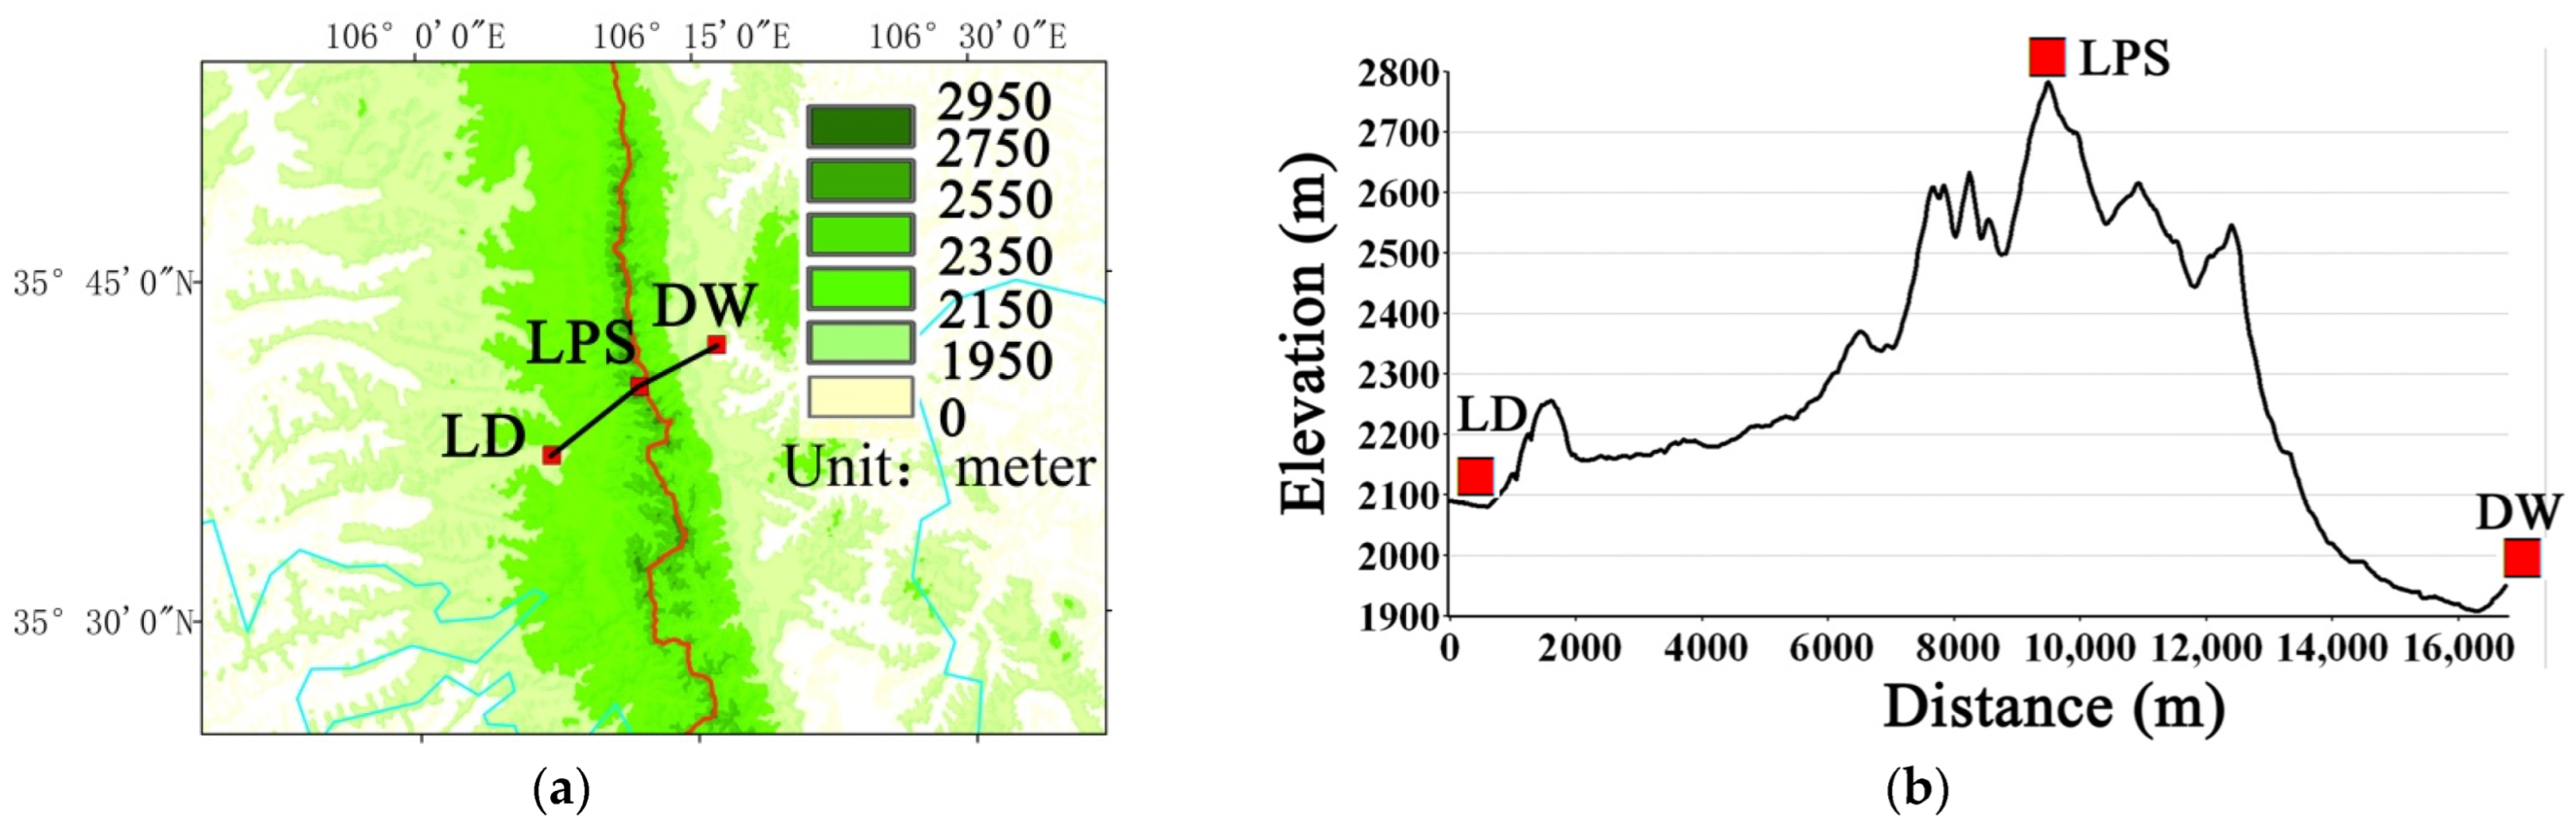
2. Overview of the Liupan Mountains Area

The Liupan Mountains area is located at the northwest edge of the southwest monsoon area. The southwest monsoon prevails in summer, and the abundant, humid water vapor originating from the lower atmosphere over the Indian Ocean, Bay of Bengal, and the South China Sea is transported northward [13]. When weather systems such as high-altitude cold troughs, cold vortices, shear or surface cold fronts from the northwest or west affect this area with cold air, the warm and humid air mass is lifted owing to the weather system and the uplifting effect of the terrain, which leads to precipitation. According to the climate record of the Liupan Mountains area over the past 30 years, the mean and maximum values of precipitation are 569 mm and 717 mm, respectively. Spatially, rainfall occurs more frequently in the south and east parts than the north and west, and statistical analysis shows that the precipitation-related weather systems over the Liupan Mountains area are mostly 500 hPa westerly troughs and 700 hPa shear or low vortices, of which 500 hPa trough and 700 hPa shear systems account for 72% of all precipitation events, and 500 hPa trough and 700 hPa low vortex systems account for 17.1%. The direction of movement of precipitating clouds over the Liupan Mountain area is mainly from southwest to northeast, accounting for 51.8%, followed by northwest to southeast (23.6%) and then west to east (15.4%). Overall, the direction of movement of precipitating clouds in each season is mainly from southwest to northeast.

3. Observations and Methods

The ridge site was located at Liupan Mountains Weather Station (LPS; 35.67° N, 106.20° E; 2842 m MSL); the west valley site was located at Longde Weather Station (LD; 35.62° N, 106.12° E; 2078 m MSL; approximately 9 km southwest of LPS); and the east valley site was located at Dawan Weather Modification Operation Site (DW; 35.7° N, 106.26° E; 1980 m MSL; approximately 8 km northeast of LPS) (Figure 2).
The MRR employed in this study, manufactured by Meteorologische Messtechnik GmbH (METEK) and referred to as MRR-2, is a Ku-band (wavelength: 12.38 mm; Frequency: 24,230 GHz), low-power, frequency-modulated, and continuous-wave VPR Doppler profiler. The instrument also contains an internal noise elimination and attenuation correction process [14]. All three MRR-2s were established to identify the phases of precipitation particles by way of the signatures of the melting layer; and, in this study, the MRR vertical profiles, which focused on raindrop sizes up to 6500 m in height above ground level, were estimated from the Doppler spectra measured by the MRRs with a vertical resolution of 150 m. For stratiform precipitation, there is a layered signature, with relatively narrow bands of reflectivity values at each height, and the vertical velocities are mainly less than 1 m s−1 [15]. Peters et al. (2005) showed that, provided the vertical wind is not too strong (lower than 2 m s−1), the MRR data averaged in 60 s intervals should offer acceptable raindrop parameter results without vertical wind correction [16]. The wavelength (λ) of MRR-2 is 12.38 mm, and the measured particle center diameter (Di) is below 6 mm, indicating that λ/Di is larger than 1, and, thus, the equivalent reflectivity factor (Ze) can be treated as the same as the reflectivity factor of MRR-2.
The microwave Humidity and Temperature Profiler proposed by Radiometer Physics GmbH (RPG), Germany, is a radiometer that is suited for networks, is economical, and can observe the liquid water path, humidity, and temperature profiles with a high temporal resolution at about 1 s. The correlation coefficient between LPS station air temperature and that measured by RPG (at the altitude of LPS) was 0.9512. The temperature profiles of RPG located at the LD station were used to calculate the isotherms in this paper.
If the vertical spatial resolution of the MRR data is adequate, the melting layer shown in the vertical reflectivity profile of stratiform precipitation as a BB, a layer of increased radar reflectivity value as well as an increase in Doppler velocity [15]. As a snow crystal falls through the atmosphere from below- to above-freezing conditions, the snowflake starts to melt. This enhances the radar-detected reflectivity owing to the larger dielectric constant of water than that of ice. Once the melting is finished, the resulting raindrop usually obtains a smaller diameter than the originating snowflake and will obtain a larger terminal velocity as well. Figure 3 explains the definitions of the important parameters of the melting layer that can be retrieved with the scheme [8,9]. Using these principles, the scheme was used to identify the top (BBt) and bottom (BBb) of the melting layer as the most negative and positive gradient in reflectivity, respectively. This is similar to the algorithm outlined by many previous authors (e.g., [8,9]). Once the BB boundaries are fixed, the largest BB reflectivity Ze(peak) and its height Hpeak are obviously seen. Related quantities such as the BB thickness (BBth) and the relative position of the peak in BB (Rpeak), are easily derived as well. Above the BB, the radar reflectivity and fall velocity of snow at the onset of the melting layer, Ze(snow) and Vsnow, are defined as the reflectivity and fall velocity 150 m above the BBt. Finally, the reflectivity of rain Ze(rain) and fall velocity of rain Vrain are measured 150 m below the bottom height BBb. The various parameters of BB mentioned above were computed for this study [8,9,17]. The relative peak position (Rpeak) in the BB is calculated as:
R peak = H peak BB b BB th
In terms of comparing the BB characteristics measured at the MRR-2 sites, one more characteristic of BB was also retrieved, using the algorithm outlined by Cha et al.—namely, the BB sharpness (BBsh), which is a method to obtain the reflectivity gradient within the BB (average gradient of reflectivity above and below the reflectivity peak) and is calculated as follows:
BB sh = Δ Z / BB th ,
where   Δ Z = Z e peak / Z e rain + Z e peak / Z e snow .
When the rain intensity was large (i.e., the MRR peak reflectivity was large), estimating the Vsnow from the MRR data was inaccurate owing to severe attenuation, and Vsnow was calculated to be larger than Vrain in many cases. To avoid this, only samples in which Vsnow was smaller than Vrain are considered in Section 4.4. Likewise, to avoid circumstances like Ze(snow) being larger than Ze(rain) affecting the BB model, only samples in which Ze(snow) was smaller than Ze(rain) are taken into account in this paper.

4. Analysis and Results

4.1. Stratiform Precipitation Statistic Differences

The MRR precipitation reflectivity can be used to classify three types of precipitation: low-level rain (shallow), rain with a BB (stratiform), and convective rain [18]. Of these, shallow rainfall makes a lower contribution to the cumulative rainfall. The MRR reflectivity of convective rain declines dramatically with height, which can be attributed to the immense reflectivity attenuation in heavy rainfall, as mentioned by Tsai and Yu (2002) [19]. Therefore, only the stratiform precipitation MRR-2 profiles of reflectivity and its characteristic fall velocity are considered in this paper. The annual total cumulative precipitation from rain gauges in 2021 at LD, LPS, and DW was 496.7 mm, 763.9 mm, and 570.7 mm, respectively. However, the MRR cannot clearly resolve the transition process of snow to rain, nor the BB boundary when the surface temperature is lower than 0 °C. Therefore, the MRR data from May to September at each place were chosen to avoid these complexities. Besides, precipitation in the Liupan Mountains area mainly occurs from May to September. The cumulative precipitation at LD, LPS, and DW was 328.5 mm, 474.4 mm, and 357.7 mm from May to September 2021, which accounted for 66.1%, 63.1%, and 62.7% of the annual amount, respectively. The cumulative rainfall of stratiform precipitation at LD, LPS, and DW was 138.6 mm, 204.5 mm, and 193.5 mm from May to September in 2021, which accounted for 55.2%, 43.1%, and 54.1%, respectively. Besides, the mean stratiform precipitation intensity in the period from May to September at LD, LPS, and DW was 1.0 mm, 1.6 mm, and 1.5 mm h−1, respectively. However, at LPS, there was a lower percentage of stratiform rainfall but larger percentages of convective and shallow rainfall at LPS, and, thus, contributed to a larger proportion of the precipitation contribution as well as the mean precipitation intensity. The percentages of stratiform and convective precipitation were as large at LD as at DW, but the proportion of the precipitation amount as well as the average precipitation intensity at DW was slightly larger than at LD.

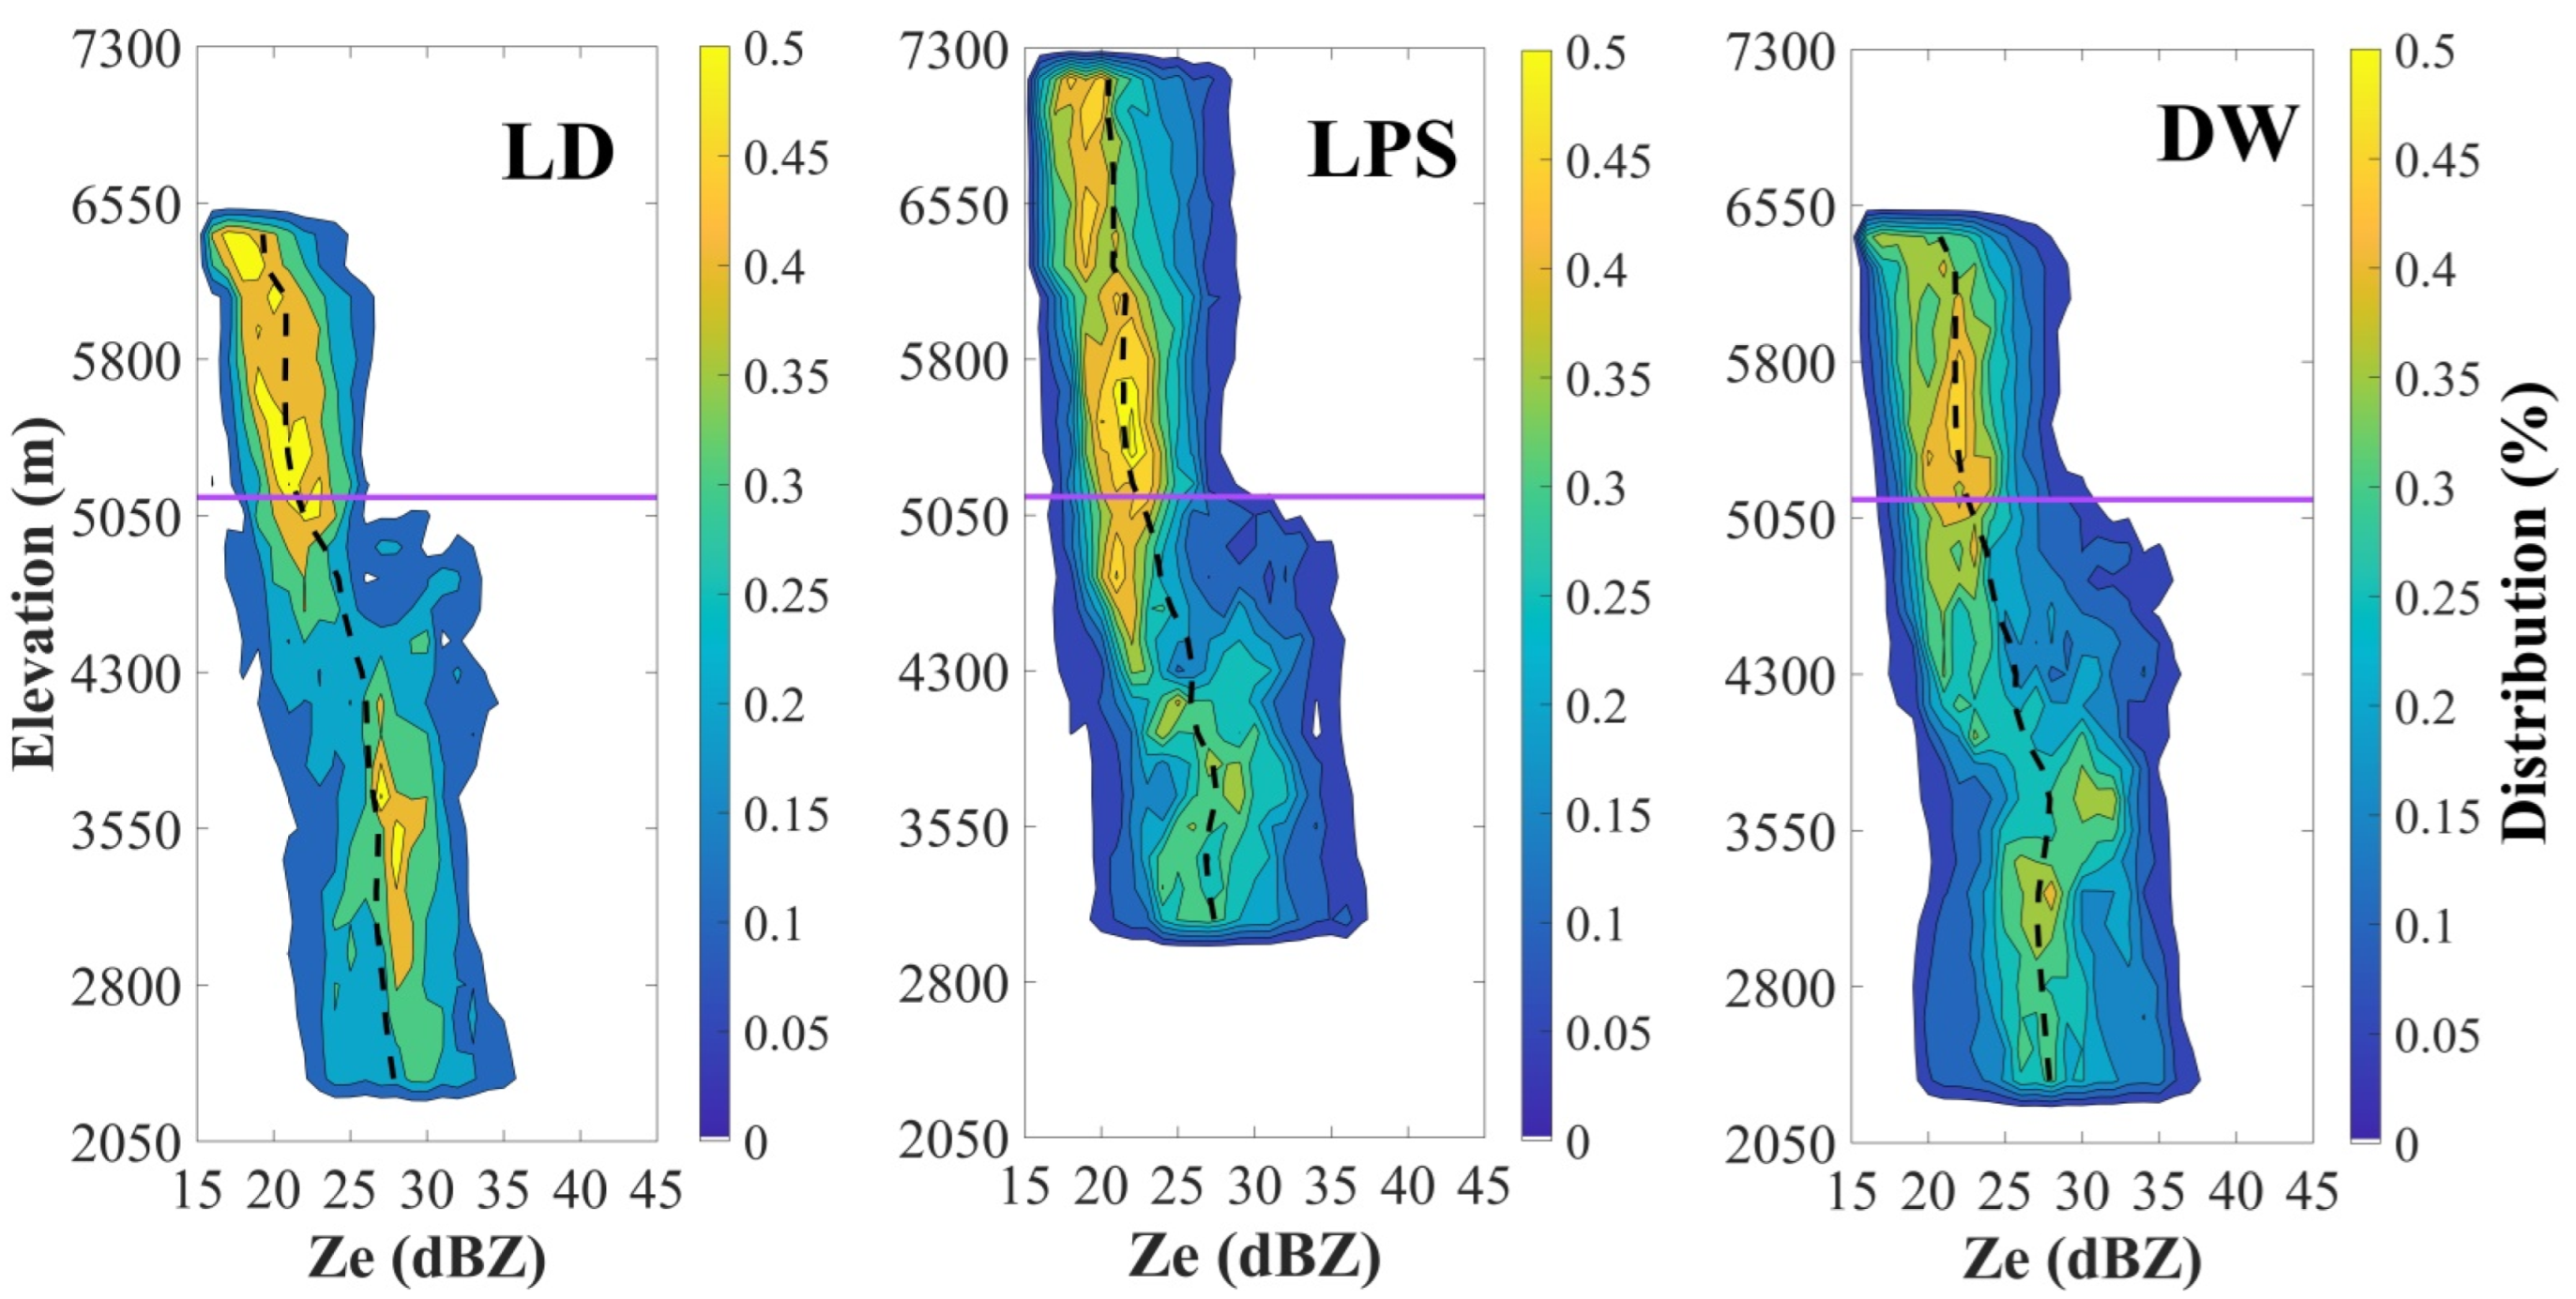
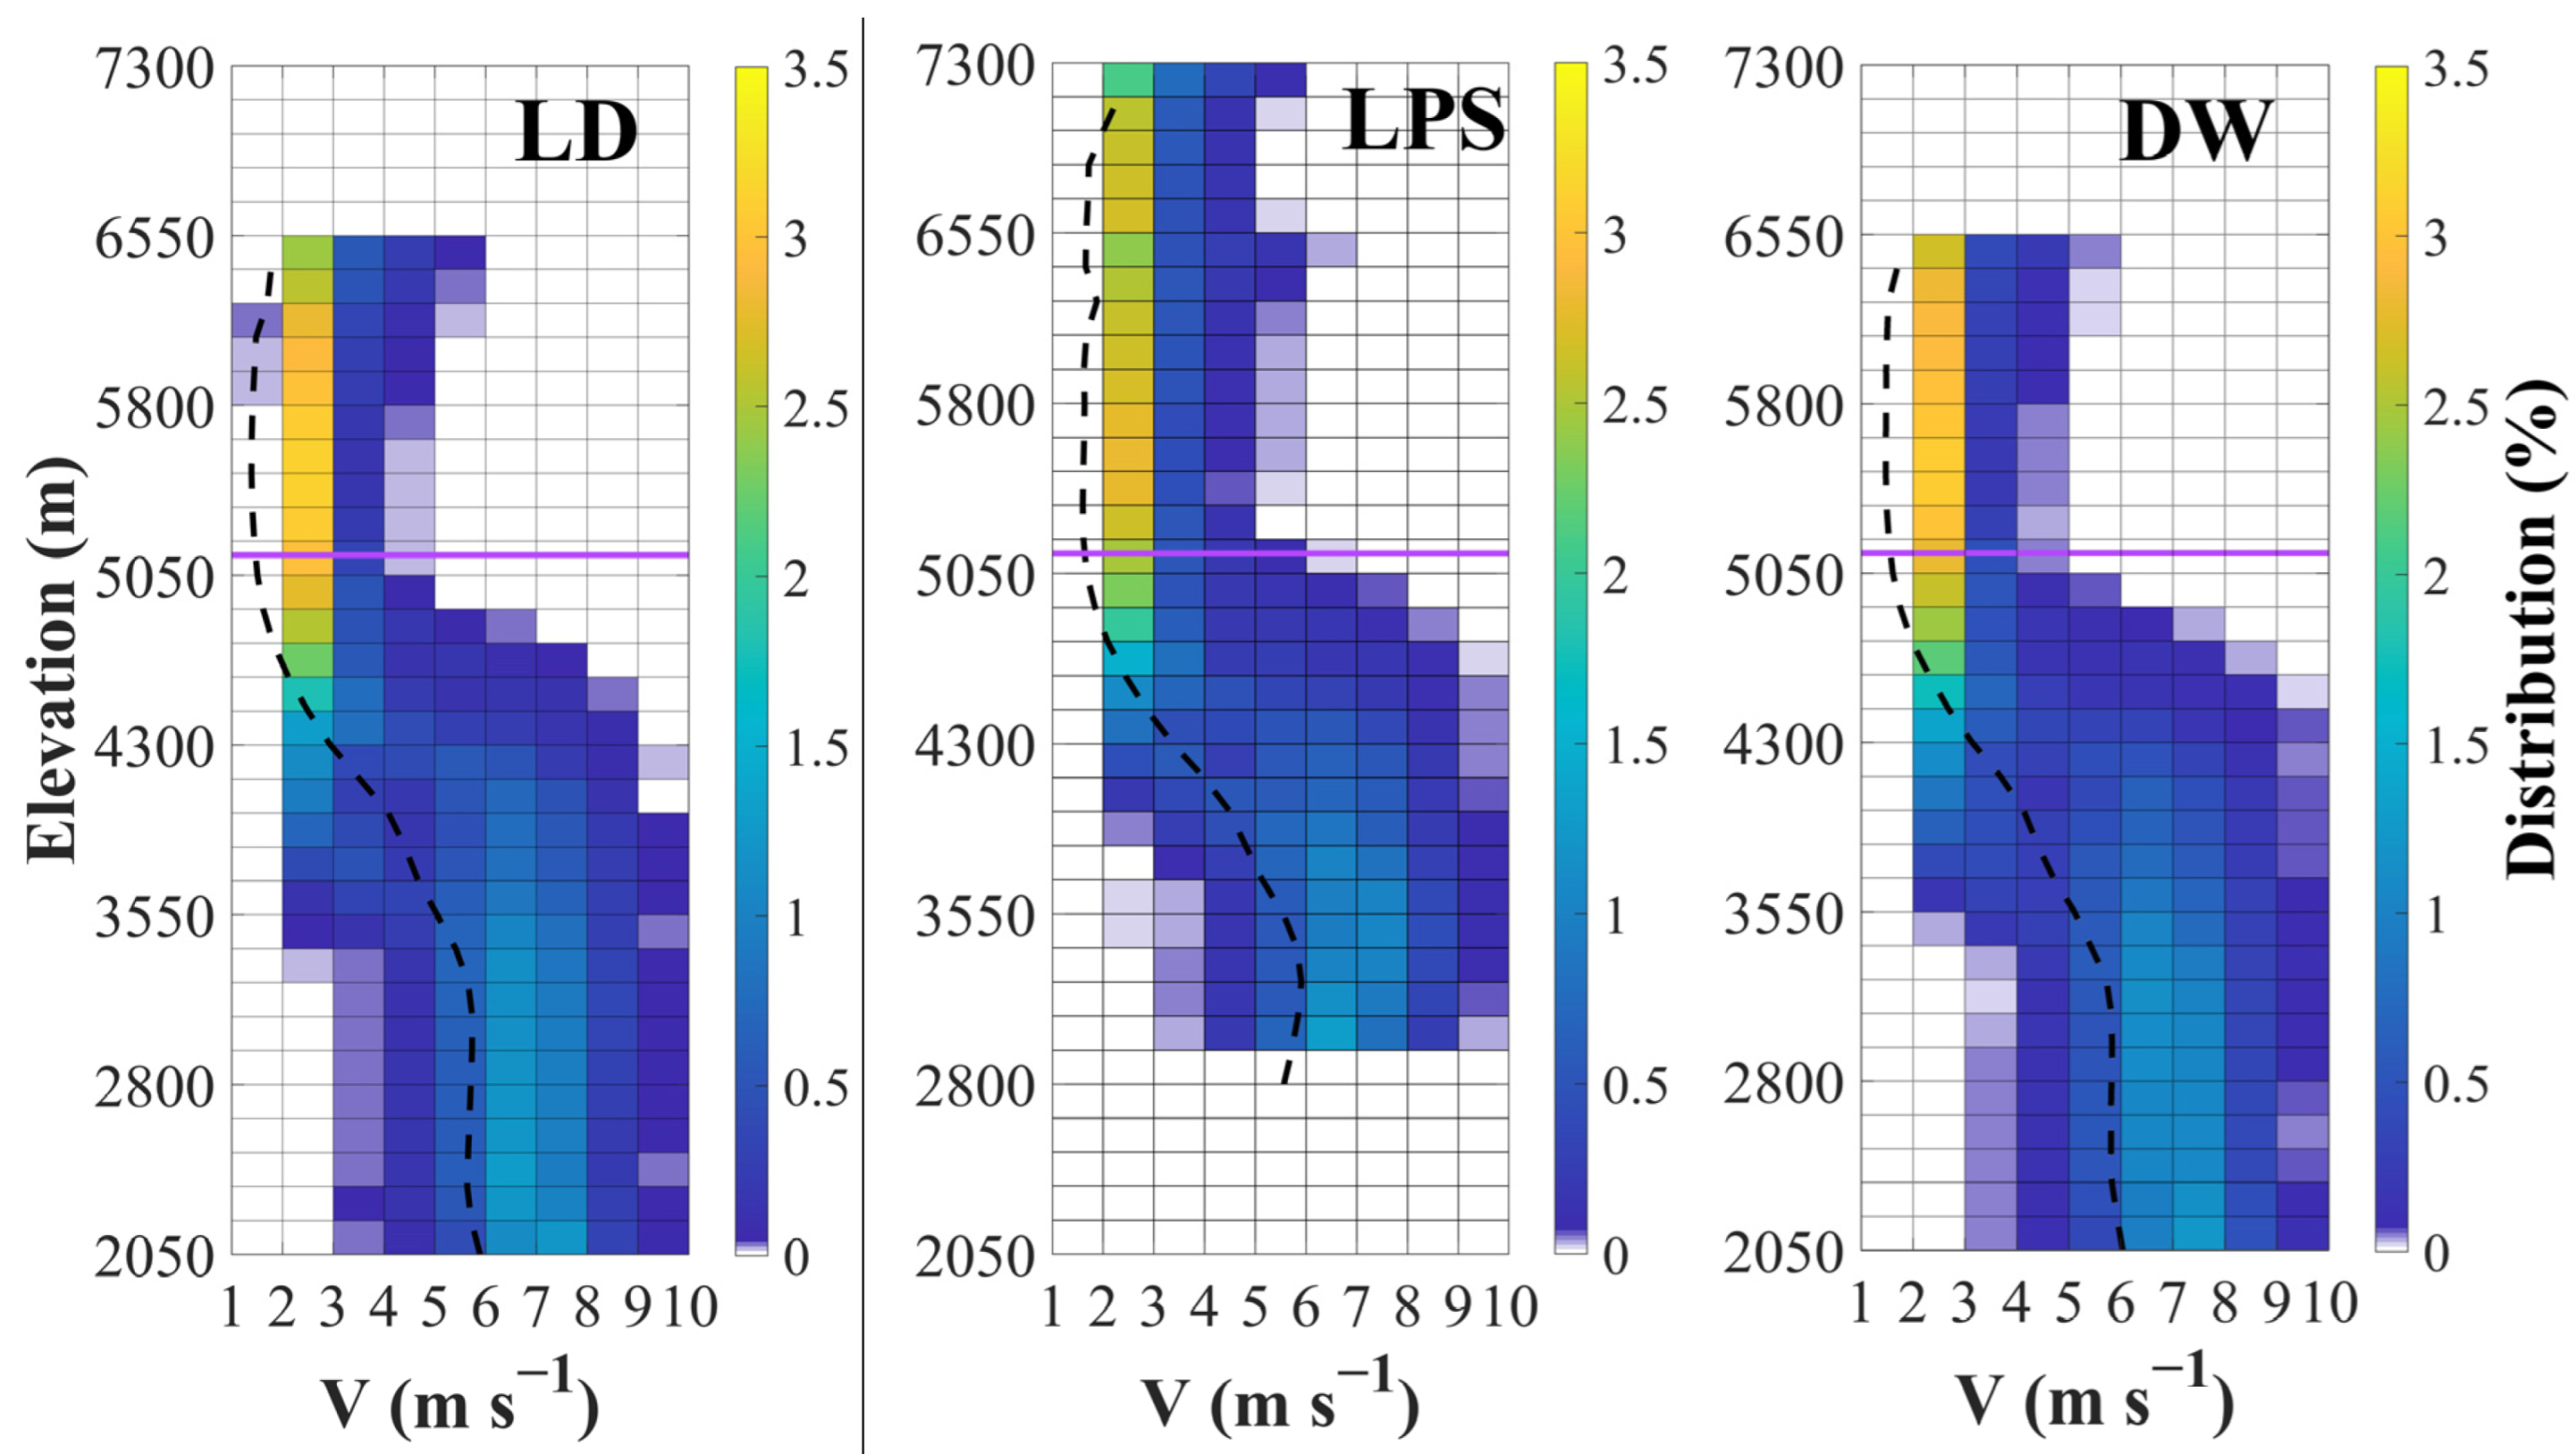
4.2. Vertical Structures Comparisons

For several types of rain, the microphysical processes during the formation and landing of raindrops are significantly diverse. Therefore, investigating the reflectivity profiles of MRR (Ze greater than 15 dBZ) is beneficial for improving the knowledge of the microphysical processes of precipitation. Figure 4 shows the MRR data for stratiform precipitation in terms of contoured frequency-by-altitude diagrams (CFAD) [20]. The level of the 0 °C isotherm (red line; ~5100 m) was averaged by all the temperature profile data from the RPG at LD. The stratiform CFAD in Figure 4 indicates a frequent occurrence of weak reflectivity below 4.5 km, and the reflectivity remains roughly constant with decreasing height. A mean reflectivity value at about 25 dBZ suggests that the raindrop evaporation and coalescence are approximately in balance in stratiform rainfall. The enhanced radar echo region (i.e., the BB) was detected at around 4.6 km, which was 0.6 km below the average RPG 0 °C isotherm (~5100 m). The BBt can be considered as the melting level and the altitude of the 0 °C isotherm, meaning the position of the 0 °C isotherm indicated by the MRR and RPG at LD agreed well with each other. Above that level, the stratiform reflectivity decreased sharply to a minimum centered at approximately 16 dBZ with increasing height. Besides, the extremely narrow frequency distribution within ±5 dBZ indicates an approximately homogenous field of reflectivity at each level.
For around 1200 m above the BBt, at a level corresponding to approximately the height of the −6 °C (The height of the −6 °C isotherm was approximately 6100 m AML in this paper, not shown in Figure 4 and Figure 5), the growth of the snow reflectivity changed noticeably. Such a transition cannot be attributed to growth by deposition; therefore, it is caused by a sudden increase in the magnitude of aggregation at that level, and updrafts may be strong enough to bring large amounts of cloud liquid water from below the melting layer toward the snow above. The capture of water droplets by snowflakes leads to riming and the genesis of graupel [8]. At the sub-0 °C height (above 5100 m) shown in Figure 4, the mean MRR-2 Ze at LD, LPS, and DW was 18.96 dBZ, 20.68 dBZ, and 20.86 dBZ, respectively. A possible explanation might be that the deposition and aggregation efficiency as well as the degree of riming at the ridge and east valley sites, were greater than those at the west valley site. The phenomenon was similar inside the melting layer; the Ze(peak) at the west valley site was 29.8 dBZ, but was 32.4 dBZ and 31.95 dBZ at the ridge and east valley site, respectively. This was because the cooling of saturated air and resulting condensation by melting snow caused a rise in hydrometeor mass of 6% and, hence, an increase in reflectivity. The magnitude of growth is assumed to be roughly equal in the layers above and below the melting layer [10]. Table 1 also shows that, although the Ze(snow) was 21.35 dBZ at the ridge, the Ze(rain) was the largest at the ridge site. These differences at the ridge site might be caused by the forced uplifting of cloudy air over the mountain area around the ridge site, possibly resulting in topographic supercooling that further led to enhancing the riming of supercooled liquid water. Therefore, the precipitation often comes from rather more “compact ice”.
Another effect that may contribute to the melting layer is the change in fall velocity throughout the process of melting [8]. The vertical profiles of fall velocity for stratiform rain at the three sites are presented in Figure 5. As snowflakes fall through the 0 °C isotherm layer, they start to melt inwards from their surface [21,22]. Meanwhile, the velocity of the snowflakes also increases. As the maximum radar reflectivity in the BB was in the area where ice-phase hydrometeors had not melted entirely, it can be concluded that the droplet fall velocity would have continued to increase before totally melting into liquid water and reaching a maximum velocity. The Vsnow and Vpeak (the fall velocity of hydrometeors at BBb) at all three sites were approximately 1.68 m s−1 and 5.60 m s−1, but the Vrain at the ridge site (7.15 m s−1) was approximately 19% greater than at the two valley sites (Table 1). In this process, forced uplifting of cloudy air over the mountain region around the ridge site might have resulted in a topographic supercooling effect that resulted in enhanced riming of supercooled liquid water.

4.3. Solid Hydrometeors Frequency Discrepancies

Analysis of the vertical reflectivity profiles around the BB using the VPR and profiler data confirmed the existence of accelerated snowflake aggregation below the −6 °C level and the importance of riming at high rainfall rates. The fall velocities of solid hydrometeors between the 0 °C and −4 °C isotherms were considered when investigating the classifications at all three sites, as below the −6 °C isotherm could bias the fall velocities. The MRR assumes only positive fall velocities (defined here as movements toward the radar), and this assumption is not always reliable to snowfall owing to its much higher sensitivity to turbulence and related particle motions. In fact, the MIRA36 Doppler velocity measurements during the TOSCA (Towards an Optimal estimation-based Snow Characterization Algorithm) project revealed frequent occurrences of upward particle motions, particularly at lower height levels, while significant downward motions could not be identified [23]. Such updrafts (or negative fall velocities) are currently misinterpreted by the MRR software as extremely high fall velocities owing to the well-known velocity range aliasing typical for FM-CW Doppler radars [23]. Kneifel et al. corrected such artifacts by the assumption that dry snowflakes do not exceed fall velocities of 5.87 m s−1 [24]. Further improved MRR snow measurements using a Doppler spectra post-processing methodology were proposed by Maavalley and Kollias (2012), and they assumed that dry snow does not exceed a velocity of 5.97 m s−1 [25]. Likewise, as seen in Figure 6, only characteristic fall velocities not exceeding 6.0 m s−1 were considered when solid hydrometeors were classified between the 0 °C and −4 °C isotherms.
Nakaya and Terada Jr. proposed a relationship between the dimension of snow particles and fall velocity by way of a field experiment at Mount Tokati [26]. The fall velocities of the needle, plane dendritic crystal, spatial dendritic crystal, and powder snow were no more than 0.8 m s−1. Meanwhile, the fall velocities of snow particles often vary from 0.8 m s−1 to 1.2 m s−1, while that of graupel (snow pellets) ranged from 1.2 to 3.0 m s−1 [27]. As seen in Figure 6, a ratio of velocity below 0.8 m s−1 seldom occurred, as the velocity resolution of MRR-2 is 0.75 m s−1, indicating that this instrument has a weak ability to detect solid hydrometeors whose fall velocities are below 0.8 m s−1. The fall velocity of snow particles (crystals with droplets) between 0.8 m s−1 and 1.2 cm s−1 accounted for 31.4% of the total sample (13014) at LD, 18.0% of the total sample (11022) at LPS, and 23.2% of the total sample (12429) at DW. The fall velocity of graupel (snow pellets) ranging from 1.2 to 3.0 m s−1 at LD accounted for 65.0% of its total sample, 56.3% of its total sample at LPS, and 76.0% of its total sample at DW. Besides, there were frequencies of fall velocities exceeding 3.0 m s−1 at all three sites, indicating larger graupel (snow pellets) in dimensions or densities deposited between the 0°C and −4°C isotherms in the storm of stratiform precipitation in the Liupan Mountains area. The fall velocity of larger graupel (snow pellets) in the range of 3.0 to 6.0 m s−1 accounted for 20.5% of its total sample at LPS, 5.2% of its total sample at DW, and 3.6% of its total sample at LD.

4.4. Melting Layer Characteristics Comparisons

The mode statistics of the BB characteristics are summarized in Table 1. Unlike Figure 4, the mode BBt for the total dataset is slightly larger at the valley sites than at the ridge site, and so is the variability. It is similar for BBb. This indicates the altitudinal difference between the ridge and valley sites, i.e., the ridge being located higher and, therefore, being colder. The width of the BB increases with precipitation intensity in that the larger solid hydrometeors associated with more intense precipitation fall faster and take longer to melt. The mean BBth was slightly larger at the ridge and east valley sites than at the west valley site, while the opposite was true for the mean BBsh. Likewise, the variability of these values was much larger at the valley sites. The mean Ze(peak) was approximately the same close to the middle of the melting layer (~0.54) at all three sites since it depends little on the rainfall intensity [8].
Scatterplots of Ze(peak) versus Ze(rain) and of Ze(snow) versus Ze(rain) are shown in Figure 7. The fine linear relationships between these parameters for the three sites are consistent with the general BB assumption that aggregation and breakup can be ignored in the BB model. That is, one snow particle converts to one raindrop [8,27,28]. Based on these results, a BB parameterization can be proposed, as follows:
At LD,
Ze(peak) = 6.141 + 0.9033 Ze(rain)
Ze(snow) = + 0.5011 + 0.7407 Ze(rain)
At LPS,
Ze(peak) = 4.353 + 0.9709 Ze(rain)
Ze(snow) = −1.544 + 0.8426 Ze(rain)
And at DW,
Ze(peak) = 4.731 + 0.9622 Ze(rain)
Ze(snow) = −3.637 + 0.9235 Ze(rain)
These two parameters of Ze(peak) versus Ze(rain) and Ze(snow) versus Ze(rain) show some nontrivial dependence with the intensity of precipitation, and for stratiform precipitation with a BB, small peak-to-rain and snow-to-rain reflectivity differences are expected with high-density solid hydrometeors [8]. The slope for Ze(rain)/Ze(snow), and especially for Ze(rain)/Ze(peak), was larger at the ridge and east valley sites than at the west valley site (Figure 7), and the peak-to-rain reflectivity difference was smaller at the ridge site (LPS, 4.731 dBZ) and east valley site (DW, 4.353 dBZ) than at the west valley site (LD, 6.141 dBZ). This is because precipitation growth by deposition still continues in the melting layer, and the magnitude of growth is assumed to be roughly equal above and below the melting layer [10], and the key parameter resulting in this difference was that the precipitable water vapor was relatively abundant at the ridge and east valley sites, inferring that the degree of deposition in the melting layer at these sites was greater than at the west valley site.
Compared with Equation (2), BBsh shows an obvious linear relationship with Ze(peak)/Ze(rain) or Ze(peak)/Ze(snow) at both sites (Figure 8). The BBth and BBsh of a BB would be highly dependent on the melting rate and fall velocity, and those two factors contribute about 80% of the reflectivity change in the bright band [8]. As seen from the mode of BBsh listed in Table 1, LPS (2.65 dB) and DW (2.66 dB) are slightly smaller than LD (2.79 dB) per kilometer, indicating that the solid hydrometeor at LPS and DW are denser in BB which takes more time to melt, as BBth are slightly thicker at LPS and DW than at LD. However, as these denser particles at the ridge and east valley sites begin to melt, their shape and density do not change significantly; therefore, there is not a large increase in reflectivity [28]. Furthermore, the slope for Ze(peak)/Ze(snow) is larger than that for Ze(peak)/Ze(rain) at three sites, due to the density variation of snow particles as opposed to the constancy of the raindrop density [8]. The key point is that the data for Ze(peak)/Ze(snow) are scattered across a wider range at DW and LPS than at LD, the ranges being 16.95 dB and 16.18 dB at DW and LPS, respectively, but only 13.31 dB at LD. The range of data points for Ze(peak)/Ze(snow) at DW was a little larger than that at LPS. A wider range of Ze(peak)/Ze(snow) values at the valley sites suggest a larger variation in snow density [9]. The Ze(peak)/Ze(snow) was larger when the snow particle density was smaller. The slope of Ze(peak) / Ze(snow) at DW (1.298) was slightly smaller than that at LPS (1.373) and LD (1.371). In addition, the Ze(peak)/Ze(snow) was relatively small at DW, which indicates a greater degree of riming and, hence, an increasing snow density.

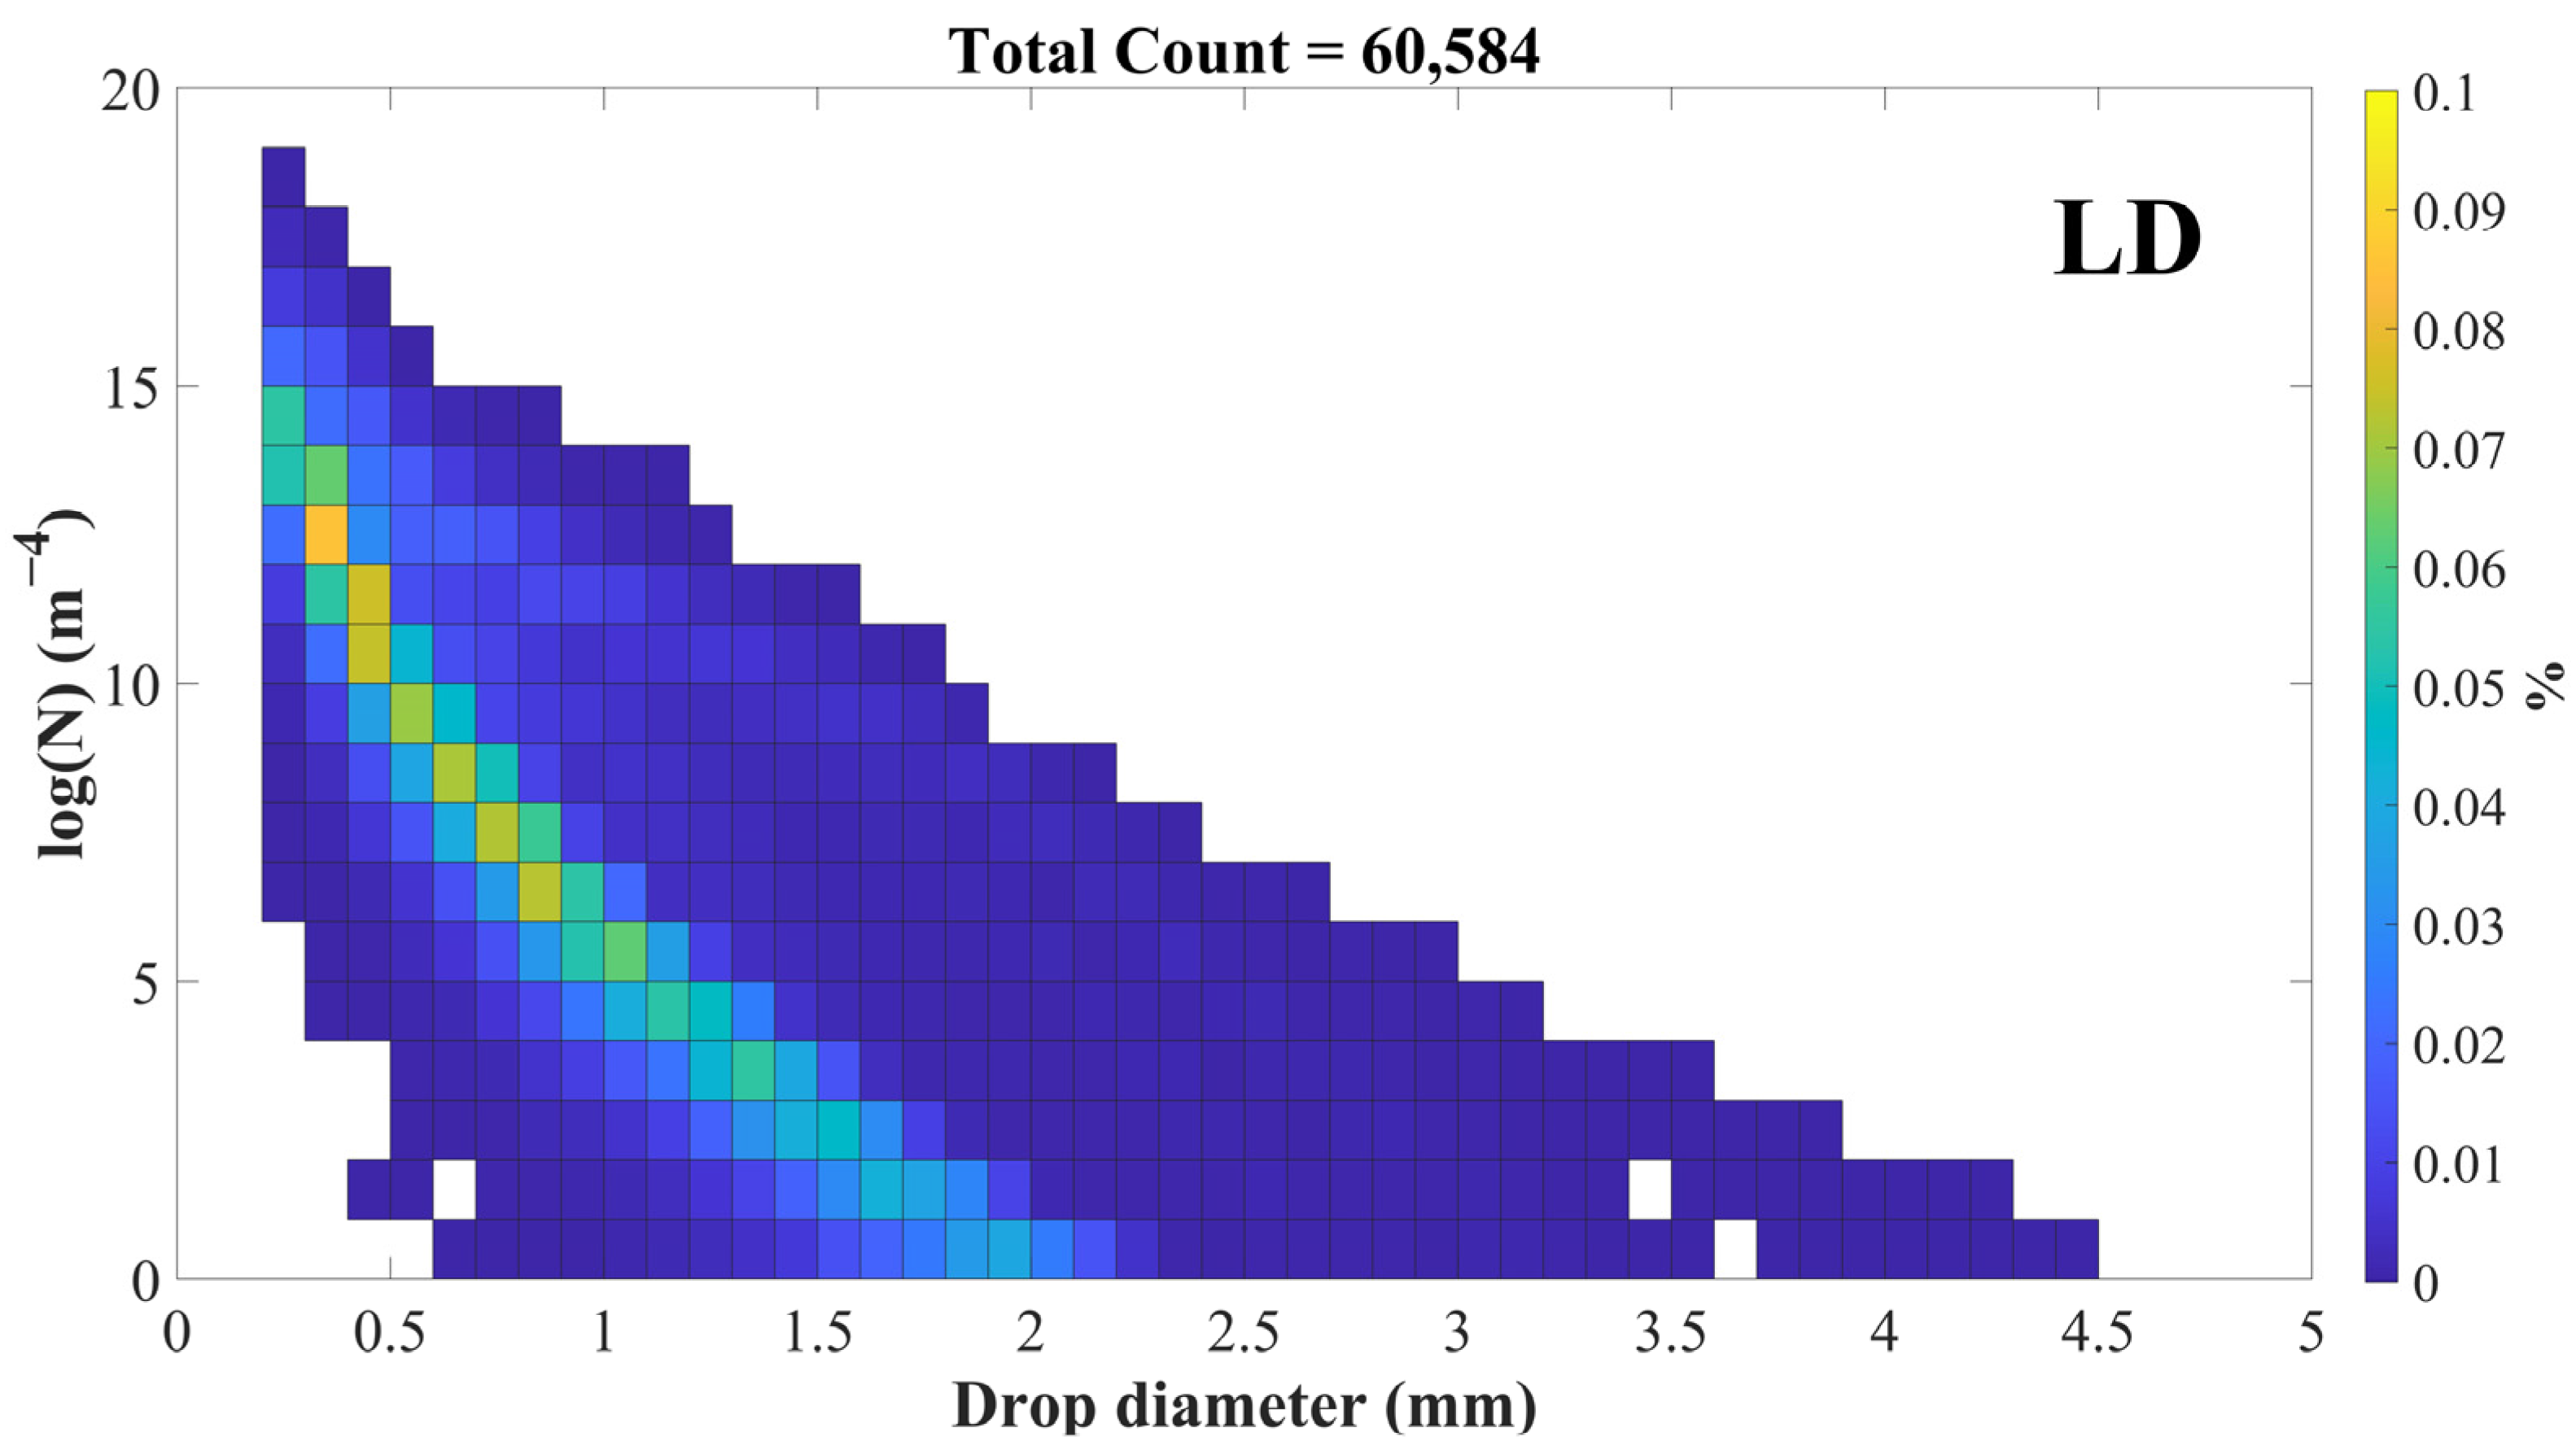
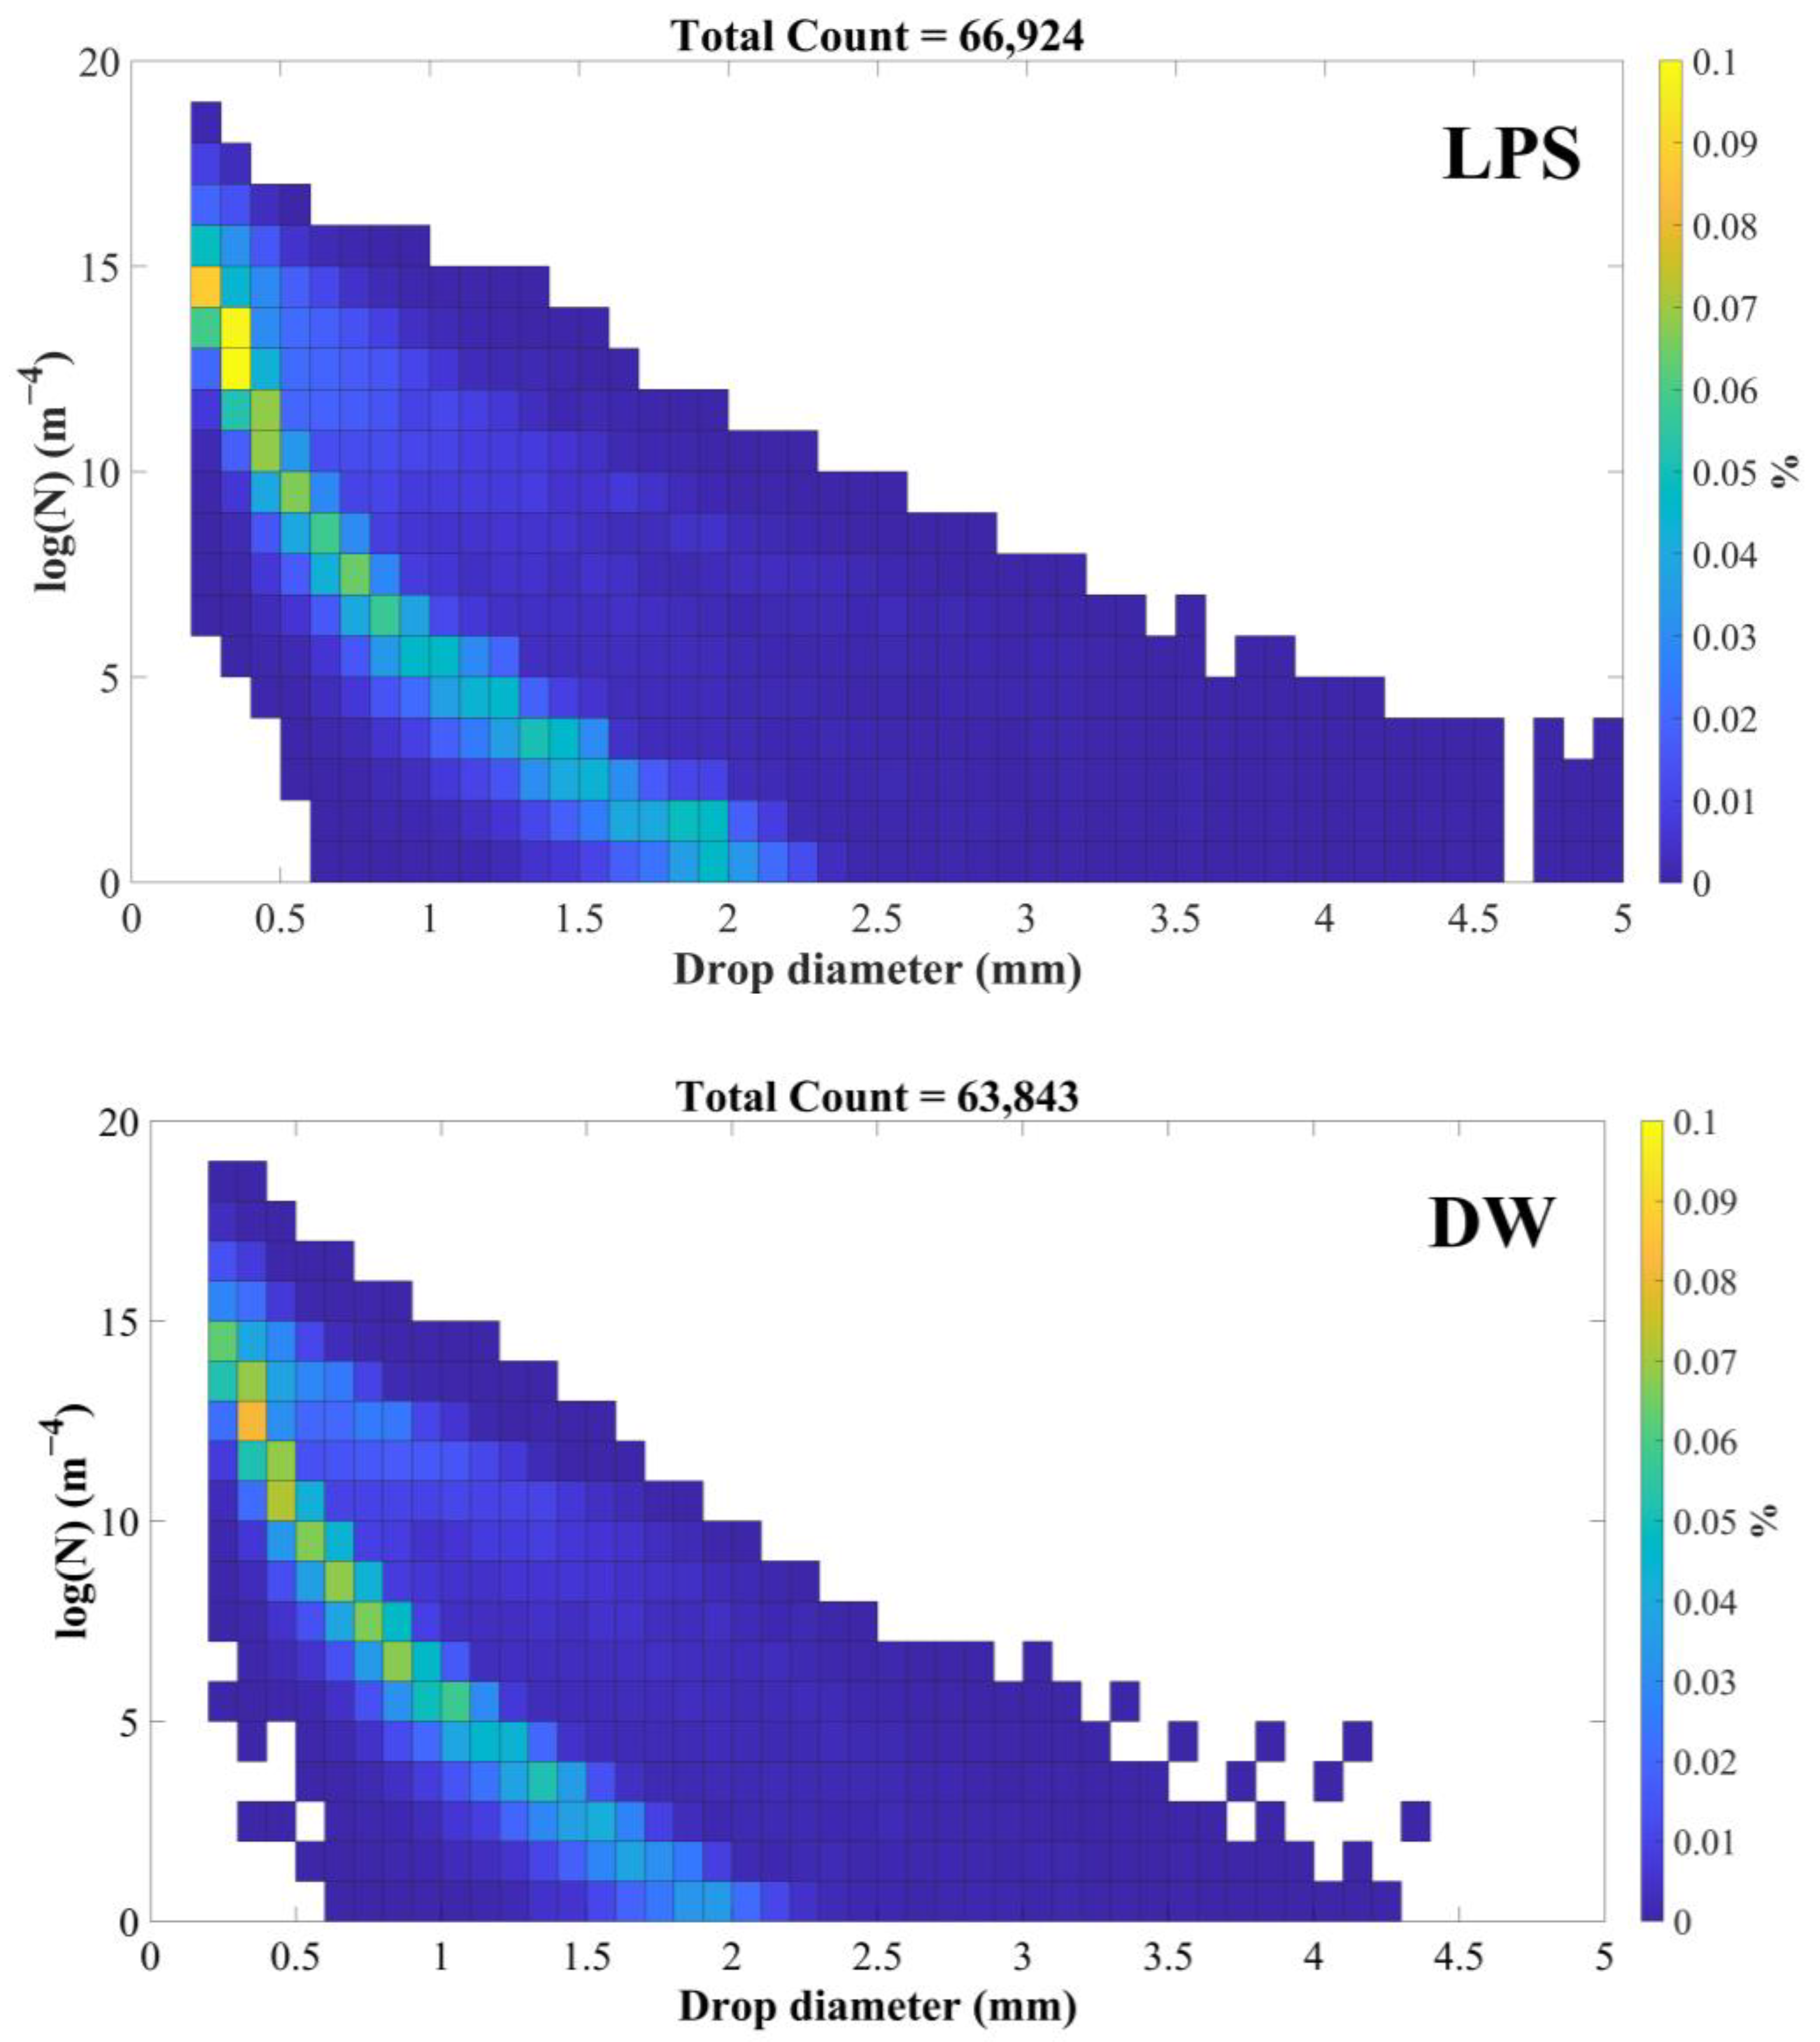
4.5. RSD below the BB Comparisons

As a basic microphysical feature of rain, the RSD is a common but key parameter for describing a precipitation event. Compared with ground measurements along a mountain slope and airborne measurements, observations of vertical microphysical variables using VPRs (i.e., MRR) are more temporally and spatially consistent. Therefore, radar remote sensing has become an important platform for studying the vertical structure of RSD [29,30,31]. Accordingly, the probability density functions of the log (N) of the RSD below the BB from the stratiform events below the BB at the three MRR sites in the Liupan Mountains area were investigated. Figure 9 indicates that stratiform precipitation consisted of higher droplet concentrations with a spectral bias towards smaller drops. For stratiform rainfall, the value of the rainfall diameter below 2.5 mm was dominant. The maximum value of log (N) could reach 19 (Figure 9). Compared with the two valley sites, the rainfall diameter above 4.5 mm at the ridge site showed relatively larger droplet sizes and log (N) values, which could reach up to 5.0 mm and 5, respectively.

5. Summary and Conclusions

Data from a long-term (one-year period during 2021) set of measurements by MRRs of stratiform precipitation events with the same duration at a west valley site, ridge site, and east valley site in the Liupan Mountains area, which is adjacent to the Qinghai-Tibet Plateau, in west China, were analyzed to explore the extent to which orographic effects influence the precipitation of weather systems. Focus was given to the stratiform precipitation patterns that usually show a distinct BB feature. To avert the complicated situation of the surface being colder than 0°C, as obtained by the microwave Humidity and Temperature Profiler at the west valley site, only the data from warmer months (May–September) were selected for analysis. The main findings can be summarized as follows:
  • The main weather systems causing precipitation in the Liupan Mountains area include 500 hPa westerly troughs and 700 hPa shear or low vortices, of which 500 hPa trough and 700 hPa shear systems account for 72% of all precipitation events, and 500 hPa trough and 700 hPa low vortex systems account for 17.1%. The movement of precipitating clouds in the Liupan Mountains area is mainly from southwest to northeast, accounting for 51.8% of the total, followed by northwest to southeast, accounting for 23.6%.
  • Compared to the rainfall characteristics of two valley sites LD and DW, although the ridge site LPS has a lower percentage of stratiform rainfall, it has a larger percentage of convective and shallow rainfall as well as a larger proportion of the precipitation contribution and average precipitation intensity. The percentages of stratiform and convective precipitation were as large at LD as at DW, but the proportion of the precipitation amount and the average precipitation intensity at DW were slightly larger than those at LD.
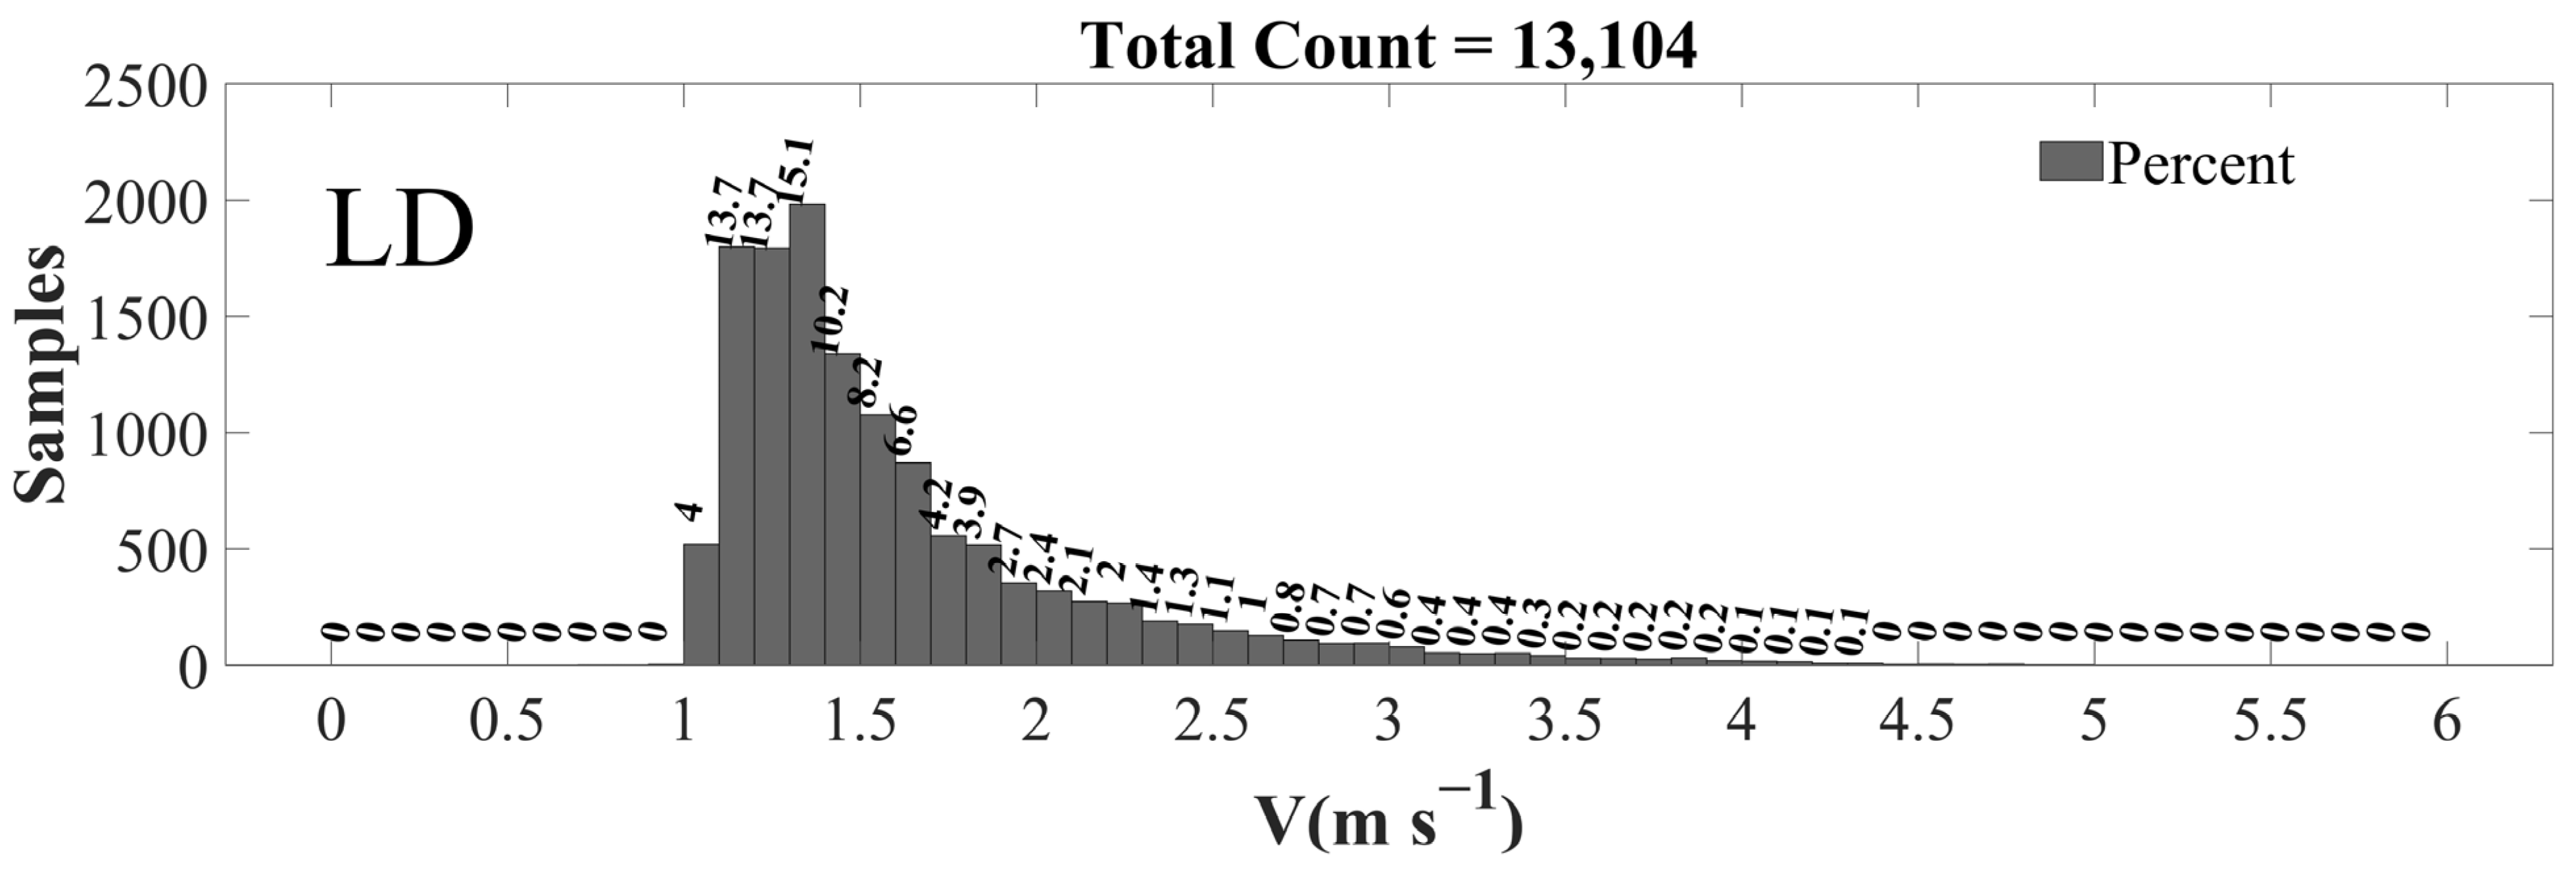
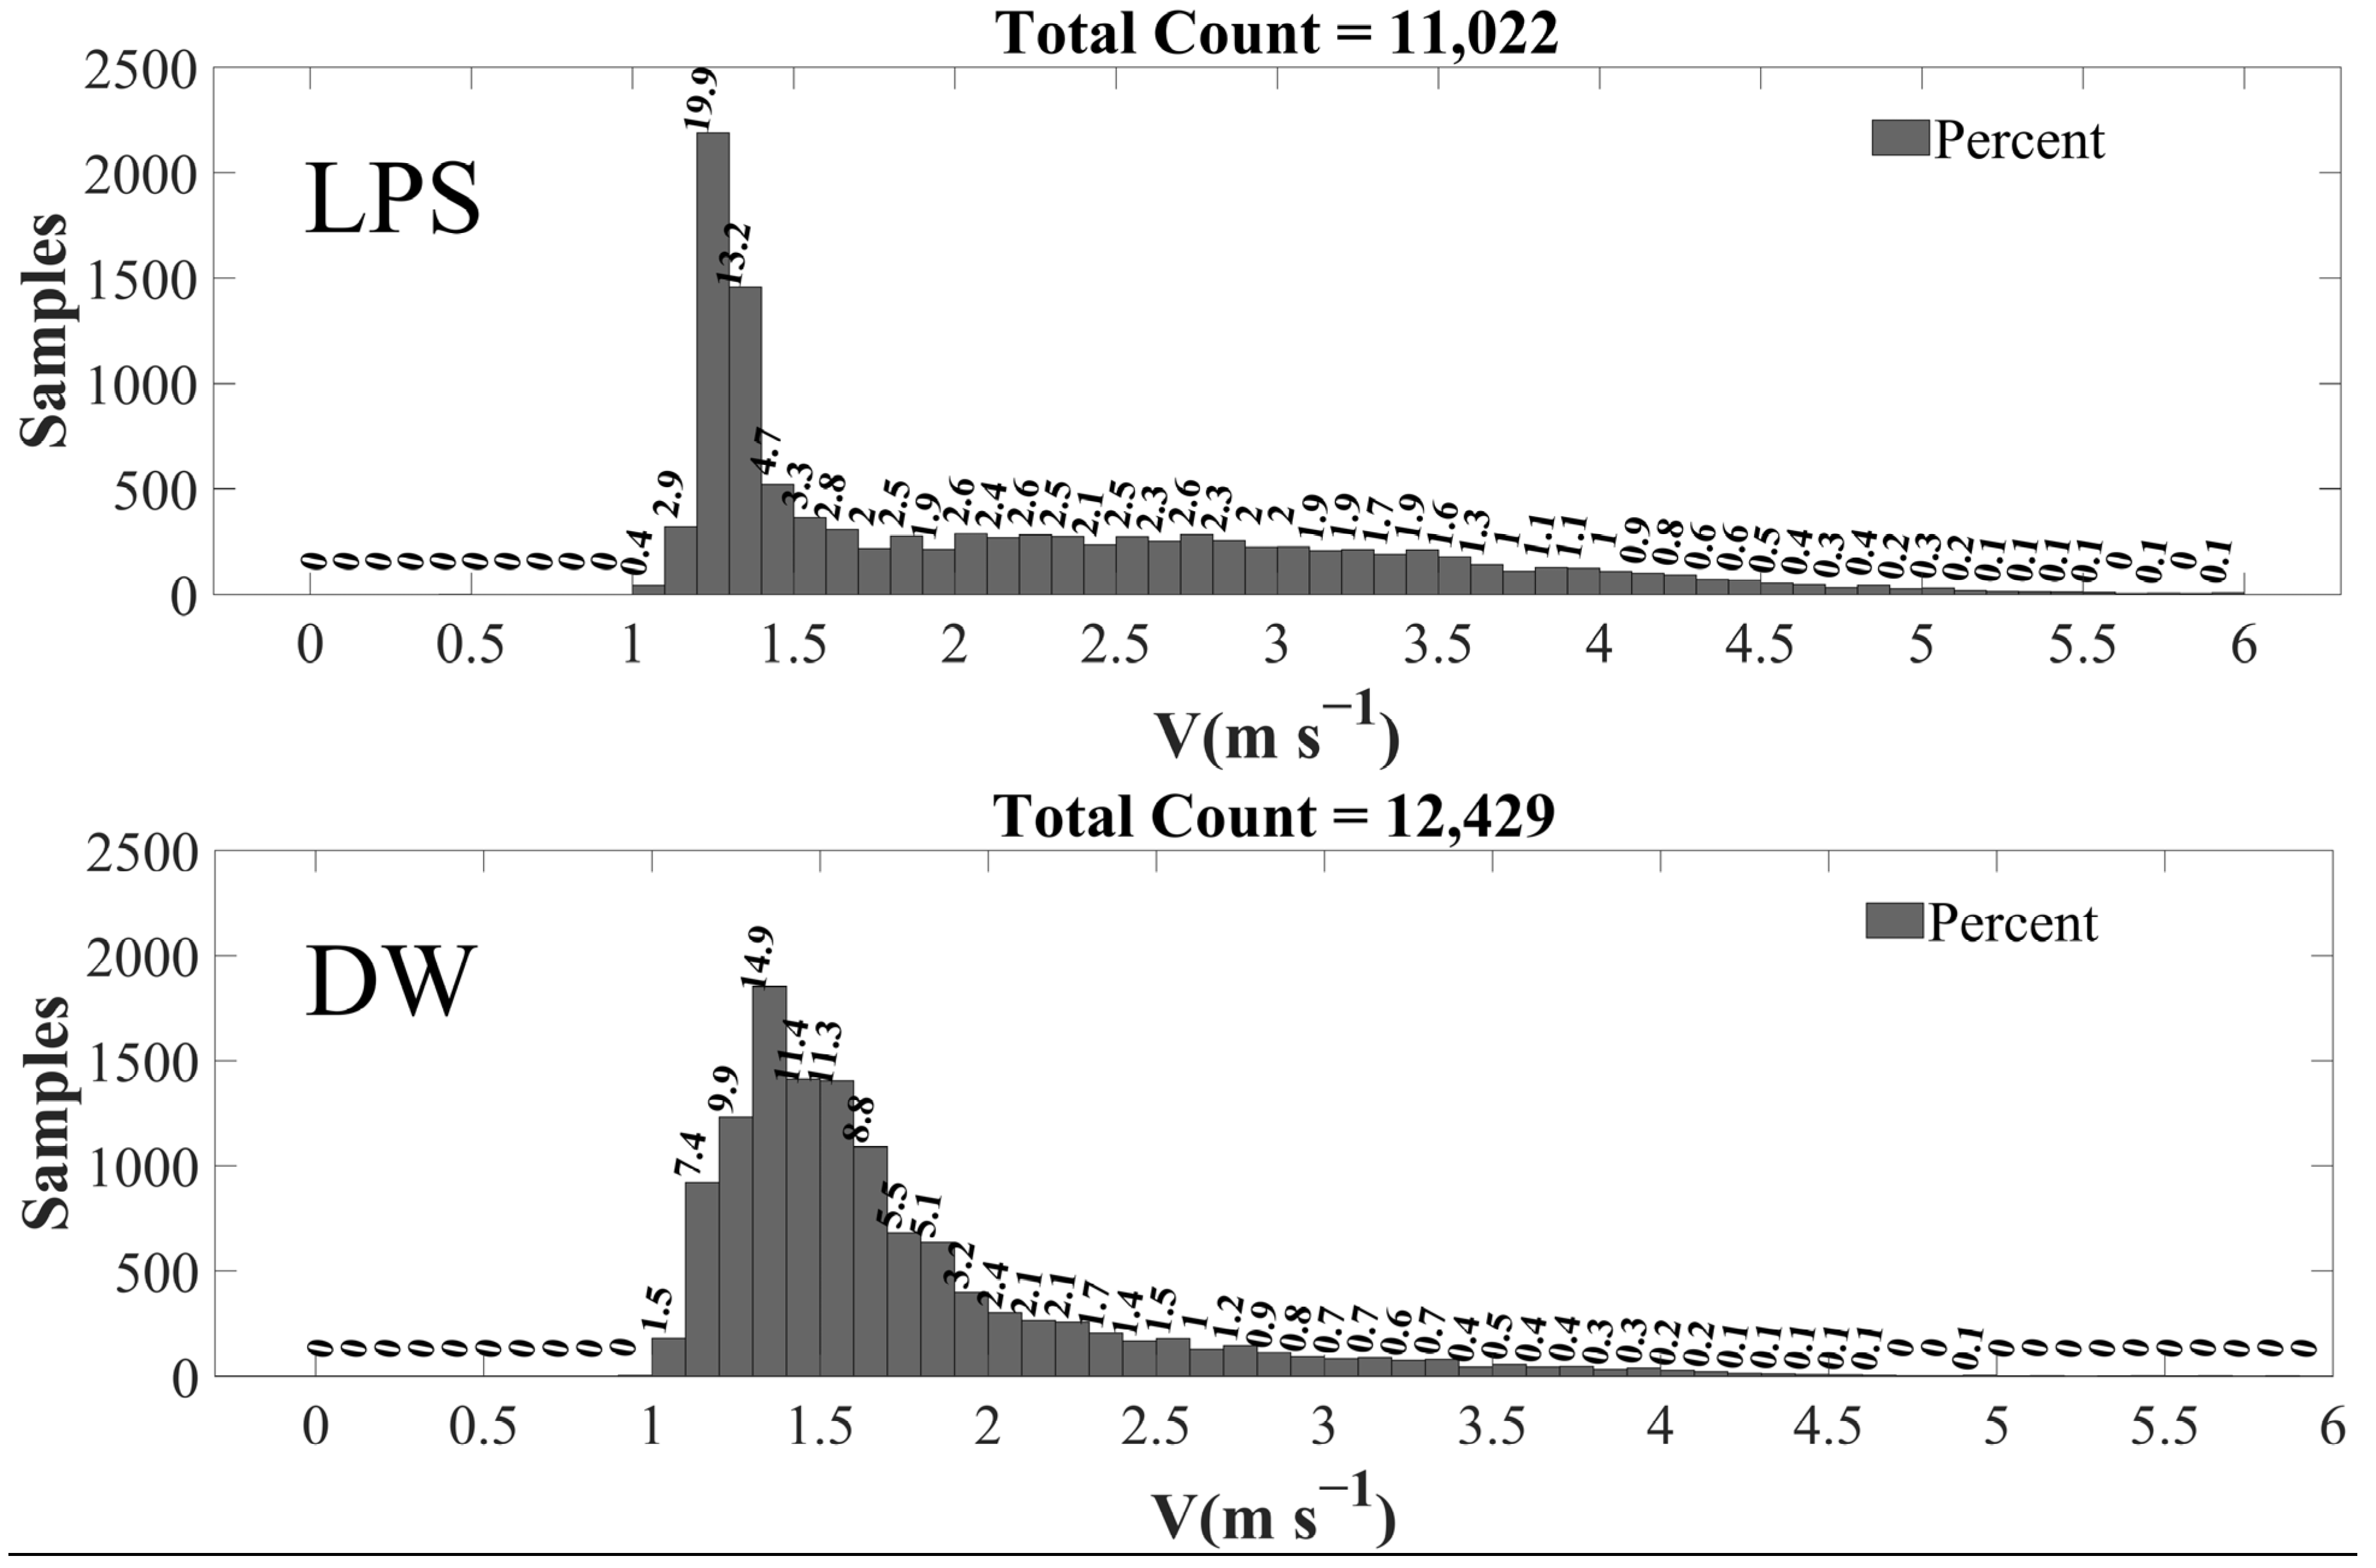
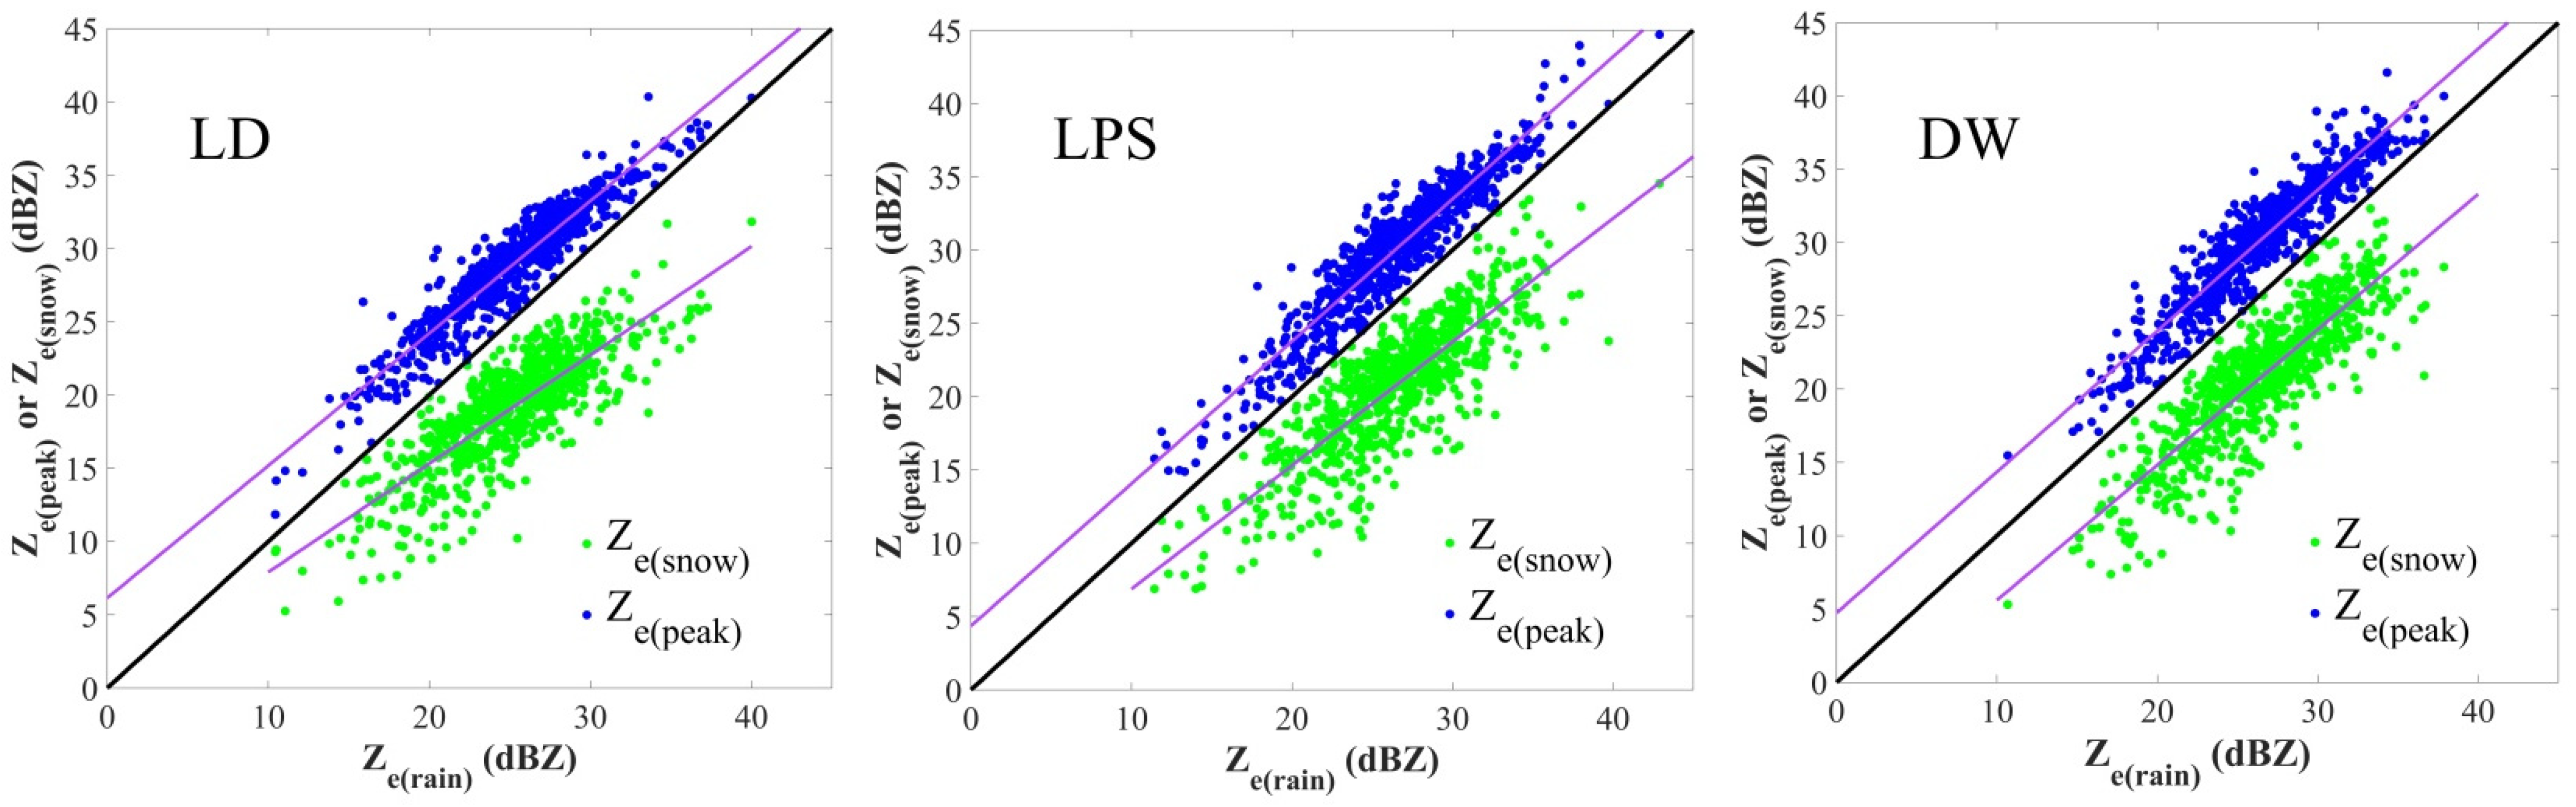
  • At sub-0 °C, the average MRR-2 Ze at LD, LPS, and DW was 18.96 dBZ, 20.68 dBZ, and 20.86 dBZ, respectively. These circumstances were similar to those inside the melting layer, where the Ze(peak) at the west valley site was 29.8 dBZ, whilst it was 32.4 dBZ and 31.95 dBZ at the ridge east valley sites, respectively. This is because the cooling of saturated air and the resulting condensation by melting snow caused a rise in hydrometeor mass of 6% and, hence, an increase in reflectivity. On the other hand, the Vsnow and Vpeak at all three sites were about 1.68 m s−1 and 5.60 m s−1, but the Vrain at the ridge site (7.15 m s−1) was approximately 19% greater than at the two valley sites. A possible reason might be the deposition and aggregation efficiency and the degree of riming at the ridge and east valley sites were greater than at the west valley site.
  • The solid hydrometeors above the sub-0 °C height were mainly snow particles and graupel, and the diameter and density of snow particles and graupel at the ridge and east valley sites were slightly larger than those at the west valley site; plus, there was also a higher occurrence frequency of larger graupel at the ridge site. The key factor causing these differences at the ridge site was the forced uplifting of cloudy air over the mountain area around the ridge site, which might have resulted in a topographic supercooling effect that led to enhanced riming of supercooled liquid water, implying the precipitation often comes from rather more “compact ice”.
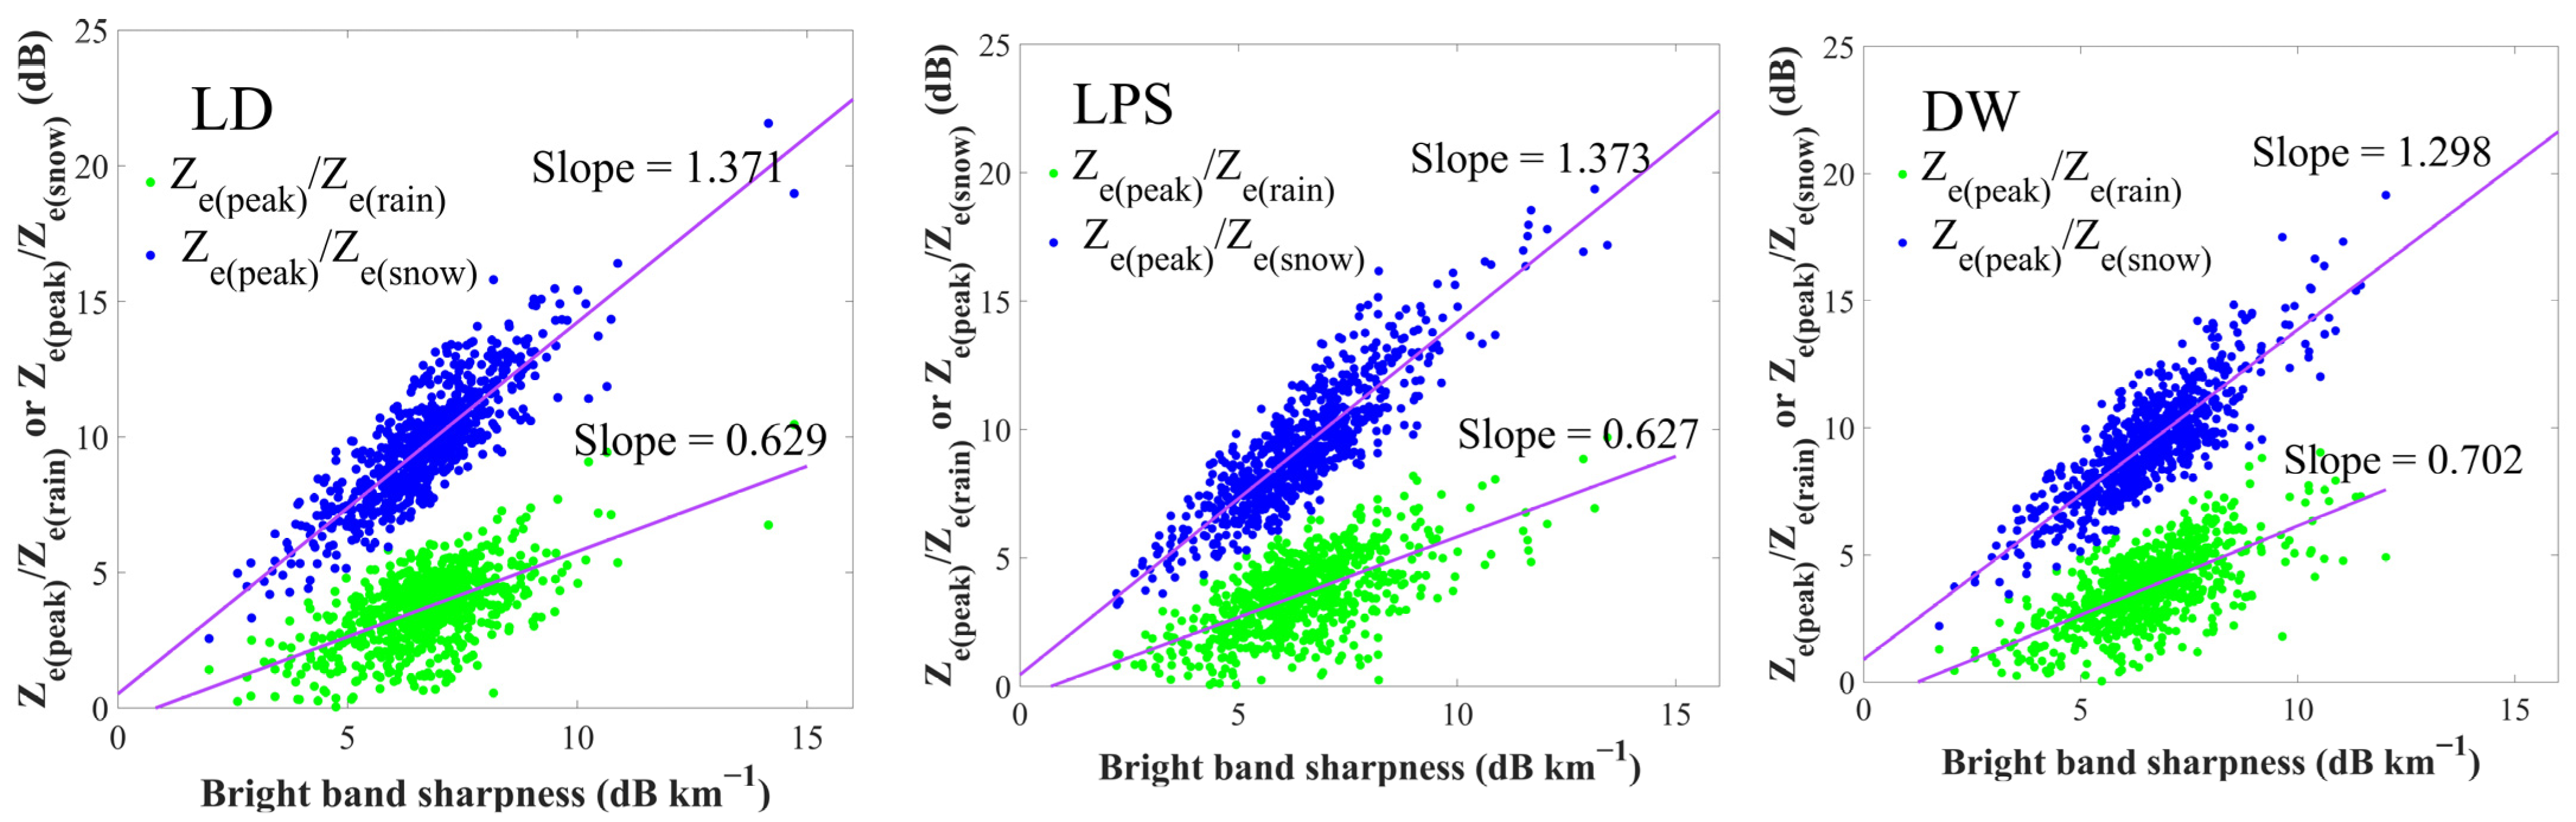
  • As a whole, the BB was thicker and the sharpness slightly weaker at the ridge site compared to those at the valley sites. The peak reflectivity itself was stronger at the ridge and east valley sites than at the west valley site. Specifically, the variability of these values was obviously larger at the valley sites than at the ridge site. The key factor causing these differences is supposed to be the discrepancies in snow particle densities at the three sites, which are related to, among others, the degree of riming [28]. Based on these results, it was found that the precipitable water vapor is relatively abundant at the ridge and east valley sites. Therefore, the cloud microphysical processes at the west valley site varied significantly from unrimed snow growth, which produced lower density and dimension solid particles, on the contrary, snow particle growth at the ridge and east valley sites tended to be affected by the riming process and the high-density snow particles. Another key factor is that the forced uplifting of cloudy air over the mountain area around the ridge site may play a part in the topographic supercooling that leads to enhanced riming of supercooled liquid water.
  • For stratiform precipitation, the values of rainfall diameter below 2.5 mm were dominant, while the maximum value of log (N) reached 19. Compared with the two valley sites, the rainfall diameter was above 4.5 mm at the ridge site and showed relatively larger droplet sizes and log (N) values, which could reach 5.0 mm and 5, respectively.
This study demonstrates the potential of MRR in revealing many macro and microphysical features of stratiform precipitation. The relevance of the BB top height retrieved by MRR and the freezing height retrieved from the microwave Humidity and Temperature Profiler was fine, which indicates that the MRR is able to offer a credible and continuous estimate of the melting layer. The results can be applied to weather modification, where continuous monitoring of the vertical structures of the thermodynamic and cloud microphysical properties is crucial to determine the proper seeding location and time. Riming could have taken place at the same time as intense aggregation if the supercooled liquid water is within the 0 °C to −6 °C [8,28]. The results in this paper indicate the existence of supercooled liquid water in the Liupan mountains area within the 0 °C to −6 °C isotherm layer during Stratiform precipitation, so the proper cloud seeding location of silver iodide should be at a corresponding height range of approximately 5100 to 6100 m in the area. On the other hand, the maximum frequency of occurrence of the daily melting layer in summer and autumn is between 11:00–13:00 Beijing time (not shown in this paper), and, therefore, it is recommended that the cloud seeding should be carried out in the period mentioned above in the area.
However, there are still many unsolved problems in understanding the cloud microphysical features of the MRR raw spectra, which both require more in-depth research. The detection ability of MRR is limited when the rain intensity is high. Alternatively, Garcia-Benadi A. et al. (2020) presented a novel MRR processing methodology that includes enhanced spectral processing and Doppler dealiasing, and the radar moments of each range gate can be computed [32].

Author Contributions

Conceptualization, Z.Y. and N.C.; methodology, N.C.; software, N.C.; validation, N.C. and Z.S.; formal analysis, Z.C.; investigation, J.M.; resources, Z.Y. and Z.C.; data curation, T.L.; writing—original draft preparation, N.C. and H.Z.; writing—review and editing, Z.Y.; visualization, J.M.; supervision, Z.Y.; project administration, Z.Y. and N.C.; funding acquisition, Z.Y., N.C. and Z.C. All authors have read and agreed to the published version of the manuscript.

Funding

This research was funded by the National Natural Science Foundation of China (No: 41775139), Key R & D Projects in Ningxia Hui Autonomous Region (No: 2022BEG02010), and Ningxia Natural Science Foundation of China (No: 2022AAC03683).

Institutional Review Board Statement

Not applicable.

Informed Consent Statement

Not applicable.

Data Availability Statement

Due to the confidentiality requirements of special observational data, the original MRR data can be obtained by applying to the Ningxia Meteorological Bureau.

Acknowledgments

The authors would like to thank Jianren Sang from Ningxia Meteorological Bureau for administrative support in this paper. The authors would like to sincerely thank the anonymous reviewers for their valuable comments and suggestions.

Conflicts of Interest

The authors declare no conflict of interest.

References

  1. Houze, R.A., Jr. Orographic effects on precipitating clouds. Rev. Geophys. 2012, 50, RG1001. [Google Scholar] [CrossRef]
  2. Roe, G.H. Orographic precipitation. Annu. Rev. Earth Planet. Sci. 2005, 33, 645–671. [Google Scholar] [CrossRef]
  3. Colle, B.A.; Mass, C.F. High-Resolution Observations and Numerical Simulations of Easterly Gap Flow through the Strait of Juan de Fuca on 9–10 December 1995. Mon. Wea. Rev. 2000, 128, 2398–2422. [Google Scholar] [CrossRef]
  4. Wallace, J.M.; Peter, V. Hobbs. Atmospheric Science: An Introductory Survey. Bull. Am. Meteorol. Soc. 2016, 88, 504. [Google Scholar]
  5. Lundquist, J.D.; Minder, J.R.; Neiman, P.J.; Sukovich, E. Relationships between Barrier Jet Heights, Orographic Precipitation Gradients, and Streamflow in the Northern Sierra Nevada. J. Hydrometeorol. 2010, 11, 1141–1156. [Google Scholar] [CrossRef] [Green Version]
  6. Minder, J.R.; Durran, D.R.; Roe, G.H. Mesoscale Controls on the Mountainside Snow Line. J. Atmos. Sci. 2011, 68, 2107–2127. [Google Scholar] [CrossRef]
  7. Unterstrasser, S.; Zängl, G. Cooling by melting precipitation in Alpine valleys: An idealized numerical modelling study. Q. J. R. Meteorol. Soc. 2006, 132, 1489–1508. [Google Scholar] [CrossRef] [Green Version]
  8. Fabry, F.; Zawadzki, I. Long-term radar observations of the melting layer of precipitation and their interpretation. J. Atmos. Sci. 1995, 52, 838–851. [Google Scholar] [CrossRef]
  9. Cha, J.-W.; Chang, K.-H.; Yum, S.S.; Choi, Y.-J. Comparison of the bright band characteristics measured by Micro Rain Radar (MRR) at a mountain and a coastal site in South Korea. Adv. Atmos. Sci. 2009, 26, 211–221. [Google Scholar] [CrossRef]
  10. Wexler, R. An Evaluation of the Physical Effects in the Melting Layer. In Proceedings of the Fifth Weather Radar Conference, Fort Monmouth, NJ, USA; American Meteor Society: Geneseo, NY, USA, 1955; pp. 329–334. [Google Scholar]
  11. Smith, R.B. 100 Years of Progress on Mountain Meteorology Research. Meteorol. Monogr. 2019, 59. [Google Scholar] [CrossRef]
  12. Fabry, F. Radar Meteorology: Principles and Practice; Cambridge University Press: Cambridge, UK, 2015; pp. 66–68. [Google Scholar]
  13. Deng, P.; Sang, J.; Yang, M.; Mu, J.; Chang, Z.; Cao, N.; Yang, M. Analysis on the Difference Characteristics of Precipitation and Air Water Vapor Conditions on the East and West Slopes of Liupan Mountain in Recent 30 Years. Meteorol. Sci. Technol. 2021, 21, 77–85. (In Chinese) [Google Scholar]
  14. Peters, G.; Fischer, B.; Andersson, T. Rain observations with a vertically looking Micro Rain Radar (MRR). Boreal Environ. Res. 2002, 7, 353–362. [Google Scholar]
  15. Houze, R.A., Jr. Stratiform precipitation in regions of convection: A meteorological paradox? Bull. Am. Meteor. Soc. 1997, 78, 2179–2196. [Google Scholar] [CrossRef]
  16. Peters, G.; Fischer, B. Profiles of raindrop size distribution as retrieved by Micro rain Radars. Appl. Meteor. 2005, 44, 1930–1949. [Google Scholar] [CrossRef]
  17. Klaassen, W. Radar observations and simulations of the melting layer of precipitation. Atmos. Sci. 1988, 45, 3741–3753. [Google Scholar] [CrossRef]
  18. Wen, L.; Zhao, K.; Zhang, G.; Xue, M.; Zhou, B.; Liu, S.; Chen, X. Statistical characteristics of raindrop size distributions observed in East China during the Asian summer monsoon season using 2-D video disdrometer and Micro Rain Radar data. J. Geophys. Res. Atmos. 2016, 121, 2265–2282. [Google Scholar] [CrossRef] [Green Version]
  19. Tsai, C.-L.; Yu, C.-K. Inter comparison analysis for micro rain radar observations. Atmos. Sci. 2012, 40, 109–134. (In Chinese) [Google Scholar]
  20. Yuter, S.E.; Houze, R.A., Jr. Three-dimensional kinematic and microphysical evolution of Florida cumulonimbus. Part II: Frequency distributions of vertical velocity, reflectivity, and differential reflectivity. Mon. Weather Rev. 1995, 123, 1941–1963. [Google Scholar] [CrossRef]
  21. White, A.B.; Gottas, D.J.; Strem, E.T.; Ralph, F.M.; Neiman, P.J. An automated bright band height detection algorithm for use with Doppler radar spectral moments. J. Atmos. Ocean. Technol. 2002, 19, 687–697. [Google Scholar] [CrossRef]
  22. White, A.B.; Neiman, P.J.; Ralph, F.M.; Kingsmill, D.E.; Persson, P.G. Coastal orographic rainfall processes observed by radar during the California land-falling jets experiment. J. Hydrometeorol. 2003, 4, 264–282. [Google Scholar] [CrossRef]
  23. Strauch, R.G. Theory and Application of the FM-CW Doppler Radar. Ph.D. Dissertation, Electrical Engineering, University of Colorado, Denver, CO, USA, 1976; p. 97. [Google Scholar]
  24. Kneifel, S.; Maahn, M.; Peters, G.; Simmer, C. Observation of snowfall with a low-power FM-CW K-band radar (Micro Rain Radar). Meteorol. Atmos. Phys. 2011, 113, 75–87. [Google Scholar] [CrossRef] [Green Version]
  25. Maahn, M.; Kollias, P. Improved Micro Rain Radar snow measurements using Doppler spectra post-processing. Atmos. Meas. Tech. 2012, 5, 2661–2673. [Google Scholar] [CrossRef] [Green Version]
  26. Thurai, M.; Hanado, H. Melting layer model evaluation using fall velocity. IEE Proc. Microw. Antennas Propag. 2004, 151, 465–472. [Google Scholar] [CrossRef]
  27. Nakaya, U.; Terada, T., Jr. Simultaneous observations of the mass, falling velocity and form of individual snow crystals. J. Fac. Sci. Hokkaido Imp. Univ. Ser. 2 Phys. 1935, 1, 191–200. [Google Scholar]
  28. Zawadzki, I.; Szyrmer, W.; Bell, C.; Fabry, F. Modeling of the melting layer. Part III: The density effect. J. Atmos. Sci. 2005, 62, 3705–3723. [Google Scholar] [CrossRef]
  29. Chen, Y.; An, J.; Liu, H.; Duan, J. An observational study on vertical raindrop size distributions during stratiform rain in a semiarid plateau climate zone. Atmos. Ocean. Sci. Lett. 2016, 9, 178–184. [Google Scholar] [CrossRef] [Green Version]
  30. Chen, Y.; Duan, J.; An, J.; Liu, H. Raindrop Size Distribution Characteristics for Tropical Cyclones and Meiyu-Baiu Fronts Impacting Tokyo, Japan. Atmosphere 2019, 10, 391. [Google Scholar] [CrossRef] [Green Version]
  31. Wang, H.; Wang, W.; Wang, J.; Gong, D.; Zhang, D.; Zhang, L.; Zhang, Q. Rainfall microphysical properties of landfalling Typhoon Yagi (201814) based on the observations of micro rain radar and cloud radar in Shandong, China. Adv. Atmos. Sci. 2021, 38, 994–1011. [Google Scholar] [CrossRef]
  32. Garcia-Benadi, A.; Bech, J.; Gonzalez, S.; Udina, M.; Codina, B.; Georgis, J.-F. Precipitation Type Classification of Micro Rain Radar Data Using an Improved Doppler Spectral Processing Methodology. Remote Sens. 2020, 12, 4113. [Google Scholar] [CrossRef]
Figure 1. Topography of the Liupan Mountains and the study area (denoted by the black dashed frame).
Water 15 00134 g001
Figure 2. (a) Detailed map of the Liupan Mountains and study sites. The MRR locations (red squares) are LD, LPS, and DW, and the black line is the cross-section between them. (b) Profile of the digital elevation data along the cross-section.
Water 15 00134 g002
Figure 3. Schematic illustration of all types of parameters derived from the MRR reflectivity observation data. (BBt and BBb are the top and bottom of the BB, BBth is the thickness of BB, Ze(peak) is the peak reflectivity in BB, Hpeak is the height of peak reflectivity in BB, Rpeak is the relative position of the Hpeak in BB, Ze(snow) is defined as the reflectivity 150 m above the BBt, the reflectivity of rain Ze(rain) is measured 150 m below the bottom height BBb.).
Water 15 00134 g003
Figure 4. Vertical reflectivity profiles (Ze greater than 15 dBZ) of stratiform precipitation at the three MRR-2 sites. Contours represent the frequency of occurrence relative to the maximum absolute frequency in the site’s data sample represented in the CFAD, contoured every 10% with the minimum contour level at 5%. The ordinate of the CFAD is altitude (150 m bins) and the abscissa is reflectivity (dBZ). The black dashed line that goes through each panel represents the mean value of reflectivity. The purple solid line represents the mean level of the 0 °C isotherm derived from the RPG at LD.
Water 15 00134 g004
Figure 5. Vertical profiles of hydrometeors’ fall velocity at the three MRR-2 sites. Color shading represents the frequency of occurrence relative to the maximum absolute frequency in a site’s data sample represented in the CFAD, classified every 5% with the minimum step level at 1%. The ordinate of the CFAD is altitude (150 m bins) and the abscissa is fall velocity (m s−1, 1 m s−1 bins). The black dotted line that goes through each panel represents the mean value of hydrometeors’ fall velocities. The purple line represents the mean level of the 0 °C isotherm derived from the RPG at LD.
Water 15 00134 g005
Figure 6. Histograms of solid hydrometeor fall velocity frequencies between the 0 °C and −4 °C isotherms at LD, LPS, and DW. The frequencies of total samples are labeled at the tops of the bars. The bin size of the fall velocity is 0.1 m s−1.
Water 15 00134 g006aWater 15 00134 g006b
Figure 7. Scatterplots of the rain reflectivity [Ze(rain)] versus the snow reflectivity [Ze(snow)] or peak reflectivity [Ze(peak)] at LD, LPS, and DW. The measurement period is from May to September 2021. The 1:1 line is also shown.
Water 15 00134 g007
Figure 8. As in Figure 7 except for the daily mean BB sharpness (BBsh) versus the ratio of Ze(peak)/Ze(rain) or Ze(peak)/Ze(snow) at LD, LPS, and DW.
Water 15 00134 g008
Figure 9. Probability density functions of the log (N) of the RSD from stratiform rainfall at LD, LPS, and DW below the BB. The abscissa represents the rain droplet diameter. The bins for the log (N) of the RSD and the rain diameter are 0.1 mm and 1 m−4, respectively.
Water 15 00134 g009aWater 15 00134 g009b
Table 1. Modes of BB characteristics—top height (BBt), bottom height (BBb), thickness (BBth), sharpness (BBsh), peak reflectivity [Ze(peak)], and relative peak position (Rpeak)—for the stratiform precipitation reflectivity profiles measured during May to September 2021 at LD, LPS, and DW.
StationBBt *BBb *Ze(snow)Ze(peak)Ze(rain)RpeakBBshBBthVsnowVrainVpeakVsnow/Vrain
LD4628410819.6029.2825.180.532.790520.51.685.925.410.30
LPS4548401821.3532.4130.430.542.645529.81.637.155.590.22
DW4680414223.9631.9525.880.542.662538.41.685.835.650.38
* The heights of BBt and BBb are above MSL.
Disclaimer/Publisher’s Note: The statements, opinions and data contained in all publications are solely those of the individual author(s) and contributor(s) and not of MDPI and/or the editor(s). MDPI and/or the editor(s) disclaim responsibility for any injury to people or property resulting from any ideas, methods, instructions or products referred to in the content.

