
Plankton Community Structure and Biomass in the Eastern Middle Caspian Sea
 ,
,  and
and
Abstract
:1. Introduction
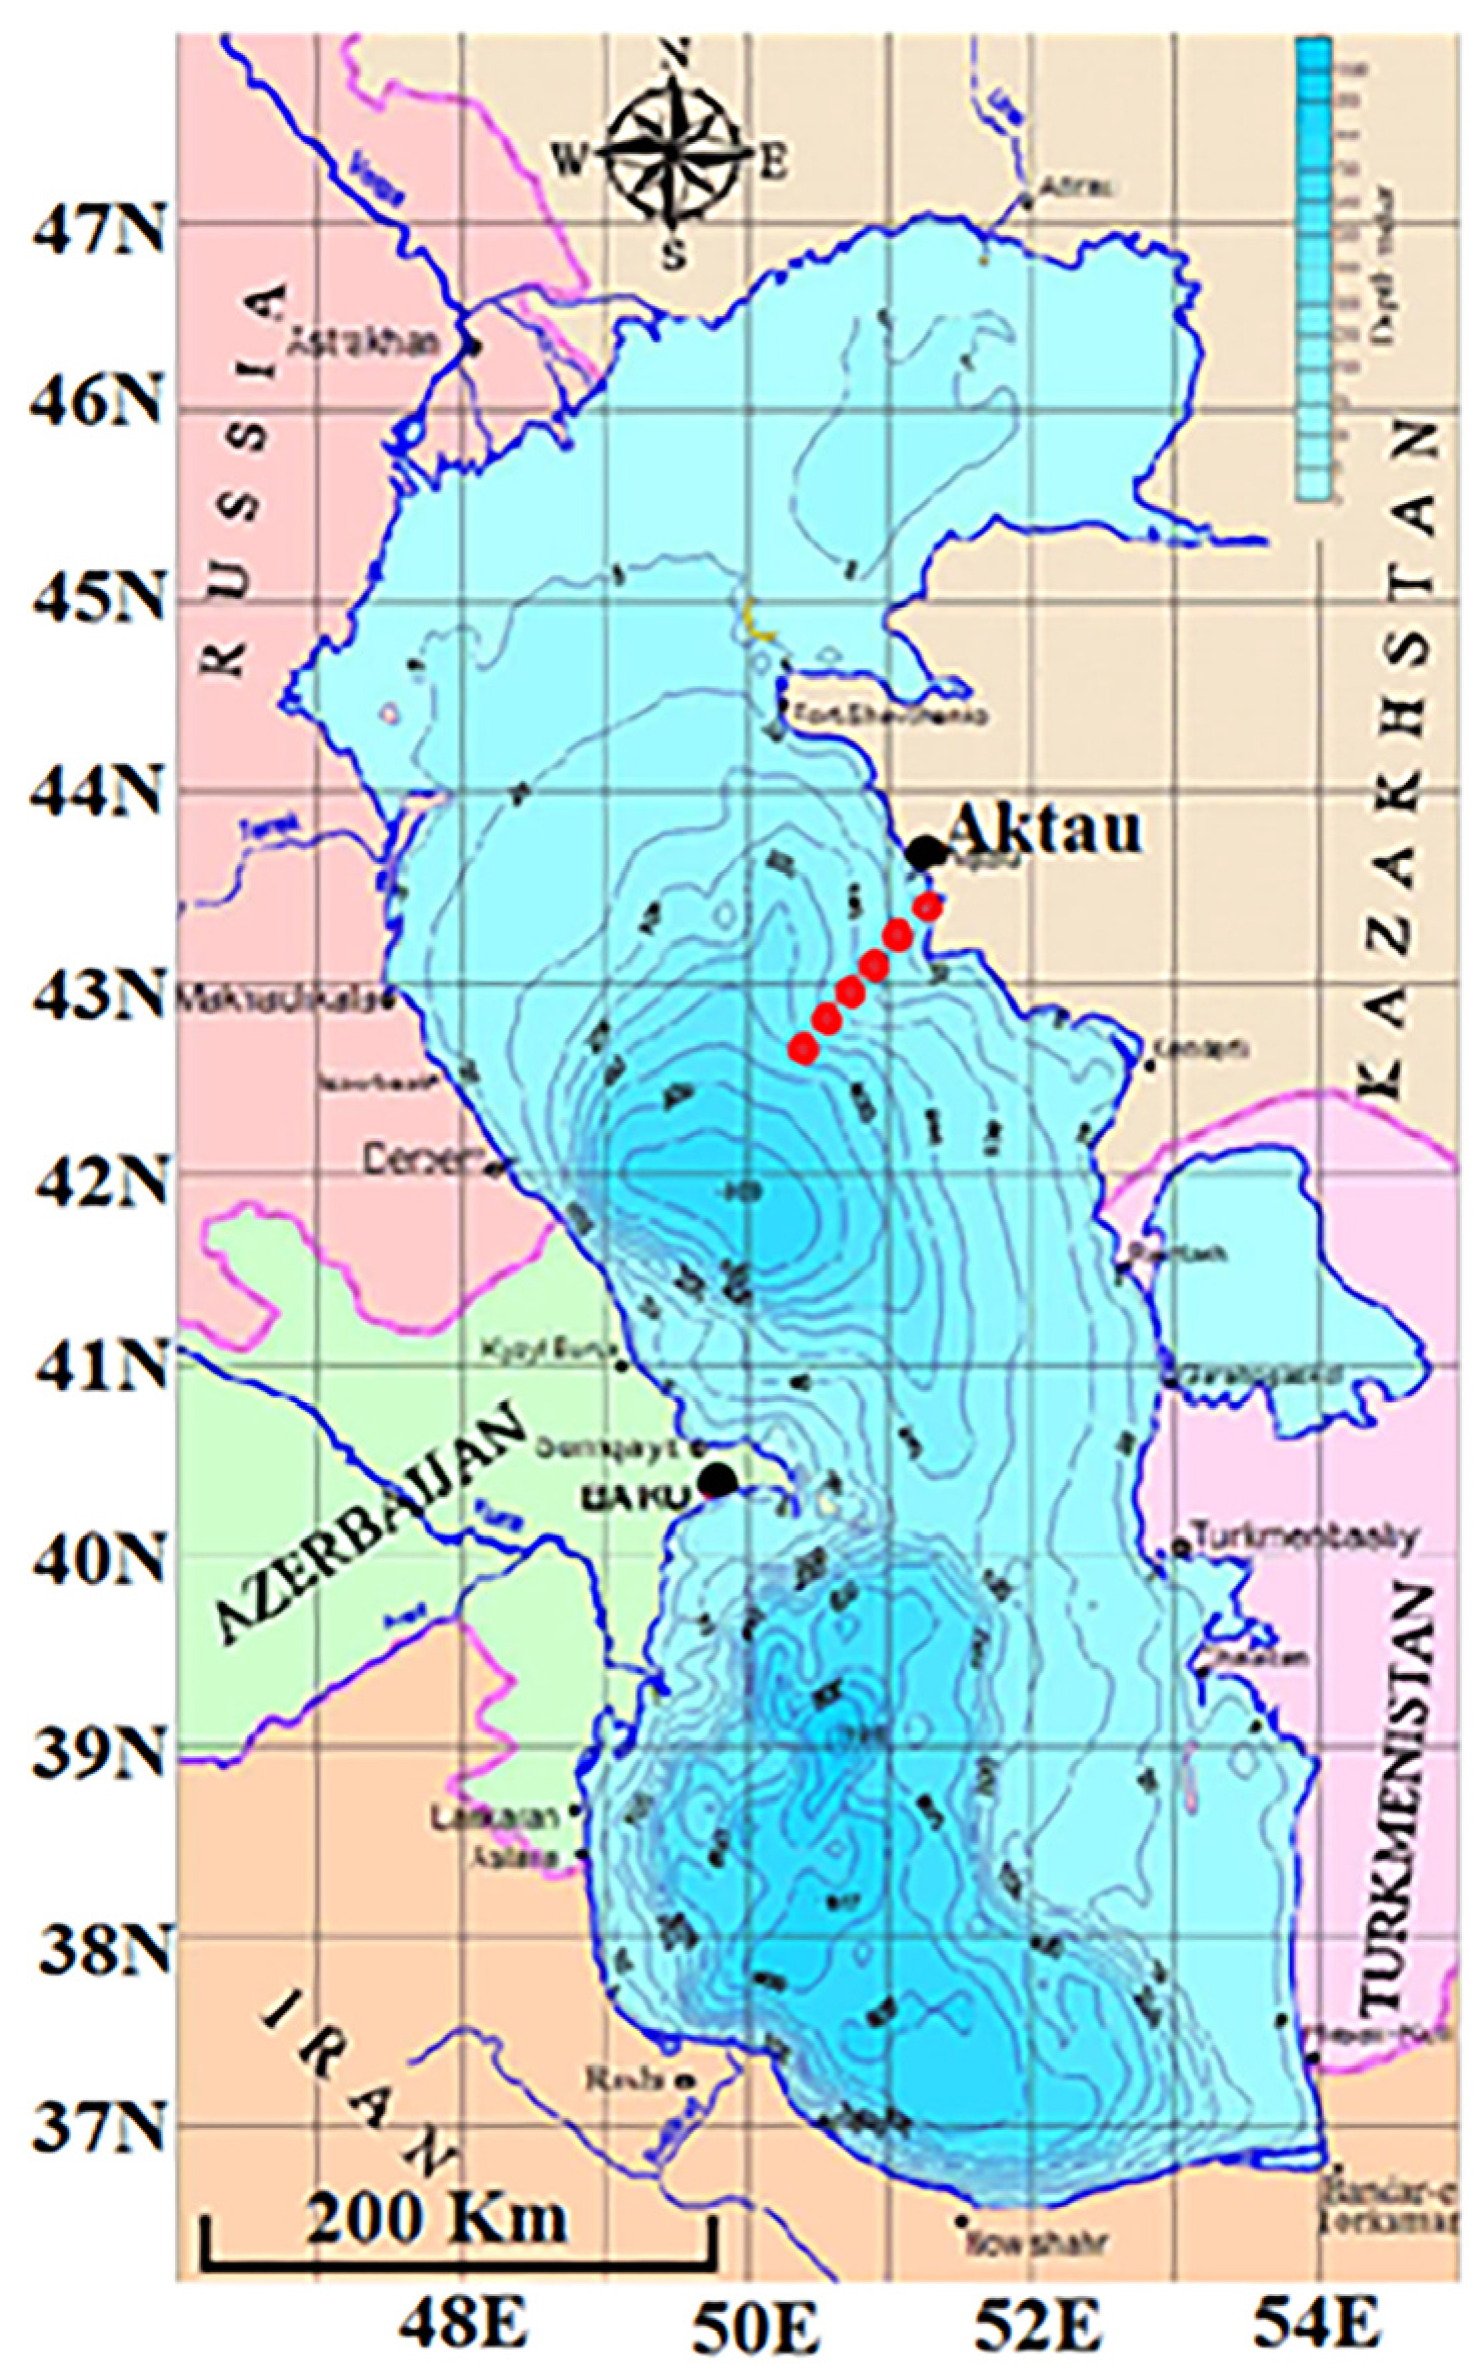
2. Study Area Description
3. Materials and Methods
4. Results
5. Discussion
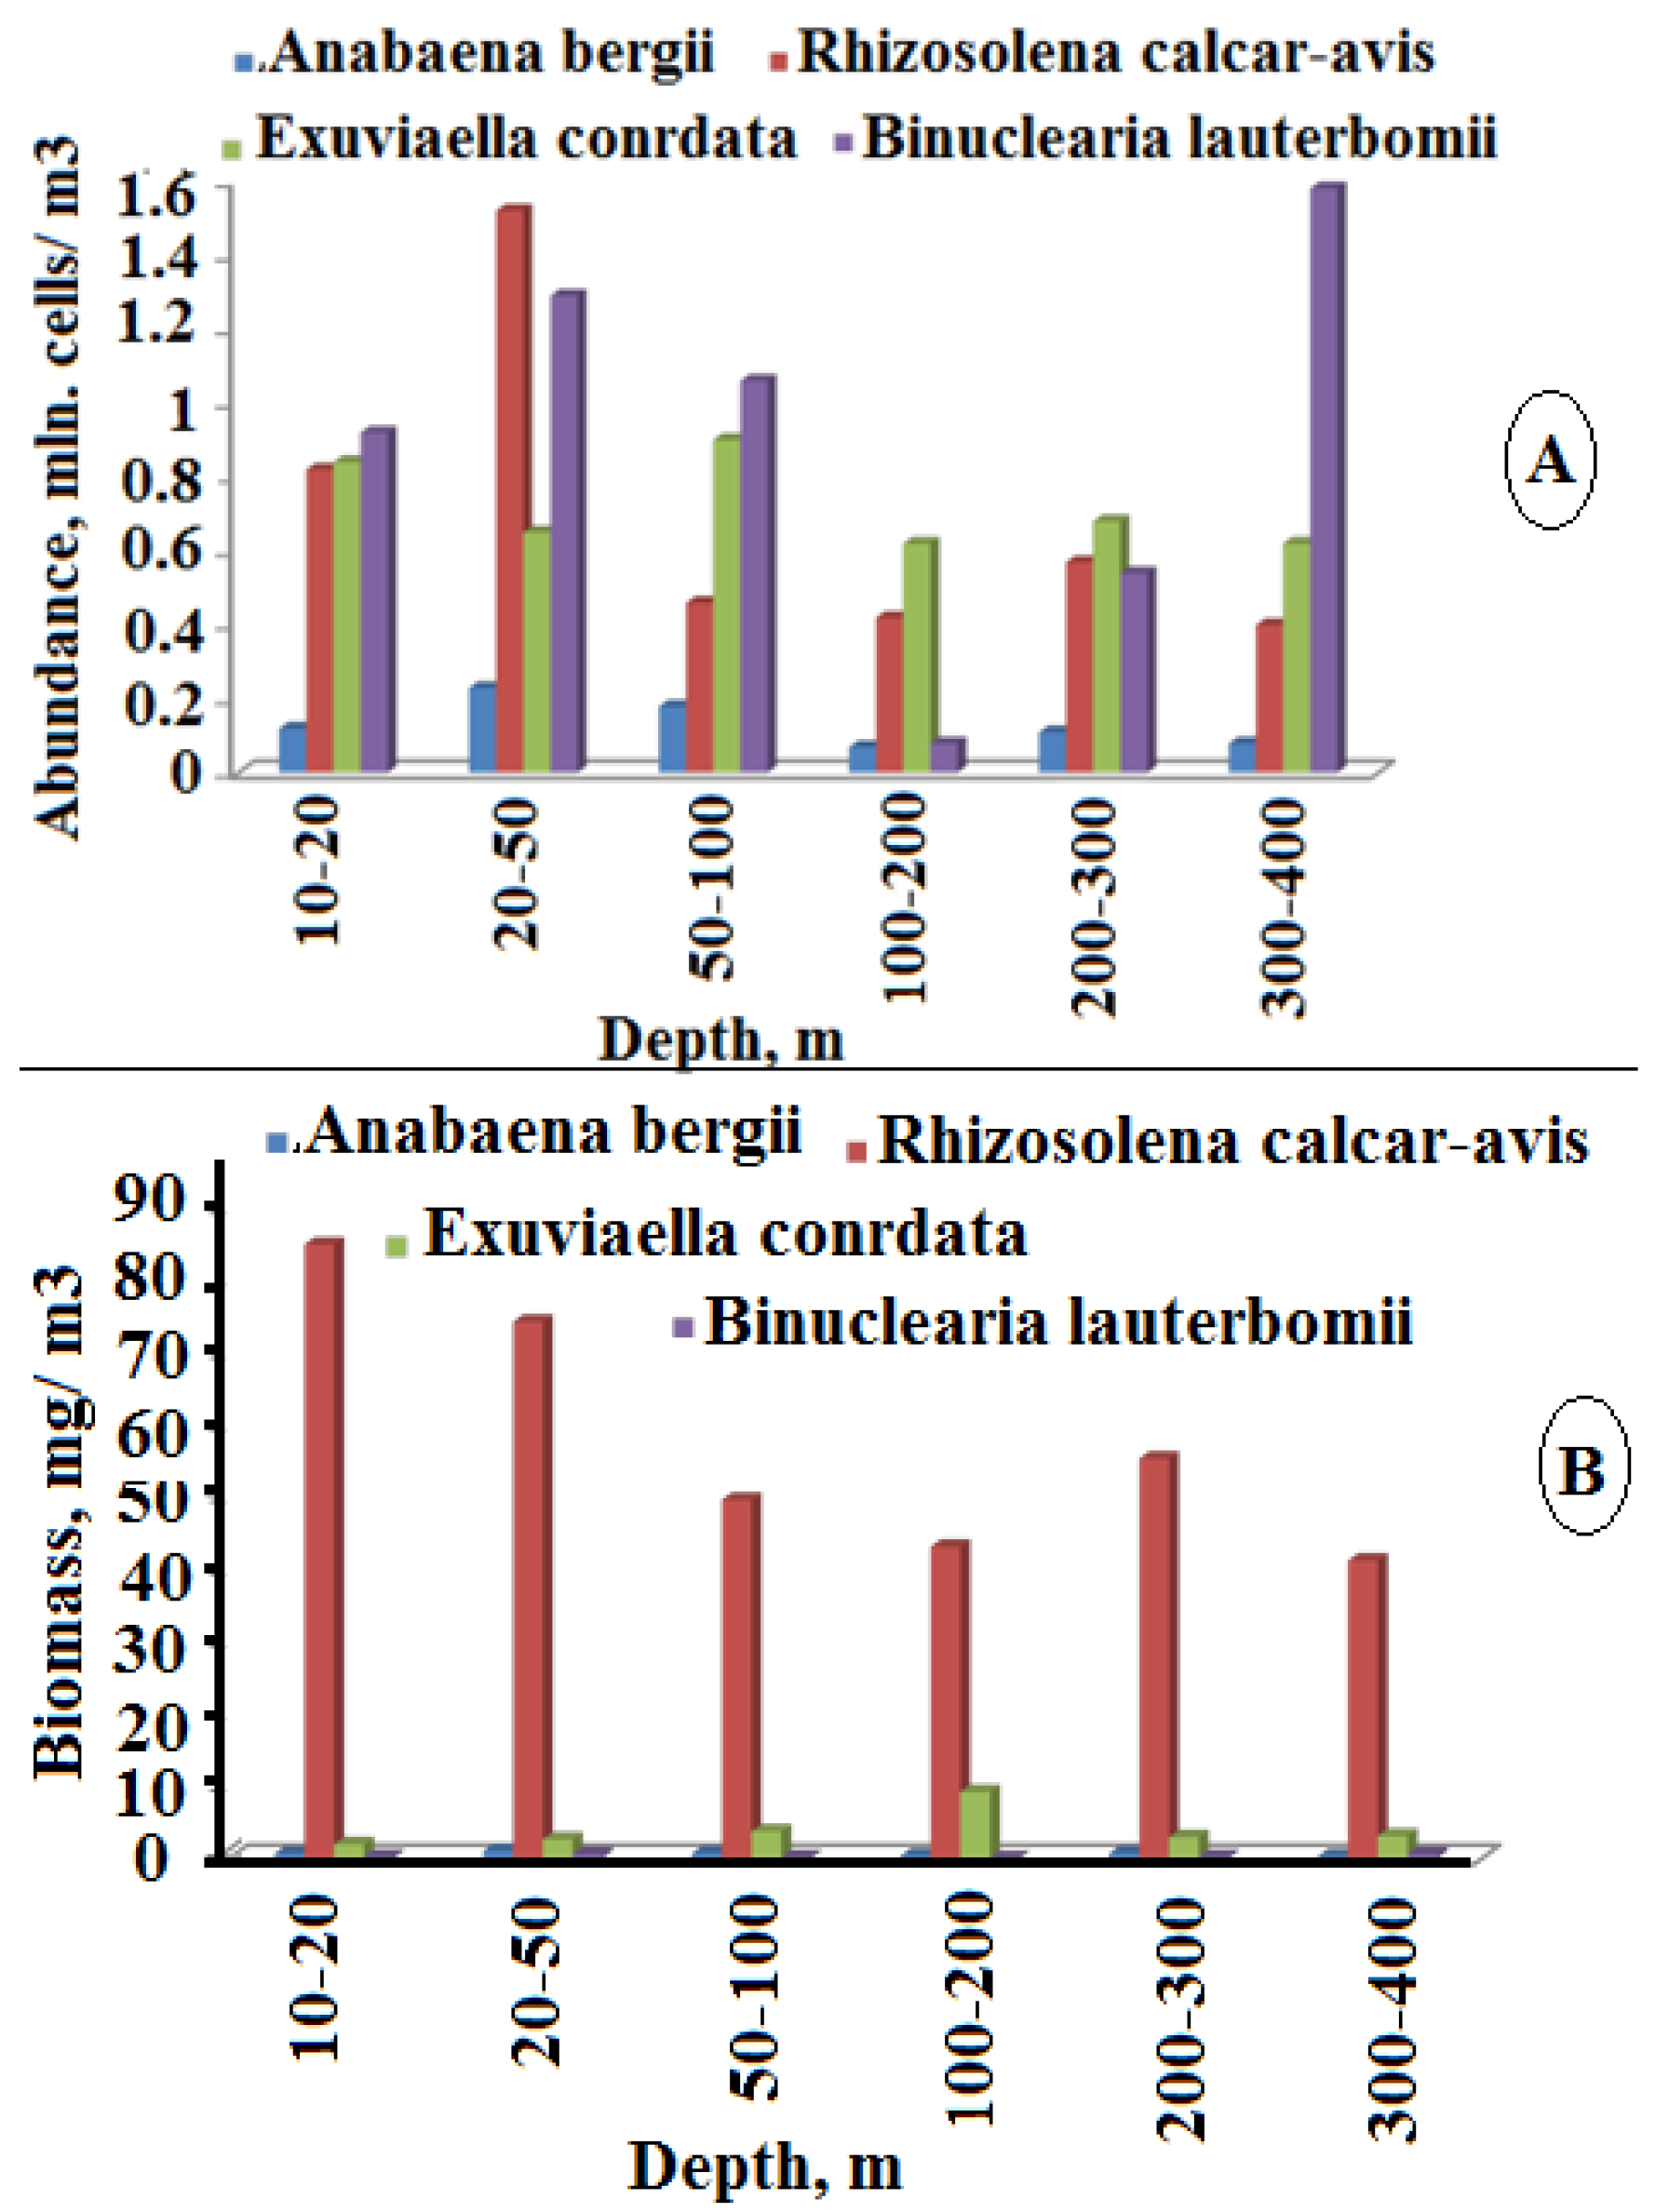
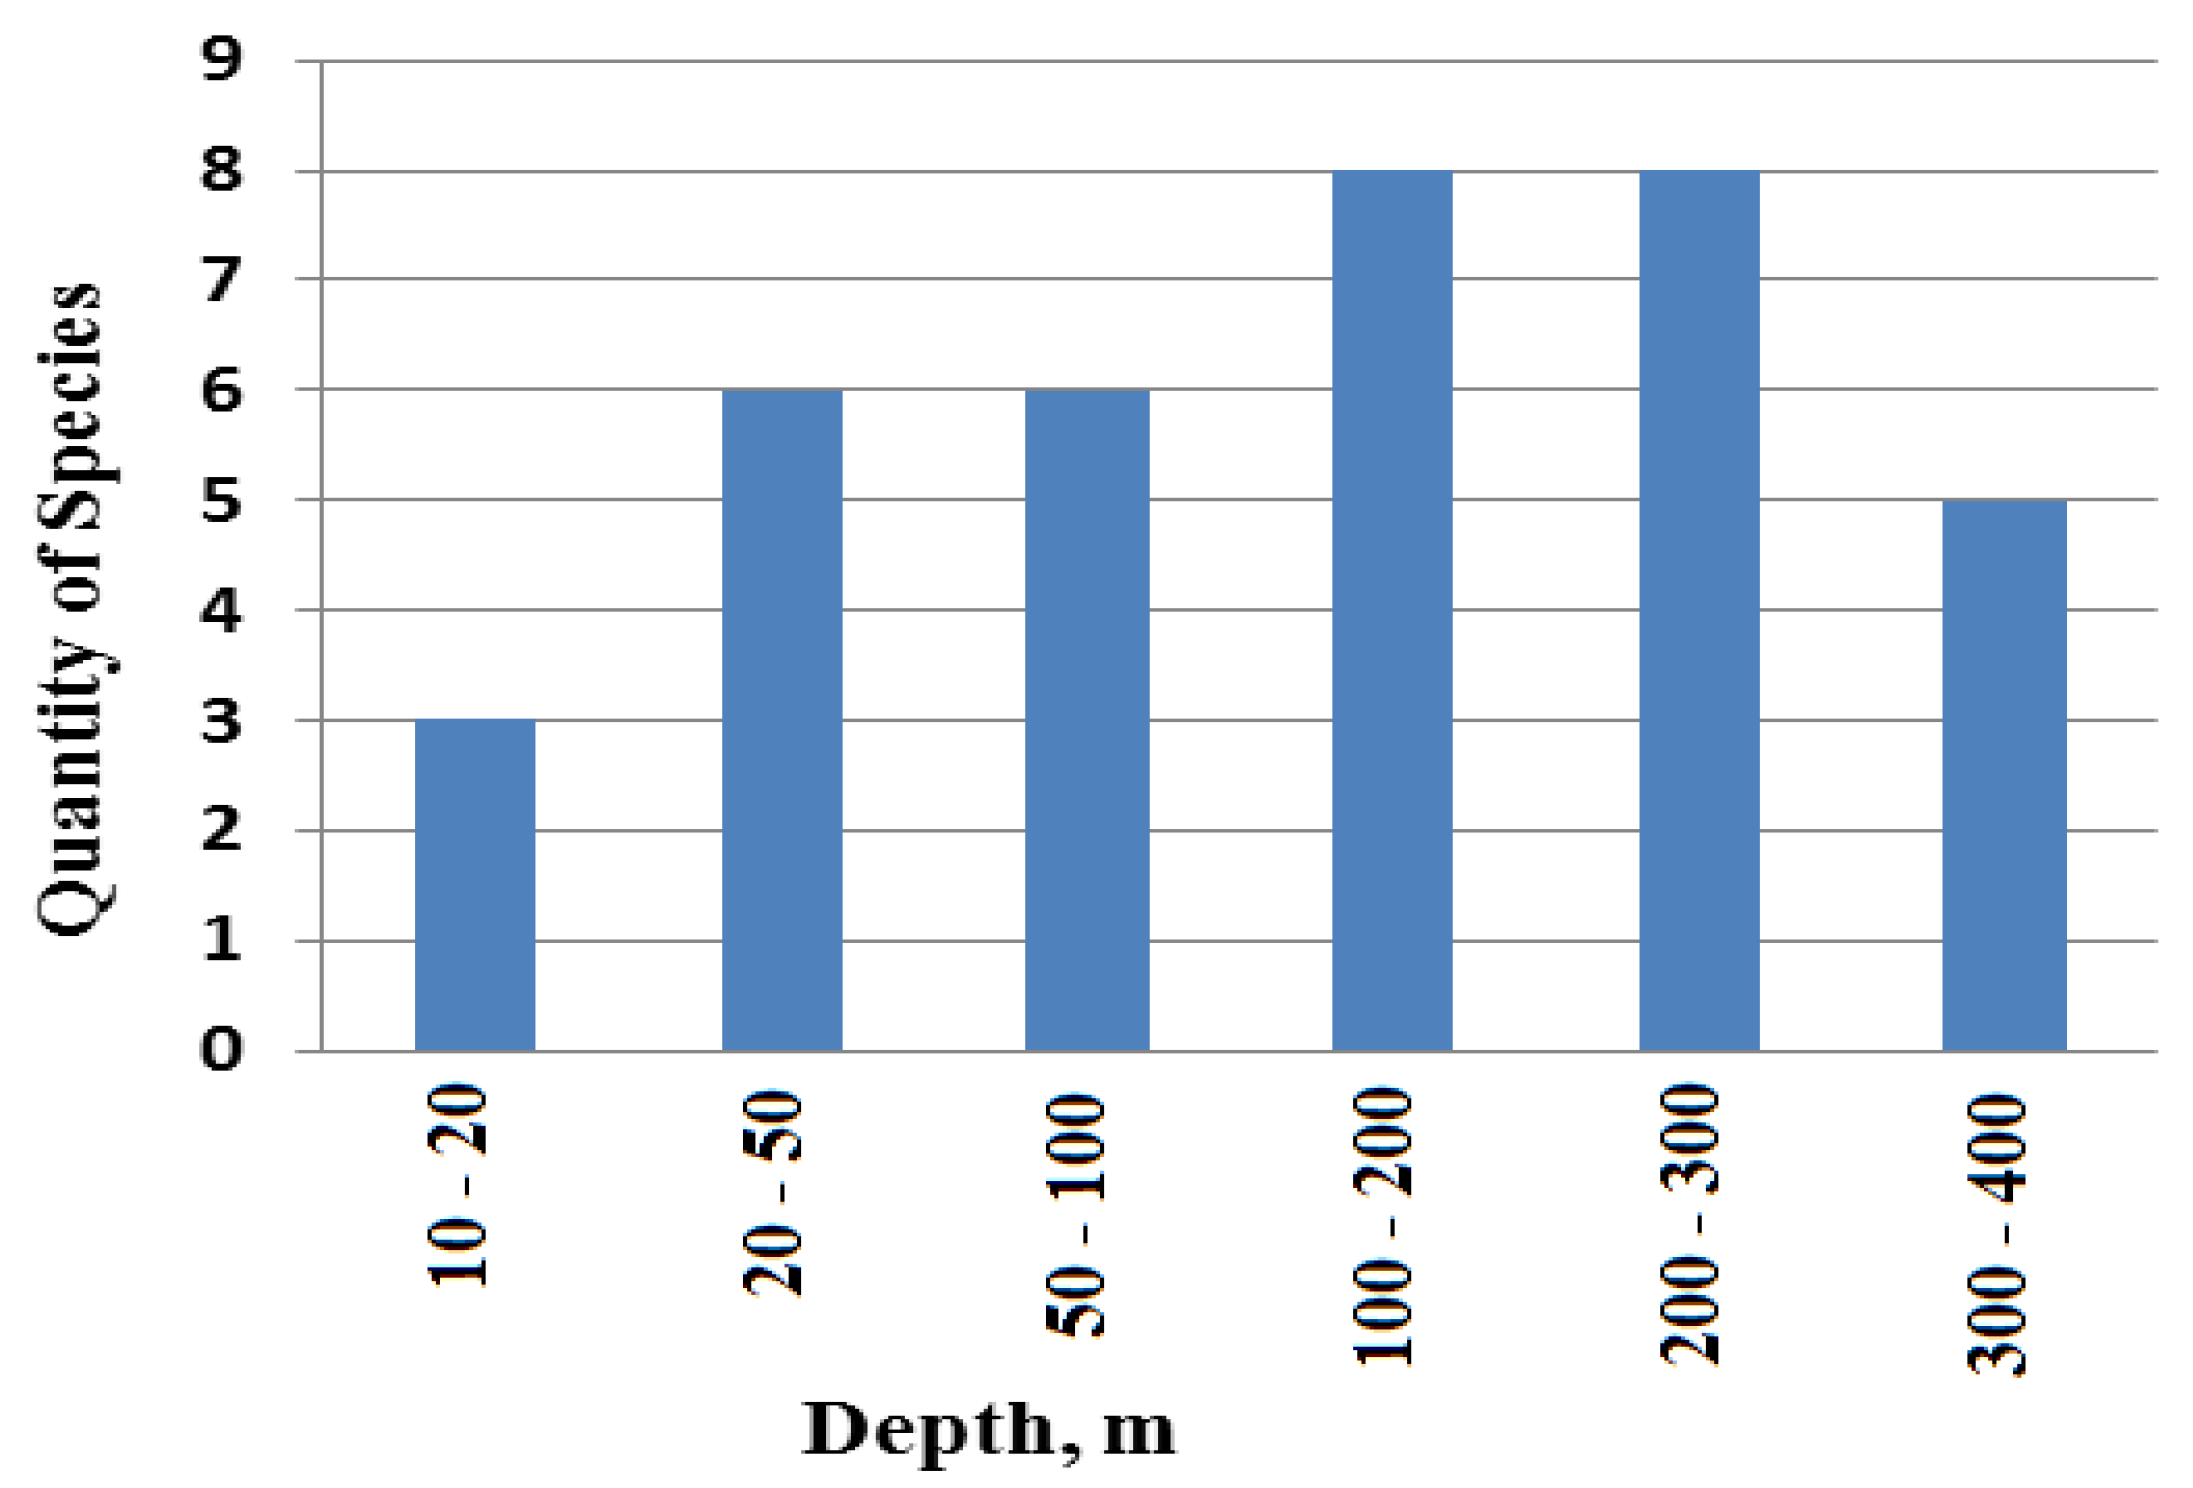
5.1. Phytoplankton Distribution with Depth
5.2. Zooplankton
5.3. Distribution of Zooplankton with Depth
5.4. Conclusions
Author Contributions
Funding
Data Availability Statement
Acknowledgments
Conflicts of Interest
References
- Zenkevich, L.A. Biology of Seas of the USSR; Academy of USSR Press: Moscow, Russia, 1963; p. 739. (In Russian) [Google Scholar]
- Starobogatov, Y.I. Fauna and Zoogeography of Molluscs of Turkmenistan. In Biogeography and Ecology of Turkmenistan; Fet, V., Atamuradov, K.I., Eds.; Kluwer Academic Publishers: Dordrecht, The Netherlands, 1994; pp. 535–543, Sur, H.I.; Özsoy, E.; Ibrayev, R. Satellite derived flow characteristics. [Google Scholar]
- Naseka, A.M.; Bogutskaya, N.G. Fishes of the Caspian Sea: Zoogeography and updated check list. Zoosyst. Ross 2009, 18, 295–317. [Google Scholar] [CrossRef]
- Raymond, R. Phytoplankton Species and Abundance Observed during 2008 in the Vicinity of the Klamath Hydroelectric Project; Oregon/Prepared for PacifiCorp Energy; Prepared by E&S Environmental Chemistry, Inc.: Corvallis, Portland, 2010; p. 47. [Google Scholar]
- Kosarev, A.N.; Yablonskaya, E.A. The Caspian Sea; SPB Academic Publishing: Amsterdam, The Netherlands, 1994; p. 259. Available online: https://www.pemberleybooks.com/product/the-caspian-sea/41455/ (accessed on 5 November 2022).
- Dumont, H. The Caspian Lake: History, biota, structure, and function. Limnol. Oceanogr. 1998, 43, 44–52. [Google Scholar] [CrossRef]
- Katunin, D.N. Hydroecological Foundations of the Formation of Ecosystem Processes in the Caspian Sea and the Volga River Delta/Astrakhan: KaspNIRKh; The Hague, The Netherlands, 2014; p. 478. Available online: http://www.nhpfund.org/files/volga-delta-nomination-en.pdf (accessed on 5 November 2022).
- Maryam, S.; Bidokhti, A.-A.A.; Chegini, V. A study of the roles of important forcing mechanisms on the circulation of the Caspian Sea using numerical simulation. J. Geophys. Tehran-Iran 2015, 9, 338–392. [Google Scholar]
- Rakisheva, Z.B.; Delpeche-Ellmann, N.; Sakhayeva, A.K. Siudying upwelling phases in the klaza khstan part of the Caspian Sea. International. J. Math. Phys. 2020, 11, 45. [Google Scholar]
- Vollenweider, R.A.; Munawar, M.; Stadelmann, P. A comparative review of phytoplankton and primary production in the Laurentian Great Lakes. J. Fish. Res. Board Can. 1974, 31, 739–762. [Google Scholar] [CrossRef]
- Roohi, A. Population Dynamic and Effects of the Invasive Species Ctenophore Mnemiopsis leidyi in the Southern Caspian Sea. Ph.D. Thesis, Universiti Sains Malaysia, Penang, Malaysia, 2009. [Google Scholar]
- Usachyov, P.I. Quantitative methodology for collecting and processing of phytoplankton. All-Russ. Hydrobiol. Soc. RAS 1961, 11, 411–415. (In Russian) [Google Scholar]
- Hasle, G.R. Some freshwater and brackish water species of the diatom genus Thalassiosira Cleve. Phycologia 1978, 17, 263–292. [Google Scholar] [CrossRef]
- Harris, R.; Wiebe, P.; Lenz, J.; Skjoldal, H.R.; Huntley, M. (Eds.) ICES Zooplankton Methodology Manual; Elsevier: Amsterdam, The Netherlands, 2000. [Google Scholar]
- Senichkina, L.G. Volumetric characteristics of oval and conical forms of cells of plankton algae. Hydrobiol. J. 1995, 31, 103–109. [Google Scholar]
- Reynolds, C.S.; Huszar, V.; Kruk, C.; Naselli-Flores, L.; Melo, S. Towards a functional classification of the freshwater phytoplankton. J. Plankton Res. 2002, 24, 417–428. [Google Scholar] [CrossRef]
- Zabelina, M.M.; Kisselev, I.A.; Proshkina-Lavrenko, A.I.; Sheshukova, V.S. Diatoms. In Inventory of Freshwater Algae of the USSR; Nauka: Moscow, Russia, 1951. (In Russian) [Google Scholar]
- Gollerbach, M.M.; Kossinskaya, E.K.; Polansky, V.I. Blue-green algae. In Guide to Freshwater Algae of the USSR; Soviet Science Press: Moscow, Russia, 1953; Volume 2, p. 651. (In Russian) [Google Scholar]
- Proshkina-Lavrenko, A.I.; Makarova, I.V. Plankton Algae of the Caspian Sea; Science Press: Leningrad, Russia, 1968; p. 295. (In Russian) [Google Scholar]
- Palamar-Mordvintseva, G.M. Chlorophyta: Conjugatophyceae. Desmidiales. In Flora Plantarum Cryptogamarum URSS; Nauka Press: Leningrad, Russia, 1982; Volume 11. (In Russian) [Google Scholar]
- Begon, M.; Harper, J.L.; Townsend, C.R. Ecology—Individuals, Populations, and Communities, 3rd ed.; Sunderland: Sinauer Associates, Inc.: Oxford, UK, 1998; p. 1068. [Google Scholar]
- Newell, G.E.K.C. Newell; Marin Plankton, Hutchinson and Co.: London, UK, 1977; p. 242. [Google Scholar]
- Abakumov, V.A. Water quality control by hydrobiological indicators in the system of the USSR Hydrometeorological Service /Scientific bases for the quality control of surface waters by hydrobiological indicators. In Proceedings of Soviet-British Seminar; Gidrometeoizdat Press: Leningrad, Russia, 1977; pp. 93–99. [Google Scholar]
- Megarran, E. Ecological Diversity and Its Measurement; Mir Press: Moscow, Russia, 1992; p. 182. [Google Scholar]
- Birshtein, Y.A.; Vinogradov, L.G.; Kondakov, N.N.; Astakhova, M.S.; Romanova, N.N. Atlas of Invertebrates of the Caspian Sea; Pishch Prom-st: Moscow, Russia, 1968; p. 413. (In Russian) [Google Scholar]
- Kutikova, L.V. Rotifer Fauna of the USSR; Science Press: Leningrad, Russia, 1970; p. 774. [Google Scholar]
- Tsalolikhin, S.J. Key to Freshwater Invertebrates of Russia and Adjacent Lands. V. 2. Crustaceans; Zoological Institute of Russian Academy of Sciences: St. Petersburg, Russia, 1995; p. 629. [Google Scholar]
- Prusova, N.Y.; Gubanova, A.D.; Shadrin, N.V.; Kushareva, E.K.; Tinenkova, D.K. Acartia tonsa (Copepoda, Calanoida)—A new species in the zooplankton of the Caspian and Azov seas. Vtsnik Zool. 2002, 36, 65–68. [Google Scholar]
- Tatarintseva, T.A.; Terletskaya, O.V. Phytoplankton of the Middle and Southern Caspian in 2003; KaspNIRKh: Astrakhan, Russia, 2004; p. 123. [Google Scholar]
- Kideys, A.E.; Soydemir, N.; Eker, E.; Vladymyrov, V.; Soloviev, D.; Melin, F. Phytoplankton distribution in the Caspian Sea during March 2001. Hydrobiologia 2005, 543, 159–168. [Google Scholar] [CrossRef]
- Bagheri, S.; Mansor, M.; Makaremi, M.; Sabkara, J.; Wan-Maznah, W.O.; Mirzajani, A.; Khodaparast, S.H.; Negarestan, H.; Ghandi, A.; Khalilpour, A. Fluctuations of phytoplankton community in the coastal waters of Caspian Sea in 2006. Am. J. Appl. Sci. 2010, 8, 1328–1336. [Google Scholar] [CrossRef] [Green Version]
- Nasrollahzadeh, H.S.; Din, Z.B.; Foonga, S.Y.; Makhlough, A. Spatial and temporal distribution of macronutrients and phytoplankton before and after the invasion of the ctenophore, Mnemiopsis leidyi, in the Southern Caspian Sea. J. Chem. Ecol. 2008, 24, 233–246. [Google Scholar] [CrossRef]
- Abdusamadov, A.S.; Belyaeva, H.S. Dagestan fisheries in the Western Caspian Sea: Current status, factors of impact and recommendations to sustainable management. Aquat. Ecosyst. Health Manag. 2015, 18, 171–183. [Google Scholar] [CrossRef]
- Bagheri, S.; Sabkara, J.; Mirzajani, A.R.; Khodaparast, S.H.; Yosefzad, E.; Foong, S.Y. List of zooplankton taxa in the Caspian Sea waters of Iran. J. Mar. Biol. 2013, 2013, 1–7. [Google Scholar] [CrossRef]
- Aboulghasem, R.; Ahmet, E.K.; Mehdi, N.J.; Mohammadali, A.B.; Ali, M.R. Caspian Sea: Environmental controls and trophic webs interactions. J. Oceanogr. Mar. Sci. 2021, 12, 1–9. [Google Scholar] [CrossRef]
- Abdurakhmanov, G.M.; Sokolsky, A.F.; Sokolskaya, E.A. Causes of plankton degradation in the Middle and South Caspian nowadays. South Russ. Ecol. Dev. 2010, 5, 12–15. (In Russia) [Google Scholar] [CrossRef] [Green Version]
- Guseinova, S.A.; Abdurakhmanov, G.M. Modern peculiarities for animal plankton distribution in the separate regions of the Caspian Sea. South Russ. Ecol. Dev. 2009, 4, 185–189. (In Russia) [Google Scholar] [CrossRef]
- Tarasova, M.N.; Nikulina, L.V. Variety of zooplankton in the Middle and Southern Caspian. In Proceedings of the VI International Scientific Conference on Biodiversity and the Role of Animals in Ecosystems, Dnipropetrovsk, Ukraine, 9–12 September 2011; pp. 140–142. [Google Scholar]
- Kazancheev, E.N. Fishes of Caspian Sea; Fisheries Press: Moscow, Russia, 1981; p. 180. [Google Scholar]
 Study stations).
Study stations).
Study stations).


| Species | Frequency of Occurrence, % | |||||
|---|---|---|---|---|---|---|
| 10–20 m | 20–50 m | 50–100 m | 100–200 m | 200–300 m | 300–400 m | |
| CYANOPHYTA- Blue-green algae | ||||||
| Oscillatoria sp. | 2 | 5 | 10 | 2 | 2 | 1 |
| O.geminata Menegh. | 1 | 10 | 2 | 6 | 2 | 2 |
| O. subtilissima (Kütz.) | 1 | - | 4 | - | 1 | - |
| Anabaena bergiiOstf. | 2 | 30 | 7 | 2 | 7 | 1 |
| A. contracta (Szafer)Geitl. | - | 1 | 1 | - | - | - |
| A. spiroides v.contracta Kleb. | - | - | 2 | - | - | - |
| Gomphosphaeria aponina v. multiplex Nyg. | - | - | 4 | - | - | - |
| Total 7 | 6 | 46 | 30 | 10 | 12 | 4 |
| BACILLARIOPHYTA- Diatoms | ||||||
| Melosira granulata (Her.) Ralfs | 4 | 24 | 12 | 4 | 13 | 2 |
| Thalassiosira caspica Makar. | 1 | 15 | 5 | 2 | 7 | 1 |
| Coscinodiscus granii Ehr. | 1 | 5 | 2 | 1 | 2 | 2 |
| C. gigas Ehr. | 1 | 2 | 5 | 1 | 1 | 1 |
| C. perforatus Ehr. | 1 | 7 | 2 | 2 | 1 | 2 |
| C. perforatus v.pavillardii (Forti H.) | 1 | - | 2 | - | 1 | - |
| C. perforatus v.cellulosus Grun. | - | - | 1 | 2 | - | - |
| Actinocyclus echrenbergii Ralfs | - | 6 | 1 | - | 2 | - |
| Rhizosolenia calcar-avis M.Schltze | 5 | 38 | 21 | 11 | 13 | 6 |
| Rh. Fragillissima Bergon. | - | 9 | 2 | 2 | 1 | 2 |
| Thalassionema nitzschioides Grun | 1 | 7 | - | 1 | 1 | 1 |
| Fragilaria virescens Ralfs | - | 2 | 1 | - | 2 | - |
| Navicula cincta (Ehr.) Ktz. | - | 4 | 5 | - | 4 | - |
| N. peregrina (Ehr.) Ktz. | - | 1 | 4 | - | 1 | - |
| N. placentula (Ehr.) Grun. | - | 1 | 1 | 2 | 2 | - |
| N. cryptocephala Kutz. | 2 | 7 | 4 | 5 | 1 | 2 |
| N. lanceolata (Ag.) Kutz | - | - | 2 | 1 | 1 | - |
| Hyalodiscus sphaericum Makar. | 2 | 7 | 2 | 1 | 2 | 2 |
| Nitzschia distans Greg. | 1 | 10 | 6 | 2 | 5 | 1 |
| N. acicularis W.Sm. | - | 1 | 1 | 1 | - | - |
| N. seriata Cl. | - | 5 | 5 | - | 4 | - |
| N. closterium(Ehr.)W.Sm. | 1 | 6 | 6 | 5 | 4 | - |
| N. sigma (Kutz.) W.Sm. | - | 1 | 1 | - | - | - |
| Gomphonema constrictum Her. | - | 1 | - | - | - | - |
| Total 24 | 21 | 159 | 69 | 43 | 68 | 22 |
| PYRROPHYTA- dinoflagellates | ||||||
| Exuviaella cordata Ostf. | 5 | 37 | 15 | 10 | 13 | 5 |
| Ex. marina Clenk. | 1 | 10 | 10 | 5 | 4 | - |
| Prorocentrum scutellum Schrod. | - | - | - | 1 | 1 | 1 |
| Gymnodinium variabile Herdm. | - | 2 | - | - | - | - |
| Peridinium latum Pauls. | 1 | 1 | - | 1 | - | 2 |
| P. latum v. halophila (Lind.) I.Kissel. | - | 2 | 2 | - | 1 | - |
| P. achromaticum Levand. | - | - | 2 | - | 1 | - |
| P. subsalsum Ostf. | - | - | 1 | - | - | - |
| Peridinium trochoideum (Stein.) Gemm. | - | 2 | - | - | - | - |
| Goniaulax digitale (Pouch.)Kof. | - | 2 | 1 | - | 1 | - |
| G. polyedra Stein | - | 1 | 1 | - | - | - |
| G. spinifera (Clapar.et Lachm.) Dies. | 1 | - | 2 | - | - | - |
| Glenodinium lenticula (Berg.) Schiller | - | - | 1 | - | - | - |
| Total 13 | 8 | 57 | 35 | 17 | 21 | 8 |
| CHLOROPHYTA | ||||||
| Pediastrum duplex Meyen | - | 1 | 1 | - | 1 | - |
| Dictyosphaerium pulchellum Wood | - | 1 | 1 | - | - | - |
| Ankistrodesmus convolutus Corda | - | 1 | - | - | - | - |
| Binuclearia lauterbornii Schmidle | 4 | 29 | 15 | 4 | 10 | 4 |
| Mougeotia sp. | - | - | 1 | - | - | - |
| Spirogyra sp. | - | 1 | - | - | - | - |
| Total 6 | 4 | 33 | 18 | 4 | 11 | 4 |
| Sum 50 spp. | 39 | 295 | 152 | 74 | 112 | 38 |
| Mean | 2 | 8 | 4 | 3 | 4 | 2 |
| Depth, m | Cyanophyta | Bacillariophyta | Dinoflagellata | Chlorophyta | Total |
|---|---|---|---|---|---|
| Abundance, Million Cells/m3 | |||||
| 10–20 | 0.40 ± 0.06 | 2.26 ± 0.52 | 0.98 ± 0.53 | 0.92 ± 0.41 | 4.56 ± 1.52 |
| 20–50 | 0.43 ± 0.09 | 2.99 ± 0.41 | 0.85 ± 0.12 | 1.42 ± 0.31 | 5.69 ± 0.93 |
| 50–100 | 0.58 ± 0.21 | 1.84 ± 0.19 | 1.35 ± 0.20 | 1.29 ± 0.31 | 5.06 ± 0.91 |
| 100–200 | 0.22 ± 0.02 | 1.47 ± 0.25 | 0.80 ± 0.17 | 0.08 ± 0.04 | 2.57 ± 0.48 |
| 200–300 | 0.27 ± 0.08 | 2.58 ± 0.30 | 0.78 ± 0.22 | 0.56 ± 0.26 | 4.19 ± 0.86 |
| 300–400 | 0.44 ± 0.20 | 1.58 ± 0.22 | 1.24 ± 0.39 | 1.58 ± 0.68 | 4.84 ± 1.49 |
| Mean | 0.39 ± 0.11 | 2.12 ± 0.32 | 1.00 ± 0.27 | 0.98 ± 0.34 | 4.49 ± 1.03 |
| Depth, m | Cyanophyta | Bacillariophyta | Dinoflagellata | Chlorophyta | Total |
|---|---|---|---|---|---|
| Biomass, mg/m3 | |||||
| 10–20 | 2.44 ± 0.43 | 98.04 ± 12.27 | 3.54 ± 1.31 | 0.22 ± 0.13 | 104.24 ± 14.14 |
| 20–50 | 1.96 ± 0.27 | 91.47 ± 6.06 | 3.91 ± 0.53 | 0.71 ± 0.20 | 98.05 ± 7.06 |
| 50–100 | 2.68 ± 0.49 | 65.11 ± 8.54 | 6.96 ± 1.28 | 0.21 ± 0.05 | 74.96 ± 10.36 |
| 100–200 | 1.56 ± 0.16 | 56.93 ± 10.09 | 3.91 ± 0.83 | 0.03 ± 0.02 | 62.43 ± 11.10 |
| 200–300 | 1.55 ± 0.49 | 70.22 ± 11.34 | 3.88 ± 0.83 | 0.43 ± 0.24 | 76.08 ± 12.9 |
| 300–400 | 1.42 ± 0.52 | 61.58 ± 6.57 | 5.16 ± 0.83 | 0.54 ± 0.23 | 68.70 ± 8.15 |
| Mean | 1.94 ± 0.39 | 73.89 ± 9.15 | 4.56 ± 0.94 | 0.36 ± 0.16 | 80.74 ± 10.62 |
| Depth, m | Structural Indices of Phytoplankton | Saprobes, S | ||
|---|---|---|---|---|
| Number of Species | H, Specimen | H, mg | ||
| 10–20 | 7 | 1.77 | 0.77 | 1.62 ± 0.09 |
| 20–50 | 8 | 1.60 | 0.89 | 1.47 ± 0.04 |
| 50–100 | 9 | 1.75 | 1.21 | 1.69 ± 0.06 |
| 100–200 | 7 | 1.78 | 1.08 | 1.60 ± 0.08 |
| 200–300 | 8 | 1.70 | 0.99 | 1.56 ± 0.04 |
| 300–400 | 7 | 1.64 | 1.20 | 1.54 ± 0.07 |
| Mean | 8 ± 0.35 | 1.71 ± 0.07 | 1.02 ± 0.13 | 1.58 ± 0.06 |
| Indicators | 2013 | 2014 | 2015 | 2016 | |
|---|---|---|---|---|---|
| May | May | September | April | May | |
| Total number of taxa | 74 | 15 | 49 | 59 | 50 |
| Number, million cells/m3 | 10.1 | 55.9 ± 12.98 | 9.0 ± 0.63 | 6.4 ± 0.36 | 4.5 ± 1.03 |
| Dominant group by abundance | Bacillariophyta | Bacillariophyta | Bacillariophyta | Bacillariophyta | Bacillariophyta |
| Biomass, mg/m3 | 80.1 | 301.2 ± 39.7 | 76.2 ± 8.06 | 93.0 ± 4.95 | 80.7 ± 10.62 |
| Dominant group by biomass | Bacillariophyta | Bacillariophyta | Bacillariophyta | Bacillariophyta | Bacillariophyta |
| Shannon–Weaver index, bit/ind. | - | 1.09 ± 0.20 | 1.98 ± 0.13 | 1.65 ± 0.09 | 1.71 ± 0.07 |
| Shannon–Weaver index, bit/mg | - | 0.57 ± 0.12 | 1.98 ± 0.1 | 1.01 ± 0.16 | 1.02 ± 0.13 |
| Saprobity index | 1.72 | - | 1.80 ± 0.1 | 1.46 ± 0.03 | 1.58 ± 0.06 |
| Species | Frequency of Occurrence, % | |||||
|---|---|---|---|---|---|---|
| 10–20 m | 20–50 m | 50–100 m | 100–200 m | 200–300 m | 300–400 m | |
| Copepoda | ||||||
| Acartia tonsa Dana | 100 | 100 | 100 | 100 | 100 | 100 |
| Cladocera | ||||||
| Evadne anonyx typica G.O. Sars | 100 | 100 | 100 | 100 | 100 | 100 |
| Evadne anonyx producta G.O. Sars | 0 | 7 | 9 | 11 | 11 | 3 |
| Evadne anonyx prolangata G.O. Sars | 0 | 0 | 0 | 1 | 3 | 0 |
| Evadne anonyx deflexa G.O. Sars | 0 | 0 | 0 | 1 | 3 | 0 |
| Podon polyphemoides Leukert | 0 | 1 | 2 | 2 | 0 | 0 |
| Podonevadne camptonyx podonoides G.O. Sars | 0 | 0 | 0 | 0 | 1 | 0 |
| Others | ||||||
| Ostracoda | 0 | 5 | 5 | 4 | 5 | 2 |
| Cirrpedia Balanus improvisus Dorwin | 100 | 100 | 100 | 100 | 100 | 100 |
| Average | 3 | 6 | 6 | 8 | 8 | 5 |
| Depth, m | Ccopepods | Cladocera | Others | All |
|---|---|---|---|---|
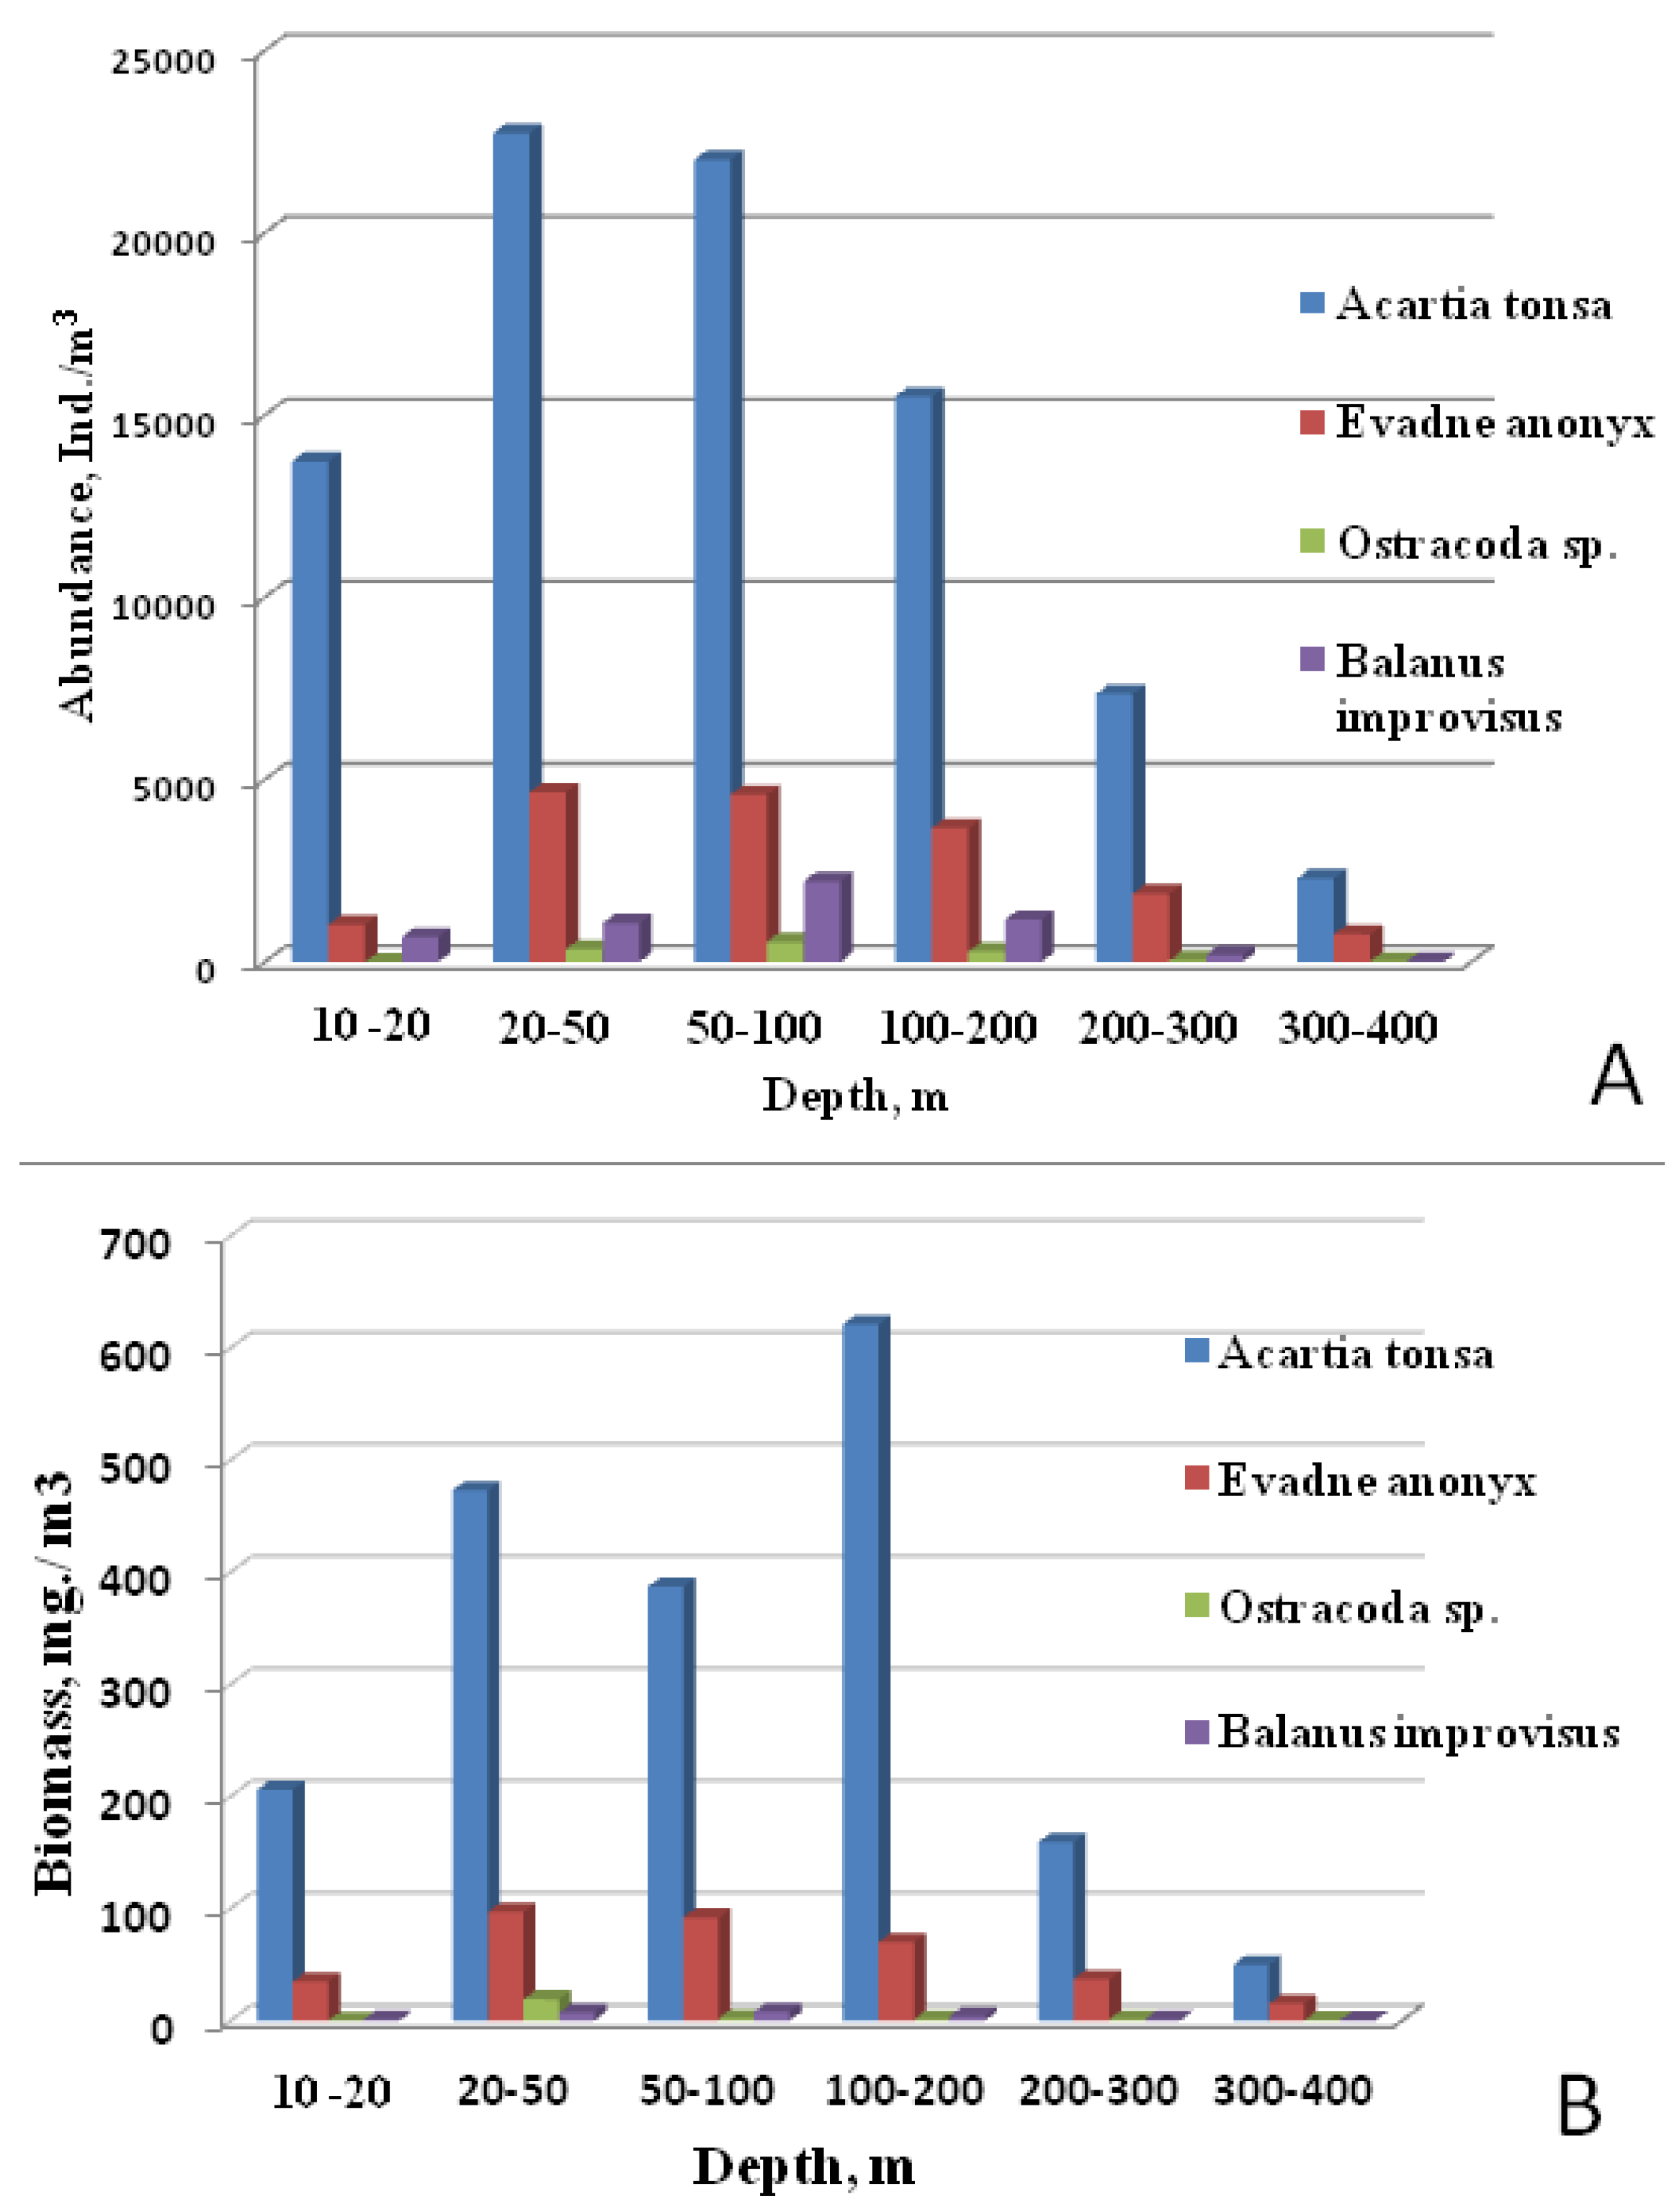
| Abundance, ind./m3 | ||||
| 10–20 | 13,737 ± 3134 | 1760 ± 419 | 684 ± 214 | 16,181 ± 3101 |
| 20–50 | 22,738 ± 653 | 4994 ± 293 | 1427 ± 186 | 29,160 ± 785 |
| 50–100 | 22,014 ± 515 | 4838 ± 197 | 2773 ± 115 | 29,625 ± 665 |
| 100–200 | 15,517 ± 309 | 3896 ± 135 | 1452 ± 114 | 20,866 ± 448 |
| 200–300 | 7362 ± 253 | 2014 ± 59 | 242 ± 13 | 9619 ± 300 |
| 300–400 | 2301 ± 171 | 810 ± 39 | 52 ± 11 | 3165 ± 186 |
| Mean | 13,945 ± 8048 | 3052 ± 1758 | 1105 ± 1004 | 18,103 ± 10,597 |
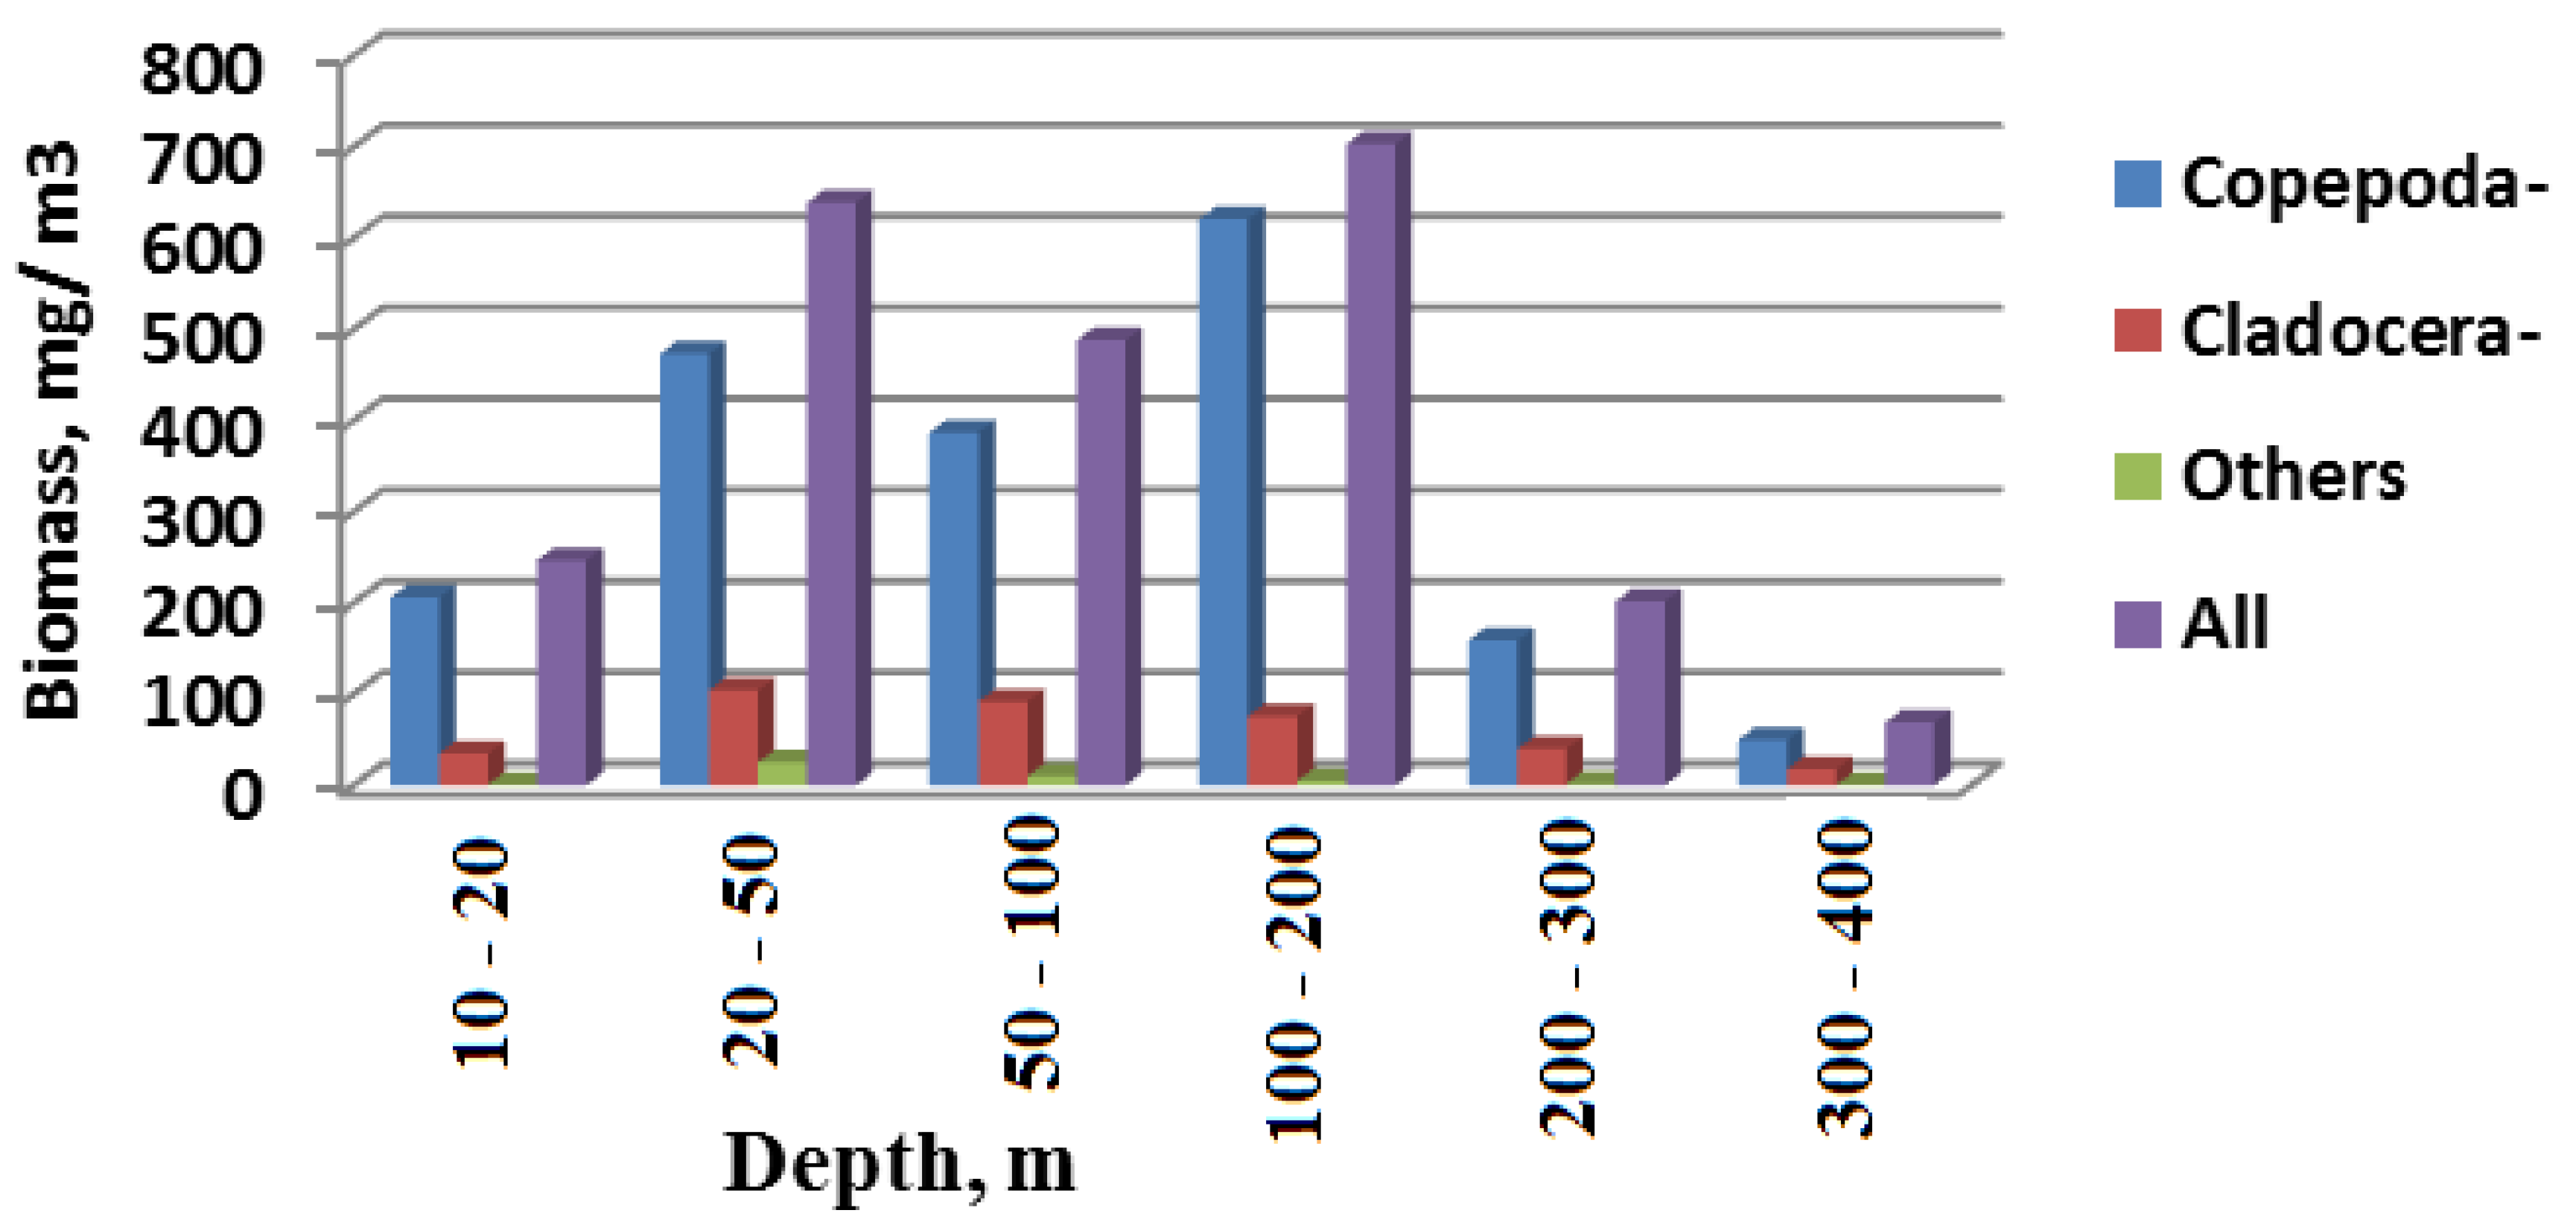
| Depth, m | Copepoda | Cladocera | Others | All |
|---|---|---|---|---|
| Biomass, mg/m3 | ||||
| 10–20 | 206 ± 48 | 35 ± 8 | 1 ± 0.4 | 247 ± 51 |
| 20–50 | 473 ± 15 | 104 ± 6 | 25 ± 5 | 639 ± 17 |
| 50–100 | 387 ± 13 | 93 ± 4 | 10 ± 0.5 | 488 ± 14 |
| 100–200 | 621 ± 57 | 77 ± 3 | 6 ± 0.5 | 704 ± 57 |
| 200–300 | 159 ± 7 | 40 ± 1 | 2 ± 0.2 | 202 ± 7 |
| 300–400 | 50 ± 5 | 18 ± 1.2 | 0.5 ± 0.1 | 69 ± 6 |
| Mean | 316 ± 214 | 61 ± 35 | 8 ± 9 | 392 ± 257 |
| Depth, m | Structural Indicators of Zooplankton | ||
|---|---|---|---|
| Number of Species | Hh, bit/copy | Hb, bit/mg | |
| 10–20 | 3 ± 0.6 | 0.45 ± 0.45 | 0.35 ± 0.35 |
| 20–50 | 3 ± 0.7 | 0.58 ± 0.22 | 0.56 ± 0.22 |
| 50–100 | 3 ± 1 | 0.28 ± 0.28 | 0.26 ± 0.26 |
| 100–200 | 4 ± 1 | 0.71 ± 0.21 | 0.58 ± 0.24 |
| 200–300 | 4 ± 1 | 0.61 ± 0.28 | 0.53 ± 0.25 |
| 300–400 | 4 ± 0.01 | 0.77 ± 0.23 | 0.76 ± 0.21 |
| Mean | 4 ± 0.4 | 0.47 ± 0.35 | 0.42 ± 0.33 |
| Indicator | 2013 | 2014 | 2015 | 2016 | |
|---|---|---|---|---|---|
| May | May | Sept. | April | May | |
| Total number of taxa | 8 | 14 | 13 | 11 | 9 |
| Number, thousand. ind./m3 | 3.1 ± 0.7 | 6.8 ± 2.0 | 5.3 ± 0.5 | 1.2 ± 0.1 | 18.1 ± 10.6 |
| Dominant group by abundance | Copepoda | Copepoda | Copepoda | Copepoda | Acartia tonsa |
| Biomass, mg/m3 | 38.2 ± 8.8 | 771.9 ± 186.8 | 64.1 ± 7.9 | 17.0 ± 1.8 | 392 ± 257 |
| Dominant group by biomass | Cladocera | Cladocera | Copepoda | Cladocera | Acartia tonsa |
| Number of Mnemiopsis leidyi, ind./m3 | 0 | 0 | 81 | 0 | 0 |
| Shannon–Weaver index, bit/ind. | - | 2.47 | 1.90 | 1.19 ± 0.03 | 0.47 ± 0.35 |
| Shannon–Weaver index, bit/mg | - | - | - | 1.57 ± 0.03 | 0.42 ± 0.33 |
| Average individual weight of the specimen, mg | 0.115 | 0.012 | 0.0176 ± 0.0011 | - | |
Disclaimer/Publisher’s Note: The statements, opinions and data contained in all publications are solely those of the individual author(s) and contributor(s) and not of MDPI and/or the editor(s). MDPI and/or the editor(s) disclaim responsibility for any injury to people or property resulting from any ideas, methods, instructions or products referred to in the content. |
© 2022 by the authors. Licensee MDPI, Basel, Switzerland. This article is an open access article distributed under the terms and conditions of the Creative Commons Attribution (CC BY) license (https://creativecommons.org/licenses/by/4.0/).
Share and Cite
Kurochkina, T.F.; Nasibulina, B.M.; Bakhshalizadeh, S.; Popov, N.; Kuanysheva, G.; Fazio, F.; Ali, A.M. Plankton Community Structure and Biomass in the Eastern Middle Caspian Sea. Water 2023, 15, 138. https://doi.org/10.3390/w15010138
Kurochkina TF, Nasibulina BM, Bakhshalizadeh S, Popov N, Kuanysheva G, Fazio F, Ali AM. Plankton Community Structure and Biomass in the Eastern Middle Caspian Sea. Water. 2023; 15(1):138. https://doi.org/10.3390/w15010138
Chicago/Turabian StyleKurochkina, Tatyana Fedorovna, Botagoz Murasovna Nasibulina, Shima Bakhshalizadeh, Nikolai Popov, Gulnur Kuanysheva, Francesco Fazio, and Attaala Muhaysin Ali. 2023. "Plankton Community Structure and Biomass in the Eastern Middle Caspian Sea" Water 15, no. 1: 138. https://doi.org/10.3390/w15010138