
Research on Optimal Allocation of Water Resources in Handan City Based on the Refined Water Resource Allocation Model

1
School of Water Conservancy and Hydroelectric Power, Hebei University of Engineering, Handan 056038, China
2
Handan Water Resources Management Centre, Handan 056038, China
3
Handan Zhangfu River Irrigation and Water Supply Management Office, Handan 056038, China
*
Author to whom correspondence should be addressed.
Water 2023, 15(1), 154; https://doi.org/10.3390/w15010154
Submission received: 5 December 2022
/
Revised: 22 December 2022
/
Accepted: 26 December 2022
/
Published: 30 December 2022
(This article belongs to the Special Issue Smart Water and the Digital Twin)
Abstract
:In order to realize the dynamic regulation and control of regional water resources and alleviate the imbalance between supply and demand of regional water resources, on the basis of the demand of refined management of water resources, the dynamic General Water Allocation and Simulation Model (GWAS) of Handan City was constructed. The research on the optimal allocation of water resources in different regions and counties under different normal and dry years in the planning years (2025 and 2035) was carried out. The results show that the allocated water volume in the normal and dry years of Handan in 2025 is 2.248 billion m3 and 2.150 billion m3, respectively, and the water shortage rate is 11.72% and 22.11%, respectively. The water shortage is mainly in agriculture. In 2035, the allocated water volumes in normal and dry years will be 2.504 billion m3 and 2.33 billion m3, respectively, and the water shortage rates will be 4.50% and 21.84%, respectively. After optimized allocation, the water supply structure was significantly improved. The proportion of groundwater supply will decrease at each planning level year, and the water supply of external water transfer and unconventional water will increase. This research can provide technical reference to the Handan development scheme depending on water resources in the future, as well as the optimal allocation of water resources in other cities in the Beijing–Tianjin–Hebei Region.
1. Introduction
With the transformation of the concept of social economic development, regional water resource management will become increasingly refined. Water resource allocation is an important part of water resource management—it is used to standardize and reasonably suppress water demand, as well as save and efficiently ensure water supply, alongside other means and measures; moreover, it is an effective way to rationalize the distribution of water resources to different regions and users and to make them sustainable [1,2]. The dynamic adjustment of the supply and demand structure according to the changes in social and economic development and the changes in the temporal and spatial distribution of water resources, so as to achieve the fine allocation of water resources, is the development trend of water resource allocation in the new situation, and it is also the key to effectively resolving the contradiction between supply and demand of regional water resources.
The problem of regional water resource allocation has obvious complexity, dynamics, and multi-objectivity. In recent years, most scholars have applied intelligent bionic algorithms to solve the allocation scheme of water resources in the region, such as the fish swarm algorithm [3,4], genetic algorithm [5], particle swarm algorithm [6], whale algorithm [7], and improvement or fusion methods based on these algorithms [6,8]. Among them, NSGA-II (the second generation non dominated sorting genetic algorithm) is one of the widely used multi-objective genetic algorithms, having the advantages of a fast-running speed and good solution set convergence [9]. Therefore, many scholars, such as Sha Jinxia [10] and Wang Hui [11], have applied the algorithm to the calculation of water resource optimal allocation schemes in different scales and types of areas, such as Xingtai City, Baojixia Wuquan Irrigation District, and Hebei Province, and have obtained good research results, confirming the universality of the algorithm.
With the development of computer science, on the basis of optimizing and improving the solution algorithm, some scholars conducted research on water resource allocation by applying MIKE, VIC, WROOM, DTVG-WEAR, and other models [12,13,14,15,16]. Because the water cycle is strongly affected by human social activities, most algorithms and models do not reflect the impact of dynamic changes in water resources in real time during water allocation, and it is difficult to accurately reflect the fine allocation between natural water resources and social water resources under high-intensity water use activities, and thus the allocation effect is not very good [17,18]. Therefore, Sang Xuefeng et al. [19,20] developed the GWAS model based on the theory of natural–social dual water cycle and the theory of dynamic allocation of water resources. When using this model for water resource allocation, the operation of the water resource system can be dynamically simulated, and the dynamic allocation of water resources based on the regional water supply process and its runoff feed mechanism is realized, which effectively compensates for the shortcomings of the previous model that cannot achieve dynamic feedback of the water resource system. Subsequently, Chang Huanyu [21], Cao Yongqiang [22], Du Lijuan et al. [23], and Luan qinghua et al. [24] used this model to conduct research on water resource allocation at different regional scales in the Beijing–Tianjin–Hebei region, Beijing, the Pishihang irrigation district, and Wu’an city, respectively, obtaining reasonable allocation results. The above research results show the applicability and stability of the GWAS model. However, with the continuous refinement of water resource management, application research needs to be carried out in different regions to provide technical support for the dynamic allocation and management of regional water resources.
In recent years, in order to strengthen water resource management, Handan City has established the red line of total water use control, the red line of water use efficiency control, and the relevant control index system, as well as improving the relevant management system and management system. It has successively implemented the Eastern ecological water network project, the Yellow River Diversion Project, the Middle Route Supporting Project of the South to North Water Transfer Project, and the Groundwater Over-Exploitation Comprehensive Treatment Project, among others [25]. The regional water supply source structure, the water supply network system, and the pattern of water demand in the industry have all changed, but the problem of water shortage still exists. The way in which to accurately allocate and manage the limited water resources in the region is a practical problem that Handan City urgently needs to solve.
On the basis of the above background, we selected Handan City as the study area, taking 2020 as the current year to build the GWAS model of Handan, using the non-dominated sorting genetic algorithm (NSGA II-S) with the elite strategy to solve it, so as to achieve the optimal allocation of water resources in the normal (p = 50%) and dry (p = 75%) years of 2025 and 2035 in Handan City. This was done in order to support the refined management of regional water resources and regional sustainable development. The research results can provide a decision-making reference for regional water resources refinement management under the new situation, as well as providing a scientific basis for improving the efficiency of water resource utilization and ensuring sustainable economic and social development in the region.
2. Overview and Data Sources of the Study Area
2.1. Overview of the Study Area
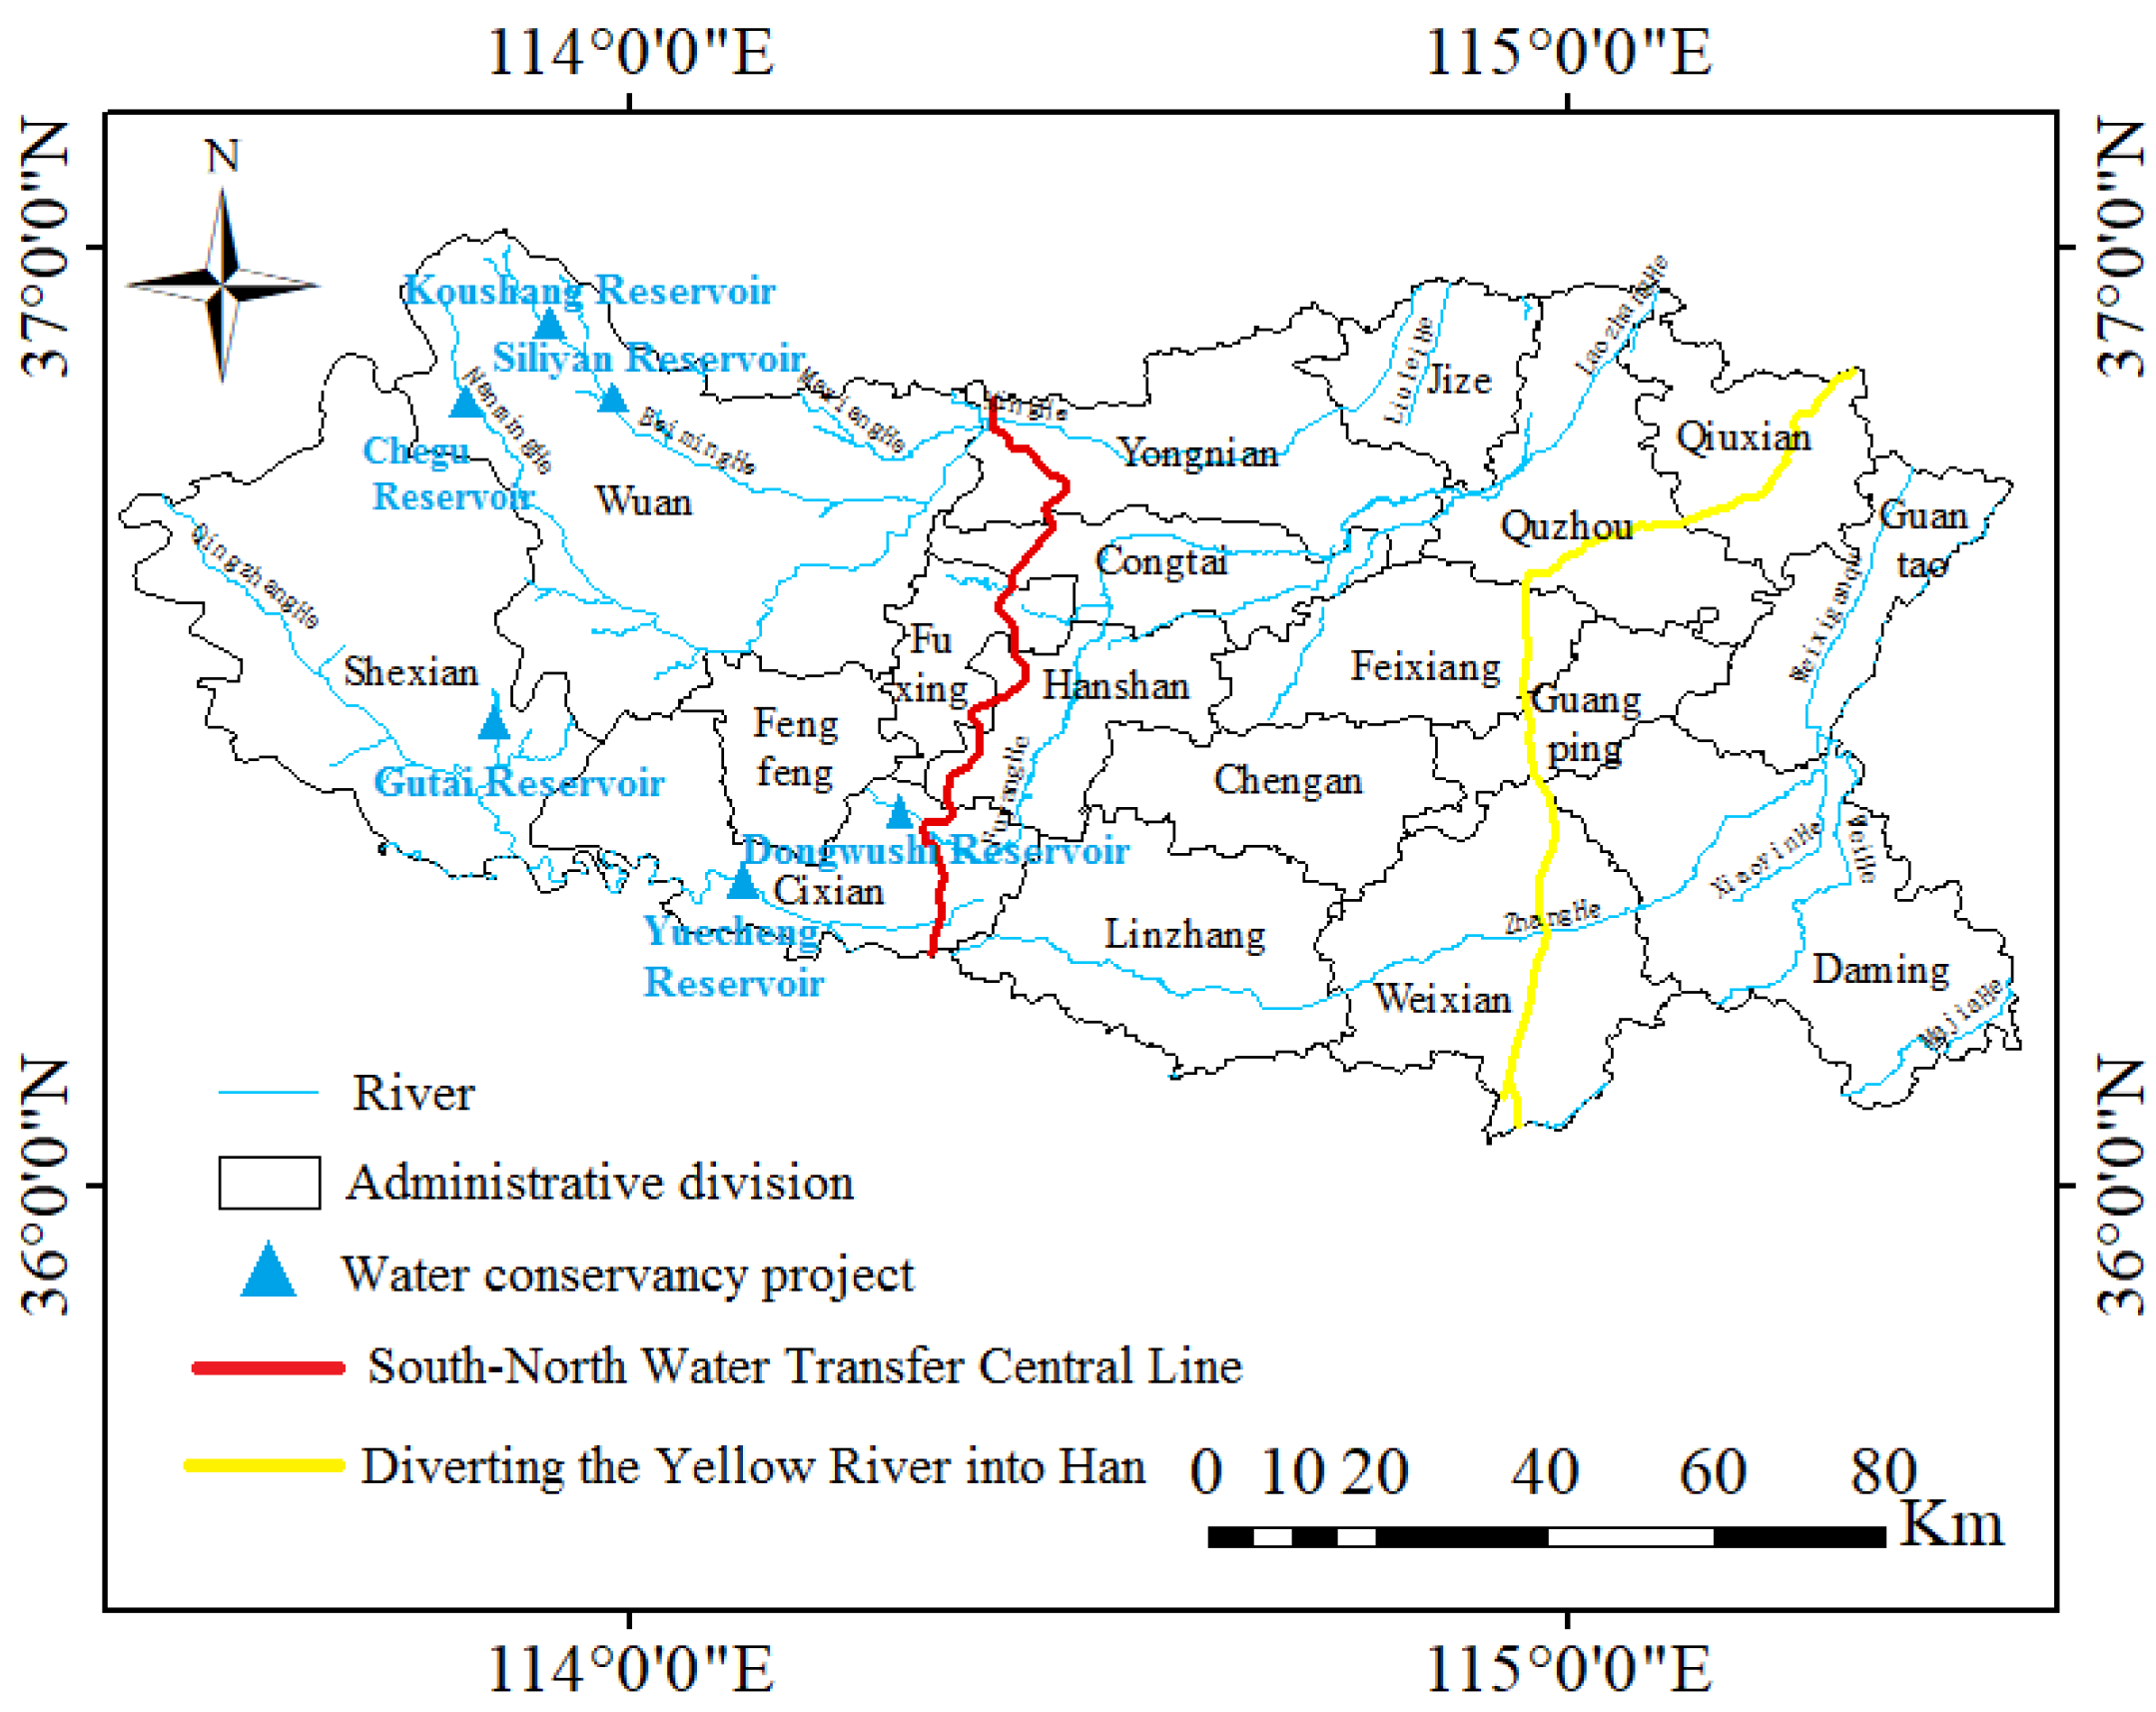
The geographical location, administrative division and water resources division of the study area are shown in Figure 1. The region is located in the warm temperate semi-humid semi-arid continental monsoon climate zone, with an annual average precipitation of 513.8 mm (1980~2016 sequence), and there is an imbalance in the distribution. In terms of time, 70% of the annual precipitation is basically concentrated with from July to August each year, and there is a large difference between each year. Spatially, affected by the high terrain in the west and low in the east, the western mountains in the same period had more precipitation than in the eastern plains. The annual average water resources were 1.088 billion m3, and the per capita water resources were 118 m3 (1980–2016), which is at a low level nationwide and is considered a resource-based water shortage. The region is also dominated by traditional high-energy-consuming industries and high-water-consuming agriculture, and the added value of six high-energy-consuming industries such as ferrous metal smelting, non-ferrous metal smelting, and electric power and heat production accounts for more than 50% of the industries above the designated size. The development and utilization of the total amount of water resources were at a high level. Due to the dependence on a large number of over-extracted groundwater resources in recent decades to maintain domestic and production water, some parts of the eastern plain have experienced problems such as groundwater level decline, surface settlement, and scrapping of machine wells.
It can be seen that Handan is not only a strong economic city with prominent industries in the Beijing–Tianjin–Hebei region but that it is also a city with limited water resources. Groundwater resource is the main water supply source, and agriculture and industry are the main water users, and therefore the contradiction between water supply and water consumption is extremely prominent. In the future, it is necessary to refine the regional configuration scale, optimize the composition of water supply, realize the refined management of water resources, and improve the industrial structure, so as to support the green and high-quality development of the region.
2.2. Data Sources
3. Forecast of Water Supply and Demand in the Planning Year
As a key year for building a moderately prosperous society in all respects and achieving the first centenary goal, 2020 will have a profound impact on future regional development, so 2020 was chosen as the benchmark year. The planning years were set at the end of the “Fourteenth Five Year” and “Sixteenth Five Year” development plans, i.e., 2025 and 2035, respectively.
A comprehensive planning of water resources in these two years can not only reveal the regional development problems but also facilitate the timely strategic adjustment in response to the development trend. Therefore, the water supply and demand of 18 districts and counties under the jurisdiction of Handan City were predicted under the normal and dry conditions. For the comparison and analysis of water demand prediction methods, the quota method can be adjusted dynamically according to various factors and policies, and it is widely used. Therefore, this method was selected for prediction. The domestic and agricultural water demand in the planning year was predicted by referring to the relevant indicators of the Hebei Water Quota for Living and Service Industry (DB135450.1-2021), the Agricultural Water Quota (DB135449.1-2021, planting industry), and the Agricultural Water Quota (DB135449.2-2021, aquaculture industry). Due to limited data collection, ecological water demand was calculated by the per capita ecological water demand quota [22]. Considering the strictness of total water consumption control and water intake permit approval in Hebei Province, as well as the promotion of “water-based production” in the future, and on the basis of the characteristics of enterprise water intake permit with a certain number of years, the water volume of enterprise water intake license approved by Handan in the current year was taken as the upper limit of the industrial water demand in the 2025 planning level year. On this basis, the industrial water demand in 2035 was predicted. According to the comprehensive analysis of the demands of the above industries, the total water demand of Handan in 2025 will be 25.40 × 10⁸ m3 and 29.40 × 10⁸ m3 in normal and dry years, respectively (see Figure 2 for water demand of different industries in different districts and counties). The total water demand in normal and dry years in 2035 will be 26.21 × 10⁸ m3 and 29.81 × 10⁸ m3, respectively; water demand of different industries in each district and county is shown in Figure 3.
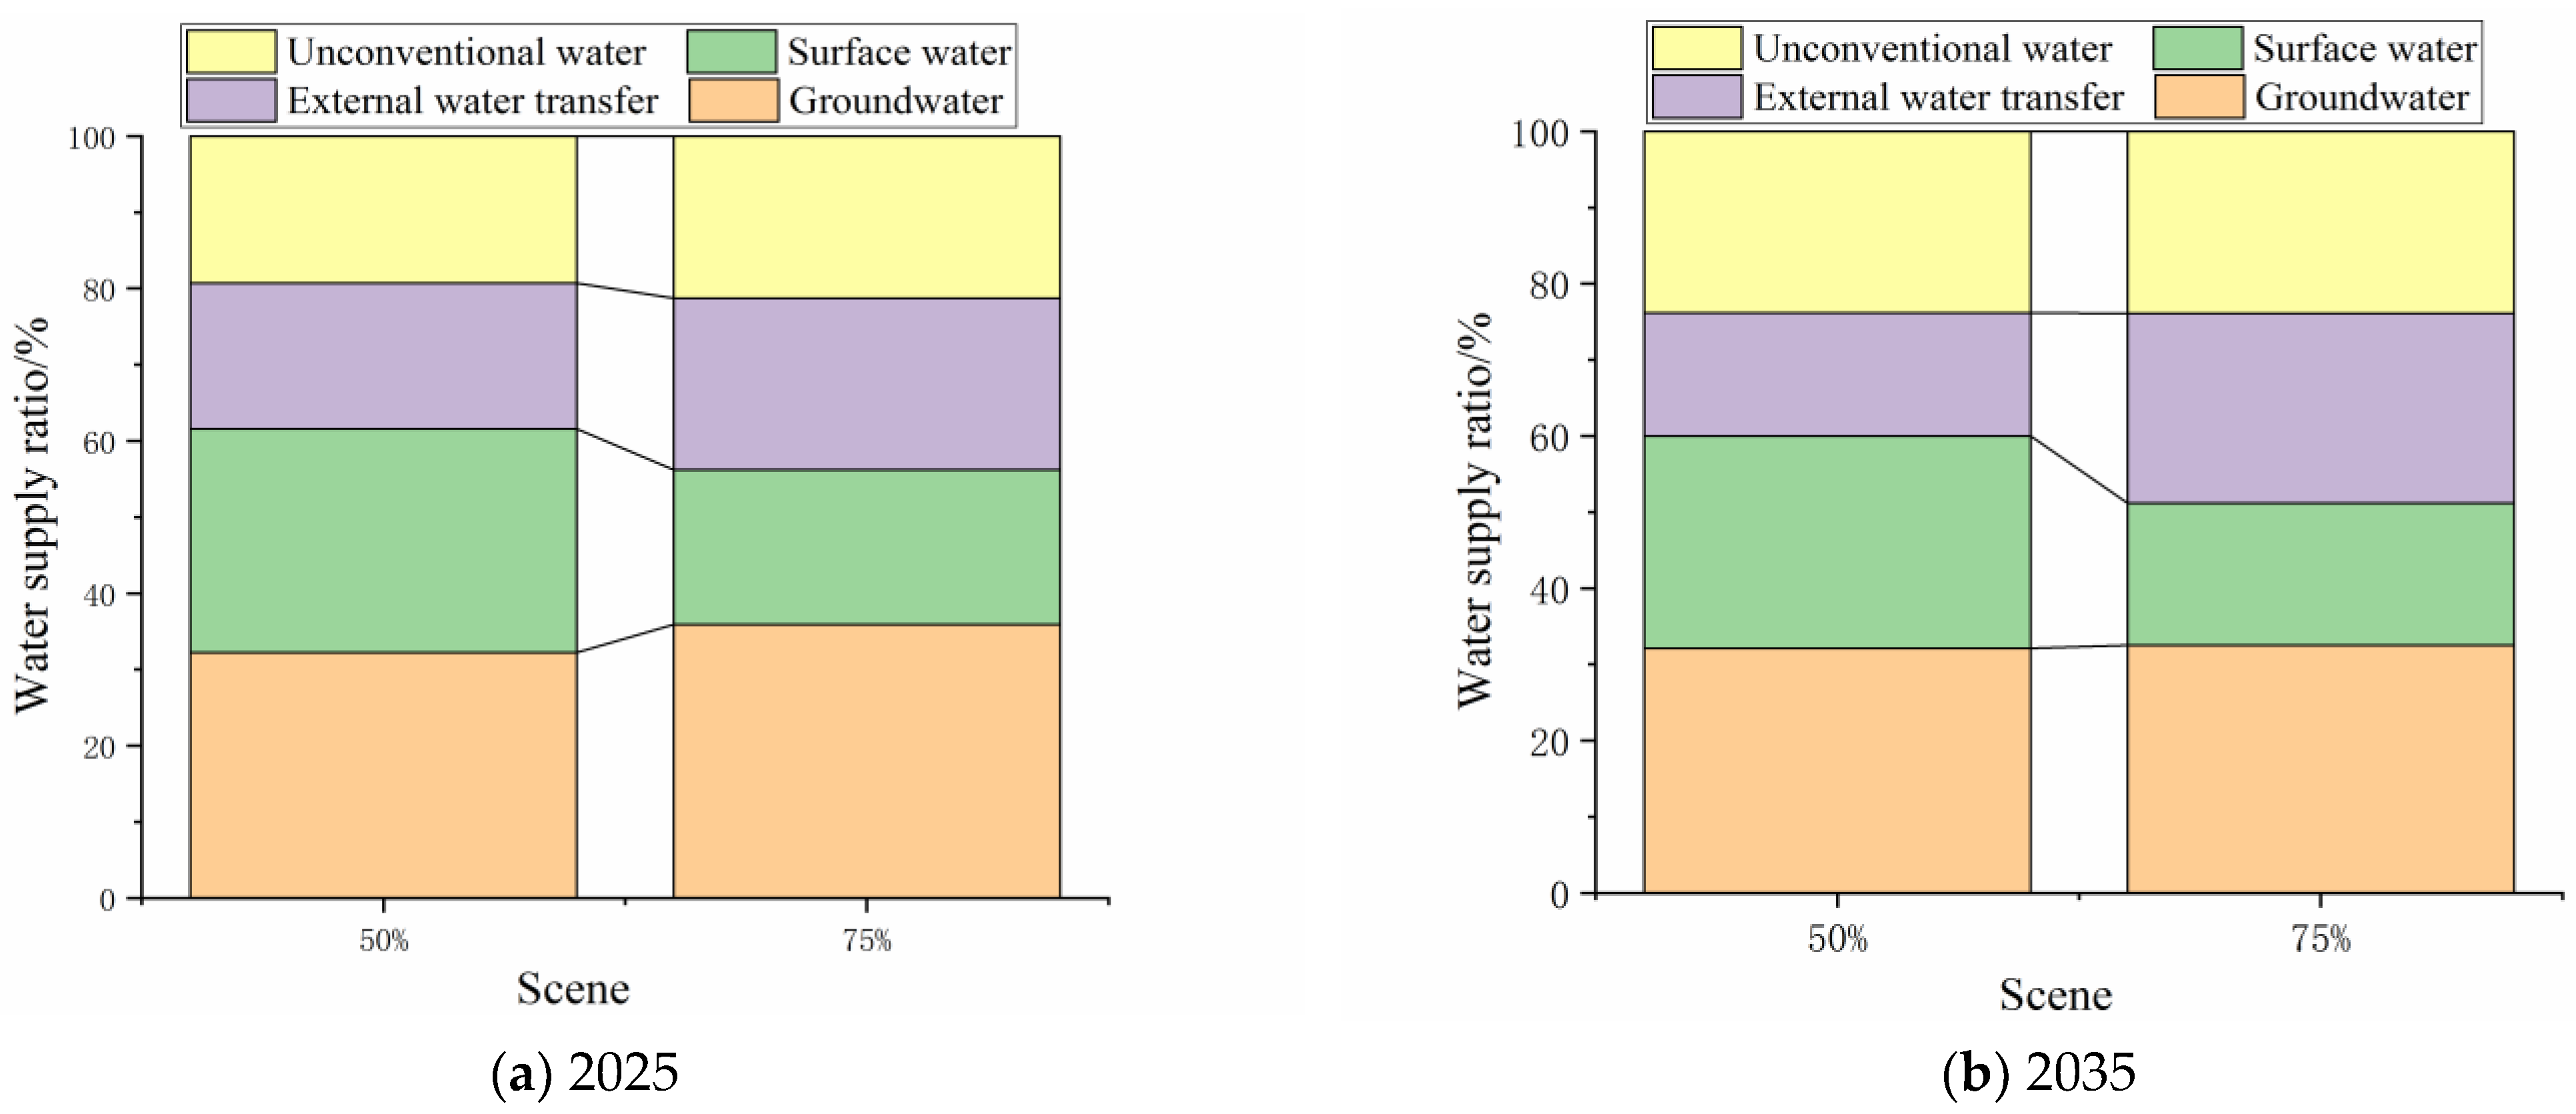
On the basis of the analysis of the current annual water supply and demand structure of Handan City, the latest water resource evaluation results of Hebei Province (1956~2020 series), combined with the red line index of total groundwater use in Handan City, were taken as the basis for the regional surface water supply and shallow groundwater exploitation. In the background of the implementation of the Regulations of Hebei Province on Water Conservation, considering the implementation of water-saving measures such as reclaimed water reuse by enterprises, the water supply of reclaimed water and mine drainage stations were included in the calculation of regional water supply. The available water supply of reclaimed water was predicted according to the sewage recycling of urban domestic water consumption and industrial water consumption. The mine drainage was calculated according to the underground unconventional water permit of Handan City. Through prediction, in 2025, the available water supply of Handan in normal and dry years will be 22.42 × 10⁸ m3 and 20.99 × 10⁸ m3, respectively. In 2035, the available water supply in normal and dry years will be 25.02 × 10⁸ m3 and 23.31 × 10⁸ m3, respectively. Figure 4 reflects the proportion of available water supply of each water source under different scenarios in 2025 and 2035. Due to the prominent phenomenon of rain-fed agriculture in the region, agricultural water shortage is essentially normal, and 2020 was a dry year, making the current regional water supply predicted under the flat dry scenario in different planning years lower than the total water demand.
4. The Water Resources Optimal Allocation
4.1. Regional Model Construction
The construction of the regional GWAS model mainly involves the optimization module of water resource allocation [9]. The goal of balance between supply and demand of water resources involves multiple goals such as industrial water security, water supply equity, and sustainability. The fairness optimization and the minimum water shortage rate of water supply are used as the objective function of the optimal allocation of water resources. The fairness of water use in different units of each industry is reflected by the variance index of the water shortage rate of the industry spatial unit, and the satisfaction of the industry water load in the water use unit is reflected by the minimum index of the water shortage rate. The definitions, expression formulas, variables, and parameter meanings of each objective function and constraint are described as follows.
4.1.1. Objective Function
(1) Fairness optimal objective function. This is represented by the difference degree of the water shortage rate among districts and counties. The smaller the degree of difference, the smaller the value of the objective function, reflecting better fairness of the configuration. On the contrary, the fairness of the allocation between towns is worse. The expression is as follows:
where is the fair objective; is a fairness function; is the penalty function for industry users; is the water shortage rate of industry user in unit of district and county; is the average water shortage rate of industry user in unit of district and county; is the number of years in the calculation period; is the monthly value of the year; is the number of industrial water types; is the number of area units.
(2) Minimum objective of water shortage rate. This is characterized by the degree to which the water supply allocated in the whole region meets the water demand. The lower the water shortage rate, the more regional water demand can be guaranteed. On the contrary, the demand for water is not easy to be met. The expression is as follows:
where is the objective of water supply stress; is the water supply stress function; is the penalty function for industry users; is the water shortage rate of industrial user in district/county unit ; is the ideal value of water supply stress objective in each month of regional industrial user ; is the number of years in the calculation period; is the monthly value in the year; is the number of industrial water types; and is the number of regional units.
(3) General objective. This is the weighted sum of the above equity objective and water scarcity objective. The smaller the function value, the better the global allocation result of water resources. The expression is as follows:
where is the general objective, is the objective of fairness, is the weight of the fairness objective function, is the objective of the water shortage rate, and is the weight of the objective function of the water shortage rate.
4.1.2. Constraints
(1) Constraints on water resource carrying capacity. The total water supply of each water source to different industries of each district/county unit shall not exceed the total available water supply of the water source.
where is the total water supply of each industry from each water source to unit u in different districts and counties, and is the amount of water supplied by source to district/county unit , .
(2) Water demand constraints. The water demand of each district/county shall be between the corresponding maximum and minimum water demand.
where , are, respectively, the maximum and minimum water demand of district/county unit in each industry , .
(3) Water transport capacity constraints. The total water supply of each source shall not exceed the upper limit of the water transfer capacity of the source:
where is the upper limit of water transmission capacity of water source to supply water to each district/county unit , .
(4) Constraints of water supply by quality. Considering the water quality requirements of different users, the water supply of the source meets the constraint conditions of the water supply standard:
where is the water quality supplied by water source to user , and is the user’s minimum water quality standard.
(5) Ecological flow constraints. The river flow shall meet the restriction conditions of river ecological base flow.
where is the flow of river channel in period , and is the minimum water consumption of the river in the period .
(6) The decision variable is non-negative constraints. The water supply is not negative:
where is the upper limit of water transmission capacity of water source to the district/county unit user of all industries, .
4.2. Construction of Regional Water Supply and Consumption Network
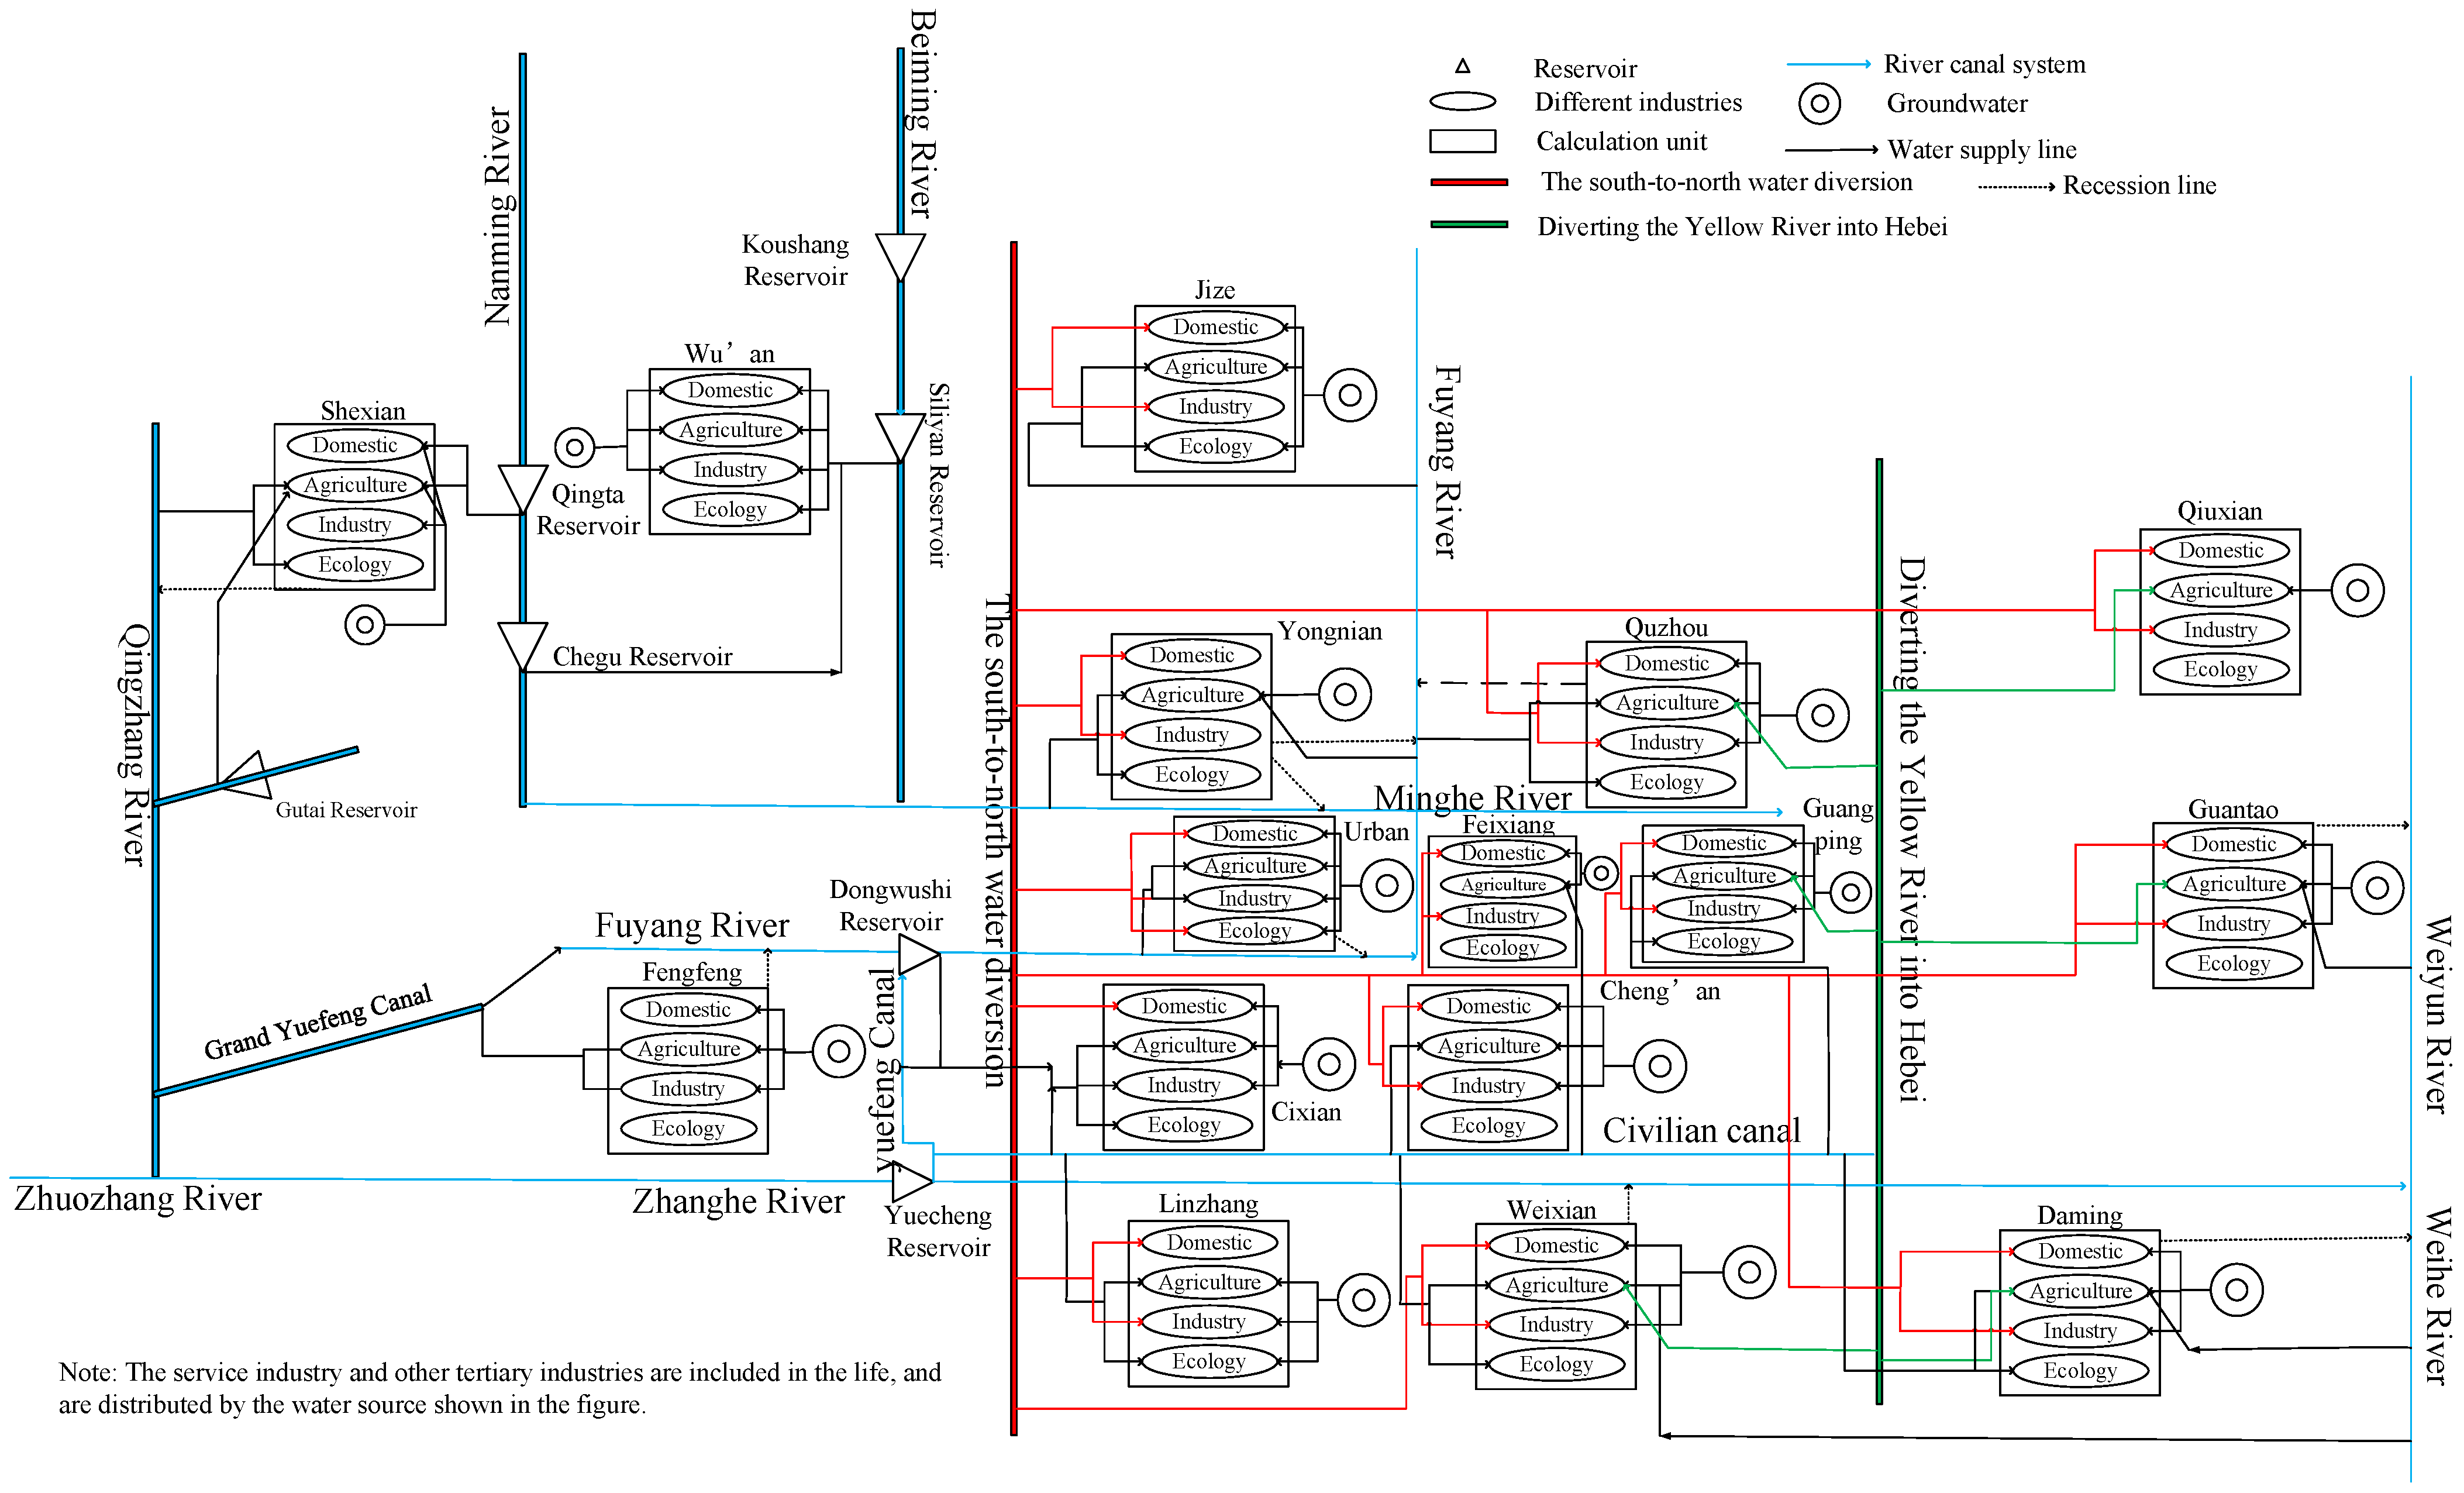
On the basis of the scale and distribution of water conservancy projects, the industrial structure of different districts and counties, and the quantity and temporal and spatial distribution of other water supply sources, a network diagram of the water resource system in Handan City was constructed (Figure 5). The water supply plan for Handan City was given the following priorities by fully considering the water use characteristics and water quality requirements of various industries and combining them with the water supply capacity of water sources: (1) Regional surface water. Optimize the joint operation of seven reservoirs, namely, Koushang Reservoir, Qingta Reservoir, Chegu Reservoir, Siliyan Reservoir, Dongwushi Reservoir, Gutai Reservoir, and Yuecheng Reservoir. The allocation of water resources shall be carried out in the order of giving priority to the protection of urban and rural domestic water and following the order of ecological environment water, industrial production water, and agricultural irrigation water. (2) Make full use of unconventional water sources such as reclaimed water and mine drainage to supplement industrial water. (3) Reasonable exploitation of groundwater. According to the strict control of groundwater exploitation in the Regulations on Groundwater Management of Hebei Province, the exploitation and utilization of deep groundwater will not be considered in the planning annual allocation. Shallow groundwater will be used for urban and rural life to supplement industrial production and agricultural irrigation water. On this basis, the water supply relationship between the water source and the water industry in the district/county is further clarified, and the topological relationship between the water supply in different districts and counties is determined so that the model can accurately analyze the relationship between water supply and use among water sources, units, and industries.
4.3. Model Parameter Adjustment
The GWAS model is based on the natural–social dual water cycle theory. The model architecture describes the integration process of the natural–social water resource system. Through this architecture, the input and output of the natural–social water resource system and the dynamic mutual feedback relationship between them can be realized, as well as the precipitation, surface water, soil water, groundwater, transpiration, water supply, water consumption, drainage process, and flux. Figure 6 shows the structural framework of the GWAS model.
The model parameters include water supply parameters, water demand parameters, comprehensive parameters, and optimal allocation parameters. On the basis of analyzing the water resource system network of Handan City, the water supply parameters were mainly found to be reservoir characteristic parameters, thus forming the topological network of reservoir → district/county water supply and consumption, obtaining the water volume data of each water source period. Water demand parameters mainly refer to the water demand of different industries in various districts and counties. On the basis of the above water supply and consumption parameters, according to the situation of districts and counties, the authors of [23] further set the water division ratio of the water source industry as the weight parameter of water supply of different water sources and then obtained the weight of water supply of each industry. It is pointed out in particular that “green” is the era background of “high-quality development”. Therefore, the ecological weight is improved only next to life and slightly higher than the industrial weight. The proportion of domestic, ecology, industry, and agriculture is 10:9:8:7.
As far as Handan city is concerned, this paper believes that the two objectives of optimal fairness and minimum water shortage rate are equally important, and thus the weight coefficients Kf and Ky of the total objective function were set to be 10. In terms of the optimization algorithm, the NSGAII- S algorithm was adopted, and the water quantity distributed by each water source to each water user was taken as the decision variable. Set optimization simulation parameters: the population size was 100, the gene length was 0, the crossover probability was 0.32, the mutation probability was 0.04, and the maximum number of runs was 1500.
4.4. Verification of Simulation Results
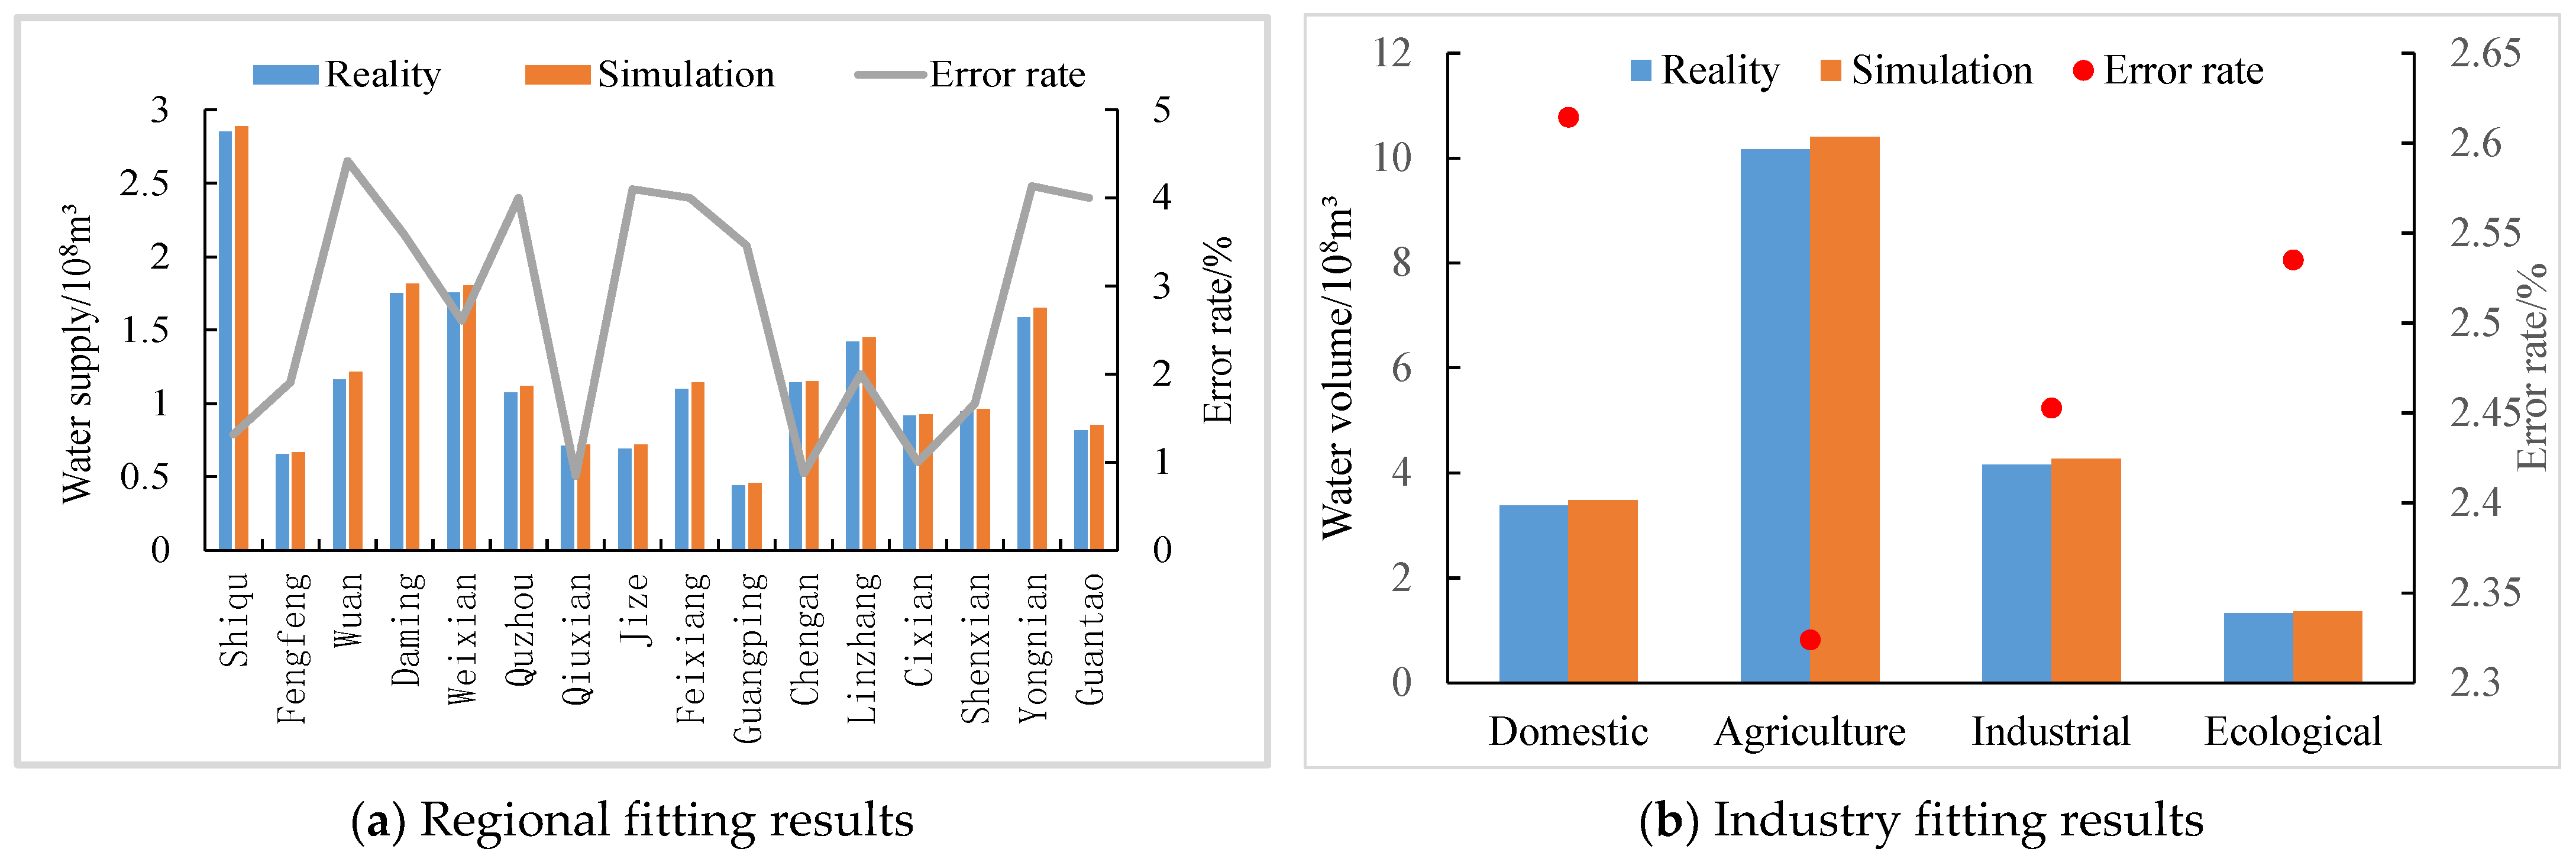
In order to comprehensively verify the rationality of model parameter settings and the exactitude of simulation accuracy, on the basis of the water consumption of each district, county, and industry in the current year of Handan City, the error rate between actual water supply and simulated water supply in each district and county was compared. According to the fitting results of districts and counties (Figure 7a), the error rate between actual water supply and simulated water supply was controlled below 5%. According to the industry fitting results (Figure 7b), the error rate was controlled within 3%. Further calculation of the correlation coefficient between actual water volume and simulated water volume showed that the correlation coefficients under the two fitting methods were greater than 0.95, indicating that the correlation between the two groups of data was good. The error rate and correlation were within the acceptable range, indicating that the above model parameters were set reasonably and the simulated water allocation results were more accurate.
5. Results and Analysis of Water Resource Allocation
5.1. Optimization Analysis of Water Resource Allocation
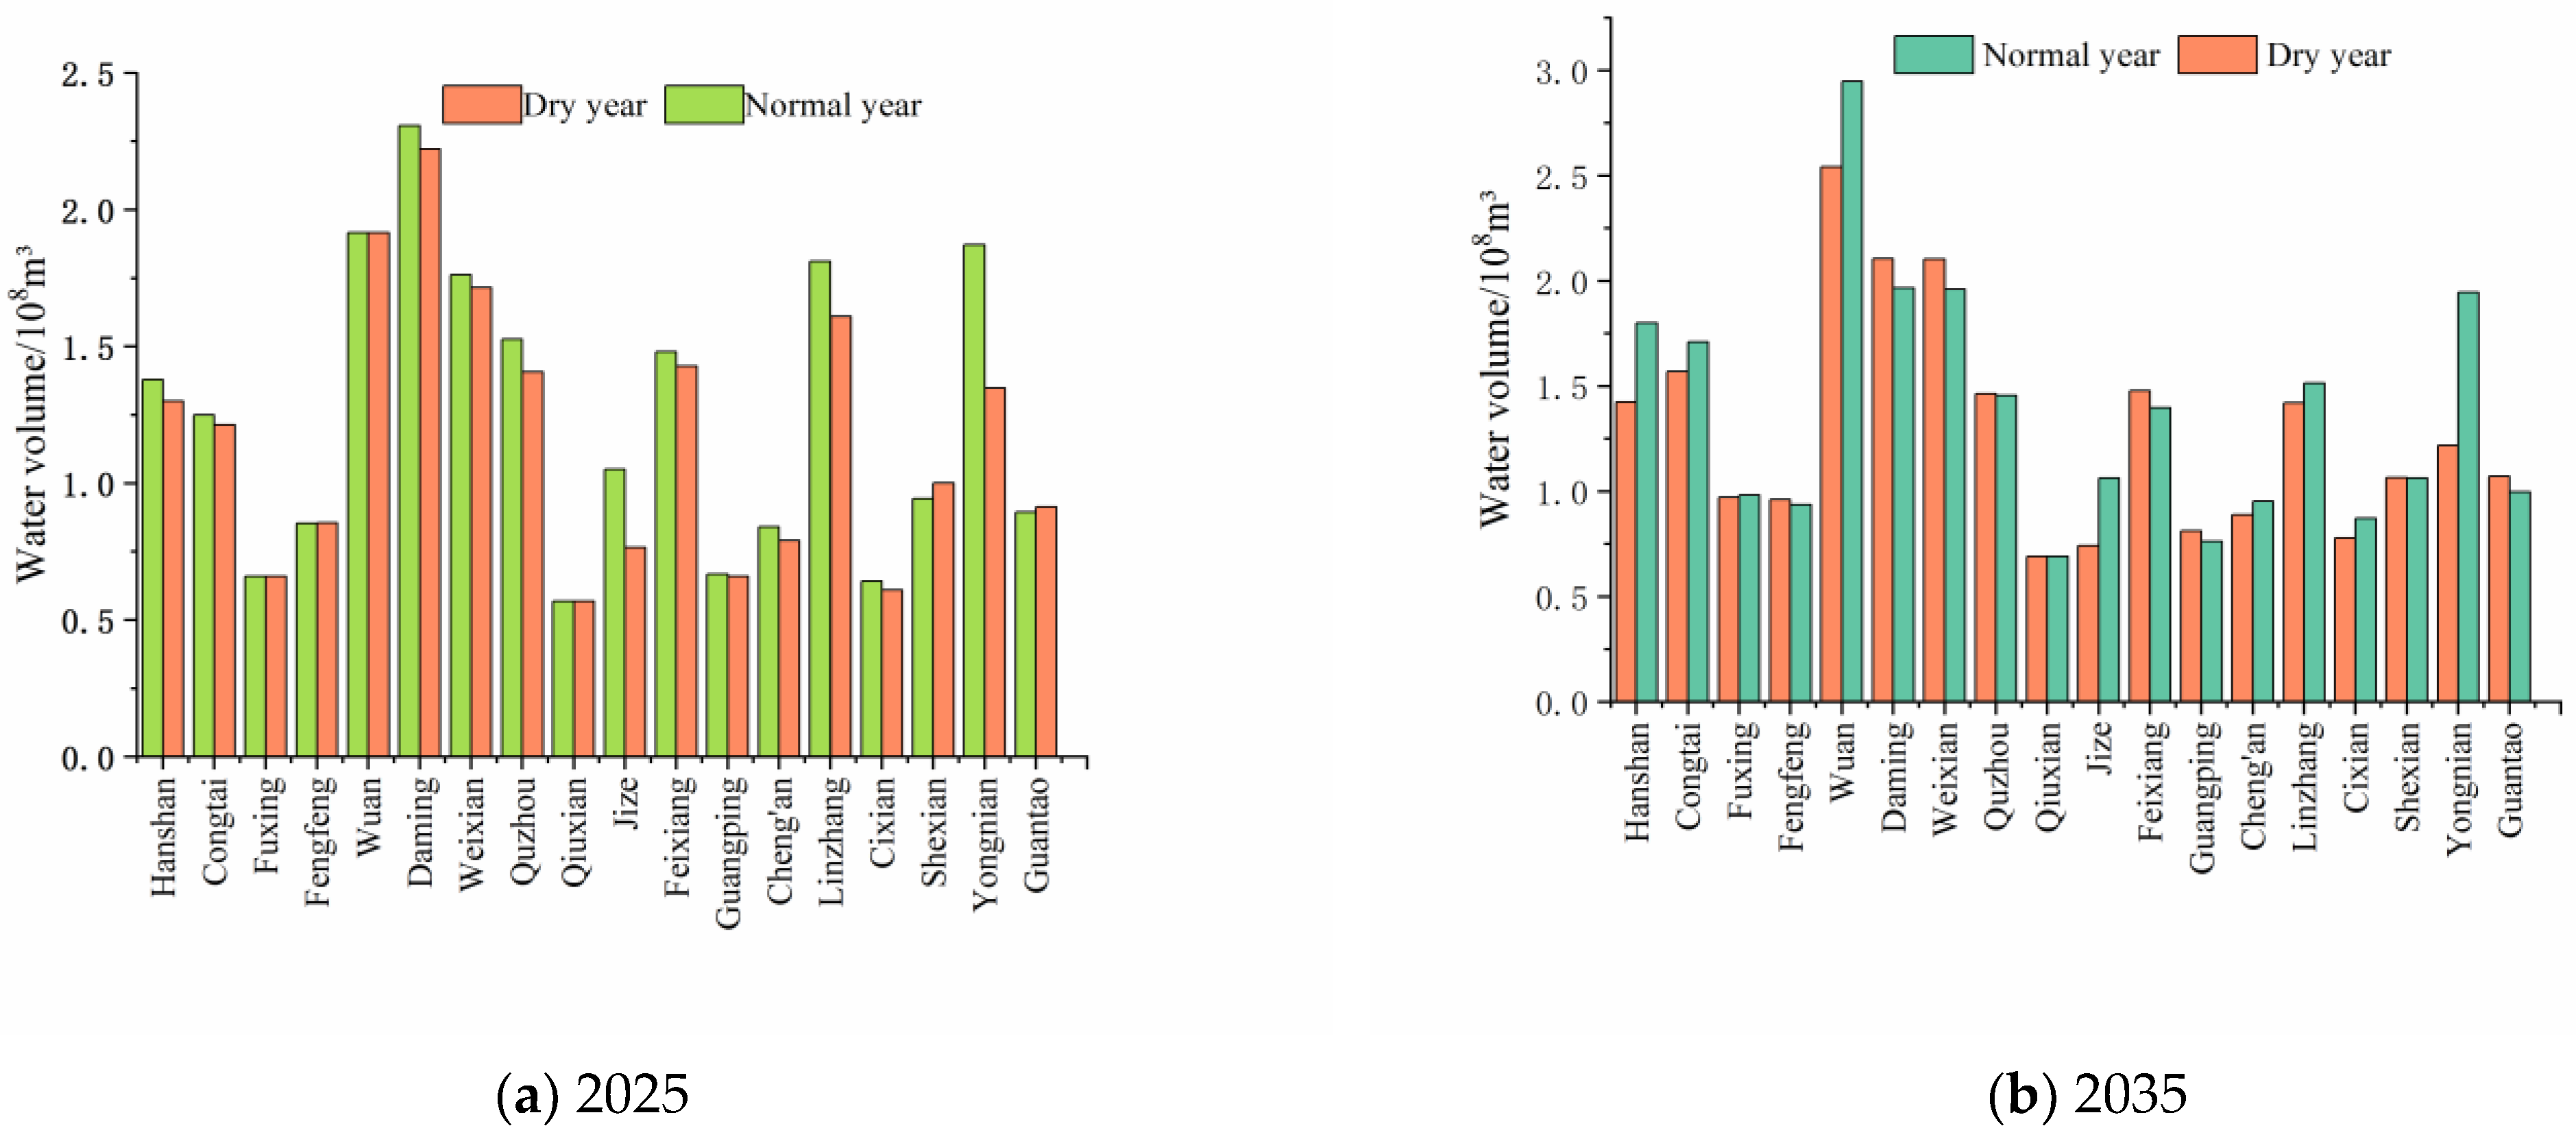
According to the prediction results of water supply and demand, on the basis of the objectives and constraints of the optimal allocation model of water resources, the GWAS model was used to optimize the allocation of water resources in Handan in 2025 and 2035. The results are shown in Figure 8. Although the allocation results of each district and county were different under the normal and dry conditions in different planning years, each district and county can be roughly divided into three grades according to the size of the allocated water volume. The first grade (1.80 × 10⁸ m3 < allocated water volume ≤ 3.00 × 10⁸ m3): Wu’an, Daming, Weixian, Linzhang, Yongnian. The second grade (1.00 × 10⁸ m3 < allocated water volume ≤ 1.80 × 10⁸ m3): Hanshan, Congtai, Quzhou, Jize, Feixiang, Shexian, Guantao. The third grade (0.25 × 10⁸ m3 < allocated water volume ≤ 1.00 × 10⁸ m3): Fuxing, Fengfeng, Qiuxian, Guangping, Cheng’an, Cixian. It can be seen that the water resource allocation in Handan City has a relatively significant spatial difference, and this distribution difference was similar in different planning level years and different scenarios.
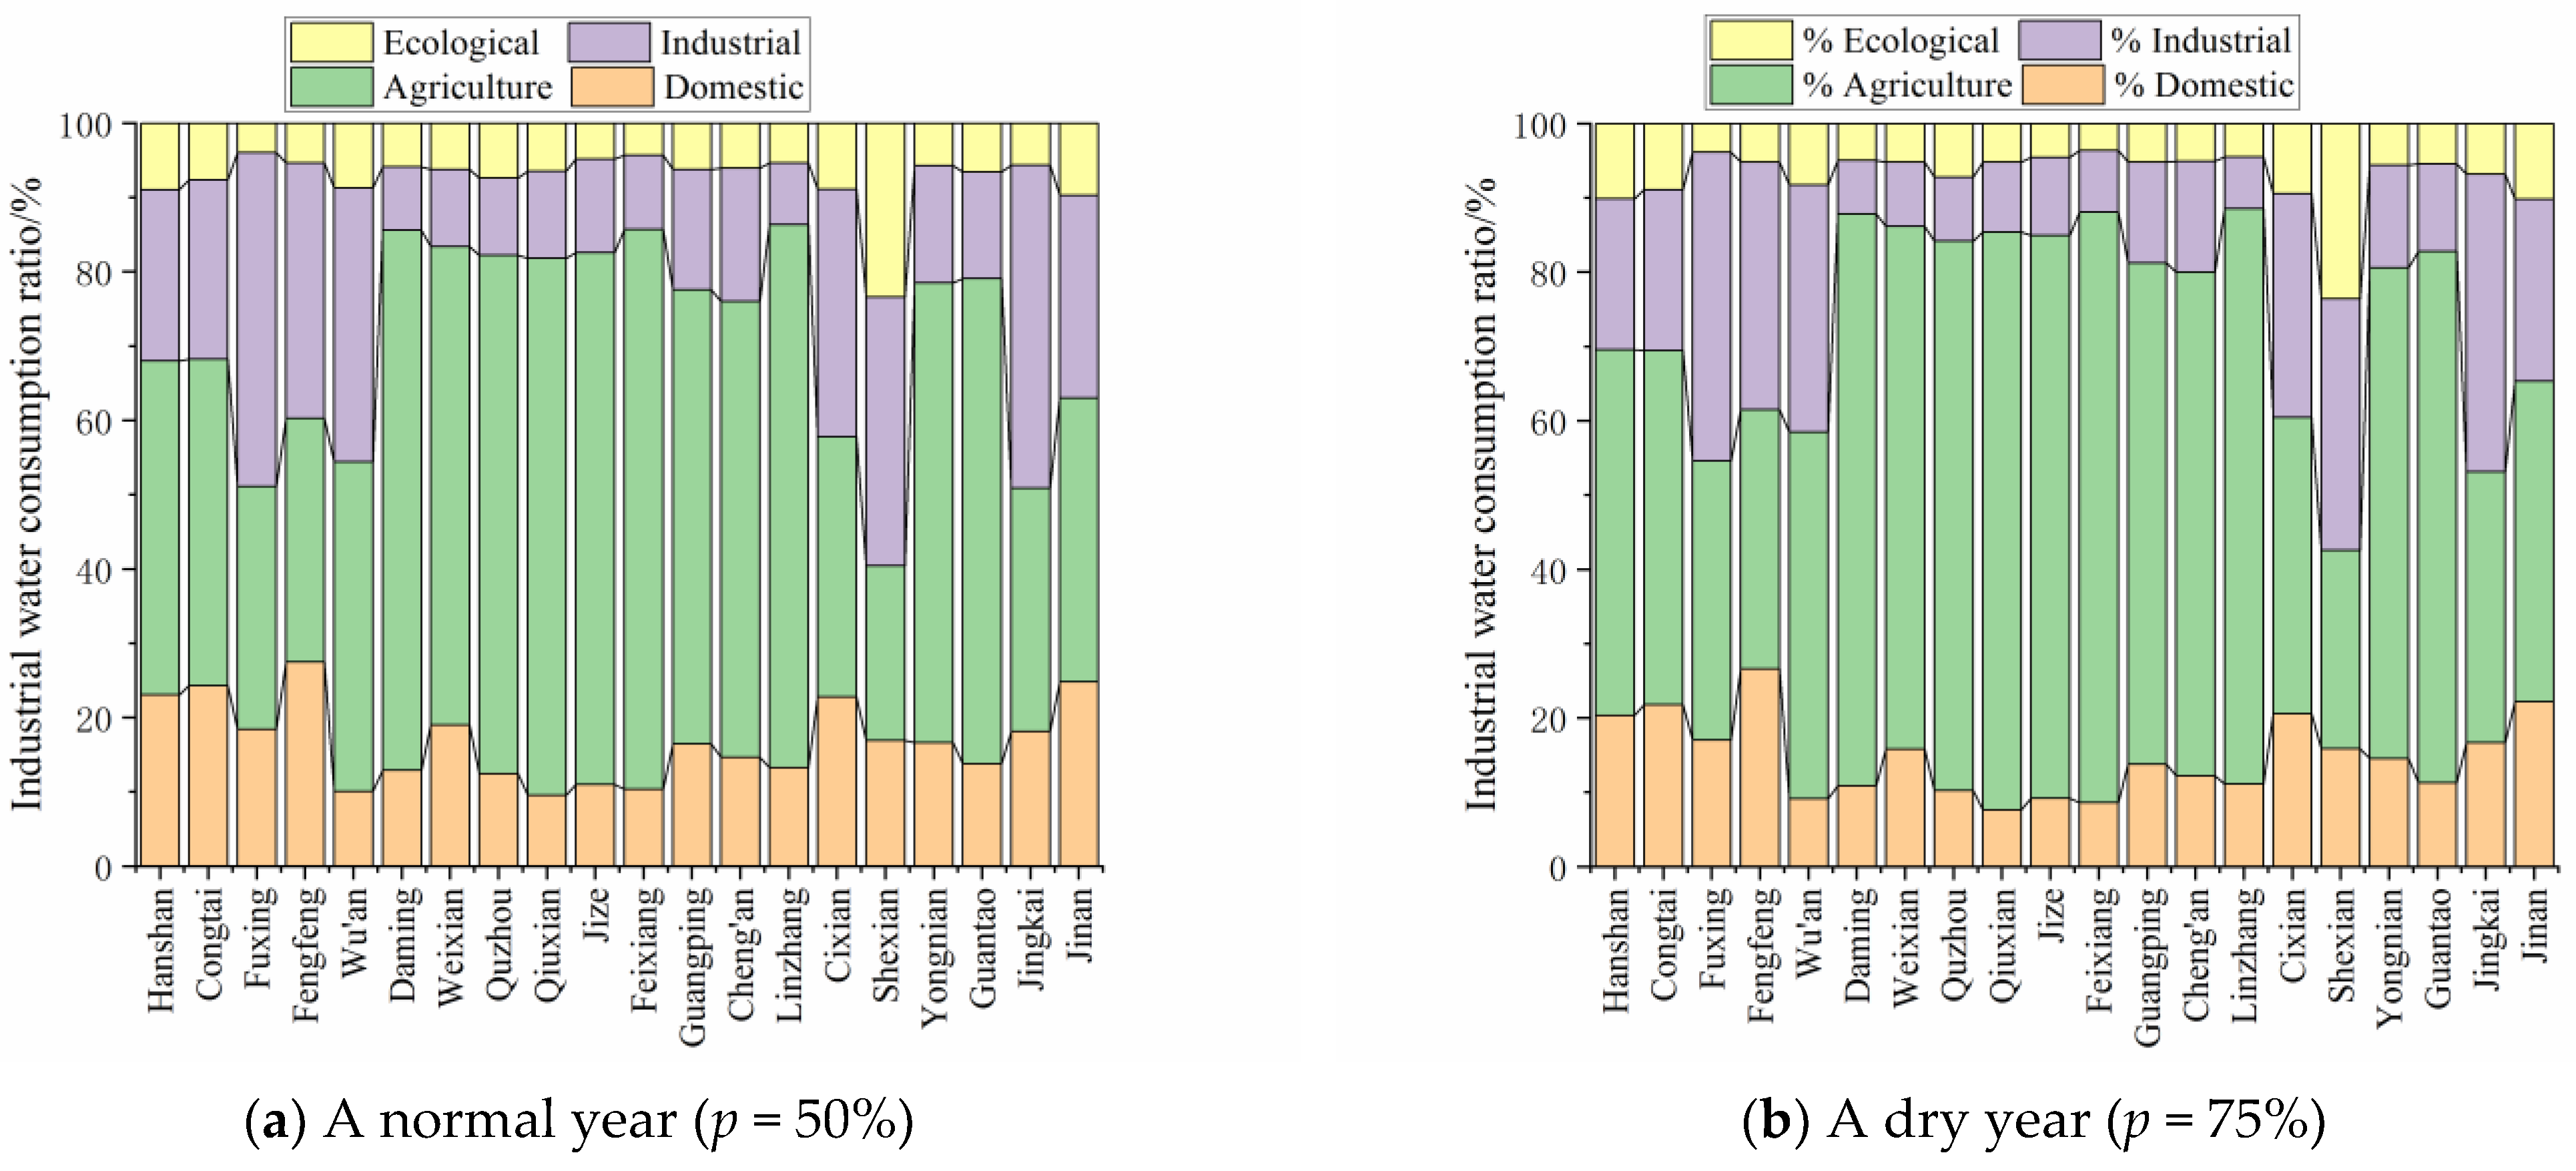
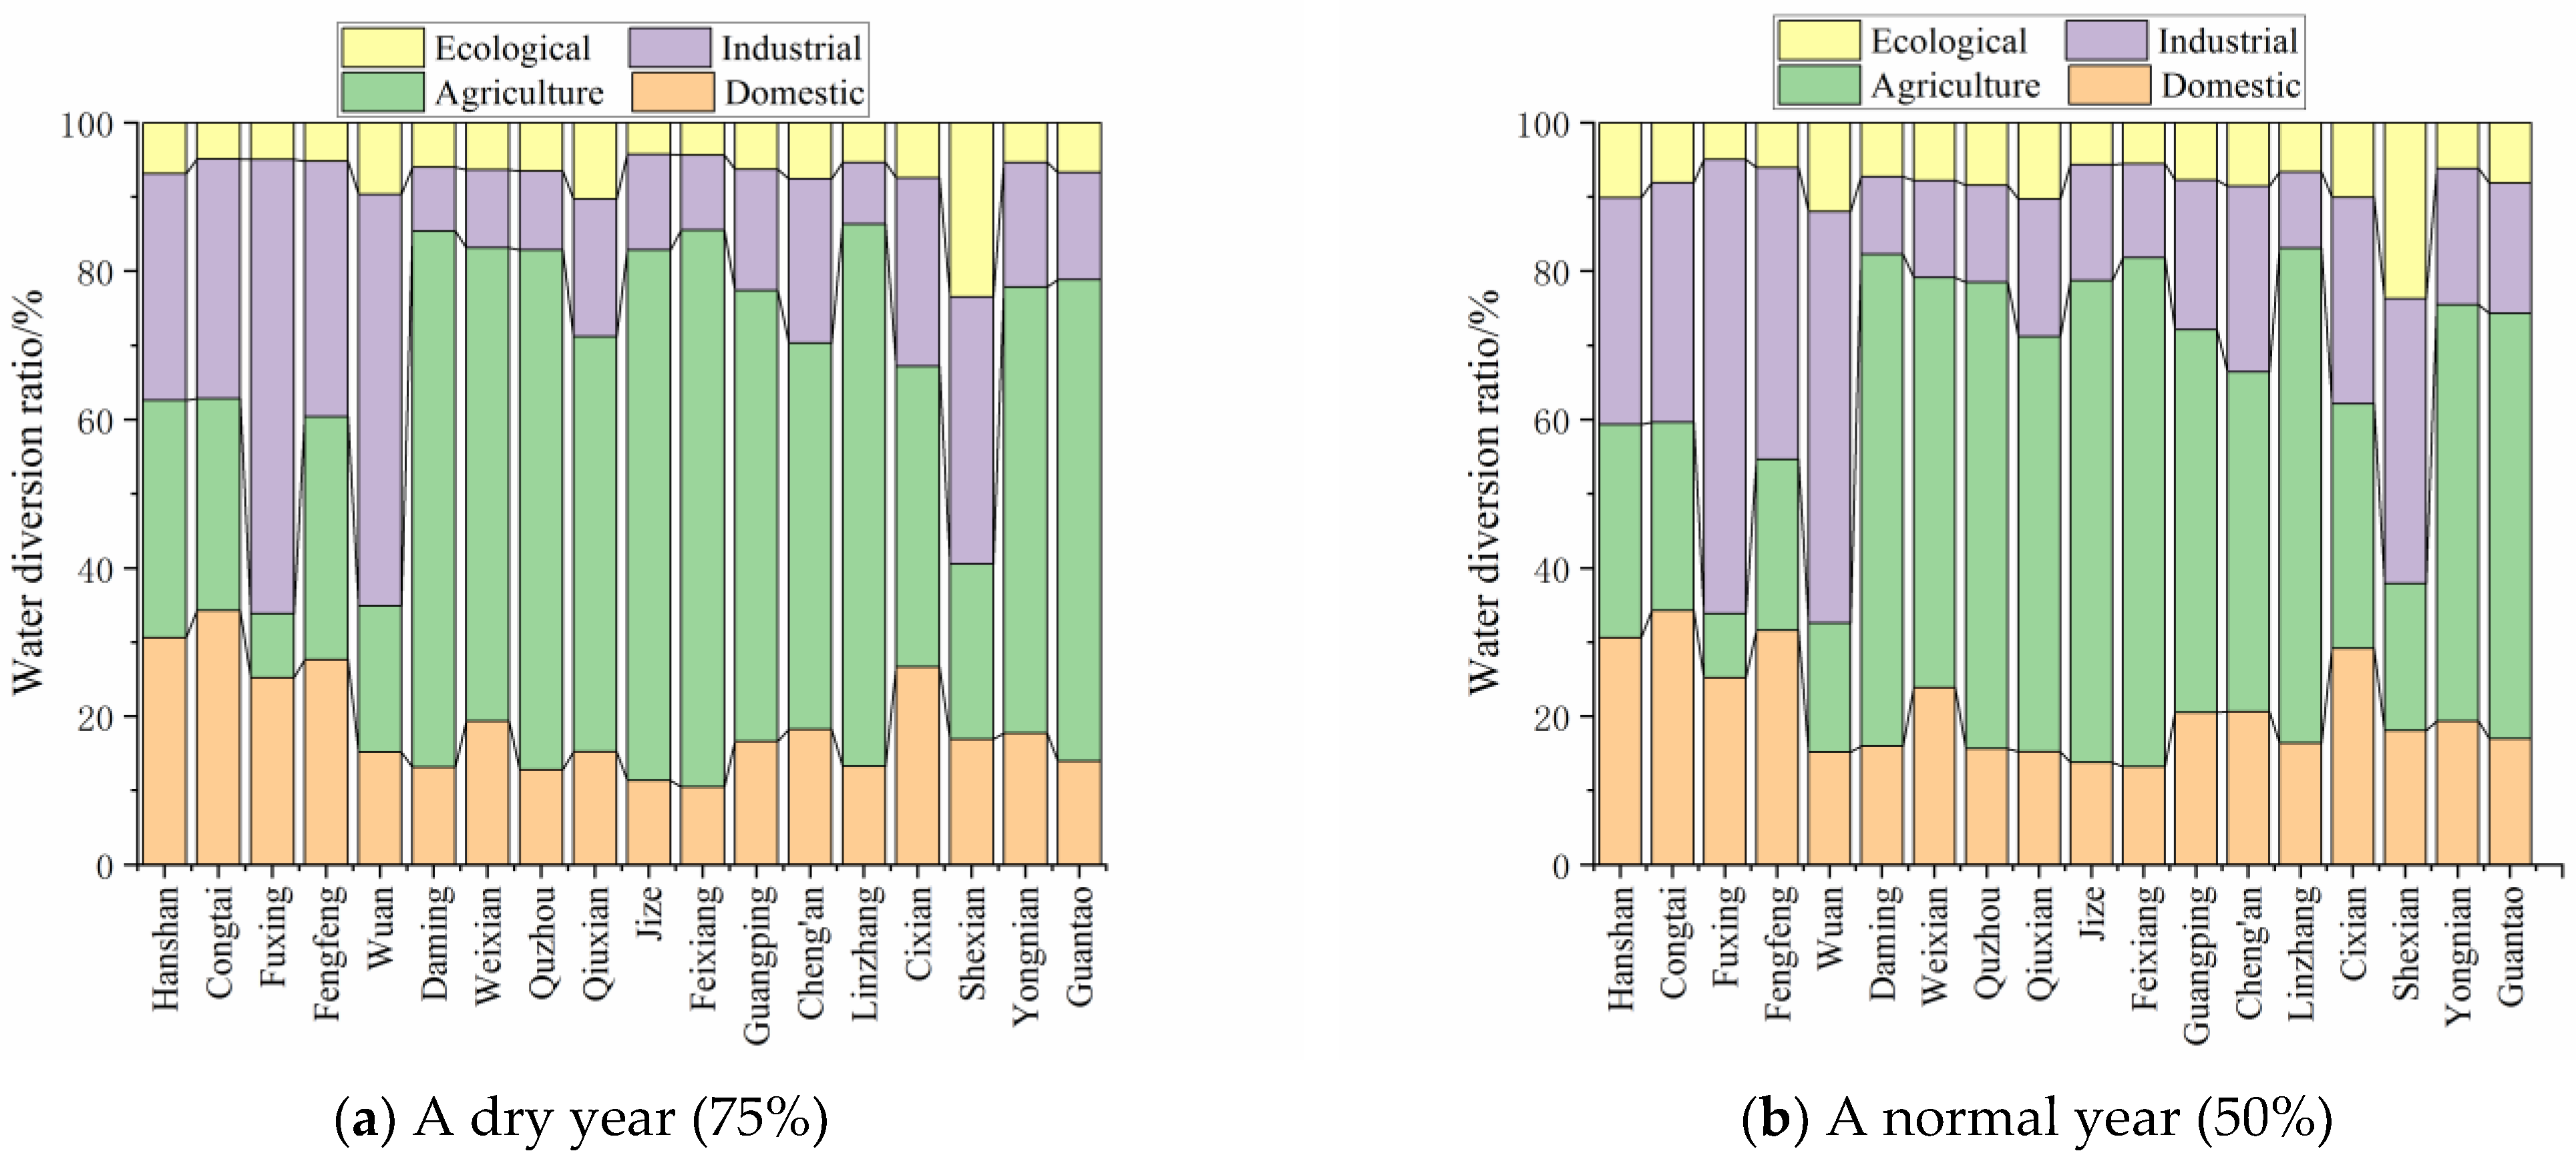
In view of the similarity of the spatial differences of the above allocation results, combined with the regional industrial structure distribution and the spatial characteristics of water resources, we optimized the allocation of water resources in major industries under different scenarios in different planning level years. The results are shown in Figure 9 and Figure 10. In 2025, the proportion of water allocated to major industries in all districts and counties will be essentially the same, regardless of it being a normal or dry year. Taking a normal year as an example, the proportion of domestic water allocation in all districts and counties was mostly between 15% and 35%. Congtai will be the highest proportion at 34.28%. The proportion of agricultural allocation water will generally be high, with the largest being Feixiang, at 68.63%. The next are Linzhang, Daming, Jize, and Quzhou, accounting for more than 60%. Except for Fuxing, other districts and counties will essentially be between 20% and 60%, and the proportion of agricultural water allocation in Fuxing will be less than 10%, at 8.61%. The largest proportion of industrial water allocation will be in Fuxing and Wu’an, accounting for 61.19% and 55.41%, respectively. Other districts and counties will essentially be between 10% and 40%. The proportion of ecological allocation water will generally be low, except for Shexian and Qiuxian, which will account for 10.30%; Hanshan, which will account for 10.09%; Wu’an, which will account for 11.96%; and Cixian, which will account for 10.06%; the proportion of other districts and counties will be between 3% and 10%.
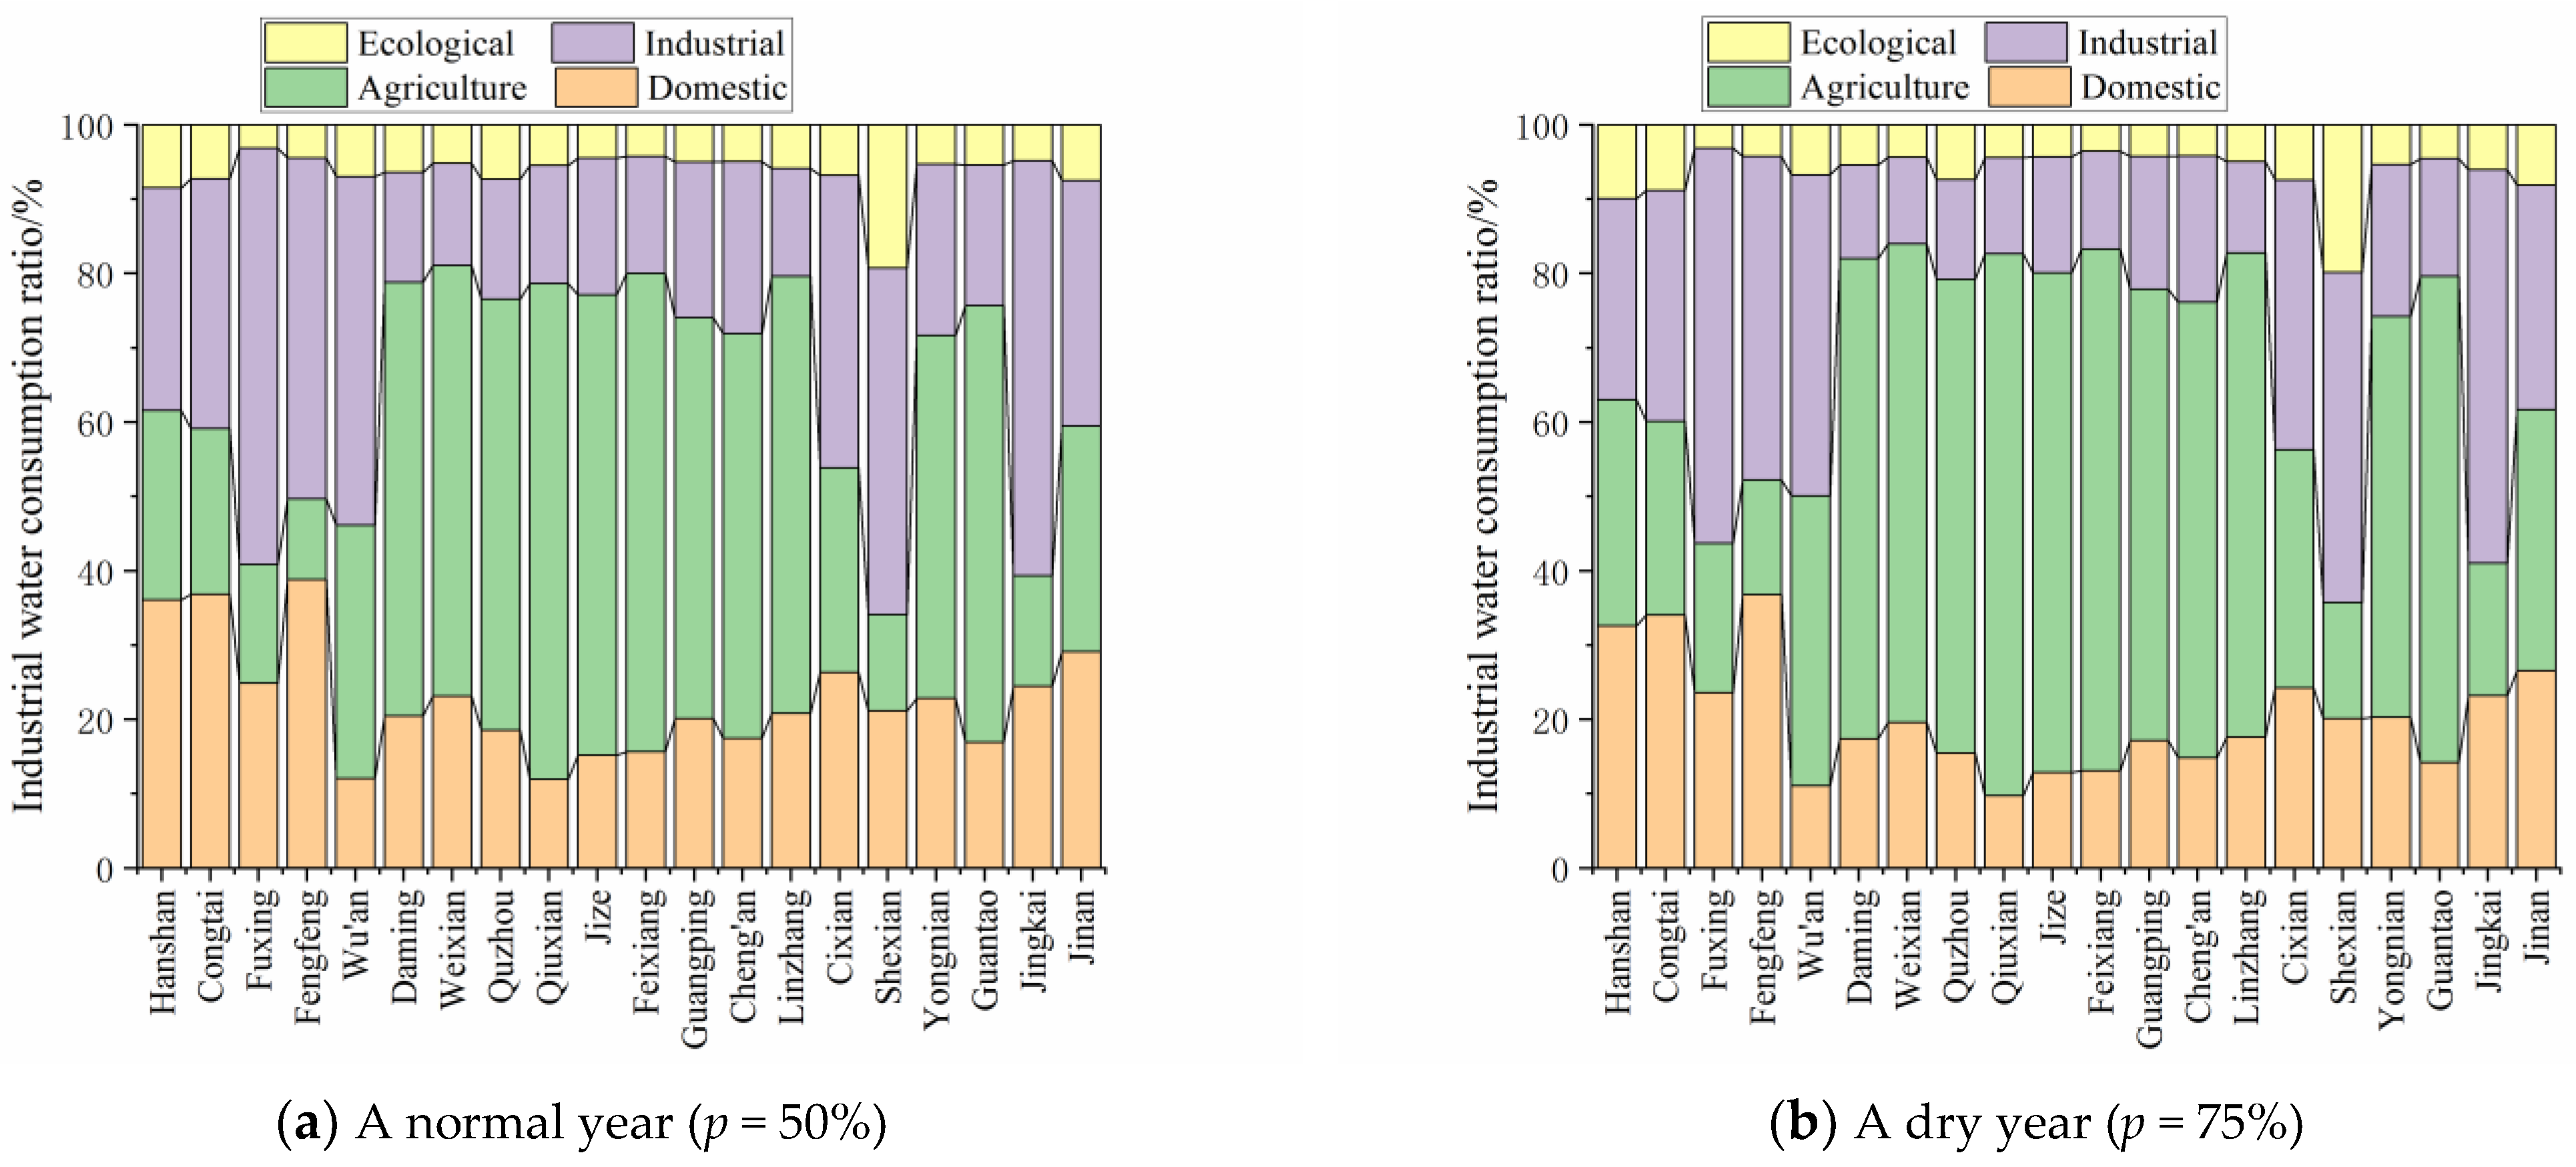
In 2035, the proportion of water allocated for domestic, agriculture, industry, and ecology in each district and county will be 22.51%, 42.11%, 29.33%, and 6.08%, respectively, in a normal year. In a dry year, the proportion will be 24.17%, 38.65%, 31.08%, and 6.10%, respectively. The proportion of agriculture is still the largest, but it will decrease significantly compared with 2025.
5.2. Analysis of the Water Shortage Rate
5.2.1. Analysis of the Regional Water Shortage Rate
We analyzed the regional water shortage under the same scenario in different planning years, as shown in Table 1. In 2035, the water shortage rate under the two scenarios of normal and dry years will be 4.54% and 21.80%, respectively, which will be improved compared with 11.69% and 28.61% in 2025. It shows that the regional implementation of the Regulations of Hebei Province on Water Conservation will achieve remarkable results. The water resources in the county can be reasonably planned, and the efficiency and quality of water resource utilization can reach a higher level.
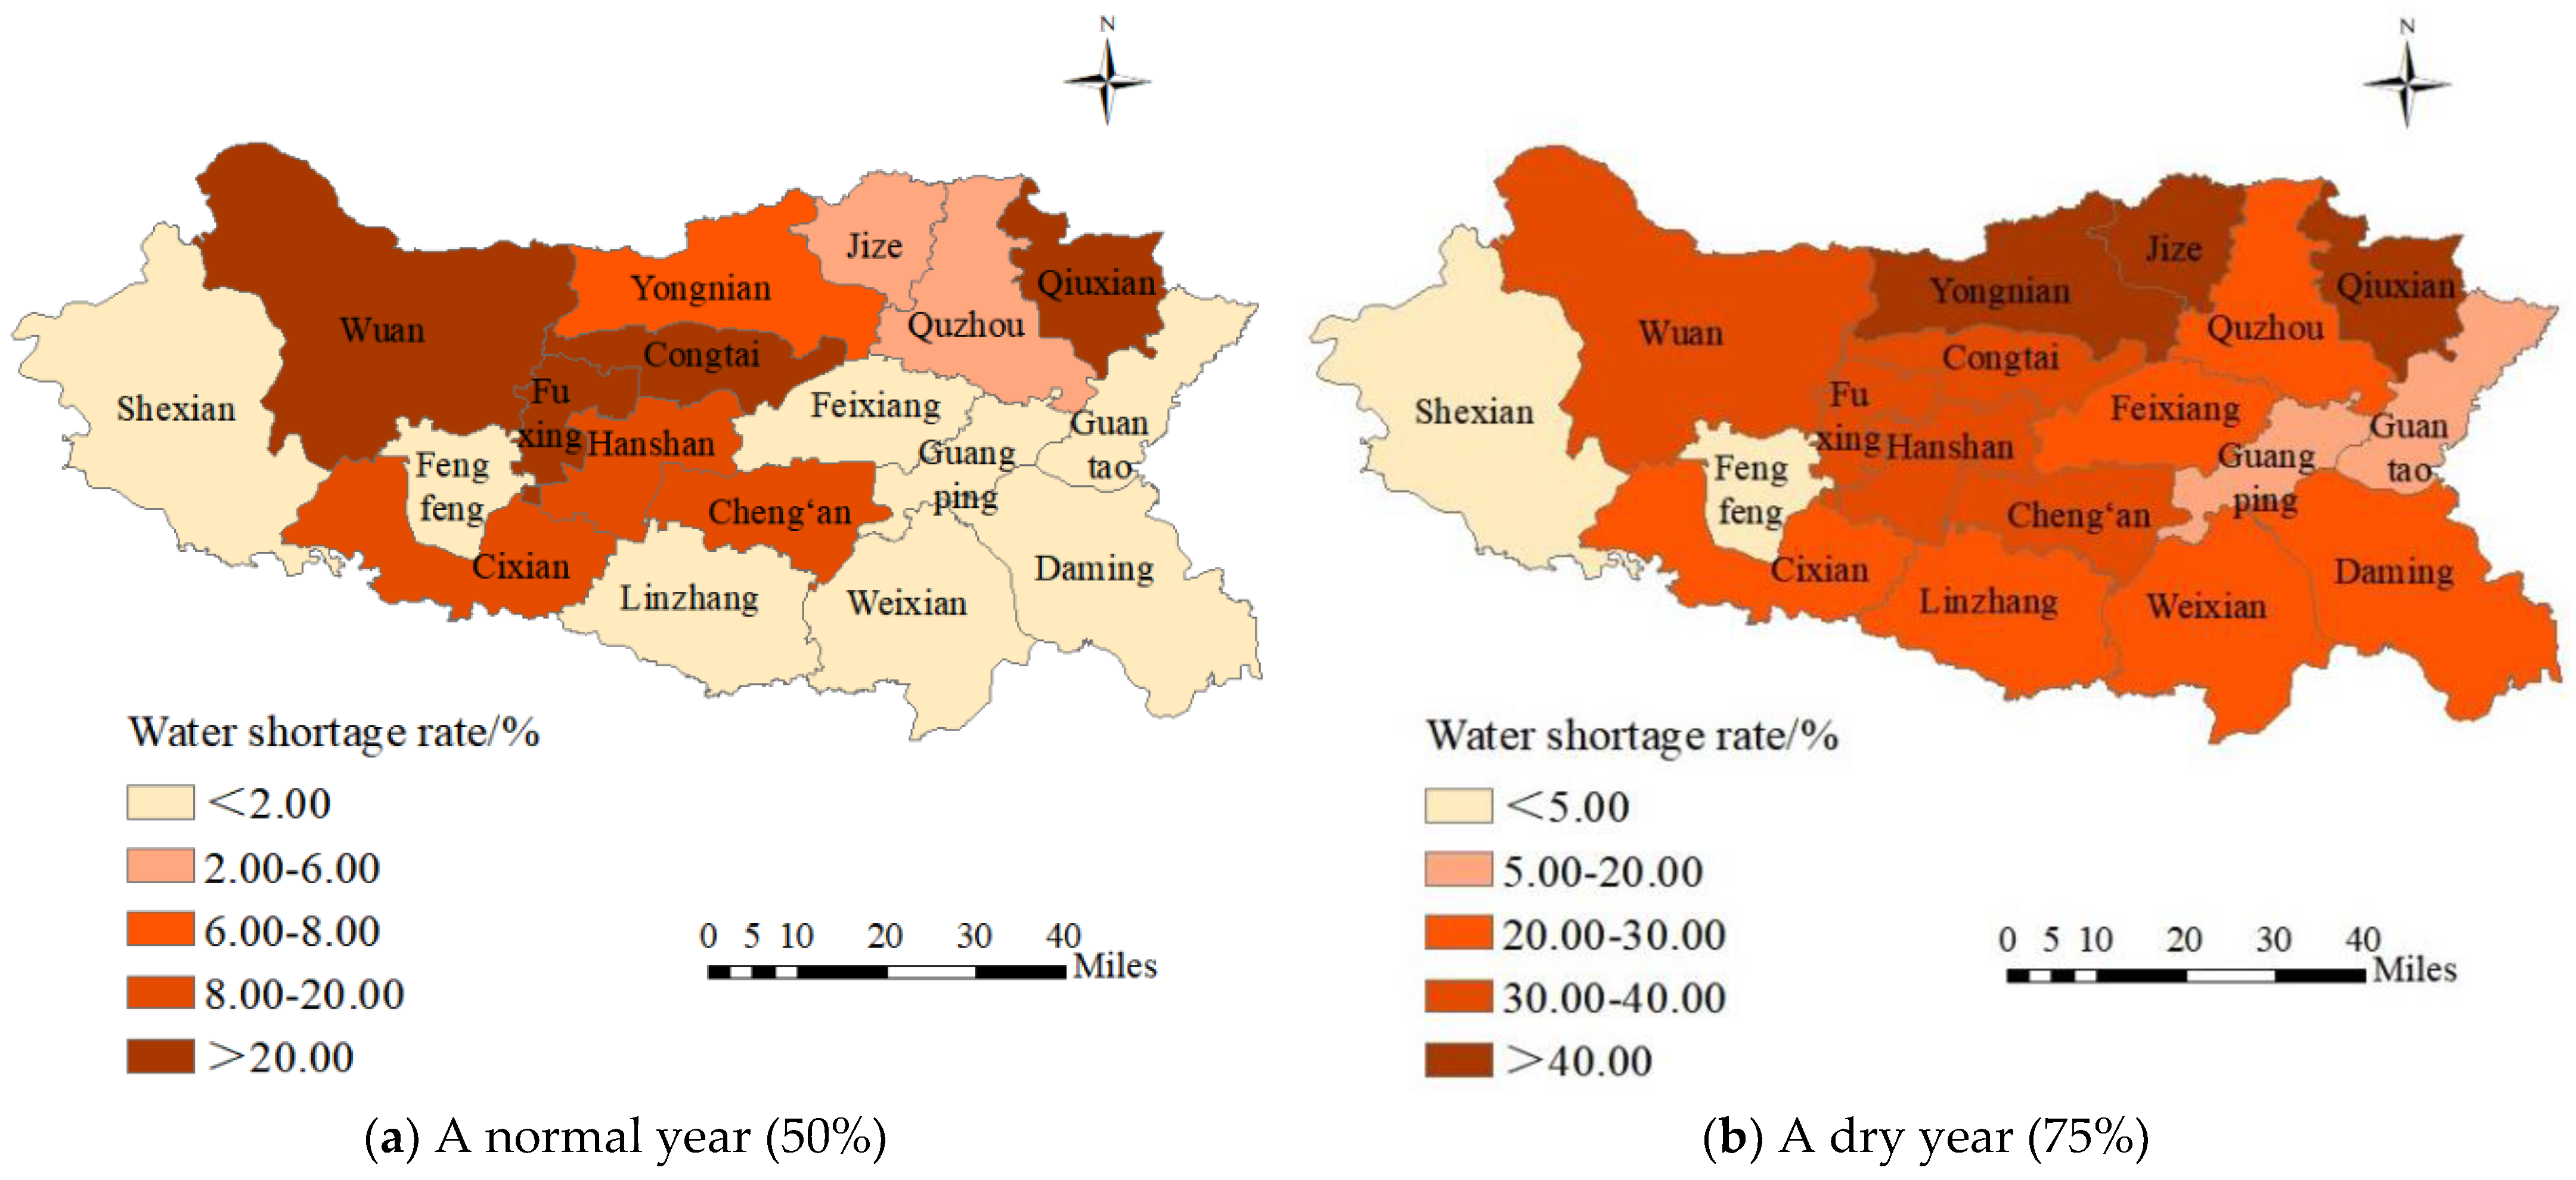
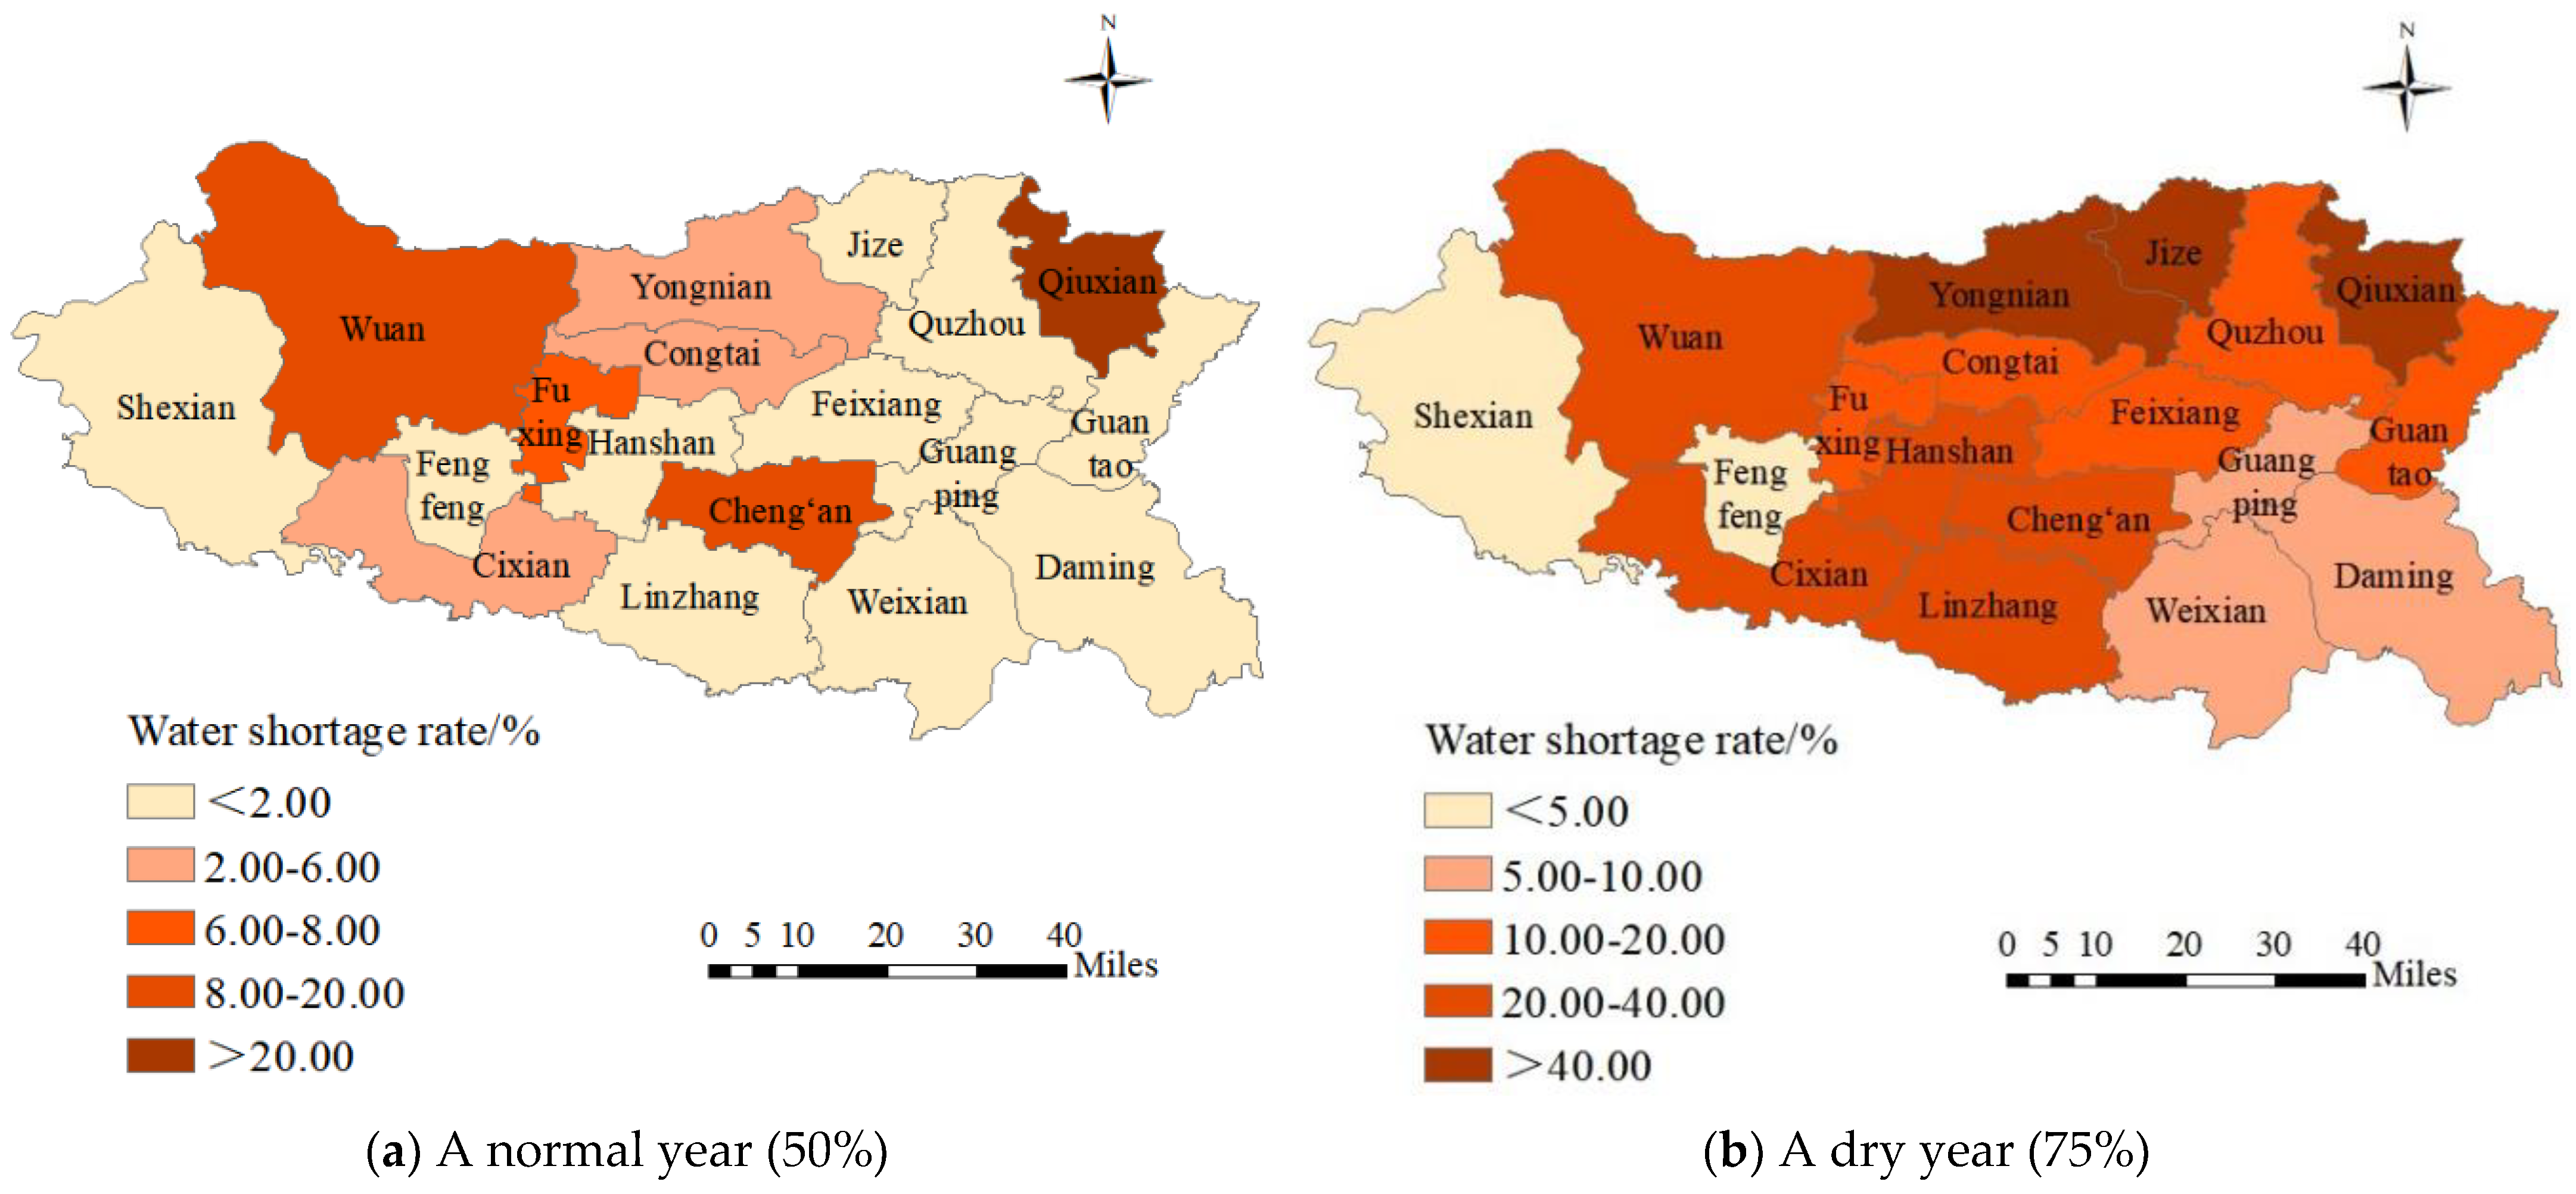
According to the water resource allocation results of Handan in 2025, the water shortage situation of each district and county was analyzed, as shown in Figure 11. During a normal year, all districts and counties will be short of water to varying degrees, which is mainly related to the shortage of natural water resources. The water shortage rate of Qiuxian, Wu’an, Congtai, and Fuxing will be relatively high, ranging from 20% to 40%. The water shortage rate of other districts and counties will be relatively low, not exceeding 20%, maintaining the healthy and sustainable development of the region as a whole. In a dry year, the degree of water shortage in all districts and counties will be further aggravated. Shexian and Fengfeng will have the lowest water shortage rate. The water shortage rate of other districts and counties will be between 15% and 50%, especially Qiuxian, which will reach 49.79%, seriously affecting the healthy and sustainable development of the region. According to the results of water resource allocation in Handan in 2035 (Figure 12), compared with 2025, the water shortage rate will be decreased, especially in the normal year, but there will still be a water shortage in different degrees in all districts and counties. In normal water years, Qiuxian, Cheng’an, and Wu’an will have high water shortage rates, ranging from 10% to 30%, while other districts and counties will have relatively low water shortage rates of less than 10%, especially in Linzhang, where there will be almost no water shortage. In a dry year, the water shortage degree of each district and county will be relatively serious. The water shortage rates of Fengfeng, Daming, Weixian, Guangping, and Shexian will be low, all below 10%. The water shortage rates of other districts and counties will be between 10% and 50%, especially the highest water shortage rate in the eternal year, reaching 45.48%.
5.2.2. Analysis of the Industry Water Shortage Rate
In 2025 and 2035, the domestic, ecology, and industry water shortage rates will be low in each district and county, and the main water shortage industry will be agriculture. Therefore, it is necessary to further analyze the agricultural water shortage in each district and county.
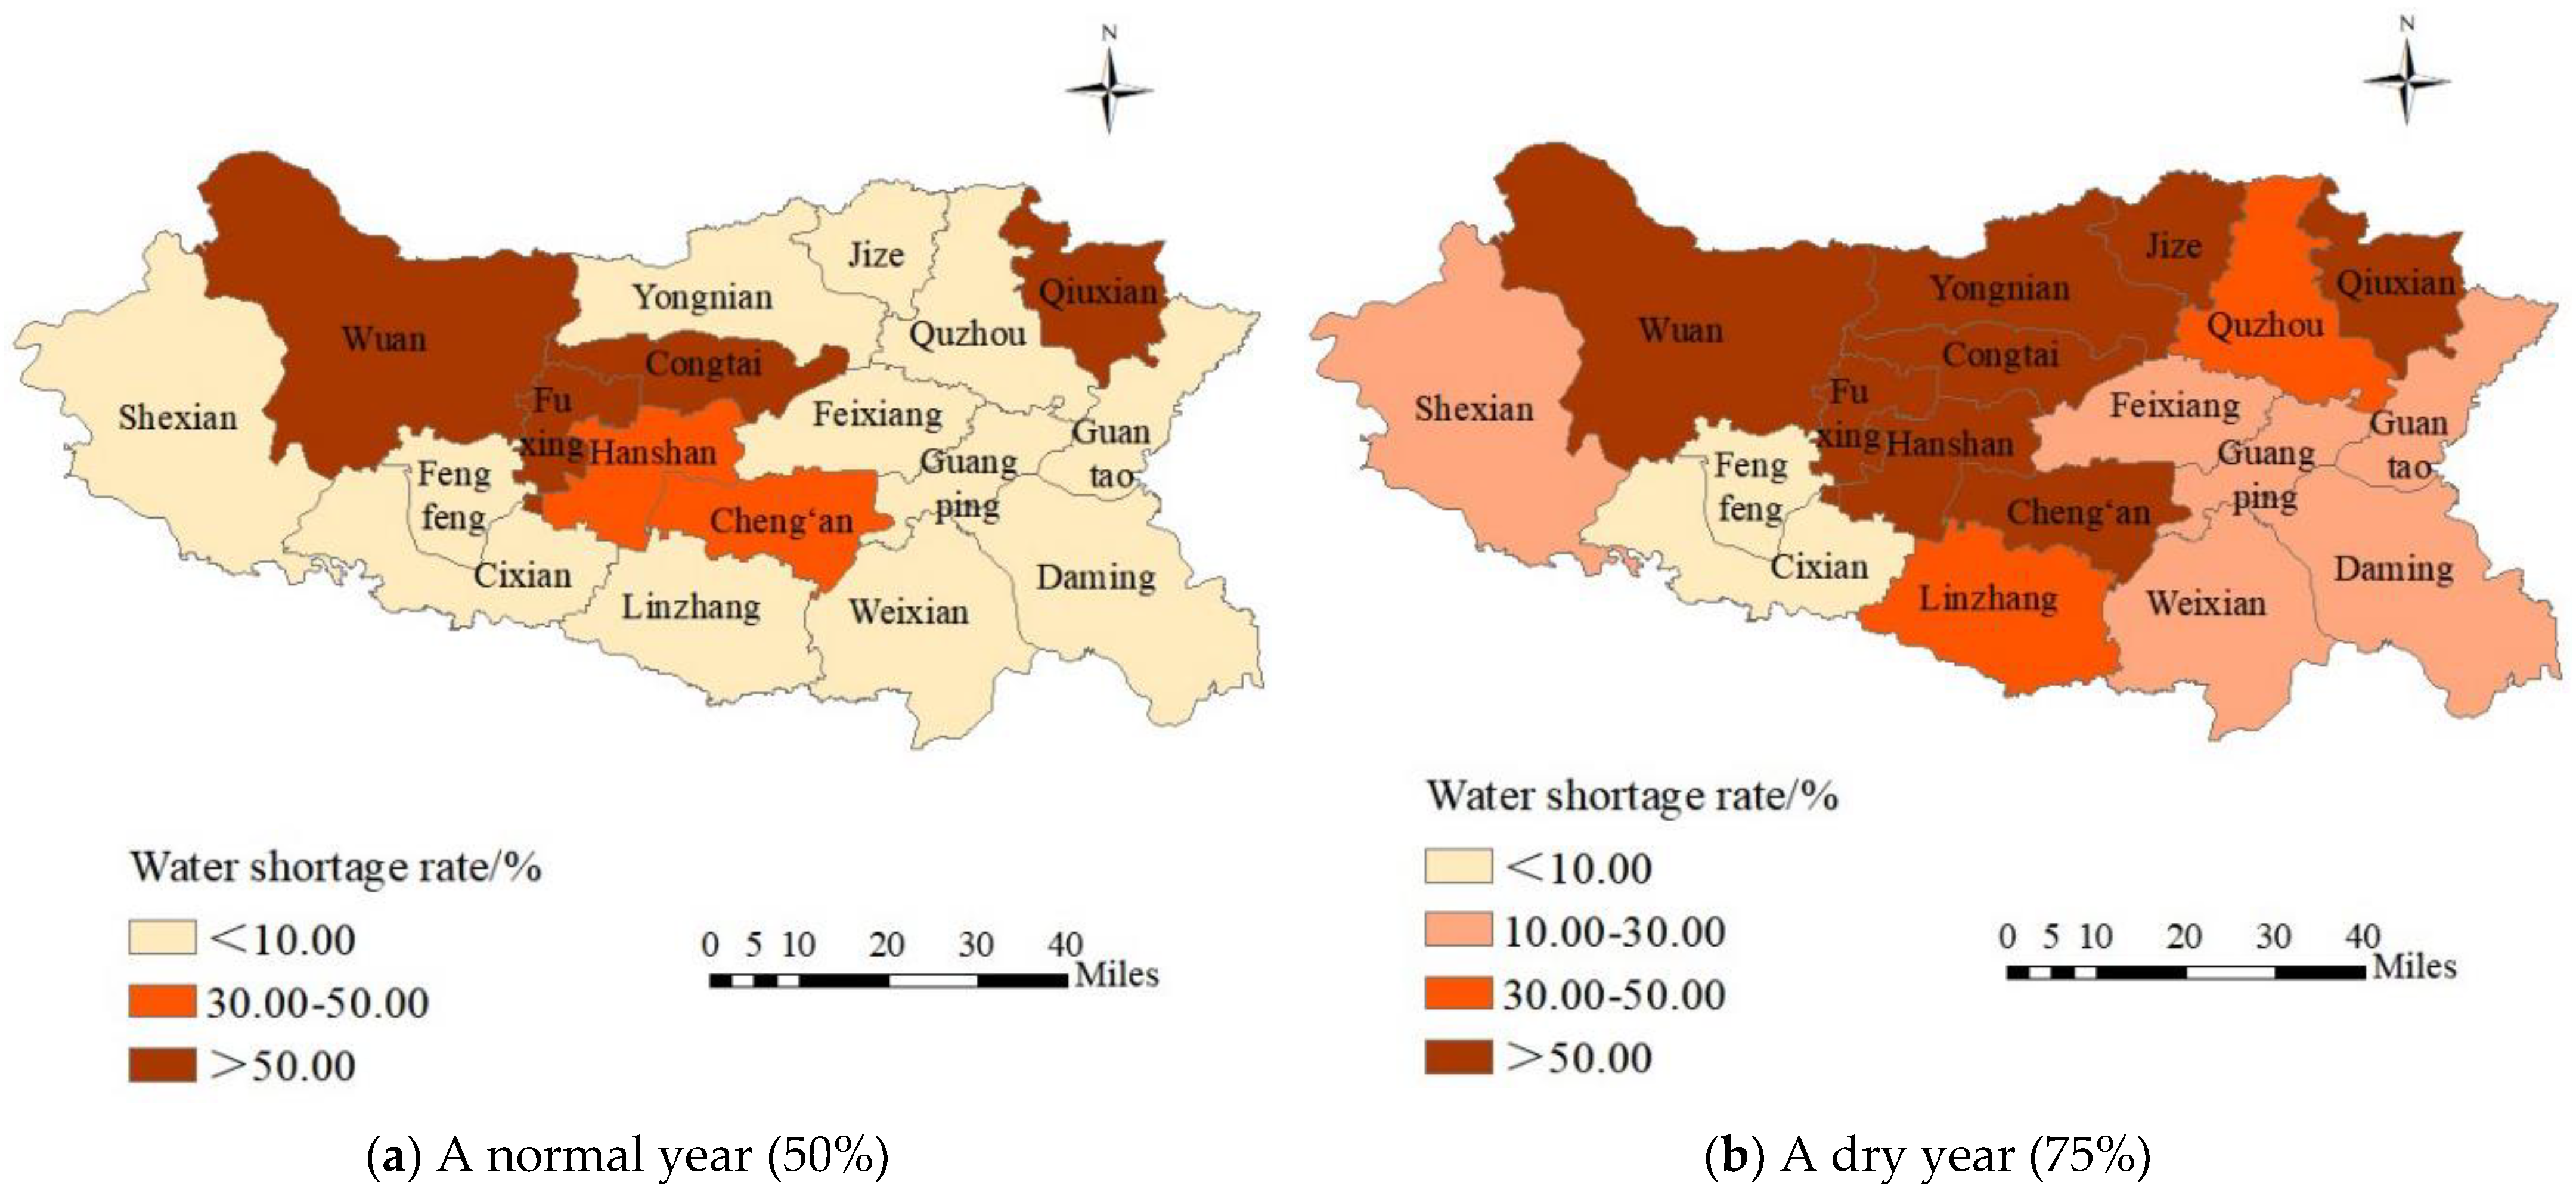
In 2025, the total agricultural water shortage will be 2.52 × 10⁸ m3 and 7.22 × 10⁸ m3 in normal and dry years, respectively, and the agricultural water shortage rates will be 17.39% and 39.37%, respectively, as shown in Figure 13. Except for Shexian, all other districts and counties will have agricultural water use gaps to varying degrees. The agricultural water use gap in Fuxing and Wu’an will be the largest; in a normal year, the water shortage rates will be 80.72% and 70.39%, respectively, and this will increase to 84.50% and 72.76% in a dry year, respectively. This is followed by Congtai, Qiuxian, Hanshan, and Cheng’an. In a normal water year, the water shortage rates will be 53.86%, 51.53%, 46.33%, and 31.62%, respectively. In a dry year, the water shortage rates will increase to 67.31%, 63.90%, 64.87%, and 54.38%, respectively. The agricultural water use in nine districts and counties will have obvious gaps in dry years, such as in Yongnian and Jize. The water shortage rates will increase from about 10% in a normal year to 20–60%. In Linzhang in particular, the agricultural water shortage rate will be 0.03% in a normal year and 32.75% in a dry year. The gap of agricultural water use in Fengfeng will be relatively small, with a water shortage rate of 0.77% in a normal water year and 9.03% in a dry year.
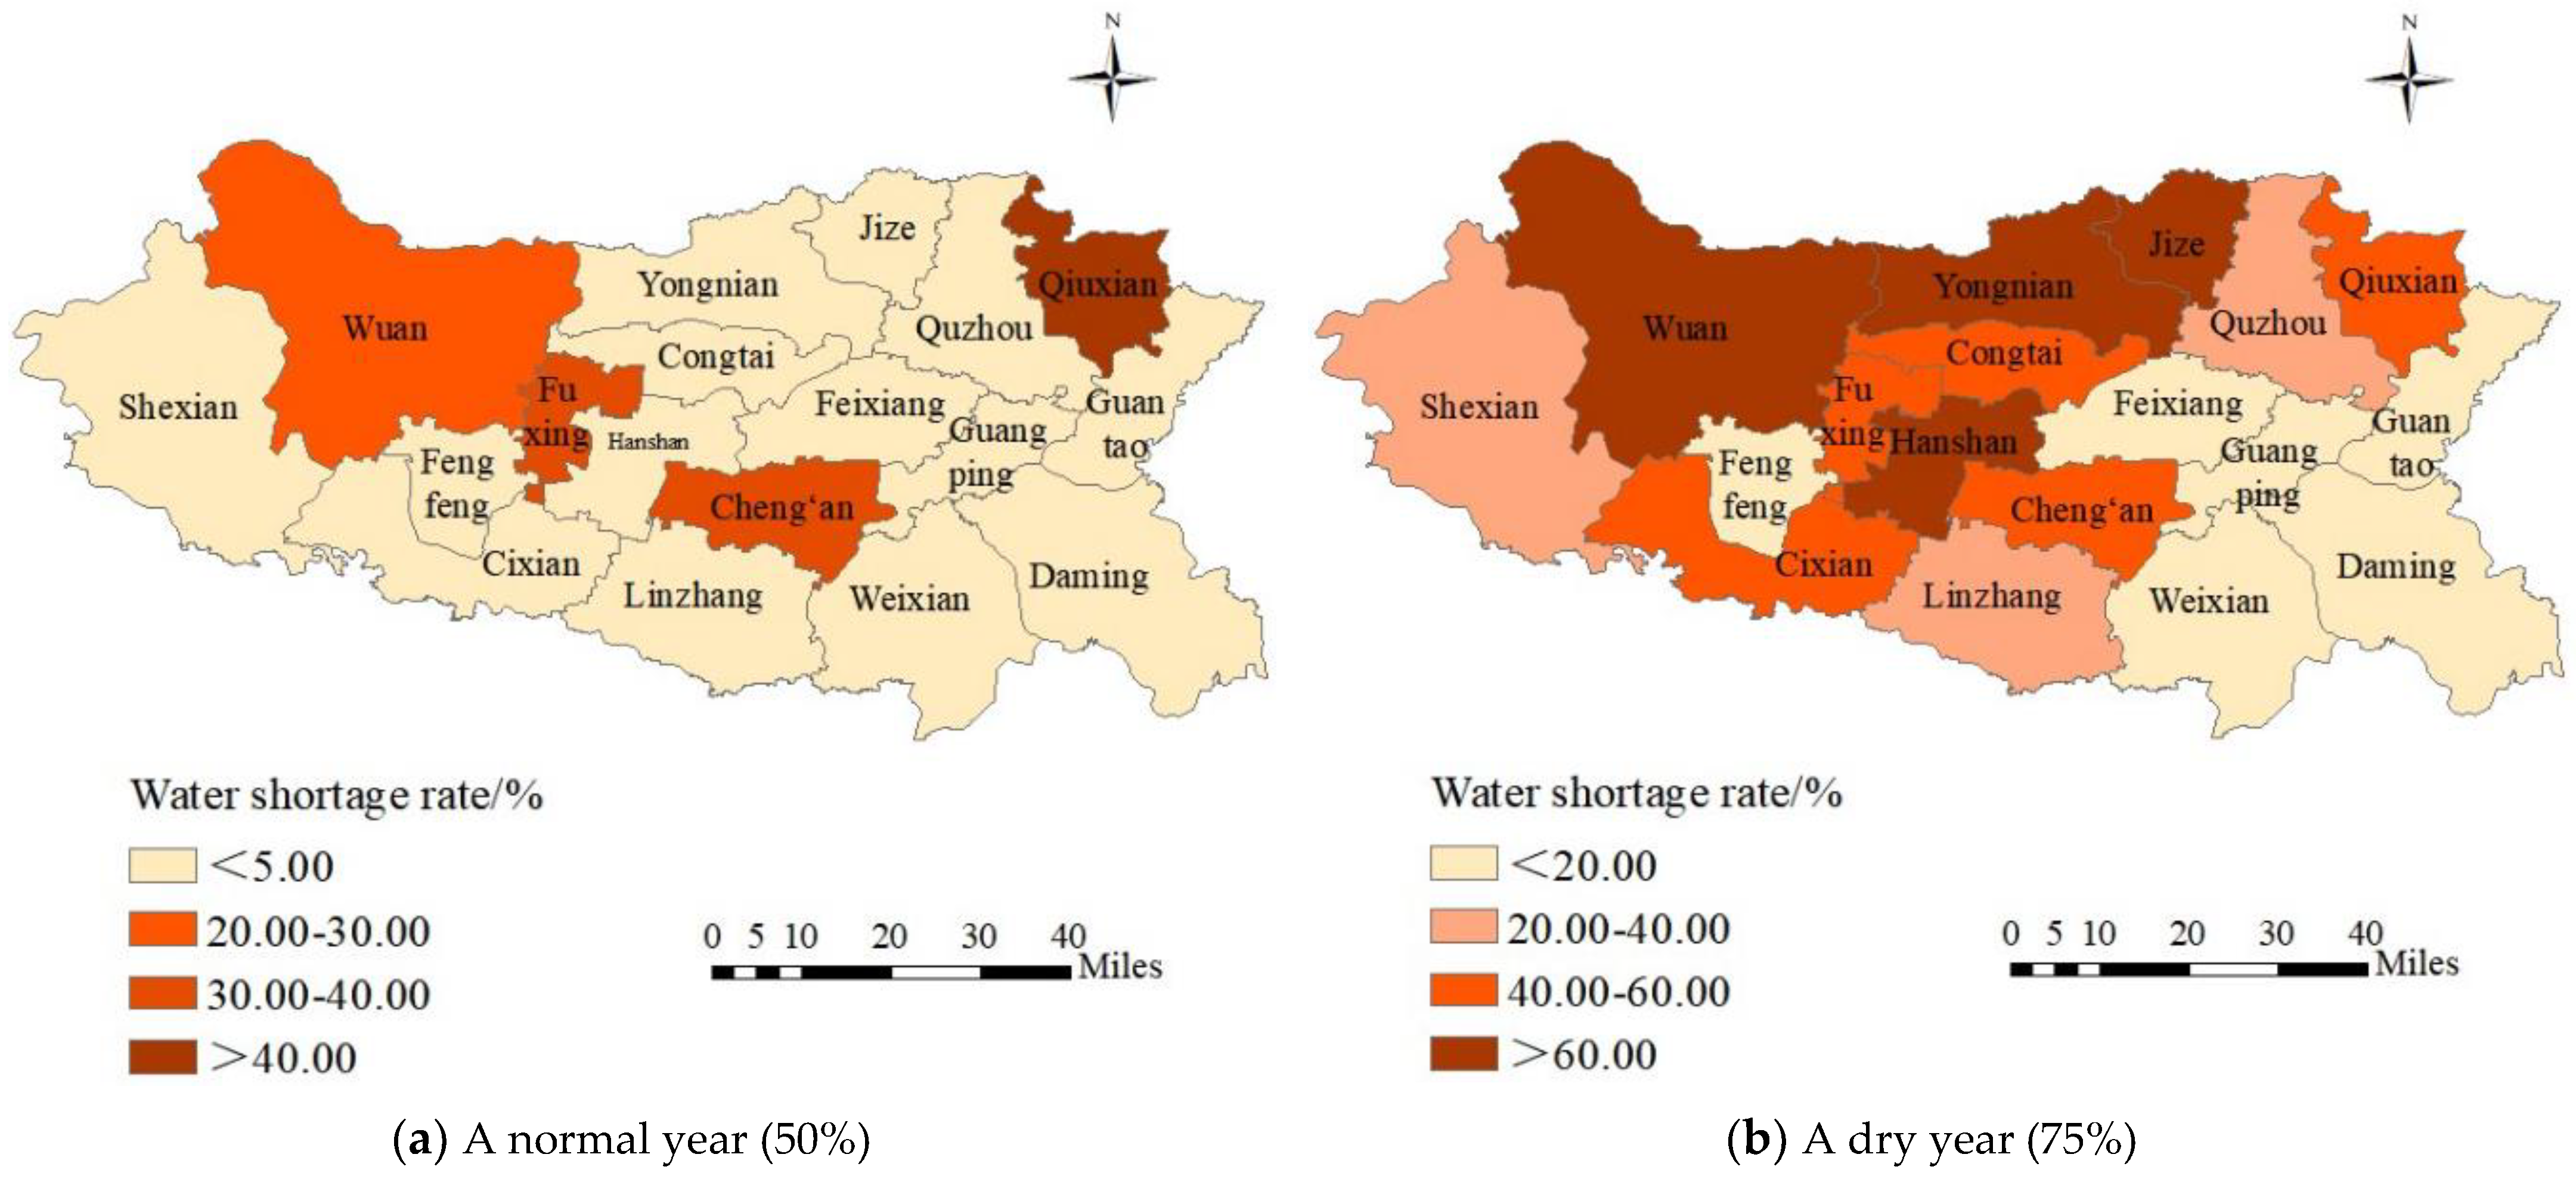
In 2035, the agricultural water shortage in all districts and counties will decrease compared with that in 2025; the agricultural water shortage in normal and dry years will be 0.99 × 10⁸ m3 and 5.96 × 10⁸ m3, respectively; and the agricultural water shortage rate will be 8.59% and 32.49%, respectively, as shown in Figure 14. In a normal year, the agricultural water shortage in Fuxing, Wu’an, Qiuxian, and Cheng’an will be large, with water shortage rates of 37.59%, 27.00%, 44.45%, and 34.81%, respectively. The agricultural water shortage of other districts and counties will be relatively small, below 3%. In dry years, the agricultural water shortage rate in Hanshan and Yongnian will be the largest at 86.74% and 81.78%, respectively. The next will be Congtai, Fuxing, Wu’an, Qiuxian, Jize, Cheng’an, and Cixian, with water shortage rates ranging from 25% to 65%. The water shortage rates of other districts and counties will be between 10% and 20%. To sum up, agricultural water shortage will still be serious in dry years.
5.3. Optimized Configuration of the Water Supply Structure
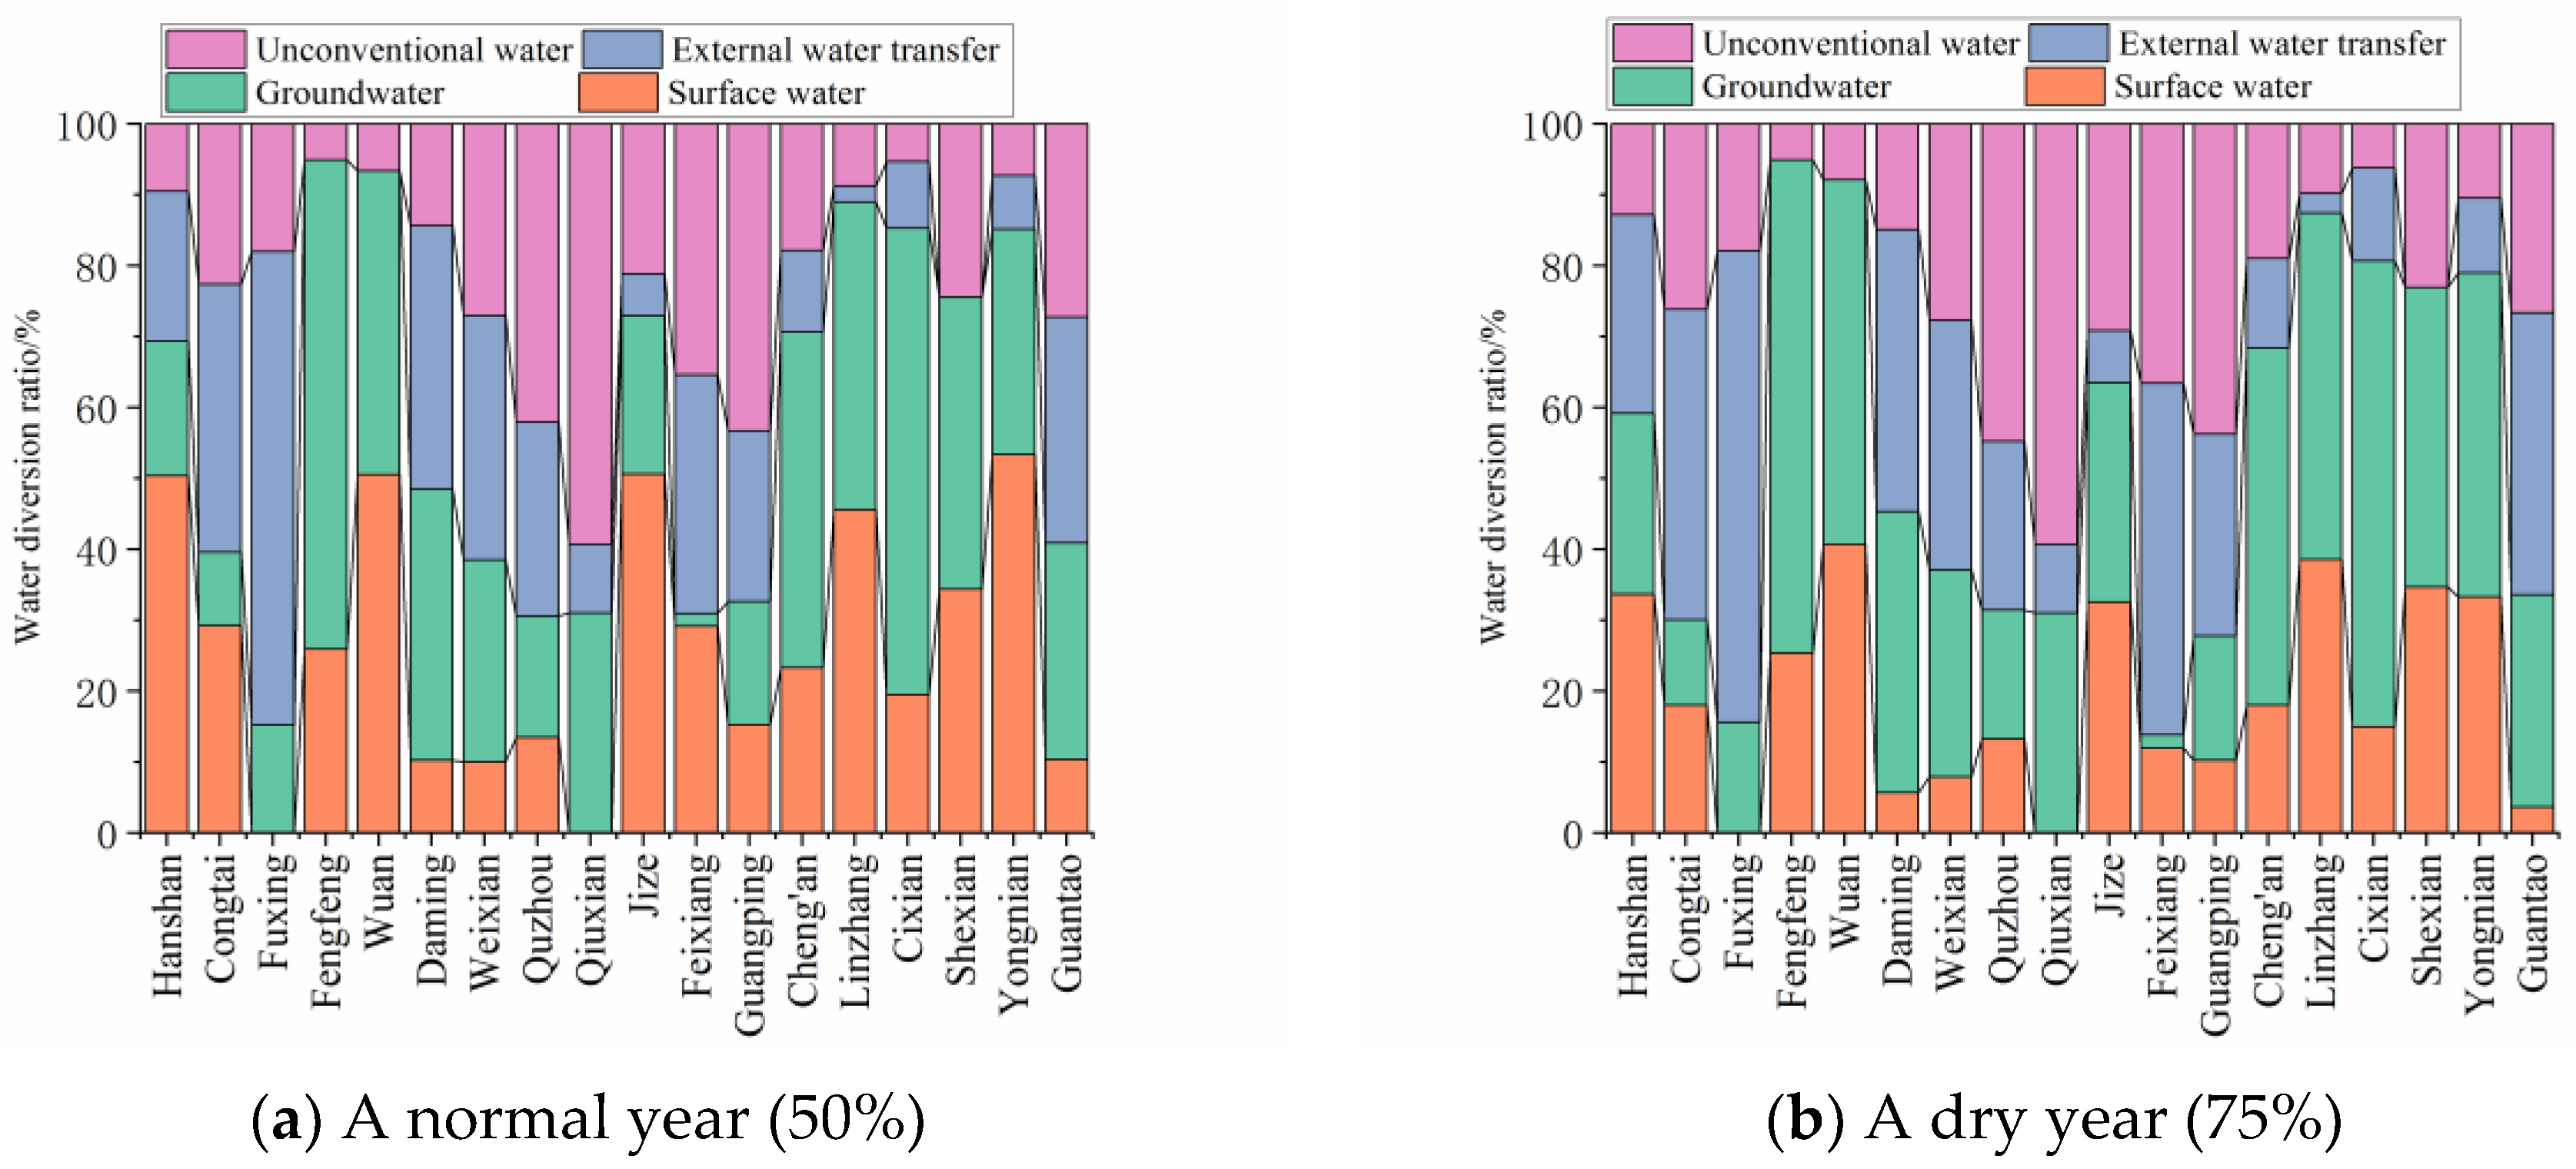
On the basis of the model simulation results, the water supply source structure of the region in different level years in 2025 was analyzed, and the results are shown in Figure 15. In 2025, groundwater will still be the main source of water supply, accounting for 32.16% in a normal year and 35.86% in a dry year. The second is surface water, which will account for 29.35% in a normal year and decreases to 20.25% in a dry year due to the influence of precipitation. With the implementation of the Yellow River diversion project, the proportion of external water diversion will increase year by year, accounting for 19.18% in a normal year and 22.52% in a dry year. Unconventional water is mainly mine drainage and recycled water, and its proportion will increase with the strengthening of water resource reuse, accounting for 19.33% and 21.40% in normal and dry years, respectively.
According to the water supply situation of each district and county, in a normal year, surface water will be the main water supply source in Yongnian, Jize, Wu‘an, and Hanshan, accounting for 53.34%, 50.59%, 50.54%, and 50.35%, respectively, while Fuxing and Qiuxian have no surface water source. As the main water supply source in the region, groundwater will account for a proportion in the water supply structure of each district and county, among which Fengfeng and Cixian will account for the highest proportion of 68.96% and 65.79%, respectively. Other districts and counties will generally account for between 10% and 50%, but Feixiang will account for a very low proportion, only 1.79%. Fuxing will have the highest proportion of external water transfer, accounting for 66.75%, followed by Congtai, Daming, Weixian, and the other eight districts and counties, with the first three accounting for 20–40% and other districts and counties accounting for about 2–12%. However, Fengfeng, Wu‘an, and Shexian have no external water transfer. Unconventional water mainly includes mine drainage and recycled water, and various counties have unconventional water sources, with the highest proportion of an area county being an official, at 59.28%, followed by Guangping and Quzhou, accounting for 43.30% and 42.06%, respectively. However, there are few unconventional water sources in Cixian, Fengfeng, Hanshan, Linzhang, YongNian, and Wu’an, accounting for under 10%. Other districts and counties will account for between 10% and 40%.
In a dry year, the proportion of surface water in each district and county will decrease annually compared with that of flat water, with only Wu’an accounting for 40.73%. Due to the relative shortage of surface water resources in dry years, the proportion of groundwater in all districts and counties will generally increase, and Fengfeng and Cixian will still be the highest, accounting for 69.57% and 65.73%, respectively, at nearly 70%. Fuxing will have the highest proportion of external water transfer, accounting for 66.41%, which is essentially the same as that in normal year. The highest proportion of unconventional water will be 59.28% in Qiuxian, which is consistent with a normal water year.
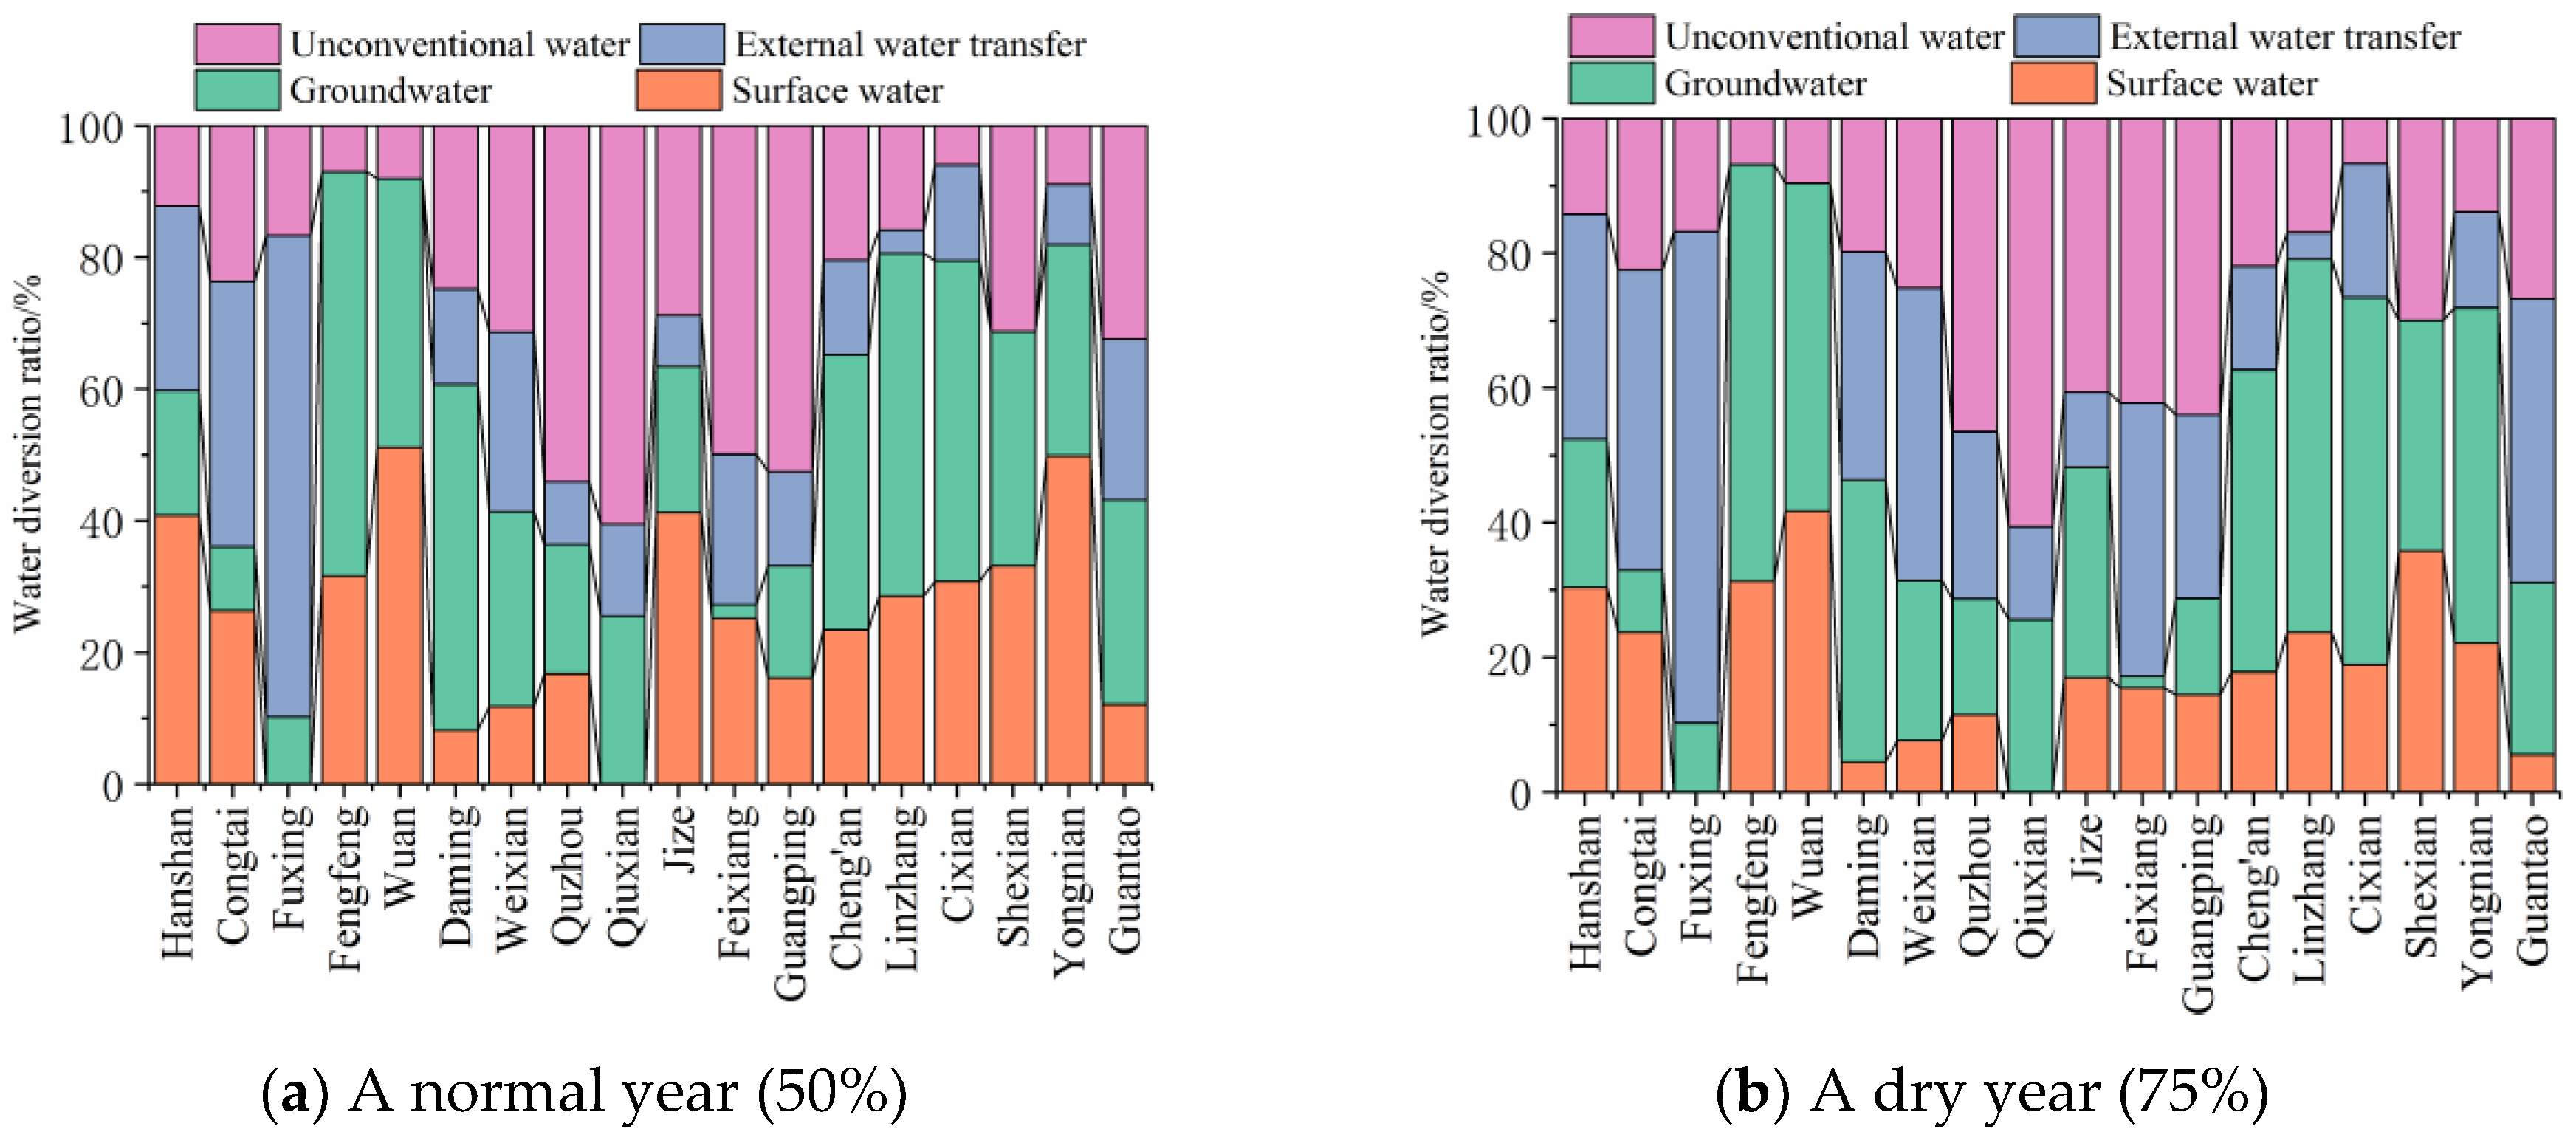
In 2035, groundwater will still be the main source of water supply, accounting for 32.2% and 32.4%, respectively, in normal and dry years, having declined compared with 2025. The proportion of surface water will be similar to that in 2025, with 27.9% in a normal year and 18.7% in a dry year. The proportion of transferred water will increase, especially in a dry year, accounting for 24.87%. Irregular water will account for 23.78% and 23.96%, respectively, in normal and dry years, with a significant increase compared with 2025. See Figure 16 for details.
To sum up, in 2025 and 2035, the water supply for urban and rural life in all districts and counties will be guaranteed in normal and dry years, and there will be no shortage of water. There will be a large gap in agricultural and ecological water use in 2025, and the water shortage will be significantly improved in the normal year of 2035, but the water shortage in the dry year will be similar to that in 2025, and the gap in agricultural and ecological water use will still be large, being mainly related to the poor background conditions of regional water resources. Regional groundwater will still be the main source of water supply, especially in a year, but its proportion in 2035 will decrease significantly compared with 2025, while the proportion of unconventional water will increase significantly. With the rapid development of the social economy, in order to further alleviate the pressure of water supply and demand, Handan’s industrial structure and water supply system must be adjusted accordingly. On the one hand, in accordance with the policy of “land and production are determined by water”, we will focus on strengthening the promotion of agricultural water-saving technology, developing fine agricultural production, further optimizing the planting structure, and constantly promoting the development of agriculture towards low water consumption and high output value. On the other hand, while continuing to promote the control of groundwater overexploitation, we should further strengthen the efficient use of external water resources. Since the implementation of the South to North Water Transfer Project, the water pressure of Handan City has been greatly relieved, and the water diverted from the river has essentially met the domestic water demand. With the implementation of the South to North Water Transfer Project and the Yellow River Diversion and Storage Project, the replaced surface water resources can be comprehensively regulated and stored in the region to realize the complementation of water resources in time and space, so as to relieve the pressure of agricultural and ecological water use in dry years.
6. Conclusions
In this paper, Handan City, an extreme resource type water shortage area, is taken as the study area. On the basis of the analysis of the topological relationship of regional water supply and demand and the prediction of water demand, the GWAS model of Handan City was built to refine and optimize the allocation of water resources in the normal (p = 50%) and dry (p = 75%) years in 2025 and 2035. The following conclusions were obtained:
- (1)
- The total water demand of Handan in 2025 was estimated to be 2.54 billion m3 and 2.94 billion m3 in normal and dry years, respectively. The simulated allocation water volumes of the model were 2.24 billion m3 and 2.10 billion m3, respectively. The water deficient rates were 11.69% and 28.61%, respectively. In 2035, the total water demand in normal and dry years was estimated to be 2.62 billion m3 and 2.98 billion m3, respectively, and the model simulated allocation water was 2.50 billion m3 and 2.33 billion m3, respectively. The water shortage rates were 4.54% and 21.80%, respectively, being significantly improved compared with that in 2025.
- (2)
- The water allocation in different planning years and different normal and dry years can essentially meet the domestic, industry, and ecology water demand, but the agricultural water shortage will be serious. In 2025, the agricultural water shortage in normal and dry years will be 250 million m3 and 720 million m3, respectively. The agricultural water shortage will be alleviated in 2035, and the agricultural water shortage will be reduced to 99 million m3 and 596 million m3 in normal and dry years, respectively.
- (3)
- The regional groundwater as the water supply source will account for 32.16% and 35.86%, respectively, in the normal and dry years in 2025, and 32.10% and 32.51%, respectively, in 2035. Although will decrease slightly, the groundwater will still play a major role in the regional water supply source in the future. With the further development of ecological civilization construction and comprehensive treatment of groundwater, its proportion will gradually decline, while the water supply of external water transfer and unconventional water will increase. This will mainly be because of the construction of key supporting projects of the South to North Water Transfer Project and the transformation of enterprise water resources to recycling.
This study shows the applicability of the GWAS model for water resource allocation in Handan City, but only considers the water resource allocation in different counties under the red line of total water use, the red line of water use efficiency, and the red line of groundwater availability. With the improvement of the refinement of water resource management, the allocation and management can be further refined to the township level. In view of the limited background of water resources, the water supply at different frequencies is significantly different. When designing different scenarios, more types can be considered, taking into account the complementation of time and space to carry out fine allocation research.
Author Contributions
Writing—original draft preparation, J.M.; data curation, H.L.; resources, W.W.; writing—review and editing, Y.Z.; investigation, S.D. All authors have read and agreed to the published version of the manuscript.
Funding
This research was funded by the General Program of NSFC, funding number 51879066.
Data Availability Statement
Not applicable.
Conflicts of Interest
The authors declare no conflict of interest.
References
- Wang, H.; Wang, J.; Liu, J.H.; Mei, C. Analysis of urban water cycle evolution and countermeasures. J. Hydraul. Eng. 2021, 52, 3–11. [Google Scholar] [CrossRef]
- Wang, H.; You, J.J. Progress of water resources allocation during the past 30 years in China. J. Hydraul. Eng. 2016, 47, 265–271+282. [Google Scholar] [CrossRef]
- Liu, M.Y.; Zhang, L.; Luan, Q.H.; Xu, D.; Liu, B. Application of artificial fish swarm algorithm in optimal allocation of water resources in Hejian County. Hydro.-Sci. Eng. 2021, 3, 74–83. [Google Scholar]
- Zeng, M.; Wang, F.; Zhang, Y.P.; Yu, S. Research on of the optimal allocation of water resources in Guangdong Province based on fish swarm algorithm. J. Northwest Univ. Nat. Sci. Ed. 2020, 50, 733–741. [Google Scholar] [CrossRef]
- Shan, B.Y.; Guo, P.; Zhang, F.; Guo, S. A multi-objective optimization model solving method based on genetic algorithm and scheme evaluatio. J. China Agric. Univ. 2019, 24, 157–165. [Google Scholar] [CrossRef]
- Fang, G.H.; Guo, Y.X.; Wen, X.; Huang, X. Application of improved multi-objective quantum genetic algorithm on water resources optimal operation of Jiangsu Section of South-to-North Water Transfer East Route Project. Water Resour. Prot. 2018, 34, 34–41. [Google Scholar]
- Li, X.D.; Sha, J.X.; Liu, B.; Yan, Z.H.; Li, S.; Zhou, W.K. Optimal allocation of water resources based on whale optimization algorithm. China Rural Water Hydropower 2018, 4, 40–45,49. [Google Scholar]
- Ji, N.Y.; Yang, K.; Chen, J.; Yang, J. Research on optimal allocation model of regional water resources based on IABC-PSO algorithm. Yangtze River 2021, 52, 49–57,87. [Google Scholar]
- Zhu, S.F.; Li, Z.X. Research on Optimal Allocation of Water Resources based on Improved NSGA-II Algorithm in Jinzhong City. China Rural Water Hydropower 2020, 34, 1–18. [Google Scholar]
- Sha, J.X. Application of improved NSGA-Ⅱ in optimal allocation of water resources in Xingtai city. Water Resour. Power 2018, 36, 21–25. [Google Scholar]
- Wang, H.; Gao, Z.H.; Sun, C.; Zhang, J.; Li, T. Water Resource Allocation for Irrigation Optimized using the NSGA-ⅡModel: Theory and Application. J. Irrig. Drain. 2021, 40, 118–124. [Google Scholar]
- Mallawaarachchi, T.; Auricht, C.; Loch, A.; Adamson, D.; Quiggin, J. Water allocation in Australia’s Murray–Darling Basin: Managing change under heightened uncertainty. Econ. Anal. Policy 2020, 66, 345–369. [Google Scholar] [CrossRef]
- Cheng, K.; Wei, S.; Ren, Y.T.; Fu, Q. Optimal allocation of agricultural water resources under the background of China’s agricultural water price reform-a case study of Heilongjiang province. Appl. Math. Model. 2021, 97, 636–649. [Google Scholar] [CrossRef]
- Liu, D.; Guo, S.; Shao, Q.; Liu, P.; Xiong, L.; Wang, L.; Hong, X.; Xu, Y.; Wang, Z. Assessing the effects of adaptation measures on optimal water resources allocation under varied water availability conditions. J. Hydrol. 2018, 556, 759–774. [Google Scholar] [CrossRef]
- Feng, J.H. Optimal allocation of regional water resources based on multi-objective dynamic equilibrium strategy. Appl. Math. Model. 2021, 90, 1183–1203. [Google Scholar] [CrossRef]
- Gao, L.M.; Chen, H.W.; Li, F.L. Quantity/quality-dual-control-based optimal allocation of water resources in the typical water-shortage area of North China. South-North Water Transf. Water Sci. Technol. 2020, 18, 70–78. [Google Scholar] [CrossRef]
- Zeng, X.T.; Zhang, S.J.; Feng, J.; Huang, G.H.; Li, Y.P.; Zhang, P.; Chen, J.P.; Li, K.L. A multi-reservoir based water-hydroenergy management model for identifying the risk horizon of regional resources-energy policy under uncertainties. Energy Convers. Manag. 2017, 143, 66–84. [Google Scholar] [CrossRef]
- Zhuang, X.W.; Li, Y.P.; Huang, G.H.; Zeng, X.T. An inexact joint-probabilistic programming method for risk assessment in water resources allocation. Stoch. Environ. Res. Risk Assess. 2015, 29, 1287–1301. [Google Scholar] [CrossRef]
- Sang, X.F.; Wang, H.; Wang, J.H.; Zhao, Y.; Zhou, Z. Water resources comprehensive allocation and simulation model (WAS), part Ⅰ: Theory and development. J. Hydraul. Eng. 2018, 49, 1259–1451. [Google Scholar] [CrossRef]
- Sang, X.F.; Zhao, Y.; Zhai, Z.L.; Chang, H. Water resources comprehensive allocation and simulation model (WAS), part Ⅱ: Application. J. Hydraul. Eng. 2019, 50, 201–208. [Google Scholar] [CrossRef]
- Chang, H.Y. Development and Improvement of WAS Model and Application of Water Resources Allocation in Beijing-Tianjin-Hebei Region. Master’s Thesis, China Institute of Water Resources & Hydropower Research, Beijing, China, 2019. [Google Scholar]
- Cao, Y.Q.; Li, L.H. Simulation analysis of water resources in Beijing based on integrated comprehensive water simulation and allocation model. Adv. Sci. Technol. Water Resour. 2021, 41, 25–31. [Google Scholar]
- Du, L.J.; Chen, G.F.; Liu, C.S.; Wang, X.; Liu, J.; Wang, H. GWAS model-based optimal allocation of water resources in irrigation district. Water Resour. Hydropower Eng. 2020, 51, 26–35. [Google Scholar]
- Luan, Q.H.; Gao, H.Y.; Liu, H.L.; He, L.; Ma, J.; Wang, C. Optimal allocation of water resources in Wu’an County based on GWAS model. Water Resour. Prot. 2022. [Google Scholar]
- Ma, J.; Duan, N.; Lv, R.L.; Luan, Q.H.; Wang, Q. Health evaluation methods of water-cycle and related applications: A case study on Handan city. Sci. Technol. Eng. 2021, 21, 14372–14378. [Google Scholar]
- Huo, H.S. Handan Statistical Yearbook (2020); China Statistics Press: Beijing, China, 2020; pp. 33–316.
- Guo, J.P.; Wang, X.H.; Li, C.Y.; Yan, X.T.; Liu, H.L. Handan Water Resources Bulletin (2020); Handan Water Resources Management Center: Handan, China, 2021; pp. 1–43. [Google Scholar]
Figure 1.
Location, water system, and water conservancy projects.

Figure 2.
Prediction of water demand in 2025.

Figure 3.
Prediction of water demand in 2035.

Figure 4.
Prediction of regional water supply.

Figure 5.
The network diagram of the water resource system in Handan City.

Figure 6.
The structural framework of the GWAS model.

Figure 7.
Verification of simulation results.

Figure 8.
Allocated water volume.

Figure 9.
Industrial water distribution in 2025.

Figure 10.
Industrial water distribution in 2035.

Figure 11.
Water shortage rate in 2025.

Figure 12.
Water shortage rate in 2035.

Figure 13.
Agricultural water shortage in 2025.

Figure 14.
Agricultural water shortage in 2035.

Figure 15.
The structure of water supply source in 2025.

Figure 16.
The structure of water supply source in 2035.


Table 1.
The results of optimal allocation of water resources.
| Planning Years | Scenarios | Water Demand (108 m3) | Allocated Water Volume (108 m3) | Water Shortage Rate (%) |
|---|---|---|---|---|
| 2025 | 50% | 25.40 | 22.43 | 11.69 |
| 75% | 29.40 | 20.99 | 28.61 | |
| 2035 | 50% | 26.21 | 25.02 | 4.54 |
| 75% | 29.81 | 23.31 | 21.80 |
Disclaimer/Publisher’s Note: The statements, opinions and data contained in all publications are solely those of the individual author(s) and contributor(s) and not of MDPI and/or the editor(s). MDPI and/or the editor(s) disclaim responsibility for any injury to people or property resulting from any ideas, methods, instructions or products referred to in the content. |
© 2022 by the authors. Licensee MDPI, Basel, Switzerland. This article is an open access article distributed under the terms and conditions of the Creative Commons Attribution (CC BY) license (https://creativecommons.org/licenses/by/4.0/).
Share and Cite
MDPI and ACS Style
Ma, J.; Liu, H.; Wu, W.; Zhang, Y.; Dong, S. Research on Optimal Allocation of Water Resources in Handan City Based on the Refined Water Resource Allocation Model. Water 2023, 15, 154. https://doi.org/10.3390/w15010154
AMA Style
Ma J, Liu H, Wu W, Zhang Y, Dong S. Research on Optimal Allocation of Water Resources in Handan City Based on the Refined Water Resource Allocation Model. Water. 2023; 15(1):154. https://doi.org/10.3390/w15010154
Chicago/Turabian StyleMa, Jing, Hongliang Liu, Wenfeng Wu, Yinqin Zhang, and Sen Dong. 2023. "Research on Optimal Allocation of Water Resources in Handan City Based on the Refined Water Resource Allocation Model" Water 15, no. 1: 154. https://doi.org/10.3390/w15010154
Note that from the first issue of 2016, this journal uses article numbers instead of page numbers. See further details here.