Article

Optimized Planting Density and Nitrogen Rate Increased Grain Yield and Water-Nitrogen Use Efficiency of Two Maize Cultivars under Mulched Drip Fertigation by Improving Population Photosynthesis and Grain-Filling Characteristics

1
Key Laboratory of Agricultural Soil and Water Engineering in Arid and Semiarid Areas of the Ministry of Education, Northwest A&F University, Yangling 712100, China
2
College of Water Conservancy and Civil Engineering, China Agricultural University, Beijing 100083, China
*
Author to whom correspondence should be addressed.
Water 2023, 15(1), 163; https://doi.org/10.3390/w15010163
Submission received: 1 December 2022 / Revised: 19 December 2022 / Accepted: 28 December 2022 / Published: 31 December 2022
(This article belongs to the Special Issue Insight into Drip Irrigation)

Abstract

:
The characteristics of photosynthesis and grain filling play a significant role in determining maize (Zea mays L.) yield. Planting density and nitrogen (N) rate are two factors affecting the growth, physiology, and grain yield of maize. The coupling effects of planting density and N rate on individual and population photosynthetic rates, grain-filling characteristics, grain yield, water use efficiency (WUE), and N partial factor productivity (NPFP) of two maize cultivars (QS51 and ZD958) under mulched drip fertigation in northwest China were investigated. Three planting densities (D1: 80,000 plants ha−1, D2: 100,000 plants ha−1, and D3: 120,000 plants ha−1) and three N rates (N0: 0 kg ha−1, N180: 180 kg ha−1, and N240: 240 kg ha−1) were designed. The results showed that the population photosynthetic rate, grain yield, WUE, and NPFP were significantly affected by planting density and N rate for both QS51 and ZD958, and their interaction had a significant effect on grain yield, WUE, and NPFP. Nitrogen application significantly improved grain-filling rates compared with N0, but there was no significant difference between N240 and N180. The D2N180 treatment obtained the maximum grain yield (15,693 kg ha−1 for QS51 and 17,644 kg ha−1 for ZD958), WUE (3.42 kg kg−1 for QS51 and 3.05 kg kg−1 for ZD958), and NPFP (98.37 kg kg−1 for QS51 and 83.93 kg kg−1 for ZD958). It was concluded that the optimized planting density and N rate improved grain yield and water-nitrogen use efficiency of QS51 and ZD958 by increasing population photosynthetic rate, grain-filling rate, and grain weight. This study enhanced our understanding of how optimized planting density and N rate maintained the sustainable maize production under mulched drip fertigation in northwest China.

1. Introduction

The arid and semiarid region of northwest China is one of the main maize production areas in China. With the increase in population and demand for food, the demand for maize production has been increasing [1,2,3]. Therefore, increasing maize yield is of great importance for realizing national food security. Grain filling is a vital physiological process for grain formation during the growth and development of maize [4,5,6]. The storage capacity is greatly affected by the grain-filling rate and duration, which determines the yield and quality of maize [7,8]. Li et al. [9] found that water–fertilizer interaction extended the grain-filling time by ~4.4 days and increased the average grain-filling rate by ~19.5%, and the grain-filling rate and grain-filling duration were positively correlated with maize economic yield. Extending the active grain-filling duration, mid-late grain-filling duration, and increasing the average grain-filling rate can greatly increase grain yield [8].
Planting density and nitrogen (N) rate are two factors that affect the growth, physiology, and grain yield of maize. Optimum planting density can enhance the light interception rate in the upper part of the canopy and increase canopy productivity [10,11,12,13]. Hou et al. [14] found that for the situation of nitrogen surplus in China, high yield can be achieved by increasing planting density (15,000 plants ha−1) without increasing the N rate so as to reduce N input and harm to the environment. Previous studies [15,16] have demonstrated that there is a clear parabolic relationship between yield components and planting density. Within a certain range, crop water use efficiency (WUE), grain yield, and radiation use efficiency increased with increasing planting density, as reported by Jia et al. [16]. In high-yielding maize cultivation, the majority of maize yield derives from the accumulation of photosynthetic productivity after flowering, which is positively correlated with grain yield and critical in determining maize yield [12].
Soil N deficiency can result in a large gap between crop N demand and soil N supply [17]. Nitrogen application can enhance the remobilization of the nutrient element from the nutritional organs of the crop to the grains and greatly promote the productivity of crops, which makes a great contribution to global food security [18]. The N consumption in China accounts for ~30% of the world total, which is one of the reasons why China has successfully fed 21.8% of the world population with only 6.8% of the world arable land [19]. However, excessive N input does not significantly improve crop yield, but causes the waste of resources and produces a series of environmental and ecological problems, such as the increased N deposition in the atmosphere [20], increased greenhouse gas emissions [21], excessive nitrate in groundwater [22] and soil acidification [2]. Therefore, optimizing N rate and improving N use efficiency are key to realizing the sustainable agricultural development in China. Accordingly, the appropriate N rate will not only guarantee maize yield, but also alleviate environmental problems [23,24].
Planting density and N rate can increase maize yield within appropriate ranges, which are efficient and practical measures to obtain favorable economic and environmental benefits [25]. Although many studies have explored the effects of planting density and N rate on maize growth and grain yield, their coupling effects on individual and population photosynthesis as well as grain-filling characteristics have been poorly understood. Therefore, the main objectives of this study were to (1) investigate the coupling effects of different planting densities and N rates on individual and population photosynthesis rates and grain-filling characteristics of two maize cultivars under mulched drip fertigation in an arid region of northwest China, and (2) explore the responses of maize yield and its components as well as water-nitrogen use efficiency to various planting densities and N rates.

2. Materials and Methods

2.1. Experimental Site Description

Field experiments were undertaken from May to September in 2020 at the Agricultural and Ecological Water Conservation Experimental Station of China Agricultural University in Wuwei County, Gansu Province, China (37°52′ N, 102°50′ E; 1580 m a.s.l.). This site has a temperate continental climate, with abundant light and heat but relatively short water resources supply. The average annual rainfall is 164 mm, while the annual evaporation is up to 2000 mm. The groundwater depth ranges from 40 to 50 m. The soil properties of the 0–20 cm soil layer before sowing in May 2020 were as follows: mean soil dry bulk density of 1.52 g cm−3, pH of 8.22, organic matter of 8.9 g kg−1, soil total nitrogen of 0.50 g kg−1, available phosphorus of 3.82 mg kg−1, available potassium of 114.5 mg kg−1, mineral nitrogen of 12.93 mg kg−1, field capacity of 32.9%, and wilting coefficient of 12% by weight. The irrigation water was groundwater with a salinity of 0.71 g L−1.

2.2. Experimental Design

The experiment was arranged in a split-split plot design, with planting density as the main plot, N rate as the subplot and maize cultivar as the sub-subplot. Based on the local planting density of 80,000 plants ha−1, three planting densities, i.e., low planting density (D1: 80,000 plants ha−1), medium planting density (D2: 100,000 plants ha−1), and high planting density (D3: 120,000 plants ha−1) were applied [25,26]. Based on the local N application rate of 240 kg ha−1 (N180), a reduced N rate of 180 kg ha−1 (N180) and a non-N fertilization treatment (N0) were further applied [25,26]. Two commonly cultivated maize varieties of QS51 (Shanxi Qiangsheng Seed Industry Co., Ltd., Taiyuan, China) and ZD958 (Institute of Food Crops, Henan Academy of Agricultural Sciences, Zhengzhou, China) were used in the experiment. Three replicates were set for each treatment, with a total of 54 plots, and the planting area per plot was 20 m2. The maize was seeded on 8 May and harvested on September 26 in 2020. Irrigation was conducted with the mulched drip irrigation system. Maize was planted in wide and narrow rows (80–40 cm), which is a common planting pattern in the study region, with the planting density adjusted by spacing adjustments (Figure 1). Other field management measures were the same as local practices. The drip tapes were laid before sowing maize, and they were then covered with transparent polyethylene film (1.2 m in width and 0.008 mm in thickness). The drip irrigation system mainly consisted of three parts, namely irrigation water, water distribution pipelines, and proportional fertilization pumps. The drip tape had a discharge rate of 2.3 L h−1 and two drip tapes were spaced 40 cm apart and placed in the middle of narrow rows. Urea (N-46%), potassium sulfate (K-52%), and calcium superphosphate (P-46%) were used as fertilizers. The amounts of calcium superphosphate and potassium sulfate applied in all treatments were 100 kg ha−1. During the whole growing period of maize, the three fertilizers were applied at the seedling stage, jointing stage, tasselling stage, and grain-filling stage, with the corresponding proportions of 20%, 30%, 30%, and 20%, respectively. Maize was irrigated at intervals of 10 days, and the irrigation amount was calculated based on reference evapotranspiration and crop coefficients as per Lai et al. [26]. If there was rainfall on the day of irrigation, the irrigation was postponed. Irrigation initiated at the three-leaf stage of maize and ended about 20 days before harvest. Over the entire growing period, maize was irrigated nine times, which totaled 317 mm for both maize cultivars.

2.3. Sampling and Measurements

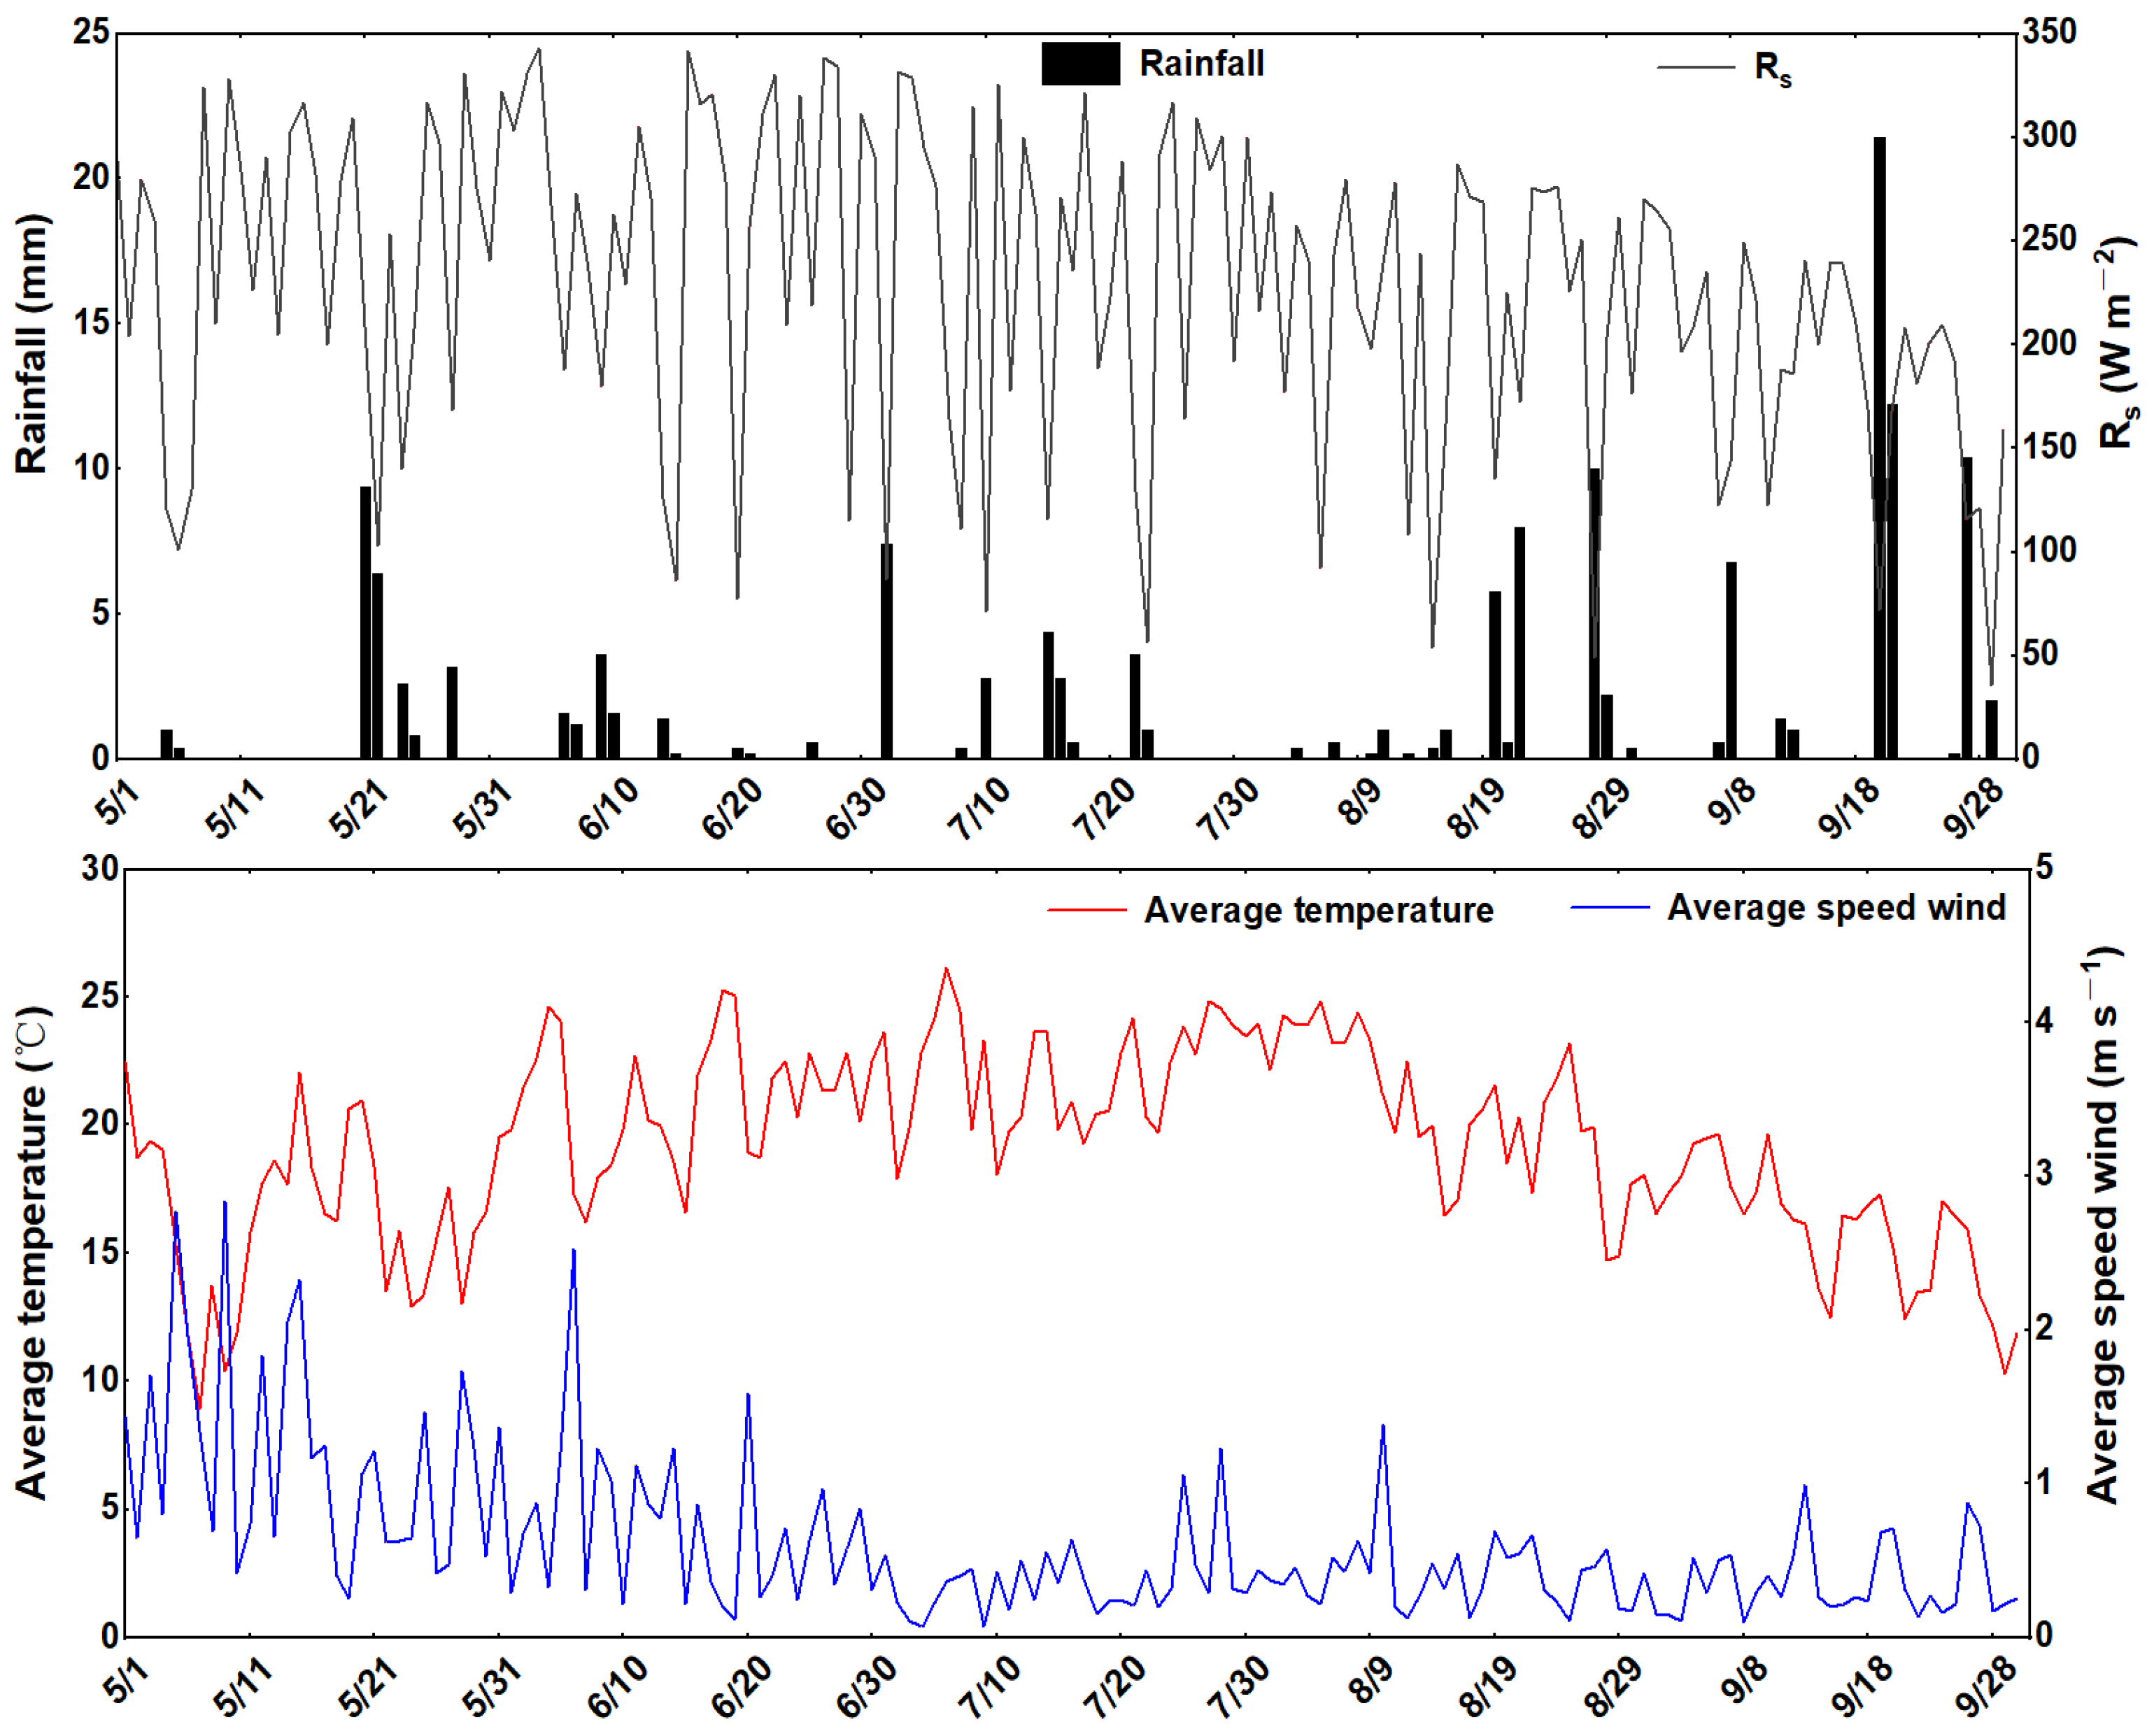
2.3.1. Meteorological Data

The meteorological data including solar radiation, air temperatures, wind speed, relative humidity, and rainfall were obtained from a standard automatic weather station (Hobo, Onset Computer., Bourne, MA, USA) installed at the experimental site. The daily average temperature, solar radiation, rainfall, and wind speed during the whole growing period of maize are shown in Figure 2.

2.3.2. Individual and Population Photosynthetic Rates

A Li-6400 portable photosynthesis system (Li-Cor Inc., Lincoln, NE, USA) was used to measure the net photosynthetic rate (Pn) of maize leaves (the uppermost fully expanded leaf was measured before heading) from 9:00 to 11:00 in the morning on sunny and cloudless days. Measurements were replicated three times for each treatment. The population Pn was calculated as follows:
P o p u l a t i o n   P n = I n d i v i d u a l   P n × L A I  
where LAI is the leaf area index.

2.3.3. Grain-Filling Process and Grain Weight Dynamics

At the tasselling stage, maize spikes were selected and marked. A total of 30 spikes per plot were marked, and three replicates (taking 100 grains per panicle in the middle plot) were collected from each plot at 5-day intervals from the silking stage to maturity. The collected grains were placed in an oven and dried at 105 °C for 1 h, followed by drying at 80 °C to a constant weight, and finally weighed on an electronic balance. The following logistic equations were used to fit the grain-filling process and to obtain the basic parameters for grain-filling characteristics. The independent variable was days after tasselling (t), and the dependent variable was the 100-grain weight per sample (y).
According to Wang et al. [24], the fitting equation was as follows:
y = a 1 + b e k t 1  
where y is the 100-grain weight (g); a is the theoretical maximum 100-grain weight (g); t is the number of days after silking (days); b is the initial value parameter; k is the growth rate parameter; e is the natural logarithm. The following values can be calculated from the above parameters:
t e = 6 / k
t m a x = l n b / k
A G F R m e a n = ak / 6  
G F R m a x = a k / 4
where te is the grain-filling duration time, tmax is the appearance time of maximum grain-filling rate, AGFR is the average grain-filling rate during the period, and GFRmax is the maximum grain-filling rate.
The fitting of population grain weight dynamics was also conducted based on the logistic growth function:
Y = A 1 + B e K t 1
where Y is the population grain weight (kg ha−1); B is the initial value parameter; K is the growth rate parameter. A, B, and K are the fitting parameters.
T e = 6 / K
T m a x = l n B / K
A G W R m e a n = A K / 6
G W R m a x = A K / 4
where Te is the duration time of grain weight increase, Tmax is the appearance time of maximum grain weight increase rate, AGWR is the average grain weight increase rate during the period, and GFRmax is the maximum grain weight increase rate.

2.3.4. Yield and Its Components

At the maturity stage, four rows of maize were harvested from the middle of each plot. After air drying, 20 spikes were randomly selected from each treatment. The yield components (spike length, rows per spike, grains per row, 100-grain weight, spike diameter, bare tip length, and grains per spike) were determined from spikes selected from each treatment. The grains per spike were estimated by multiplying grains per row by rows per spike. The harvested maize was threshed, and grain yield was determined.

2.3.5. Evapotranspiration, Water Use Efficiency, and Irrigation Water Use Efficiency

Evapotranspiration (ET) was calculated using the simplified soil water balance equation:
E T = P + I ± Δ S W S
where P is the rainfall during the whole growing period (mm); I is the irrigation amount during the whole growing period (mm); ΔSWS is the change of soil water storage in the 0–100 cm soil layer at the beginning and end of the experimental period (mm).
Water use efficiency (WUE) and irrigation water use efficiency (IWUE) were calculated as follows:
W U E = G Y / E T
I W U E = G Y / I
where GY is the grain yield (kg ha−1).

2.3.6. Nitrogen Use Efficiency

Three maize plants were selected from each treatment at harvest. The plants were separated as stem, leaf, and ear, which were then smashed and sieved through a 1 mm sieve and digested with H2SO4-H2O2. Total nitrogen was determined by the Auto Analyzer-III (Bran + Luebbe, Hamburg, Germany). N partial factor productivity (NPFP) was then calculated as follows:
N P F P = G Y / N

2.4. Statistical Analysis

Data processing was conducted in Excel 2016 (Microsoft Corp., Washington, DC, USA). Statistical analysis was conducted by the analysis of variance (ANOVA) using IBM SPSS software (version 26.0), and mean values of the analysis variances were compared for significance using Duncan’s multiple-range tests at p = 0.05 level. The Origin 2018 software was used to create figures.

3. Results

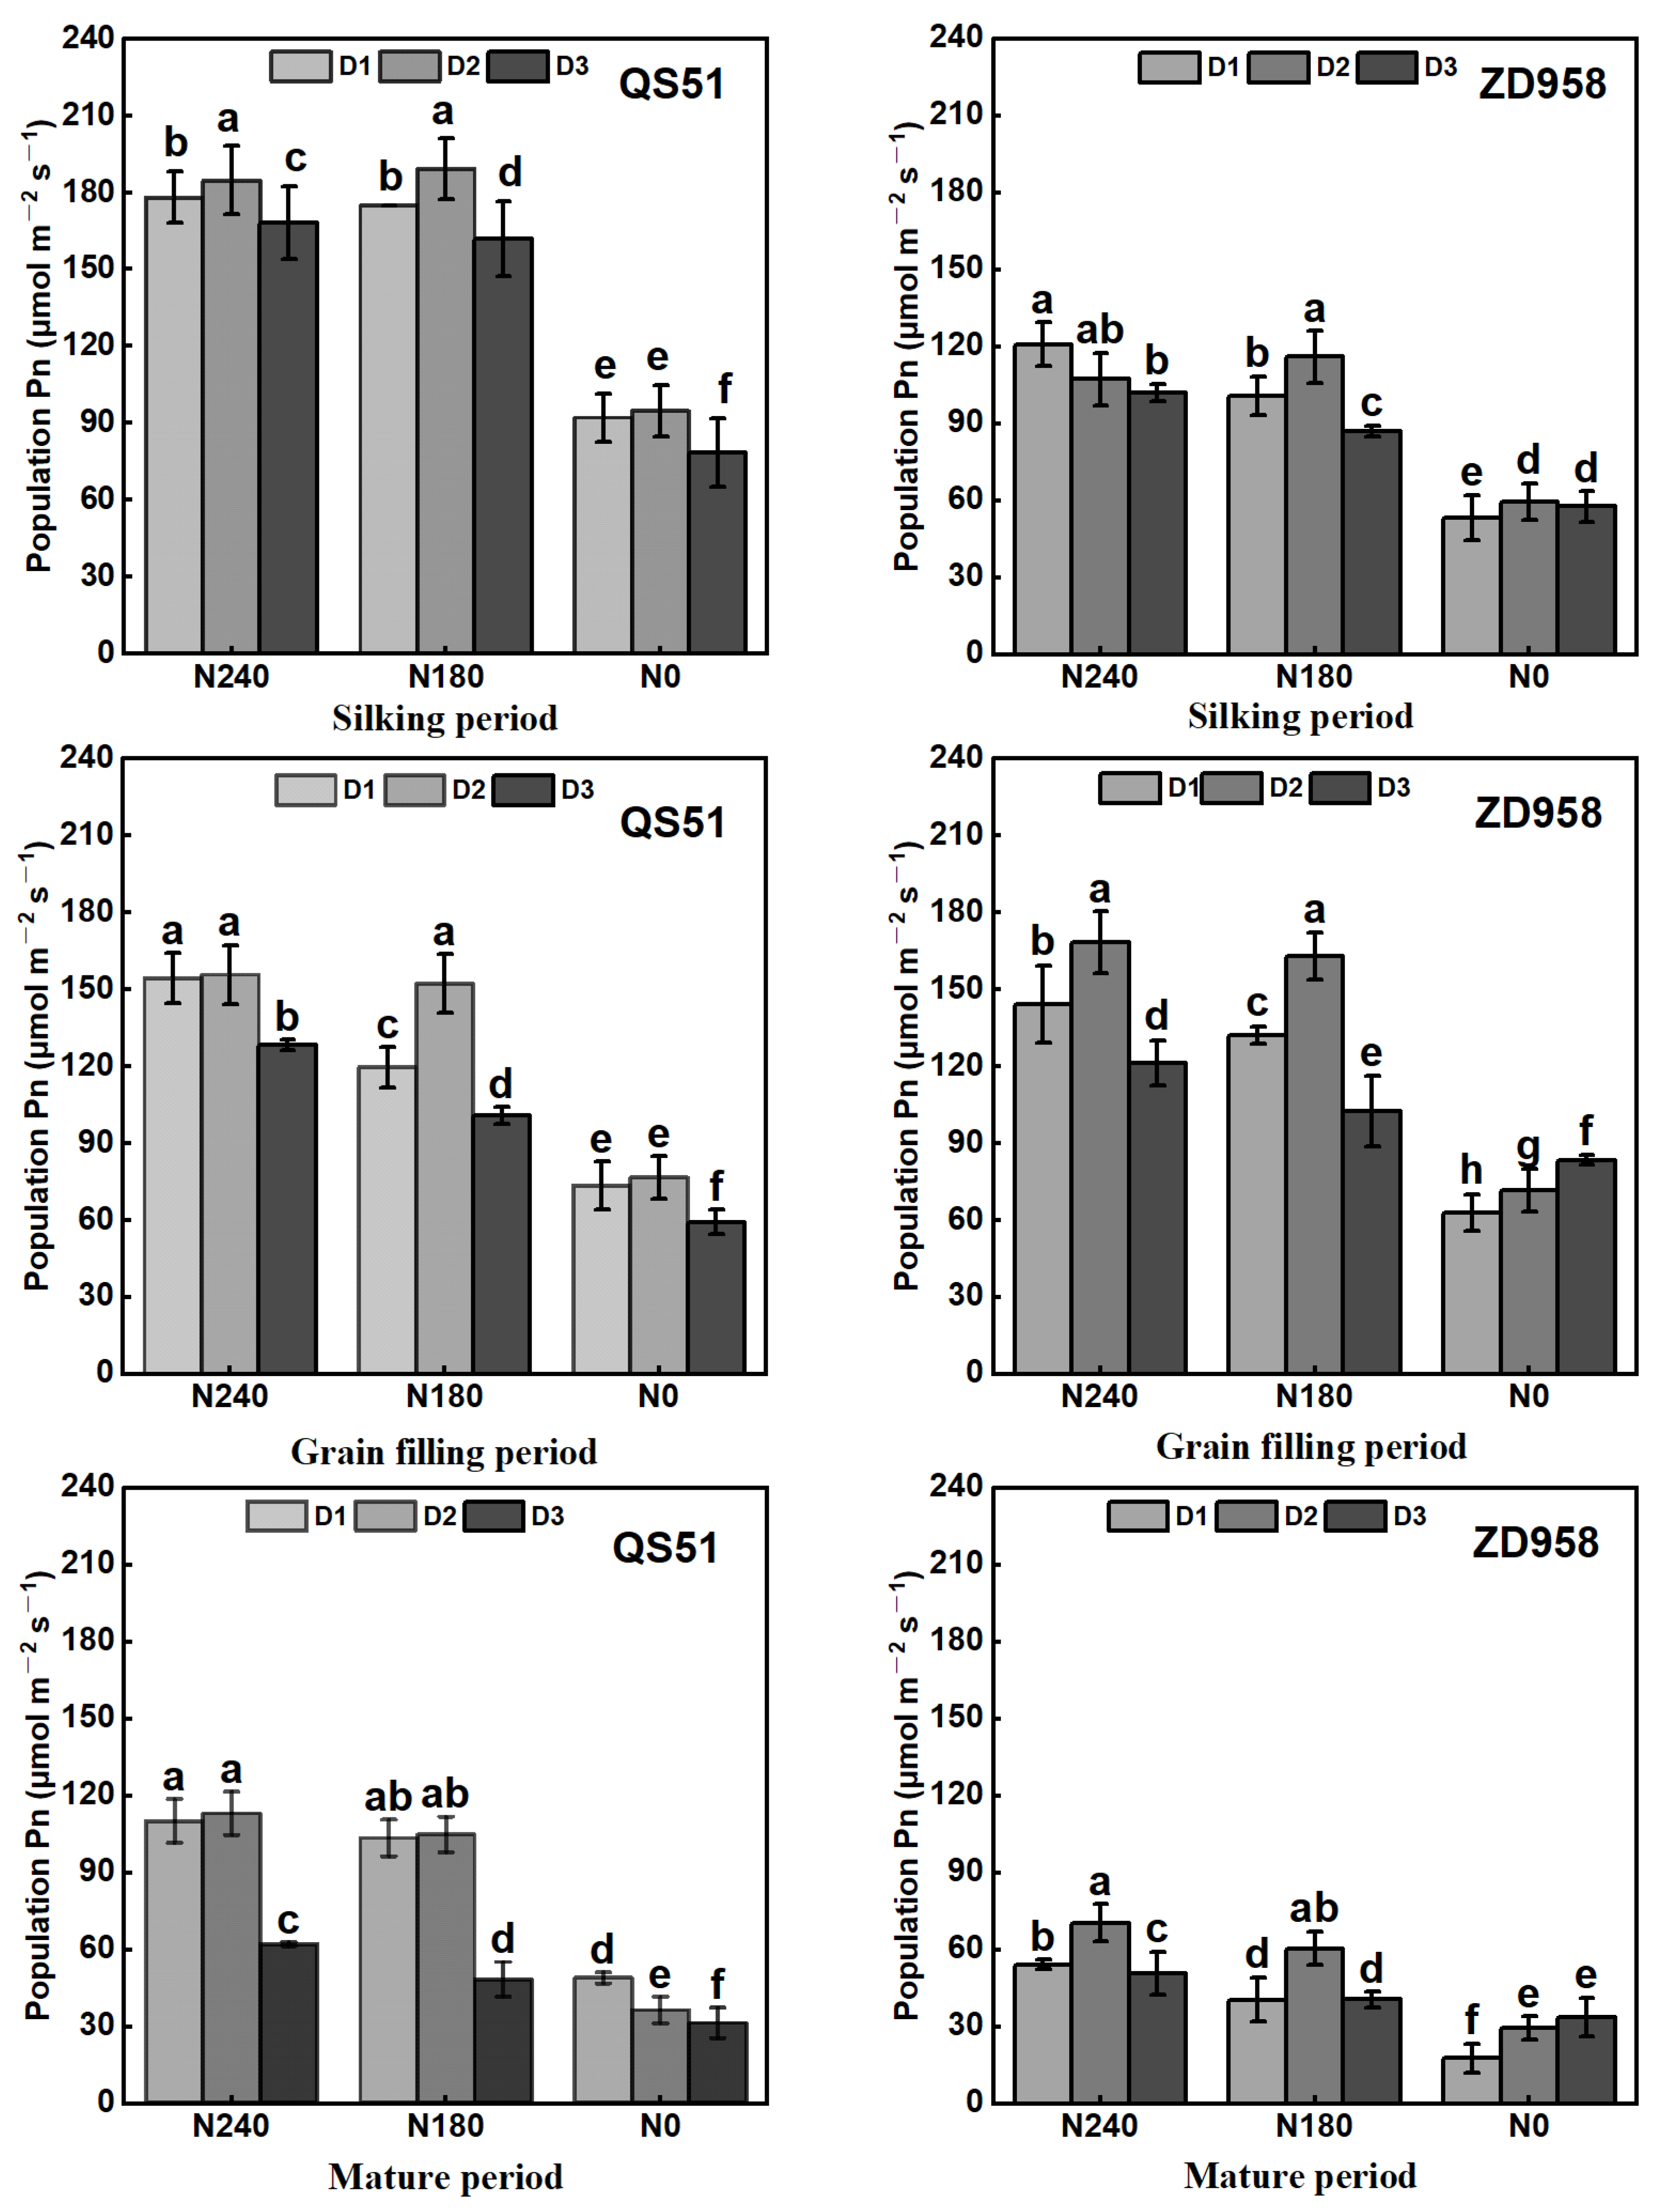
3.1. Individual and Population Photosynthesis Rates

As shown in Figure 3, the net photosynthetic rate (Pn) of individual maize plants decreased from the silking to maturity stages in all treatments. The maximum individual Pn occurred at the silking stage, after which individual Pn gradually decreased as maize plants senesced for the two maize varieties (Figure 3). Planting density and N rate had significant effects on individual Pn at the tasselling, grain filling, and maturity stages, while their interaction had no significant effect. Individual Pn increased with the increase in the N rate. For QS51, N240 significantly increased individual Pn by 13.5% (D1), 8.9% (D2), and 18.5% (D3) compared to N0, while the corresponding values were 14.6% (D1), 12% (D2), and 11% (D3) for ZD958, respectively. No significant difference was observed between N240 and N180 at the silking, grain filling, and maturity stages. Individual Pn decreased significantly with increasing planting density, especially at the silking and grain-filling stages. For QS51, the average Pn under D3 was 14.5% (N240), 12.2% (N180), and 7.9% (N0) lower than that under D1, while the average Pn at D2 was 5.2% (N240), 12.2% (N180), and 14.0% (N0) lower than that under D1. For ZD958, the average Pn at D3 was 15.2% (N240), 23.7% (N180), and 14.8% (N0) lower than that at D1, while the average Pn under D2 was 7.9% (N240), 6.5% (N180), and 5.5% (N0) lower than that at D1.
The changes in population Pn (Figure 4) among the treatments varied greatly from those of individual Pn. The population Pn showed a decreasing trend as the reproductive period progressed. The population Pn increased with increasing N ate at the same planting density for both varieties, but there was no significant difference between N180 and N240 at D1 and D2. At the same N rate, population Pn exhibited a first increasing and then decreasing trend with increasing planting density for both varieties, with the maximum population Pn at D2. Compared with D2, D1 and D3 reduced population Pn by 4.7% and 24.3%, respectively. Overall, the maximal population Pn was achieved in the D2N180 treatment, which had the highest potential for maize yield. In comparison with D1N240, D2N180 significantly increased population Pn by 3.8% (QS51) and 16.8% (ZD958).

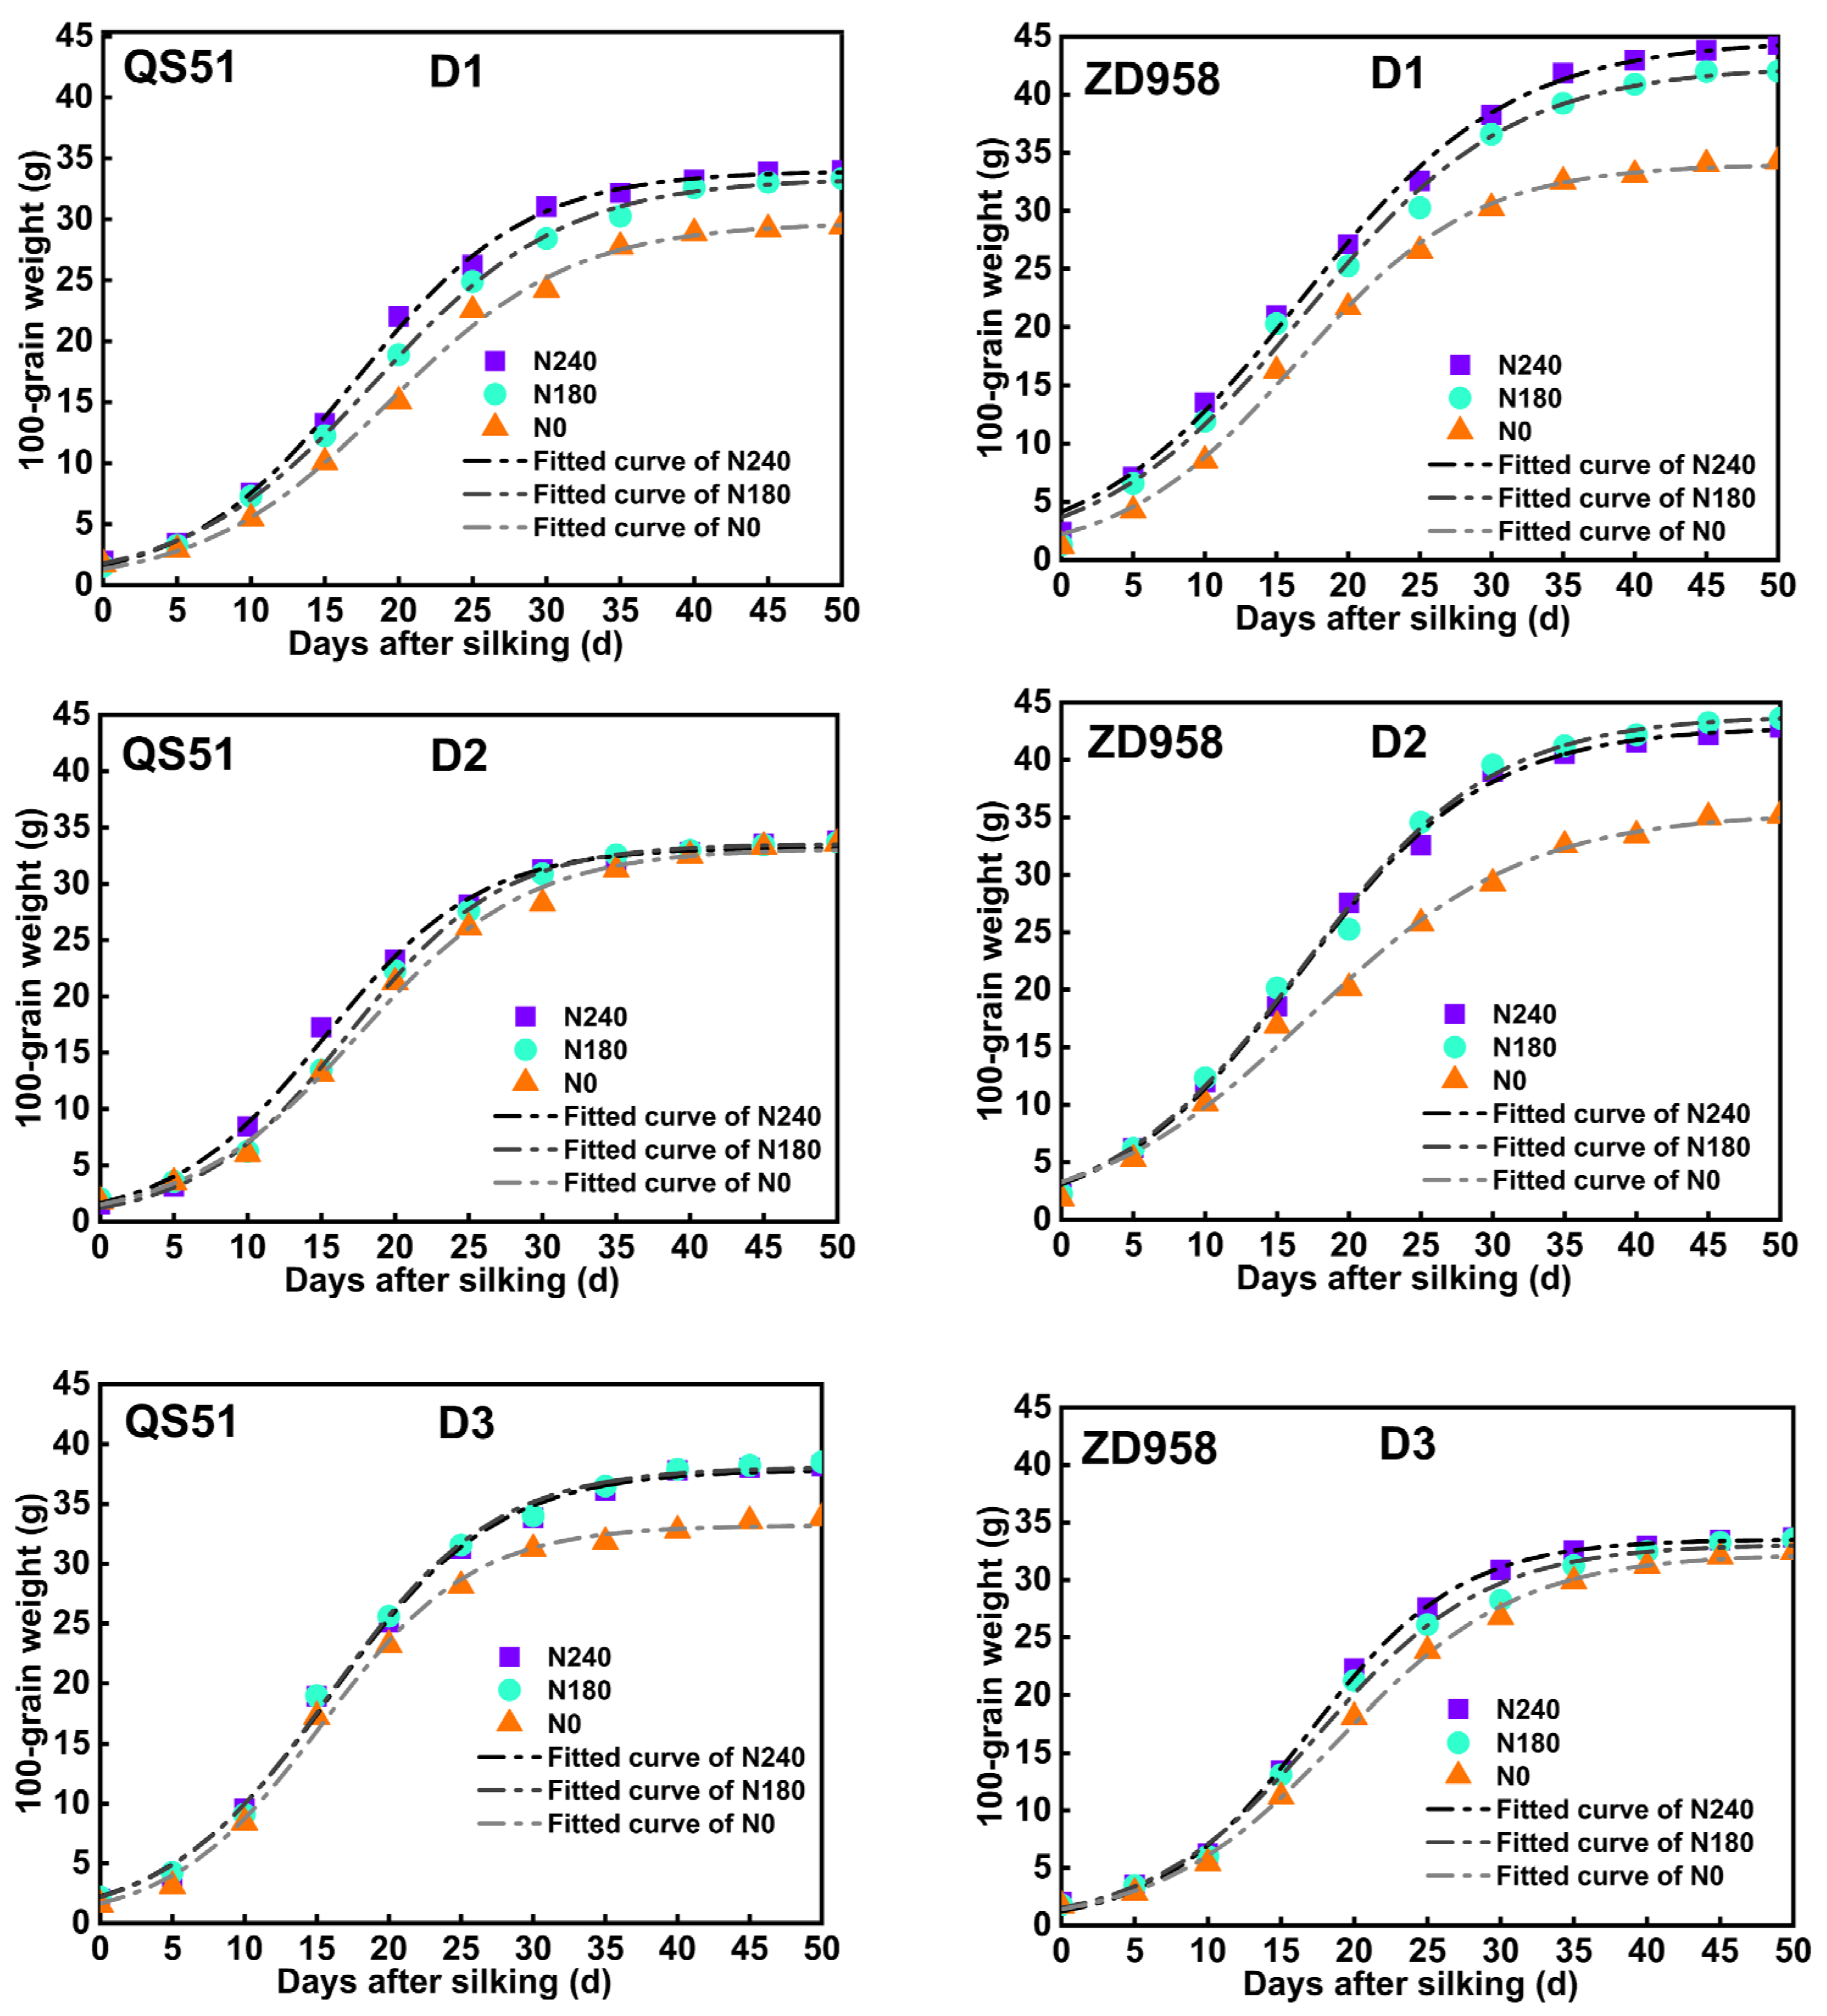
3.2. Grain-Filling Process and Grain Weight Dynamics

The 100-grain weight during the grain-filling period of maize showed a sigmoid pattern for the two maize varieties (Figure 5). The results indicated that the effects of planting density and N rate on the grain-filling process were mainly achieved by affecting tmax. Equation (1) provided an excellent fitting of the grain-filling process. The R2 ranged from 0.961 to 0.999 (p < 0.01). Therefore, the fitted parameters allowed further calculations of the characteristic parameters and then the analysis of the effect of planting densities and N rate on grain-filling characteristics. As shown in Table 1, tmax, te, and GFRmax were significantly affected by planting density and N rate for QS51 (p < 0.05). Only the N rate showed a significant effect on AGFR (p < 0.05). Planting density and N rate had significant effects on tmax and te (p < 0.05), and N rate had significant effects on GFRmax and AGFR for ZD958 (p < 0.05). Maize cultivar significantly affected tmax, te, GFRmax, and AGFR (p < 0.05). There was a significant C × N interaction on tmax (p < 0.05).
The same formula as that of grain filling was used to fit the dynamics of grain weight (Figure 6). The dynamics of grain weight presented an S-shaped curve for each treatment, and the fitted parameters for the two maize cultivars are displayed in Table 2. There were significant differences in grain weight among the treatments. Grain weight decreased slightly with the increase in N rate at D1 and D2, but it tended to decrease with increasing N rate at D3. At the same N rate, grain weight peaked at D2 for both maize cultivars, but no significant difference was observed between D2N180 and D2N240. As shown in Table 2, D, N, and C significantly affected Tmax, Te, GWRmax, and AGWRmean (p < 0.05).
The increase in planting density resulted in the decrease in grain-filling characteristic parameters, and the grain-filling characteristics parameters were significantly different at different N rates. Increasing the N rate increased the average tmax at the same planting density. The tmax was not significantly different between D1 and D2, but tmax appeared earlier at D3. For QS51, tmax at D3 was an average of 3.18 days (N240), 1.73 days (N180), and 4.14 days (N0) ahead of that at D2 and D1. For ZD958, tmax at D3 was an average of 2.17 days (N240), 1.64 days (N180), and 1.09 days (N0) ahead of that at D2 and D1. The average te first decreased and then slightly increased as the N rate increased at D1 and D2, while te increased with increasing N rate at D3 (Table 1). Both tmax and te were negatively correlated with planting density. The latest tmax and te were obtained at D2 (averaged at 28.0 and 45.0 days for QS51 and ZD958, respectively).
The increase in planting density led to the increase in GFRmax and AGFR and then slightly decreased at N240 and N180 (Table 1). However, with the increase in planting density, GFRmax and AGFR showed a downward trend at N0. The AGFR of ZD958 increased first and then decreased slightly with the increase in planting density at N0. GFRmax and AGFR of both maize varieties increased with increasing N rate at all planting densities (Table 1). The largest 100-grain weight (averaged 38.56 g for QS51 and 44.67 g for ZD958) was obtained at D2, and the smallest 100-grain weight was obtained at D3, followed by N0 (Table 3).
The Tmax and Te showed the same increasing trends with the increase in N rate; however, they exhibited opposite trends with the increase in planting density. The GWRmax showed an increasing and then decreasing trend with an increasing N rate at D1 and D2 but a continuous increase at D3. There was no significant difference in GWRmax between D2N240 and D2N180. It first increased and then decreased with increasing planting density at the same N rate, peaking at D2. In comparison with D2, D1 significantly decreased GWRmax by 27.6% (QS51) and 21.2% (ZD958), and D3 reduced GWRmax by 18.1% (QS51) and 10.9% (ZD958). AGWRmean and GWRmax exhibited similar variation trends.
Increasing planting density increased and then decreased grain-filling rate, which indicated that the light crowding stress was more favorable to the increase in grain weight. In addition, the grain-filling duration increased with increasing N rate, but there was no significant difference in GFRmax and AGFR between N240 and N180. The greatest GFRmax and AGFR were obtained in D2N180 and D2N240 (averaged at 1.105 g d−1 for QS51 and 0.945 g d−1 for ZD958), but the maximum grain weight was obtained in D2N180 for both maize varieties.

3.3. Grain Yield and Its Components

Table 3 summarizes grain yield and its components of the two maize varieties under various planting densities and N rates. The grain yield significantly differed at various planting densities (p < 0.01). With the increase in planting density, the bare tip increased, but the cob length, diameter, grains per row, and 100-grain weight decreased. Compared with D1, D2 and D3 increased grain yield by about 31.4% and 20.3% for QS51, while the corresponding values were 28.4% and 19.5% for ZD958, respectively (Table 3). The responses of grain yield to planting density increased first and then decreased under the competition for resources. In addition, high planting density significantly reduced grain yield mainly by reducing the grain number per row and 100-grain weight (p < 0.05). Maize cultivar exerted significant influences on 100-grain weight, bare tip length, ear number, grain number per ear, and grain yield (p < 0.05). D × N had a significant effect on ear length, grain number per ear, and grain yield (p < 0.05); N × C had significant effects on the other components of grain yield except for ear length and ear diameter (p < 0.05); D × N × C significantly influenced grain yield and grain number per ear (p < 0.05).
Planting density, N rate, and their interaction had significant effects on grain number per spike (p < 0.05, Table 3). With the increase in the N rate, the number of grains on the ears increased and then decreased for both maize varieties. The effects of planting density and N rate on 100-grain weight were significant for the two maize varieties (p < 0.05), but their interaction had no significant effect on 100-grain weight (p > 0.05, Table 3). The average number of grains per spike was 5.0% and 16.4% higher at D1 than that at D2 and D3, respectively.
Nitrogen rate also had a significant impact on grain yield (p < 0.01). The average yield of N240 and N180 was increased by 23.8% and 25.7% for QS51 and 36.8% and 36.4% for ZD958 compared with that of N0, respectively (Table 3). The response of grain yield to the N rate was different for the two maize varieties at various planting densities. At D1 and D2, the grain yield increased first and then decreased with the increase in the N rate. However, the grain yield continuously increased with the increase in the N rate at D3. The 100-grain weight of both maize varieties generally increased with increasing N rates at D2 and D3. However, it showed an increasing and then decreasing trend with the increase in the N rate at D1. Spike length, spike diameter, and spike number increased with increasing N rate at all three planting densities, and the length of the bare tip increased significantly at N180. However, excessive N application did not increase maize yield but reduced its yield because it resulted in a reduction in the number of spikes. The yield of both QS51 (15,093 kg ha−1) and ZD958 (17,644 kg ha−1) reached the maximum in D2N180.

3.4. Water Use Efficiency and Nitrogen Partial Factor Productivity

Planting density, N rate, and maize cultivar, as well as their interactions, had significant effects on ET, WUE, IWUE, and NPFP (Table 4). D × N, D × C, N × C, and D × N × C all significantly influenced WUE, IWUE, and NPFP. The WUE first increased and then decreased at different N rates for QS51, while the average WUE at D2 increased significantly by 7.1% and 7.4% compared with that at D1 and D3, respectively (p ≤ 0.05). However, for ZD958, WUE increased with increasing planting density, with a significant increase in 12.5% and 8.0% at D2 compared with D1 and D3, respectively (p ≤ 0.05). The WUE of both maize varieties increased and then decreased with increasing N rate at D1, peaking at N180, which was significantly increased compared to that at N240 (by 15.0% for QS51 and 7.8% for ZD958). At D2 and D3, WUE increased with an increasing N rate. The same trend as IWUE was observed in grain yield. The effects of planting density and N rate and their interaction on NPFP were significant for both QS51 and ZD958 (p < 0.01). The NPFP increased and then decreased with planting density, peaking at D2. At N180, D1N180 and D3N180 decreased NPFP by 19.4% (QS51), 17.4% (ZD958), and 16.1% (QS51), 12.7% (ZD958) compared to D2N180; at N240, D1N240 and D3N240 decreased NPFP by 20.8% (QS51) and 17.4% (ZD958) compared to D2N240, respectively. Planting density, N rate, and their interaction had significant effects on NPFP for both maize varieties (p < 0.01) (Table 4). At the same N rate, NPFP gradually increased for QS51 while it increased first and then decreased for ZD958 with increasing planting density. At the same planting density, the increase in N rate reduced NPFP, and it was significantly higher at N180 than at N240.

4. Discussion

4.1. Effects of Planting Density and Nitrogen Rate on Photosynthesis, Grain-Filling Characteristics, and Grain Weight Dynamics

Our study showed that N application significantly facilitated the increase in the population photosynthetic rate, but there was no significant difference between N240 and N180. Physiologically, this can be explained by the increase in leaf membrane lipid peroxidation in the absence of excess nitrogen. In the present study, individual Pn decreased gradually with increasing planting density. This was due to the fact that there was a significant difference in the nitrogen absorbed by individual plants at a given amount of nitrogen applied, which caused a decrease in Pn under dense planting. The reduced nitrogen absorption of individual plants might cause the proceeding ahead of leaf senescence, which in turn affects the content of leaf photosynthetic pigment and then affects its Pn [27]. The lack of nitrogen usually leads to the poor photosynthetic performance of leaves, which was similar to the finding in this study [28,29]. However, the different distribution of leaf area index within the canopy at different growth stages resulted in various distributions of light and N within the canopy, which in turn caused the variations of the effects of planting density and N rate on Pn of maize leaves at different growth stages. Relatively high-yielding maize depends on the availability of a high population photosynthetic rate. Our study indicates that the maximum population Pn was attained in D2N180. This was related to the relatively greater leaf area index and higher individual Pn in D2N180. The population Pn improved with the increase in planting density from D1 to D2 since it increased the population photosynthetic area of maize and improved the light transmittance of the lower and middle canopy, which could fully utilize the available light resources at various levels [30].
The grain-filling process is a key determinant of 100-grain weight and population grain weight. According to our study, the grain weight at N0 was significantly lower than that at N240 and N180 during the grain-filling process, which was consistent with previous studies [17,31]. The main reason was that N application increased the grain-filling rate and the mass of growth at the maximum filling rate and prolonged the active filling period of the grain, which increased the 100-grain weight. However, excess N application slightly decreased GFRmax and AGFR compared with N180 by reducing the accumulation of non-structural carbohydrates in pre-flowering stems and inhibiting the transfer of nutrients to the grains, which resulted in a greedy and late maturing plant and was not conducive to the increase in grain weight [32]. Jiang [33] found that the effect of high N on grain weight was not significant, and even grain weight was decreased, which was in line with our study. In our study, with the increase in planting density, the grain-filling rate increased first and then decreased. Present studies have shown that the occurrence of early decay and a corresponding decrease in the number of lower leaves were observed when maize planting density was excessive [34,35], which reduced the grain-filling period. Consistent with previous studies [31], high planting density reduced the grain-filling duration (Table 1). Consequently, high-density maize increased the competition for resources among populations, which may directly lead to a decrease in carbohydrate accumulation in cobs. As a result, carbohydrates transported to grains may be reduced. In our study, the duration of the filling time decreased with increasing planting density, and the time to reach the maximum grain-filling rate was also delayed with increasing planting density, which explained the low 100-grain weight under high density, thereby affecting the yield increase [5]. Excessive planting density and N rate resulted in a high leaf area index and shading of the plant leaves, which caused a reduction in grain-filling rate under high planting density [36].

4.2. Effects of Planting Density and Nitrogen Rate on Grain Yield and Its Components

When a certain number of ears of maize have been established, it is important to harmonize the number of grains per spike with the grain weight in sequence to further increase the yield of maize [37]. The improvement of yield by N application is mainly demonstrated by the increase in the number of grains in the spike. Within a certain range, increasing the N rate can significantly increase grain development of the upper ear of maize, reduce the length of the bald tip and increase the number of grains in the spike, thereby enhancing the effect of yield. However, excessive N application may cause plant over-nutrition, which delays plant senescence, causing plants to turn green belatedly with an eventual reduction in grain yield caused by insufficient dry matter accumulation [13,17]. Planting density had significant effects on grain yield and its components. With the increase in planting density, the bare tip increased, but the cob length, diameter, grains per row, and 100-grain weight decreased, which were similar to the results of Dou et al. [38]. An increase in planting density enhanced the seasonal interception of solar radiation, thereby increasing photosynthesis in the plant population canopy (Figure 3) and accumulation of biomass, which caused an increase in grain yield. Many studies have shown that increased planting density increased crop competition for light, heat, water, and fertilizer resources and affected light quality, reducing the proportion of red and far red light at the bottom of crop canopy as a result of increased planting density, which in turn inhibited crop growth [39]. Much research has demonstrated that high planting densities reduced the utilization of light, heat, water, and other growth factors, which in turn led to a reduction in dry matter, leaf area, and photosynthetic products allocated to the cob in the upper part of the maize field, and ultimately to a reduction in grain yield [40]. Our results found that excess N application contributed to higher yields at excessive planting density. The results of this study showed that maize yield was highest under the combination of medium planting density (D2) and medium nitrogen ate (N180), reaching 15,093 kg ha−1 for QS51 and 17,644 kg ha−1 for ZD958, which increased maize yield by about 6.3% and 1.4% compared with the combination of medium planting density (D2) and high N rate (N240), respectively.

4.3. Effects of Planting Density and Nitrogen Rate on Water-Nitrogen Use Efficiency

Optimal N application should balance crop N requirements with N effectiveness and maximize crop grain yield while achieving resource conservation and preventing environmental damage [15,16,17,18]. The main effect of the N rate on improving WUE is to increase evapotranspiration from canopy plants by promoting plant growth and allowing the canopy to expand more rapidly [41,42]. In this case, the grain yield relates to the WUE at N0, which is lower only when the grain yield is low. Moreover, maize growth was more sensitive to moisture at high N rates, so WUE at N240 was lower than that at N180. Due to the increased sensitivity of maize to soil moisture, which resulted in lower WUE and Pn at N180 compared with N240 [43]. Compared with the high N treatment, the degree of leaf curling decreased under low N treatment when maize plants were subjected to soil water stress, so low N treatment achieved higher WUE [44].
Nowadays, one of the major purposes for achieving long-term sustainability in agriculture is to achieve greater NPFP. The more N transferred from vegetative organs to grains at the grain-filling stage, the stronger N assimilation ability after silking can not only increase maize yield but also improve N productivity. The increase in the N rate usually leads to a decrease in NPFP [45]. Contrarily, reducing the N rate can balance crops’ requirements for N and their availability of it [42]. According to our research, NPFP increased with planting density from D1 to D2. This was mainly due to the fact that increasing planting density maximized the absorption of nutrients applied in fertilizers and other organic sources of available N. In contrast, NPFP decreased with increasing planting density from D2 to D3. As the most substantial organ for absorption and storage of nitrogen in pre-anthesis plants, the decline in leaf N concentration of maize under crowded stress (high planting density) may be the source. Modifications in the nitrogen distribution among plant organs will result in a reduction in leaf concentration [45].
Stem development was significantly impacted by planting density and N rate. The optimum planting density was typically site-specific and completely reliant on the environment. According to our findings, high densities potentially cause the plant to be more agitated when there is a deficit of water easily accessible. WUE increased with planting density until a critical threshold, after which it decreased, with the possible exception of years of exceptional drought, according to the findings of several earlier studies [46]. According to Peake et al. [47], increasing maize planting density caused WUE to first increase and then decrease. As compared to that at D1, the average WUE at D2 increased by 8.8%. However, if compared to that at D2, the average WUE at D3 decreased by 12.7%. This resulted from an increase in ET and a noticeably lower grain yield at D3 than at D2. In addition, at D1 and D2, WUE at N240 was lower than that at N180, owing to the high sensitivity of plants to soil moisture at high N rates.
The patchy distribution of fertility in the experimental field exerts a random effect on the grain yield of each experimental plot. This error is randomly generated and unavoidable, and the magnitude of values and the occurrence of positive and negative values are not certain and can only be reduced by a reasonable trial design. Experimental errors caused by soil differences can be significantly reduced by a reasonable field trial design. Setting up multiple replicates at the same time not only reduces the error but also allows the magnitude of the experimental error to be estimated based on the differences in the observed values in different plots of the same treatment.

5. Conclusions

Exploring photosynthesis and grain-filling characteristics can provide ideas for maize management at the physiological level. The population photosynthetic rate of both maize varieties increased with the increase in the N rate at the same planting density. The maximum population photosynthetic rate was obtained in the D2N180 treatment. Grain weight, maximum and average filling rates, and grain yield of both varieties reached the maximum in the D2N180 treatment, with no significant difference between D2N180 and D2N240, which demonstrated that the optimized planting density and N rate increased grain yield by increasing both population photosynthetic rate and grain weight. Both WUE and NPFP presented increasing and then decreasing trends with increasing planting density and N rate within certain planting density and N rate ranges. Overall, the D2N180 treatment was more favorable for grain yield, WUE, and NPFP of maize. This study can provide guidance for the selection of reasonable planting density and N management strategies of maize under mulched drip irrigation in northwest China. Further studies may focus on investigating the sink-source relationships, grain nutrients dynamic, and hormonal responses under different planting densities and N rates.

Author Contributions

Conceptualization, J.F.; methodology, Z.L.; validation, H.K.; formal analysis, Z.L.; investigation, X.X.; resources, S.L.; data curation, R.Y.; writing—original draft preparation, Z.L.; writing—review and editing, J.F. and F.Z.; visualization, J.F.; supervision, J.F. and F.Z.; project administration, J.F.; funding acquisition, J.F. All authors have read and agreed to the published version of the manuscript.

Funding

This study was funded by the National Natural Science Foundation of China (52279048) and by the Chinese Universities Scientific Fund (2452020018).

Data Availability Statement

All data will be made available on request to the correspondent author’s e-mail with appropriate justification.

Conflicts of Interest

The authors declare no conflict of interest.

References

  1. Cassman, K.G.; Dobermann, A.; Walters, D.T.; Yang, H. Meeting cereal demand while protecting natural resources and improving environmental quality. Annu. Rev. Environ. Resour. 2003, 28, 315–358. [Google Scholar] [CrossRef] [Green Version]
  2. Cassman, K.G.; Liska, A.J. Food and fuel for all: Realistic or foolish? Biofuels Bioprod. Biorefin. 2007, 1, 18–23. [Google Scholar] [CrossRef] [Green Version]
  3. Grassini, P.; Thorburn, J.; Burr, C.; Cassman, K.G. High-yield irrigated maize in the Western U. S. corn belt: I. On-farm yield, yield potential, and impact of agronomic practices. Field Crop Res. 2011, 120, 142–150. [Google Scholar] [CrossRef] [Green Version]
  4. Muhammad, K.; Su, W.; Ahmad, I.; Meng, X.; Cui, W.; Zhang, X.; Mou, S.; Aaqil, K.; Han, Q.; Liu, T. Application of paclobutrazol affect maize grain yield by regulating root morphological and physiological characteristics under a semi-arid region. Sci. Rep. 2018, 8, 4818. [Google Scholar]
  5. Jiang, Q.; Du, Y.; Tian, X.; Wang, Q.; Xiong, R.; Xu, G.; Yan, C.; Ding, Y. Effect of panicle nitrogen on grain filling characteristics of high-yielding rice cultivars. Eur. J. Agron. 2016, 74, 185–192. [Google Scholar] [CrossRef]
  6. Okamura, M.; Arai-Sanoh, Y.; Yoshida, H.; Mukouyama, T.; Adachi, S.; Yabe, S.; Nakagawa, H.; Tsutsumi, K.; Taniguchi, Y.; Kobayashi, N.; et al. Characterization of high-yielding rice cultivars with different grain-filling properties to clarify limiting factors for improving grain yield. Field Crops Res. 2018, 2191, 39–147. [Google Scholar] [CrossRef]
  7. Li, Y.; Pang, H.; Li, H.; Li, Y.; Xue, Y.; Dong, G.; Gao, L.; Wang, X. Effects of deep vertically rotary tillage on grain filling and yield of spring maize in North Huang-Huai-Hai region. Sci. Agric. Sin. 2013, 46, 3055–3064, (In Chinese with English abstract). [Google Scholar]
  8. Shen, L.; Chao, X. Research on grain filling characteristics of different nitrogen efficiency genotypes of maize. J. Henan Agric. Sci. 2017, 46, 7–12, (In Chinese with English abstract). [Google Scholar]
  9. Shen, L.; Hunag, Y.; Li, T. Top-grain filling characteristics at an early stage of maize (Zea mays L.) with different nitrogen use efficiencies. J. Integr. Agric. 2017, 16, 626–639. [Google Scholar] [CrossRef] [Green Version]
  10. Tollenaar, M.; Wu, J. Yield improvement in temperate maize is attributable to greater stress tolerance. Crop Sci. 1999, 39, 1597–1604. [Google Scholar] [CrossRef]
  11. Tokatlidis, I.S.; Koutroubas, S.D. A review of maize hybrids’ dependence on high plant populations and its implications for crop yield stability. Field Crops Res. 2004, 88, 103–114. [Google Scholar] [CrossRef]
  12. Liu, G.; Hou, P.; Xie, R.; Ming, B.; Wang, K.; Xu, W.; Liu, W.; Yang, Y.; Li, S. Canopy characteristics of high-yield maize with yield potential of 22.5 Mg ha-1. Field Crops Res. 2017, 213, 221–230. [Google Scholar] [CrossRef]
  13. Xu, W.J.; Liu, C.W.; Wang, K.R.; Xie, R.Z.; Ming, B.; Wang, Y.H.; Zhang, G.Q.; Liu, G.Z.; Zhao, R.L.; Fan, P.P.; et al. Adjusting maize plant density to different climatic conditions across a large longitudinal distance in China. Field Crops Res. 2017, 212, 126–134. [Google Scholar] [CrossRef]
  14. Assefa, Y.; Prasad, P.V.V.; Carter, P.; Hinds, M.; Bhalla, G.; Schon, R.; Jeschke, M.; Paszkiewicz, S.; Ciampitti, I.A. Yield responses to planting density for US modern corn hybrids: A synthesis-analysis. Crop Sci. 2016, 56, 2802. [Google Scholar] [CrossRef] [Green Version]
  15. Assefa, Y.; Carter, P.; Hinds, M.; Bhalla, G.; Schon, R.; Jeschke, M.; Paszkiewicz, S.; Smith, S.; Ciampitti, I.A. Analysis of long-term study indicates both agronomic optimal plant density and increase maize yield per plant contributed to Yield Gain. Sci. Rep. 2018, 8, 4937. [Google Scholar] [CrossRef] [Green Version]
  16. Jia, Q.M.; Sun, L.F.; Wang, J.J.; Li, J.; Shahzad, A.; Liu, T.N.; Zhang, P.; Lian, Y.H.; Ding, R.X.; Ren, X.L.; et al. Limited irrigation and planting densities for enhanced water productivity and economic returns under the ridge-furrow system in semi-arid regions of China. Field Crops Res. 2018, 221, 207–218. [Google Scholar] [CrossRef]
  17. Zhou, B.; Sun, X.; Wang, D.; Ding, Z.; Li, C.; Ma, W.; Zhao, M. Integrated agronomic practice increases maize grain yield and nitrogen use efficiency under various soil fertility conditions. Crop J. 2019, 7, 527–538. [Google Scholar] [CrossRef]
  18. Cheng, M.; Wang, H.; Fan, J.; Zhang, F.; Wang, X. Effects of Soil Water Deficit at Different Growth Stages on Maize Growth, Yield, and Water Use Efficiency under Alternate Partial Root-Zone Irrigation. Water 2021, 13, 148. [Google Scholar] [CrossRef]
  19. Chen, K.; Kumudini, S.V.; Tollenaar, M.; Vyn, T.J. Plant biomass and nitrogen partitioning changes between silking and maturity in newer versus older maize hybrids. Field Crops Res. 2015, 183, 315–328. [Google Scholar] [CrossRef]
  20. Le, C.; Zha, Y.; Sun, Y.; Lu, D.; Yin, H. Eutrophication of lake waters in China: Cost, causes, and control. Environ. Manag. 2010, 45, 662–668. [Google Scholar] [CrossRef]
  21. Aerts, R. Nutrient resorption from senescing leaves of perennials: Are there general patterns? J. Ecol. 1996, 84, 597–608. [Google Scholar] [CrossRef]
  22. Jongkaewwattana, S.; Geng, S.; Brandon, M.D.; Hill, J.E. Effect of nitrogen and harvest grain moisture on head rice yield. Agron. J. 1993, 85, 1143–1146. [Google Scholar] [CrossRef]
  23. Hua, L.M.; Squires, V. Managing China’s pastoral lands: Current problems and future prospects. Land Use Policy 2015, 43, 129–137. [Google Scholar] [CrossRef]
  24. Wang, X.; Zhang, L.; Liu, S.; Cao, Y.; Wei, W.; Liu, C.; Wang, Y.; Bian, S.; Wang, L. Grain filling characteristics of maize hybrids differing in maturities. Sci. Agric. Sin. 2014, 47, 3557–3565, (In Chinese with English abstract). [Google Scholar]
  25. Zou, H.; Fan, J.; Zhang, F.; Xiang, Y.; Wu, L.; Yan, S. Optimization of drip irrigation and fertilization regimes for high grain yield, crop water productivity and economic benefits of spring maize in Northwest China. Agric. Water Manag. 2020, 230, 105986. [Google Scholar] [CrossRef]
  26. Lai, Z.; Fan, J.; Yang, R.; Xu, X.; Liu, L.; Li, S.; Zhang, F.; Li, Z. Interactive effects of plant density and nitrogen rate on grain yield, economic benefit, water productivity and nitrogen use efficiency of drip-fertigated maize in northwest China. Agric. Water Manag. 2022, 263, 107453. [Google Scholar] [CrossRef]
  27. Ren, B.; Dong, S.; Liu, P.; Zhao, B.; Zhang, J. Ridge tillage improves plant growth and grain yield of waterlogged summer maize. Agric. Water Manag. 2016, 177, 392–399. [Google Scholar] [CrossRef]
  28. Duan, W.; Zhao, H.; Guo, C.; Xiao, K.; Li, Y. Photosynthetic characteristics of summer maize in response to nitrogen dosage. J. Crop Sci. 2007, 6, 949–954, (In Chinese with English abstract). [Google Scholar]
  29. Chen, S.; Yin, M.; Zheng, X.; Liu, S.; Chu, G.; Xu, C.; Wang, D.; Zhang, X. Effect of dense planting of hybrid rice on grain yield and solar radiation use in Southeastern China. Agron. J. 2019, 111, 1229–1238. [Google Scholar] [CrossRef] [Green Version]
  30. Wang, H.; Li, J.; Cheng, M.; Zhang, F.; Wang, X.; Fan, J.; Wu, L.; Fang, D.; Zou, H.; Xiang, Y. Optimal drip fertigation management improves yield, quality, water and nitrogen use efficiency of greenhouse cucumber. Sci. Hortic. 2019, 243, 357–3664. [Google Scholar] [CrossRef]
  31. Shi, J.; Cui, H.; Zhao, B.; Dong, S.; Liu, P.; Zhang, J. Effect of light on yield and characteristics of grain-filling of summer maize from flowering to maturity. Sci. Agric. Sin. 2013, 46, 4427–4434, (In Chinese with English abstract). [Google Scholar]
  32. Xu, T.; Lyu, T.; Zhao, J.; Wang, R.; Chen, C.; Liu, Y.; Liu, X.; Wang, Y.; Liu, C. Photosynthetic characteristics, dry matter accumulation and translocation, grain filling parameter of three main maize cultivars in production. Acta Agron. Sin. 2018, 44, 414–422, (In Chinese with English abstract). [Google Scholar] [CrossRef]
  33. Jia, B.; Fu, J. Nitrogen Uptake and Nitrogen Deficit Model of Drip Irrigation Maize in Ningxia Based on Critical Nitrogen Concentration. Trans. Chin. Soc. Agri. Mach. 2020, 51, 256–263, (In Chinese with English abstract). [Google Scholar]
  34. Sylvesterbradley, R.; Kindred, D.R. Analysing nitrogen responses of cereals to prioritize routes to the improvement of nitrogen use efficiency. J. Exp. Bot. 2009, 60, 1939–1951. [Google Scholar] [CrossRef] [PubMed] [Green Version]
  35. Yang, J.; Zhang, J.; Wang, Z.; Zhu, Q.; Liu, L. Water deficit–Induced senescence and its relationship to the remobilization of pre-stored carbon in wheat during grain filling. Agron. J. 2001, 93, 196–206. [Google Scholar] [CrossRef]
  36. Sarula; Yang, H.; Zhang, R.; Li, Y.; Meng, F.; Ma, J. Impact of Drip Irrigation and Nitrogen Fertilization on Soil Microbial Diversity of Spring Maize. Plants 2022, 11, 3206. [Google Scholar] [CrossRef]
  37. Alves, S.S.; Higino, V.J.; Bispo, D.; Da, S.; Cabral, A.C. Impact of Irrigation Frequency and Planting Density on Bean’s Morpho-Physiological and Productive Traits. Water 2020, 12, 2468. [Google Scholar] [CrossRef]
  38. Dou, C.Y.; Yu, X.Q.; Yu, J.C. Effects of planting density on plant growth and water consumption of ZhongDi77 maize under controlled irrigation. Agric. Res. Arid Areas 2013, 31, 141–145. [Google Scholar]
  39. Xu, L.; Yan, Y.; Mei, P.P.; Chen, S.L.; Wang, S.D. Effect of planting density on grain filling characteristics of different maize varieties. Shan East Agri. Sci. 2020, 52, 20–23, (In Chinese with English abstract). [Google Scholar]
  40. Zhang, P.; Chen, G.; Geng, P.; Gao, Y.; Zheng, L.; Zhang, S.; Wang, P. Effects of high temperature during grain filling period on superior and inferior kernels’ development of different heat sensitive maize cultivars. Sci. Agric. Sin. 2017, 50, 2061–2070, (In Chinese with English abstract). [Google Scholar]
  41. Guo, Q.; Huang, G.; Guo, Y.; Zhang, M.; Zhou, Y.; Duan, L. Optimizing irrigation and planting density of spring maize under mulch drip irrigation system in the arid region of Northwest China. Field Crops Res. 2021, 266, 108141. [Google Scholar] [CrossRef]
  42. Ciampitti, I.A.; Vyn, T.J. A comprehensive study of plant density consequences on nitrogen uptake dynamics of maize plants from vegetative to reproductive stages. Field Crops Res. 2011, 121, 2–18. [Google Scholar] [CrossRef]
  43. Lamptey, S.; Li, L.; Xie, J.; Zhang, R.; Yeboah, S.; Antille, D.L. Photosynthetic response of maize to nitrogen fertilization in the semiarid western loess plateau of China. Crop Sci. 2017, 57, 2739–2752. [Google Scholar] [CrossRef]
  44. Rudnick, D.R.; Irmak, S.; Djaman., K.; Sharma, V. Impact of irrigation and nitrogen fertilizer rate on soil water trends and maize evapotranspiration during the vegetative and reproductive periods. Agric. Water Manag. 2017, 191, 77–84. [Google Scholar] [CrossRef]
  45. Wang, Y.; Zhang, X.Y.; Chen, J.; Chen, A.J.; Wang, L.Y.; Guo, X.Y.; Niu, Y.L.; Liu, S.R.; Mi, G.H.; Gao, Q. Reducing basal nitrogen rate to improve maize seedling growth, water and nitrogen use efficiencies under drought stress by optimizing root morphology and distribution. Agric. Water Manag. 2019, 212, 328–337. [Google Scholar] [CrossRef]
  46. AlKaisi, M.; Yin, X. Effects of nitrogen rate irrigation rate, and plant population on corn yield and water use efficiency. Agron. J. 2003, 95, 1475–1482. [Google Scholar] [CrossRef] [Green Version]
  47. Peake, A.S.; Huth, N.I.; Kelly, A.M.; Bell, K.L. Variation in water extraction with maize plant density and its impact on model application. Field Crops Res. 2013, 146, 31–37. [Google Scholar] [CrossRef]
Figure 1. The schematic diagram of maize planting pattern with 80 cm wide and 40 cm narrow rows. (A) D1: 80,000 plants ha−1, with plant spacing of 21 cm; (B) D2: 100,000 plants ha−1, with plant spacing of 17 cm; (C) D3: 120,000 plants ha−1, with plant spacing of 14 cm.
Water 15 00163 g001
Figure 2. Daily average rainfall, solar radiation (Rs), wind speed, and temperature during the whole growing period of spring maize in 2020.
Water 15 00163 g002
Figure 3. Effects of planting density and nitrogen (N) rate on individual photosynthetic rate (Pn) of maize at different growth stages. D1: 80,000 plants ha−1; D2: 100,000 plants ha−1; D3: 120,000 plants ha−1; N0: no N application; N180: 180 kg N ha−1; N240: 240 kg N ha−1. Bars are the means ± standard deviation (n  =  3). Different lower-case letters denote significant differences at p < 0.05 among treatments at the same growth stage.
Water 15 00163 g003
Figure 4. Effects of planting density and nitrogen (N) rate on population photosynthetic rate (Pn) of maize at different growth stages. D1: 80,000 plants ha−1; D2: 100,000 plants ha−1; D3: 120,000 plants ha−1; N0: no N application; N180: 180 kg N ha−1; N240: 240 kg N ha−1. Bars are the means  ±  standard deviation (n = 3). Different lower-case letters denote significant differences at p < 0.05 among treatments at the same growth stage.
Water 15 00163 g004
Figure 5. Dynamic changes of 100-grain weight for QS51 and ZD958. D1: 80,000 plants ha−1; D2: 100,000 plants ha−1; D3: 120,000 plants ha−1; N0: no N application; N180: 180 kg N ha−1; N240: 240 kg N ha−1.
Water 15 00163 g005
Figure 6. Dynamic changes of grain weight for QS51 and ZD958. D1: 80,000 plants ha−1; D2: 100,000 plants ha−1; D3: 120,000 plants ha−1; N0: no N application; N180: 180 kg N ha−1; N240: 240 kg N ha−1.
Water 15 00163 g006
Table 1. Analysis of variance of maize grain-filling characteristics parameters under different planting densities and nitrogen rates for QS51 and ZD958.
CultivarTreatmenttmax (d)te (d)GFRmax (g d−1)AGFR (g d−1)
QS51D124.5 ± 5.3 a44.0 ± 1.8 a0.96 ± 0.03 a0.81 ± 0.02 a
D222.6 ± 6.3 b43.8 ± 2.3 a0.94 ± 0.08 b0.8 ± 0.07 a
D320.6 ± 6.6 c38.3 ± 0.8 b0.89 ± 00.04 c0.75 ± 0.03 b
N24026.6 ± 1.8 a42.8 ± 3.2 a0.97 ± 0.04 a0.82 ± 0.04 a
N18025.5 ± 1.9 a43.1 ± 4.2 a0.94 ± 0.04 b0.80 ± 0.04 a
N015.6 ± 2.8 b40.2 ± 2.4 b0.88 ± 0.05 c0.74 ± 0.04 b
ZD958D122.31 ± 4.76 a42.8 ± 1.31 a1.09 ± 0.09 a0.92 ± 0.08 b
D221.97 ± 4.88 a41.15 ± 0.89 b1.08 ± 0.15 a0.98 ± 0.08 a
D321.12 ± 5.22 a37.81 ± 1.07 c0.92 ± 0.06 b0.79 ± 0.06 c
N24025.72 ± 1.25 a41.4 ± 2.37 a1.11 ± 0.16 a0.96 ± 0.12 a
N18025.09 ± 0.97 a41.36 ± 3.25 a1.09 ± 0.11 a0.93 ± 0.11 b
N015.83 ± 0.65 c39.46 ± 2.4 a0.91 ± 0.07 b0.81 ± 0.08 c
ANOVAD**nsns
N****
C****
D × Nnsnsnsns
D × Cnsnsnsns
C × N*nsnsns
D × N × Cnsnsnsns
Note: The same letter in each column indicates that there is no significant (p < 0.05) difference between the two groups (n = 3). ns represents non-significant, and ‘*’ represents significance at the 0.05 level.
Table 2. Analysis of variance of maize grain weight characteristics parameters at different planting densities and nitrogen rates for QS51 and ZD958.
TreatmentTmax (d)Te (d)GWRmax
(kg ha−1 d−1)
AGWRmean
(kg d−1 ha−1 d−1)
R2
QS51D1N24027.88 a44.67 a474.11 c316.07 c0.998
N18027.86 a44.51 a483.51 c322.34 c0.999
N017.9 d42.79 b343.96 e229.31 e0.998
D2N24027.13 ab44.93 a622.51 a415.01 a0.998
N18026.05 b44.01 a639.44 a426.29 a0.998
N015.62 e41.22 b536.21 b357.47 b0.999
D3N24024.6 c39.98 c533.33 b355.55 b0.997
N18024.35 d38.81 d477.91 c318.61 c0.996
N012.99 f36.95 e462.01 d308.01 d0.997
ZD958D1N24026.31 a43.7 a470.48 e313.65 e0.997
N18025.86 a43.94 a505.13 d336.75 d0.998
N016.46 e40.98 c396.64 g264.43 g0.999
D2N24026.26 a41.02 ab672.82 a448.55 a0.998
N18025.24 ab42.67 a670.34 a446.89 a0.998
N016.01 f40.33 d398.58 g265.72 g0.997
D3N24024 c38.52 e596.35 b397.57 b0.998
N18023.23 d37.57 f546.47 c364.31 c0.991
N015.04 g36.29 g408.49 f272.33 f0.995
D ****
N ****
C ****
D × N nsnsnsns
D × C nsnsnsns
C × N nsnsnsns
D × C × N nsnsnsns
Note: The same letter in each column indicates that there is no significant (p < 0.05) difference between the two groups (n = 3). ns represents non-significant, and ‘*’ represents significance at the 0.05 level.
Table 3. Grain yield and its components for QS51 and ZD958 in 2020.
Maize CultivarTreatmentEar Length (cm)100-Grain Weight (g)Ear Diameter (mm)Bare Tip Length (cm)Ear NumberGrain Number per EarGrain Yield
(kg ha−1)
QS51D1N24021.96 a35.24 cde54.74 a1.30 e39 a398 a11,207 e
D1N18021.01 a35.98 bc53.86 a1.18 d38 a387 a11,136 ef
D1N019.91 cd34.51 cde50.56 d1.98 b34 c303 e8362 g
D2N24020.50 b38.34 abc52.27 b1.95 b36 b391 a14,195 b
D2N18020.58 b38.56 a53.15 ab1.86 c36 b370 b15,093 a
D2N018.36 e33.85 cd48.11 ef2.54 ab31 e336 c11,368 f
D3N24019.99 c33.74 cde51.63 c1.92 bc34 c325 cd13,141 c
D3N18019.28 d32.60 de50.78 d1.86 c32 d324 d12,672 d
D3N018.77 e32.41 e49.42 e2.58 a33 cd293 f11,392 ef
ZD958D1N24023.67 a44.35 a54.01 b0.68 d37 a400 b13,235 e
D1N18021.51 b42.03 d53.68 bc0.69 d36 a433 a14,560 d
D1N019.01 c34.28 h53.13 cd0.78 c35 b359 d9847 h
D2N24018.53 cd42.85 c53.10 cd0.64 d36 a407 b17,444 a
D2N18018.02 d43.67 b58.23 a0.67 d36 a404 b17,644 a
D2N017.79 e35.19 g53.28 c1.08 ab35 b340 e11,977 fg
D3N24017.61 e34.01 h55.47 b0.95 b34 c393 bc16,037 b
D3N18017.01 f33.50 i54.32 b1.05 ab34 c382 c15,400 c
D3N017.53 ef29.43 j54.31 b1.14 a33 d303 f12,333 f
ANOVAD******ns*****
N******ns****
Cns*ns****
D × N*ns**nsns****
D × C*nsnsnsns****
C × Nns*ns****
D × N ×Cnsnsnsnsns**
Note: The same letter in each column indicates that there is no significant (p < 0.05) difference between the two groups (n = 3). ns represents non-significant, ‘*‘represents significance at the 0.05 level, and ‘**’ represents significance at the 0.01 level.
Table 4. Effects of different planting densities and nitrogen rates on water-fertilizer use efficiency of the two maize varieties.
Planting DensityNitrogen RateET (mm)WUE (kg kg−1)IWUE (kg kg−1)NPFP (kg kg−1)
QS51ZD958QS51ZD958QS51ZD958QS51ZD958
D1N0343.06 k333.79 k2.91 cde2.51 def3.10 i2.64 h//
N180446.02 gh424.23 h3.30 b2.62 d4.59 e3.51 d81.21 c61.64 c
N240465.02 f460.79 f2.87 ef2.43 ef4.17 f3.53 e55.03 f46.67 f
D2N0451.19 g441.15 g2.714 f2.58 de3.78 g3.58 fg//
N180519.06 b494.96 c3.42 b3.05 a5.56 a4.76 a98.37 a83.93 a
N240486.80 e472.36 e3.64 a3.01 ab5.50 a4.47 a73.51 d58.91 d
D3N0419.19 i403.47 i2.96 cde2.83 c3.89 g3.59 f//
N180513.36 c498.01 b3.09 cd2.54 de4.85 c4.00 c85.92 b70.43 b
N240548.97 a508.39 a3.00 cde2.58 de5.06 b4.14 b67.87 e54.57 e
ANOVAD****************
N***************
C*ns*ns*ns*ns
D × N********
D × C****
C × N****
D × N ×C****
Note: The same letter in each column indicates that there is no significant (p < 0.05) difference between the two groups (n = 3). ns represents non-significant, ‘*’ represents significance at the 0.05 level, and ‘**’ represents significance at the 0.01 level.
Disclaimer/Publisher’s Note: The statements, opinions and data contained in all publications are solely those of the individual author(s) and contributor(s) and not of MDPI and/or the editor(s). MDPI and/or the editor(s) disclaim responsibility for any injury to people or property resulting from any ideas, methods, instructions or products referred to in the content.

