Article

Integrated and Individual Impacts of Land Use Land Cover and Climate Changes on Hydrological Flows over Birr River Watershed, Abbay Basin, Ethiopia

by
Demelash Ademe Malede
1,2,*,
Tena Alamirew
3 and
Tesfa Gebrie Andualem
4,5
1
Department of Hydrology and Water Resource Management at Africa Center of Excellence for Water Management, Addis Ababa University, Addis Ababa P.O. Box 1176, Ethiopia
2
Department of Natural Resources Management, Debre Markos University, Debre Markos P.O. Box 269, Ethiopia
3
Water and Land Resource Center, Ethiopian Institute of Water Resource, Addis Ababa University, Addis Ababa P.O. Box 1176, Ethiopia
4
Department of Hydraulic and Water Resources Engineering, Debre Tabor University, Debre Tabor 272, Ethiopia
5
UniSA-STEM, University of South Australia, Adelaide, SA 5095, Australia
*
Author to whom correspondence should be addressed.
Water 2023, 15(1), 166; https://doi.org/10.3390/w15010166
Submission received: 10 November 2022 / Revised: 26 December 2022 / Accepted: 28 December 2022 / Published: 31 December 2022
(This article belongs to the Special Issue Impacts of Climate Change on Hydrology and Water Resources)

Abstract

:
Land use/land cover (LULC) and climate change are the two major environmental factors that affect water resource planning and management at different scales. This study aims to investigate the effects of LULC and climate change patterns for a better understanding of the hydrological processes of the Birr River watershed. To examine the effects of LULC and climate change patterns on hydrology, three periods of climate data (1986–1996, 1997–2007 and 2008–2018) and three sets of LULC maps (1986, 2001 and 2018) were established. The changes in hydrological flow caused by climate and LULC changes were estimated using the soil and water assessment tool (SWAT) and indicator of hydrological alteration (IHA) method. Results showed that the SWAT model performed well during the calibration and validation period at monthly timestep, with R2 and NSE values of (0.83 and 0.81) and (0.80 and 0.71), respectively. The LULC change increased surface runoff while decreasing baseflow, water yield, and evapotranspiration. This was due to increased agriculture and settlements, and a reduction in bushland, forest, and grassland. Climate change increased surface runoff and water yield while decreasing baseflow and evapotranspiration during 1996–2006. The combined effect of LULC and climate reveals increased surface runoff and a decreased trend of evapotranspiration, whereas baseflow and water yield showed inconsistency. In addition, the IHA found no statistically significant increasing trend for one-day, three-days, seven-day, and thirty-day minimum and maximum daily streamflow in the Birr River watershed. These findings will be useful to authorities, water engineers, and managers concerned with hydrology, LULC, and climate.

1. Introduction

Lan use/land cover (LULC) and climate change are the two major environmental components that had a significant effect on the hydrological process and socioeconomic activities, which directly affects water resource management and development [1,2,3,4,5]. The patterns of LULC and climate change are dynamic, with the effects of natural phenomena and anthropogenic activities primarily governing their prevalent processes [6,7]. Various anthropogenic activities of LULC changes, such as rapid urbanization, agricultural expansion, deforestation, industrialization, and other human activities can have a significant effect on streamflow, surface runoff, groundwater flow, water yield, and evapotranspiration of a watershed [8,9,10]. Climate change also has a wide range of effects on the hydrological cycle in a variety of ways, including changes in peak flow and volume [11,12,13,14]. Moreover, both the quantity and quality of water are constantly deteriorating as a result of mining activities and the conversion of forests into agricultural areas. Mining increases land degradation and soil erosion, whereas deforestation increases surface runoff and decreases baseflow on agricultural and urbanization fields [15] As a result, LULC and climate change had a detrimental effect on long-term water resource management, and development [16,17]. Hence, to effectively manage the available water resource for various uses, the watershed’s water should be adequately quantified and estimated.
Analyzing and quantifying the impact of LULC and climate change on the hydrological flows of a watershed is a challenge because of the complex relationship between landscape, LULC, climate, and hydrology [6]. Thus, understanding these impacts at a watershed scale is essential for land use planners, policymakers, stakeholders, and water planners and managers. Studies of LULC and climate change patterns, and implications can also pave the way for the development and implementation of appropriate land management strategies [18,19]. Local and regional knowledge is especially important in the Birr watershed, which contains many small rivers and streams that supply water to the Birr River [20]. Several studies have been conducted to better understand the separate impact of LULC or climate change on hydrological flow in a watershed [19,21,22,23]. However, it is critical to recognize the cumulative effect of these LULC and climate change factors. [24,25,26]. The integrated and individual effects of climate and land cover change influence the hydrological processes of a watershed [27,28,29]. Although, the magnitude of the change varies among watersheds depending on the watershed’s characteristics such as vegetation cover, climate condition, land cover, and topography. Therefore, studying the effects of changes in climate and land cover drivers on hydrological response has become a major research topic in recent decades [30]. Many scholars studied LULC and climate change effects on hydrological processes all over the world [24,31,32,33,34,35,36], however, it is complicated to quantify the hydrological process [37]. Some researchers recently also concluded that the effects of LULC and climate change on streamflow varied over several regions as a result of the difference in soil type, terrain, human activities, and climate conditions [1,38,39,40]. For instance, Kuma et al. and Chen et al. [28,29] reported that climate change has a greater impact on hydrologic response than land cover change. On the other hand, land cover changes are more sensitive to hydrologic responses than climate change [5,7,41]. Patel and Verma [42] stated that changes in LULC contribute to an increase in streamflow and a decrease in evapotranspiration, primarily as a result of increased urbanization and decreased water bodies and forest cover. Thus, it is important to consider the effect of both climate and land cover changes on hydrological processes. This study used soil and water assessment tools (SWAT) and indicators of hydrological alteration (IHA) to investigate how changes in hydrological processes within the Birr River watershed. Because of the limited data, there are fewer studies in which SWAT has been applied in the Birr River watershed. IHA is used to estimate the magnitude of changes in hydrological flow fluctuation caused by climate and anthropogenic changes Additionally, this study raised concerns about resource degradation, particularly the loss of vegetation and its transformation in other land LULC types. The transformation of land use is the result of human-induced systems, which are primarily disrupting watershed streamflow regimes.
Many types of research have been conducted to investigate the effect of climate and LULC change on hydrological flows using a hydrological model due to the enormous economic and social importance of these climate and LULC changes [25,43,44,45,46,47,48]. Regional and local studies have been conducted using the SWAT model to investigate the response of hydrological variables to LULC and climate change in a watershed [49,50,51,52,53,54,55]. The SWAT model is a physically-based semi-distributed hydrological model that is used worldwide. It is user-friendly and freely available, and it estimates surface runoff using a modified Soil Conservation Service Curve Number (SCS–CN) technique. The model has been used to monitor and control, changes in LULC and climate changes in the Birr River watershed.
The Birr River watershed mainly experienced rapid LULC and climate change, high population growth, and decreased surface water availability, due to high agricultural water demand [56]. Most local people in the watershed depend on rainfed agriculture and small-scale irrigation schemes for their livelihoods, which have been severely impacted by LULC and climate change. Land degradation from soil erosion, deforestation, and uncontrolled hillside farming is a serious problem in the watershed [20]. The study area has high deforestation and steep slopes employed by farmland for crop production, resulting in severe land degradation. Vegetations are becoming scarce as a result of increased cultivation, settlements, and land degradation. Thus, quantifying the individual and integrated effects of land use and climate change on various hydrological processes on a local scale (watershed level) and identifying the relative contribution of these changes is the novelty of the study. The study provides more information on the integrated and individual effects of land use and climate change drivers for a better understanding of the hydrological processes in the Birr River watershed. Furthermore, the study would have the highest impact and be useful in developing policies and strategies for sustainable land and water resource management practices in the study area. Therefore, the main goal of this study was (i) to determine the impact of integrated climate and LULC change on hydrological processes (surface runoff, baseflow, water yield, and evapotranspiration) over 32 years (1986–2018) (ii) to analyze the relative contribution of individual climate and LULC cover change on hydrological processes (iii) to model and understand the availability of streamflow in the Birr River watershed for the effect of climate and land use changes using the IHA.

2. Materials and Method
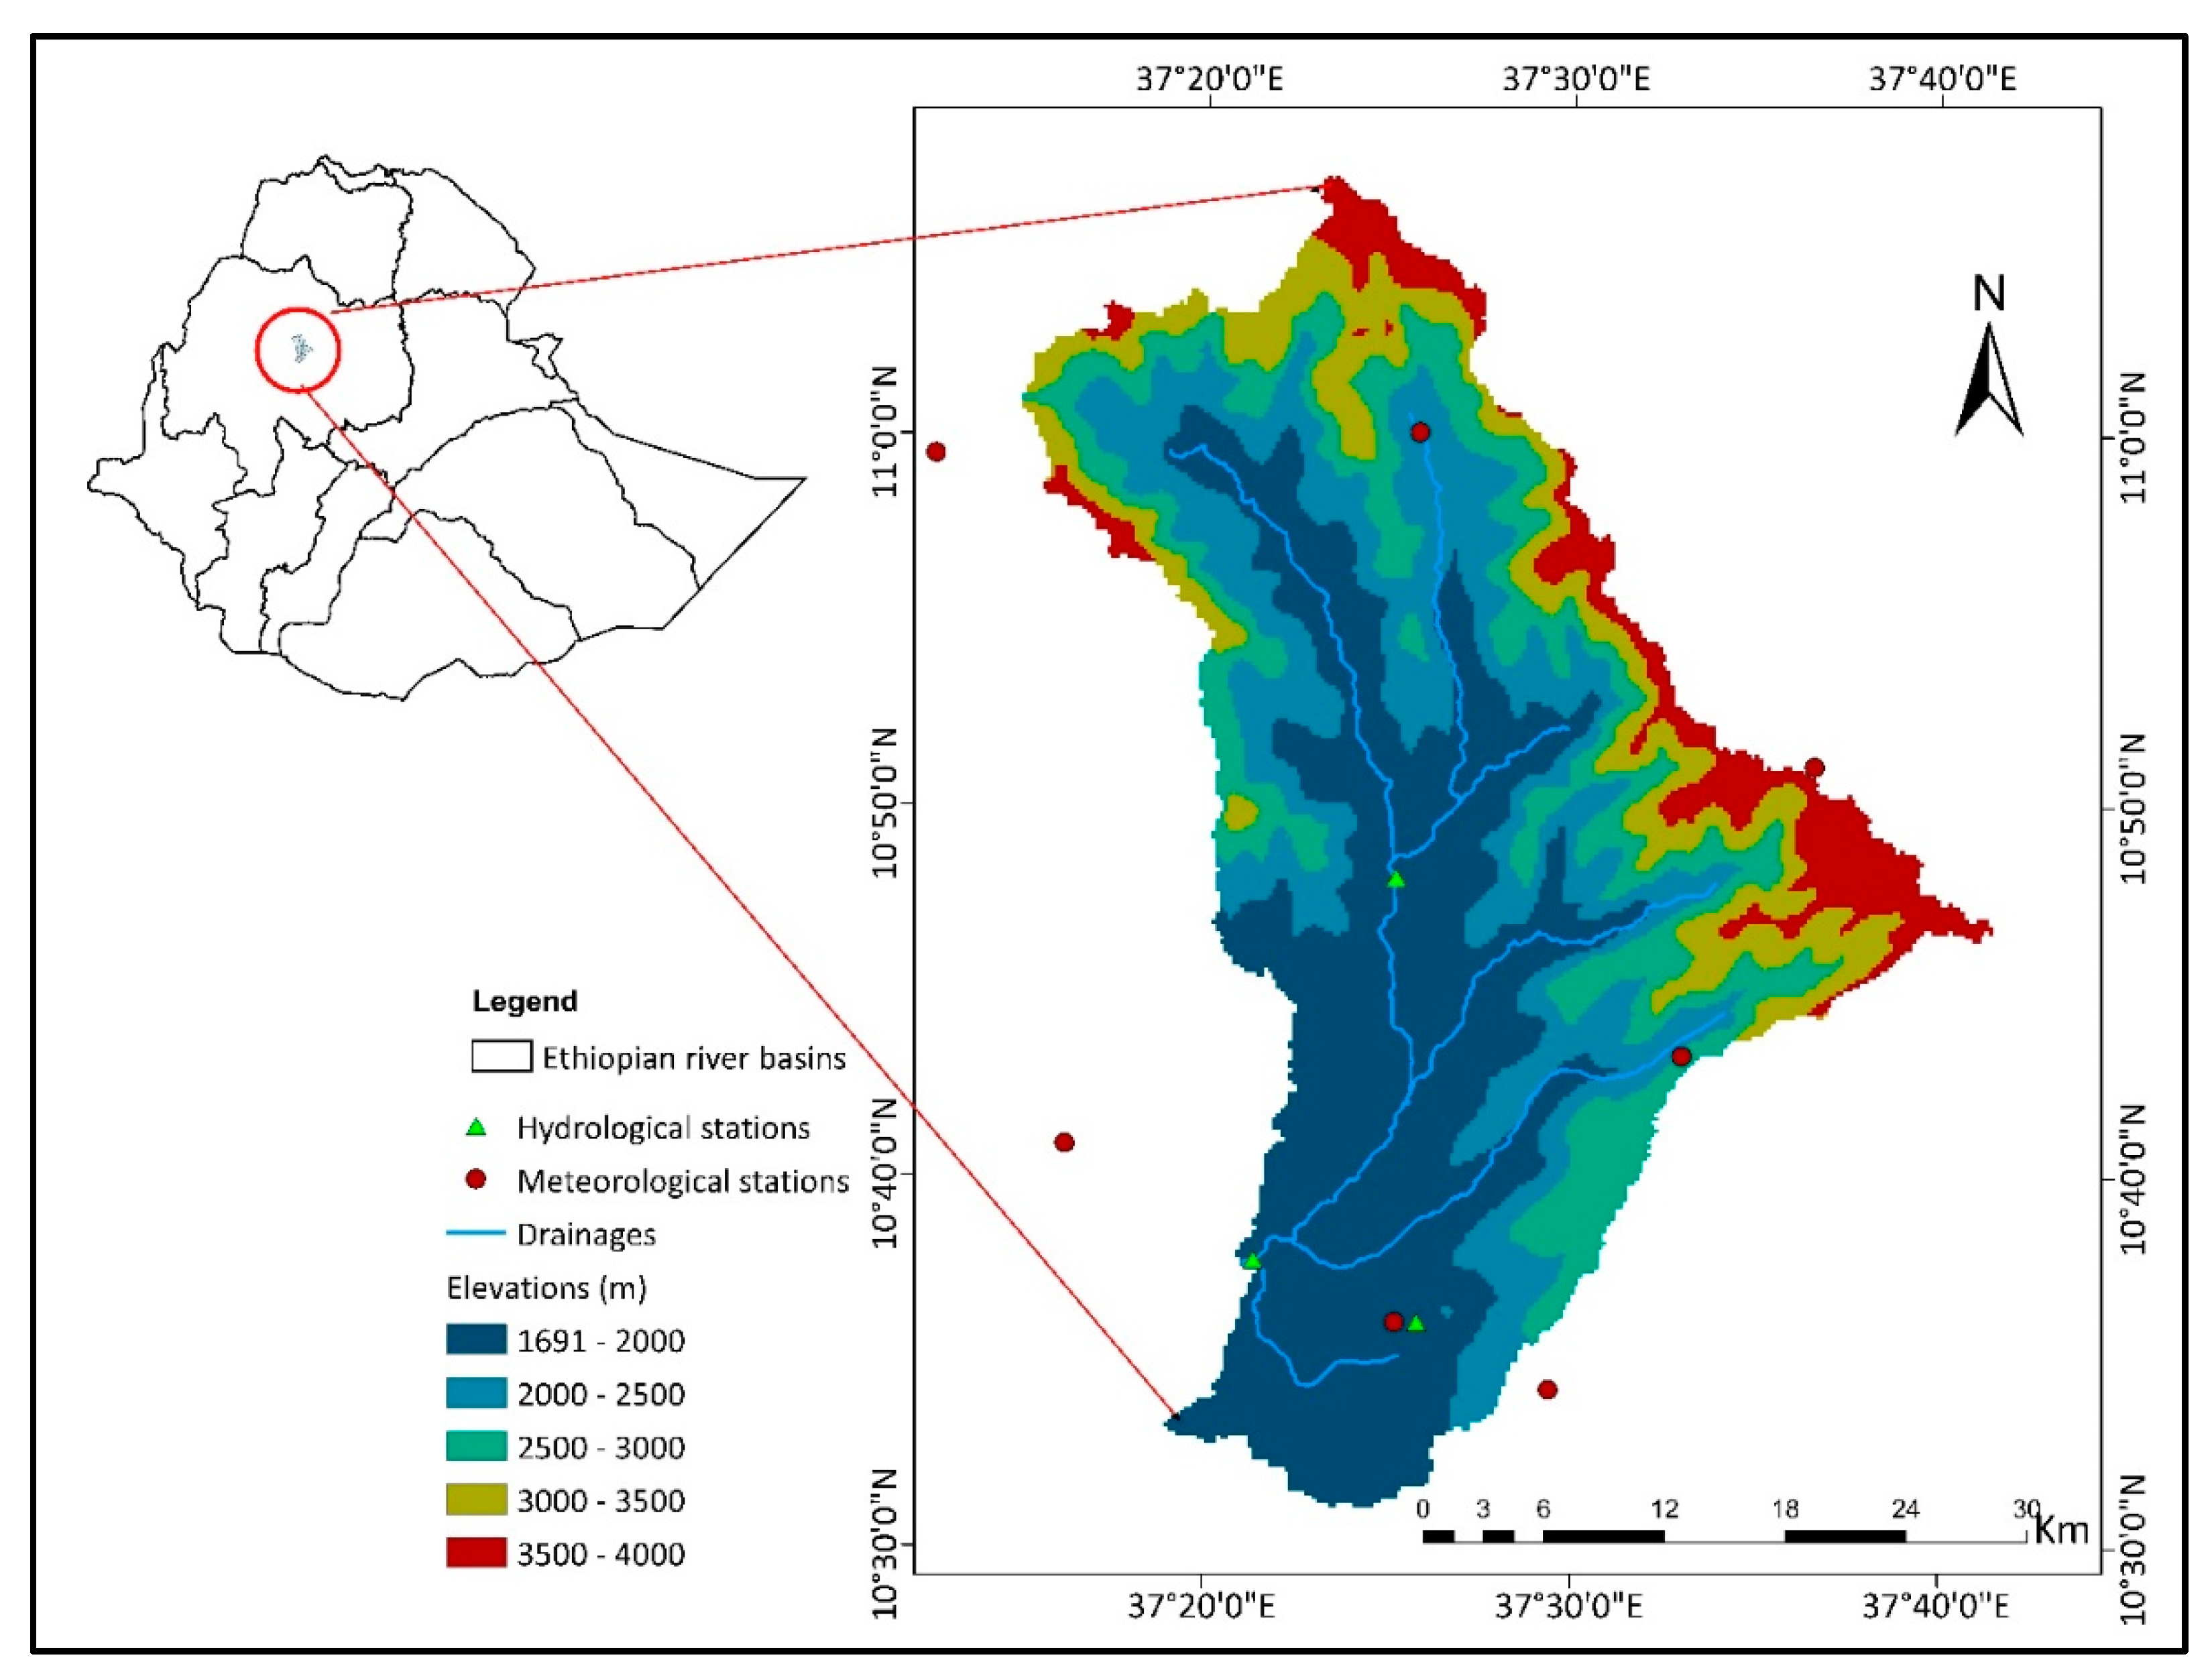
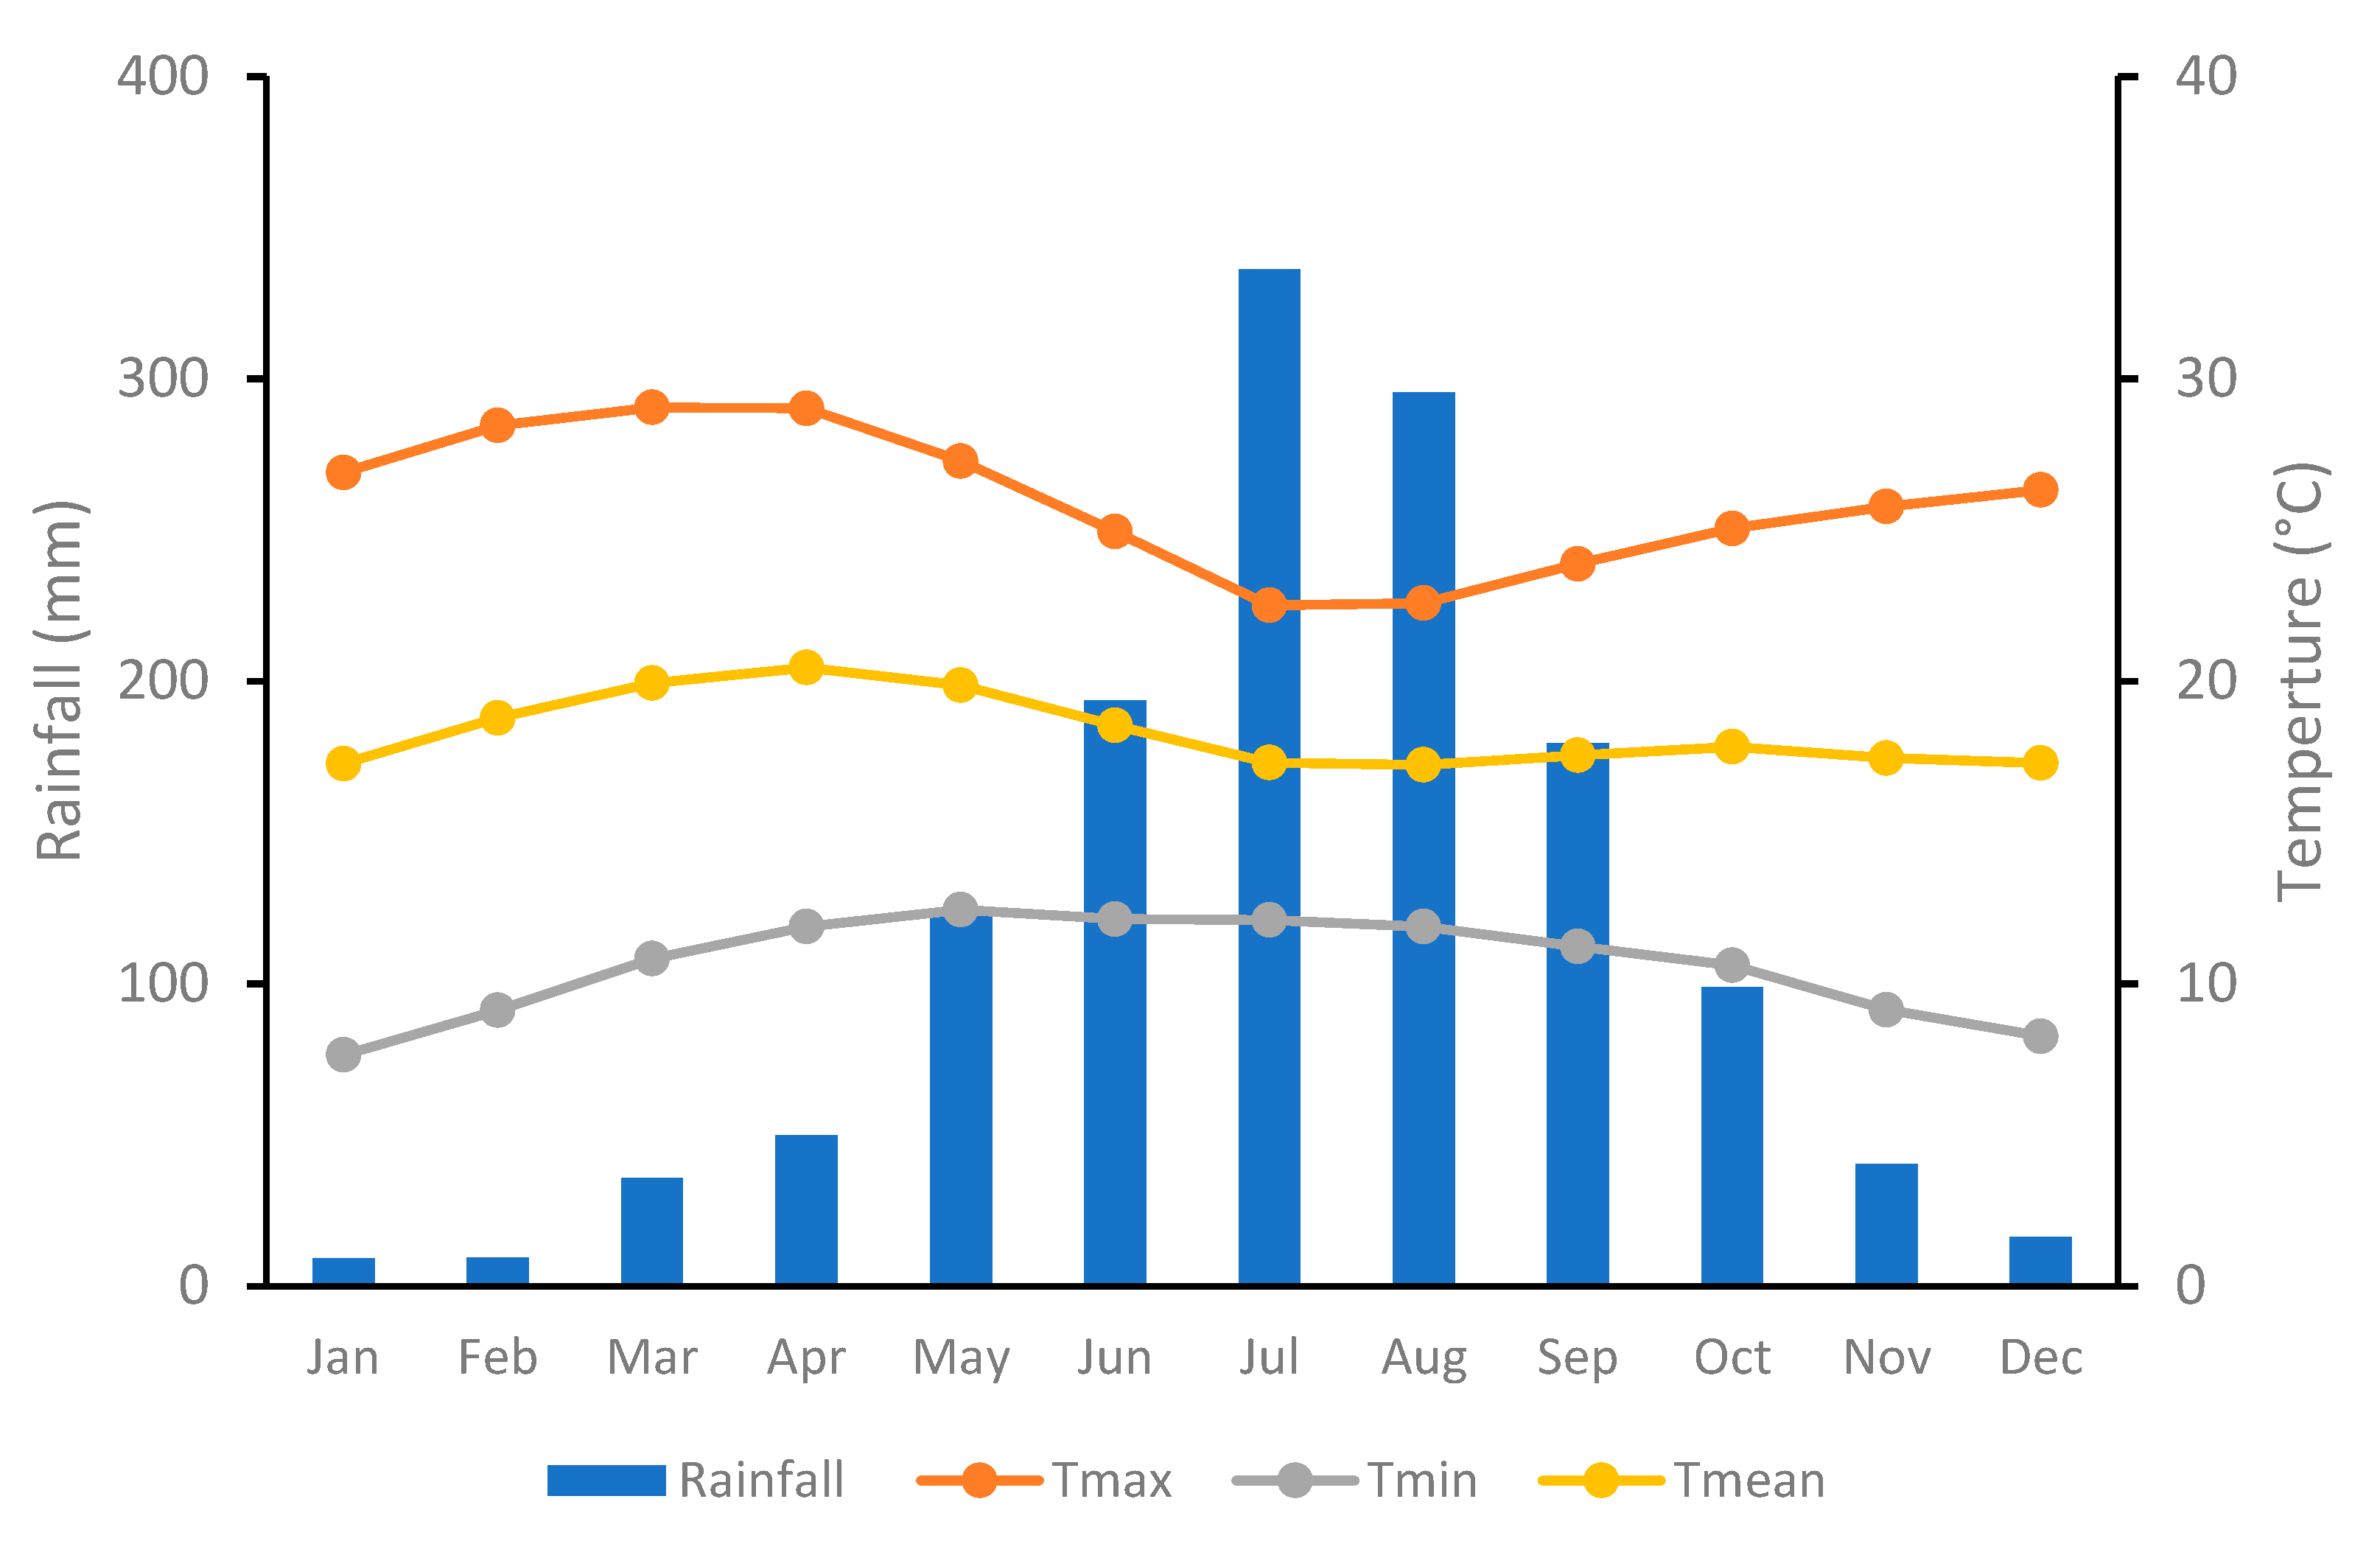
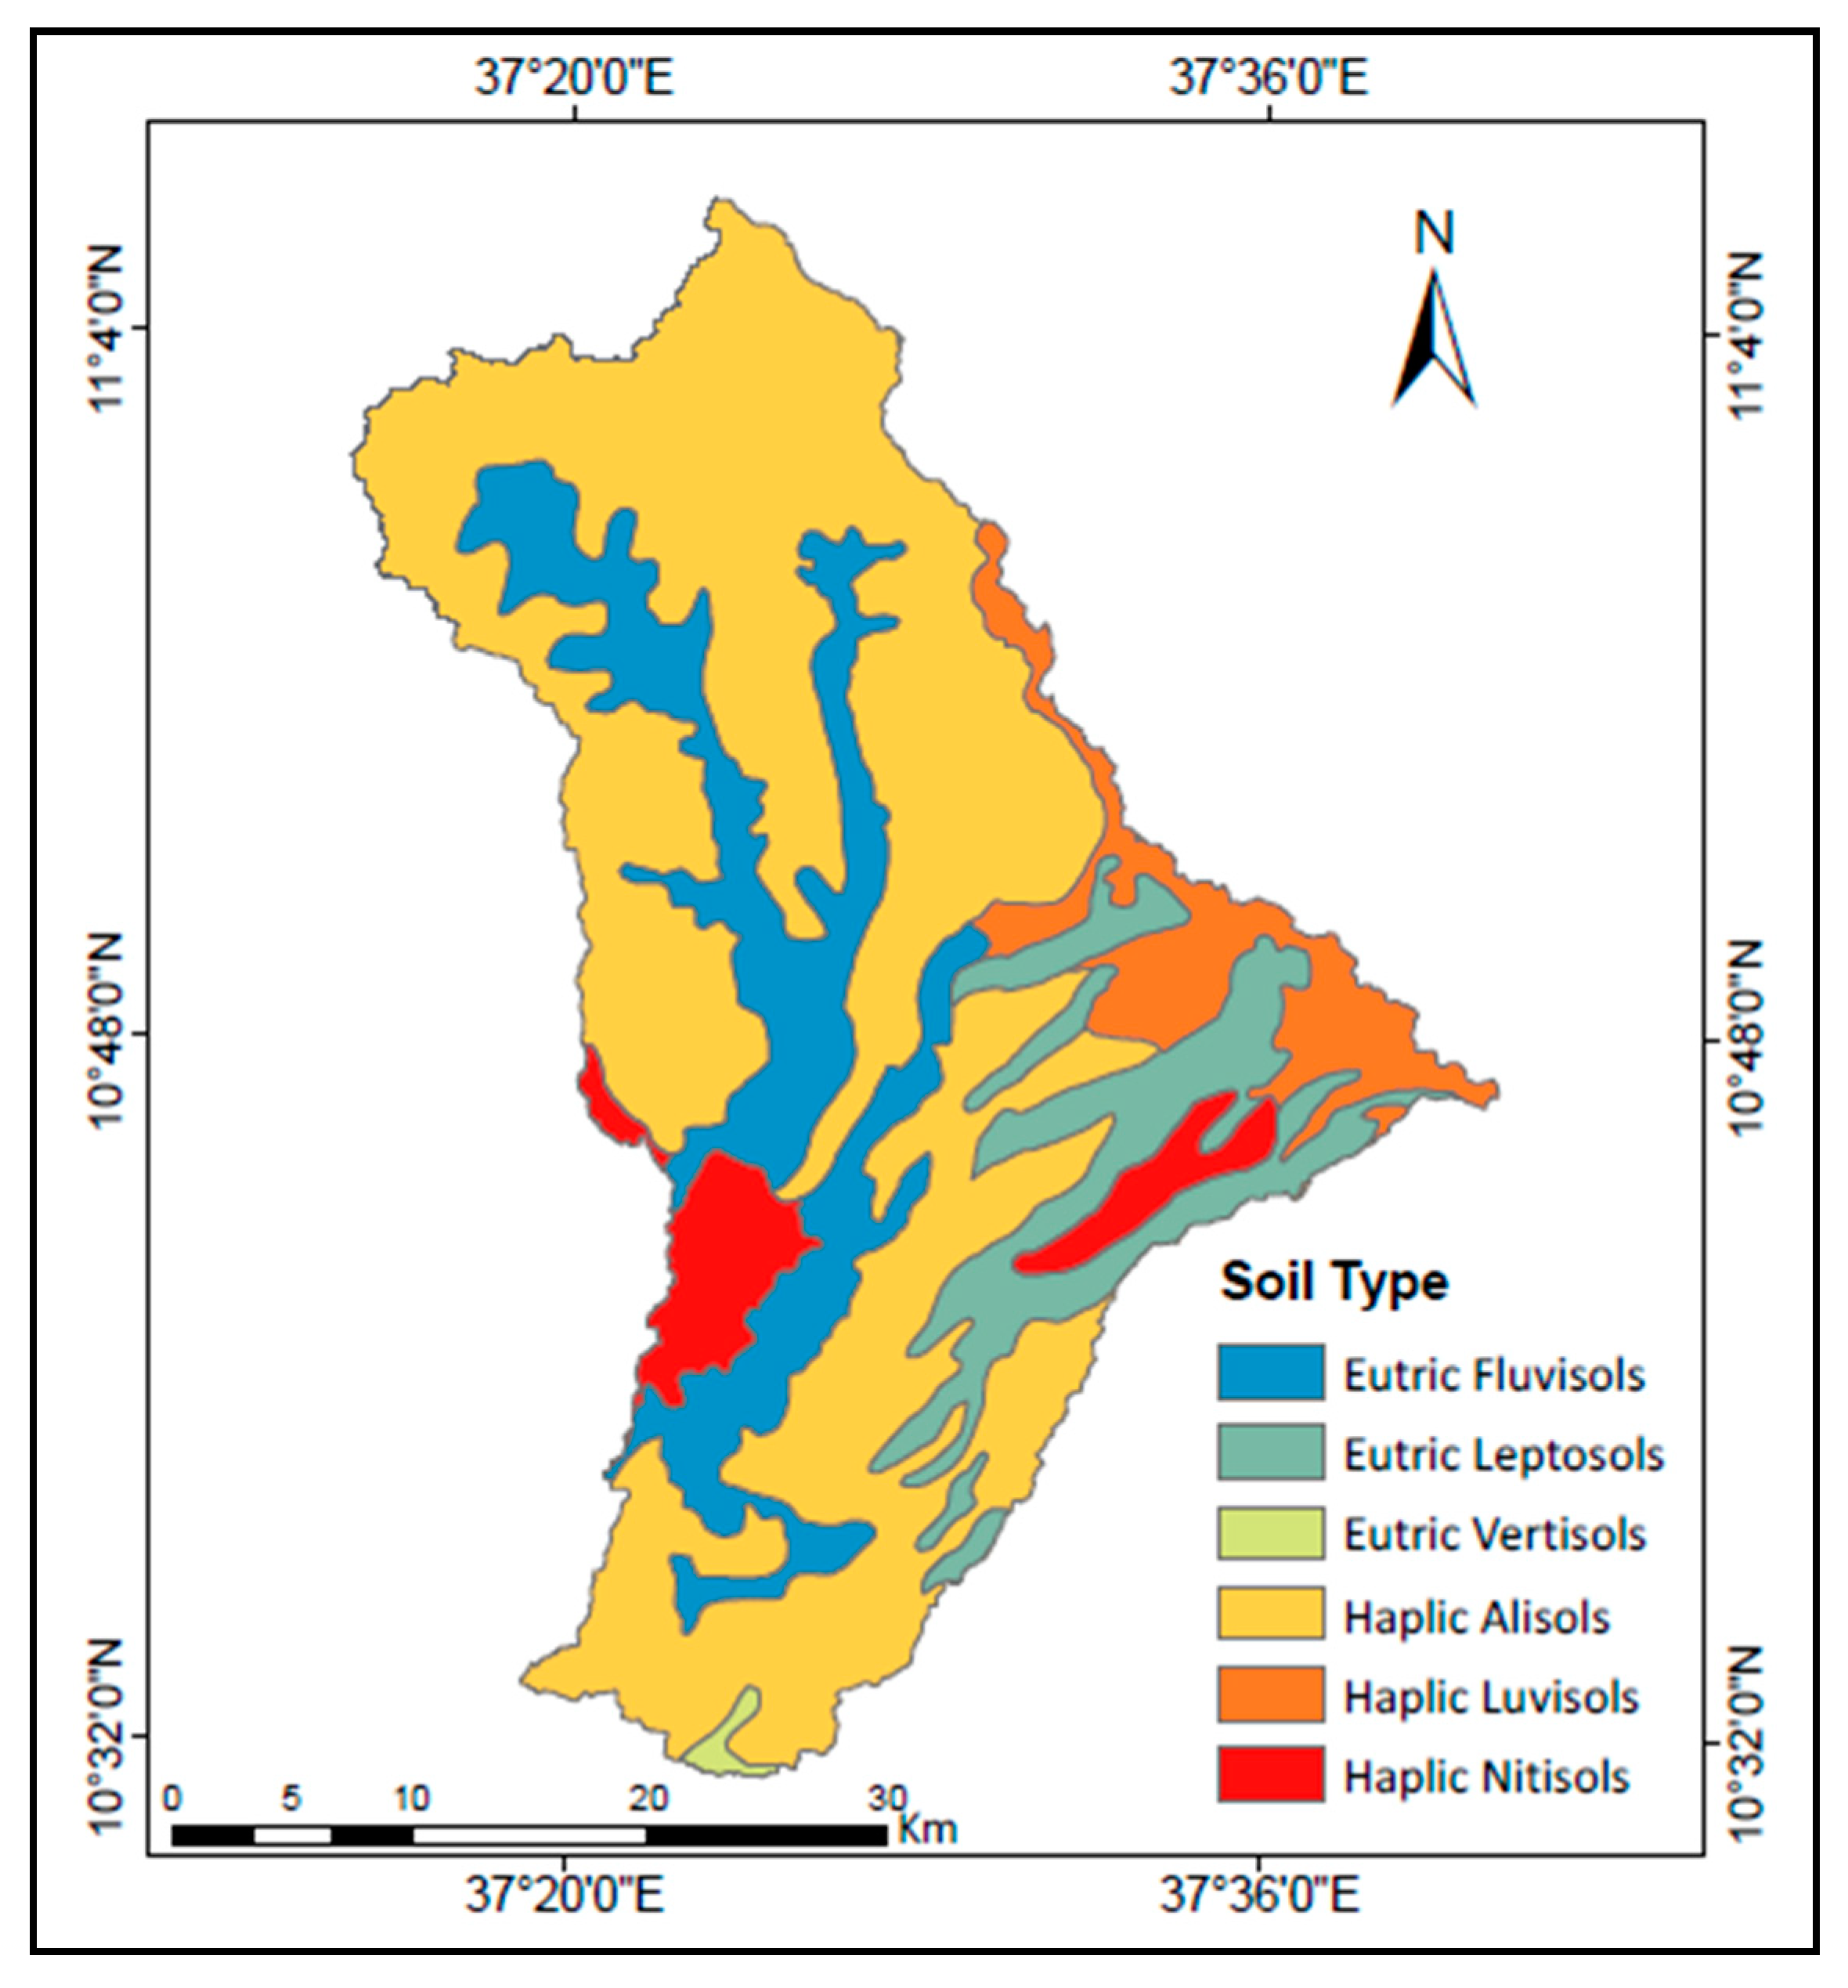
2.1. Study Area

Birr River watershed is situated in the northwestern highlands of Ethiopia. Geographically, the watershed is located between the longitude of 37°10′ and 38°50′ E and the latitude of 10°30′ and 11°10′ N (Figure 1). The watershed is characterized by rough topography and a wide range of elevations ranging from 1691 to 4084 m above sea level. The total drainage area of the watershed is 3062 km2. Many small tributary streams contribute to high discharge to the Birr River watershed during the summer season and are distinguished by substantial spatial and seasonal variability in rainfall. Based on the rainfall patterns, there are three distinct seasons: the main rainy season, which runs from June to September, the minor rainy season, which runs from February to Ma, and the dry season, which runs from October to February [57,58]. The estimated mean annual rainfall for the watershed is 1389 mm based on 32 years of recorded data (1986–2018) obtained from nearby representative meteorological stations, (Figure 2). The northwestern region of the watershed has an estimated annual rainfall was 1391 mm, while the southwestern tip near the mouth of the basin was 1026 mm. The estimated maximum temperature also ranges between 23 and 30 °C, while the lowest temperature varied between 8 to 12 °C, with an average temperature of 18 °C (Figure 2). Figure 2 depicts the average maximum and minimum temperatures, as well as rainfall, in the Birr River watershed. The estimated gauged area of the Birr River watershed covers 1500 km2 (Figure 1). The watershed is significant on local and national magnitude. It includes a high irrigation potential, a high value of cash crops, livestock production as well as tourism, because of the existence of an impressive landscape, and a unique source of biological diversity [20,57].

2.2. Data Collection and Quality Control

2.2.1. Spatial Data

A spatial dataset of digital elevation model (DEM), soil, and LULC was employed to simulate the SWAT hydrological model. DEM data is required to define watershed and sub-watershed boundaries, as well as the delineation of the hydrological response unit, and slope reclassification. DEM data with the 30-m spatial resolution was obtained from the Shuttle Radar Topographic Mission (SRTM) USGS website http://earthexplorer.usgs.gov/ (accessed on 1 August 2022) [59]. The soil and LULC map along with the watershed and sub-watersheds delineated from DEM was used to determine the hydrological parameters and the Hydrological Response Units (HRUs). The soil map was collected from the Ethiopian Ministry of Water, Irrigation, and Energy (MoWIE). There are six major soil types found in the Birr River watershed, which include Haplic Alisols, Eutric Fluvisols, Haplic Luvisols, Eutrc Leptosols, Haplic Nitisols, and Eutric Vertisols (Figure 3). Among all soil types Haplic Alisols is most dominated soil types, which covers about 816 km2 (59.78%) followed by Eutric Fluvisols 236 km2 (17.29%), Eutrc Leptosols 125km2 (9.16%), Haplic Luvisols 96km2 (7.03%), Haplic Nitisols 65km2 (4.76%), and Eutric Vertisols 5km2 (0.37%). The Birr River watershed’s detailed soil physical and chemical property parameters, such as soil texture, bulk density, available water content, hydraulic conductivity, soil depth, and organic carbon content, were derived from the world’s digital soil map [60].
Landsat imagery from the years 1986, 2001, and 2018 was employed to determine how LULC was changing over time. These satellite images were downloaded from the USGS website https://earthexplorer.usgs.gov/ (accessed on 1 August 2022). Table 1 summarizes the sensors, path/raw, spatial resolution, and acquisition dates that were used in the study area. Each Landsat image was georeferenced to World Geodetic System 1984 (WGS84) Universal Transverse Mercator (UTM) zone 37 N. Image preprocessing such as band composite, layer stacking, mosaic, sub-setting, noise, and haze correction was performed. Then based on the prevalent land covers, the spectral responses of features on Landsat images, extensive field observation, and a literature review, the Birr River watershed was divided into five LULC classes or types that were generated namely; agricultural, bushland, forest, grassland, and settlement (Table 2). The maximum likelihood classification method was used to process the image classification using the ERDAS imagine 2015 software (version 15.0). Then, the SWAT model includes these five LULC classes (agricultural, forest, grassland, shrub/bushland, and settlements), with the LULC maps beginning in 1986, 2001, and 2018.

Accuracy Assessment of the Classified LULC Types

Accuracy assessment is an important step for LULC classification. It compares the classified image to another data source that is considered to be accurate or ground truth data. The ground truth should be chosen in such a way that it appears in both the Landsat image and the google earth map. The overall accuracy demonstrates the ability of the classifier to preview the classes. It was calculated by dividing the total number of correctly classified pixels (diagonal) by the total number of reference pixels. The recommended one should be between 85–95% [61]. For accuracy evaluations, the Kappa coefficient (K), which represents the agreement between the classified image and the reference or ground truth, was used. The Kappa coefficient is calculated using Equation (1).
K a p p a   C o e f f i c i e n t   K = T o t a l   s a m p l e × T o t a l   c o r e c t e l y   c l a s s i f i e d   s a m p l e C o l u m n   t o t a l R o w   t o t a l T o t a l   s a m p l e 2 C o l u m n   t o t a l R o w   t o t a l 100
Kappa coefficient statistics criteria agreements are as follows: poor when Kappa < 0.4, good when 0.4 < kappa < 0.7, and excellent when k > 0.75 [62].

2.2.2. Temporal Data

Climatological data is the main requirement of the SWAT hydrological model. Daily climate data (rainfall, maximum and minimum temperature data, relative humidity, sunshine hours, and wind speed) were obtained from the Ethiopian National Meteorological Agency (NMA). These climate data were used between 1986 and 2018 at eight meteorological stations (Adet, Dembecha, Dengayber, Feresebet, Finoteselam, Qaurit, Sekela, and Yechereka). SWAT weather generator was used to simulate relative humidity, solar radiation, and wind speed data from the Adet station [63]. The weather generator was also used to fill the missing rainfall, and temperature data. The double mass curve method was also used to assess the consistency of data elements [64]. The daily evapotranspiration was estimated using the Penman-Monteith method, which is the only accepted method of calculating evaporation [65,66]. The consistent hydrological streamflow data were also collected from MoWIE. The missing and its homogeneity test were investigated using indicators of hydrological alterations (IHA), which employed long-term daily streamflow data [67].

2.3. The SWAT Model

SWAT predicts the effect of human activities on the quality and quantity of hydrological processes at different scales [26,43,68,69,70]. It is a physically-based, semi-distributed, computationally efficient, robust, process-based hydrological model, that was created to estimate the long-term effect of land use management practices on water, sediment, and agricultural chemical yields [65,68,71]. SWAT also simulates the water balance components of surface runoff, groundwater flow, lateral flow, total water yield, and evapotranspiration [68,72]. The water balance equation is given (Equation (2)).
S W t = S W O + R d a y S U R Q E a W s e e p G W Q
where S W t is the final soil water content (mm), S W O is the initial soil water content (mm), t is time in days, R d a y is the amount of precipitation (mm), S U R Q is the amount of surface runoff (mm), E a is the amount of evapotranspiration (mm), W seep is the amount of water entering the vadose zone from the soil profile (mm), and G W Q is the amount of groundwater flow (mm).
ArcSWAT 2012.10.4.21 was used with ArcGIS 10.4.1 to delineate watershed boundaries and stream networks. The model simulates a watershed by separating it into sub-watersheds, which are then subdivided into hydrologic response units (HRUs), which have smaller units and specific land use, soil, and slope combinations [69,71].

2.4. Calbiration and Validation

A two-year warm-up period was used to simulate the Birr River watershed [73]. The sequential uncertainty fitting version 2 (SUFI-2) algorithm was used to achieve an acceptable satisfactory agreement between simulated and observed streamflow data. SWAT model parameters were calibrated using monthly observed streamflow data from the Birr River gauging stations between 1994–2001. The validation process of a model was used to examine simulation consistency and validated using monthly streamflow data from 2002 to 2005 period.

2.5. Model Performance Evaluation

SWAT model simulation was evaluated using monthly timescale streamflow data from the Birr River gauging station because daily timescale simulations may not clearly show the effects of LULC and climate change. Various statistics can be used to calculate the degree of agreement between observed and simulated data [74,75,76,77]. The model was evaluated using the coefficient of determination (R2), Nash Sutcliffe Efficiency (NSE), and percent of bias (PBIAS) as described (Equations (3)–(5)). R2 is the correlation between observed and simulated streamflow data, and it ranges from 0 to 1. R2 > 0.5 is regarded as acceptable, as is the model’s ability to predict observed values reliability [78,79]. NSE calculates the relative magnitude of the residual variance in comparison to the measured data variance, and how well the observed versus simulated data plot fits [80]. NSE value ranges from −∞ to 1. As the NSE is closer to 1, the more accurate the model is. NSE = 1, a perfect match between the observed and simulated streamflow data. NSE = 0, showed that the model predictions are as accurate as the mean of the observed data. −∞ < NSE < 0, indicates that the observed mean is a better predictor than the model. The PBIAS compares the average tendency of the simulated to the observed data [81]. The best value of PBIAS is 0. The positive value of PBIAS indicates an underestimation and the negative value indicates an overestimation of the model [81]. The statistical indices were estimated using the equations listed below.
R 2 = i = 1 n O i O ¯ S i S ¯ i = 1 n O i O ¯ 2   i = 1 n S i S ¯ 2
N S E = i = 1 n O i O ¯ 2 i = 1 n S i O i 2 i = 1 n O i O ¯ 2
P B I A S = O i S i 100 i = 1 n O i
where the total number of observations, O i is the ith observed value, O ¯ is the mean observed value, S i is the ith model simulated value, and S ¯ is the mean model simulated value.

2.6. Simulation of LULC and Climate Change Impacts

A fixing-changing method was used to assess the effect of LULC and climate change on the hydrological process [7,25,82,83,84]. Climate data from 1986 to 2018 were divided into three time periods (1986–2000, 2001–2010, and 2011–2018) for the LULC map of 1986, 2001, and 2018. Based on these climate data and a set of LULC maps, nine scenarios were established (Table 3). If the LULC map and climate data are from the same period, it is referred to as a baseline scenario, and if they are from different periods, it is referred to as an assumed scenario [6]. For instance, in scenario 1, the LULC map from 1986 and climate data from 1986–2000 was used, and this is known as the baseline scenario. The LULC map from 2001 and climate data from 1986–2000 were used in scenario 2, which is also known as an assumed scenario. These scenarios would provide more detailed information about the effects of LULC and climate change on the Birr River watershed.
The difference in the hydrological process obtained from scenarios S2 and S1 represents the separated effect of LULC from 1986 to 2001. The main goal of this evaluation is to determine whether LULC change is a driver for changes in hydrological processes in the Birr River watershed or not while keeping the DEM and soil data constant [6,25,83,84]. The difference between S4 and S1, on the other hand, would indicate the effect of climate change between 1986–2010. Furthermore, the difference between S5 and S1 (baseline scenarios) represents the combined effect of LULC and climate change between 1986 and 2010. Equations (6)–(8) provided the percentage changes resulting from the contributions of LULC, climate, and combined LULC and climate change on the hydrological flows [6].
Δ H LULC   = S 2 S 1 S 1 × 100
Δ H Climate   = S 4 S 1 S 1 × 100
Δ H Combined   = S 5 S 1 S 1 × 100
where ΔH is a change in percentages for the effect of LULC, climate, and combined on hydrological processes, and S1, S2, S4, and S5 are scenarios considered. For other periods, between 1986 to 2018 and 2010 to 2018 a similar analogy is used to analyze the effect of LULC and climate changes.

2.7. Indicator of Hydrological Alteration Method

The indicator of hydrological alteration (IHA) method is used to estimate the magnitude of changes in hydrological flow fluctuation caused by climate and anthropogenic changes. The IHA is a software program that was created in the 1990s by the US Nature Conservancy to process hydrological records [85]. The IHA parameters of one day, three days, seven days, thirty days, and ninety days were investigated for the minimum and maximum magnitudes and durations of streamflow conditions. The parameters were evaluated and compared using a p-value of 5% significance. Modeling water resources with IHA provides useful information and identification of hydrological regimes in the watershed that is influenced by climate and anthropogenic factors in the watershed [86].

3. Results

3.1. Land Use Land Cover Change Detections

There are five major land use classes identified in the study area: agricultural land, bushland, forest, grassland, and settlements. Agriculture covered the largest area in the watershed than the other LULC types in all three years (1986, 2001, and 2018), whereas forests and settlements covered less area [87]. This indicates agriculture is critical to the socioeconomic development of the study watershed. Table 4 depicts the LULC classification in the watershed over 32 years (1986, 2001, and 2018). Agricultural land increased from 56.39–70.19% between (1986–2018) because increased population density leads to an increase in cultivated area and settlements. This finding is in agreement with another finding [30,88].

Accuracy Assessment of Classified LULC

According to the results of three classified LULCs, the overall accuracy of the maps from 1986, 2001, and 2018 was 90.69%, 91.01%, and 92.22%, respectively. The classification performed in this study produces an overall accuracy that meets the minimum accuracy level of 85 defined by Anderson et al. [61]. The Kappa coefficients for the 1986, 2001, and 2018 maps were also 0.84, 0.86, and 0.89, respectively. Therefore, the classification used in this study has an almost perfect agreement for the years 1986, 2001, and 2018 (Table 5, Table 6 and Table 7).
The extent and rate of LULC change patterns from 1986 to 2018 are also presented in (Table 8). The result showed that agricultural land and settlements increased by 24.49%, and 54.78%, respectively, whereas bushland, forest, and grasslands had a decreasing trend. The rate of change in agricultural land and settlements was also raised by 0.77% and 2.96%, respectively. Bushland, forest, and grasslands had also dropped by −0.82%), −1.91%, and −1.22% respectively. Similarly, Ewunetu et al. [89] showed the highest gain in agricultural land was obtained from grassland and bushland in the North Gojjam sub-basin from 1986 to 2017.

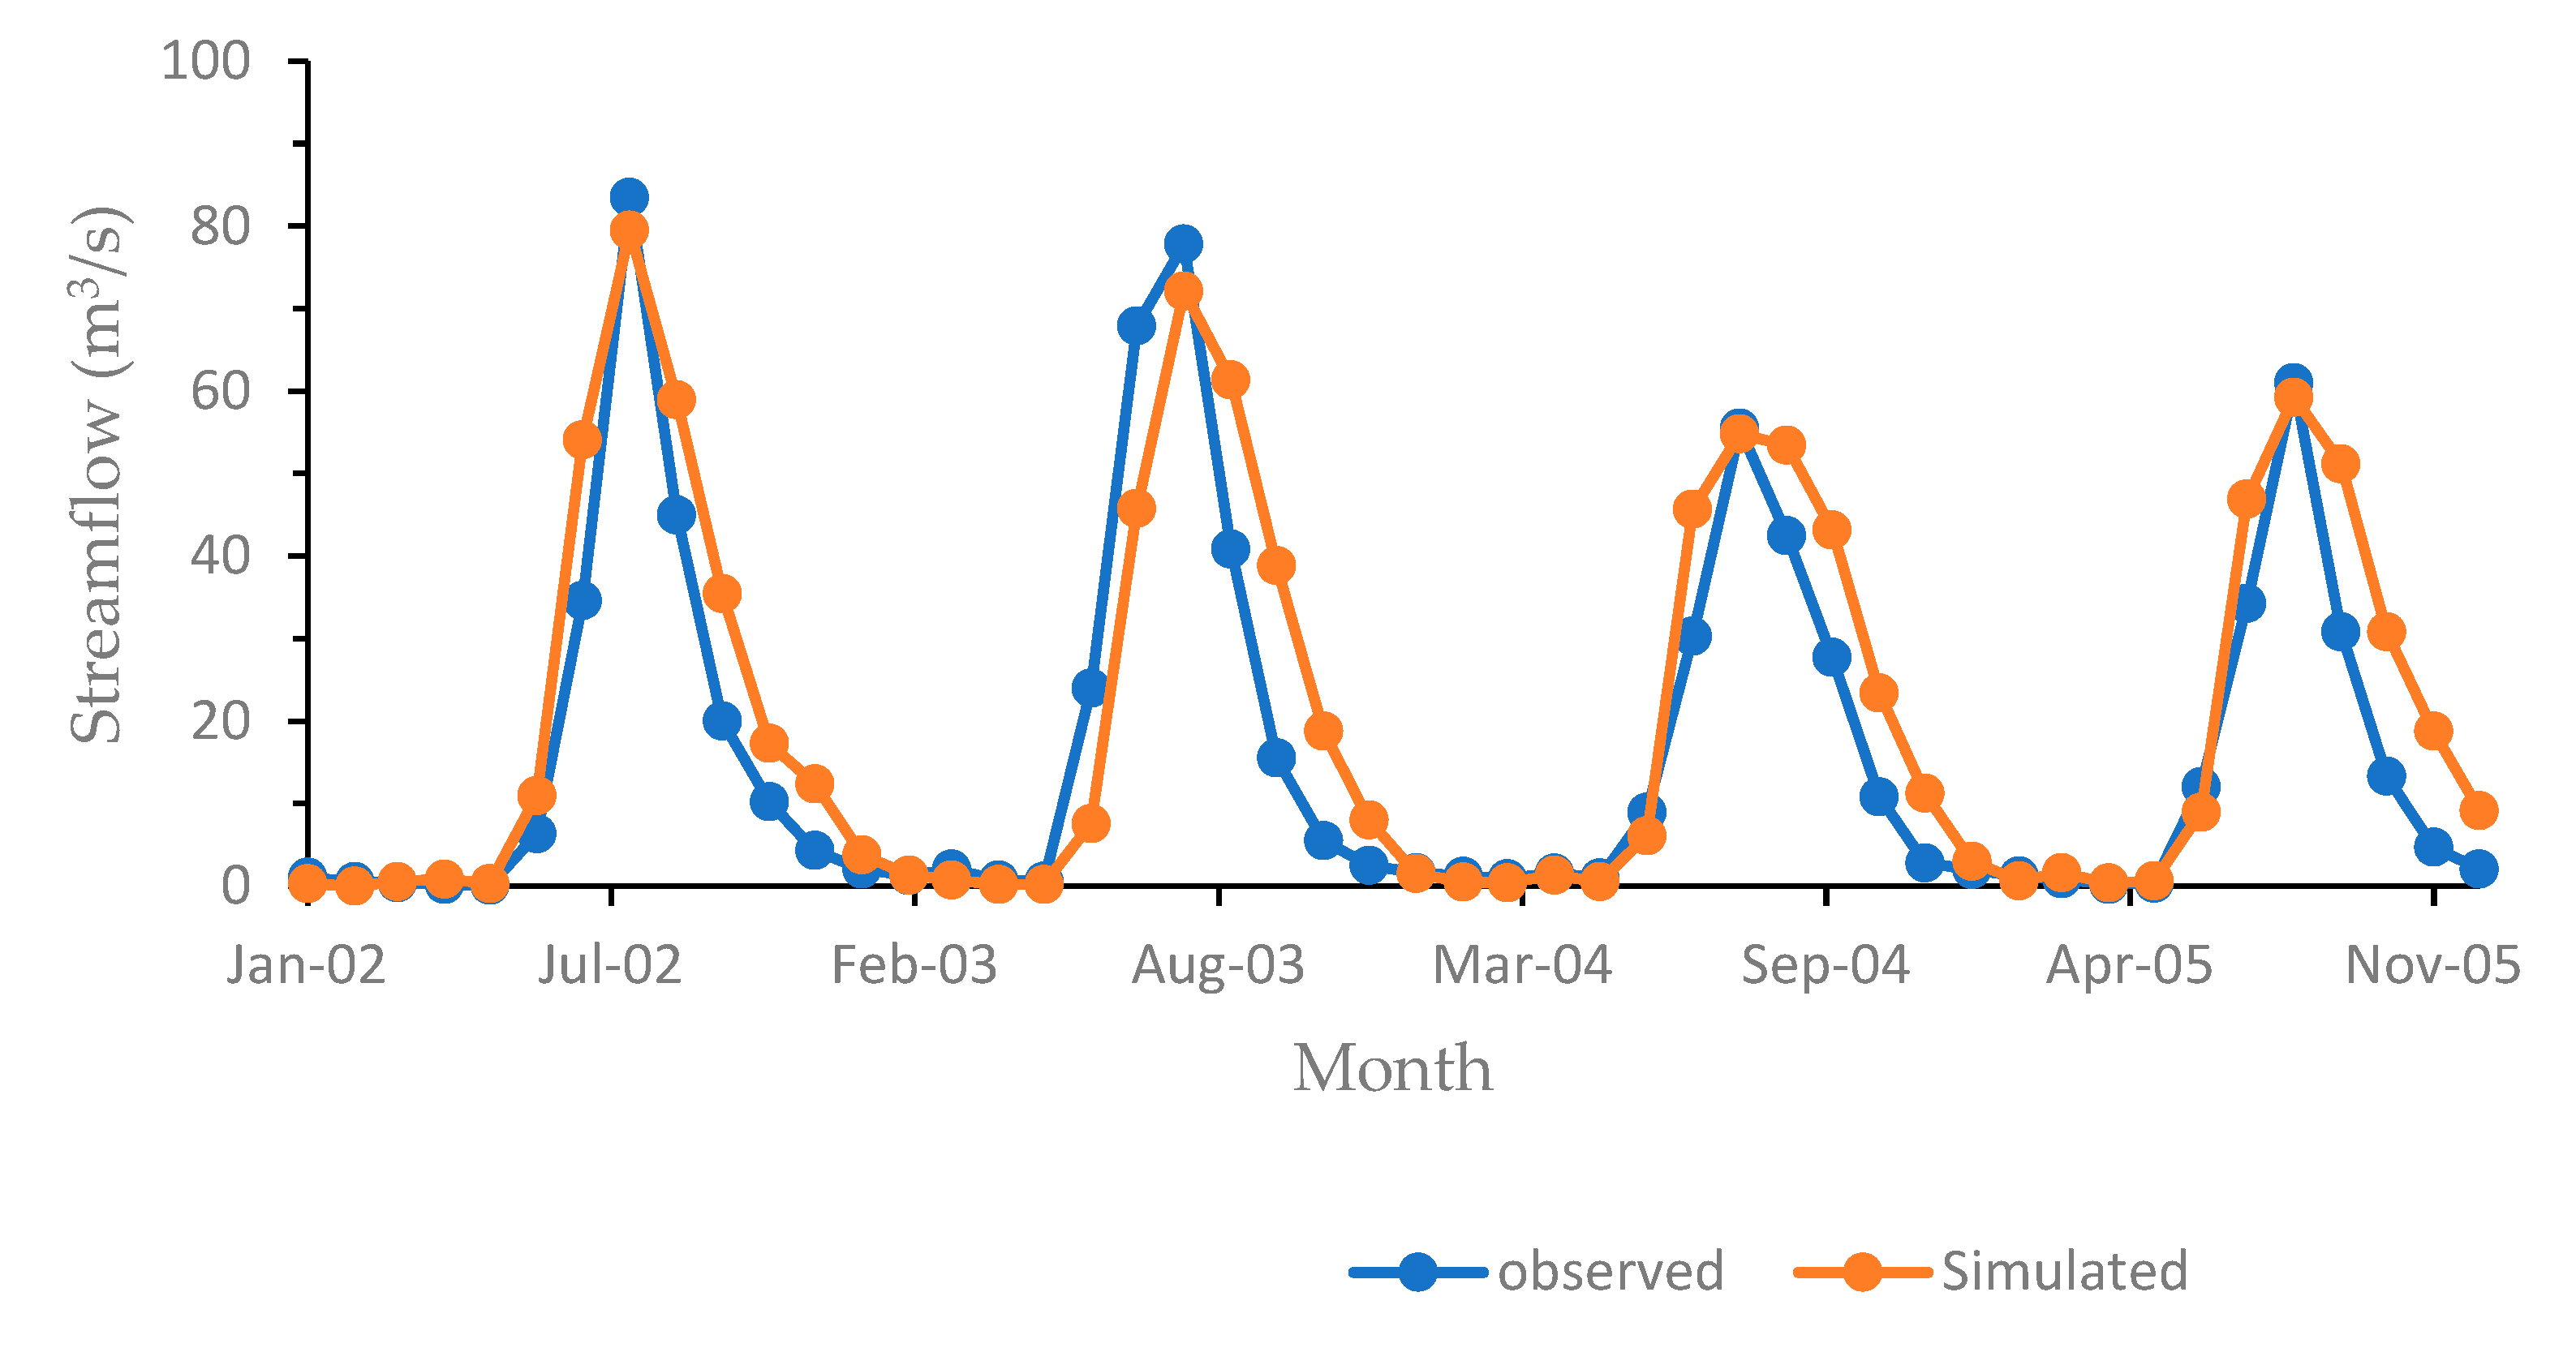
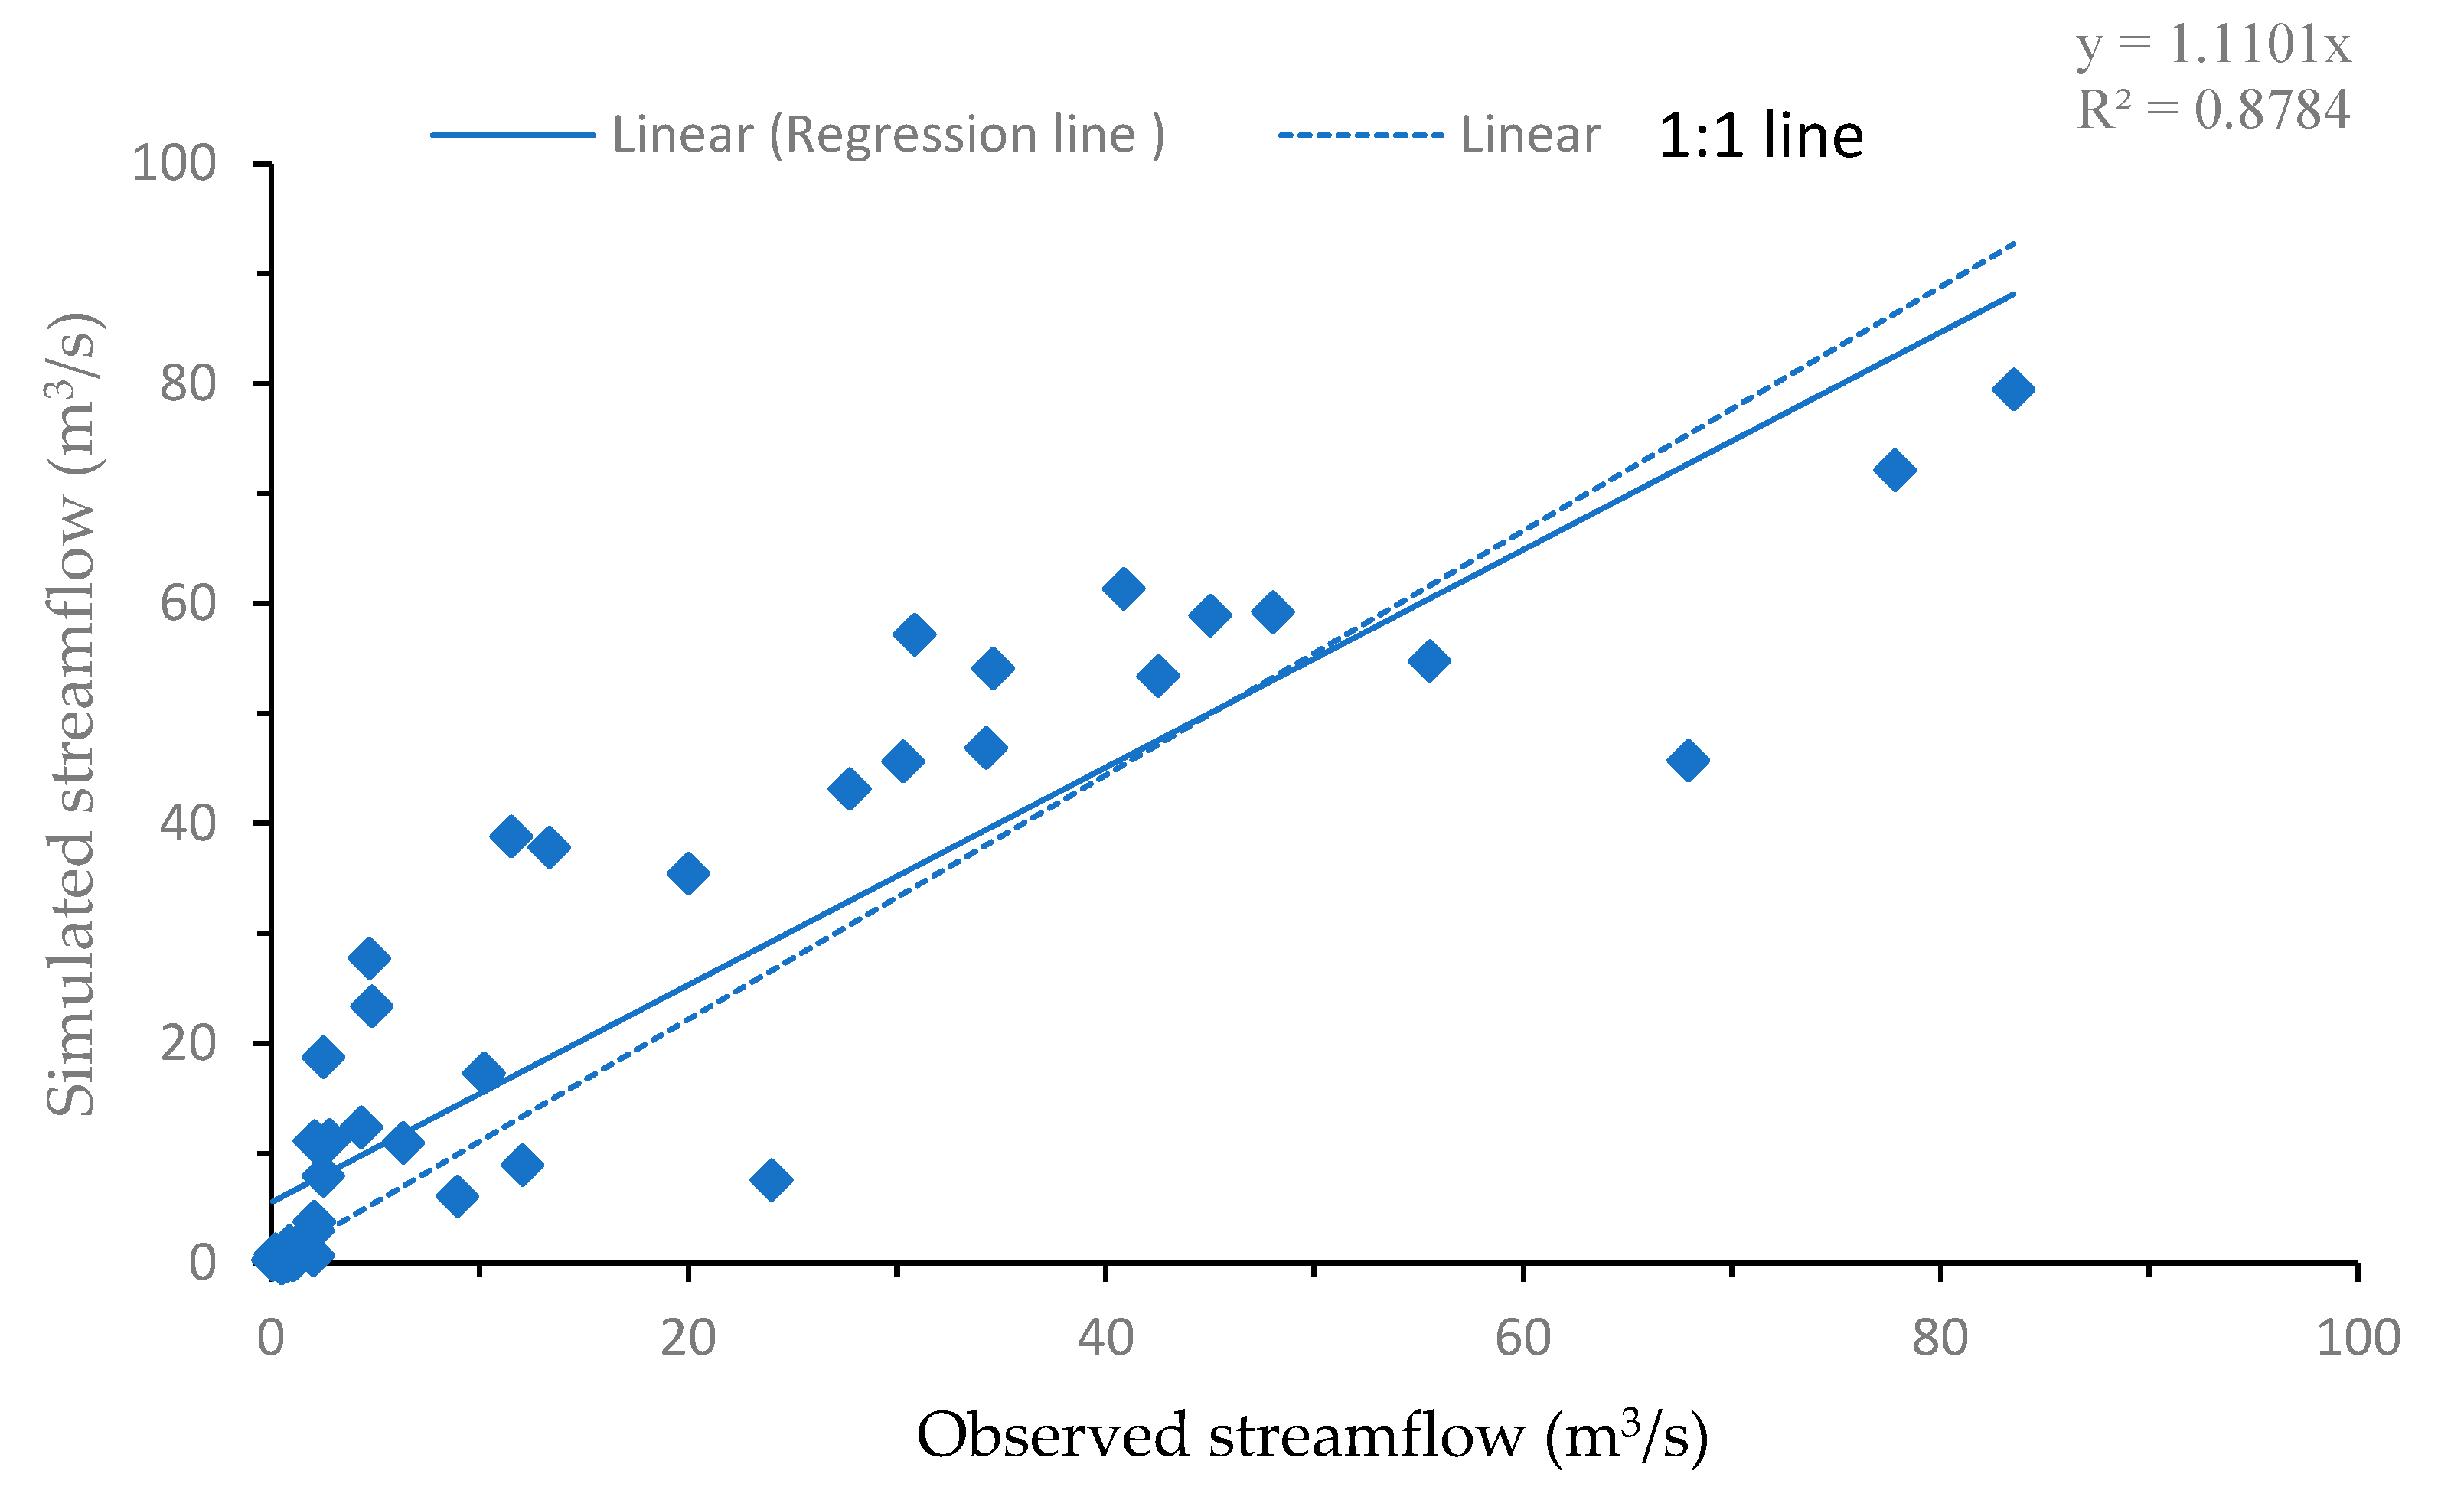
3.2. SWAT Model Calibration and Validation

The SWAT model had been calibrated using the monthly observed streamflow covering from 1994 to 2001 over the Birr River watershed. Streamflow data from the previous years was used for the warm-up period from 1992 to 1993. SWAT-CUP automatic calibration with the sequential uncertainty fitting version 2 (SUFI-2) algorithm at the Birr River gauging station from 1994 to 2001 was used. Before beginning to calibrate and validate the SWAT model, the model’s developer and users provided detailed readings and observations, which aided in determining the calibration and validation parameters that needed to be adjusted. The parameters such as SCS runoff curve number for moisture conditions II (CN2), soil evaporation compensation factor (ESCO), The threshold water level shallow aquifer baseflow (GWQMN), maximum canopy index (Canmx), an available water capacity of the soil layer (SOL_AWS), and soil depth (SOL_Z) were employed for the model calibration. The model was calibrated by varying the parameter range values between the lower and upper limits. These SWAT parameters, range values, fitted values, and parameter descriptions used in the SWAT model simulation are shown in (Table 9).
Figure 4 and Figure 5 depict the comparison and relationship between the simulated and observed monthly streamflow at the Jiga gauging station. To calibrate the SWAT model, climate data from 1997 to 2007 were used, as well as the 2001 LULC map. The peak value of the simulated streamflow closely matches those of the observed one, but at different magnitudes (Figure 4). According to the simulation results, the SWAT model demonstrated that monthly streamflow has a better agreement in the Birr River watershed. The SWAT model calibration and validation confirmed that it could be used to assess the effects of LULC and climate change on water balance components. Figure 5 shows that for the lower values of observed streamflow, the simulated streamflow values are distributed uniformly along a one-to-one line. However, at higher discharge values, the model simulation values showed slight underestimation.
For further investigation of the calibrated SWAT model, the simulated and observed monthly streamflow at Jiga gauging stations validation period was also compared as shown in (Figure 6 and Figure 7). The Birr River watershed gauging site has a good agreement between simulated and observed monthly streamflow.
The statistical parameters of R2, NSE, and PBIAS all indicate a satisfactory relationship between observed and simulated streamflow (Table 10). It has been observed that for the period 1994–2001, the model performed well in terms of R2 and NSE, which were found to be 0.83 and 0.80, respectively during calibration. For the model validation period the R2 and NSE were also found to be 0.81 and 0.71, respectively. The model performed better during the calibration period than during the validation period, which could be attributed to the poor quality of streamflow data recorded during the validation period. Furthermore, a lack of consistent hydroclimate and spatial data (LULC and soil data), may result in a slight discrepancy in the model simulation, however, the graphical interpretation of the simulated and observed monthly streamflow hydrographs, as well as the performance of the statistical indices, meet the criteria suggested by Moriasi et al. [90]. As a result, the SWAT model results showed that the overall prediction of monthly streamflow during the calibration and validation period was satisfactory and acceptable for further investigation.

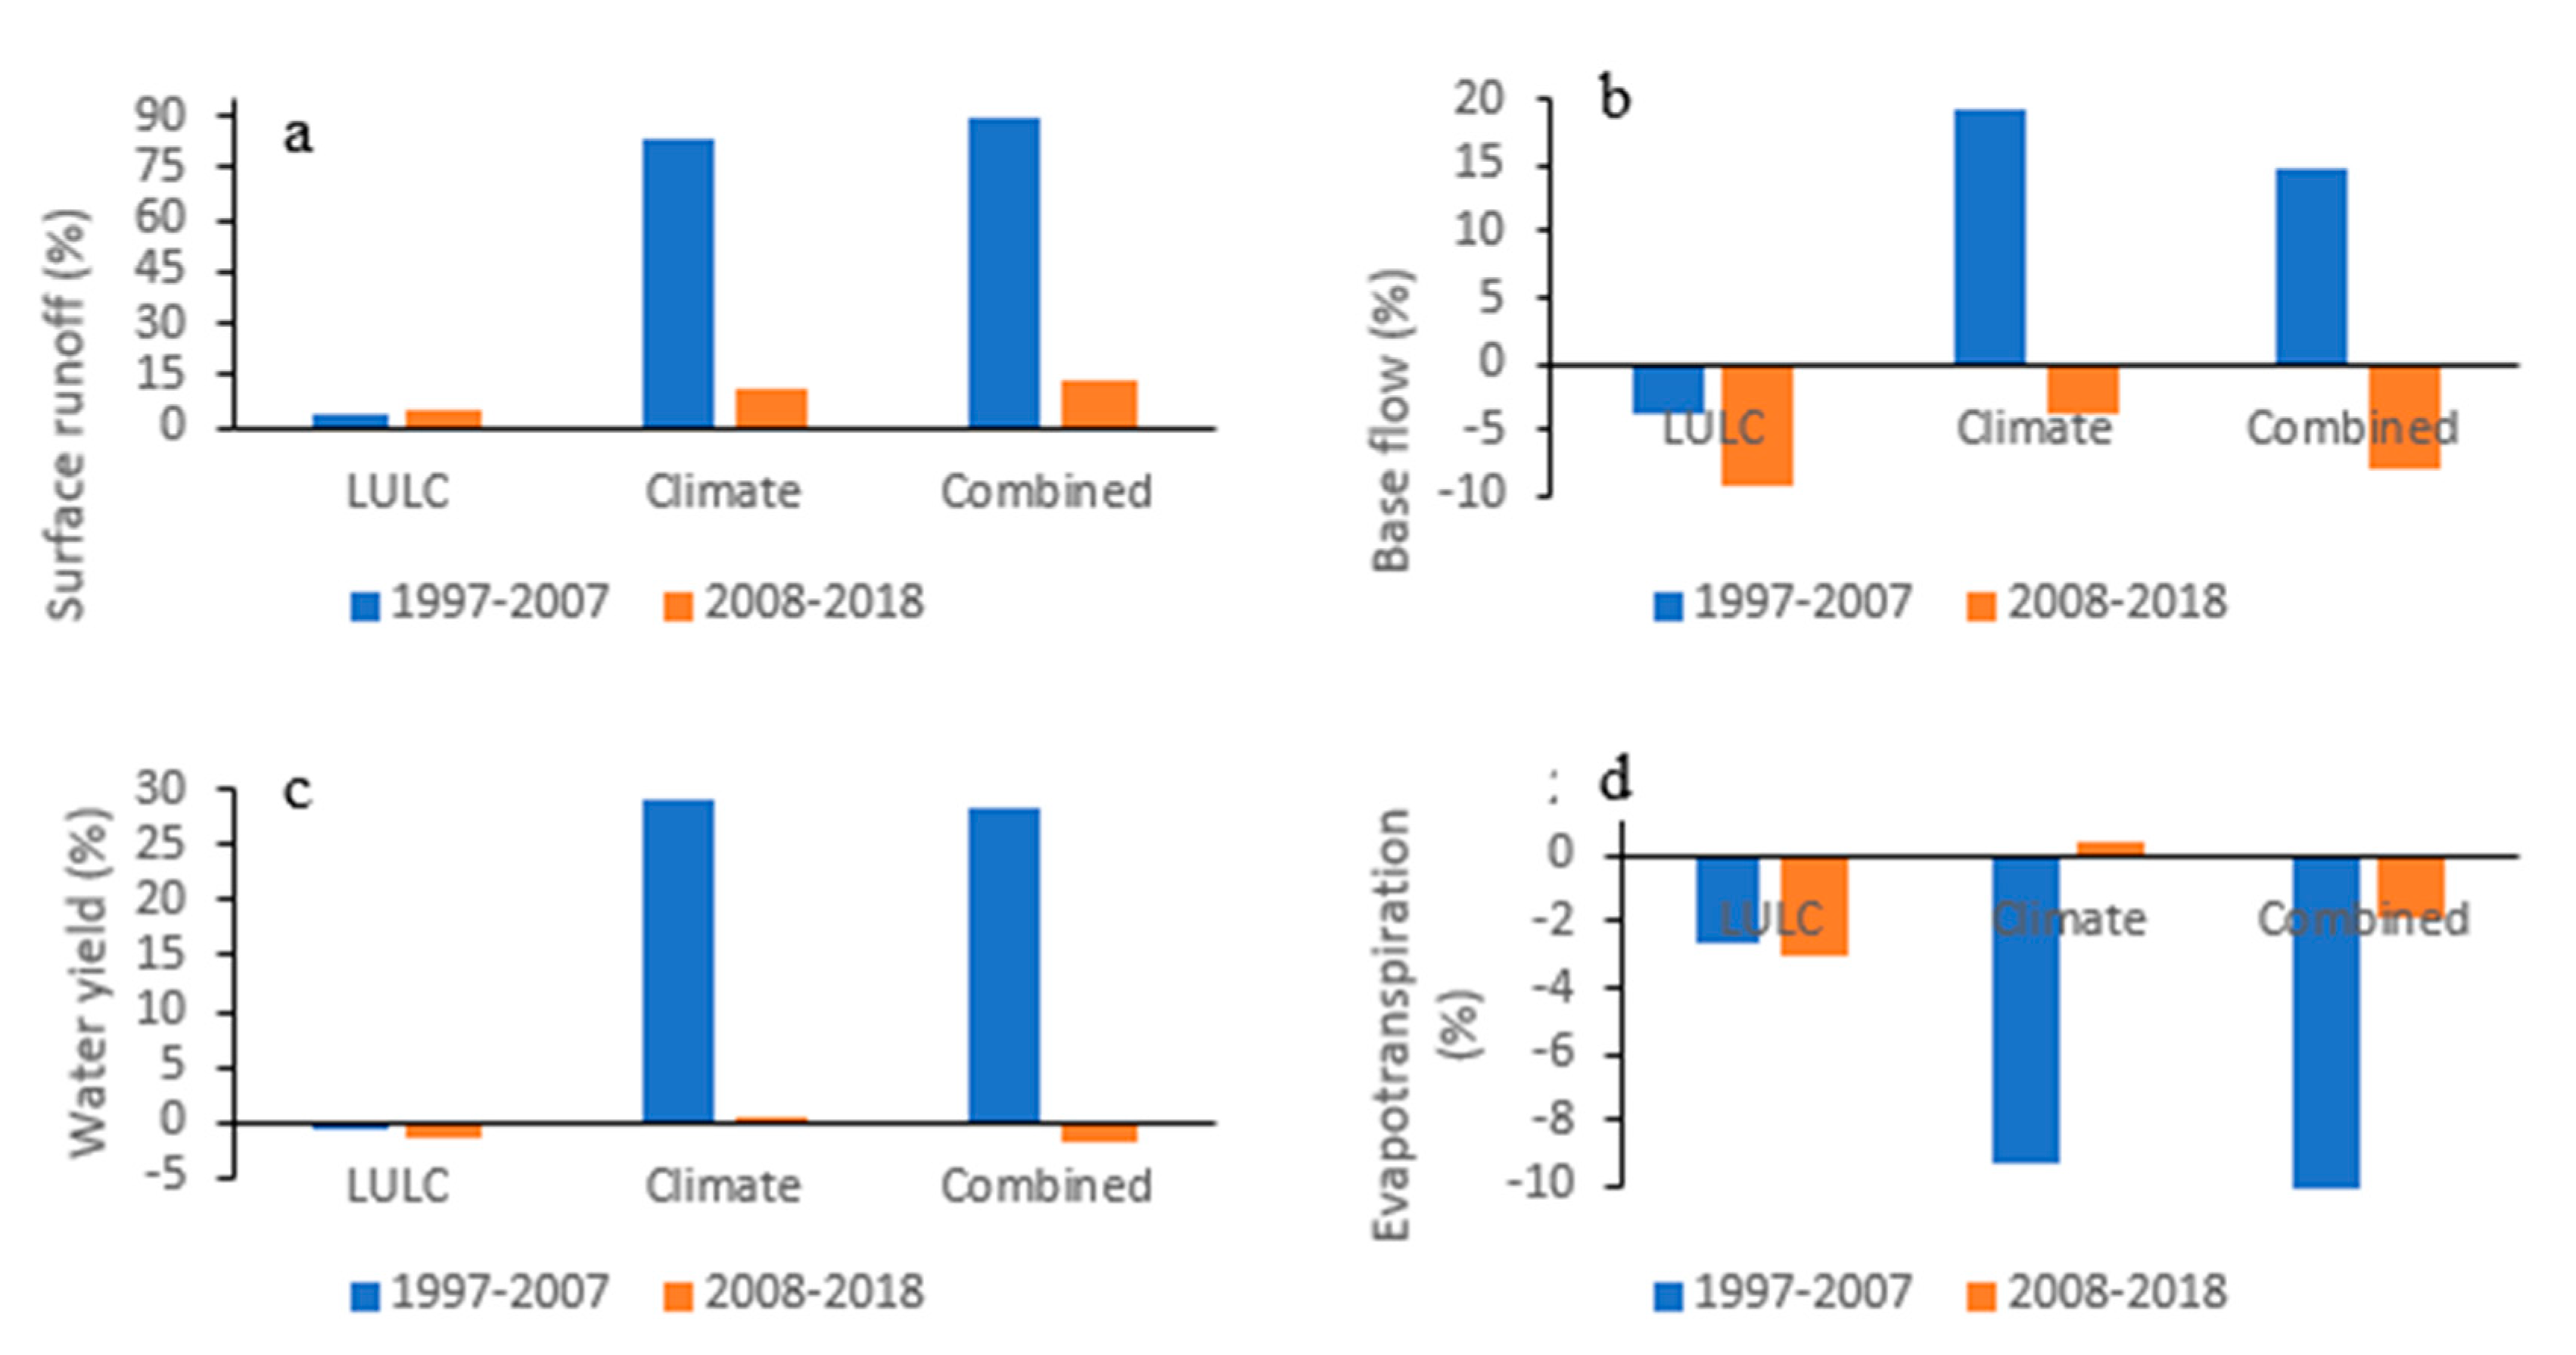
3.3. The Effects of LULC and Climate Change on Hydrological Flows

To assess the effect of LULC and climate change on hydrological flows, different land use scenarios are compared with various climatic settings. The SWAT model simulated various hydrological water balance components, namely, streamflow, surface runoff, baseflow, water yield, and evapotranspiration under various LULC and climatic conditions (Table 11, Table 12 and Table 13).

3.3.1. Effects of LULC Change on Hydrological Flows

Table 11 depicts the three land use scenarios evaluated (S1, S2, and S3) from 1986 to 1996, illustrating the predominant influence of LULC changes with constant climatic circumstances. Similarly, Table 12 shows the different scenarios considered in (S4, S5, and S6), which is the sole effect of land use change with constant climatic settings between 1997–2007, as well as Table 13 depicts the various scenarios considered in (S7, S8, and S9), which is the sole effect of land uses change with constant climatic settings between 2008–2018. Surface runoff increased by 0.39 mm (4.72%), and 0.88 mm (10.65%) in 2001 and 2018, respectively, when compared to the baseline scenario in S1 with S2 and S3, whereas baseflow decreased by −1.75 mm (−5.34%), and −2.21 mm (−6.75%). In different assumed scenarios considered from S4 to S9, similar results of increased surface runoff and decreased baseflow patterns were observed. However, the magnitudes of surface runoff and baseflow have differed (Table 12 and Table 13). The changes in LULC play a significant role in runoff variations, particularly in tropical areas [1]. Baker and Miller [91] reported that the dramatic changes in LULC have resulted in increased surface runoff and decreased groundwater recharge. Similarly, water yield and evapotranspiration decreased in all considered assumed scenarios between S1–S9 during the study period (1986–2018).
Agricultural land increased from 56.39% in 1986 to 70.19% in 2018, while settlements increased from 0.73% in 1986 to 1.42% in 2018, in the study watershed. On the other hand, bushland, forest, and grassland decreased from 26.18%, 4.94%, and 11.77% in 1986 to 19.30%, 1.92%, and 7.16% in 2018 respectively. The reduction of baseflow increases surface runoff and results in more frequent and severe flooding [92,93]. As a result, changes in LULC may be the reason for increasing surface runoff and decreasing baseflow and evapotranspiration. These findings imply the separate effect of LULC change in the Birr River watershed between the assumed scenarios.

3.3.2. Effects of Climate Change on Hydrological Flows

The SWAT model was used to assess and address the effects of climate change (i.e., precipitation and temperature) on hydrological flows in the Birr River watershed. The comparisons were carried out using scenarios S1, S4, and S7, in which the constant LULC map of 1986 was compared to the various climatic settings from 1986–1996, 1997–2007, and 2008–2018 (Table 11, Table 12 and Table 13). The results reveal that surface runoff increased by 6.89 mm from S1 to S4, whereas in S4 to S7 surface runoff also increased by 0.9 mm although the magnitude is different. Furthermore, baseflow increased by 6.26 mm from S1 to S4, but decreased by −1.06 mm from S4 to S7. The variation between S1, S4, and S7 scenarios noticeably indicates separate climate variability has a distinct effect on the study River watershed. Repeated trials on (S2, S5, S8), and (S3, S6, S9) scenarios revealed an increase and decrease in the magnitude of surface runoff and baseflow patterns. These study findings revealed that the impact of climate change is much greater than the impact of LULC change on surface runoff in the Birr River watershed. This study was in agreement with the previous finding [1,7,25,94]. Furthermore, water yield increased from S1–S7, whereas evapotranspiration decreased from S1 to S4 and increased from S4 to S7 for the individual effect of climate change. Evapotranspiration is more sensitive to LULC than to climate change [5].

3.3.3. Integrated Effects of LULC and Climate Change on Hydrological Flows

To better understand the hydrological flow of the Birr River watershed, baseline scenarios with the combined effect of LULC and climate change were presented. To determine the relative contribution of the combined effect for climate and LULC, climate data from 1986–1996 were selected with the LULC map of 1986 (S1), climate data from 1997–2007 were selected with the LULC map of 2001 (S5), and climate data from 2008–2018 were selected with LULC map of 2018 (S9) (Table 11, Table 12 and Table 13). The results show that surface runoff increased by 9.54 mm from S1 to S9, baseflow increased by 1.78 mm, water yield increased by 13.03 mm, and evapotranspiration decreased by 3.85 mm. It has been also observed that from S5 to S9, surface runoff increased by 2.65 mm, baseflow decreased by 4.48 mm, water yield decreased by 1.67 mm, and evapotranspiration increased by 2.84 mm. This indicates that the combined effects of LULC and climate change have a significant impact on the changing pattern of hydrological components in the Birr River watershed. The combined effect of climate and LULC, however, did not clearly show a one-dimensional pattern from S1–S9. Overall, the combined effect of LULC and climate change increases surface runoff in the Birr River watershed, but the magnitude of baseflow, water yield, and evapotranspiration varies from 1986 to 2018. The relative contribution of the combined effects of climate and LULC changes to the hydrological flow is not consistent in the study area. Previous studies have also reported similar findings [88,95,96].

3.4. Indicator of Hydrological Alteration

The IHA findings for one-day, three-day, seven-day, and thirty-day minimum and maximum daily streamflow in the Birr River watershed revealed no statistically significant increasing trend (Table 14). To assess the trend results, the Z value and computed two tailed probability (P) were compared at 5% confidence level. A small amount of positive increasing patterns were shown in both minimum and maximum daily streamflow, however, after ninety days the minimum and maximum streamflow showed a statistically significant positive increasing pattern. Streamflow regimes in the watershed were also investigated using rise and fall rate parameters. The result showed that there was no statistically significant trend. The rising rate was positive, while the falling rates showed negative streamflow patterns in the Birr River watershed.

4. Discussion

The SWAT model was found to be suitable for investigating the impact of climate and LULC change on hydrologic processes in the Birr River watershed. Overall, the SWAT model performance classification for the watershed was very good [90]. As the SWAT model results revealed that LULC and climate changes had effect on the hydrologic process (i.e., streamflow, surface runoff, baseflow, water yield, and ET) of the Birr River watershed. The observed changes in hydrological processes were attributed to LULC and climate change for this study. Substantial changes in LULC have been observed in the Birr River watershed over the last 32 years. Agriculture and settlement, for example, increased between 1986–2018, while bushland, forest, and grassland decreased (Table 8). The changes in LULC were mainly driven by anthropogenic activities (population pressure). For example, the population size of Quarit district (including urbanization), which is entirely within the Birr watershed is 114,771 in 2007, and this population number increased to 142,675 in 2022 with a 1.4% annual population change [97]. Natural vegetation is being converted into agricultural areas in the watershed. This could increase surface runoff and reduce baseflow, resulting increase in land degradation, soil erosion, and shortage of water resources. These findings were in line with previous scholars [30,88,95,98] For example, Wedajo et al. [30] indicated the transformation of natural vegetation into agricultural land in the Dhidhessa River basin. These could be increased surface runoff and decreased baseflow. Similarly, Gashaw et al. [88] reported that during 1985–2015, there was a continuous expansion of cultivated land and settlements, and a withdrawal of forest, shrubland, and grassland. Similarly, malede et al. [87], Demeke and Andualem [99], and Andualem et al. [100] indicated there is a significant land use change in the highlands of Ethiopia.
Individual LULC changes in the Birr River watershed also showed a positive increase in surface runoff while decreasing baseflow, however, the amount of increment is small (Table 11, Table 12 and Table 13). From 1997–2007 and 2008–2018, surface runoff increased by 3.63% and 4.71%, while baseflow changes by −3.77% and −9.34%, respectively (Figure 8a,b). The primary cause of the growth in surface runoff and decline in baseflow is agricultural land and small-extent settlement expansion, which reduces the water infiltration rate in the watershed. Thus, surface runoff increases and reduces baseflow characteristics in the study Birr River watershed. Between 1986 and 2018, the area of agricultural land and settlements increased by 24.49% and 54.78%, respectively, resulting in more surface runoff and reduced baseflow (Table 8). Agriculture and settlement areas increased to 9.4% and 43.15%, respectively, during 1986–2001, resulting in increased surface runoff. Agriculture and settlement areas also further increased to 13.23% and 19.38%, respectively, during 2001–2018, which showed increased surface runoff and reduced baseflow. This result is consistent with previous studies by [6,7,75,91,101]. Agricultural and settlement areas increase impervious areas, which reduces soil infiltrations. Flooding becomes more frequent and severe as baseflow decreases and surface runoff increases [92,93,102]. The increase in surface runoff and decrease in baseflow is also attributed to due to a reduction in water bodies, forests, and bushlands.
Water yield and evapotranspiration (ET) revealed a decreased trend due to the effect of LULC change. During 19,997–2007 and 2008–2018, ET decreased by −2.61% and −3.03%, whereas water yield decreased by −0.75% and −1.35%, respectively (Figure 8d). The decrease in evapotranspiration and water yield is primarily caused by a reduction in bushland, forest cover, and shrublands. Between 1986–2018, bushland, forest cover, and grasslands decreased by −26.27%, −61.01%. and −3914%, respectively (Table 8). Liu et al. [103] reported that for all cover types, forest area contributes the greatest proportion of total evapotranspiration.
The spatiotemporal change in rainfall and temperature (climate change) was observed in the last three decades over the Birr River watershed [17,87]. This climate change increased surface runoff by 83.41% and 10.63% during 1997–2007, and 2008–2018, respectively, whereas baseflow increased by 19.11% from 1997–2007 and decrease by −3.65% during the 2008–2018 period (Figure 8). Climate change also resulted in a decrease in ET during 1997–2007, and it increases in 2008–2018. Individual climate change has a greater impact on surface runoff than individual LULC change over the Birr River watershed. The rising trend of rainfall and temperature causes more surface runoff [17,104]. Furthermore, increased rainfall in the Didessa River basin during the analysis study period have been contributed to increasing surface runoff [30].
Surface runoff was found to be more sensitive to the integrated effects of LULC and climate change than to the individual effects of LULC and climate change. Surface runoff increased by 90.07% from 1997–2007, and 13.38% from 2008–2018 (Figure 8a). Surface runoff increased significantly from 1997 to 2007, compared to 2008–2018. The decrease in surface runoff from 2008–2018 could be attributed to the Ethiopian government’s planned afforestation and reforestation package program, which began in 2010 [105]. The cumulative impact of climate and LULC change on baseflow also showed a 14.62% increase from 1997–2007 but it decreased by −8.02 from 2008–2018. The combined effect of LULC and climate change on ET indicated a small decrease in ET in the period between 2008–2018 as compared to a decrease from 1997–2007, ET decreased by −1.9%. In general, proper implementation of integrated watershed management such as soil and water conversion practices, afforestation, and reforestation could play important roles in mitigating the impact of the hydrological process in the Birr River watershed [30]. According to Wedajo et al. [30] integrated watershed management reduced surface runoff by reducing peak runoff and increasing infiltration. Conservation measures also improve soil fertility, healthy vegetation growth, improved agricultural yield, increased water resource availability and combating climate change and watershed degradation in the Birr River watershed.
In addition to the SWAT model, the IHA is appropriate for evaluating the variations of daily streamflow due to climate and anthropogenic effects. The IHA model found to be there is no statistically significant increasing trend in the Birr River watershed for one-day, three-days, seven-day, and thirty-day minimum and maximum daily streamflow. However, all showed a positive small increment pattern in both minimum and maximum streamflow. In contrast, after ninety days, the minimum and maximum streamflow showed a statistically significant positive increasing pattern. Moreover, the streamflow regimes in the watershed were also investigated using the rise and fall rate parameters. There was no statistically significant trend observed in either the rise or fall rates; however, the rising rate was positive, whereas the falling rate was negative streamflow patterns in the Birr River watershed. These findings were consistent with those previously studied by [86,106]. For example, Gebremicael et al. [86], stated that the daily streamflow rising rate has remained constant, while the falling rate has significantly increased. Moreover, the one-day and seven-day maximum flows remain unchanged at Embamadre station. The one day and seven-day maximum flows did not change significantly could be the attributed to the homogenization of the low flow and peak flow hydrographs following the construction of the hydropower dam.
According to the integrated SWAT and IHA modeling, the Birr River watershed revealed a small amount of streamflow. However, the demand for water resources is increasing for different purposes such as irrigation, and water supply. Therefore, studying the important hydrological processes (streamflow, surface runoff, baseflow, water yield, and evapotranspiration) is serious for precise water resource planning, management, and development of this scarce water resource in the watershed.

5. Conclusions

An integrated study that quantifies the combined and separate effects of climate and land use change on the hydrological flow is ideal and necessary for effective water resource planning and management. Most previous studies concentrated on the separate effects of LULC and climate change on hydrological responses. This study analyzed the separate and combined effects of LULC and climate change over the Birr River watershed during the last 32 years using the SWAT hydrological model. In the Birr River watershed, it is important to investigate and identify the combined and separate effects of LULC and climate change on the hydrology at the watershed level (local) as well as the relative contribution of their changes. The SWAT model, which is GIS-enabled, was used to investigate the impact of LULC and climate change on hydrological flows in the Birr River watershed. The calibration results for the SWAT model indicate that it is a reliable and effective model for analyzing the hydrological process in the Birr River watershed with the effects of LULC and climate change.
The study results indicate that the sole effect of LULC change on surface runoff increased by 3.64% and 4.71%, during 1997–2007, and 2008–2018, respectively, whereas baseflow, water yield, and evapotranspiration decreased by −3.77%, and −9.34%; −0.75% and −1.35%; −2.61%, and −3.03% during the same period. Increased agricultural and settlement expansion was attributed to the increase in surface runoff. The decreasing trend in evapotranspiration can also be attributed to the reduction of bushland, forest, and grassland, while increasing agriculture and settlements. A decrease in baseflow and water yield, on the other hand, could be due to decreased groundwater recharge as a result of the transformations of vegetation cover to agricultural land. Streamflow increases during the wet season but declines during the dry season, affecting agricultural activities and water availability in the watershed. Individual climate change has a much greater relative contribution to surface runoff in the Birr River watershed than LULC change. Surface runoff and water yield showed positive values for the effect of climate change, whereas baseflow and evapotranspiration were revealed as uneven patterns. Surface runoff, baseflow, and water yield were more affected by climate change than LULC changes. In the Birr River watershed, the cumulative effect of climate and LULC change on hydrological flow is greater than the individual effect of climate and LULC change. The magnitude of surface runoff showed much-increased while decreasing evapotranspiration. Moreover, climate and LULC change caused an increase in baseflow and water yield between 1997–2007, and a decrease between 2008–2018. Overall, the results of the hydrological response to the effect of LULC and climate change showed a negative effect on the availability of water resources for agricultural production and others. Therefore, to reduce the impact of environmental changes on the hydrological processes of the Birr River watershed, appropriate integrated watershed management strategies, such as soil and water conservation practices, afforestation, and climate change strategies, must be implemented.

Author Contributions

D.A.M.: idea conceptualization, methodology setup, data curation and analysis, investigation, original draft, writing, and revision of the manuscript, editing, visualizing. T.A.: idea conceptualization, methodology, editing, review, visualization, and supervision. T.G.A.: review, editing, visualization, writing, and revision of the manuscript. All authors have read and agreed to the published version of the manuscript.

Funding

This study was carried out with the support of the Africa Center of Excellent for Water Management, Addis Ababa University.

Institutional Review Board Statement

Not applicable.

Informed Consent Statement

Not applicable.

Data Availability Statement

The data that supports the funding of this study is available from the corresponding author upon reasonable request.

Acknowledgments

The authors would like to thank the Ethiopian National Meteorology Agency and the Ministry of Water Irrigation and Energy for providing climate and streamflow data. Africa Center of excellent for water management, Addis Ababa University for the support to conduct this research.

Conflicts of Interest

The authors declare no conflict of interest.

References

  1. Ahmed, N.; Wang, G.; Booij, M.J.; Xiangyang, S.; Hussain, F.; Nabi, G. Separation of the Impact of Landuse/Landcover Change and Climate Change on Runoff in the Upstream Area of the Yangtze River, China. Water Resour. Manag. 2022, 36, 181–201. [Google Scholar] [CrossRef]
  2. Petrovic, F. Hydrological Impacts of Climate Change and Land Use. Water 2021, 13, 799. [Google Scholar] [CrossRef]
  3. Talib, A.; Randhir, T.O. Climate Change and Land Use Impacts on Hydrologic Processes of Watershed Systems. J. Water Clim. Chang. 2017, 8, 363–374. [Google Scholar] [CrossRef]
  4. Kirby, J.M.; Mainuddin, M.; Mpelasoka, F.; Ahmad, M.D.; Palash, W.; Quadir, M.E.; Shah-Newaz, S.M.; Hossain, M.M. The Impact of Climate Change on Regional Water Balances in Bangladesh. Clim. Chang. 2016, 135, 481–491. [Google Scholar] [CrossRef]
  5. Berihun, M.L.; Tsunekawa, A.; Haregeweyn, N.; Meshesha, D.T.; Adgo, E.; Tsubo, M.; Masunaga, T.; Fenta, A.A.; Sultan, D.; Yibeltal, M.; et al. Hydrological Responses to Land Use/Land Cover Change and Climate Variability in Contrasting Agro-Ecological Environments of the Upper Blue Nile Basin, Ethiopia. Sci. Total Environ. 2019, 689, 347–365. [Google Scholar] [CrossRef]
  6. Kumar, M.; Denis, D.M.; Kundu, A.; Joshi, N.; Suryavanshi, S. Understanding Land Use/Land Cover and Climate Change Impacts on Hydrological Components of Usri Watershed, India. Appl. Water Sci. 2022, 12, 39. [Google Scholar] [CrossRef]
  7. Yang, L.; Feng, Q.; Yin, Z.; Wen, X.; Si, J.; Li, C.; Deo, R.C. Identifying Separate Impacts of Climate and Land Use/Cover Change on Hydrological Processes in Upper Stream of Heihe River, Northwest China. Hydrol Process. 2017, 31, 1100–1112. [Google Scholar] [CrossRef]
  8. Schäfer, M.P.; Dietrich, O.; Mbilinyi, B. Streamflow and Lake Water Level Changes and Their Attributed Causes in Eastern and Southern Africa: State of the Art Review. Int. J. Water Resour. Dev. 2015, 32, 853–880. [Google Scholar] [CrossRef]
  9. Getachew, B.; Manjunatha, B.R.; Bhat, H.G. Modeling Projected Impacts of Climate and Land Use/Land Cover Changes on Hydrological Responses in the Lake Tana Basin, Upper Blue Nile River Basin, Ethiopia. J. Hydrol. 2021, 595, 125974. [Google Scholar] [CrossRef]
  10. Zhou, F.; Xu, Y.; Chen, Y.; Xu, C.Y.; Gao, Y.; Du, J. Hydrological Response to Urbanization at Different Spatio-Temporal Scales Simulated by Coupling of CLUE-S and the SWAT Model in the Yangtze River Delta Region. J. Hydrol. 2013, 485, 113–125. [Google Scholar] [CrossRef]
  11. Tekleab, S.; Mohamed, Y.; Uhlenbrook, S. Hydro-Climatic Trends in the Abay/Upper Blue Nile Basin, Ethiopia. Phys. Chem. Earth Parts A/B/C 2013, 61–62, 32–42. [Google Scholar] [CrossRef]
  12. Hassan, M.M. Monitoring Land Use/Land Cover Change, Urban Growth Dynamics and Landscape Pattern Analysis in Five Fastest Urbanized Cities in Bangladesh. Remote Sens. Appl. Soc. Environ. 2017, 7, 69–83. [Google Scholar] [CrossRef]
  13. Osei, M.A.; Amekudzi, L.K.; Wemegah, D.D.; Preko, K.; Gyawu, E.S.; Obiri-Danso, K. The Impact of Climate and Land-Use Changes on the Hydrological Processes of Owabi Catchment from SWAT Analysis. J. Hydrol. Reg. Stud. 2019, 25, 100620. [Google Scholar] [CrossRef]
  14. Wang, S.; Kang, S.; Zhang, L.; Li, F. Modelling Hydrological Response to Different Land-Use and Climate Change Scenarios in the Zamu River Basin of Northwest China. Hydrol. Process. 2008, 22, 2502–2510. [Google Scholar] [CrossRef]
  15. Venkatesh, K.; Ramesh, H.; Das, P. Modelling Stream Flow and Soil Erosion Response Considering Varied Land Practices in a Cascading River Basin. J. Env. Manag. 2020, 264, 110448. [Google Scholar] [CrossRef] [PubMed]
  16. Duveiller, G.; Caporaso, L.; Abad-Viñas, R.; Perugini, L.; Grassi, G.; Arneth, A.; Cescatti, A. Local Biophysical Effects of Land Use and Land Cover Change: Towards an Assessment Tool for Policy Makers. Land Use Policy 2020, 91, 104382. [Google Scholar] [CrossRef]
  17. Malede, D.A.; Agumassie, T.A.; Kosgei, J.R.; Andualem, T.G.; Diallo, I. Recent Approaches to Climate Change Impacts on Hydrological Extremes in the Upper Blue Nile Basin, Ethiopia. Earth Syst. Environ. 2022, 6, 669–679. [Google Scholar] [CrossRef]
  18. Winkler, K.; Fuchs, R.; Rounsevell, M.; Herold, M. Global Land Use Changes Are Four Times Greater than Previously Estimated. Nat. Com. 2021, 12, 2501. [Google Scholar] [CrossRef]
  19. Getachew, B.; Rachotappa, B.; Getachew, M.B.; Programme, G.; Getachew, B.; Manjunatha, B.R. Impacts of Land-Use Change on the Hydrology of Lake Tana Basin, Upper Blue Nile River Basin, Ethiopia. Wiley Online Libr. 2022, 6, 2200041. [Google Scholar] [CrossRef]
  20. Minwyelet, M. Birr Watershed Integrated Natural Resource Management; Bahir Dar University: Bahir Dar, Ethiopia, 2014. [Google Scholar]
  21. Wang, Z.; Tian, J.; Feng, K. Response of Runoff towards Land Use Changes in the Yellow River Basin in Ningxia, China. PLoS One 2022, 17, e0265931. [Google Scholar] [CrossRef]
  22. Emiru, N.C.; Recha, J.W.; Thompson, J.R.; Belay, A.; Aynekulu, E.; Manyevere, A.; Demissie, T.D.; Osano, P.M.; Hussein, J.; Molla, M.B.; et al. Impact of Climate Change on the Hydrology of the Upper Awash River Basin, Ethiopia. Hydrology 2021, 9, 3. [Google Scholar] [CrossRef]
  23. Getu Engida, T.; Nigussie, T.A.; Aneseyee, A.B.; Barnabas, J. Land Use/Land Cover Change Impact on Hydrological Process in the Upper Baro Basin, Ethiopia. Appl. Env. Soil Sci. 2021, 2021, 6617541. [Google Scholar] [CrossRef]
  24. Chawla, I.; Mujumdar, P.P. Isolating the Impacts of Land Use and Climate Change on Streamflow. Hydrol. Earth Syst. Sci. 2015, 19, 3633–3651. [Google Scholar] [CrossRef] [Green Version]
  25. Yin, J.; He, F.; Xiong, Y.J.; Qiu, G.Y. Effects of Land Use / Land Cover and Climate Changes on Surface Runoff in a Semi-Humid and Semi-Arid Transition Zone in Northwest China. Hydrol. Earth Syst. Sci. 2017, 21, 183–196. [Google Scholar] [CrossRef] [Green Version]
  26. Kim, J.; Choi, J.; Choi, C.; Park, S. Impacts of Changes in Climate and Land Use/Land Cover under IPCC RCP Scenarios on Streamflow in the Hoeya River Basin, Korea. Sci. Total Environ. 2013, 452–453, 181–195. [Google Scholar] [CrossRef]
  27. Gurara, M.A.; Jilo, N.B.; Tolche, A.D. Modelling Climate Change Impact on the Streamflow in the Upper Wabe Bridge Watershed in Wabe Shebele River Basin, Ethiopia. Int. J. River Basin Manag. 2021, 1–13. [Google Scholar] [CrossRef]
  28. Chen, Q.; Chen, H.; Wang, J.; Zhao, Y.; Chen, J.; Xu, C. Impacts of Climate Change and Land-Use Change on Hydrological Extremes in the Jinsha River Basin. Water 2019, 11, 1398. [Google Scholar] [CrossRef] [Green Version]
  29. Kuma, H.G.; Feyessa, F.F.; Demissie, T.A. Hydrologic Responses to Climate and Land-Use/Land-Cover Changes in the Bilate Catchment, Southern Ethiopia. J. Water Clim. Chang. 2021, 12, 3750–3769. [Google Scholar] [CrossRef]
  30. Wedajo, G.K.; Muleta, M.K.; Awoke, B.G. Impacts of Combined and Separate Land Cover and Climate Changes on Impacts of Combined and Separate Land Cover and Climate Changes on Hydrologic Responses of Dhidhessa River Basin, Ethiopia Gizachew Kabite Wedajo, Misgana Kebede Muleta & Berhan Gessesse. Int. J. River Basin Manag. 2022, 1–14. [Google Scholar] [CrossRef]
  31. Chanapathi, T.; Thatikonda, S. Investigating the Impact of Climate and Land-Use Land Cover Changes on Hydrological Predictions over the Krishna River Basin under Present and Future Scenarios. Sci. Total Environ. 2020, 721, 137736. [Google Scholar] [CrossRef]
  32. Idrissou, M.; Diekkrüger, B.; Tischbein, B.; de Hipt, F.O.; Näschen, K.; Poméon, T.; Yira, Y.; Ibrahim, B. Modeling the Impact of Climate and Land Use/Land Cover Change on Water Availability in an Inland Valley Catchment in Burkina Faso. Hydrology 2022, 9, 12. [Google Scholar] [CrossRef]
  33. Astuti, I.S.; Sahoo, K.; Milewski, A.; Mishra, D.R. Impact of Land Use Land Cover (LULC) Change on Surface Runoff in an Increasingly Urbanized Tropical Watershed. Water Resour. Manag. 2019, 33, 4087–4103. [Google Scholar] [CrossRef]
  34. Khare, D.; Patra, D.; Mondal, A.; Kundu, S. Impact of Landuse/Land Cover Change on Run-off in the Catchment of a Hydro Power Project. Appl. Water Sci. 2017, 7, 787–800. [Google Scholar] [CrossRef]
  35. Bronstert, A.; Niehoff, D.; Brger, G. Effects of Climate and Land-Use Change on Storm Runoff Generation: Present Knowledge and Modelling Capabilities. Hydrol. Process. 2002, 16, 509–529. [Google Scholar] [CrossRef]
  36. Pfister, L.; Kwadijk, J.; Musy, A.; Bronstert, A.; Hoffmann, L. Climate Change, Land Use Change and Runoff Prediction in the Rhine-Meuse Basins. River Res. Appl. 2004, 20, 229–241. [Google Scholar] [CrossRef]
  37. Suryavanshi, S.; Pandey, A.; Chaube, U.C. Hydrological Simulation of the Betwa River Basin (India) Using the SWAT Model. Hydrol. Sci. J. 2017, 62, 960–978. [Google Scholar] [CrossRef]
  38. Wang, Q.; Xu, Y.; Wang, Y.; Zhang, Y.; Xiang, J.; Xu, Y.; Wang, J. Individual and Combined Impacts of Future Land-Use and Climate Conditions on Extreme Hydrological Events in a Representative Basin of the Yangtze River Delta, China. Atmos Res. 2020, 236, 104805. [Google Scholar] [CrossRef]
  39. Chang, H.; Johnson, G.; Hinkley, T.; Jung, I.W. Spatial Analysis of Annual Runoff Ratios and Their Variability across the Contiguous U.S. J. Hydrol. 2014, 511, 387–402. [Google Scholar] [CrossRef]
  40. Zuo, D.; Xu, Z.; Yao, W.; Jin, S.; Xiao, P.; Ran, D. Assessing the Effects of Changes in Land Use and Climate on Runoff and Sediment Yields from a Watershed in the Loess Plateau of China. Sci. Total Environ. 2016, 544, 238–250. [Google Scholar] [CrossRef]
  41. Kiprotich, P.; Wei, X.; Zhang, Z.; Ngigi, T.; Qiu, F.; Wang, L. Assessing the Impact of Land Use and Climate Change on Surface Runoff Response Using Gridded Observations and SWAT+. Hydrology 2021, 8, 48. [Google Scholar] [CrossRef]
  42. Patel, S.K.; Verma, P. Agricultural Growth and Land Use Land Cover Change in Peri-Urban India. Env. Monit. Assess. 2019, 191, 1–17. [Google Scholar] [CrossRef] [PubMed]
  43. Zhang, L.; Podlasly, C.; Ren, Y.; Feger, K.H.; Wang, Y.; Schwärzel, K. Separating the Effects of Changes in Land Management and Climatic Conditions on Long-Term Streamflow Trends Analyzed for a Small Catchment in the Loess Plateau Region, NW China. Hydrol. Process. 2014, 28, 1284–1293. [Google Scholar] [CrossRef]
  44. Bogale, S. Hydrological Response to Land Use and Land Cover Changes of Ribb Watershed, Ethiopia. Hydrology 2021, 9, 1. [Google Scholar] [CrossRef]
  45. Dibaba, W.T.; Demissie, T.A.; Miegel, K. Watershed Hydrological Response to Combined Land Use/Land Cover and Climate Change in Highland Ethiopia: Finchaa Catchment. Water 2020, 12, 1801. [Google Scholar] [CrossRef]
  46. Getachew, B.; Manjunatha, B.R. Potential Climate Change Impact Assessment on the Hydrology of the Lake Tana Basin, Upper Blue Nile River Basin, Ethiopia. Phys. Chem. Earth Parts A/B/C 2022, 127, 103162. [Google Scholar] [CrossRef]
  47. Woldesenbet, T.A.; Elagib, N.A.; Ribbe, L.; Heinrich, J. Catchment Response to Climate and Land Use Changes in the Upper Blue Nile Sub-Basins, Ethiopia. Sci. Total Environ. 2018, 644, 193–206. [Google Scholar] [CrossRef]
  48. Gebremicael, T.G.; Mohamed, Y.A.; van der Zaag, P. Attributing the Hydrological Impact of Different Land Use Types and Their Long-Term Dynamics through Combining Parsimonious Hydrological Modelling, Alteration Analysis and PLSR Analysis. Sci. Total Environ. 2019, 660, 1155–1167. [Google Scholar] [CrossRef]
  49. Bekele, D.; Alamirew, T.; Kebede, A.; Zeleke, G.; Melesse, A.M. Modeling the Impacts of Land Use and Land Cover Dynamics on Hydrological Processes of the Keleta Watershed, Ethiopia. Sustain. Environ. 2021, 7, 1909860. [Google Scholar] [CrossRef]
  50. Mehdi, B.; Lehner, B.; Gombault, C.; Michaud, A.; Beaudin, I.; Sottile, M.F.; Blondlot, A. Simulated Impacts of Climate Change and Agricultural Land Use Change on Surface Water Quality with and without Adaptation Management Strategies. Agric. Ecosyst. Env. 2015, 213, 47–60. [Google Scholar] [CrossRef]
  51. El-Khoury, A.; Seidou, O.; Lapen, D.R.L.; Que, Z.; Mohammadian, M.; Sunohara, M.; Bahram, D. Combined Impacts of Future Climate and Land Use Changes on Discharge, Nitrogen and Phosphorus Loads for a Canadian River Basin. J. Env. Manag. 2015, 151, 76–86. [Google Scholar] [CrossRef]
  52. Wang, K.; Qian, M.; Xu, S.; Liang, S.; Chen, H.; Hu, Y.; Su, C.; Zhao, M.; Li, W.; Wang, J. Impacts of Climate Change on Water Resources in the Huaihe River Basin. MATEC Web Conf. 2018, 246, 01090. [Google Scholar] [CrossRef]
  53. Mishra, H.; Denis, D.M.; Suryavanshi, S.; Kumar, M.; Srivastava, S.K.; Denis, A.F.; Kumar, R. Hydrological Simulation of a Small Ungauged Agricultural Watershed Semrakalwana of Northern India. Appl. Water Sci. 2017, 7, 2803–2815. [Google Scholar] [CrossRef] [Green Version]
  54. Lopes, T.R.; Zolin, C.A.; Mingoti, R.; Vendrusculo, L.G.; de Almeida, F.T.; de Souza, A.P.; de Oliveira, R.F.; Paulino, J.; Uliana, E.M. Hydrological Regime, Water Availability and Land Use/Land Cover Change Impact on the Water Balance in a Large Agriculture Basin in the Southern Brazilian Amazon. J. South Am. Earth Sci. 2021, 108, 103224. [Google Scholar] [CrossRef]
  55. Bal, M.; Dandpat, A.K.; Naik, B. Hydrological Modeling with Respect to Impact of Land-Use and Land-Cover Change on the Runoff Dynamics in Budhabalanga River Basing Using ArcGIS and SWAT Model. Remote Sens. Appl. Soc. Environ. 2021, 23, 100527. [Google Scholar] [CrossRef]
  56. Melesse, A.M.; Loukas, A.G.; Senay, G.; Yitayew, M. Advanced Bash-Scripting Guide An In-Depth Exploration of the Art of Shell Scripting Table of Contents. Hydrol. Process. 2010, 2274, 2267–2274. [Google Scholar] [CrossRef]
  57. Bekele, A.A.; Pingale, S.M.; Hatiye, S.D.; Tilahun, A.K. Impact of Climate Change on Surface Water Availability and Crop Water Demand for the Sub-Watershed of Abbay Basin, Ethiopia. Sustain. Water Resour. Manag. 2019, 5, 1859–1875. [Google Scholar] [CrossRef]
  58. Gebere, S.B.; Alamirew, T.; Merkel, B.J.; Melesse, A.M. Performance of High-Resolution Satellite Rainfall Products over Data-Scarce Parts of Eastern Ethiopia. Remote Sens. 2015, 7, 11639–11663. [Google Scholar] [CrossRef] [Green Version]
  59. SRTM Source of the 30 M Resolution. Available online: https://earthexplorer.usgs.gov/ (accessed on 1 October 2022).
  60. FAO. World Soil Resources: An Explanatory Note on the FAO (Food and Agriculture Organization) World Soil Resources Map at 1:25 000 00 Scale; FAO: Rome, Italy, 1995. [Google Scholar]
  61. Anderson, J. A Land Use and Land Cover Classification System for Use with Remote Sensor Data; USGS: Reston, VA, USA, 1976.
  62. Ismail, M.; Jusoff, K. Satellite Data Classification Accuracy Assessment Based from Reference Dataset. Int. J. Geol. Environ. Eng. 2008, 2, 23–29. [Google Scholar]
  63. Neitsch, S.L.; Arnold, J.G.; Kiniry, J.R.; Williams, J.R. Soil & Water Assessment Tool Theoretical Documentation Version 2009; Technical Report; Texas Water Resources Institute: College Station, TX, USA, 2011; pp. 1–647. [Google Scholar] [CrossRef]
  64. Qiu, B.L.; Peng, D.; Fang, J.; Zhang, Z. Estimation of Hydrological Responses to Climate Changes and Human Activities Estimation of Hydrological Responses to Climate Changes and Human Activities in the Xitiaoxi River Basin. In Proceedings of the 3rd IMA International Conference on Flood Risk, Swansea University, Wales, UK, 30–31 March 2015. [Google Scholar]
  65. Dile, Y.T.; Daggupati, P.; George, C.; Srinivasan, R.; Arnold, J. Introducing a New Open-Source GIS User Interface for the SWAT Model. Environ. Model. Softw. 2016, 85, 129–139. [Google Scholar] [CrossRef]
  66. Zotarelli, L.; Dukes, M.D.; Romero, C.C.; Migliaccio, K.W.; Kelly, T. Step by Step Calculation of the Penman-Monteith Evapotranspiration (FAO-56 Method). Inst. Food Agric. Sciences. Univ. Fla. 2020, 8, 1–10. [Google Scholar]
  67. Masih, I.; Uhlenbrook, S.; Maskey, S.; Smakhtin, V. Streamflow Trends and Climate Linkages in the Zagros Mountains, Iran. Clim. Chang. 2011, 104, 317–338. [Google Scholar] [CrossRef]
  68. Arnold, J.G.; Srinivasan, R.; Muttiah, R.S.; Williams, J.R. LARGE AREA HYDROLOGIC MODELING AND ASSESSMENT PART I: MODEL DEVELOPMENT1. JAWRA J. Am. Water Resour. Assoc. 1998, 34, 73–89. [Google Scholar] [CrossRef]
  69. Arnold, J.G.; Moriasi, D.N.; Gassman, P.W.; Abbaspour, K.C.; White, M.J.; Srinivasan, R.; Santhi, C.; Harmel, R.D.; van Griensven, A.; Van Liew, M.W.; et al. SWAT: Model Use, Calibration, and Validation. Trans. ASABE 2012, 55, 1491–1508. [Google Scholar] [CrossRef]
  70. Neitsch, S.L.; Arnold, J.G.; Srinivasan, R. Pesticides Fate and Transport Predicted by the Soil and Water Assessment Tool (SWAT) Atrazine, Metolachlor and Trifluralin in the Sugar Creek Watershed. BRC Rep. 2002, 3, 1–100. [Google Scholar]
  71. Gassman, P.W.; Sadeghi, A.M.; Srinivasan, R. Applications of the SWAT Model Special Section: Overview and Insights. J. Env. Qual. 2014, 43, 1–8. [Google Scholar] [CrossRef] [PubMed]
  72. Vazquez-Amábile, G.G.; Engel, B.A. Use of SWAT to Compute Groundwater Table Depth and Streamflow in the Muscatatuck River Watershed. Trans. Am. Soc. Agric. Eng. 2005, 48, 991–1003. [Google Scholar] [CrossRef] [Green Version]
  73. Daggupati, P.; Pai, N.; Ale, S.; Douglas-Mankin, K.R.; Zeckoski, R.W.; Jeong, J.; Parajuli, P.B.; Saraswat, D.; Youssef, M.A. A Recommended Calibration and Validation Strategy for Hydrologic and Water Quality Models. Trans. ASABE 2015, 58, 1705–1719. [Google Scholar] [CrossRef] [Green Version]
  74. Murty, P.S.; Pandey, A.; Suryavanshi, S. Application of Semi-distributed Hydrological Model for Basin Level Water Balance of the Ken Basin of Central India. Wiley Online Libr. 2013, 28, 4119–4129. [Google Scholar] [CrossRef]
  75. Andualem, T.; Eng, B.G. Impact of Land Use Land Cover Change on Stream Flow and Sediment Yield: A Case Study of Gilgel Abay Watershed, Lake Tana Sub-Basin, Ethiopia. Int. J. Technol. Enhanc. Merg. 2015, 3, 28. [Google Scholar]
  76. Tenagashaw, D.Y.; Andualem, T.G. Analysis and Characterization of Hydrological Drought under Future Climate Change Using the SWAT Model in Tana Sub-Basin, Ethiopia. Water Conserv. Sci. Eng. 2022, 7, 131–142. [Google Scholar] [CrossRef]
  77. Andualem, T.G.; Guadie, A.; Belay, G.; Ahmad, I.; Dar, M.A. Hydrological Modeling of Upper Ribb Watershed, Abbay Basin, Ethiopia. Glob. Nest J. 2020, 22, 158–164. [Google Scholar] [CrossRef]
  78. Santhi, C.; Arnold, J.G.; Williams, J.R.; Dugas, W.A.; Srinivasan, R.; Hauck, L.M. Validation of the Swat Model on A Large Rwer Basin with Point and Nonpoint Sources. JAWRA J. Am. Water Resour. Assoc. 2001, 37, 1169–1188. [Google Scholar] [CrossRef]
  79. Van Liew, M.W.; Arnold, J.G.; Garbrecht, J.D. Hydrologic Simulation on Agricultural Watersheds: Choosing between Two Models. Trans. Am. Soc. Agric. Eng. 2003, 46, 1539–1551. [Google Scholar] [CrossRef]
  80. Nash, J.E.; Sutcliffe, J.V. River Flow Forecasting through Conceptual Models Part I—A Discussion of Principles. J. Hydrol. 1970, 10, 282–290. [Google Scholar] [CrossRef]
  81. Gupta, H.V.; Sorooshian, S.; Yapo, P.O. Status of Automatic Calibration for Hydrologic Models: Comparison with Multilevel Expert Calibration. J. Hydrol.Eng. 1999, 4, 135–143. [Google Scholar] [CrossRef]
  82. Li, Z.; Xu, Z.; Shao, Q.; An, J.Y.-H.P. Parameter Estimation and Uncertainty Analysis of SWAT Model in Upper Reaches of the Heihe River Basin. Hydrol. Process. Int. J. 2009, 23, 2744–2753. [Google Scholar] [CrossRef]
  83. Mekonnen, D.; Duan, Z.; Rientjes, T.; Disse, M. Analysis of the Combined and Single Effects of LULC and Climate Change on the Streamflow of the Upper Blue Nile River Basin (UBNRB): Using Statistical Trend Tests, Remote Sensing Landcover Maps and the SWAT Model. Hydrol. Earth Syst. Sci. Discuss. 2017, 1–26. [Google Scholar] [CrossRef]
  84. Woldesenbet, T.A.; Elagib, N.A.; Ribbe, L.; Heinrich, J. Hydrological Responses to Land Use/Cover Changes in the Source Region of the upper Blue Nile Basin, Ethiopia. Sci. Total Environ. 2017, 575, 724–741. [Google Scholar] [CrossRef]
  85. Mathews, R.; Richter, B.D. Application of the Indicators of Hydrologic Alteration Software in Environmental Flow Setting. JAWRA J. Am. Water Resour. Assoc. 2007, 43, 1400–1413. [Google Scholar] [CrossRef]
  86. Gebremicael, T.G.; Mohamed, Y.A.; Zaag, P.V.; Hagos, E.Y. Temporal and Spatial Changes of Rainfall and Streamflow in the Upper Tekezē-Atbara River Basin, Ethiopia. Hydrol. Earth Syst. Sci. 2016, 21, 2127–2142. [Google Scholar] [CrossRef] [Green Version]
  87. Malede, D.A.; Alamirew, T.; Kosgie, J.R.; Andualem, T.G. Analysis of Land Use/Land Cover Change Trends over Birr River Watershed, Abbay Basin, Ethiopia. Environ. Sustain. Indic. 2023, 17, 100222. [Google Scholar] [CrossRef]
  88. Gashaw, T.; Tulu, T.; Argaw, M.; Worqlul, A.W. Modeling the Hydrological Impacts of Land Use/Land Cover Changes in the Andassa Watershed, Blue Nile Basin, Ethiopia. Sci. Total Environ. 2018, 619–620, 1394–1408. [Google Scholar] [CrossRef] [PubMed]
  89. Ewunetu, A.; Simane, B.; Teferi, E.; Zaitchik, B.F. Land Cover Change in the Blue Nile River Headwaters: Farmers’ Perceptions, Pressures, and Satellite-Based Mapping. Land 2021, 10, 68. [Google Scholar] [CrossRef]
  90. Moriasi, D.N.; Arnold, J.G.; van Liew, M.W.; Bingner, R.L.; Harmel, R.D.; Veith, T.L. Model Evaluation Guidelines for Systematic Quantification of Accuracy in Watershed Simulations. Trans. ASABE 2007, 50, 885–900. [Google Scholar] [CrossRef]
  91. Baker, T.J.; Miller, S.N. Using the Soil and Water Assessment Tool (SWAT) to Assess Land Use Impact on Water Resources in an East African Watershed. J. Hydrol. 2013, 486, 100–111. [Google Scholar] [CrossRef]
  92. Huang, H.J.; Cheng, S.J.; Wen, J.C.; Lee, J.H. Effect of Growing Watershed Imperviousness on Hydrograph Parameters and Peak Discharge. Hydrol. Process. 2008, 22, 2075–2085. [Google Scholar] [CrossRef]
  93. Wang, R.; Kalin, L.; Kuang, W.; Tian, H. Individual and Combined Effects of Land Use/Cover and Climate Change on Wolf Bay Watershed Streamflow in Southern Alabama. Hydrol. Process. 2014, 28, 5530–5546. [Google Scholar] [CrossRef]
  94. Chim, K.; Tunnicliffe, J.; Shamseldin, A.Y.; Bun, H. Assessment of Land Use and Climate Change Effects on Hydrology in the Upper Siem Reap River and Angkor Temple Complex, Cambodia. Env. Dev 2021, 39, 100615. [Google Scholar] [CrossRef]
  95. Teklay, A.; Dile, Y.T.; Setegn, S.G.; Demissie, S.S.; Asfaw, D.H. Evaluation of Static and Dynamic Land Use Data for Watershed Hydrologic Process Simulation: A Case Study in Gummara Watershed, Ethiopia. Catena 2019, 172, 65–75. [Google Scholar] [CrossRef]
  96. Worku, T.; Khare, D.; Tripathi, S.K. Modeling Runoff–Sediment Response to Land Use/Land Cover Changes Using Integrated GIS and SWAT Model in the Beressa Watershed. Env. Earth Sci. 2017, 76, 550. [Google Scholar] [CrossRef]
  97. Central Statistical Agency (CSA). Summary and Statistical Report of the 2007 Population and Housing Census Results; Central Statistical Agency (CSA): Addis Ababa, Ethiopia, 2007.
  98. Yang, X.L.; Ren, L.L.; Liu, Y.; Jiao, D.L.; Jiang, S.H. Hydrological Response to Land Use and Land Cover Changes in a Sub-Watershed of West Liaohe River Basin, China. J. Arid. Land 2014, 6, 678–689. [Google Scholar] [CrossRef] [Green Version]
  99. Demeke, G.G.; Andualem, T.G. Application of Remote Sensing for Evaluation of Land Use Change Responses on Hydrology of Muga Watershed, Abbay River Basin, Ethiopia. J. Earth Sci. Clim. Chang. 2018, 9, 2. [Google Scholar] [CrossRef]
  100. Andualem, T.G.; Belay, G.; Guadie, A. Land Use Change Detection Using Remote Sensing Technology. J. Earth Sci. Clim. Chang. 2018, 9, 1–6. [Google Scholar] [CrossRef]
  101. Fenta Mekonnen, D.; Duan, Z.; Rientjes, T.; Disse, M. Analysis of Combined and Isolated Effects of Land-Use and Land-Cover Changes and Climate Change on the Upper Blue Nile River Basin’s Streamflow. Hydrol. Earth Syst. Sci. 2018, 22, 6187–6207. [Google Scholar] [CrossRef] [Green Version]
  102. Kim, Y.; Engel, B.A.; Lim, K.J.; Larson, V.; Duncan, B. Runoff Impacts of Land-Use Change in Indian River Lagoon Watershed. J. Hydrol. Eng. 2002, 7, 245–251. [Google Scholar] [CrossRef]
  103. Liu, J.; Chen, J.M.; Cihlar, J. Mapping Evapotranspiration Based on Remote Sensing: An Application to Canada’s Landmass. Water Resour. Res. 2003, 39, 1189. [Google Scholar] [CrossRef]
  104. Malede, D.A.; Agumassie, T.A.; Kosgei, J.R.; Linh, N.T.T.; Andualem, T.G. Analysis of Rainfall and Streamflow Trend and Variability over Birr River Watershed, Abbay Basin, Ethiopia. Environ. Chall. 2022, 7, 100528. [Google Scholar] [CrossRef]
  105. Takele, A.; Lakew, H.B.; Kabite, G. Does the Recent Afforestation Program in Ethiopia Influenced Vegetation Cover and Hydrology? A Case Study in the Upper Awash Basin, Ethiopia. Heliyon 2022, 8, e09589. [Google Scholar] [CrossRef]
  106. Gao, B.; Li, J.; Wang, X. Analyzing Changes in the Flow Regime of the Yangtze River Using the Eco-Flow Metrics and IHA Metrics. Water 2018, 10, 1552. [Google Scholar] [CrossRef]
Figure 1. Location map of the study area, meteorological and hydrological gauging stations.
Water 15 00166 g001
Figure 2. Monthly maximum temperature (Tmax), minimum temperature (Tmin), mean temperature (Tmean), and mean rainfall in the Birr River watershed (1986–2018).
Water 15 00166 g002
Figure 3. Major soil types in the study Birr River watershed.
Water 15 00166 g003
Figure 4. Comparison of observed and simulated streamflow for model calibrated value (1994–2001).
Water 15 00166 g004
Figure 5. Scatter plot between observed and simulated streamflow for model calibration period (1994–2001).
Water 15 00166 g005
Figure 6. Observed and simulated streamflow for a model validation value (2002–2005).
Water 15 00166 g006
Figure 7. Scatter plot between observed and simulated streamflow for model validation period (2002–2005).
Water 15 00166 g007
Figure 8. Separate and combined effects of LULC and climate change on: (a). surface runoff; (b). baseflow; (c). water yield, and (d). evapotranspiration.
Water 15 00166 g008
Table 1. Satellite data acquisition in the study area.
SourceSensorsPath/RowSpatial ResolutionAcquisition Date
Earthexplorer.usgs.gov (accessed on 1 August 2022)Landsat TM169/05330 m × 30 mJanuary 1986
Landsat TM169/05330 m × 30 mJanuary 2001
Landsat OLI/TIRS169/05330 m × 30 mFebruary 2018
Table 2. General description of LULC classes.
LULC Classes Description of LULC Classes
Agricultural landEnclosed with permanent crops, following land, and irrigated cultivation
Bushlands Covered with small to medium-sized perennial woody or natural vegetation
Forest land Trees taller than 5 m and covering more than 0.5 hectares of land
Grasslands Terrestrial vegetation dominated by grass, suitable for grazing by livestock
Settlements Built-up areas and roads, the establishment of a person in a new region
Table 3. Different simulation scenarios for evaluating the effect of LULC and climate change on hydrological processes from 1986 to 2018.
Scenarios ConsideredLULC mapClimate DataRemarks
S119861986–1996Bassline
S2 20011986–1996Assumed
S3 20181986–1996Assumed
S419861997–2007Assumed
S520011997–2007Baseline
S620181997–2007Assumed
S719862008–2018Assumed
S820012008–2018Assumed
S920182008–2018Baseline
Table 4. The proportional area coverage in kilometer squares (km2) and percentage (%) of LULC classes in the Birr River watershed.
LULC ClassesLULC Area in Kilometer Squares (km2) and Percentage (%)
198620012018
km2%km2%km2%
Agriculture773.0456.39849.9061.99962.3470.19
Bushland358.9126.18326.3523.80264.6419.30
Forest67.694.9424.231.7726.391.92
Grassland161.3811.77154.2611.2598.227.16
Settlements9.960.7316.251.1919.401.42
Table 5. Accuracy assessment of LULC map classification, 1986.
Land Use ClassesAgricultureBushlandForestGrasslandSettlementRow TotalUsers Accuracy
Agriculture27000027100%
Bushland1220202588%
Forest109001085%
Grassland2101702090%
Settlement10003475%
Column total3223920386
Producers accuracy84%95%100%90%100%
Overall classification accuracy = 90.69%Kappa Coefficient = 0.87
Table 6. Accuracy assessment of LULC map classification, 2001.
Land Use ClassesAgricultureBushlandForestGrasslandSettlementRow TotalUsers Accuracy
Agriculture2531103083.33%
Bushland1230102592%
Forest00100010100%
Grassland1001902095%
Settlement000044100%
Column total27261121489
Producers accuracy92%88%90%90%100%
Overall classification accuracy = 91.01%Kappa Coefficient = 0.88
Table 7. Accuracy assessment of LULC map classification, 2018.
Land Use ClassesAgricultureBushlandForestGrasslandSettlementRow TotalUsers Accuracy
Agriculture2810103093%
Bushland2221002588%
Forest00100010100%
Grassland1101802090%
Settlement000055100%
Column total31261219590
Producers accuracy90%85%83%95%100%
Overall classification accuracy = 92.22%Kappa Coefficient = 0.89
Table 8. Rate of LULC changes between 1986 and 2018.
LULC Classes19862018Change in 1986 and 2018Rate of Changes
km2km2km2%km2/year%
Agricultural land773.04962.34189.324.495.920.77
Bushland358.91264.64−94.27−26.27−2.95−0.82
Forest67.6926.39−41.30−61.01−1.29−1.91
Grassland161.3898.22−63.16−39.14−1.97−1.22
Settlements9.9619.409.4454.780.312.96
Table 9. The parameter values used to simulate the SWAT model.
ParametersRange ValueFitted ValueParameter Description
CN2−50 to 5023.33SCS curve number for moisture conditions II
ESCO0 to 10.23Soil evaporation compensation factor
GWQMN0 to 5000166.66The threshold depth of water in the shallow aquifer required for return flow occurs (mm)
Canmax0 to 107.66Maximum canopy index
SOL_AWS−50 to 5013.33Available water capacity of the soil layer (mm mm−1)
SOL_Z−50 to 509.99Depth from the soil surface to the bottom of the layer (mm)
Table 10. Statistical analysis of the observed and simulated monthly streamflow during calibration (1997–2007) and validation (2008–2013).
PeriodStatistical ParametersValue
CalibrationsR20.83
NSE0.80
PBIAS−15.23
ValidationsR20.81
NSE0.71
PBIAS−14.45
Table 11. Average monthly hydrological components for the effect of various land use types with fixed climate data.
ScenariosLULCClimateSurface Runoff (mm)Baseflow (mm)Water Yield (mm)Evapotranspiration (mm)
S119861986–19968.2632.7650.3348.83
S220011986–19968.6531.0150.3048.78
S320181986–19969.1430.5549.4548.75
Table 12. Average monthly hydrological components for the effect of various land use types with fixed climate data.
ScenariosLULCClimateSurface Runoff (mm)Baseflow (mm)Water Yield (mm)Evapotranspiration (mm)
S419861997–200715.1539.0265.0344.27
S520011997–200715.7037.5564.5443.12
S620181997–200716.0935.8563.0742.14
Table 13. Average monthly hydrological components for the effect of various land use types with fixed climate data.
ScenariosLULCClimateSurface Runoff (mm)Baseflow (mm)Water Yield (mm)Evapotranspiration (mm)
S719862008–201816.8937.9665.6244.98
S820012008–201817.0036.6364.2343.62
S920182008–201817.8034.5463.3642.30
Table 14. Results in Indicators of hydrological alteration parameters.
IHA Parameters1-Day
min
3-Day
min
7-Day
min
30-Day
min
90-Day
min
1-Day
max
3-Day
max
7-Day
max
30-Day
max
90-Day
max
Rise Rate Fall Rate
p value 0.350.310.070.010.000.480.350.140.290.030.010.00
Z value 0.931.021.790.822.210.700.941.481.062.200.78−1.78
Note: min = minimum, and max = maximum.
Disclaimer/Publisher’s Note: The statements, opinions and data contained in all publications are solely those of the individual author(s) and contributor(s) and not of MDPI and/or the editor(s). MDPI and/or the editor(s) disclaim responsibility for any injury to people or property resulting from any ideas, methods, instructions or products referred to in the content.

