
Determination of Groundwater Recharge Mechanism Based on Environmental Isotopes in Chahannur Basin
by
Xizhao Tian
1, 
Zhiqiang Gong
1,
Lulu Fu
1,
Di You
2,
Fan Li
1,
Yahui Wang
3,
Zhi Chen
1,* and
Yahong Zhou
2 1
Hebei Key Laboratory of Geological Resources and Environment Monitoring and Protection, Hebei Geological Environment Monitoring Institute, Shijiazhuang 050021, China
2
School of Water Resources and Environment, Hebei GEO University, Shijiazhuang 050031, China
3
Land Resources Exploration Centre of Hebei Bureau of Geology and Mineral Exploration and Development (Emergency Rescue Centre for Mines and Geological Disasters of Hebei Province), Shijiazhuang 050081, China
*
Author to whom correspondence should be addressed.
Water 2023, 15(1), 180; https://doi.org/10.3390/w15010180
Submission received: 19 October 2022
/
Revised: 22 November 2022
/
Accepted: 3 December 2022
/
Published: 1 January 2023
(This article belongs to the Special Issue Isotope Fingerprints of Precipitation in Groundwater, Lakes and Rivers)
Abstract
:In recent years, the lake area of the Chahannur Basin has been decreasing, leading to an increase in salt dust storms. In order to find out the recharge mechanism of groundwater in the Chahannur Basin, a total of 51 groundwater and surface water samples were collected. Tritium (3H) isotope and Freon (CFCs) were used to estimate the age of groundwater and preliminarily analyze the sources of groundwater recharge. The characteristics of hydrogen, oxygen, and strontium isotopes are used to indicate the characteristics of the water cycle in the Chahannur Basin. The results show that: (1) Two dating methods, tritium isotope (3H) and Freon (CFCs), are suitable for semi-quantitative dating of groundwater in the Chahannur Basin. (2) Hydrogen, oxygen, and strontium isotopes can be used to characterize the groundwater cycle in the Chahannur Basin. (3) The groundwater level around the Chahannur Lake area is low, and the groundwater in the Chahannur Basin flows from the southwest and northwest to the lake area. (4) The groundwater in the Chahannur Basin is mainly replenished by atmospheric precipitation, and the evaporation of groundwater and surface water is strong. The research results provide a basis for the study of measures to prevent the reduction in the Chahannur watershed area.
1. Introduction
The Chahannur Basin is located in Zhangjiakou City, covering an area of about 6757 km2. There are a number of lakes in the basin, including Chahannur Lake. In recent years, due to the excessive exploitation of groundwater, the water level has been declining year by year, and the area of the Chahannur Basin Lake area has been gradually reduced, resulting in land desertification and other problems. Therefore, a comprehensive study of the recharge, runoff, and discharge mechanism of inland water in the Chahannur Basin and the transformation characteristics among groundwater, surface water, and atmospheric precipitation is helpful to formulate targeted groundwater exploitation policies to avoid the continuous decline of inland water level and the reduction in lake area in the Chahannur Basin [1]. Research on groundwater recharge sources currently uses groundwater hydrodynamics, model simulations, temperature tracers, and hydrochemistry and isotope tracers [2,3]. Stable hydrochemical indexes and stable isotope indexes remain relatively stable in groundwater runoff [4]. However, different recharge sources lead to significant differences in hydrochemical and isotope indexes in groundwater. Environmental isotopes have become a practical “key” to studying groundwater recharge sources. A wealth of national and international research has provided a solid foundation for this study. Takuya Matsumoto used Kr isotope and radioactive He as quantitative tracers for groundwater dating and accurately estimated the groundwater age distribution from the coastal plain to the sea area in the North China Plain (the age of groundwater refers to the time that water remains underground, that is, the time that precipitation penetrates into the ground and is isolated from the atmosphere) [5]. Xiaolin Qiu used the results of helium isotope and neon isotope to show that the groundwater in this area comes from the crust rather than the deeper mantle [6]. Ahmad Taufifiq studied the control factors and driving mechanism of nitrate pollution in the groundwater system of Bandung Basin, Indonesia, based on the comprehensive analysis of stable isotope ratio, CFC age dating, and socioeconomic parameters [7]. Todor Anovski et al. applied environmental isotope technology to establish a linear regression model of stable isotope data of precipitation samples to determine the source and recharge mechanism of the Rashche spring [8]. Jasechko proposed a groundwater quality fraction estimation method based on 14C to better understand the 14C dating method and groundwater resources in California [9]. Rohana Chandrajith investigated the geochemical and isotopic characteristics of geothermal springs in Sri Lanka and obtained evidence that the geothermal gradient of geothermal springs in Sri Lanka was steeper than expected [10]. Jianfei Yuan determined the boron content in the geothermal fields of Yangba Well and Yangyi from 52 samples of geothermal water, warm spring water, cold groundwater, and river water, and believed that boron isotope could be used to trace the origin of geothermal water and identify the polluted geothermal wastewater caused by geothermal water [11]. Peng Wang studied the geochemical properties of hydrothermal fluid in the MGF system, revealed the source of solute, and determined the equilibrium temperature to supply the reservoir [12]. Using the accumulation rate of 228 Ra in the Dead Sea, Yael Kiro calculated the age and flow rate of high saline water entering groundwater in the Dead Sea [13]. Xianchun Tang analyzed the relationship between the thermal structure, hydrothermal activity, and geothermal dynamics of ETGB by using helium isotope, gravity and magnetism, and seismic data. At the same time, based on the heat source and geo-geophysical background, he proposed the Kangding and Batang hydrothermal system models in ETGB [14]. Therefore, based on the isotope and hydrochemical information in groundwater and surface water, the characteristics of the cycle and transformation process of different water bodies can be characterized. In a word, the main purpose of this study is to trace the source of tritium, freon, hydrogen, and 82 oxygen and strontium isotopes. It mainly solves the following problems: using isotopes to determine the recharge and discharge characteristics and hydrochemical characteristics of groundwater in the Chahannur Basin. The research results can provide a reference for the risk caused by the reduction and degradation of the lake area in Chahannur Basin.
2. Materials and Methods
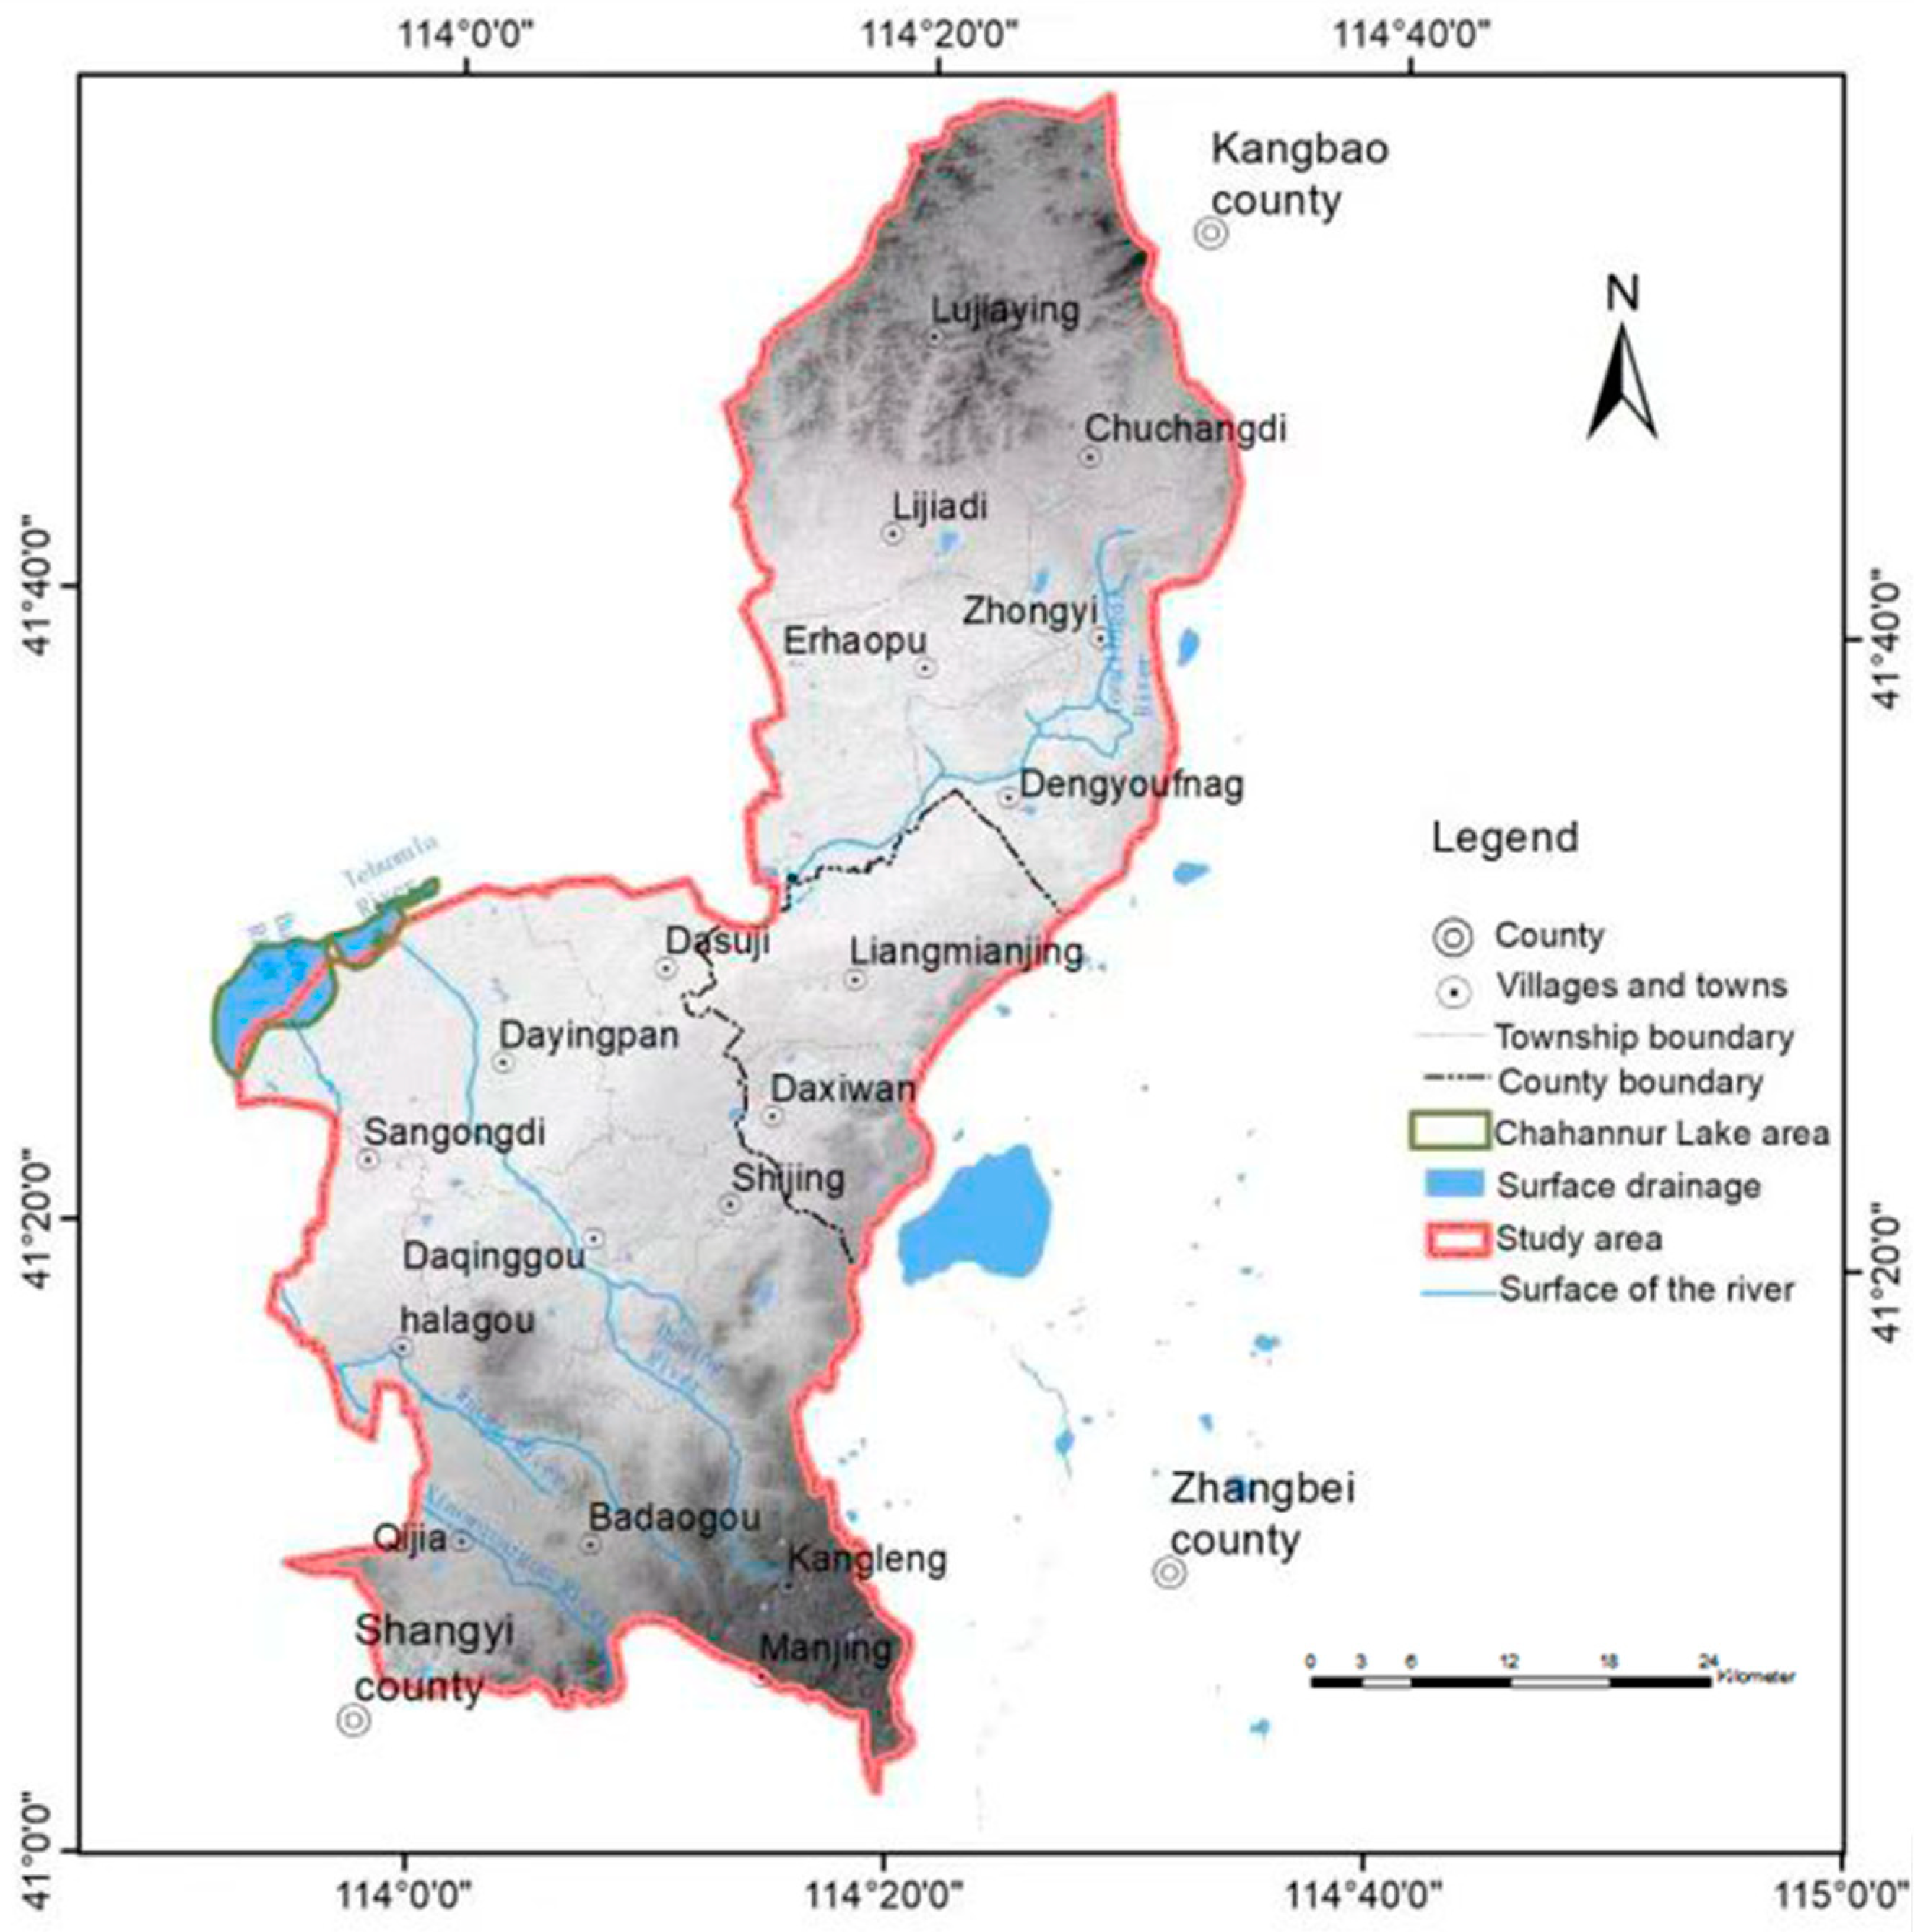
2.1. Study Area
The Chahannur Basin is between 1270 and 1561 m above sea level, with high terrain surrounding and low terrain in the middle and gully development. The average annual rainfall is 364.1 mm and the average annual temperature is 3.7 °C. The natural geographical environment of the basin is simple; because of the continuous dissipation of groundwater resources, a large number of lakes shrink or even dry up. The land desertification phenomenon is serious.
The phreatic water in the Chahannur Basin is mainly composed of Quaternary loose rock pore phreatic water and Neogene and Paleogene clastic rock fracture pore phreatic water. The confined water mainly consists of pore-confined water of Quaternary loose rocks and fractured pore-confined water of Neogene, Paleogene, and Lower Cretaceous clastic rocks. The pore water and confined water of the Quaternary loose rocks are only distributed in the surrounding area of the Chahannur Lake area with a small area. The lithology is mainly composed of silty clay, silty sand, and fine sand, which is supplied by the lateral runoff of groundwater in the upper wavy plain area. Fracture water, pore water, and confined water of clastic rocks of the Neogene, Paleogene, and Lower Cretaceous are widely distributed in the basin. The lithology is dominated by sandstone and conglomerate of Upper Neogene and Paleocene Eocene of Paleogene, overlaid with thick layers of mudstone or sandy mudstone, up to 40 m thick. See Figure 1 for details.
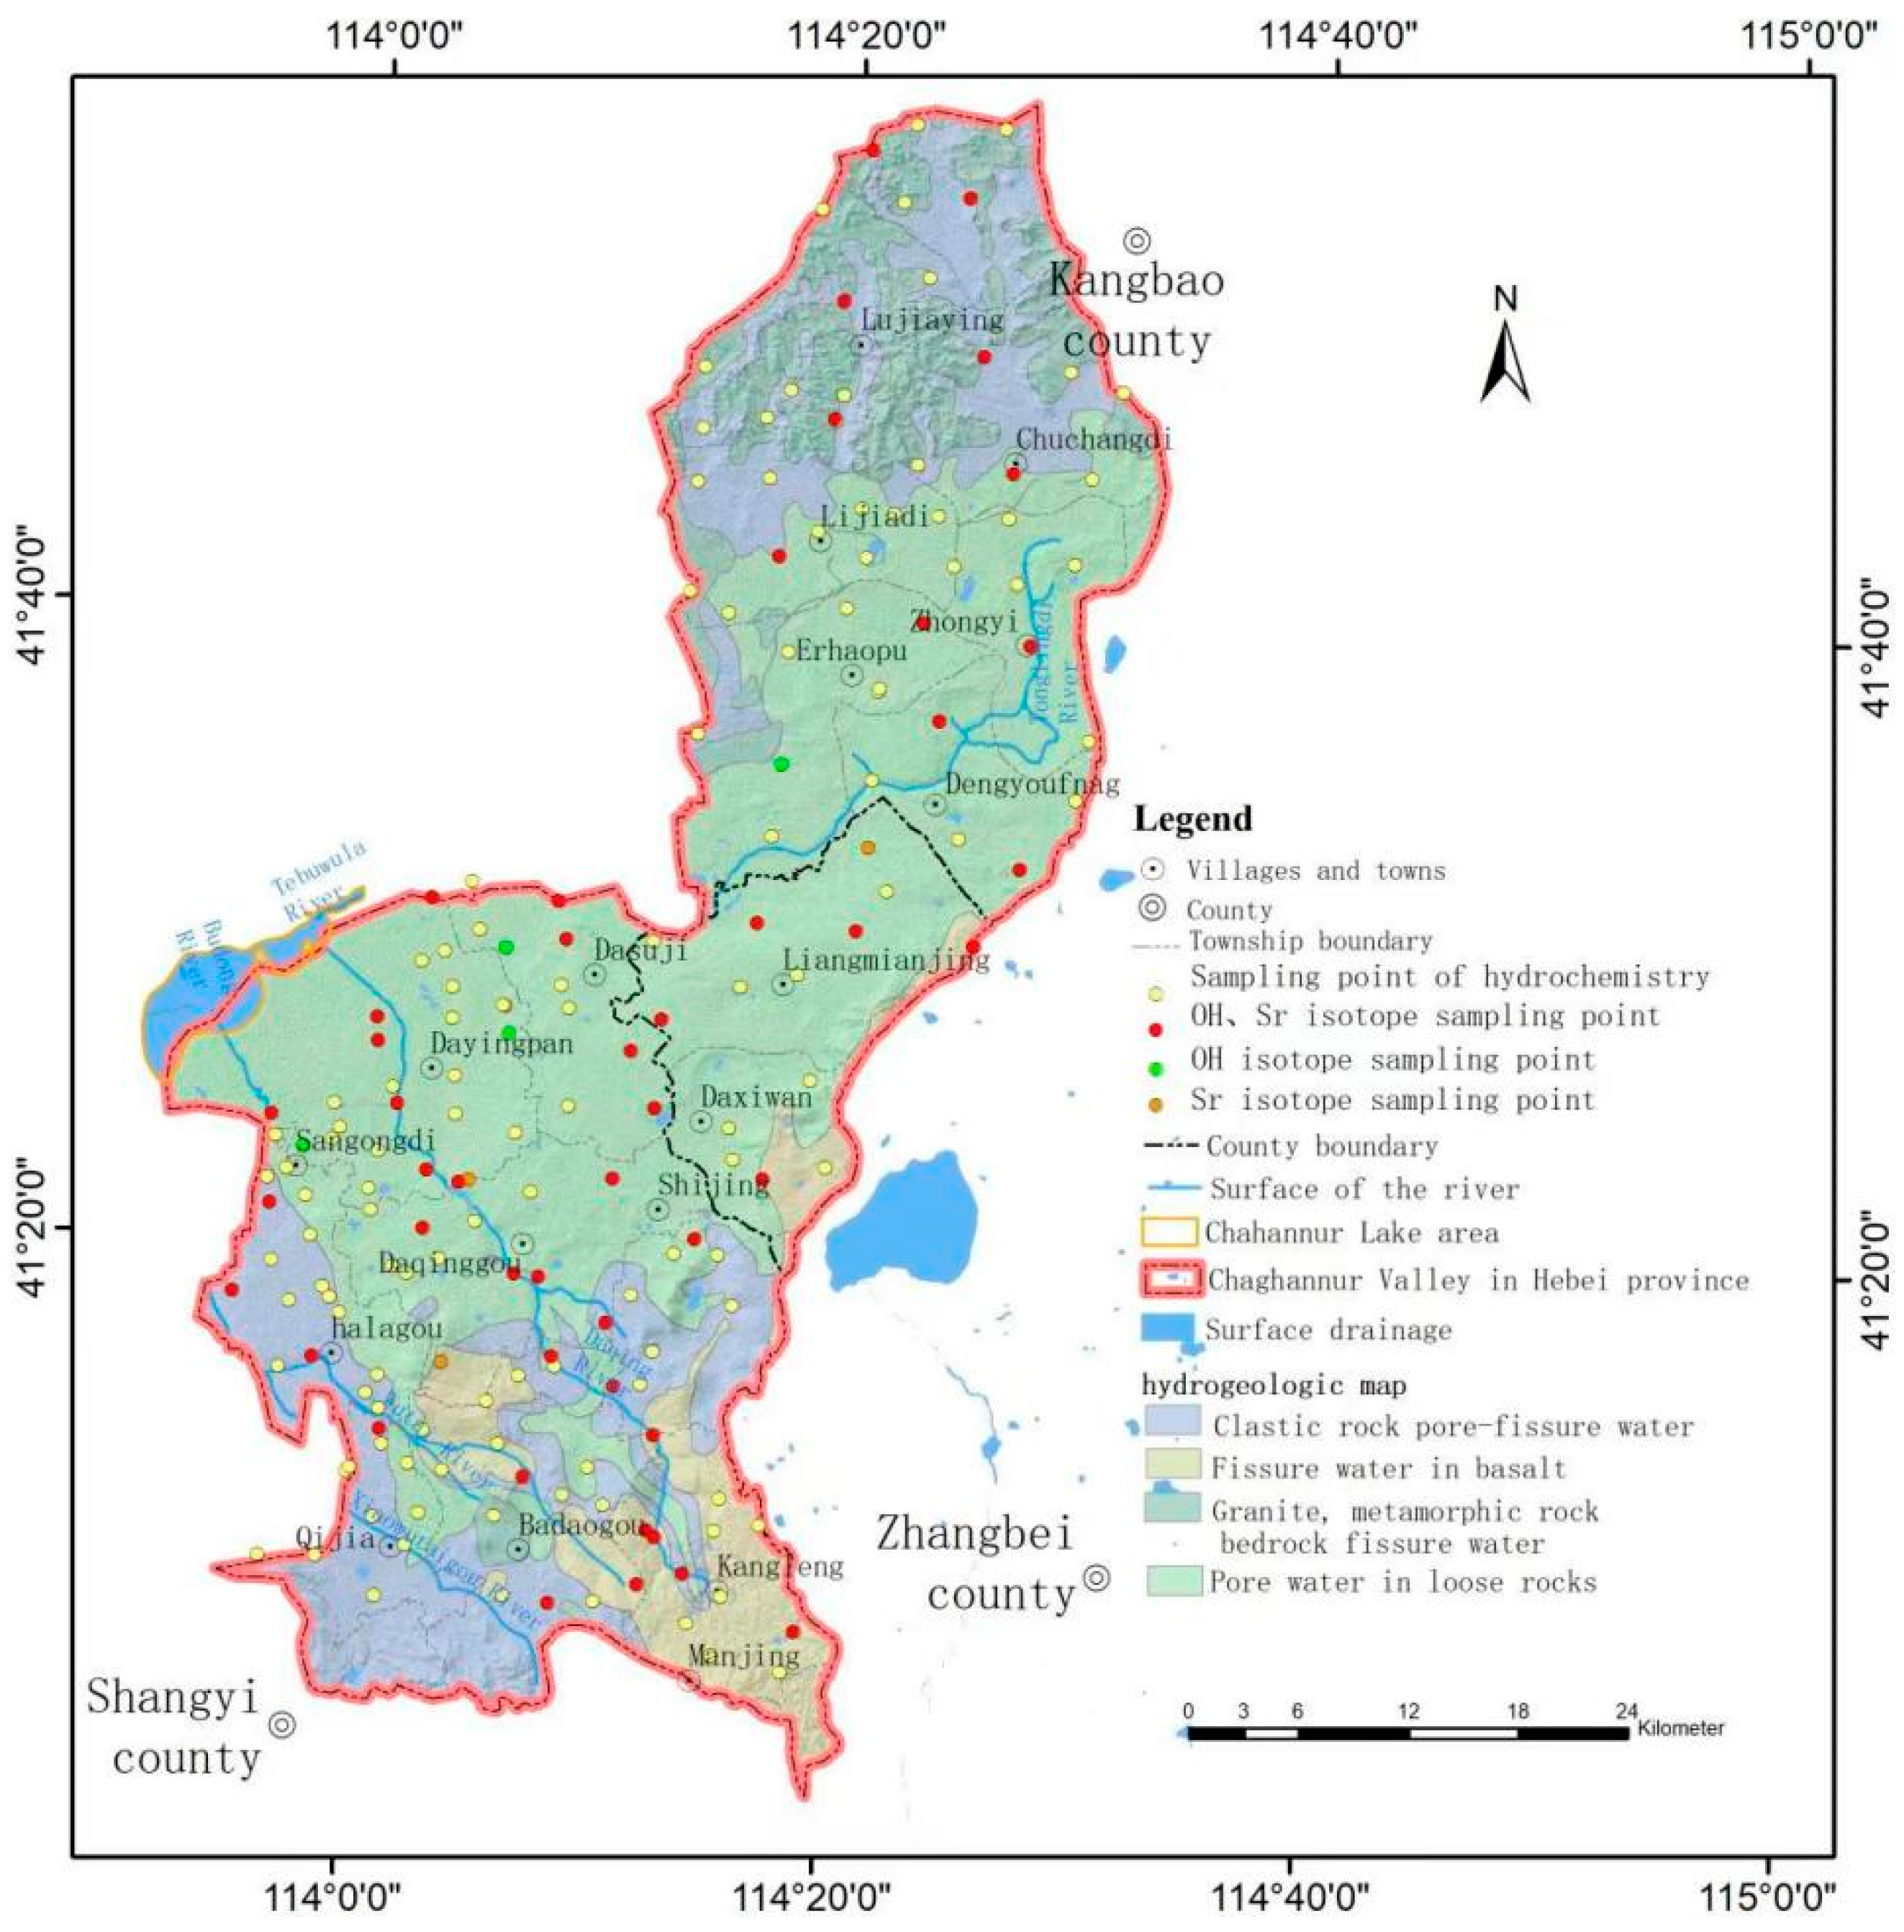
2.2. Data Collection
This investigates the relationship between the recharge, runoff, and discharge mechanism of shallow groundwater, and the transformation between groundwater and surface water in the Chahannur Basin. In this study, 51 sampling points were selected to collect groundwater and surface water samples. Among them, 14C, hydrogen and oxygen isotopes were detected at 49 sampling points; Strontium and Freon isotopes were tested at 51 sampling points, see Figure 2 for details.. The groundwater samples collected in this study are all within the depth of 50 m, representing shallow groundwater in the basin. Pump water for 30 min before sampling. All water samples are collected in pre-cleaned polyethylene bottles and bottled to 2/3. After collecting the water sample, immediately tighten the cap of the water bottle, seal it, stick a label, and store it in a refrigerator at ±4 °C.
The isotope samples were tested in the Groundwater, Mineral Water, and Environmental Monitoring Center of the Ministry of Land and Resources, Institute of Hydrogeology and Environmental Geology, Chinese Academy of Geological Sciences. The stable hydrogen and oxygen isotope values were determined by liquid water isotope analyzer (DLT-100, LGR Company, San Jose, CA, USA). The accuracy of δD and δ18O values were 0.5‰ and 0.15‰, respectively. The tritium isotope test was conducted according to DZ/T0064—93. The samples were distilled at a low temperature (110 °C) to obtain water samples. After desalting by distillation and electrolytic enrichment, the samples were tested by ultra-low background liquid scintillation spectrometer Quantulus 1220 (PerkinElmer, Inc., Waltham, MA, USA). The counting time of a single sample is 500 min and expressed in the tritium unit (TU). The detection limit is 1.0 TU and the precision is σ ≤ 0.6 TU. The CFCs content was tested using “Purge and Capture gas chromatography”. The concentrations of CFC-11, CFC-12, and CFC-113 in water samples were determined by Electron Capture Detector (GC-ECD, Electron Capture Detector) (GC-14B, SHIMADZU), the lowest detection limit was 0.01 pmol·kg−1, the determination accuracy was 1%. The ratio of 87Sr/86Sr was tested by Nu plasma II MC-ICP-MS, and the NIST SRM 987 Sr isotope reference material was used as the standard sample.
2.3. Groundwater Age Determination
Groundwater age refers to the time that water has been in the subsurface [15]. That is, the time experienced by atmospheric precipitation after it seeps into the ground and becomes isolated from the atmosphere [16]. Isotope dating methods typically use the half-life of radioactive isotopes, which is usually fixed, so the method is relatively reliable. This paper mainly uses the isotope method to calculate groundwater age [17,18,19,20,21,22], which can be divided into two types: the radionuclide method, which mainly uses 3H [23], and the atmospheric historical content matching method, which mainly uses CFCs gas [24,25].
2.3.1. 3H Method to Calculate Groundwater Age
3H is a radioactive isotope of hydrogen with a half-life of 12.43a and is only suitable for groundwater with a retention time of several years to 60a. 3H has two origins: one is natural, and artificial nuclear explosions produce the other. Natural 3H mainly comes from nuclear reactions in the atmosphere. The atmospheric nuclear tests in the northern hemisphere in the 1950s and 1960s increased the tritium content in the atmosphere to several hundred TU. After the nuclear explosion tests, the tritium content in the atmosphere decreased exponentially, making it an ideal tracer to indicate the residence time of groundwater since the 1960s. In addition, seasonal variation has little influence on 3H dating results, so 3H dating is more commonly used in young waters [26,27,28,29].
A physical mathematical model based on 3H isotope is required for specific calculation of groundwater age:
Type: t—Output time series;
τ—Flow time in groundwater (age);
t − τ—Input time series;
Cout(t)—Tritium content in groundwater as a function of time;
Cin(t − τ)—Tritium content of the supply source as a function of time;
h(τ)—Distribution function of groundwater age.
Different groundwater flow characteristics have different distribution functions. If t and τ are expressed in years, dτ = 1, the equation can be written as follows:
The thickness of the Quaternary deposits in the Chahannur Basin is 50–200 m. Generally, it is a single-layer structure, forming a unified continuous aquifer without a continuous cohesive soil waterproof layer; the aquifer is mainly coarse sand and gravelly sand. The vertical recharge condition of groundwater is well-conditioned and the age distribution function of groundwater is the piston model (PM). The piston model considers only the decay of radioactive isotopes. It is assumed that the transfer time of isotopes on different streamlines in the same section is equal. There is no hydrodynamic dispersion or molecular diffusion. The groundwater age distribution function is:
The age distribution of groundwater is described by Dirac delta function in mathematics. Tt is the tritium age of groundwater (a). By substituting Formula (2) into Formula (1), it can be concluded that the relationship between tritium output and input concentration in groundwater is:
2.3.2. CFCs Dating Method
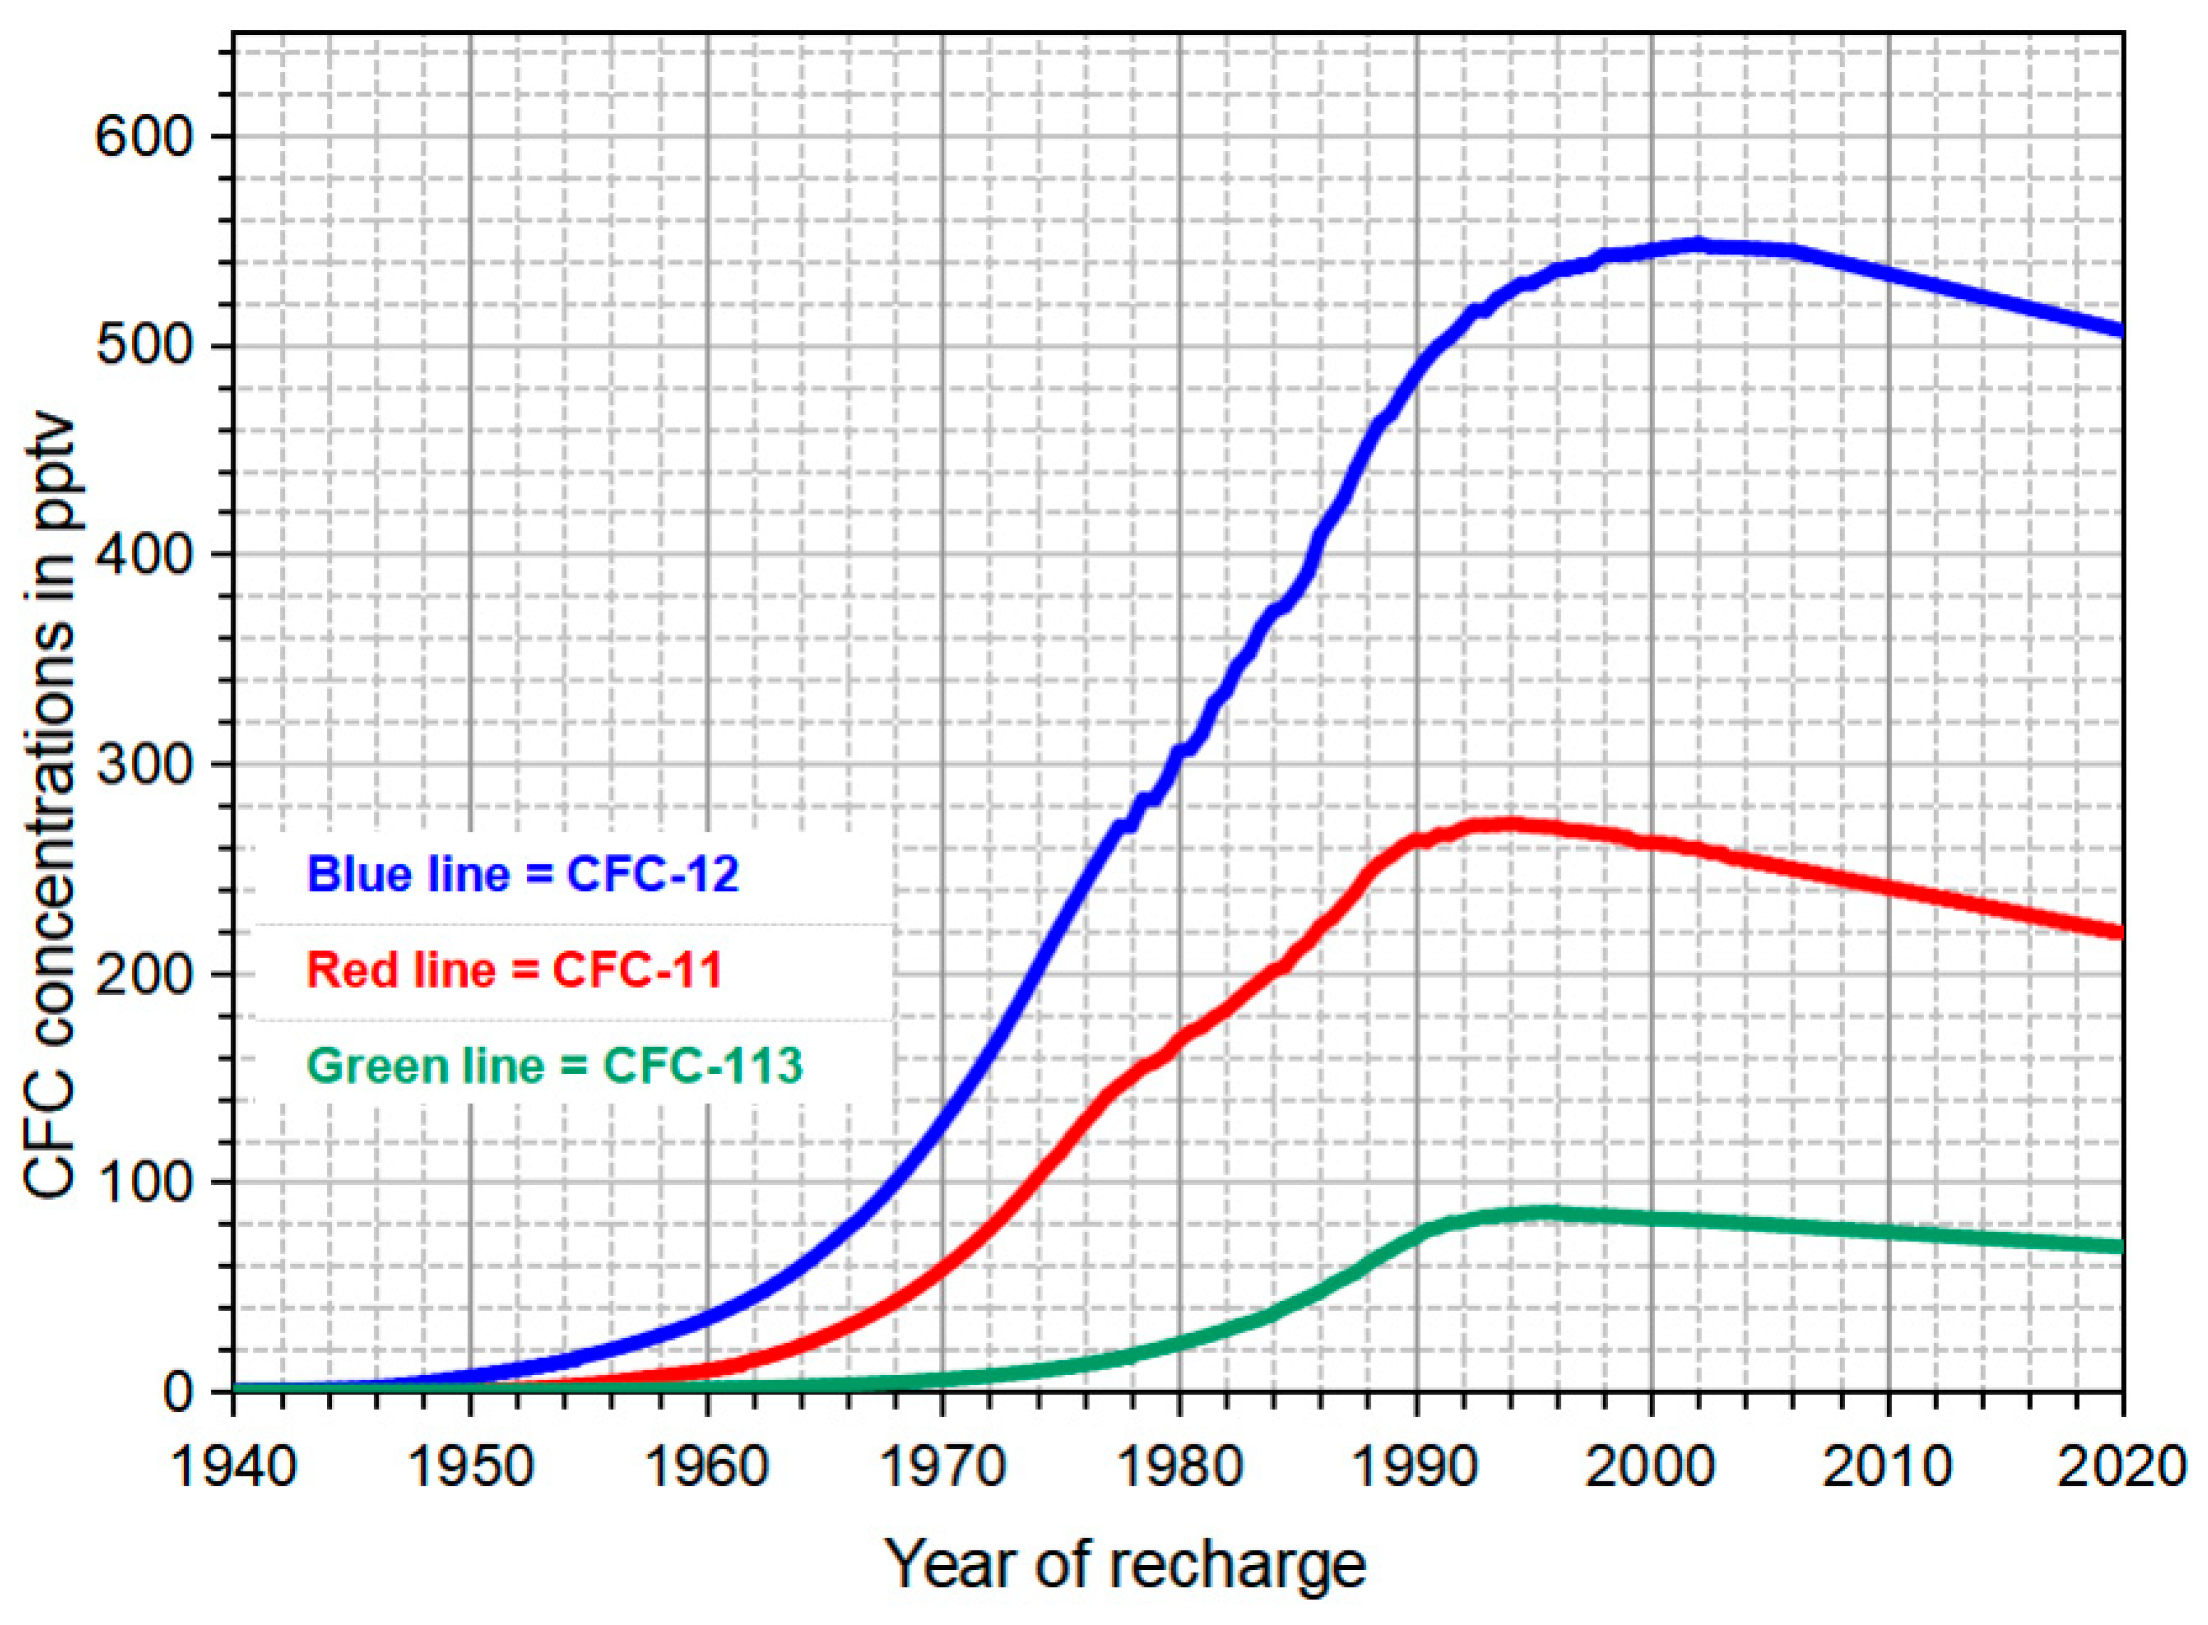
CFC dating is applicable to young water with an age less than 60a, but the application of CFCs requires certain conditions, such as temperature, the thickness of the aeration zone, external pollution, and other apparent effects on CFCs. The application should be analyzed based on the actual conditions [30,31,32,33,34].
CFC gases can be divided into three categories: CFC-11, CFC-12, and CFC-113 (Figure 3). The concentration of CFCs in the atmosphere increased continuously from the 1940s to the 1990s, establishing suitable atmospheric conditions for CFCs as age tracers. CFC dating is based on Henry’s law; by comparing the partial pressure of CFCs in groundwater with the change curve of atmospheric CFC concentration, the recharge time of groundwater can be determined, and thus the age of groundwater is inferred (Figure 3). If the groundwater ages calculated based on CFC-11, CFC-12, and CFC-113 are close, the estimated groundwater ages are more reliable. If CFC-113 is not detected in the groundwater sample, the groundwater is old and was replenished before the 1970s. If the three types of CFCs in groundwater are not detected, freon was not widely available in the atmosphere when the groundwater was recharged, and the corresponding time was before the 1940s.
3. Results and Discussion
3.1. Age Characteristics of Groundwater in the Chahannur Basin
3.1.1. Groundwater Age Estimated by Tritium Isotope (3H)
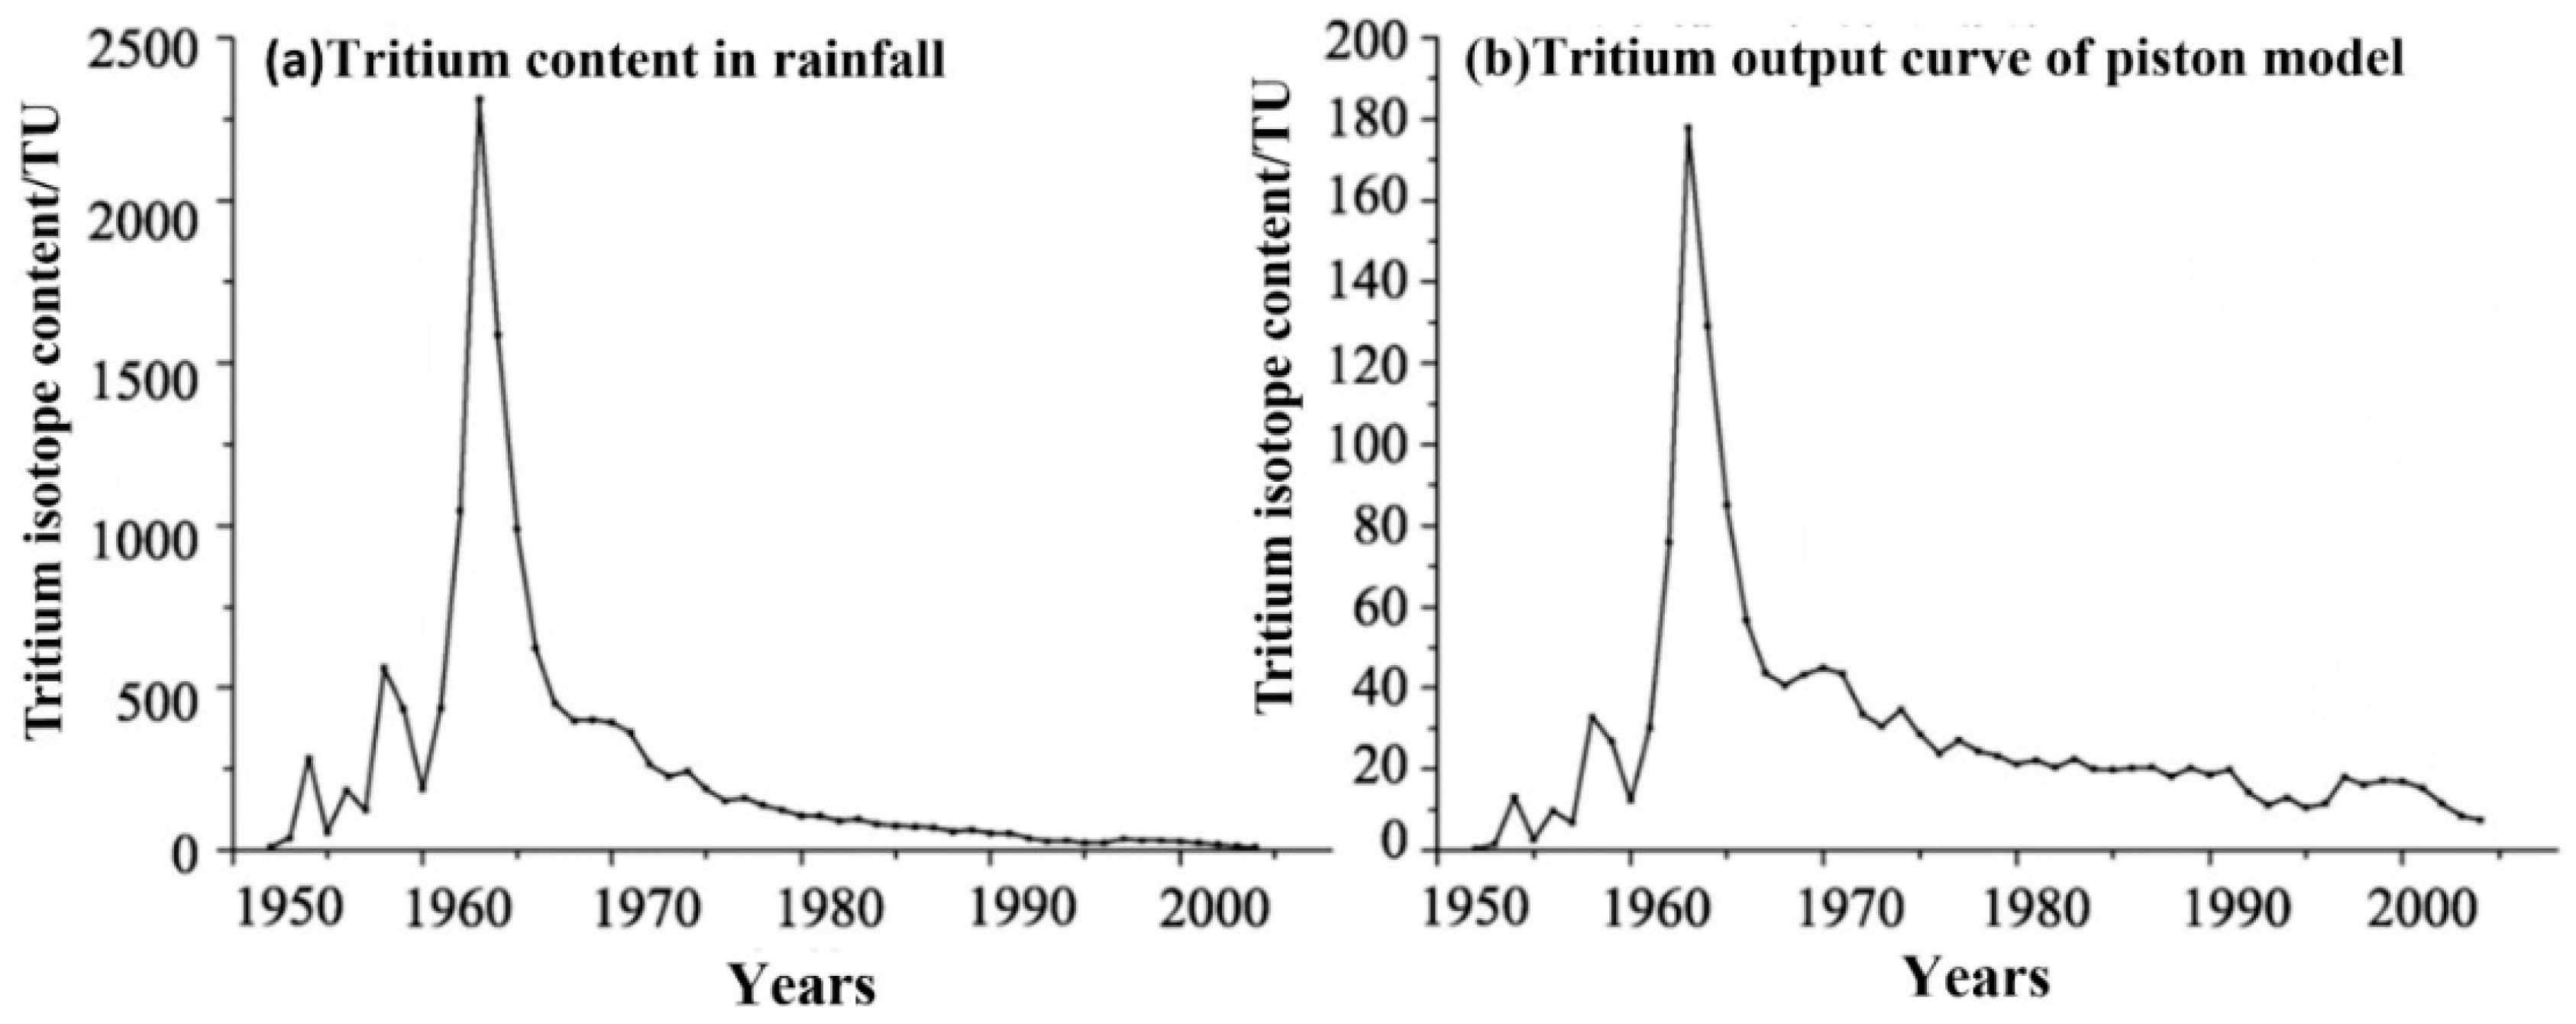
Although the distribution and variation characteristics of tritium isotope in atmospheric precipitation have been studied in China, the series observation data of tritium content in precipitation in most areas are not enough to meet the needs of groundwater age calculation. Recovering the concentration of tritium in precipitation is necessary before calculating groundwater age [35,36]. The recovery results of tritium content in precipitation are shown in Figure 4a. The atmospheric tritium content from 1952 to 1959 was estimated by precipitation tritium in Changchun [37]. From 1960 to 1986, the Doney model was used (F1 = 150, F2 = 50). From 1987 to 2007, weighted average precipitation of measured data in Harbin, Qiqihar, and Changchun was used, and single-phase correlation extrapolation between the Harbin station and Ottawa station was used for the missing years [33]. The Ottawa station data were from the international atomic energy agency (IAEA, https://www.iaea.org/. PHP, accessed on 5 January 2022). In the piston model, the tritium entering water only changes according to the attenuation law, and is shown in Figure 4b.
According to the distribution of tritium in rainwater in China, the measured tritium content in groundwater in the last ten years can be used as the basis for qualitative age judgment according to Table 1.
The tritium isotope content in the shallow groundwater in the study area ranges from 1.3 to 11.9 TU, with little difference in spatial distribution. The calculation shows that the groundwater ages of 24 samples are concentrated in the range of 4~23a, 13 samples are between 28~51a, and 13 samples are over 51a, detailed results are shown in Table 2.
The areas with groundwater age greater than 51a are mainly distributed in the lower reaches of the Wutai River, northern bedrock fissure water and Tertiary pore fissure water areas, which are generally distributed dispersedly and close to the boundary of the study area, and the groundwater renewal speed is the slowest; the sample areas with groundwater age of 28~51 a are distributed in the middle reaches of Wutai River, Silamaziying Chenda Wugou village, Liujiapu village, Laozhanggei village, Hou’ermafang village, Siworksite Chenjia village, Liuyoufang, and other areas, with obvious groundwater runoff characteristics. The points with groundwater ages between 4–23a are widely distributed, mainly concentrated in the central area of the study area, where the groundwater renewal speed is relatively fast.
3.1.2. Groundwater Ages Estimated by CFCs
High CFC concentrations were mainly distributed in Erbu-Zhongyi Xiang-Dengyoufang town and Houfulongwan-Sanjianqi town, whereas the low concentrations were located in southern and eastern Daqinggou town. According to the CFCs output curve for groundwater age, CFC-11 groundwater age is 32~55a, CFC-12 groundwater age is 27~61a, and CFC-113 groundwater age is 33~49a. The groundwater ages of most CFC-11 and CFC-12 are close to and greater than those of CFC-113, and the estimated age range of CFC-113 is narrow, whereas the estimated age range of CFC-12 is the widest (Table 3).
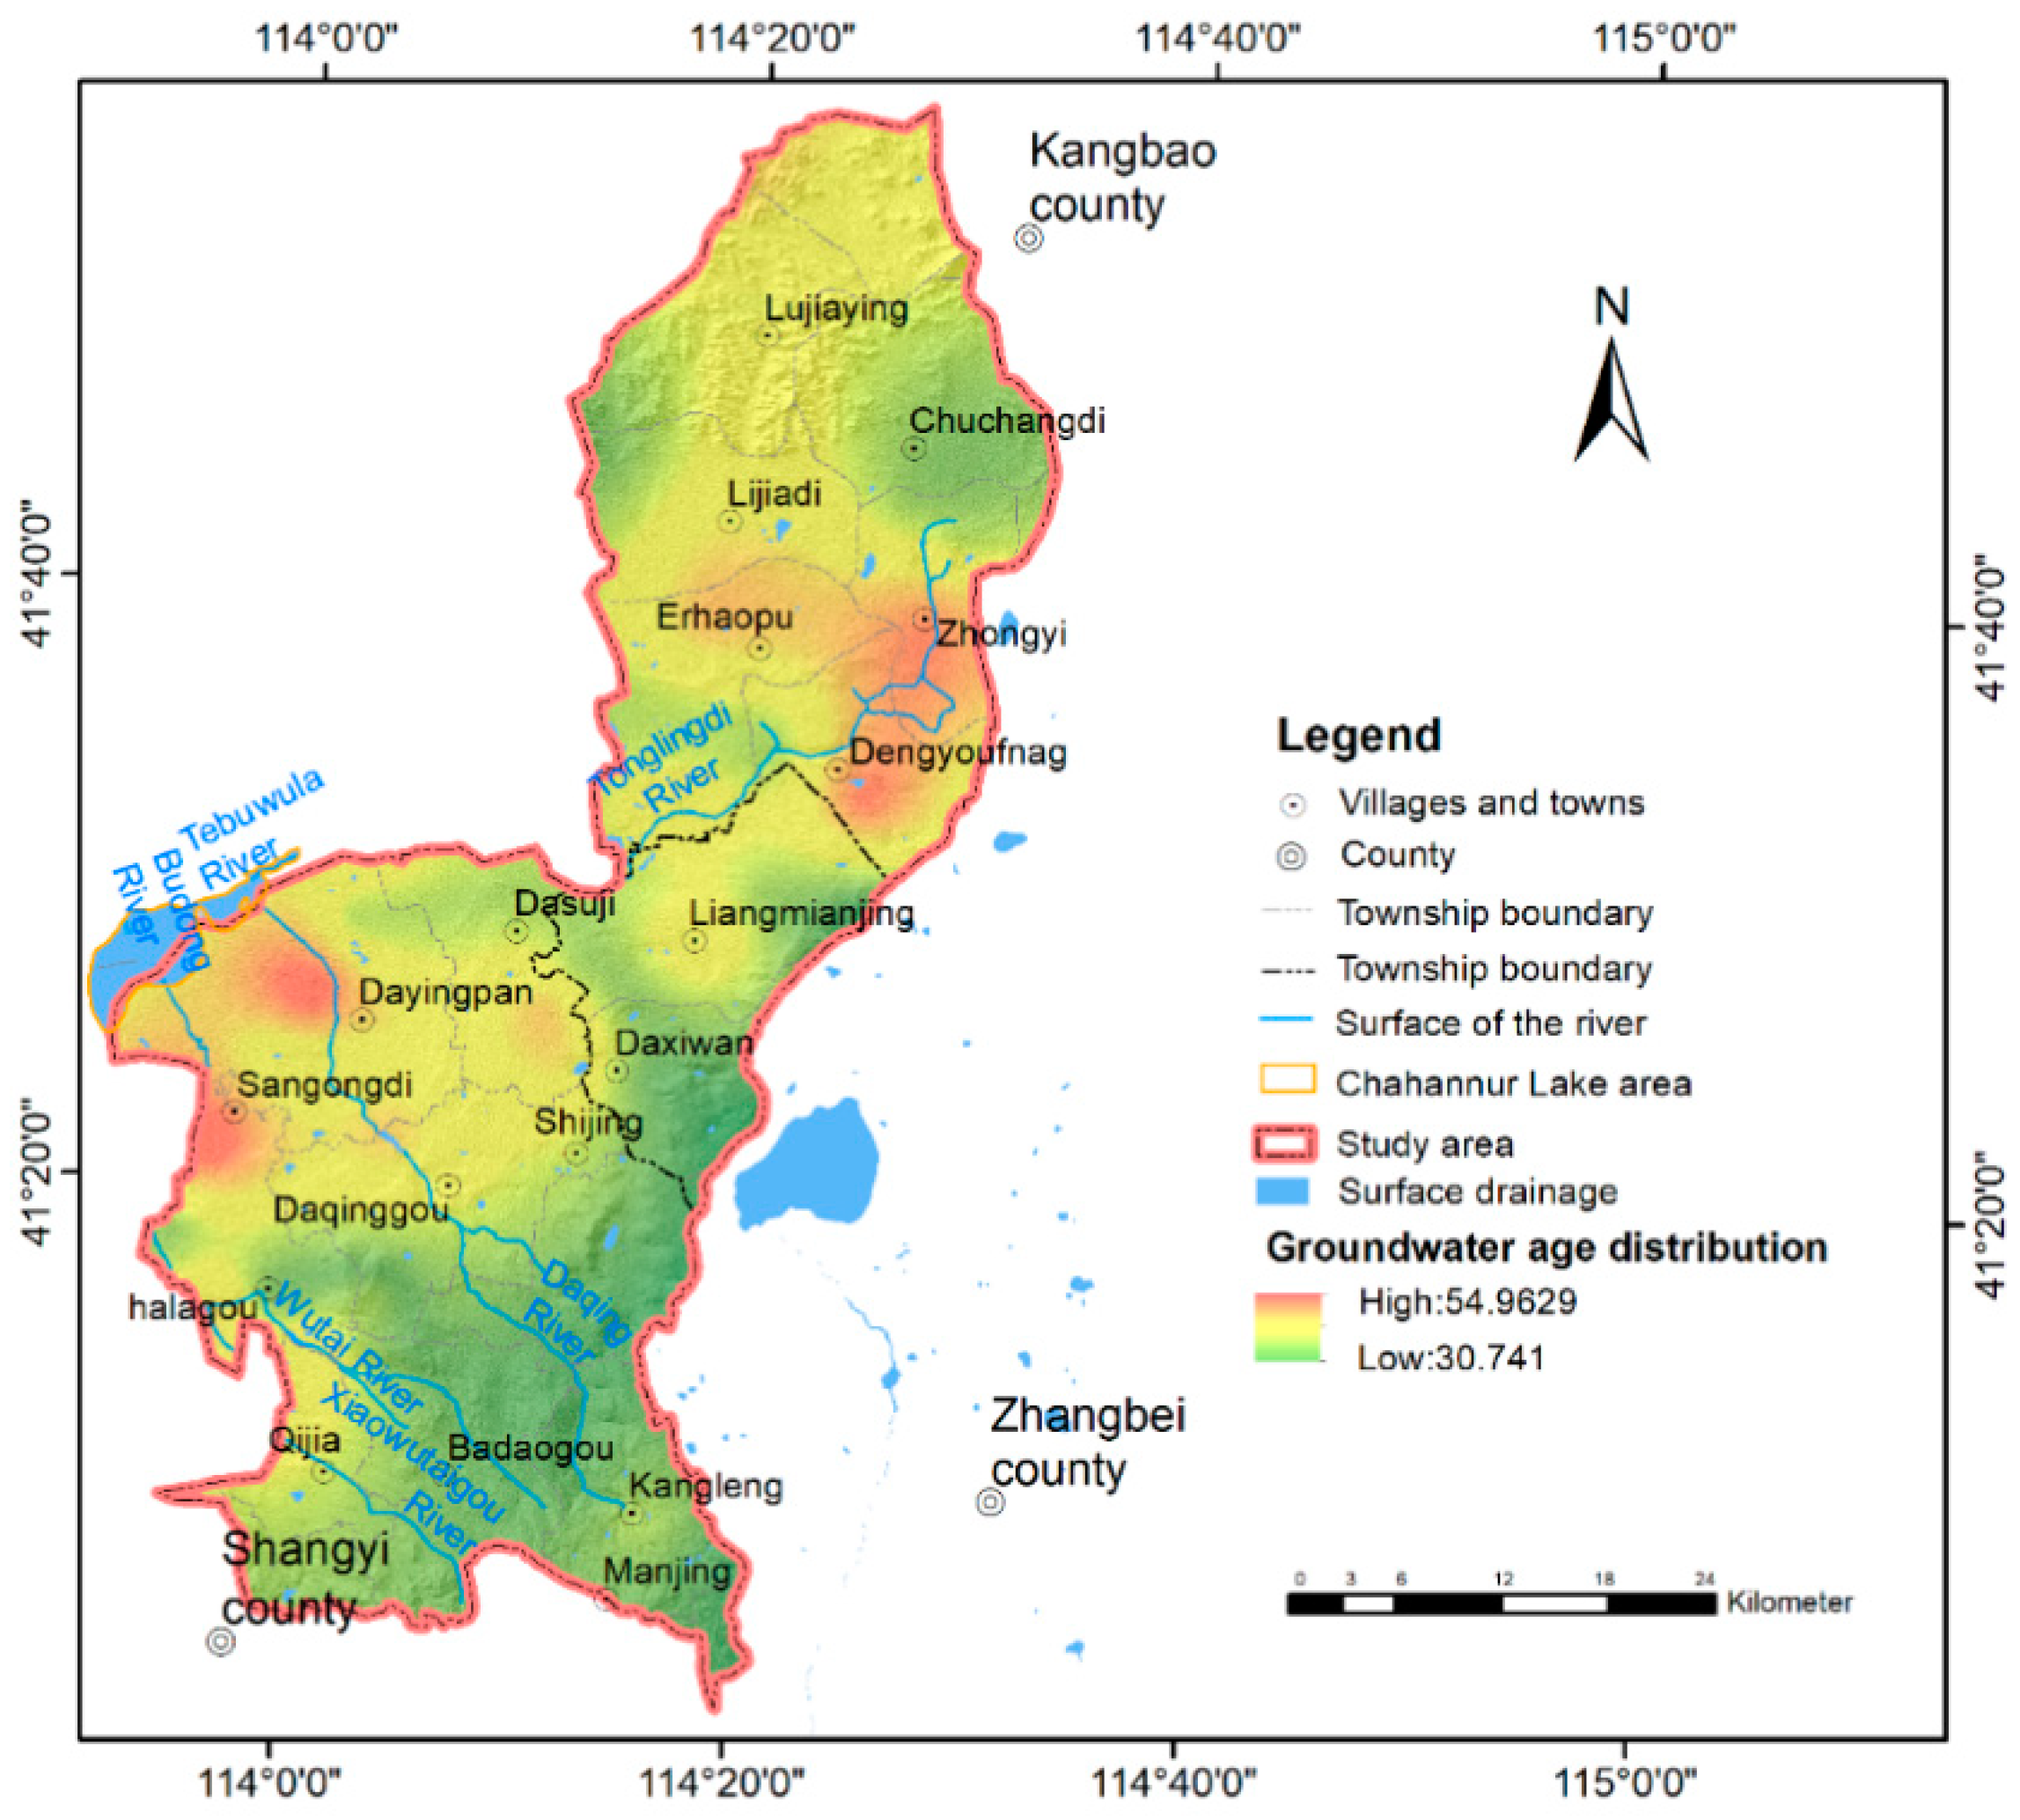
In the Territorial River Basin-Yannao Groundwater System, groundwater age ranges from ~31~52a. The groundwater age distribution presents a dumbbell shape, with both sides high and intermediate low. The middle reaches of the first line of the Tonglingdi River are high-age groundwater areas, mostly older than 50 years, with a short retention time of about 30–50 years.
In the Daqinggou, Wutai River Basin, and Chahannur groundwater systems, the groundwater age distribution range is ~30–60a. The groundwater flow direction in this area is generally discharged to Chahannur by runoff from the south and southeast of the working area. The groundwater age increases along with the groundwater flow direction (Figure 5). The water in basalt fissures is directly replenished by meteoric water, which is quick, and the groundwater retention time is short, generally less than 40a. After groundwater runoff to the plain area, the aquifer medium is loose rock and clastic rock with uneven thickness; the groundwater retention time becomes longer in this area, increasing the overall age. The maximum value is 55a.
Through comparative analysis, the groundwater age calculated by the tritium dating method is not much different from that calculated by the CFCs method. The analysis shows that the accuracy of the two dating methods is relatively high in this area, and the dating method can reflect the runoff of groundwater.
3.2. Groundwater Recharge Flow Pattern in the Basin
3.2.1. Characteristics of Water Cycle Indicated by Hydrogen and Oxygen Isotopes
Characteristics of Hydrogen and Oxygen Isotopes in Different Water Bodies
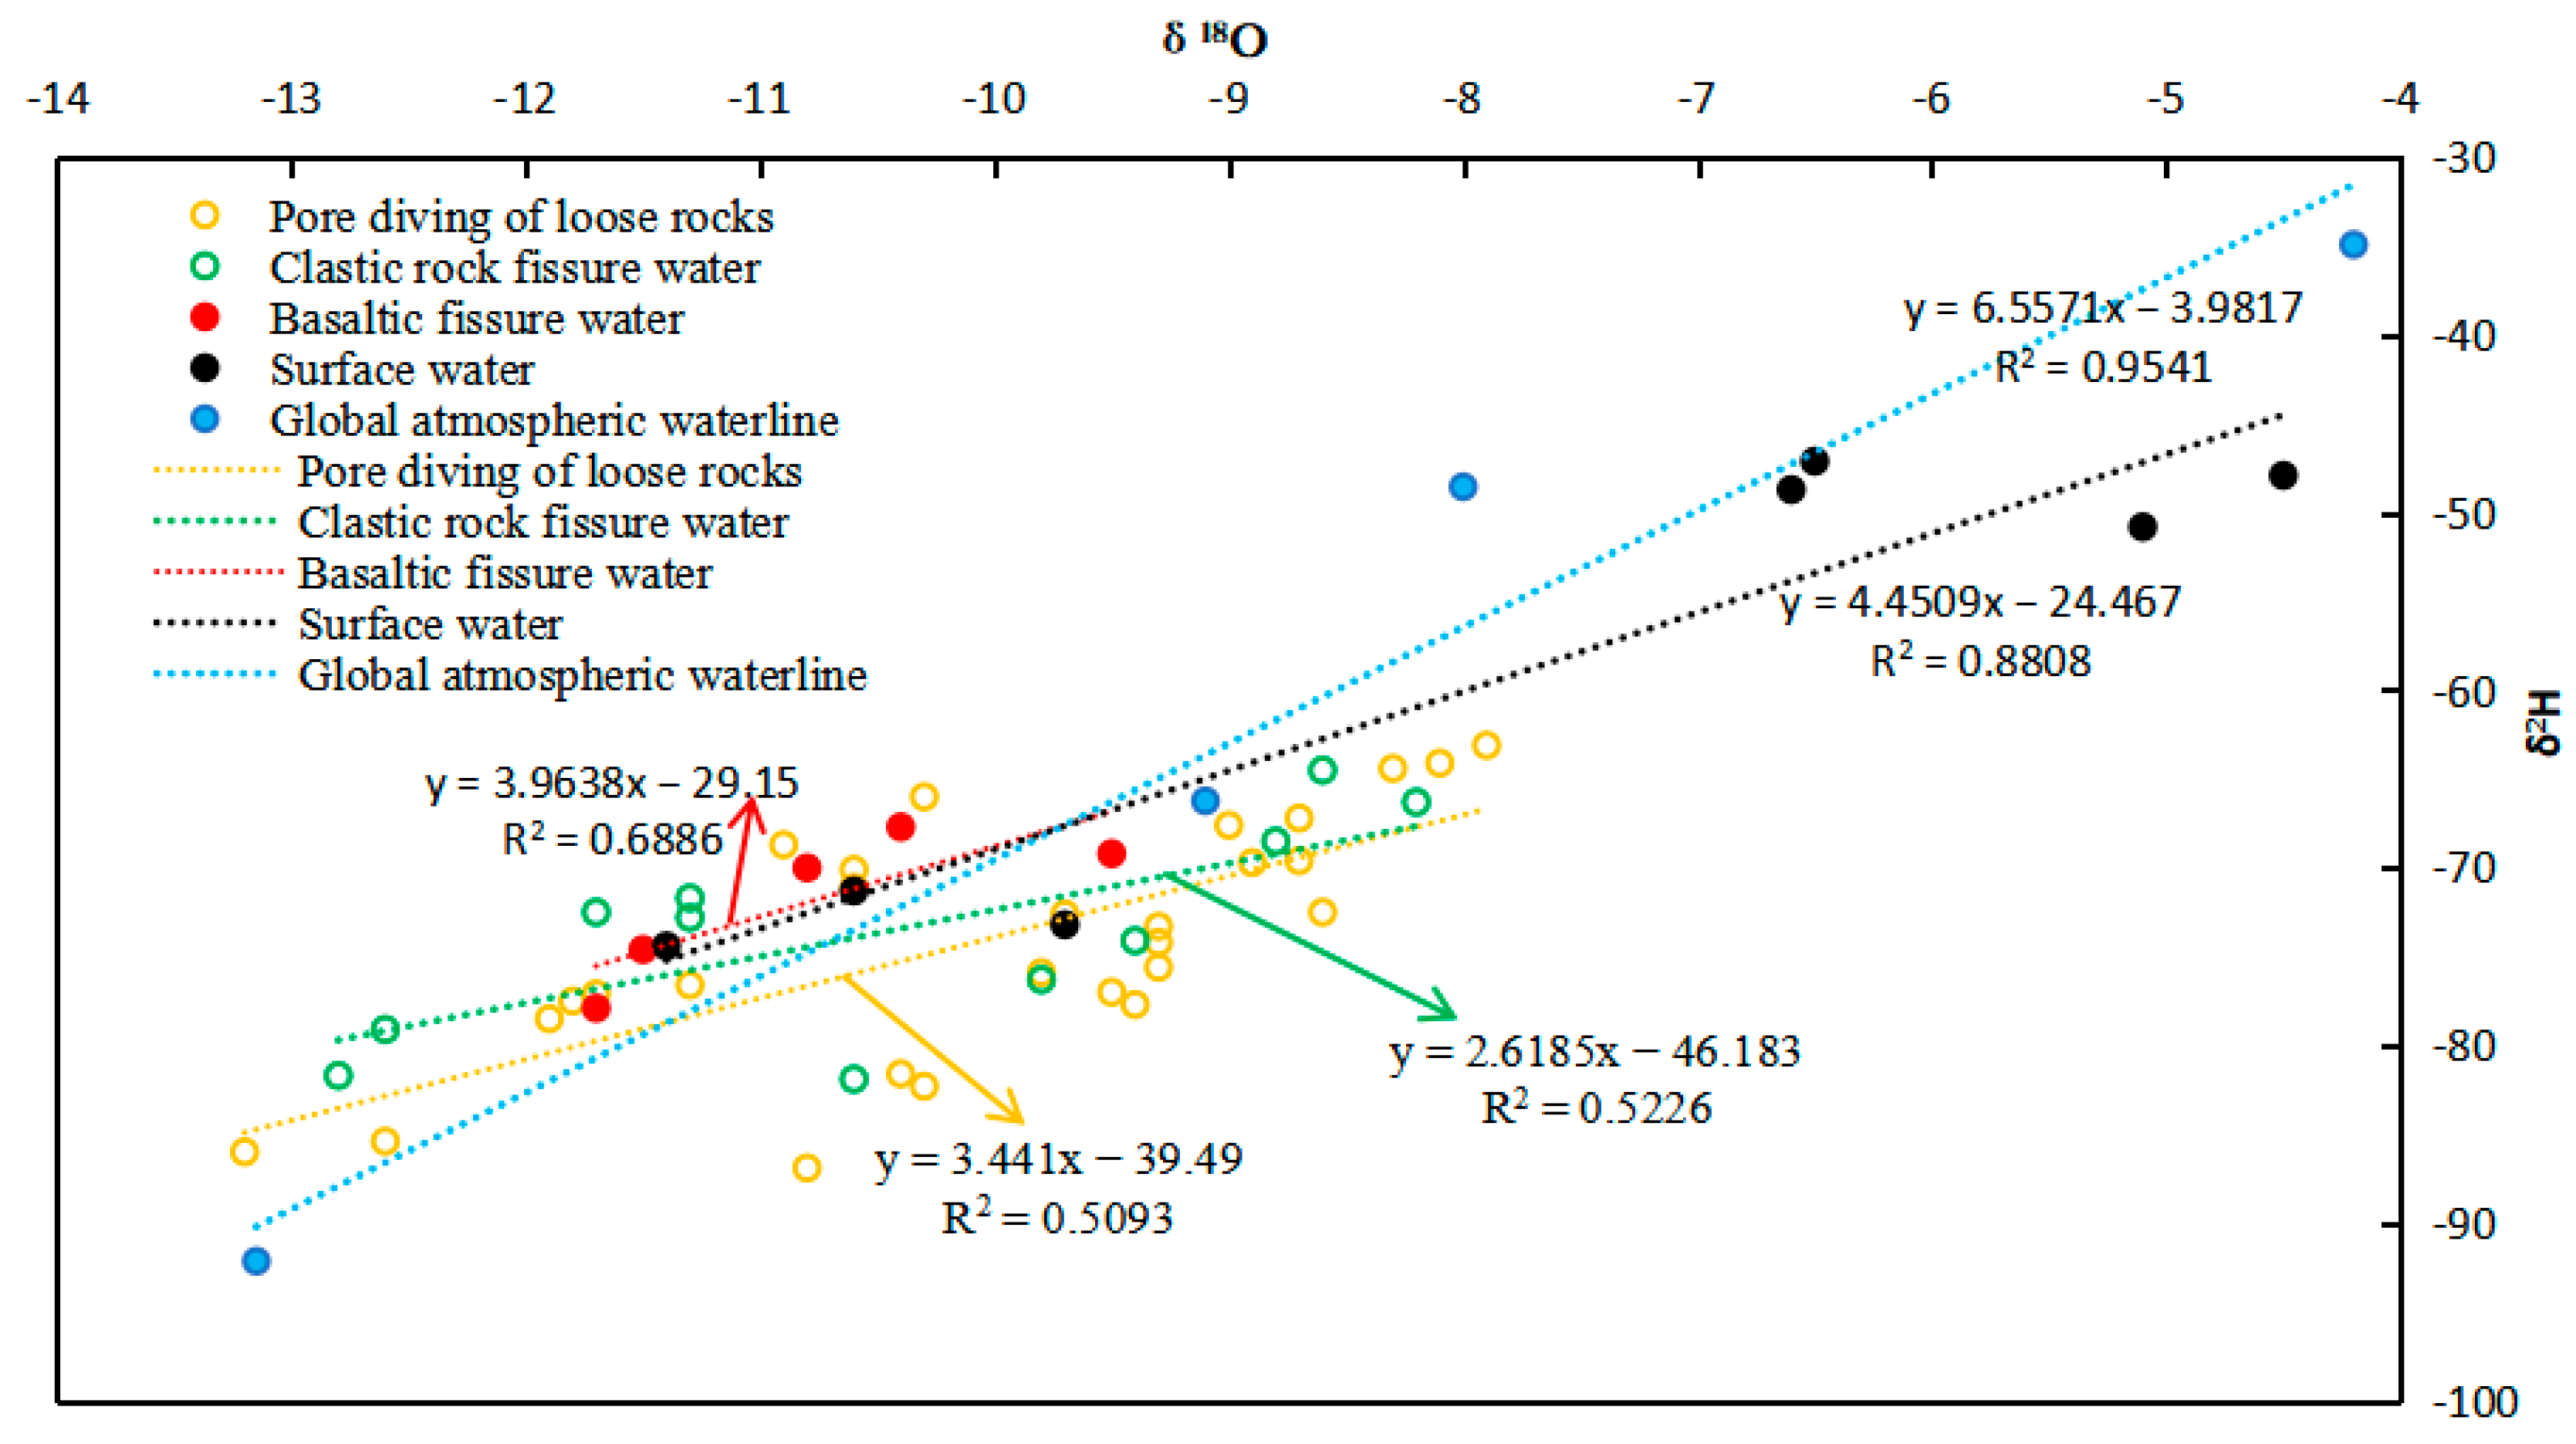
Analysis results show that from the phreatic water, the δ18O ranges from −13.2~−7.9‰, with a mean of −9.9‰. δ2H ranges from −86.9~−63.1‰, with a mean of −72.0‰, see Table 4 for details. A total of 19 precipitation samples taken during the flood season (June–September 2021) were analyzed. The regression equation of hydrogen and oxygen isotopes of precipitation is δ2H = 7.1526δ18O + 0.9354 (n = 16, R2 = 0.9615), with a slope of 7.15. Compared with the global precipitation line δ2H = 8δ18O + 10, the slope is less than 8. It is located at the lower right of the global precipitation line (Figure 6), indicating strong evaporation in this region.
The test results show that the variation range of δD and δ18O value of surface water is small. The variation range of various types of groundwater is large. It reflects that groundwater is affected by many more complex hydrogeological conditions, such as water-bearing medium, burial conditions, and water circulation process, and their differences provide a basis for further inversion of groundwater recharge runoff discharge relationship. See the Table 5 for details.
The δ2H ranges from −74.4‰ to −71.3‰, and the δ18O ranges from −11.4‰ to −9.7‰. The δ2H of river water ranges from −50.8‰ to −47.1‰, and δ18O ranges from −6.6‰ to −4.5‰. Groundwater can be divided into three types. The δ2H of phreatic water ranges from −86.9‰ to −63.1‰, and δ18O ranges from −13.2‰ to −7.9‰. Fracture pore water of clastic rocks has δ2H ranging from −81.9~−64.5‰, and δ18O value ranging from −12.6~−8.2‰. Basalt fissure pore water δ2H ranges from −77.9~−67.7‰, and δ18O ranges from −11.7~−9.2‰. Results show that surface water (spring water, river water, and reservoir water) of the delta and δ2H and δ18O value changes of a smaller range of various types of groundwater change has a broader range, potentially reflecting variations in the groundwater aquifer medium, burial conditions and hydrological cycle, and many other more complex hydrogeological conditions. The influence of these factors needs further investigation into the groundwater runoff relationship.
Surface water and groundwater samples are mostly located at the lower right of the local atmospheric rainfall line (the local atmospheric rainfall line is based on the local average rainfall for many years) (Figure 6). The slope and intercept of the evaporation lines of the two are far less than the local meteoric water line, indicating that both surface water and groundwater in the basin come from the local meteoric water. The slope of the evaporation line of surface water (4.45) and intercept (−39.49) is greater than the slope of the evaporation line of three types of groundwater (2.4, 2.5, 3.4), indicating that river (reservoir) water is strongly affected by evaporative fractionation, mainly due to evaporation accompanied by precipitation process. Surface water is directly affected by evaporation; therefore, groundwater is also affected by evaporative fractionation in different degrees while receiving atmospheric precipitation or surface water recharge.
Recharge, Range, and Discharge Relationship of Groundwater Indicated by Hydrogen and Oxygen Isotopes
The calculation results of hydrogen and oxygen isotopes and deuterium surplus values of different groundwater types in the basin show that the δ2H of the loose rock fracture phreatic water ranges from −86.9~−63.1‰, with an average value of −74.0‰. The δ18O values range from −13.2~−7.9‰, with an average of −10.0‰. The deuterium surplus ranges from −3.7~19.6‰, with an average of 6.25‰. The δ2H of crushed rock fissure water ranges from −81.9~−64.5‰, with an average value of −73.6‰. The δ18O values range from −12.6~−8.2‰, with an average value of −10.3‰. The deuterium surplus ranged from −0.7~21.7‰, with an average of 8.67‰. The basalt fissure pore water δ2H ranges from −77.9‰ to −67.7‰, with an average value of −71.9‰. The δ18O values range from −77.9~−67.7‰, with an average value of −10.1‰. The deuterium surplus ranged from 1.4~15.7‰, with an average of 8.6‰. The average values of δ2H and δ18O of the above three groundwater types are not significantly different. The deuterium surplus values of clastic and basalt fissure pore water are almost the same, but the deuterium surplus of the loose pore water is 1.5‰ lower, indicating that the intensity of evaporative fractionation of loose pore water is slightly stronger than the first two types of water.
- Salt and Quagmire groundwater systems
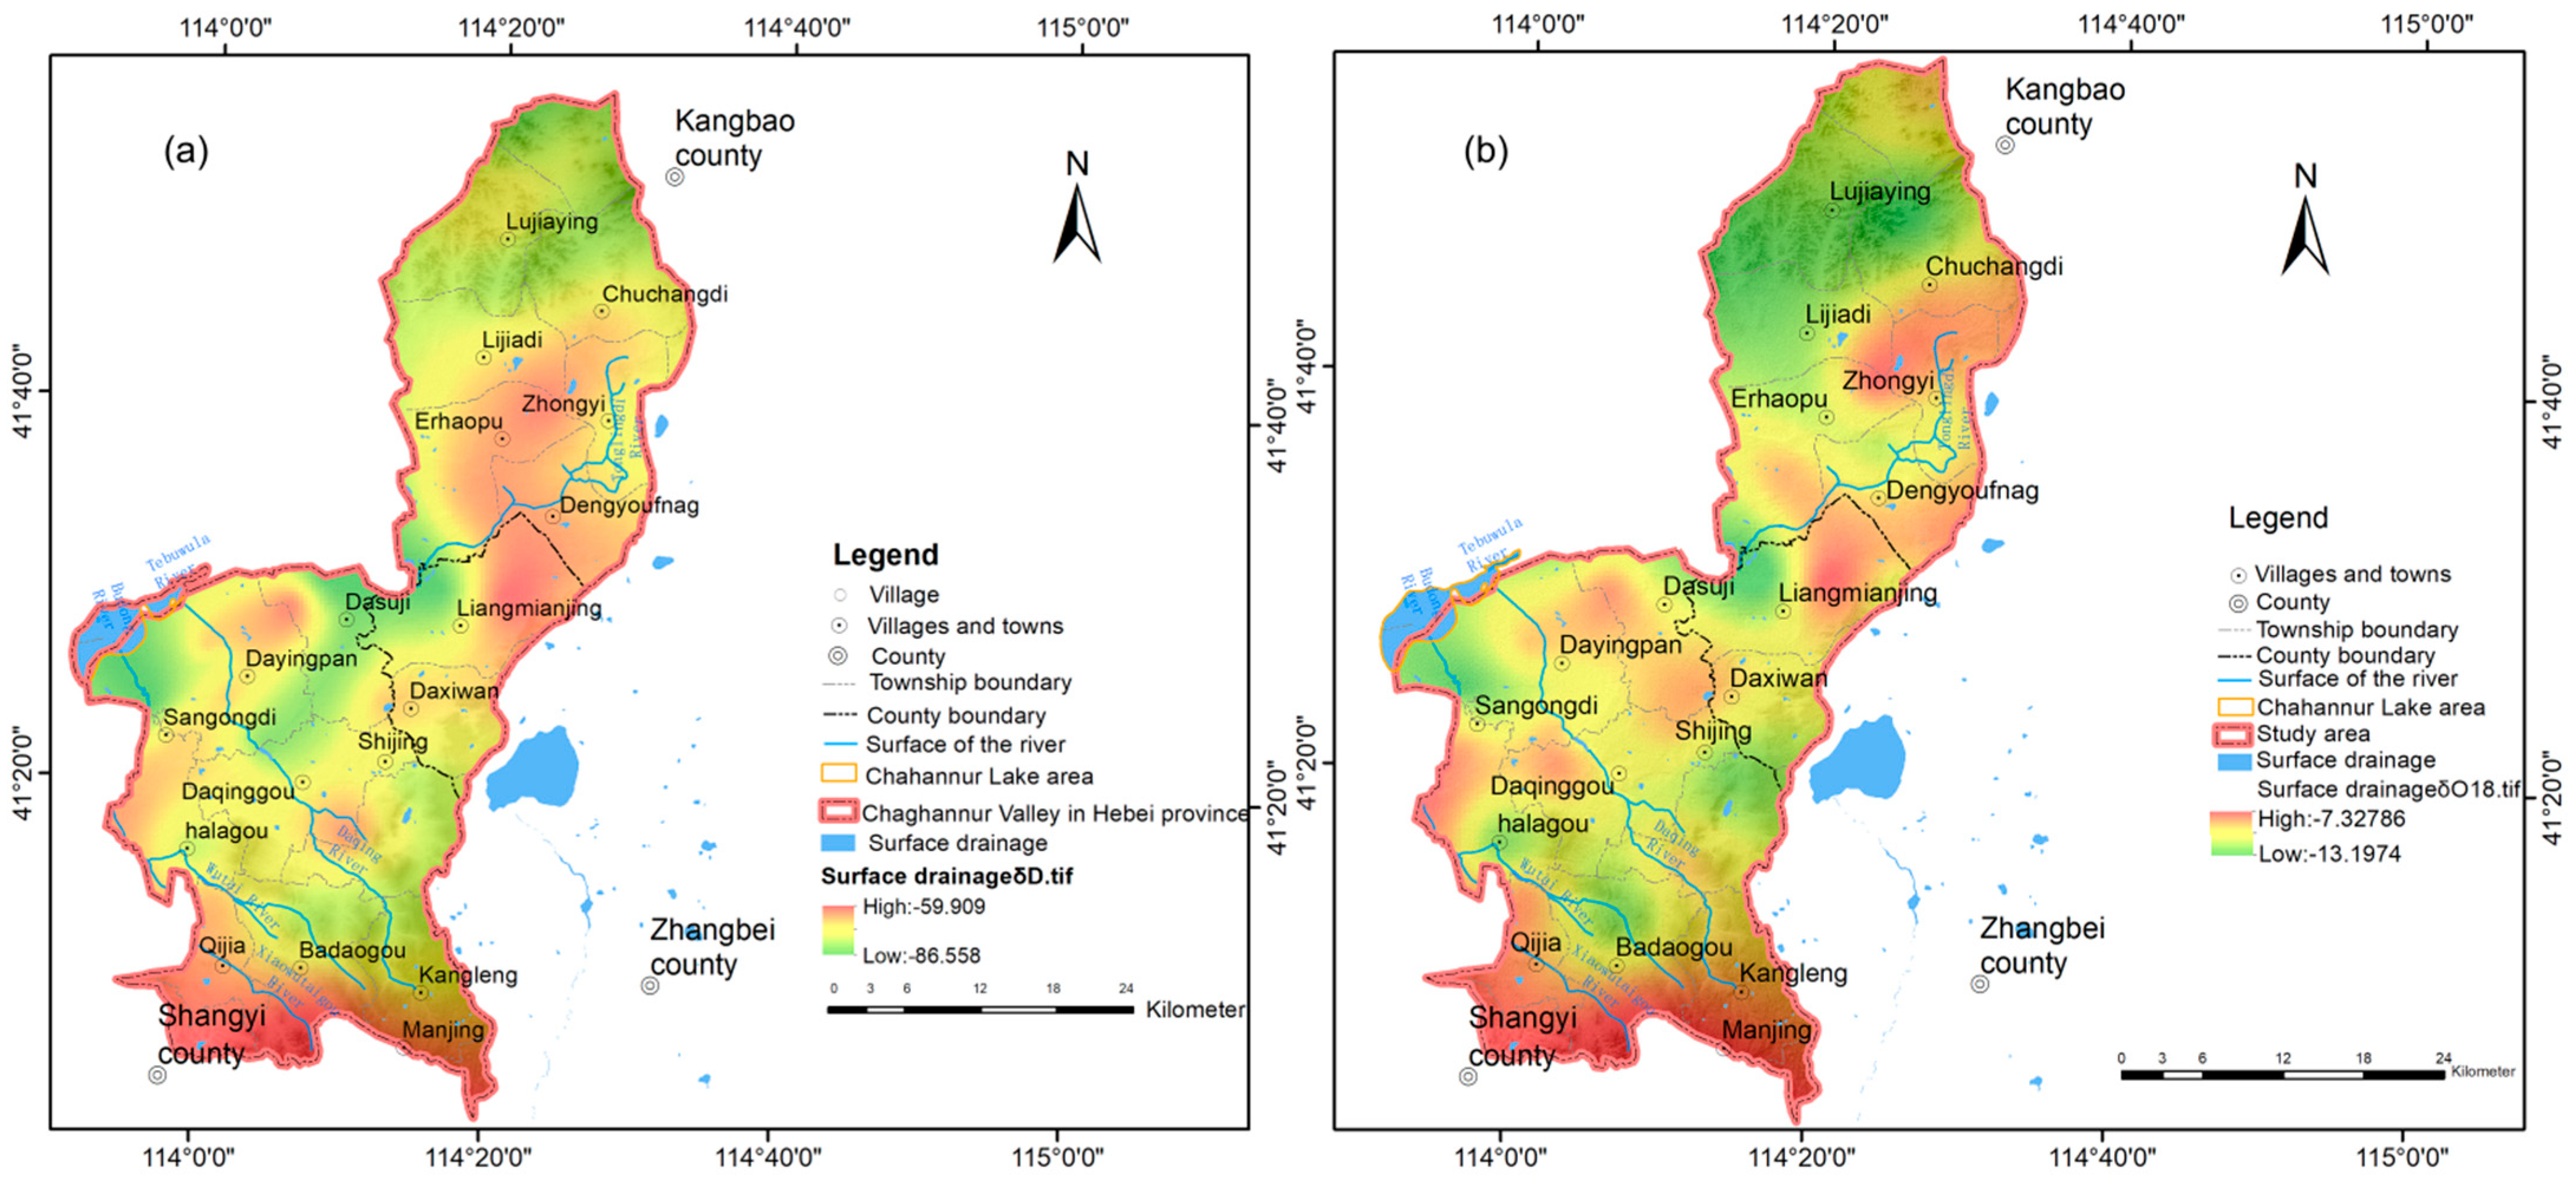
In the area north of Xinjiafangcun, Laozhanggai, and Zhongyi townships, groundwater generally flows north to south, and hydrogen and oxygen isotopes present the same spatial distribution characteristics in this area (Figure 7). The δ2H and δ18O values in the northern part of Xinjiafangcun and Changdi townships are significantly lower than those in the southern part, and the depth of the reference wells is not very far from the depth of the water level, which may be because the seasonal flood leakage of the command area recharges the surrounding phreatic water, resulting in the enrichment of phreatic water isotope.
To the north of Yugoliang and Sujiliang villages, the groundwater flow generally flows to the Yannao runoff. The hydrogen and oxygen isotopes are enriched in the upper and middle reaches of the Magidi River and depleted in Liujiab village. The δ18O values are low at Mazhanggaiyingzi, which is located near the precipitation line, indicating that the region has received direct replenishment of atmospheric precipitation. Hydrogen and oxygen isotopes are enriched in the area of Qiliang, Houbirongwan, Baisha Quancun, and Benkeying in the northwest direction of the region. In the intermediate transition zone between the Daqinggou River Basin and the Miodi River Basin, the groundwater flow occurs in two directions: one flows to the Yannao groundwater system, and the other flows to the Chahannur groundwater system (Figure 7b).
- Chahannur groundwater system
In the groundwater recharge area of the upper reaches of the Daqinggou River, the basalt fissure pore water oxygen isotope is the most enriched. With the direction of groundwater runoff, the groundwater oxygen isotope generally fluctuates between decreasing and increasing (Figure 7b), reflecting the frequent mutual replenishment between river water and groundwater. The groundwater flow direction is the runoff direction along the Daqinggou River. The hydrogen and oxygen isotopes decrease first, then increase, and finally, decrease.
In the main stream direction of the Wutai River, the groundwater types experienced the filling, routing, and drainage process of the basalt fissure pore water—clastic rock fissure pore water—loose rock pore phreatic water. From the spring water of three springs to the village of Jiuhua Ben in Dayingpan town, groundwater supplies the river. In Yaojia village, three construction sites are located in town, and river water recharges the groundwater near these locations. The flow direction of groundwater is from the basalt platform watershed in the south to the Chahannur Lake. Due to the close connection with the hydraulic power of the Wutai River during the flood season, the hydrogen and oxygen isotopes experience dilution, enrichment, and dilution.
3.2.2. Characteristics of Water Cycle Indicated by Strontium Isotope
Spatial Distribution Characteristics of Strontium Isotopes
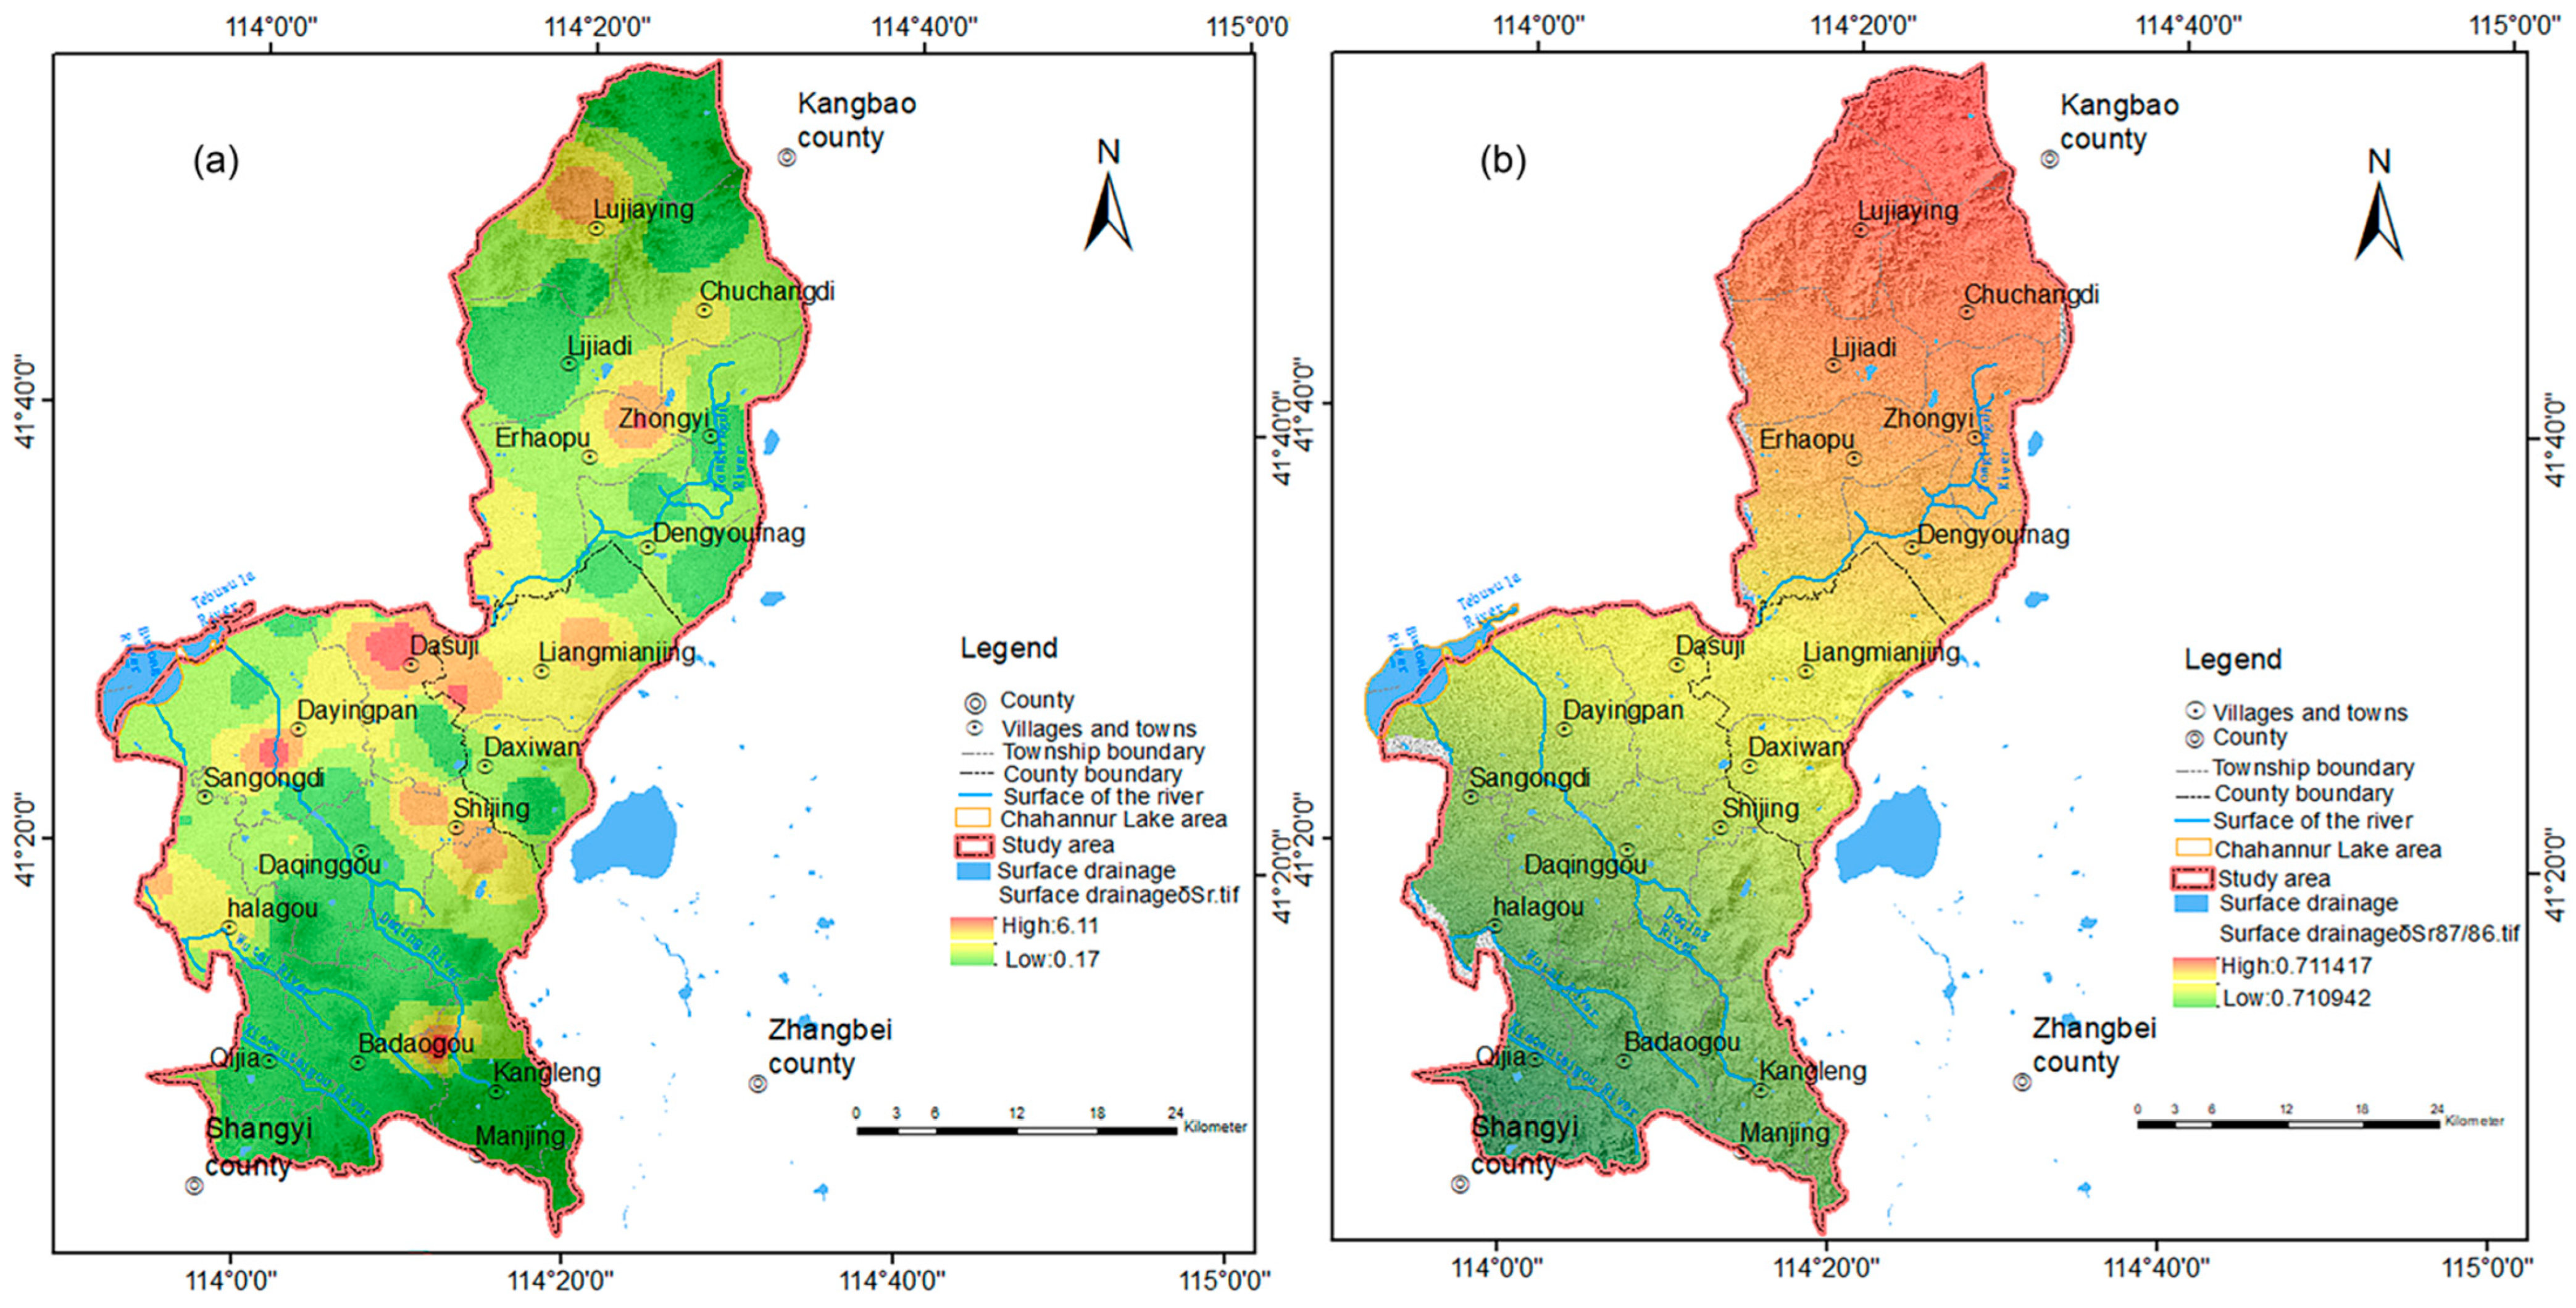
Sr2+ concentration ranges from 0.163−0.531 mg/L Figure 8a, with 87Sr/86Sr values ranging from 709.222‰–711.418‰. Overall, there are intense variations in groundwater Sr2+ concentration and 87Sr/86Sr value throughout the study area Figure 8b.
Samples from the Daqinggou River were analyzed, with 25 samples taken from phreatic water, and eight samples taken from surface rivers and springs. Sr2+ concentration range is 0.153–6.049 mg/L (Figure 8a), 87Sr/86Sr value is 709.222‰–711.418‰ (Figure 8b). According to the analysis results of groundwater Sr2+ concentration and 87Sr/86Sr value, there are great differences in groundwater Sr2+ concentration and 87Sr/86Sr value in different areas in the study area. Most of the points are concentrated in the central plain of the study area, and the Sr2+ concentration values of the sampling points are all greater than 1 mg/L, which are generally low in the south and north and high in the middle. The 87Sr/86Sr ratio ranges from 709.2.22‰ to 711.418‰. Among them, the ratio of 87Sr/86Sr in quaternary diving is higher than 711.000 in the area from Yannuo to Badaguanao and Houbirong Bay.
There were 11 samples of clastic fracture pore water, in which the Sr2+ concentration was 0.416–0.318 mg/L, the Sr2+ concentration in the northern mountain area was greater than 1 mg/L, and the 87Sr/86Sr value was 709.462–711.418‰. The sample points with a ratio greater than 0.711 were all distributed in the northern part of the study area.
There are six samples of basalt fissure pore water with Sr2+ concentration of 0.431–6.253 mg/L and 87Sr/86Sr value of 709.5–711.3‰. The Sr2+ concentration of Mianjing and Changdi townships is greater than 1 mg/L and 87Sr/86Sr value of 711.000‰.
The Sr2+ concentration and 87Sr/86Sr value of granite fissure water samples in Dengyoufang town, Kangbao County are 0.962 mg/L and 711.088‰, respectively. The Sr2+ concentration of groundwater is shown in the figure below.
There is no obvious linear relationship or rule between groundwater depth and Sr2+ concentration and 87Sr/86Sr value.
Characteristics of Groundwater Circulation as Indicated by Strontium Isotopes
The increase in Sr is because minerals containing Sr are dissolved by circulating groundwater. Sr entering groundwater usually does not participate in ion exchange reactions and cannot reach saturation precipitation conditions. Therefore, Sr gradually accumulates in groundwater. The 87Sr/86Sr ratio change is caused by the inconsistency between 87Sr and 86Sr concentrations in the dissolved minerals and groundwater.
The Sr2+ content of clastic fissure pore water and bedrock fissure water in the north of the study area is less than 1 mg/L, which increases to 1.91 mg/L and 3.57 mg/L in Changdi Township and Wanglide village, respectively. The Sr2+content in the groundwater of Qiannaobuzi village and Laozhangjia village in Dengyoufang town is 0.72 mg/L and 0.93 mg/L, respectively, indicating that the groundwater in Changdi village flows southward along Erhaoba Township, Shaojiying village, and Xiabenhong village, and finally flows into the Yannao River.
The Sr2+ content of Quaternary pore water is less than 1 mg/L in the north by Liujiabu village, Yuguliang village, and Sujiliang village, with the Yannao runoff occurring to the southwest. The Xiaobenghong and DongYou villages on line to the north of Liujiapu village, Yugouliang village, and SujiLiang village, villages on the line, the area of Sr2+ content is greater than 1 mg/L, with runoff to Yannao occurring to the northwest. The XiaoBenHong village and GuLiGai beam area groundwater towards the town of Dasuli Guligailiang village no longer have runoff to the north. Furthermore, near the village, the Sr2+ content also reaches the maximum value of 6.41 mg/L. The content of Sr2+ in Baishaquan village in the north is 0.76 mg/L, and the groundwater flows southward. The Sr2+ content in Xishuiquan village is 0.53 mg/L, and that in Baoyinnuo is 0.63 mg/L. The groundwater flows to Yanggao village in the northwest.
The Sr2+ content in Mazhanggai Yingzi, Dayindi village, and Shieerhao villages gradually increase to 3.29 mg/L, 3.39 mg/L, and 4.75 mg/L, respectively. However, the Sr2+ content in Houbolongwan and Mengmengying villages are 1.58 mg/L and 1.64 mg/L, respectively. The results show that the groundwater in the southeast study area does not flow through the wetland park of Dayingpan town and Mengmengying village and is not discharged to Chahannur. The Sr2+ content of groundwater and river water from the upper to middle reaches of the Daqinggou River (except Dajing village, Shijing town) is less than 1 mg/L, and the groundwater flows essentially parallel to the river (Figure 9). After Shierhao village, the groundwater Sr2+content is greater than 1 mg/L, so it is speculated that the east and west sides of the No. 1–12 villages are replenished by groundwater lateral runoff.
Sanpai Di bounds the area in the middle of the Wutai River and Daqinggou River, Xingjia Cun, and Silamingzi, with Sr2+ content of less than 1 mg/L in the south and Sr2+ content of more than 1 mg/L in the north. This boundary is also the boundary between the Quaternary loose rock pore water and clastic rock fracture pore water. The results indicate that Sr2+ content in the groundwater gradually accumulates with an increase in the groundwater path during circulating runoff. In the sampling sites near Wutai River, the Sr2+ contents of water samples after Gaojia village in Daqinggou town are all greater than 1 mg/L.
In conclusion, hydrogen and oxygen isotopes and strontium isotopes reflect the same groundwater cycle process.
4. Conclusions
In this paper, the age of water discharge in the interior of the Chahannur Basin was determined, the recharge mode of groundwater and surface water was identified, and the recharge runoff discharge mechanism of groundwater was described, so as to improve the understanding of groundwater and surface water circulation in the Chahannur Basin and provide a policy basis for the reduction in the area of the Chahannur Lake area. The results achieved are described below:
- (1)
- Tritium isotope (3H) and Freon (CFCs) dating methods are suitable for the semi-quantitative dating of groundwater in the Chahannur Basin.
- (2)
- Hydrogen, oxygen, and strontium isotopes can be used to characterize the groundwater cycle in the Chahannur Basin.
- (3)
- The groundwater level around the Chahannur Lake area is low, and the groundwater in the Chahannur Basin flows from the southwest and northwest to the lake area.
- (4)
- The groundwater in the Chahannur Basin is mainly replenished by atmospheric precipitation, and the evaporation of groundwater and surface water is strong.
Author Contributions
Conceptualization, X.T.; data curation, X.T. and D.Y.; funding acquisition, Z.C. and Y.Z.; methodology, Z.G. and Z.C.; project administration, Y.Z.; resources, F.L.; software, F.L., Y.W. and D.Y.; validation, Y.W.; writing—review and editing, L.F. All authors have read and agreed to the published version of the manuscript.
Funding
This research is funded by the Open Project of the Hebei Key Laboratory of Geological Resources and Environmental Monitoring and Protection (JCYKT202101 & JCYKT202105); Nature Fund of Hebei Province (E2021210007); Special Project for Cultivating Scientific and Technological Innovation Ability of College and Middle School Students in Hebei Province (V1650636047357); Hebei University Science and Technology research project (ZD2022119); Science and Technology Innovation Team project of Hebei GEO University (KJCXTD-2021-14); Introduction of Foreign Intelligence Project in Hebei province in 2021 (2021ZLYJ-1).
Institutional Review Board Statement
This study was conducted in accordance with the Declaration of Helsinki and approved by the Institutional Review Board (or Ethics Committee) of the Institute’s name (Agreement code 001 and 6 December 2022).
Informed Consent Statement
Informed consent has been obtained from all subjects participating in the study.
Data Availability Statement
The data are the monitoring data of Hebei Geological Environment Monitoring Institute, which are true and reliable.
Acknowledgments
Thanks to the Land Resources Exploration Centre of Hebei Bureau of Geology and Mineral Exploration and Development and School of Water Resources and Environment, Hebei GEO University—the two partners—for their support.
Conflicts of Interest
The authors declare no conflict of interest.
References
- Chen, M.; Li, Y.; Lei, X.; Li, N.; Gao, Q.; Wang, C. Quantitative assessment of spatio-temporal evolution characteristics and driving factors of groundwater level in Chahannur basin. Resour. Environ. Arid. Areas 2022, 36, 105–111. (In Chinese) [Google Scholar] [CrossRef]
- Prada, S.; Cruz, J.V.; Figueira, C. Using stable isotopes to characterize groundwater recharge sources in the volcanic island of Madeira, Portugal. J. Hydrol. 2016, 536, 409–425. [Google Scholar] [CrossRef]
- Wu, X.; Dong, W.; Lin, X. Evolution of wetland in Honghe ational Nature Reserve from the view of hydrogeology. Sci. Total Environ. 2017, 609, 1370–1380. [Google Scholar] [CrossRef] [PubMed]
- Zhang, L.; Li, P.; He, X. Interactions between surface water and groundwater in selected tributaries of the Wei River (China) revealed by hydrochemistry and stable isotopes. Hum. Ecol. Risk Assess. Int. J. 2021, 28, 1–21. [Google Scholar] [CrossRef]
- Matsumoto, T.; Chen, Z.; Wei, W.; Yang, G.-M.; Hu, S.-M.; Zhang, X. Application of combined 81Kr and 4He chronometers to the dating of old groundwater in a tectonically active region of the North China Plain. Earth Planet. Sci. Lett. 2018, 493, 208–217. [Google Scholar] [CrossRef]
- Anja, B.; Karsten, O.; Richard, G.; Janina, S.R.; Seifu, K.; Susanne, S. Groundwater origin and flow dynamics in active rift systems—A multi-isotope approach in the Main Ethiopian Rift. J. Hydrol. 2011, 402, 274–289. [Google Scholar]
- West, A.G.; February, E.C.; Bowen, G.J. Spatial analysis of hydrogen and oxygen stable isotopes (“isoscapes”) in ground water and tap water across South Africa. J. Geochem. Explor. 2014, 145, 213–222. [Google Scholar] [CrossRef] [Green Version]
- Vystavna, Y.; Diadin, D.; Huneau, F. Defining a stable water isotope framework for isotope hydrology application in a large trans-boundary watershed (Russian Federation/Ukraine). Isot. Environ. Health Stud. 2017, 54, 147–167. [Google Scholar] [CrossRef]
- Qiu, X.; Wang, Y.; Wang, Z.; Regenauer-Lieb, K.; Zhang, K.; Liu, J. Determining the origin, circulation path and residence time of geothermal groundwater using multiple isotopic techniques in the Heyuan Fault Zone of Southern China. J. Hydrol. 2018, 567, 339–350. [Google Scholar] [CrossRef]
- Taufiq, A.; Effendi, A.J.; Iskandar, I.; Hosono, T.; Hutasoit, L.M. Controlling factors and driving mechanisms of nitrate contamination in groundwater system of Bandung Basin, Indonesia, deduced by combined use of stable isotope ratios, CFC age dating, and socioeconomic parameters. Water Res. 2018, 148, 292–305. [Google Scholar] [CrossRef]
- Wu, X.; Chen, F.; Liu, X.; Wang, S.; Zhang, M.; Zhu, G.; Zhou, X.; Chen, J. The Significance of Hydrogen and Oxygen Stable Isotopes in the Water Vapor Source in Dingxi Area. Water 2021, 13, 2374. [Google Scholar] [CrossRef]
- Yuan, J.; Guo, Q.; Wang, Y. Geochemical behaviors of boron and its isotopes in aqueous environment of the Yangbajing and Yangyi geothermal fields, Tibet, China. J. Geochem. Explor. 2014, 140, 11–22. [Google Scholar] [CrossRef]
- Anovski, T.; Anovska-Jovcheva, E.; Lisichkov, K.; Dimitrovski, D.; Kuvendziev, S.; Leis, A.; Benischke, R.; Micevski, E.; Arsov, L. Application of environmental isotope techniques for determining the origin and mechanisms of recharge of the Rashche Spring. Environ. Earth Sci. 2019, 78, 656. [Google Scholar] [CrossRef]
- Wang, T.; Chen, J.; Zhang, C. Estimation of fossil groundwater mass fraction accounting for endogenic carbon input across California. J. Hydrol. 2021, 595, 126034. [Google Scholar] [CrossRef]
- Chandrajith, R.; Barth, J.A.; Subasinghe, N.; Merten, D.; Dissanayake, C. Geochemical and isotope characterization of geothermal spring waters in Sri Lanka: Evidence for steeper than expected geothermal gradients. J. Hydrol. 2013, 476, 360–369. [Google Scholar] [CrossRef]
- Massoudieh, A.; Ginn, T. The theoretical relation between unstable solutes and groundwater age. Water Resour. Res. 2011, 47, W10523. [Google Scholar] [CrossRef]
- Elliot, T.; Bonotto, D.M.; Andrews, J.N. Dissolved uranium, radium and radon evolution in the Continental Intercalaire aquifer, Algeria and Tunisia. J. Environ. Radioact. 2014, 137, 150–162. [Google Scholar] [CrossRef] [Green Version]
- Lee, K.-S.; Kim, J.-M.; Lee, D.-R.; Kim, Y.; Lee, D. Analysis of water movement through an unsaturated soil zone in Jeju Island, Korea using stable oxygen and hydrogen isotopes. J. Hydrol. 2007, 345, 199–211. [Google Scholar] [CrossRef]
- Woldemariyam, F.; Ayenew, T. Application of hydrochemical and isotopic techniques to understand groundwater recharge and flow systems in the Dawa River basin, southern Ethiopia. Environ. Earth Sci. 2016, 75, 1002. [Google Scholar] [CrossRef]
- Elmarami, H.; Meyer, H.; Massmann, G. Combined approach of isotope mass balance and hydrological water balance methods to constrain the sources of lake water as exemplified on the small dimictic lake Silbersee, northern Germany. Isot. Environ. Health Stud. 2017, 53, 184–197. [Google Scholar] [CrossRef]
- Zhen, Z.-L.; Li, C.-Y.; Zhang, S.; Li, W.-B.; Shi, X.-H.; Sun, B. Characteristics and indications of hydrogen and oxygen isotopes distribution in lake ice body. Water Sci. Technol. 2015, 71, 1065–1072. [Google Scholar] [CrossRef] [PubMed]
- Zhu, S.; Zhang, F.; Kung, H.-T.; Yushanjiang, A. Hydrogen and Oxygen Isotope Composition and Water Quality Evaluation for Different Water Bodies in the Ebinur Lake Watershed, Northwestern China. Water 2019, 11, 2067. [Google Scholar] [CrossRef] [Green Version]
- Kagabu, M.; Matsunaga, M.; Ide, K. Momoshima, N. Shimada, J.; Groundwater age determination using 85kr and multiple age tracers (sf6, cfcs, and 3H) to elucidate regional groundwater flow systems. J. Hydrol. Reg. Stud. 2017, 12, 165–180. [Google Scholar] [CrossRef]
- Bugai, D.A.; Fourre, E.; Jeancbaptiste, P.; Dapoigny, A.; Baumier, D.; Salle, K.L.G.L.; Lancelot, J.; Skalskyy, A.; Van Meir, N. Estimation of groundwater exchange at chernobyl site using the data of the isotope dating and hydrogeological modeling. Geol. J. 2010, 345, 119–124. [Google Scholar] [CrossRef]
- Okofo, L.; Adonadaga, M.; Martienssen, M. Groundwater age dating using multi-environmental tracers (SF6, CFC-11, CFC-12, δ18O, and δD) to investigate groundwater residence times and recharge processes in northeastern ghana. J. Hydrol. 2022, 610, 127821. [Google Scholar] [CrossRef]
- Kolbe, T.; MarcAis, J.; Thomas, Z.; Abbott, B.; Dreuzy, J.; Rousseau-Gueutin, P.; Aquilina, L.; Labasque, T.; Pinay, G. Coupling 3d groundwater modeling with cfc-based age dating to classify local groundwater circulation in an unconfined crystalline aquifer. J. Hydrol. 2016, 543, 31–46. [Google Scholar] [CrossRef] [Green Version]
- Bowen, G.J.; Kennedy, C.D.; Liu, Z.; Stalker, J. Water balance model for mean annual hydrogen and oxygen isotope distributions in surface waters of the contiguous United States. J. Geophys. Res. Earth Surf. 2011, 116, G04011. [Google Scholar] [CrossRef] [Green Version]
- Henderson, A.K.; Shuman, B.N. Hydrogen and oxygen isotopic compositions of lake water in the western United States. GSA Bull. 2009, 121, 1179–1189. [Google Scholar] [CrossRef]
- Janssen, S.E.; Johnson, M.W.; Blum, J.D.; Barkay, T.; Reinfelder, J.R. Separation of monomethylmercury from estuarine sediments for mercury isotope analysis. Chem. Geol. 2015, 411, 19–25. [Google Scholar] [CrossRef] [Green Version]
- He, X.; Li, P.; Ji, Y.; Wang, Y.; Su, Z.; Elumalai, V. Groundwater Arsenic and Fluoride and Associated Arsenicosis and Fluorosis in China: Occurrence, Distribution and Management. Expo. Health 2020, 12, 355–368. [Google Scholar] [CrossRef]
- Liu, J. Study on the variation trend of tritium concentration in Atmospheric precipitation over China in recent ten years. Investig. Sci. Technol. 2001, 4, 11–14. (In Chinese) [Google Scholar]
- Long, W.; Chen, H.; Duan, Q. Application of artificial neural network method in restoring tritium concentration in precipitation. Geol. Resour. 2008, 17, 208–212. (In Chinese) [Google Scholar]
- Wang, F. A regional model for the recovery of tritium concentration in precipitation in Jilin Province. Jilin Geol. 1998, 17, 75–81. (In Chinese) [Google Scholar]
- Vergnaud-Ayraud, V.; Aquilina, L.; Pauwels, H.; Labasque, T. Groundwater age determination by CFC analysis: A tool for groundwater sustainable management. Technol. Sci. Methodes 2008, 1, 37–44. [Google Scholar]
- Jing, L.; Fadong, L.; Song, S.; Zhang, Y.; Cai, W. Worldwide application and prospective of CFCs groundwater age-dating method. Ecol. Environ. Sci. 2012, 21, 1503–1508. [Google Scholar]
- Wang, P.; Chen, X.; Shen, L.; Wu, K.; Huang, M.; Xiao, Q. Geochemical features of the geothermal fluids from the Mapamyum non-volcanic geothermal system (Western Tibet, China). J. Volcanol. Geotherm. Res. 2016, 320, 29–39. [Google Scholar] [CrossRef]
- Kiro, Y.; Weinstein, Y.; Starinsky, A.; Yechieli, Y. Groundwater ages and reaction rates during seawater circulation in the Dead Sea aquifer. Geochim. Cosmochim. Acta 2013, 122, 17–35. [Google Scholar] [CrossRef]
Figure 1.
Geographical location map of the Chahannur watershed.

Figure 2.
Plume distribution of the groundwater pollution in the study area.

Figure 3.
Freon dating curve.

Figure 4.
The historical concentrations of tritium in precipitation (a) and water determined by the piston model (b).
Figure 4.
The historical concentrations of tritium in precipitation (a) and water determined by the piston model (b).

Figure 5.
CFCs groundwater age distribution.

Figure 6.
Global meteoric water line (GMWL) and local meteoric water line (LMWL).

Figure 7.
(a) Spatial distribution of δ2H isotope values and (b) spatial distribution of δ18O isotope values.
Figure 7.
(a) Spatial distribution of δ2H isotope values and (b) spatial distribution of δ18O isotope values.

Figure 8.
(a) Spatial distribution characteristics of Sr2+ content and (b) spatial distribution of groundwater 87Sr/86Sr ratio.
Figure 8.
(a) Spatial distribution characteristics of Sr2+ content and (b) spatial distribution of groundwater 87Sr/86Sr ratio.

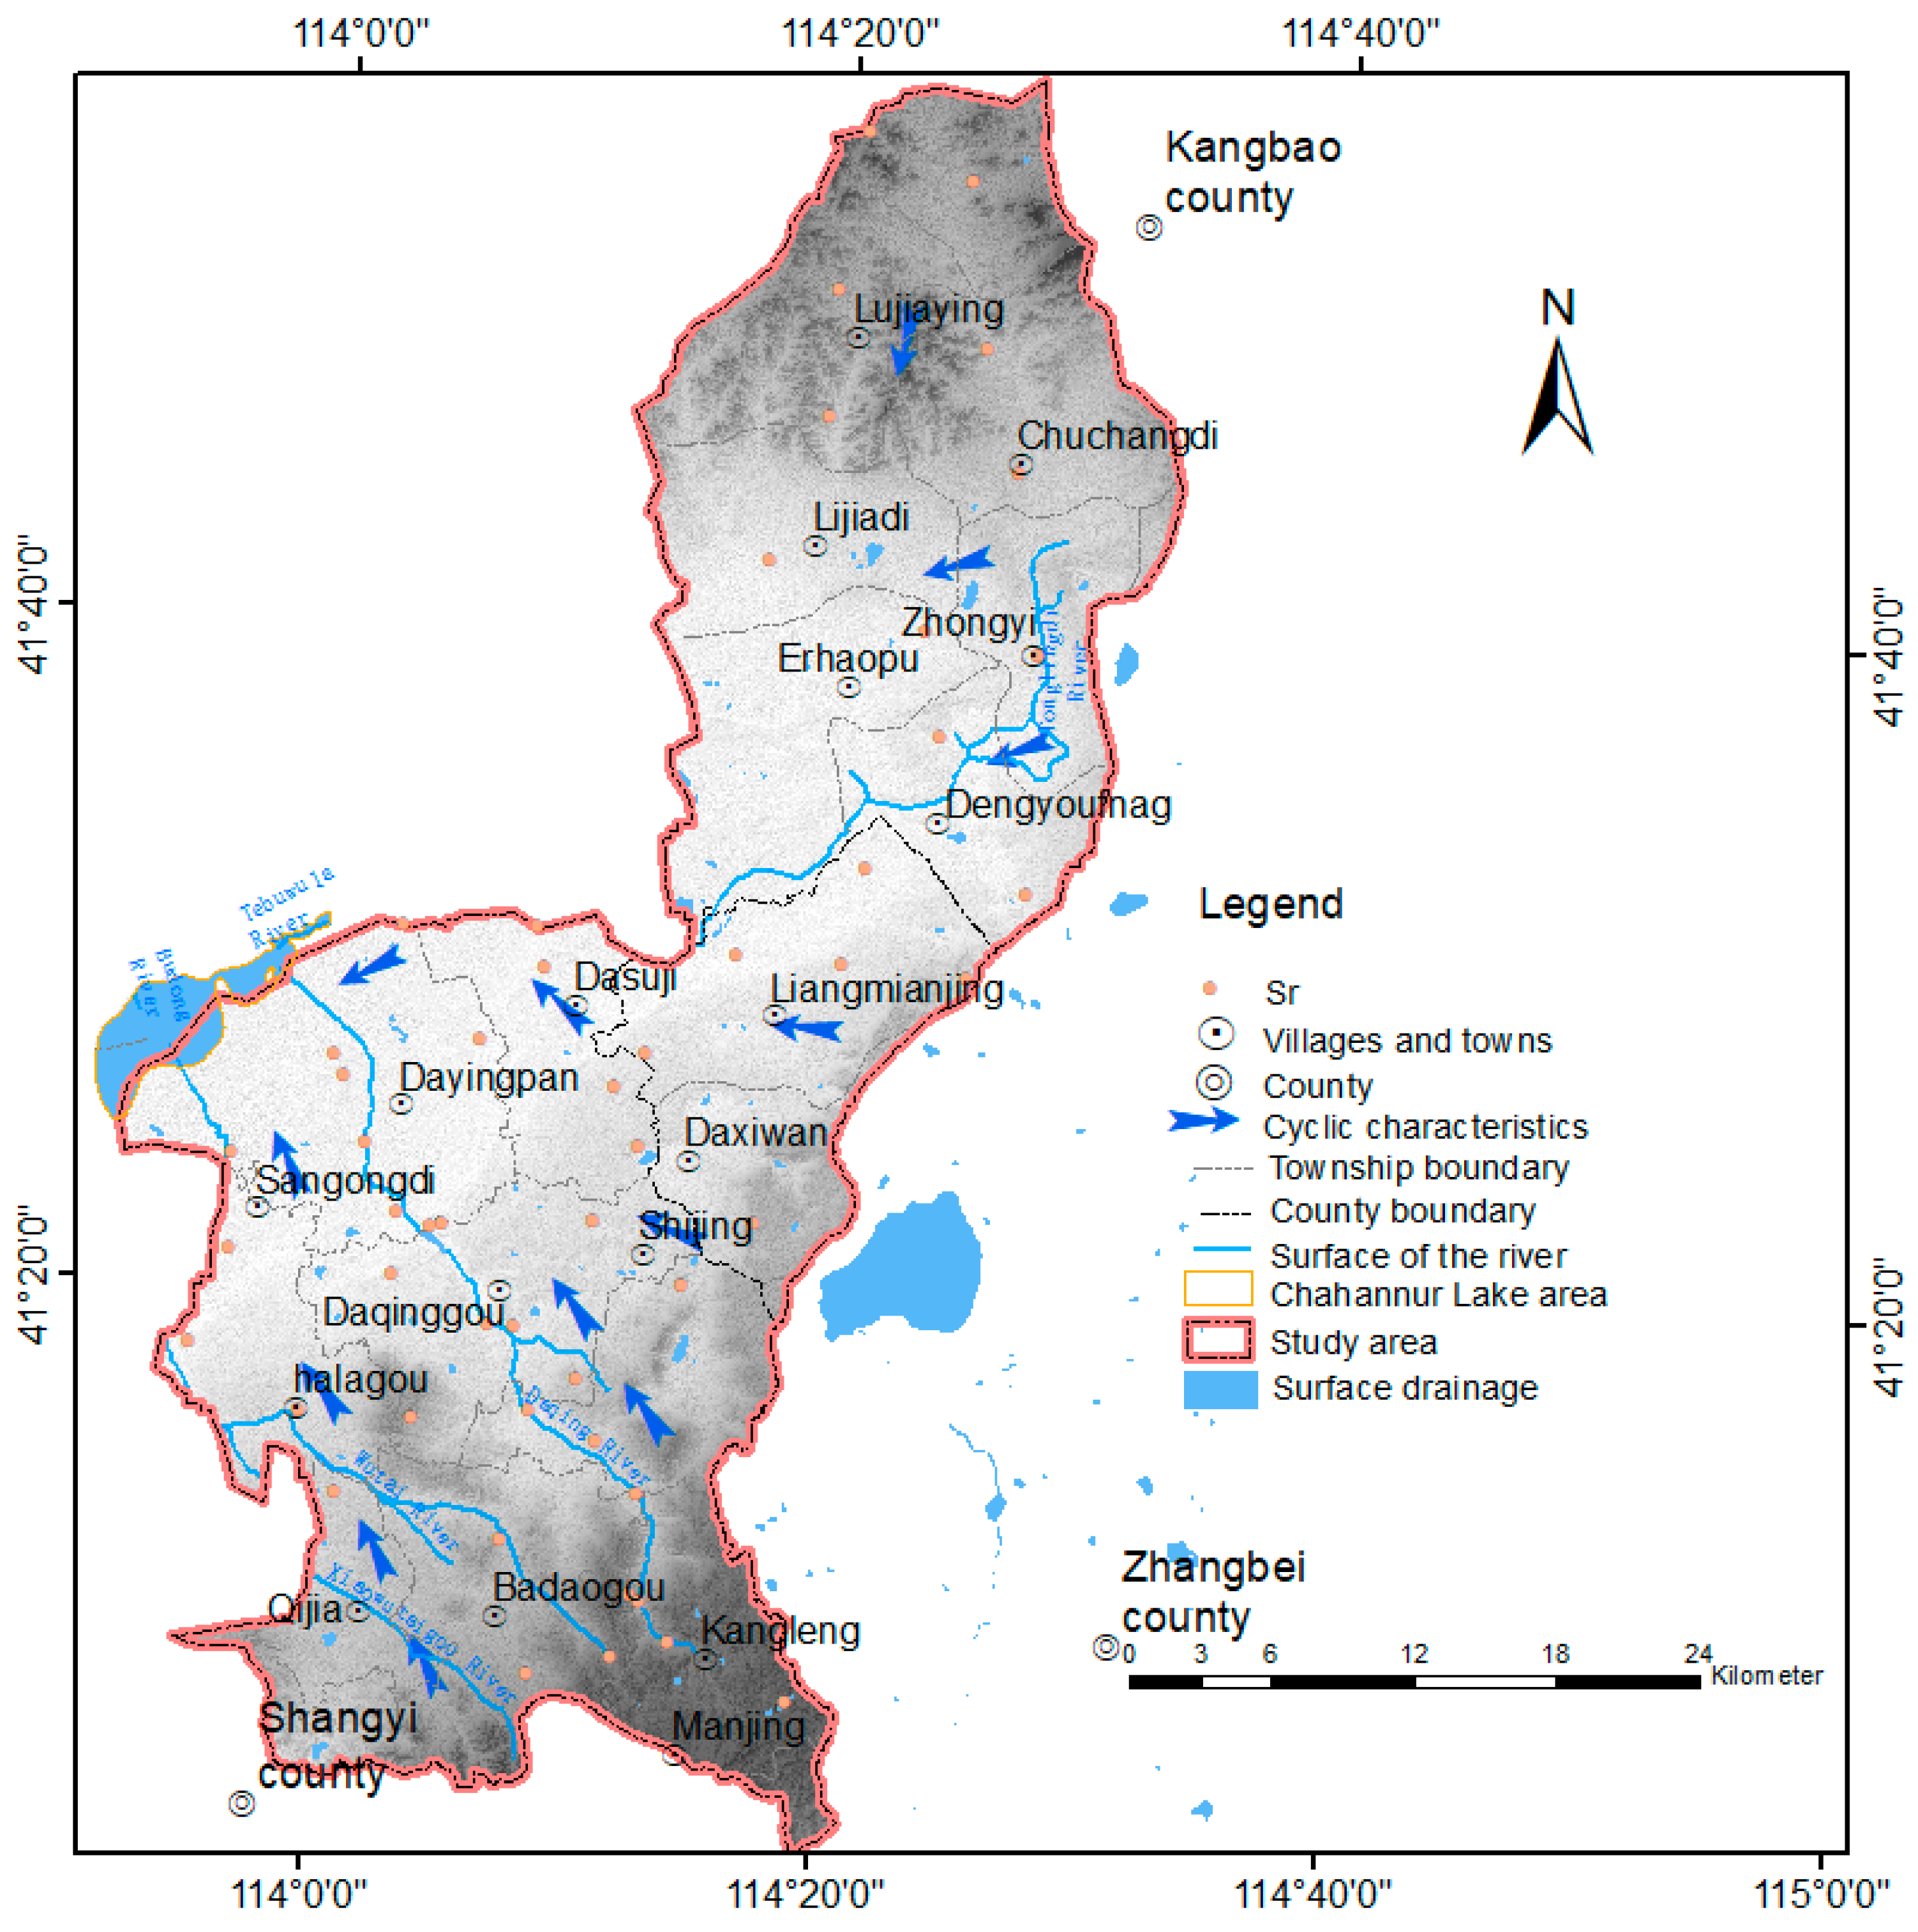
Figure 9.
The characteristics of groundwater circulation.


Table 1.
Qualitative age judgment of tritium content in groundwater.
| Tritium Content | Groundwater Age |
|---|---|
| <1TU | Old water (supplied before 1953) |
| 1~3 TU | Old water, new water (0~10 years supply), mixed |
| 3~10 TU | New water |
| 10~20 TU | Nuclear explosion 3H remained |
| >20 TU | Mainly supplied in the 1960s |
Table 2.
Shallow groundwater ages calculated by tritium isotopes.
| Hole Number | Depth of the Water Table (m) | Depth of Monitoring Well (m) | Tritium Values | Age | Hole Number | Depth of the Water Table | Depth of Monitoring Well (m) | Tritium Values | Age | Hole Number | Depth of the Water Table | Depth of Monitoring Well (m) | Tritium Values | Age |
|---|---|---|---|---|---|---|---|---|---|---|---|---|---|---|
| KBA59 | 12.94 | 51.82 | 6.1 ± 0.7 | 23 | SYB20 | 3.72 | 51.51 | 7.2 ± 0.4 | 20 | SYC75 | 1.2 | 51.97 | 8.6 ± 0.6 | 17 |
| KBB41 | 27.77 | 51.69 | 1.3 ± 0.7 | 51 | SYB32 | 12.45 | 50.73 | 3.4 ± 0.6 | 33 | SYC76 | 230 | 50.58 | 13.9 ± 0.7 | 8 |
| KBB46 | 10.82 | 50.27 | <1.3 | >51 | SYB64 | 0.8 | 50.34 | 12.1 ± 0.5 | 11 | SYC78 | 330 | 50.47 | 13.9 ± 0.7 | 8 |
| KBB47 | 8.45 | 50.10 | 10.7 ± 0.9 | 13 | SYB66 | 2.13 | 51.90 | 11.3 ± 0.5 | 12 | SYC81 | 235 | 51.84 | 17.3 ± 0.9 | 4 |
| KBB49 | 11.47 | 50.32 | 3.6 ± 0.7 | 32 | SYB67 | 4.53 | 50.37 | 8.8 ± 0.7 | 16 | SYC82 | 13.4 | 50.58 | <1.3 | >51 |
| KBB51 | 10.5 | 51.93 | 7.2 ± 0.8 | 20 | SYBS08 | 34.82 | 51.75 | 5.9 ± 0.6 | 23 | SYCS36 | 25.9 | 51.18 | <1.3 | >51 |
| KBB53 | 10.62 | 51.30 | 4.6 ± 0.7 | 28 | SYBS19 | 39.05 | 50.85 | 4.1 ± 0.5 | 30 | Syx02 | 33.4 | 51.08 | 2.4 ± 0.5 | 40 |
| KBC40 | 6.31 | 50.23 | <1.3 | >51 | SYC07 | 15.72 | 50.29 | 7.7 ± 0.6 | 19 | Syx05 | 14.87 | 50.80 | 7.0 ± 0.6 | 20 |
| KBC48 | 27.7 | 51.87 | <1.3 | >51 | SYC20 | 12.01 | 51.19 | 2.6 ± 0.5 | 38 | Syx06 | 15.15 | 51.27 | <1.3 | >51 |
| KBC55 | 21.5 | 50.11 | 3.0 ± 0.9 | 36 | SYC26 | 9.6 | 52.00 | 4.9 ± 0.5 | 27 | Syx08 | 16.84 | 50.69 | <1.3 | >51 |
| R11 | 23.4 | 50.00 | <1.3 | >51 | SYC27 | 9.52 | 51.26 | 10.3 ± 0.6 | 13 | Syx09 | 7.6 | 51.92 | 3.9 ± 0.5 | 31 |
| SBY27 | 3.08 | 51.20 | <1.3 | >51 | SYC30 | 5.23 | 51.77 | 9.6 ± 0.6 | 15 | ZBA45 | 18.2 | 51.91 | 7.2 ± 0.6 | 20 |
| SYA23 | 1.1 | 51.62 | 9.8 ± 0.4 | 14 | SYC31 | 8.3 | 50.62 | 7.8 ± 0.6 | 18 | ZBA46 | 13.8 | 51.03 | 5.9 ± 0.5 | 23 |
| SYAS19 | 18.67 | 51.16 | 6.4 ± 0.4 | 22 | SYC58 | 30.65 | 51.18 | <1.3 | >51 | ZBA50- | 2.3 | 51.63 | 10.8 ± 0.6 | 13 |
| SYB03 | 38.8 | 50.41 | <1.3 | >51 | SYC59 | 26.5 | 51.20 | 4.1 ± 0.5 | 30 | ZBA51 | 3.3 | 50.79 | 11.9 ± 0.6 | 11 |
| SYB15 | 9.78 | 50.52 | 1.9 ± 0.3 | 44 | SYC60 | 14.75 | 51.08 | <1.3 | >51 | |||||
| SYB17 | 2.64 | 50.09 | <1.3 | >51 | SYC68 | 32.4 | 51.25 | 6.2 ± 0.6 | 23 |
Table 3.
Groundwater ages calculated by CFCs.
| Point | CFC-11 | CFC-12 | CFC-113 | Age | Point | CFC-11 | CFC-12 | CFC-113 | Age |
|---|---|---|---|---|---|---|---|---|---|
| KBA37 | C | 34 | 35 | 35 | SYB20 | 33 | 38 | C | 36 |
| KBA41 | 52 | 49 | 43 | 48 | SYB50 | 49 | 54 | 38 | 47 |
| KBA43 | 36 | 38 | 37 | 37 | SYB55 | 47 | C | C | 47 |
| KBA44 | 36 | 43 | 33 | 37 | SYB65 | 43 | 45 | C | 44 |
| KBA59 | 36 | 37 | 34 | 36 | SYB66 | C | 37 | 36 | 37 |
| KBA63 | 45 | 45 | 42 | 44 | SYB67 | 41 | C | 40 | 41 |
| KBB33 | 51 | 47 | 41 | 46 | SYC04 | C | 35 | 34 | 35 |
| KBB35 | 43 | 38 | 38 | 40 | SYC07 | C | 38 | 36 | 37 |
| KBB36 | C | 50 | 34 | 42 | SYC08 | 35 | 36 | 34 | 35 |
| KBB45 | 49 | 45 | 40 | 45 | SYC27 | 49 | 46 | 40 | 45 |
| KBB46 | 55 | 55 | 47 | 52 | SYC29 | 47 | 45 | 37 | 43 |
| KBB47 | 35 | 37 | 38 | 37 | SYC30 | 46 | 45 | 38 | 43 |
| KBC40 | 49 | 49 | 38 | 45 | SYC35 | 48 | 46 | 38 | 44 |
| KBC45 | 64 | 49 | 41 | 51 | SYC61 | 45 | 53 | 38 | 45 |
| SYB60 | 34 | 36 | 33 | 34 | SYC63 | 49 | 47 | 40 | 45 |
| KBC52 | 51 | 41 | 39 | 44 | SYC65 | C | - | 33 | 33 |
| KBC54 | 36 | 43 | 35 | 38 | SYC67 | C | 32 | 34 | 33 |
| KBC55 | 47 | 42 | 39 | 43 | SYC70 | 36 | 29 | 34 | 33 |
| r8 | 32 | 30 | 35 | 32 | SYC75 | 37 | 30 | 33 | 33 |
| SBY27 | 55 | C | C | 55 | SYC84 | 48 | 44 | 38 | 43 |
| SYA18 | C | 37 | 35 | 36 | SYX09 | 37 | 40 | 35 | 37 |
| SYA29 | 55 | 61 | 49 | 55 | ZBA47 | 34 | 33 | 33 | 33 |
| SYA30 | 47 | C | 36 | 42 | ZBA50 | C | 37 | 36 | 37 |
| SYB15 | 30 | 37 | 33 | 33 | ZBA51 | 41 | 39 | 37 | 39 |
| SYB16 | 46 | 49 | 42 | 46 | ZBB52 | 43 | 36 | 38 | 39 |
| ZBC56 | 32 | 27 | 34 | 31 |
Note: “C” means excessive/polluted, “-” means not detected.
Table 4.
Statistics of stable isotopes of hydrogen and oxygen in groundwater.
| Groundwater Type | Statistics | δ18O (‰) | δ2H (‰) |
|---|---|---|---|
| phreatic water | minimum value | −13.20 | −86.90 |
| maximum | −7.90 | −63.10 | |
| mean | −9.90 | −72.00 | |
| standard deviation | 1.30 | 6.40 |
Table 5.
Changes of deuterium and oxygen isotope values in different water bodies.
| Type of Water Body | δD Value Variation Range | δ18O Value Variation Range |
|---|---|---|
| Spring water | −74.4~−71.3‰ | −11.4~−9.7‰ |
| River (reservoir) water | −50.8~−47.1‰ | −6.6~−4.5‰ |
| Loose rock pore water | −86.9~−63.1‰ | −13.2~−7.9‰ |
| Clastic rock fissure water | −81.9~−64.5‰ | −12.6~−8.2‰ |
| Basalt fissure hole water | −77.9~−67.7‰ | −11.7~−9.2‰ |
Disclaimer/Publisher’s Note: The statements, opinions and data contained in all publications are solely those of the individual author(s) and contributor(s) and not of MDPI and/or the editor(s). MDPI and/or the editor(s) disclaim responsibility for any injury to people or property resulting from any ideas, methods, instructions or products referred to in the content. |
© 2023 by the authors. Licensee MDPI, Basel, Switzerland. This article is an open access article distributed under the terms and conditions of the Creative Commons Attribution (CC BY) license (https://creativecommons.org/licenses/by/4.0/).
Share and Cite
MDPI and ACS Style
Tian, X.; Gong, Z.; Fu, L.; You, D.; Li, F.; Wang, Y.; Chen, Z.; Zhou, Y. Determination of Groundwater Recharge Mechanism Based on Environmental Isotopes in Chahannur Basin. Water 2023, 15, 180. https://doi.org/10.3390/w15010180
AMA Style
Tian X, Gong Z, Fu L, You D, Li F, Wang Y, Chen Z, Zhou Y. Determination of Groundwater Recharge Mechanism Based on Environmental Isotopes in Chahannur Basin. Water. 2023; 15(1):180. https://doi.org/10.3390/w15010180
Chicago/Turabian StyleTian, Xizhao, Zhiqiang Gong, Lulu Fu, Di You, Fan Li, Yahui Wang, Zhi Chen, and Yahong Zhou. 2023. "Determination of Groundwater Recharge Mechanism Based on Environmental Isotopes in Chahannur Basin" Water 15, no. 1: 180. https://doi.org/10.3390/w15010180
Note that from the first issue of 2016, this journal uses article numbers instead of page numbers. See further details here.