
The Influence of Different Climate and Terrain Factors on Vegetation Dynamics in the Lancang River Basin
by
 , and
, and
Yao Cheng
1,2,3,*,
Zeshen Yuan
2,3,
Yajun Li
2,3,
Jingjing Fan
2,3,
Meiqin Suo
2,3 and
Yuchun Wang
1,4,* 1
State Key Laboratory of Simulation and Regulation of Water Cycle in River Basin, China Institute of Water Resources and Hydropower Research, Beijing 100038, China
2
Hebei Key Laboratory of Intelligent Water Conservancy, Hebei University of Engineering, Handan 056038, China
3
School of Water Conservancy and Hydroelectric Power, Hebei University of Engineering, Handan 056038, China
4
Department of Water Ecology and Environment, China Institute of Water Resources and Hydropower Research, Beijing 100038, China
*
Authors to whom correspondence should be addressed.
Water 2023, 15(1), 19; https://doi.org/10.3390/w15010019
Submission received: 2 October 2022
/
Revised: 17 November 2022
/
Accepted: 17 December 2022
/
Published: 21 December 2022
(This article belongs to the Section Ecohydrology)
Abstract
:Vegetation plays an important role in soil and water conservation, regulating the atmosphere and maintaining ecosystem stability, as well as influencing regional hydrology and water–sand processes. In this study, spatial patterns in the response of climate and terrain factors to the Normalized Difference Vegetation Index (NDVI) and its dynamic characteristics were examined in the Lancang River Basin, by using a Geographically Weighted Regression (GWR) according to the Moderate Resolution Imaging Spectroradiometer (MODIS) NDVI data. The results showed that the NDVI in the study area showed a significant increasing trend in time, with 6.39% of the NDVI degraded and 90.85% of the NDVI increased in space. In the Pearson correlation analysis, precipitation was mainly negatively correlated with the NDVI, while temperature was mainly positively correlated with the NDVI, especially in Qinghai and Tibet. Among the soil types, iron-alluvium, incipient soils, and leached soils are particularly suitable for vegetation growth. In conclusion, the effects of climate and topographic factors on the NDVI are roughly the same in the Yunnan section, but opposite in the Qinghai section and Tibet section.
1. Introduction
Vegetation dynamics are a key component of terrestrial ecosystems and an indicator of global climate change response [1], playing a very important role in soil and water conservation, regulating the atmosphere, and maintaining ecosystem stability [2]. As vegetation is sensitive to climate change, it can also reflect the watershed ecological hydrology and elemental cycling in natural conditions [3]. The study of vegetation dynamics is a key issue in ecological research [4]. Studying the characteristics of vegetation dynamics can help to understand the trends of regional environmental changes [5], provides data support for scientific development policies and serves the sustainable management of the regional ecological environment [6]. Previous studies have shown that vegetation dynamic changes are mainly affected by climatic and terrain factors, and the influence of landscape vegetation change is mainly analyzed from the perspective of a single factor [7,8,9]. In fact, the influence of precipitation and temperature on vegetation dynamic change is not the same under different soil, altitude, and slope, which is important for the study of vegetation dynamic change [10,11,12,13]. It is necessary to discuss the change in watershed vegetation by integrating the joint action of these factors [14].
The Mekong River originates on the northeast slope of Tanggula Mountain in China and is called the Lancang River in China, and its ecological changes have a profound impact on the ecology of the Asian region and on international relations [15,16]. Therefore, the study of the dynamic evolution of vegetation in the Lancang River Basin and its correlation with climatic factors and altitudinal soils is of great ecological value. In the past 20 years, the development of remote sensing technology has led to the study of the dynamic evolution of vegetation becoming more and more perfect. Initially, the NDVI was obtained from the spectral band synthesis of remote sensing images to study the dynamic changes of vegetation [17]. Later, climate factors, topography factors, and human activities were added to analyze their influence on the NDVI [18]. Nowadays, with the support of more accurate satellite image data and more influence factors, it is possible to consider the process of vegetation dynamics and the influence of various influencing factors in the process of vegetation dynamics in an integrated way [19]. However, less attention has been paid to whether the quantitative effects of different influencing factors on vegetation dynamics are the same.
As an international basin, there have been some studies on soil erosion and heavy metal in the Lancang River Basin [20,21,22]. The Lancang River Basin is an area of low anthropogenic influence in China, which makes it a good place to identify the effects of climatic variables and soil types on vegetation dynamics [19,23]. The main purpose of this paper is: (1) to reveal the spatial and temporal dynamics of vegetation at different altitudes and soil types; (2) to determine the differences in the effects of temperature and precipitation on vegetation dynamics; and (3) to analyze the effects of climate factors, altitude, and slope on vegetation quantitatively. These findings could be helpful for understanding the dynamic effect of vegetation and is a push in the Lancang River Basin.
2. Materials and Methods
2.1. Study Area
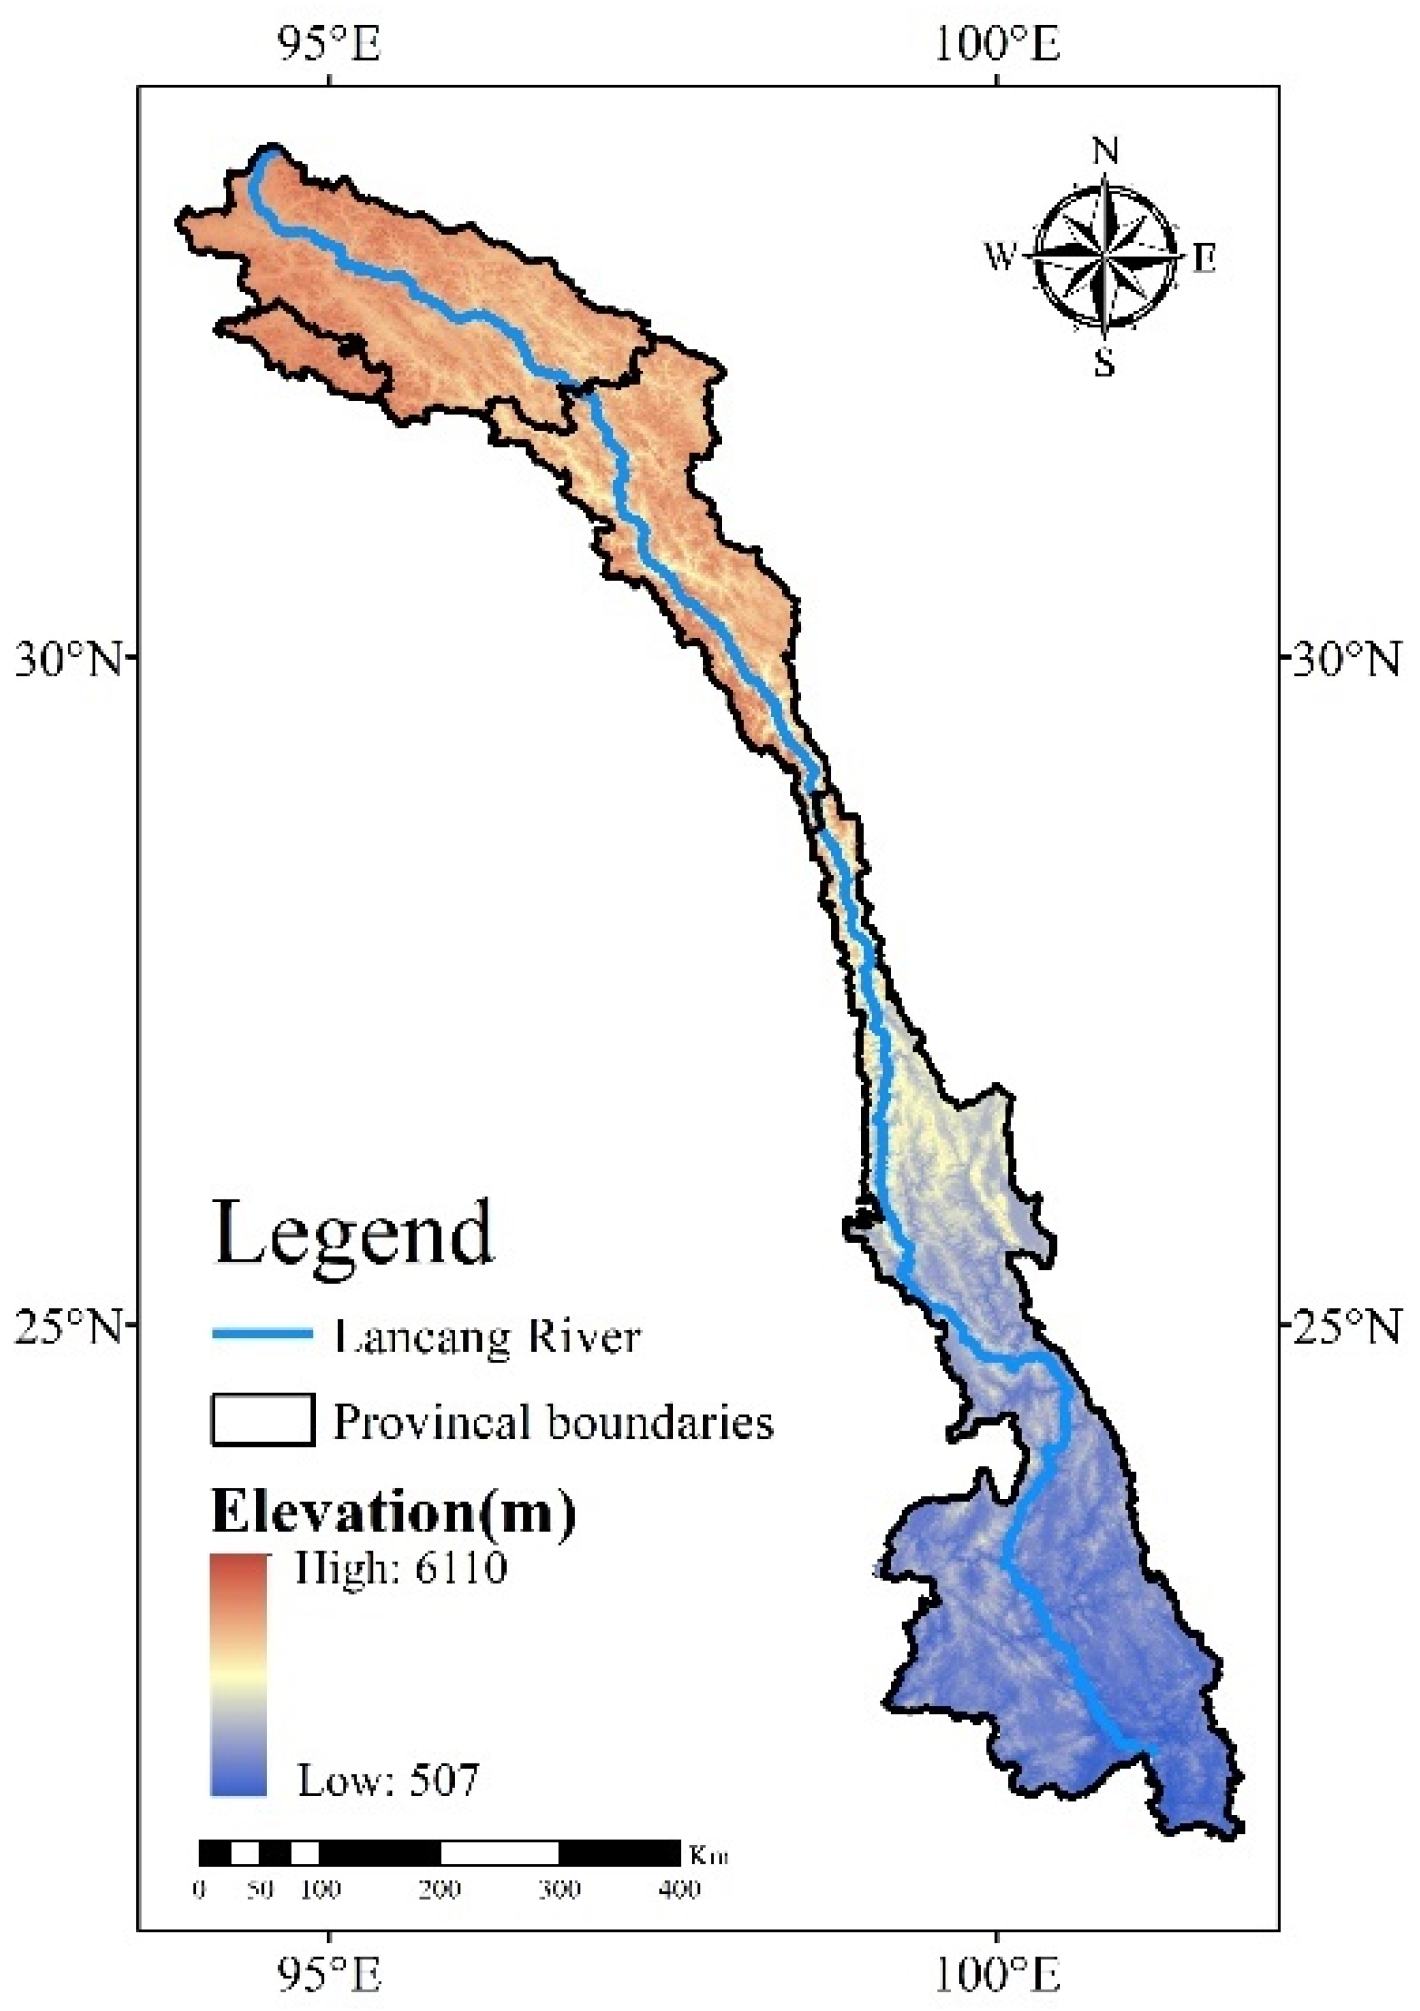
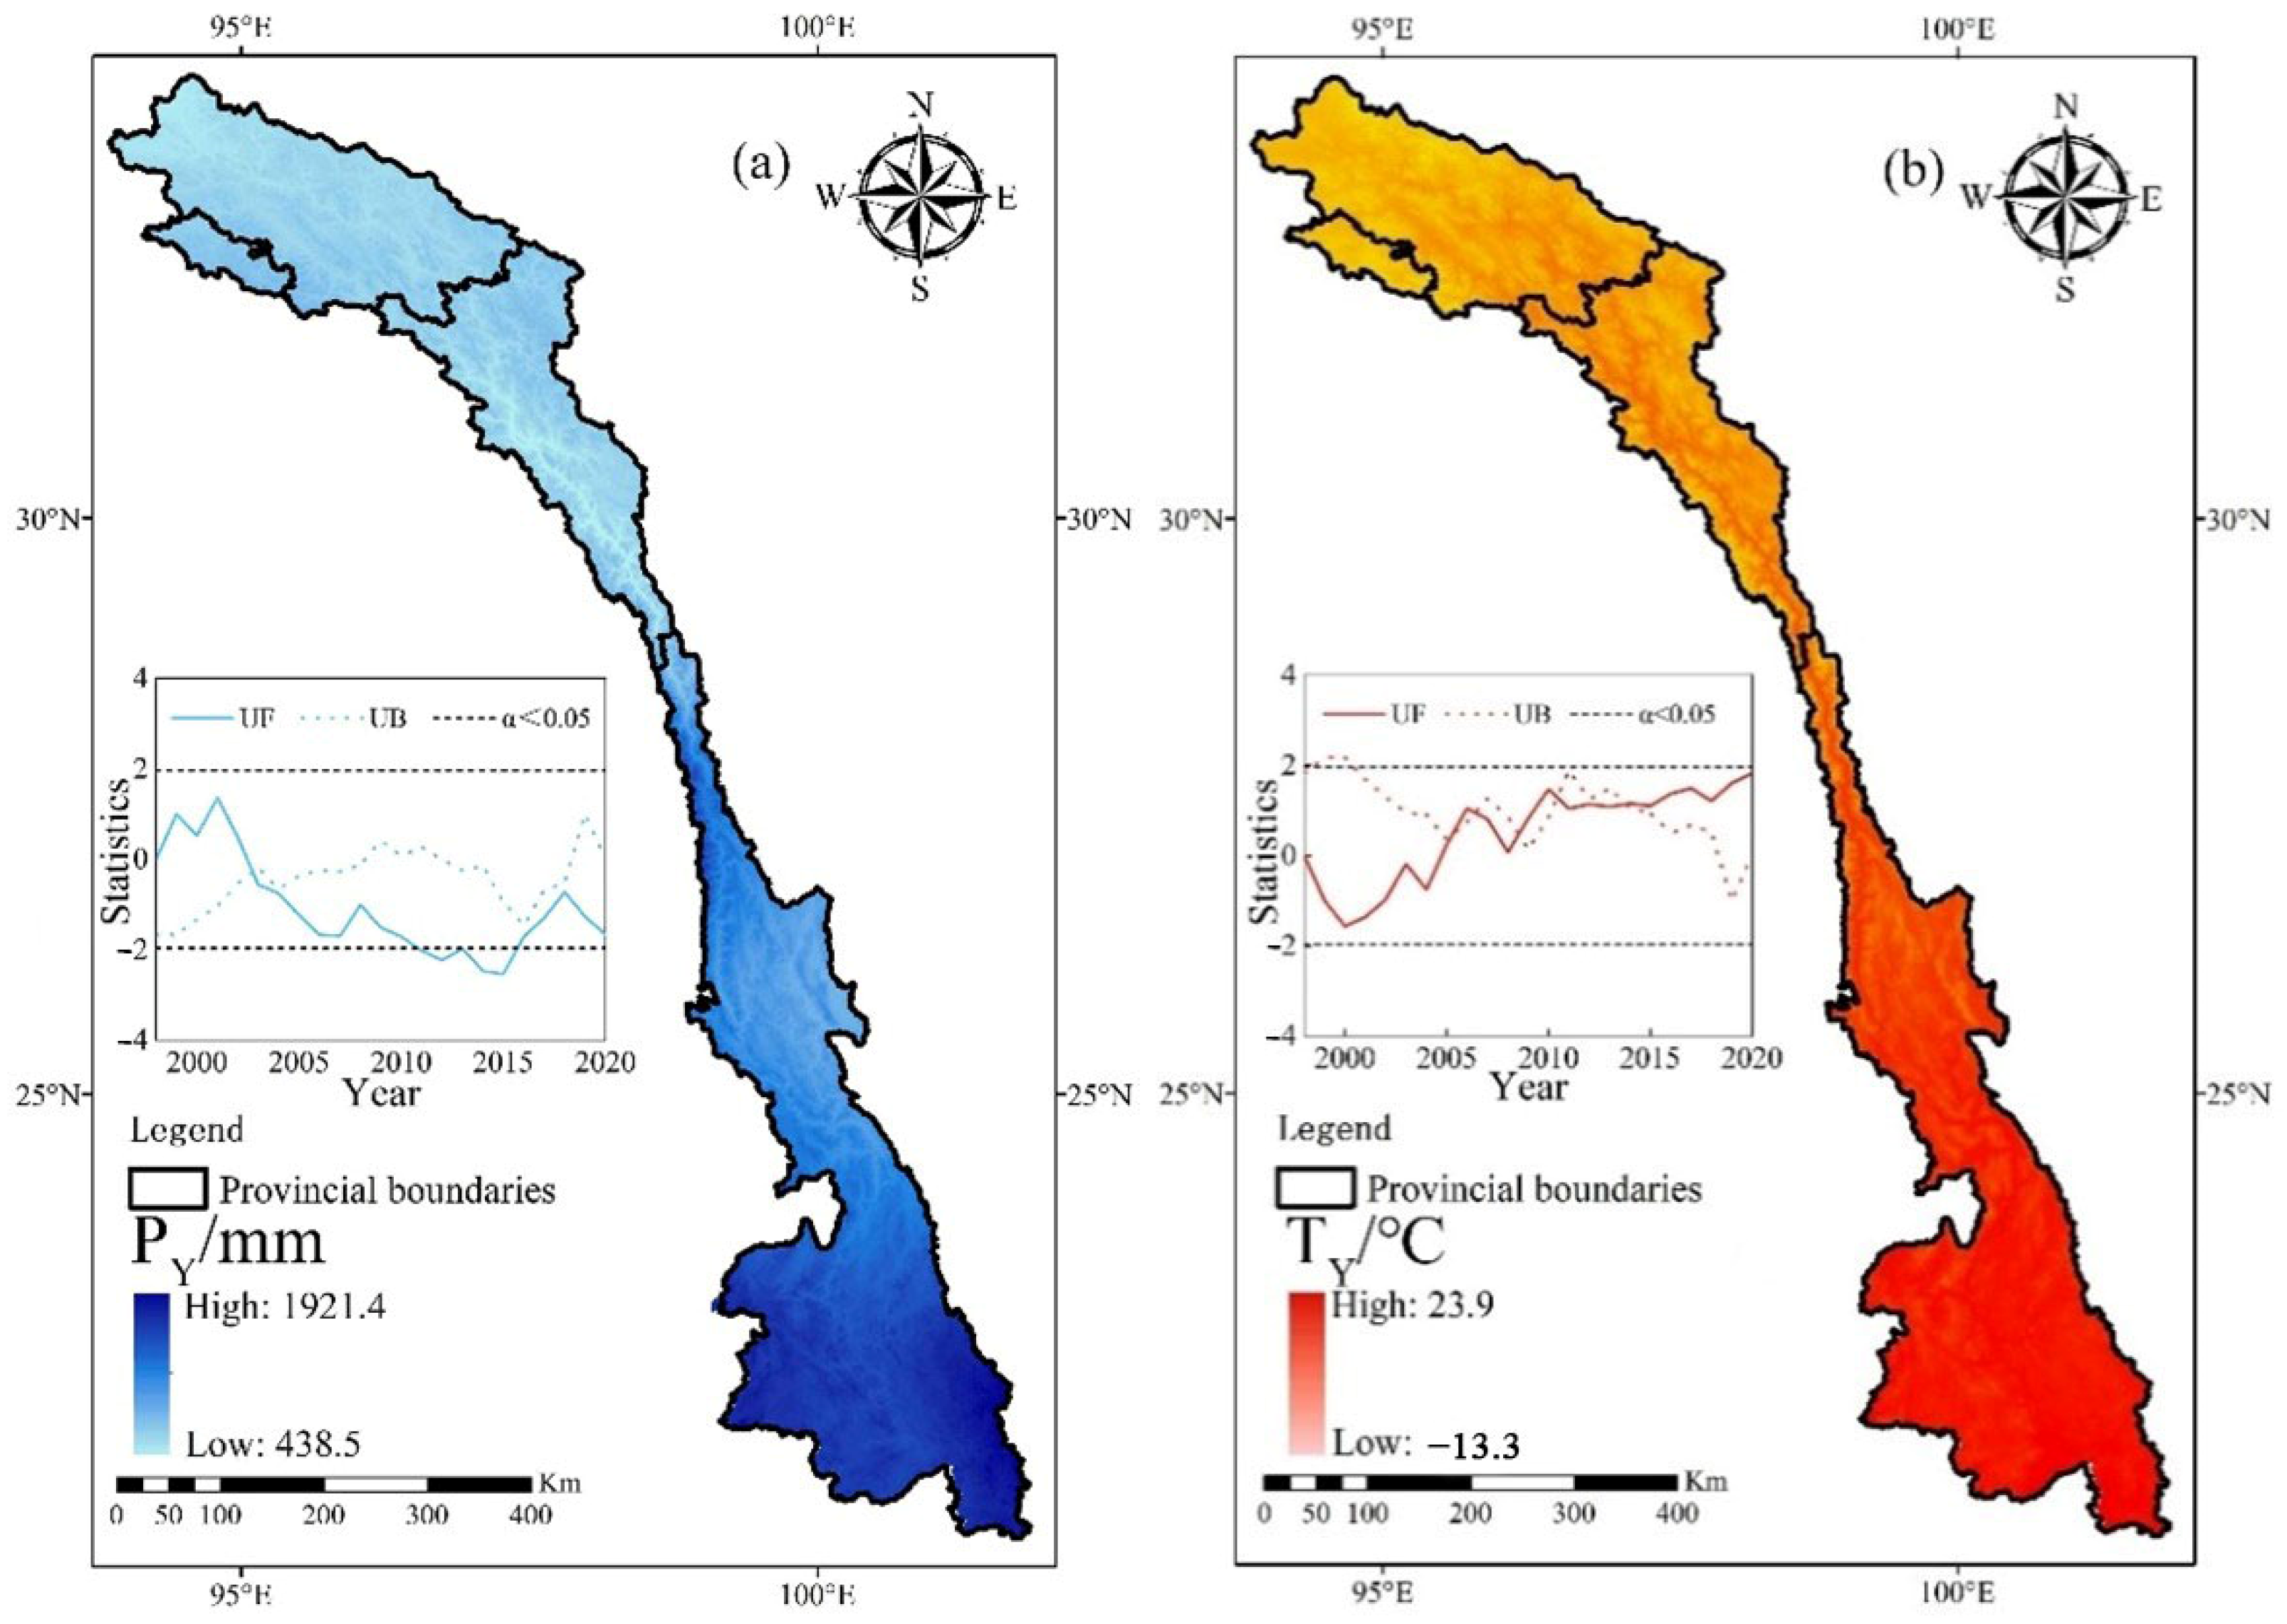
The Lancang River is 4880 km long, and the total catchment area of the basin is 8.1 × 10⁵ km2 (Figure 1) [20]. Along the way, it flows through Qinghai, Tibet, and Yunnan provinces. The headwaters are the least affected by the monsoon; the lower reaches are the most affected [24]. The annual mean precipitation increases from north to south and ranges from 438 to 1921 mm. Similarly, temperature increases from north to south and ranges between −13.3 and 23.9 °C. The upper section of the Lancang River Basin is located on the Tibet Plateau at an altitude of 4.5 km above sea level, where the mainland types are grassland, snow, and glacier cover. The middle section ranges from 2.5 km to 5 km above sea level, where grasslands and forests predominate. The lower section ranges in altitude from 0.5 km to 3 km, where the vegetation types are complex, with grasslands, scrub, forests, and swamps.
2.2. Data
The normalized vegetation index data is a vegetation index dataset generated using the maximum value synthesis method based on SPOT/VEGETATION PROBA-V 1 KM PRODUCTS (http://www.vito-eodata.be, accessed on 3 March 2022) vegetation index data. The geographical coordinate system is D_WGS_1984. The projection coordinate system is WGS_1984_UTM_Zone_46N with a spatial resolution of 1 km. The meteorological data is a spatial interpolation data set, which comes from the Resources and Environment Science and Data Center (http://www.resdc.cn, accessed on 3 March 2022). It is based on the daily observation data of more than 2400 meteorological stations in China. It is generated through sorting, calculation, and spatial interpolation processing, and then the Lancang River Basin is cut out using GIS. The geographic coordinate system is D_WGS_1984, the projection coordinate system is WGS_1984_UTM_Zone_46N, and the spatial resolution is 1 km. Soil data and elevation data were also obtained from the Resources, Environment, and Data Center of CAS (http://www.resdc.cn, accessed on 3 March 2022), with the same coordinate system and spatial resolution as above.
2.3. Methodology
2.3.1. Mann–Kendall Test
The Mann–Kendall is a non-parametric test statistic for assessing the significance of changes in time series [25,26]. Its statistical test statistic, Z-value, is calculated as follows:
The test trend was conducted at a specific level of significance. When |Z| > Z1−a/2, the original hypothesis is rejected and there is a significant trend in the time series. Z1−a/2 is obtained from a standard normal distribution table, and this study uses a significance level of α = 0.05 and Z1−a/2 = 1.96.
In the mutation test, the intersection of UFk and UBk is the time of onset of the variation, and if the intersection is between the critical values, the mutation has reached a significant level.
The statistic UFk is found with the following equation:
The results obtained were inverted and negative-sorted to obtain the UBk statistic series [26]. The mutation study was given a significance level of α = 0.05 and a critical value of U0.05 = ±1.96. The UFk and UBk statistics and the critical line for the region of significance statistic (±1.96) were plotted on a graph.
2.3.2. Sen’s Slope Estimation
Interannual variability of the NDVI in the study area is estimated using Sen’s slope estimate, which is an estimate of the median slope of all combinations of continuous data from a multi-year NDVI time series, using the following equation [27]:
where Slope is the slope of the meta-regression equation, Ai is the median NDVI in year i, and n is the length of time studied. If Slope > 0, then the NDVI is trending upwards, otherwise, it is trending downwards. Sen’s slope estimation, as a non-parametric method, has been shown to be very reliable in estimating change over time.
2.3.3. Geographically Weighted Regression
Geographically Weighted Regression (GWR) was originally proposed by Brunsdon [28] as a method for extending ordinary linear regression (e.g., OLS) when performing local spatial analysis. Using this method allows the variation of spatial relationships within a given region to be elucidated for better understanding. The parameters of GWR are a function of spatial location such that:
where and are the coordinates for each location i, is the intercept for location i, and is the local parameter estimate for independent variable at location i.
The Gaussian model is often used as a weight function for the GWR method, as follows:
where is the weight of observation j for point ; dij is the Euclidean distance between points and ; and b is the bandwidth, a function that describes the relationship between weight and distance. When > b, = 0; conversely, when = 0, = 1. Here, the corrected Akaike information criterion (AICc) is used to assess the complexity and accuracy of the model, as well as to determine the optimal b value. Lower AICc values indicate better model performance for a given simulation. Typically, the model with the lower AICc value has the best b-value when the difference in AICc values between the two models is greater than 3 [29].
3. Results
3.1. Spatial and Temporal Variation of NDVI
The trend in the NDVI for the study area is shown in Figure 2. Based on the Mann–Kendall trend analysis and linear fit of the multi-year NDVI values, the Lancang River (LCR) basin, Qinghai section, Tibet section, and Yunnan section all showed a significant increasing trend. The increasing trend in the NDVI from greatest to least is the Yunnan section (Z = 5.7, Slope = 0.0058), Lancang River section (Z = 5.7, Slope = 0.0047), Tibet section (Z = 4.5, Slope = 0.0040), and Qinghai section (Z = 4.9, Slope = 0.0031). This indicates that the vegetation of the whole Lancang River Basin is increasing year by year, and the vegetation of the Qinghai and Tibet sections is significantly lower than that of the Yunnan section.
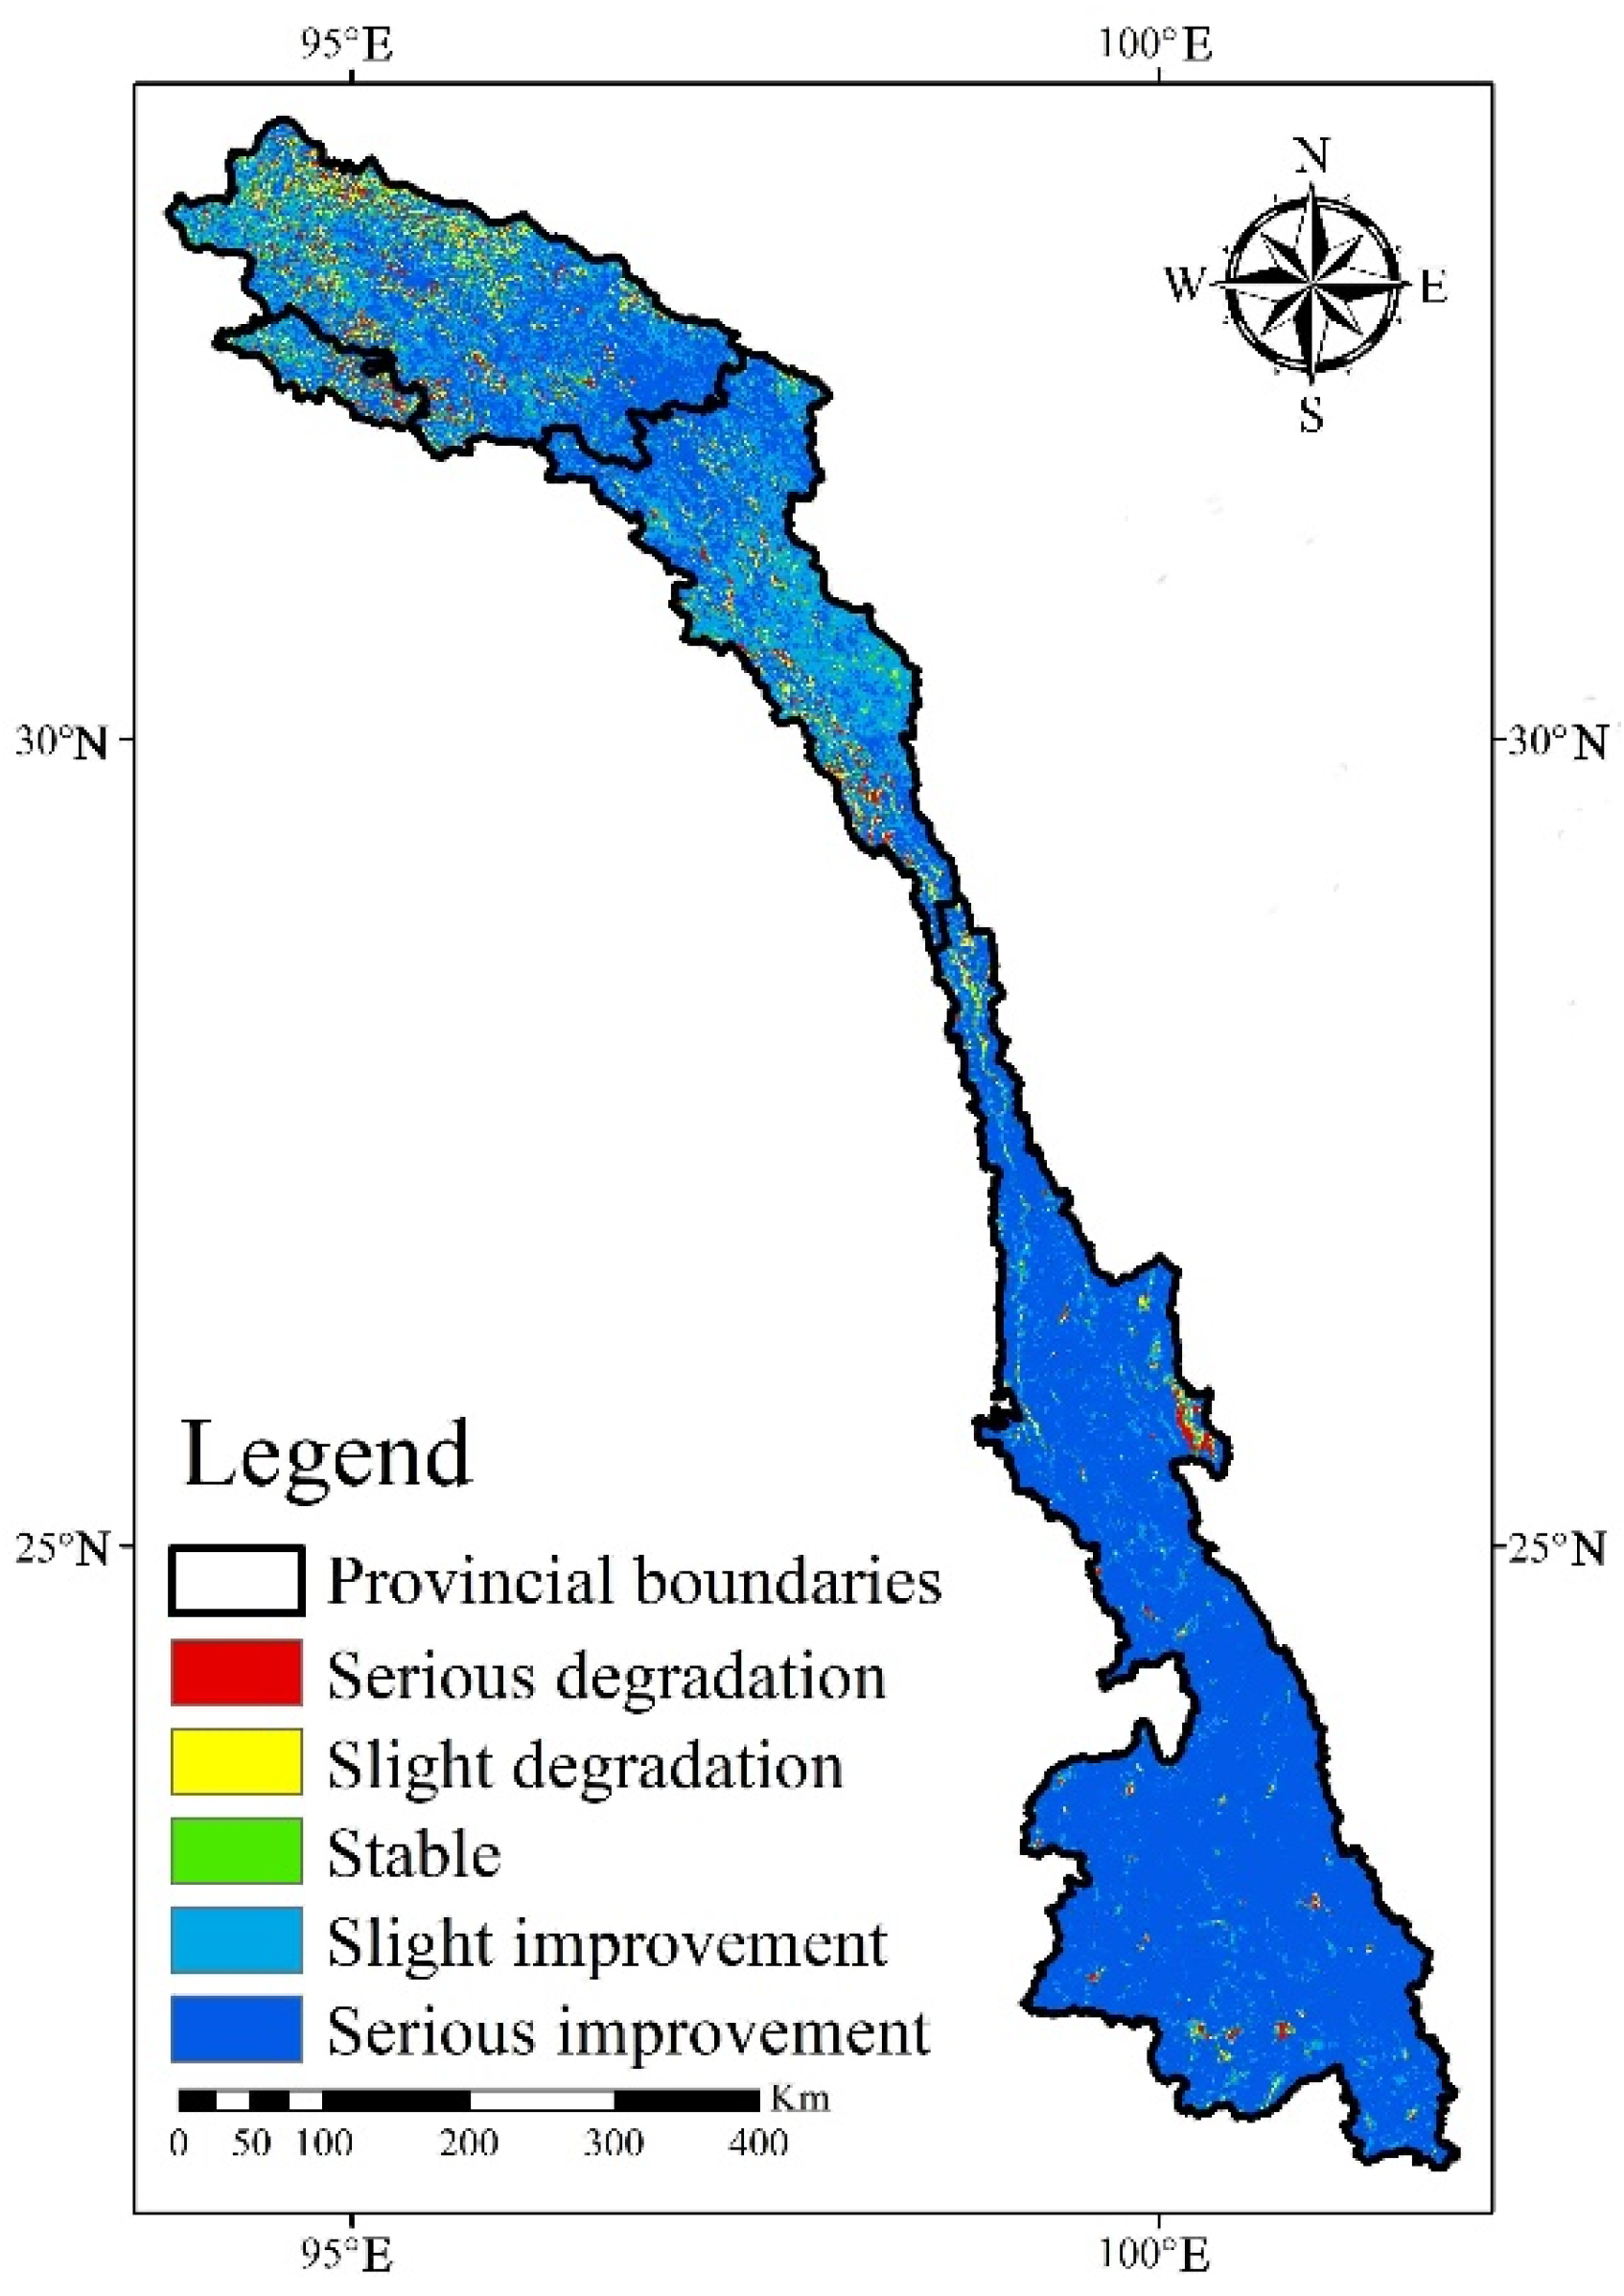
The spatial variation in the NDVI is shown in Figure 3. Overall, 27.58% of the area did not pass the significance test, indicating that 44,869 km2 of the landscape vegetation did not change significantly and was in a stable state. In contrast, 72.42% of the area passed the significance test, indicating that 117,808 km2 of the landscape vegetation improved significantly. The changes in the NDVI are shown in Table 1, 2.52% of the NDVI was in severe degradation, 3.87% in slight degradation, 2.76% in stable and unchanged, 20.95% in the slight improvement, and 60.90% in significant improvement. In the significantly changed vegetation areas, about 96.52% of the NDVI is significantly increased and in a recovered state, and about 3.48% of the vegetation is significantly reduced and in a degraded state.
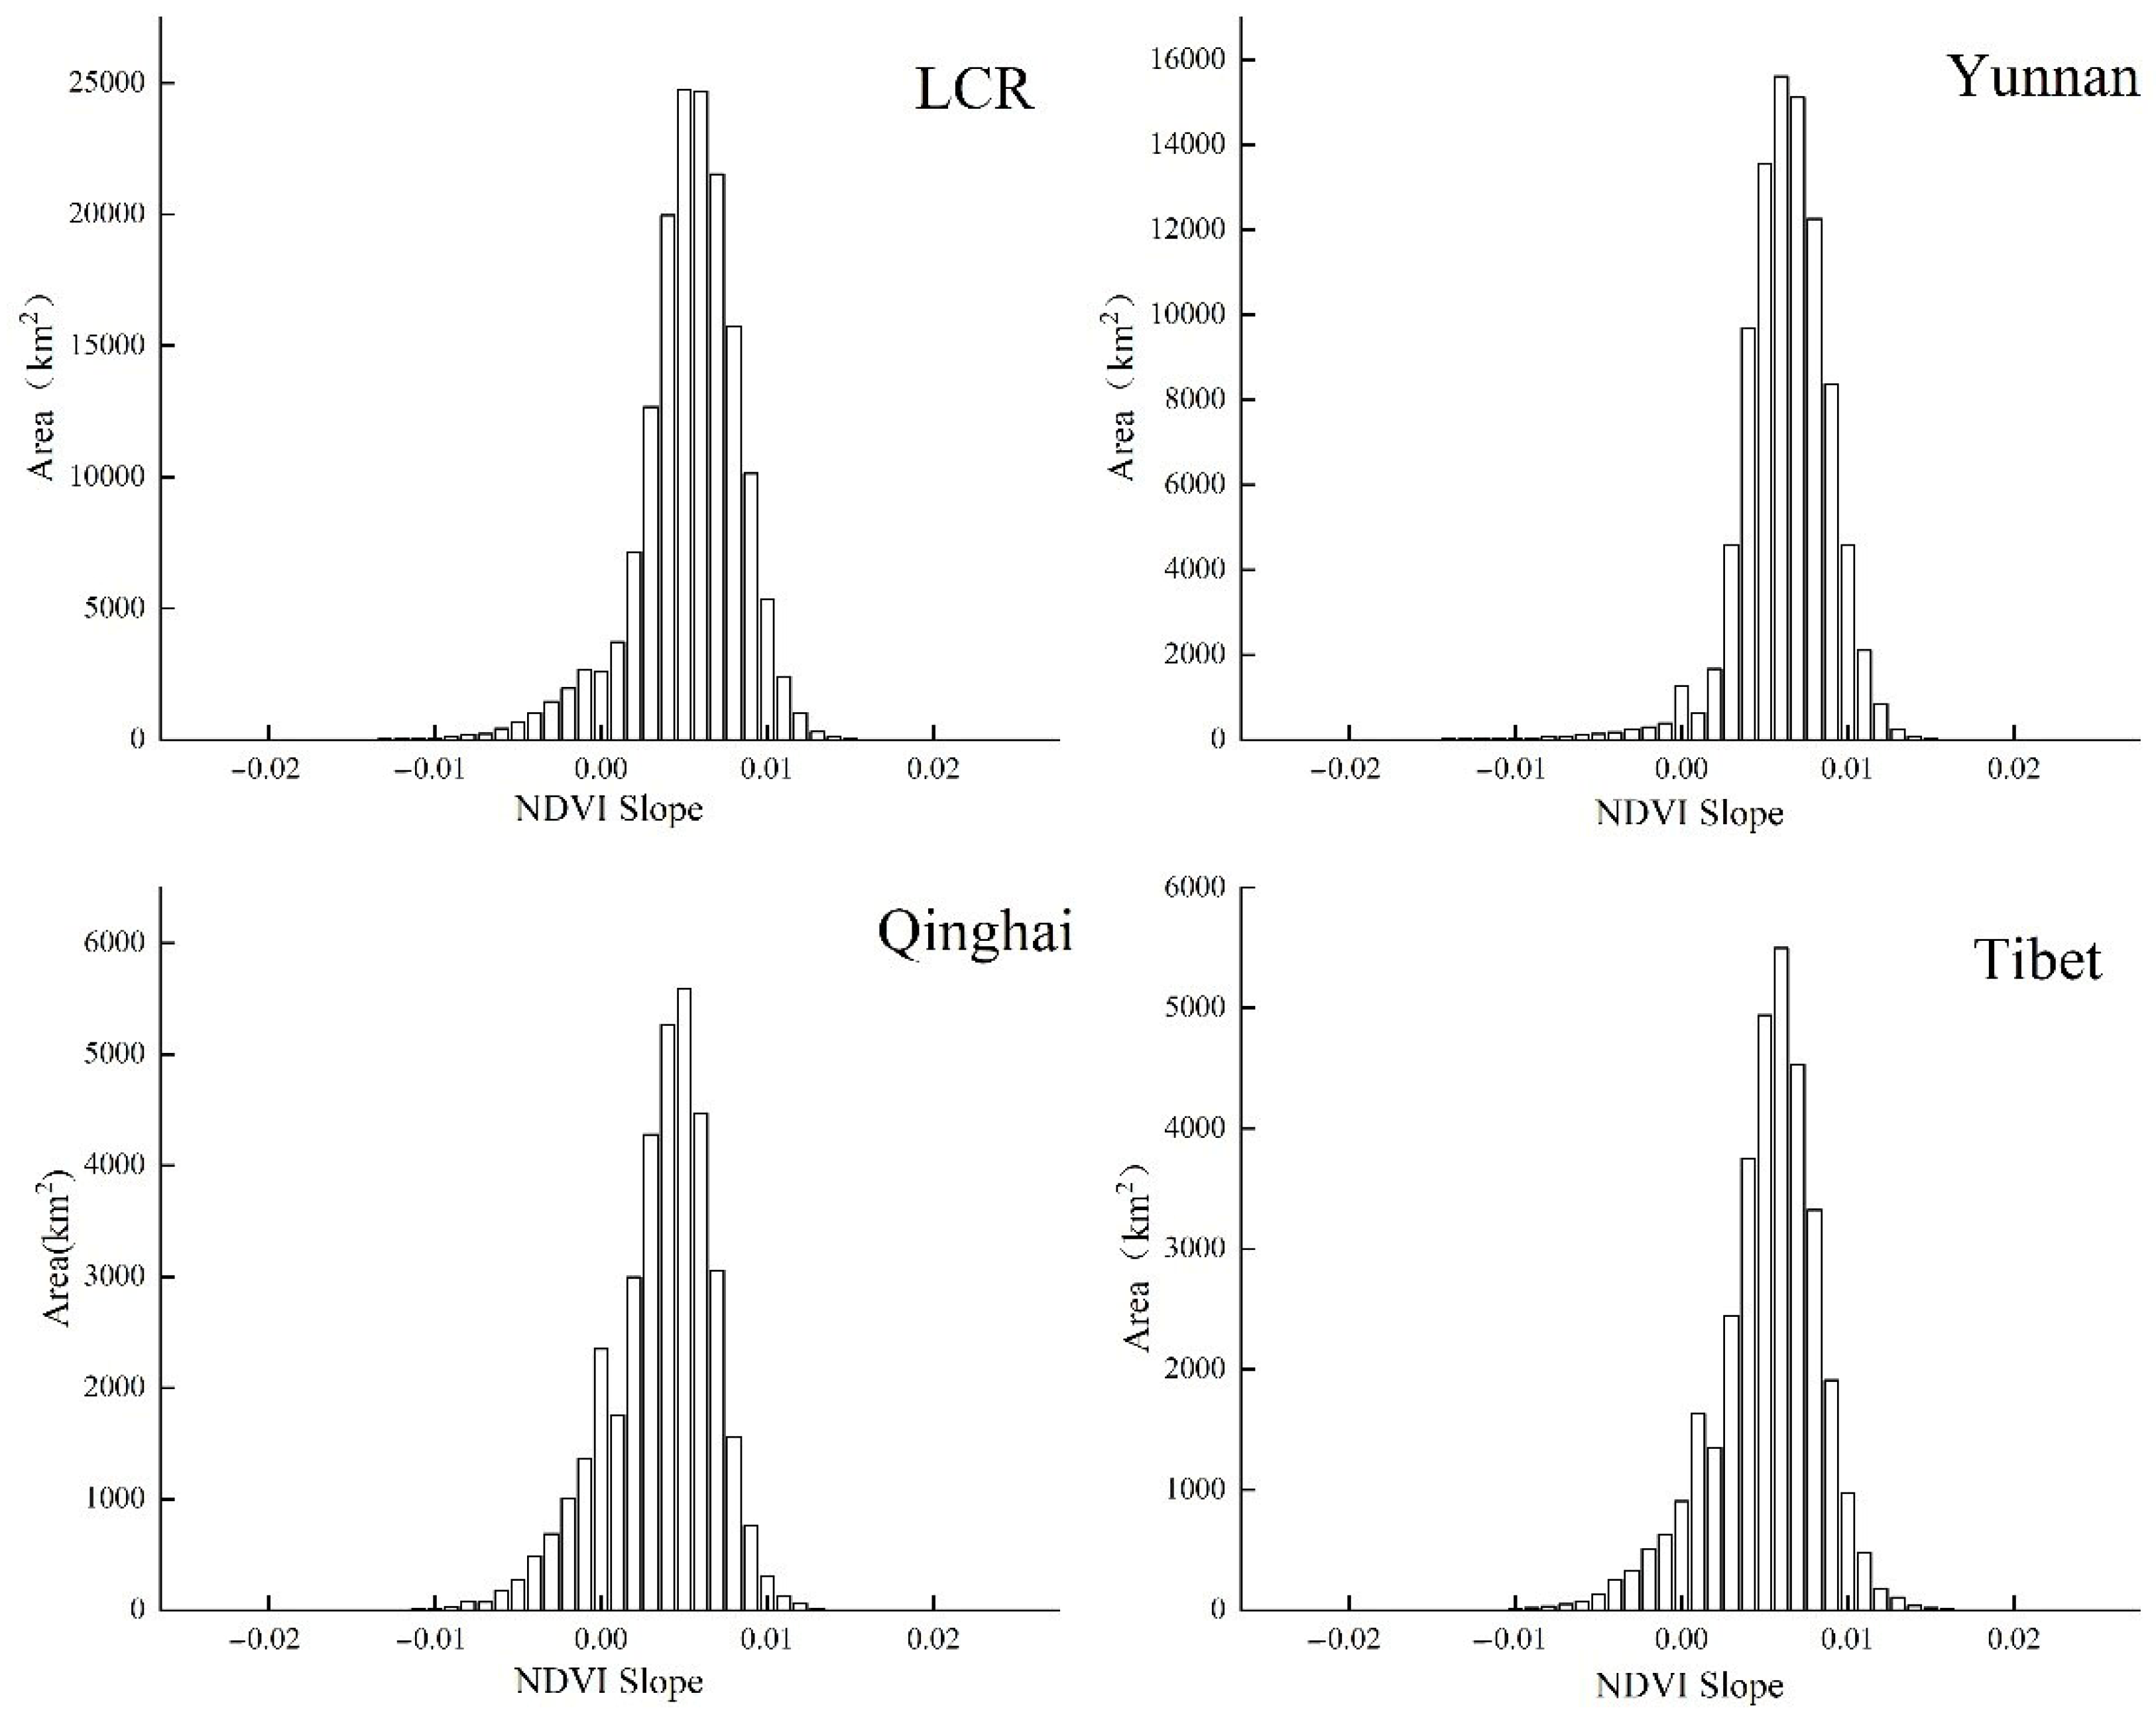
The changes in the NDVI show typical spatial heterogeneity as shown in Figure 3. The Qinghai, Tibet, and Yunnan sections accounted for 52.2%, 28.26%, and 19.54% of the NDVI degradation in the whole study area, respectively. In the Qinghai, Tibet, and Yunnan sections, the decreased area of the NDVI is 11.44%, 6%, and 1.9%, respectively. The mean elevation of the Lancang River Basin, Qinghai section, Tibet section, and Yunnan section is 3022, 4593, 4385, and 1797 m, respectively. In general, the improvement in NDVI in low-altitude areas was large, while the improvement in NDVI in altitude high-altitude areas was small as shown in the Figure 4.
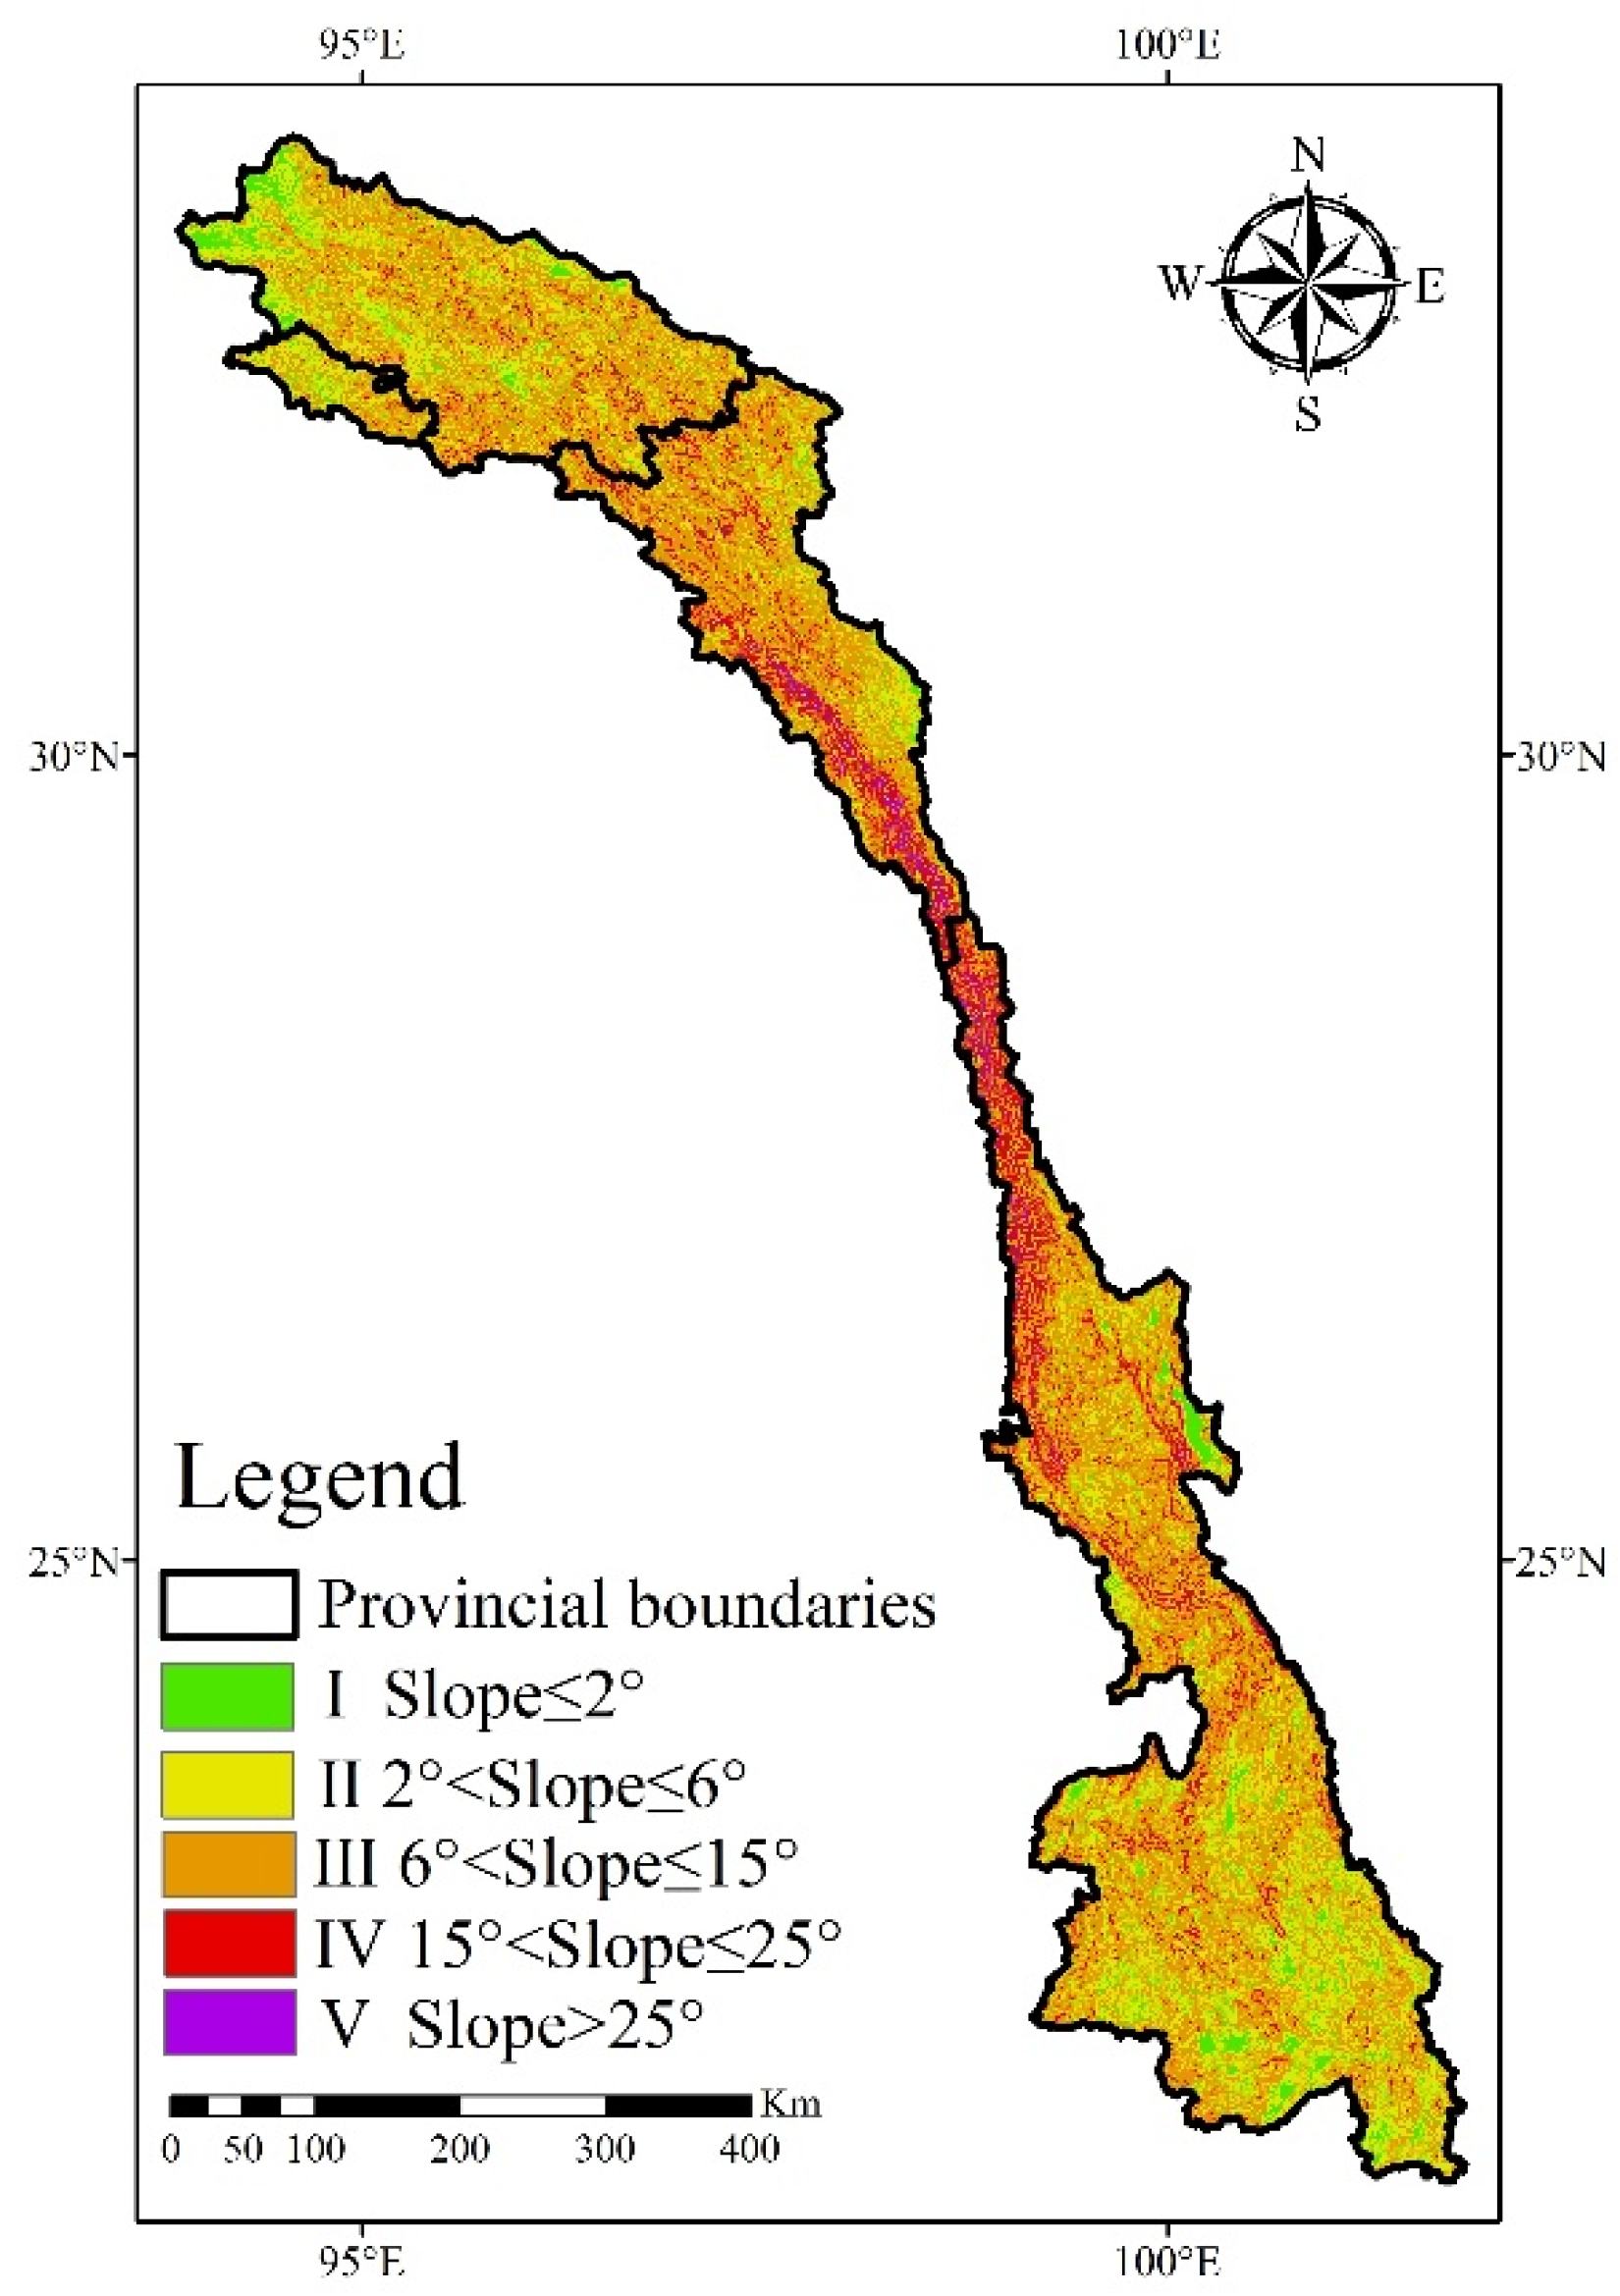
In this paper, the slope of the study area was divided into five classes, the distribution of slope in the study area is shown in Figure 5. The main slopes are II and III, accounting for 80.99% of the whole area. The Yunnan section has the most complex terrain, and more than 50% of all slope grades are in the Yunnan section. The relationship between the NDVI change and the slope is shown in Table 2. There were many NDVI improvement areas in each slope class, and the proportion from I to V was 86.52%, 91.62%, 91.69%, 90.66%, and 88.23%, respectively. However, the proportion of the degraded area is 9.52%, 5.64%, 5.94%, 6.93%, and 8.59%, respectively. Generally speaking, the land in slope II and III is more suitable for vegetation growth, while the land in slope I and V shows more vegetation degradation.
3.2. Temporal and Spatial Trends in Precipitation and Temperature
The spatial distribution of annual average precipitation and air temperature in the study area is shown in Figure 6. The annual average precipitation in the Lancang River Basin is 1043.4 ± 82 mm, among which the annual average precipitation in Qinghai, Tibet, and Yunnan are 650.9 ± 75.4, 674.9 ± 79.5, and 1341.9 ± 133.7 mm, respectively. The precipitation shows a spatial trend of increasing from north to south, and with the increase in altitude, the difference in annual average precipitation gradually decreases, and the fluctuation in standard deviation is small. The M–K test of precipitation shows that the average annual precipitation in the Lancang River Basin suddenly changed in 2003. The precipitation from 2001 to 2003 and 2004 to 2006 decreased slightly, but the precipitation from 2003 to 2004 suddenly increased. The average annual temperature of the Lancang River Basin is 8.4 ± 0.3 °C, among which the average annual temperatures in the Qinghai, Tibet, and Yunnan sections are −3.1 ± 0.27, −0.4 ± 0.35 and 16.9 ± 0.37 °C, respectively. The M–K test of temperature shows that the annual average temperature in the Lancang River Basin suddenly changed in 2004, 2006, 2009, and 2011. According to the trend line of the annual average temperature in the Lancang River Basin, it was found that it fluctuated violently from 2004 to 2011. With the increase in altitude, the annual average temperature appears to fluctuate. In Qinghai and Tibet at high altitudes, there is a large difference in standard deviation, and the average temperature difference is nearly 3 °C.
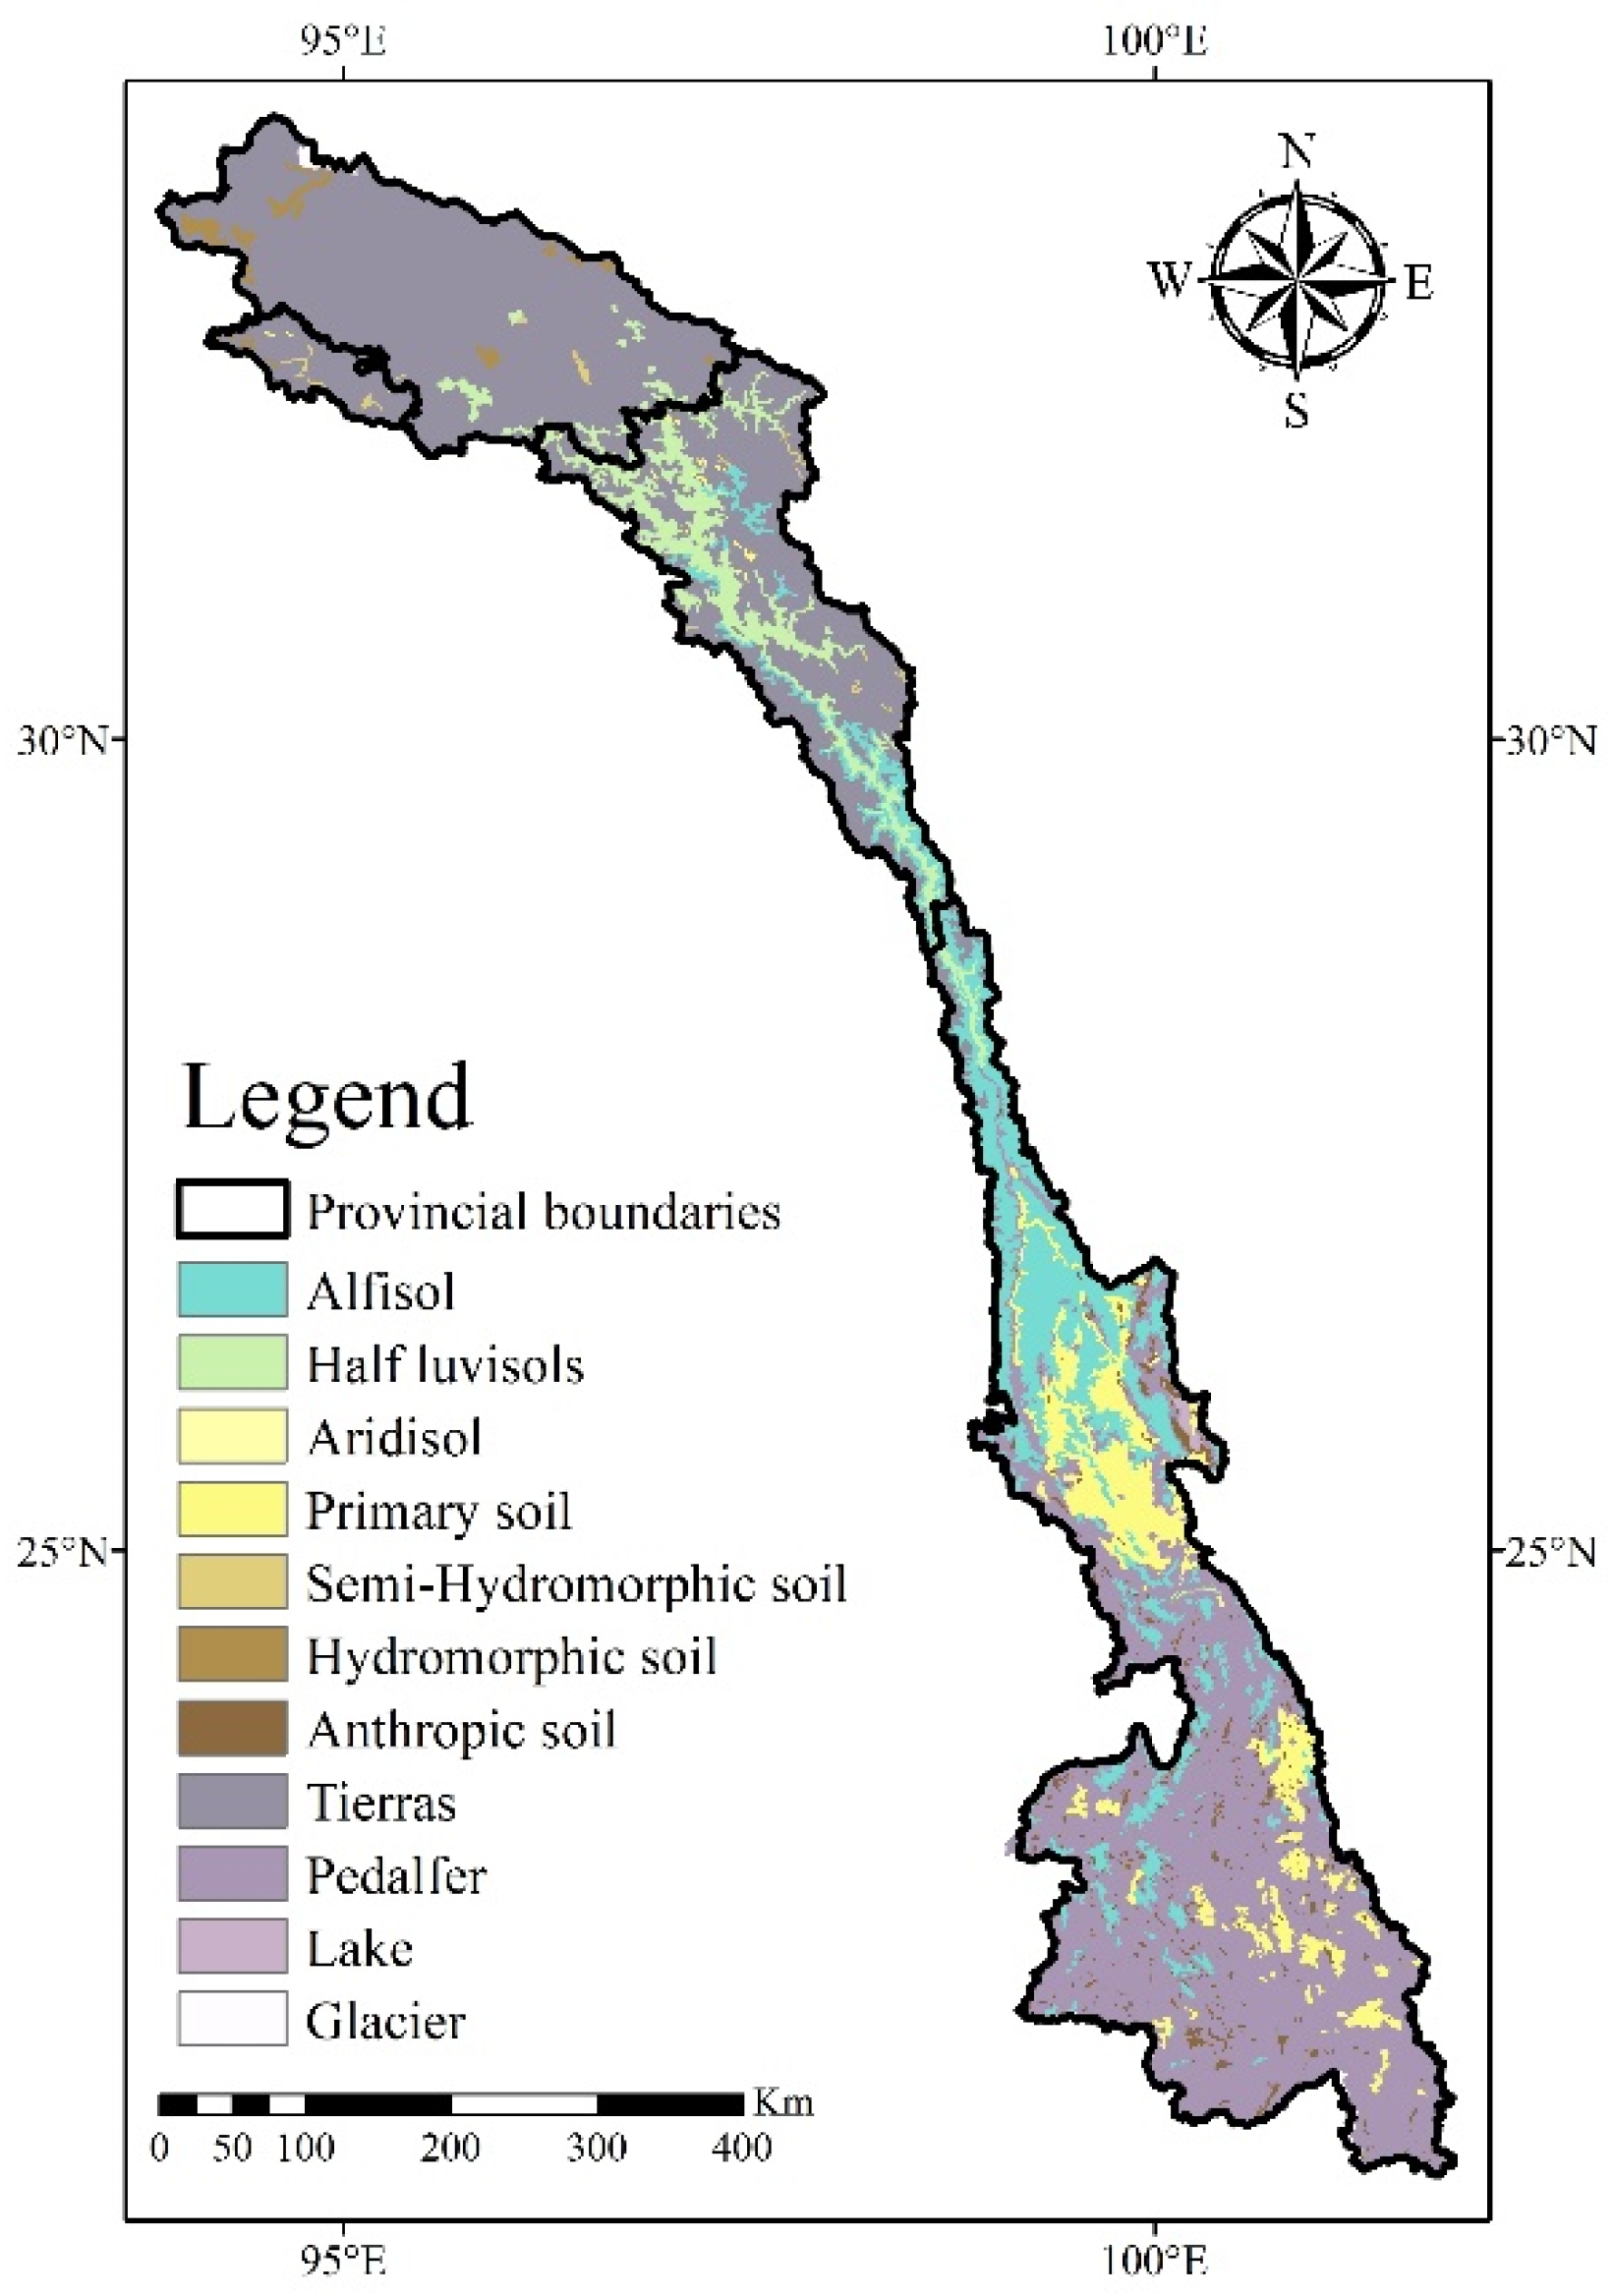
3.3. The Change Trends of NDVI under Different Soil Types
The distribution of each soil type in the study area is shown in Figure 7. Alpine soils and ferroaluminum soils are the main soil types in the study area (Table 3), with a total of 70.56% of the two soils, followed by lacustrine soils with 13.41%. The Tibet and Qinghai sections are mainly alpine soils, while the Yunnan section is mainly ferroaluminum and lacustrine soils. Among the soil types, ferroaluminum soils, incipient soils, and lacustrine soils are particularly suitable for vegetation growth, with 98.38%, 98.23%, and 97.99% of their NDVI areas improving, respectively, and 92.67% of the ferroaluminum soils improving significantly. The three soil types, anthropogenic soils, alpine soils, and hydromorphic soils, all have degraded vegetation areas of more than 10%, with 17.7%, 13%, and 12.09% degradation, respectively, with hydromorphic soils being negligible, as they only occupy 0.87% of the study area and may be affected by anthropogenic disturbance.
4. Discussion
4.1. Influence of Precipitation and Temperature on NDVI
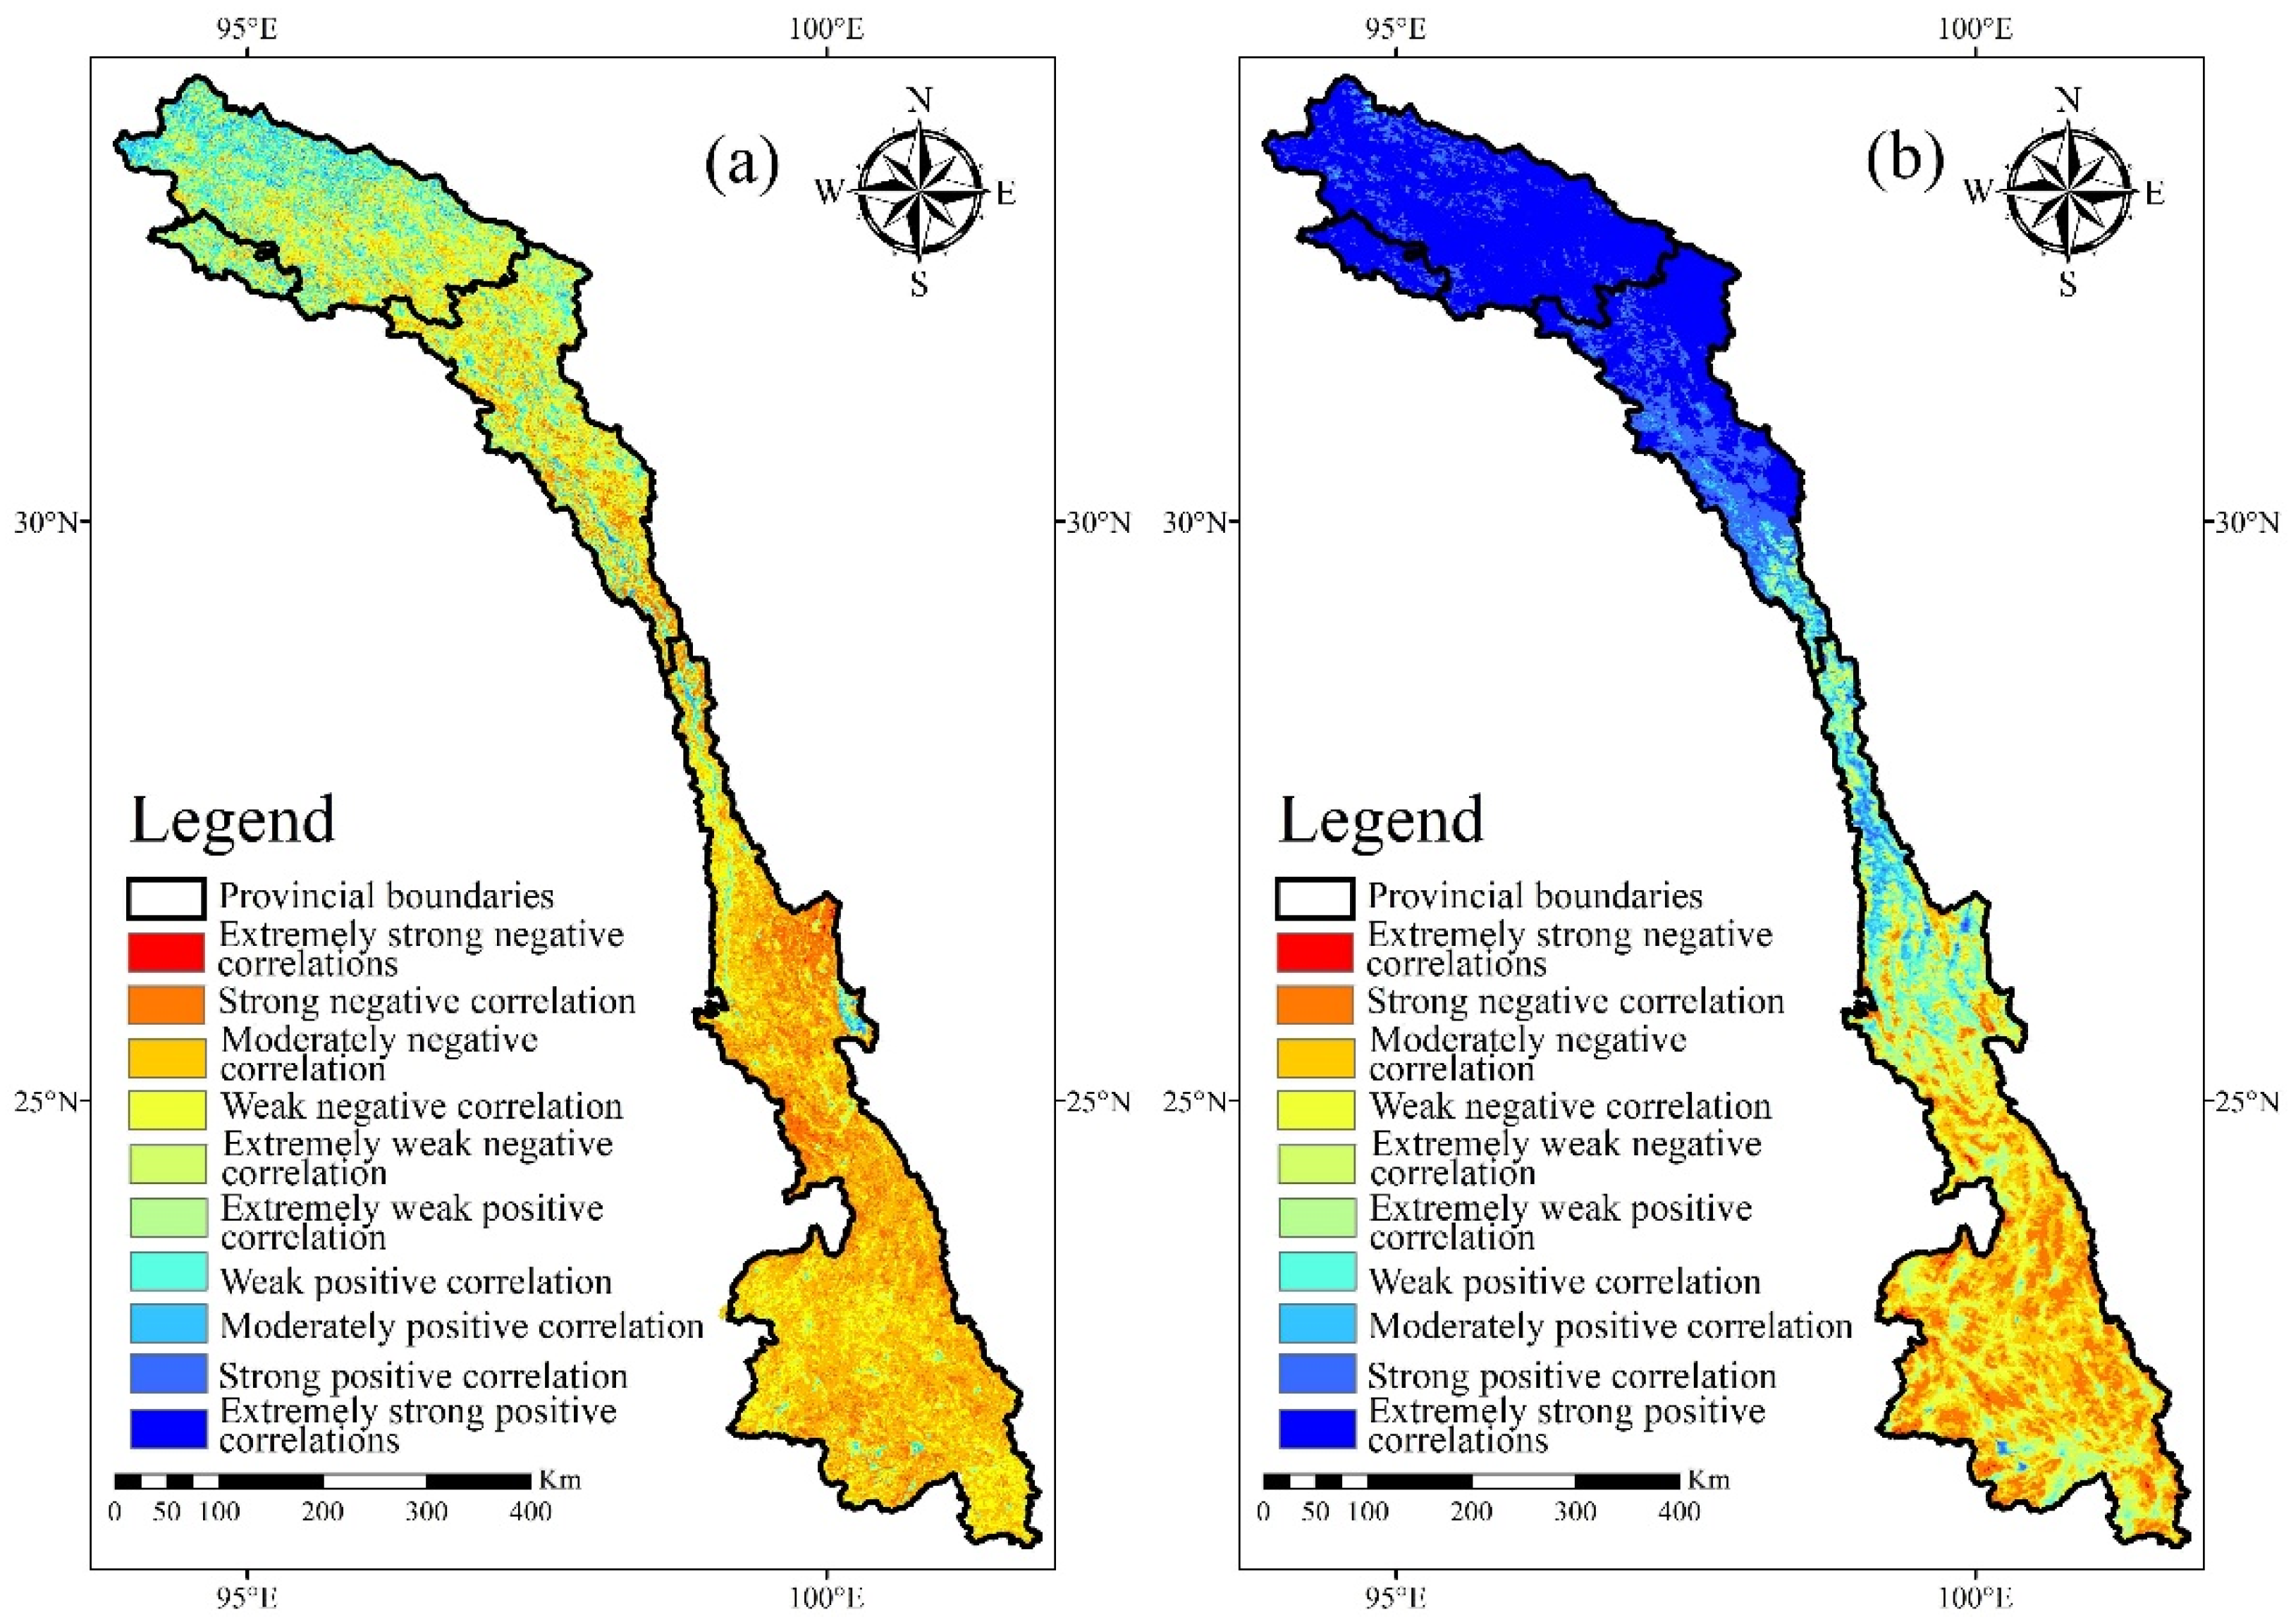
The Pearson correlation coefficient distribution of the NDVI with annual precipitation is shown in Figure 8. Overall, 85% of the regions passed the significance test (α = 0.05). The correlations between precipitation and the NDVI were mainly negative in the Lancang River Basin, the proportion of extremely strong, strong, moderately, weak, and extremely weak negative is 0.16%, 10.77%, 34.91%, 23.28%, and 12.65%, respectively. There are extremely weak negative correlations between precipitation and the NDVI in Qinghai, and there are weak negative correlations in the Tibet and Yunnan sections [30]. The correlations between temperature and the NDVI were mainly positive in the Lancang River Basin, the proportion of extremely strong, strong, moderately, weak, and extreme weak positive is 32.00%, 9.76%, 3.58%, 4.69%, and 8.52%, respectively. The positive correlations between the Qinghai and Tibet sections are only 99.99% and 99.42%, respectively. The correlations between temperature and the NDVI in the Qinghai, Tibet, and Yunnan sections were extremely strong positive, extremely strong positive, and extreme weak negative, respectively [31].
Due to the high altitude and cold climate in the Qinghai and Tibet sections, precipitation is mainly in the form of snow [32], so there is a negative correlation between precipitation and the NDVI in a large area. The growth of vegetation is greatly limited by temperature, and the rise of temperature can obtain a strong response of vegetation [33], showing a strong positive correlation [34,35].
4.2. Influence of Climatic Topography on NDVI
Five parameters such as the slope of the NDVI, precipitation, temperature, elevation, and slope were analyzed using GWR, and the Moran index was obtained to determine whether their relationships were stable in space [36]. As shown in the Table 4, all the Moran indexes except the slope are greater than 0.7, indicating that the other four parameters are spatially well autocorrelated. Moreover, the z-value of each coefficient is much greater than 2.58, indicating that the resulting Moran index is statistically significant at α = 0.01. In summary, GWR can comprehensively show the quantitative impact of each parameter and its dynamics in different regions [37]. However, the analysis of related factors does not directly prove that they have a causal relationship, but can only be used as a reference, and their specific causes have to be examined in the field.
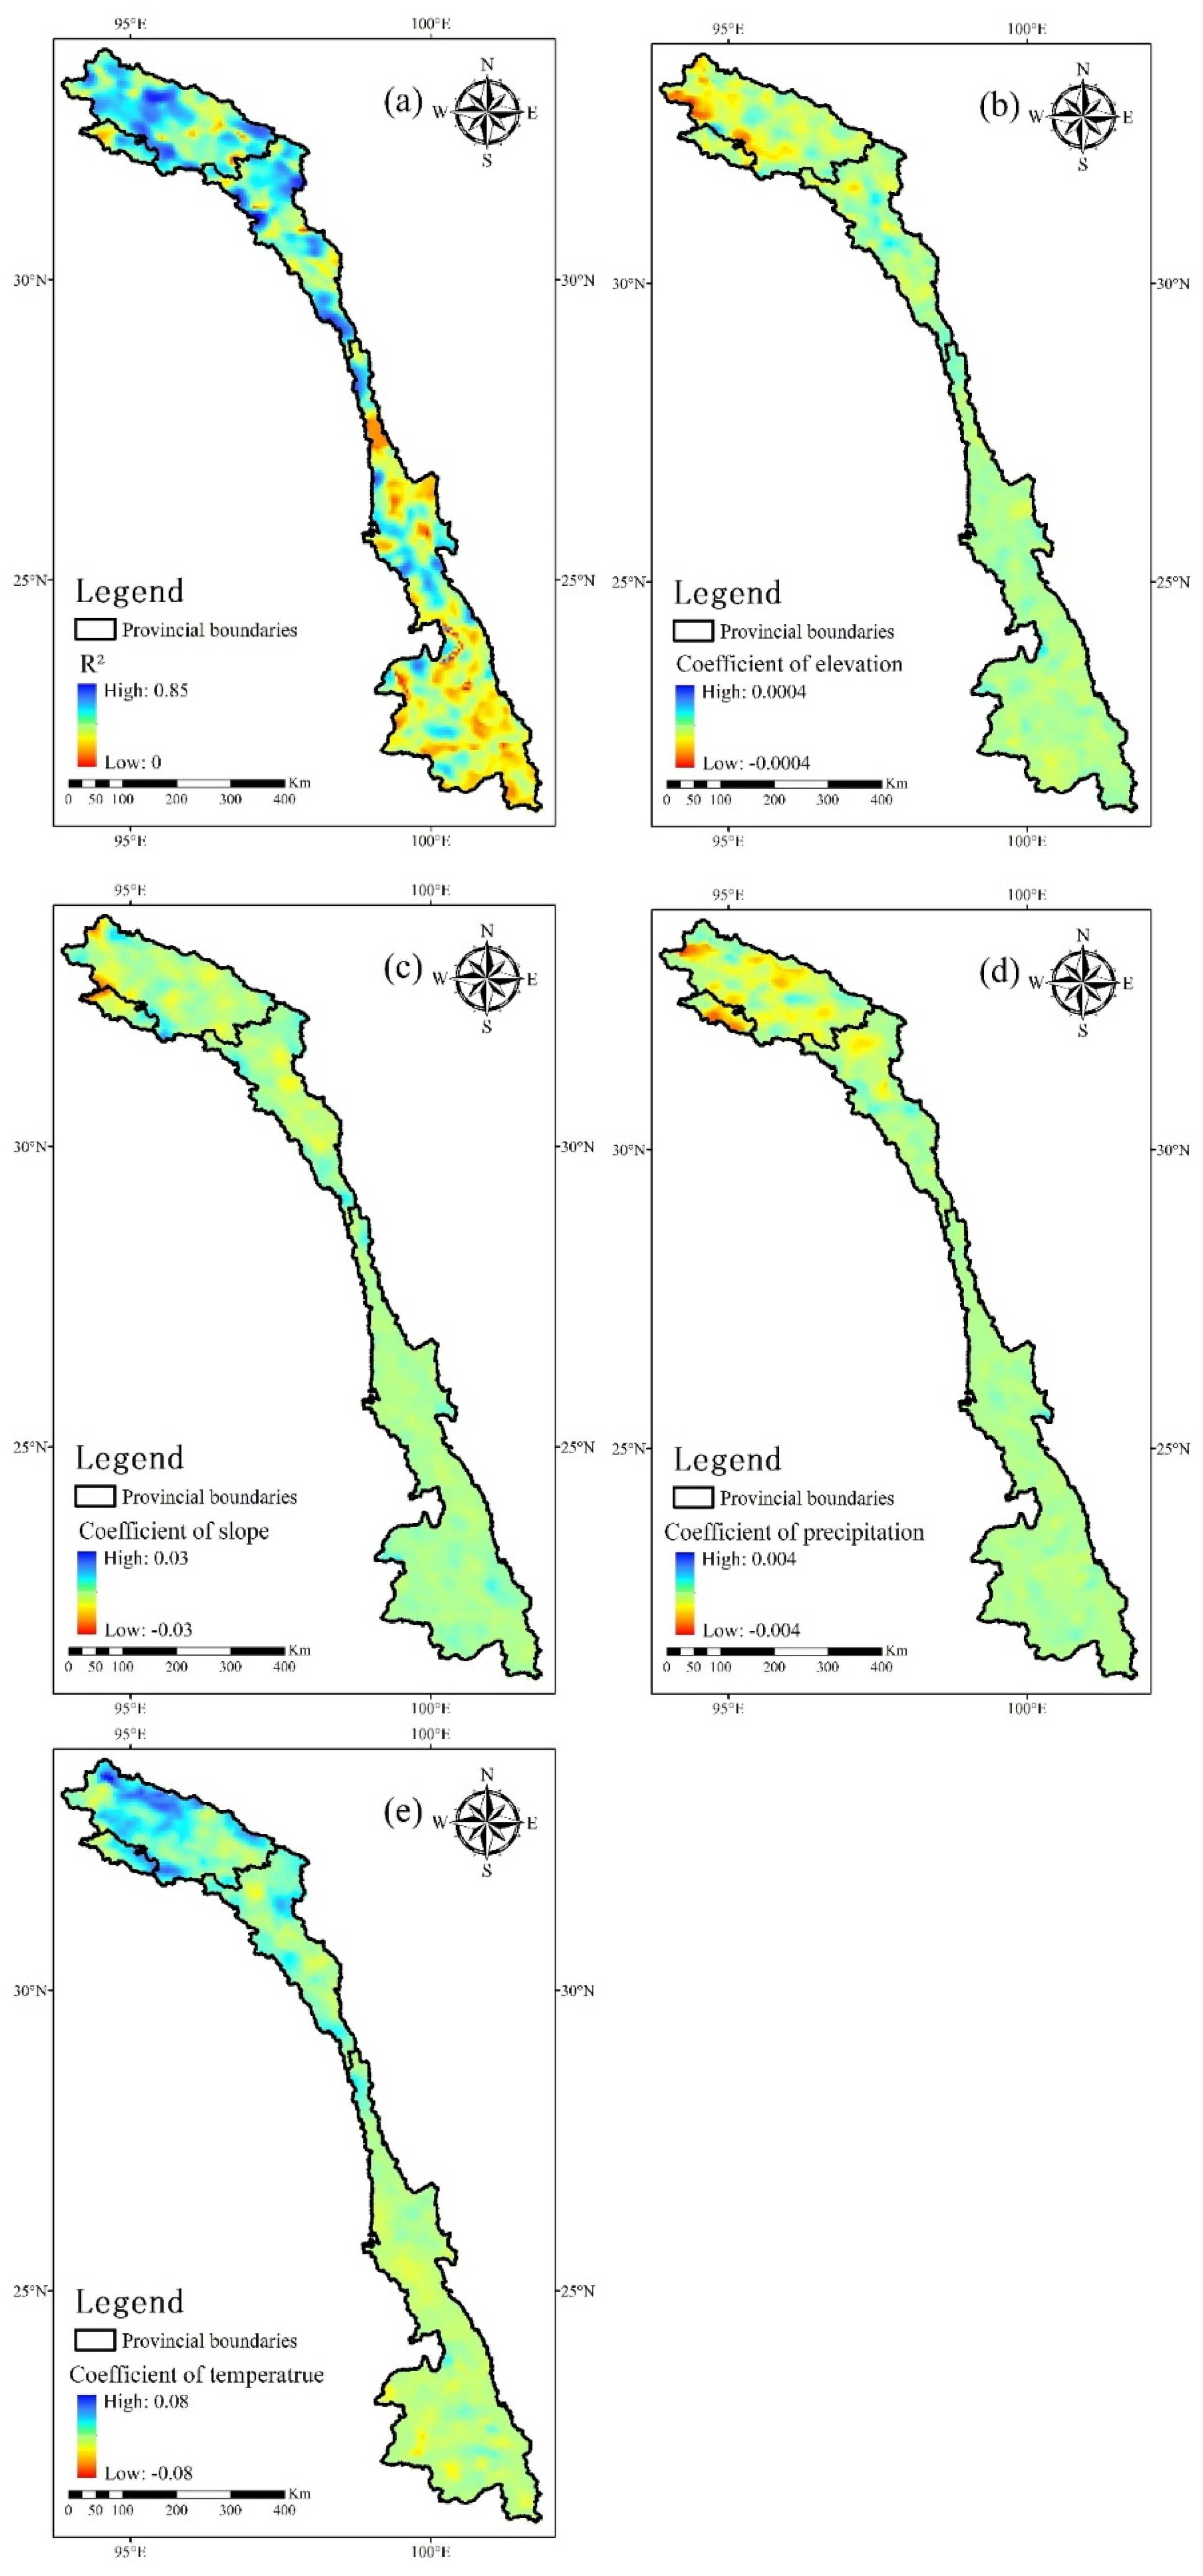
As shown in Figure 9a, the R2 of the model ranges from 0.85 to 0.11 and shows a decreasing trend from north to south. The R2 value of the Qinghai, Tibet, and Yunnan sections is 0.54, 0.51, and 0.37, respectively. This indicates that the spatial autocorrelation between these parameters is high in the northern part of the study area, which is the Qinghai and Tibet sections, and the spatial autocorrelation is low in the southern Yunnan section. This is mainly because the NDVI of vegetation in southern Yunnan is already high and close to 1 [38]. However, the changes in precipitation, temperature, altitude, and slope in southern Yunnan will not change the NDVI too much, resulting in a weak spatial correlation. However, the vegetation in the north of the study area has a large growth space and responds more strongly to the influencing factors [39].
The GWR correlation coefficient between elevation and the NDVI is shown in Figure 9b. The altitude span of the study area is large, decreasing from north to south, and the terrain is complex. The NDVI of the Qinghai and Tibet sections was more strongly influenced by elevation, and these effects were mainly negatively correlated. The air at high altitudes is thinner, and the amount of carbon dioxide and oxygen is less. The decrease in photosynthesis and respiration of vegetation makes the growth of vegetation slow or even negative. However, the NDVI of most areas in the southern Yunnan section was less affected by elevation change. The average altitude of the Yunnan section is about 1800 m, and the average coefficient of elevation is 4 × 10⁻⁶. This indicates that the NDVI increases by 4 × 10⁻⁶ for every 1 m rise in the altitude of the Yunnan section, and the influence of elevation change is almost negligible. However, the influence will decrease after reaching the threshold of 4000 m.
The GWR correlation coefficient between slope and the NDVI is shown in Figure 9c. The results shown in the figure are roughly the same as those for the elevation correlation. In the northern part of the study area, there is a strong correlation between the Qinghai and Tibet sections with a speckle distribution. There is a scattered positive correlation in the Yunnan section in the south, which indicates that increasing the slope appropriately is helpful to the growth of landscape vegetation. This is consistent with the analysis results in 3.1. The average slope of the Yunnan section is 8.6°, and it is also found that the NDVI improved more significantly when the slope was at class III (6–15°).
The GWR correlation coefficient between precipitation and the NDVI is shown in Figure 9d. The strong influence of precipitation on the NDVI was mainly distributed in the northern Qinghai and Tibet sections, and most of them were negatively correlated, while the southern Yunnan section had a slight positive influence. In Qinghai and Tibet, the temperature is low, the altitude is high, and most of the precipitation occurs as snow. In this case, precipitation has some negative effects on the growth of vegetation [40].
The GWR correlation coefficient between temperature and the NDVI is shown in Figure 9e. In the northern part of the study area, the influence of temperature on the NDVI showed many positive correlations, while in the southern part of the Yunnan section, there were some negative correlations. The average temperature coefficient in the Qinghai, Tibet, and Yunnan sections is 2.08 × 10⁻², 9.8 × 10⁻³, and −2.67 × 10⁻⁴, respectively. The temperature of the Qinghai section and Tibet section was lower (Figure 6), and the increase in temperature had a positive effect on the growth of vegetation. However, most of the Yunnan section is located in subtropical and tropical climates, where the temperature is very suitable for vegetation growth, and the vegetation is already very lush. Under such conditions, the increase in temperature will reduce the vegetation.
5. Conclusions
Spatial and temporal vegetation dynamics are critical to environmental quality, and climate and terrain factors have significant effects on vegetation dynamics. This paper uses remote sensing data combined with meteorological and terrain data to analyze the variation of NDVI in the Lancang River Basin. Firstly, the NDVI of the study area showed a significant increasing trend from 1998 to 2020, with 6.39% of the area being degraded and 90.85% of the area being increased in space. Secondly, the soil types which are suitable for vegetation growth are Fe–Al soil, incipient soil, and leaching soil. Thirdly, in a Pearson correlation analysis, precipitation was mainly negatively correlated with the NDVI, while temperature was mainly positively correlated with the NDVI, especially in Qinghai and Tibet. Finally, the GWR model shows that elevation and precipitation have similar effects on the NDVI, but climate factors and topographic factors have opposite effects on the NDVI. The Qinghai and Tibet sections were more strongly influenced by climate factors.
Author Contributions
Conceptualization, Y.C. and Y.W.; writing—original draft preparation and methodology, Y.C. and Z.Y.; formal analysis, Y.L., J.F. and M.S. All authors have read and agreed to the published version of the manuscript.
Funding
This research was financially supported by the National Natural Science Foundation of China (U1802241, U204021, 920472045 and 52209013) and Open Research Fund of State Key Laboratory of Simulation and Regulation of Water Cycle in River Basin, China Institute of Water Resources and Hydropower Research, (Grant NO. IWHR-SKL-202214).
Informed Consent Statement
Not applicable.
Data Availability Statement
Not applicable.
Conflicts of Interest
The authors declare no conflict of interest.
References
- Watson, J.E.M.; Iwamura, T.; Butt, N. Mapping vulnerability and conservation adaptation strategies under climate change. Nat. Clim. Chang. 2013, 3, 989–994. [Google Scholar] [CrossRef]
- Gu, Z.; Duan, X.; Shi, Y.; Li, Y.; Pan, X. Spatiotemporal variation in vegetation coverage and its response to climatic factors in the Red River Basin, China. Ecol. Indic. 2018, 93, 54–64. [Google Scholar] [CrossRef]
- Kipling, R.P.; Virkajarvi, P.; Breitsameter, L.; Curnel, Y.; De Swaef, T.; Gustavsson, A.M.; Hennart, S.; Hoglind, M.; Jarvenranta, K.; Minet, J.; et al. Key challenges and priorities for modelling European grasslands under climate change. Sci. Total Environ. 2016, 566–567, 851–864. [Google Scholar] [CrossRef] [PubMed] [Green Version]
- Crichton, K.A.; Anderson, K.; Charman, D.J.; Gallego-Sala, A. Seasonal climate drivers of peak NDVI in a series of Arctic peatlands. Sci. Total Environ. 2022, 838, 156419. [Google Scholar] [CrossRef] [PubMed]
- Liu, Q.; Liu, L.; Zhang, Y.; Wang, Z.; Wu, J.; Li, L.; Li, S.; Paudel, B. Identification of impact factors for differentiated patterns of NDVI change in the headwater source region of Brahmaputra and Indus, Southwestern Tibetan Plateau. Ecol. Indic. 2021, 125, 107604. [Google Scholar] [CrossRef]
- Wu, T.; Ma, W.; Wu, X.; Li, R.; Qiao, Y.; Li, X.; Yue, G.; Zhu, X.; Ni, J. Weakening of carbon sink on the Qinghai–Tibet Plateau. Geoderma 2022, 412, 115707. [Google Scholar] [CrossRef]
- Hossain, M.L.; Li, J. NDVI-based vegetation dynamics and its resistance and resilience to different intensities of climatic events. Glob. Ecol. Conserv. 2021, 30, e01768. [Google Scholar] [CrossRef]
- Catorci, A.; Lulli, R.; Malatesta, L.; Tavoloni, M.; Tardella, F.M. How the interplay between management and interannual climatic variability influences the NDVI variation in a sub-Mediterranean pastoral system: Insight into sustainable grassland use under climate change. Agric. Ecosyst. Environ. 2021, 314, 107372. [Google Scholar] [CrossRef]
- Shi, Y.; Jin, N.; Ma, X.; Wu, B.; He, Q.; Yue, C.; Yu, Q. Attribution of climate and human activities to vegetation change in China using machine learning techniques. Agric. For. Meteorol. 2020, 294, 108146. [Google Scholar] [CrossRef]
- Piedallu, C.; Cheret, V.; Denux, J.P.; Perez, V.; Azcona, J.S.; Seynave, I.; Gegout, J.C. Soil and climate differently impact NDVI patterns according to the season and the stand type. Sci. Total Environ. 2019, 651, 2874–2885. [Google Scholar] [CrossRef]
- Michaletz, S.T.; Cheng, D.; Kerkhoff, A.J.; Enquist, B.J. Convergence of terrestrial plant production across global climate gradients. Nature 2014, 512, 39–43. [Google Scholar] [CrossRef] [PubMed]
- Jiao, K.-W.; Gao, J.-B.; Liu, Z.-H.; Wu, S.-H.; Fletcher, T.L. Revealing climatic impacts on the temporal and spatial variation in vegetation activity across China: Sensitivity and contribution. Adv. Clim. Chang. Res. 2021, 12, 409–420. [Google Scholar] [CrossRef]
- Yuan, J.; Bian, Z.; Yan, Q.; Gu, Z.; Yu, H. An Approach to the Temporal and Spatial Characteristics of Vegetation in the Growing Season in Western China. Remote Sens. 2020, 12, 945. [Google Scholar] [CrossRef] [Green Version]
- He, P.; Xu, L.; Liu, Z.; Jing, Y.; Zhu, W. Dynamics of NDVI and its influencing factors in the Chinese Loess Plateau during 2002–2018. Reg. Sustain. 2021, 2, 36–46. [Google Scholar] [CrossRef]
- Dong, Z.; Liu, H.; Baiyinbaoligao; Hu, H.; Khan, M.Y.A.; Wen, J.; Chen, L.; Tian, F. Future projection of seasonal drought characteristics using CMIP6 in the Lancang-Mekong River Basin. J. Hydrol. 2022, 610, 127815. [Google Scholar] [CrossRef]
- Bibi, S.; Song, Q.; Zhang, Y.; Liu, Y.; Kamran, M.A.; Sha, L.; Zhou, W.; Wang, S.; Gnanamoorthy, P. Effects of climate change on terrestrial water storage and basin discharge in the lancang River Basin. J. Hydrol. Reg. Stud. 2021, 37, 100896. [Google Scholar] [CrossRef]
- Shu, G.; Yuan, X. Study on remote sensing monitoring forest cover by ndvi technique in mountain area of lancang river basin. Sci. Silvae Sin. 2001, 37, 134–136. [Google Scholar]
- Ouyang, W.; Wan, X.; Xu, Y.; Wang, X.; Lin, C. Vertical difference of climate change impacts on vegetation at temporal-spatial scales in the upper stream of the Mekong River Basin. Sci. Total Environ. 2020, 701, 134782. [Google Scholar] [CrossRef]
- Li, S.; Yu, D.; Huang, T.; Hao, R. Identifying priority conservation areas based on comprehensive consideration of biodiversity and ecosystem services in the Three-River Headwaters Region, China. J. Clean. Prod. 2022, 359, 132082. [Google Scholar] [CrossRef]
- Cheng, Y.; Zhao, F.; Wu, J.; Gao, P.; Wang, Y.; Wang, J. Migration characteristics of arsenic in sediments under the influence of cascade reservoirs in Lancang River basin. J. Hydrol. 2022, 606, 127424. [Google Scholar] [CrossRef]
- Cheng, Y.; Chen, C.; Hu, M.; Wang, Y. The Impact of Cascade Large Deep Reservoir on the Migration and Deposition of Cadmium in Lancang River. Sustainability 2021, 13, 11137. [Google Scholar] [CrossRef]
- Chuenchum, P.; Xu, M.; Tang, W. Predicted trends of soil erosion and sediment yield from future land use and climate change scenarios in the Lancang–Mekong River by using the modified RUSLE model. Int. Soil Water Conserv. Res. 2020, 8, 213–227. [Google Scholar] [CrossRef]
- Gao, Y.; Huang, J.; Li, S.; Li, S. Spatial pattern of non-stationarity and scale-dependent relationships between NDVI and climatic factors—A case study in Qinghai-Tibet Plateau, China. Ecol. Indic. 2012, 20, 170–176. [Google Scholar] [CrossRef]
- Li, J.; Dong, S.; Yang, Z.; Peng, M.; Liu, S.; Li, X. Effects of cascade hydropower dams on the structure and distribution of riparian and upland vegetation along the middle-lower Lancang-Mekong River. For. Ecol. Manag. 2012, 284, 251–259. [Google Scholar] [CrossRef]
- Mann, H.B. Nonparametric Tests Against Trend. Econometrica 1945, 13, 245–259. [Google Scholar] [CrossRef]
- Kendall, M.G. Rank Correlation Methods; Griffin: Oxford, UK, 1948. [Google Scholar]
- Li, J.; Wang, J.; Zhang, J.; Zhang, J.; Kong, H. Dynamic changes of vegetation coverage in China-Myanmar economic corridor over the past 20 years. Int. J. Appl. Earth Obs. Geoinf. 2021, 102, 102378. [Google Scholar] [CrossRef]
- Brunsdon, C.; Fotheringham, A.S.; Charlton, M.E. Geographically Weighted Regression: A Method for Exploring Spatial Nonstationarity. Geogr. Anal. 1996, 28, 281–298. [Google Scholar] [CrossRef]
- Jiao, K.; Gao, J.; Liu, Z. Precipitation Drives the NDVI Distribution on the Tibetan Plateau While High Warming Rates May Intensify Its Ecological Droughts. Remote Sens. 2021, 13, 1305. [Google Scholar] [CrossRef]
- Chen, J.; Wang, Y.; Sun, J.; Liang, E.; Shen, M.; Yang, B.; Jia, X.; Zhang, J. Precipitation dominants synergies and trade-offs among ecosystem services across the Qinghai-Tibet Plateau. Glob. Ecol. Conserv. 2021, 32, e01886. [Google Scholar] [CrossRef]
- Hou, Y.; Zhao, W.; Liu, Y.; Yang, S.; Hu, X.; Cherubini, F. Relationships of multiple landscape services and their influencing factors on the Qinghai–Tibet Plateau. Landsc. Ecol. 2020, 36, 1987–2005. [Google Scholar] [CrossRef]
- Kraaijenbrink, P.D.A.; Bierkens, M.F.P.; Lutz, A.F.; Immerzeel, W.W. Impact of a global temperature rise of 1.5 degrees Celsius on Asia’s glaciers. Nature 2017, 549, 257–260. [Google Scholar] [CrossRef] [PubMed]
- Park, H.; Jeong, S.-J.; Ho, C.-H.; Kim, J.; Brown, M.E.; Schaepman, M.E. Nonlinear response of vegetation green-up to local temperature variations in temperate and boreal forests in the Northern Hemisphere. Remote Sens. Environ. 2015, 165, 100–108. [Google Scholar] [CrossRef]
- Richardson, A.D.; Bailey, A.S.; Denny, E.G.; Martin, C.W.; O’Keefe, J. Phenology of a northern hardwood forest canopy. Glob. Chang. Biol. 2006, 12, 1174–1188. [Google Scholar] [CrossRef] [Green Version]
- Jolly, W.M.; Nemani, R.; Running, S.W. A generalized, bioclimatic index to predict foliar phenology in response to climate. Glob. Chang. Biol. 2005, 11, 619–632. [Google Scholar] [CrossRef]
- Thompson, E.S.; Saveyn, P.; Declercq, M.; Meert, J.; Guida, V.; Eads, C.D.; Robles, E.S.J.; Britton, M.M. Characterisation of heterogeneity and spatial autocorrelation in phase separating mixtures using Moran’s I. J. Colloid Interface Sci. 2018, 513, 180–187. [Google Scholar] [CrossRef]
- Georganos, S.; Abdi, A.M.; Tenenbaum, D.E.; Kalogirou, S. Examining the NDVI-rainfall relationship in the semi-arid Sahel using geographically weighted regression. J. Arid. Environ. 2017, 146, 64–74. [Google Scholar] [CrossRef]
- Ma, Y.; Zuo, L.; Gao, J.; Liu, Q.; Liu, L. The karst NDVI correlation with climate and its BAS-BP prediction based on multiple factors. Ecol. Indic. 2021, 132, 108254. [Google Scholar] [CrossRef]
- Sun, L.; Zhao, D.; Zhang, G.; Wu, X.; Yang, Y.; Wang, Z. Using SPOT VEGETATION for analyzing dynamic changes and influencing factors on vegetation restoration in the Three-River Headwaters Region in the last 20 years (2000–2019), China. Ecol. Eng. 2022, 183, 106742. [Google Scholar] [CrossRef]
- Zhang, S.; Hua, D.; Meng, X.; Zhang, Y. Climate change and its driving effect on the runoff in the “Three-River Headwaters” region. J. Geogr. Sci. 2011, 21, 963–978. [Google Scholar] [CrossRef]
Figure 1.
Study area.

Figure 2.
Change trend of NDVI in the Lancang River Basin from 1998 to 2020.

Figure 3.
Spatial trends of NDVI in the Lancang River Basin.

Figure 4.
The change rate of NDVI in different regions of the Lancang River Basin.

Figure 5.
Land slope in the Lancang River Basin.

Figure 6.
Distribution of annual average precipitation and temperature. (a) Distribution of annual average precipitation and M–K test of precipitation. (b) Distribution of annual average temperature and M–K test of temperature.
Figure 6.
Distribution of annual average precipitation and temperature. (a) Distribution of annual average precipitation and M–K test of precipitation. (b) Distribution of annual average temperature and M–K test of temperature.

Figure 7.
Soil types in the Lancang River Basin.

Figure 8.
Influence of precipitation and temperature on NDVI. (a) Pearson correlation coefficient between NDVI and annual average precipitation, (b) Pearson correlation coefficient between NDVI and monthly average temperature.
Figure 8.
Influence of precipitation and temperature on NDVI. (a) Pearson correlation coefficient between NDVI and annual average precipitation, (b) Pearson correlation coefficient between NDVI and monthly average temperature.

Figure 9.
GWR results in the Lancang River Basin. (a) Local R2 of GWR, (b) coefficients of elevation, (c) coefficients of slope, (d) coefficients of precipitation, and (e) coefficients of temperature.
Figure 9.
GWR results in the Lancang River Basin. (a) Local R2 of GWR, (b) coefficients of elevation, (c) coefficients of slope, (d) coefficients of precipitation, and (e) coefficients of temperature.


Table 1.
The temporal and spatial trend of NDVI in Lancang River Basin.
| Judgment Conditions | Trends | Area (Km2) | Percentage |
|---|---|---|---|
| Slope ≤ −0.0005, |Z| ≥ 1.96 | Severe degradation | 4099 | 2.52% |
| Slope ≤ −0.0005, |Z| < 1.96 | Slightly degraded | 6290 | 3.87% |
| −0.0005 < Slope < 0.0005, |Z| < 1.96 | Stable and unchanged | 4496 | 2.76% |
| Slope ≥ 0.0005, |Z| < 1.96 | Slight improvement | 34,083 | 20.95% |
| Slope ≥ 0.0005, |Z| ≥ 1.96 | Significant improvement | 113,709 | 69.90% |
Table 2.
Changes of NDVI in the Lancang River Basin.
| Degree of Change | I | II | III | IV | V |
|---|---|---|---|---|---|
| Severe degradation | 4.68% | 2.15% | 2.28% | 2.61% | 3.08% |
| Slightly degraded | 4.84% | 3.49% | 3.66% | 4.32% | 5.51% |
| Stable and unchanged | 3.97% | 2.74% | 2.37% | 2.42% | 3.18% |
| Slight improvement | 26.76% | 21.85% | 19.68% | 19.47% | 25.12% |
| Significant improvement | 59.76% | 69.78% | 72.01% | 71.19% | 63.11% |
Table 3.
Change trend of NDVI of different soil types in the Lancang River Basin.
| Soil Types | Lancang River Basin | Serious Degradation | Slightly Degraded | Stable and Unchanged | Slight Improvement | Serious Improvement |
|---|---|---|---|---|---|---|
| Alfisol | 13.41% | 0.26% | 0.86% | 0.90% | 10.86% | 87.13% |
| Half luvisols | 5.26% | 2.84% | 5.28% | 3.24% | 37.69% | 50.95% |
| Aridisol | 0.01% | 0.00% | 9.09% | 0.00% | 50.00% | 40.91% |
| Primary soil | 7.45% | 0.53% | 0.77% | 0.46% | 6.83% | 91.40% |
| semi-hydromorphic soil | 0.32% | 3.52% | 4.49% | 5.08% | 41.02% | 45.90% |
| hydromorphic soil | 0.81% | 3.60% | 8.49% | 6.81% | 40.17% | 40.93% |
| Anthropic soil | 1.86% | 11.16% | 6.55% | 4.24% | 21.61% | 56.45% |
| Tierras | 36.72% | 4.96% | 8.04% | 5.37% | 38.64% | 42.99% |
| Pedalfer | 33.84% | 0.47% | 0.55% | 0.61% | 5.71% | 92.67% |
| Lakes | 0.18% | |||||
| Glacial | 0.13% |
Table 4.
Moran’s I and Z scores of regression coefficients for each factor in the geographically weighted regression model.
Table 4.
Moran’s I and Z scores of regression coefficients for each factor in the geographically weighted regression model.
| \ | NDVI | P | T | Elevation | Slope |
|---|---|---|---|---|---|
| Moran index | 0.708099 | 0.838601 | 0.950027 | 0.884723 | 0.310317 |
| Z-value | 109 ** | 130 ** | 147 ** | 137 ** | 48 ** |
** represent significant correlations at the levels of 0.01.
Disclaimer/Publisher’s Note: The statements, opinions and data contained in all publications are solely those of the individual author(s) and contributor(s) and not of MDPI and/or the editor(s). MDPI and/or the editor(s) disclaim responsibility for any injury to people or property resulting from any ideas, methods, instructions or products referred to in the content. |
© 2022 by the authors. Licensee MDPI, Basel, Switzerland. This article is an open access article distributed under the terms and conditions of the Creative Commons Attribution (CC BY) license (https://creativecommons.org/licenses/by/4.0/).
Share and Cite
MDPI and ACS Style
Cheng, Y.; Yuan, Z.; Li, Y.; Fan, J.; Suo, M.; Wang, Y. The Influence of Different Climate and Terrain Factors on Vegetation Dynamics in the Lancang River Basin. Water 2023, 15, 19. https://doi.org/10.3390/w15010019
AMA Style
Cheng Y, Yuan Z, Li Y, Fan J, Suo M, Wang Y. The Influence of Different Climate and Terrain Factors on Vegetation Dynamics in the Lancang River Basin. Water. 2023; 15(1):19. https://doi.org/10.3390/w15010019
Chicago/Turabian StyleCheng, Yao, Zeshen Yuan, Yajun Li, Jingjing Fan, Meiqin Suo, and Yuchun Wang. 2023. "The Influence of Different Climate and Terrain Factors on Vegetation Dynamics in the Lancang River Basin" Water 15, no. 1: 19. https://doi.org/10.3390/w15010019
Note that from the first issue of 2016, this journal uses article numbers instead of page numbers. See further details here.