Article

Trend Analysis of Precipitation, Runoff and Major Ions for the Russian Part of the Selenga River Basin

by
Tcogto Zh. Bazarzhapov
1,2,3,*,
Valentina G. Shiretorova
3,
Larisa D. Radnaeva
3,4,
Elena P. Nikitina
3,
Bator V. Sodnomov
3,
Bair Z. Tsydypov
3,
Valentin S. Batomunkuev
3,
Vasilii V. Taraskin
3,
Suocheng Dong
1,2,
Zehong Li
1,2 and
Ping Wang
1,2
1
Institute of Geographic Sciences and Natural Resources Research, Chinese Academy of Sciences, Beijing 100101, China
2
University of Chinese Academy of Sciences, Beijing 100049, China
3
Baikal Institute of Nature Management, Siberian Branch of the Russian Academy of Sciences, 670047 Ulan-Ude, Russia
4
Department of Pharmacy, Institute of Medicine, Banzarov Buryat State University, 670000 Ulan-Ude, Russia
*
Author to whom correspondence should be addressed.
Water 2023, 15(1), 197; https://doi.org/10.3390/w15010197
Submission received: 4 December 2022 / Revised: 25 December 2022 / Accepted: 30 December 2022 / Published: 3 January 2023
(This article belongs to the Section Hydrology)

Abstract

:
At present, the problem of climate change is becoming increasingly acute. This is especially pressing for Lake Baikal, a World Natural Heritage site. The Russian part of the Selenga watershed is a suitable site for climate change research. The study of changes in precipitation, runoff, and chemical runoff is important for sustainable water resources management. This study presents a trend analysis of precipitation and runoff at hydrological stations and weather stations in the Russian part of the Selenga River basin. A comparative analysis of the concentrations of major ions in the surface water of the Selenga River depending on water levels was also carried out. Analysis of the data series on precipitation revealed a slight negative trend at the Novoselenginsk, Ulan-Ude, and Kabansk stations, and a weak positive trend—at the Kyakhta station. Runoff analysis revealed negative trends at the two used stations (Novoselenginsk and Mostovoi). The hydrochemical regime of the Selenga River is characterized by an increase in major ions and salinity during winter low-water periods, and a decrease during high-water periods. Mineralization and major ion content are lower in the high-water period (2019–2021) than in the low-water period (2015–2017).

1. Introduction

In recent decades, global climate change has become an increasingly hot topic [1,2,3]. This problem is especially important for the basin of Lake Baikal, a world natural heritage site that contains about 19% of the world’s freshwater. Intense industrial development has led to global warming, which can negatively affect the ecology of Lake Baikal [4,5]. In the Lake Baikal basin, warming has manifested itself much stronger than the Earth’s average, especially for winter and spring periods [6,7,8,9]. An increase in air temperature leads to an increase in evaporation and, consequently, to a change in the amount of precipitation [2,3]. Also, global warming accelerates the hydrological cycle by increasing fluctuations in river runoff [10]. An integrated analysis of trends of hydrometeorological parameters for the period of 1946–2017 revealed baseline subperiod (1946–1975) and warming subperiod (1976−2017) with intensified anthropogenic pressure and natural processes [11].
An increase of 1.6 °C or 0.022 °C/year in the average annual temperature in the Selenga River basin (i.e., by almost twice the global average warming rate) during the historical period 1938−2009 was described previously [12].
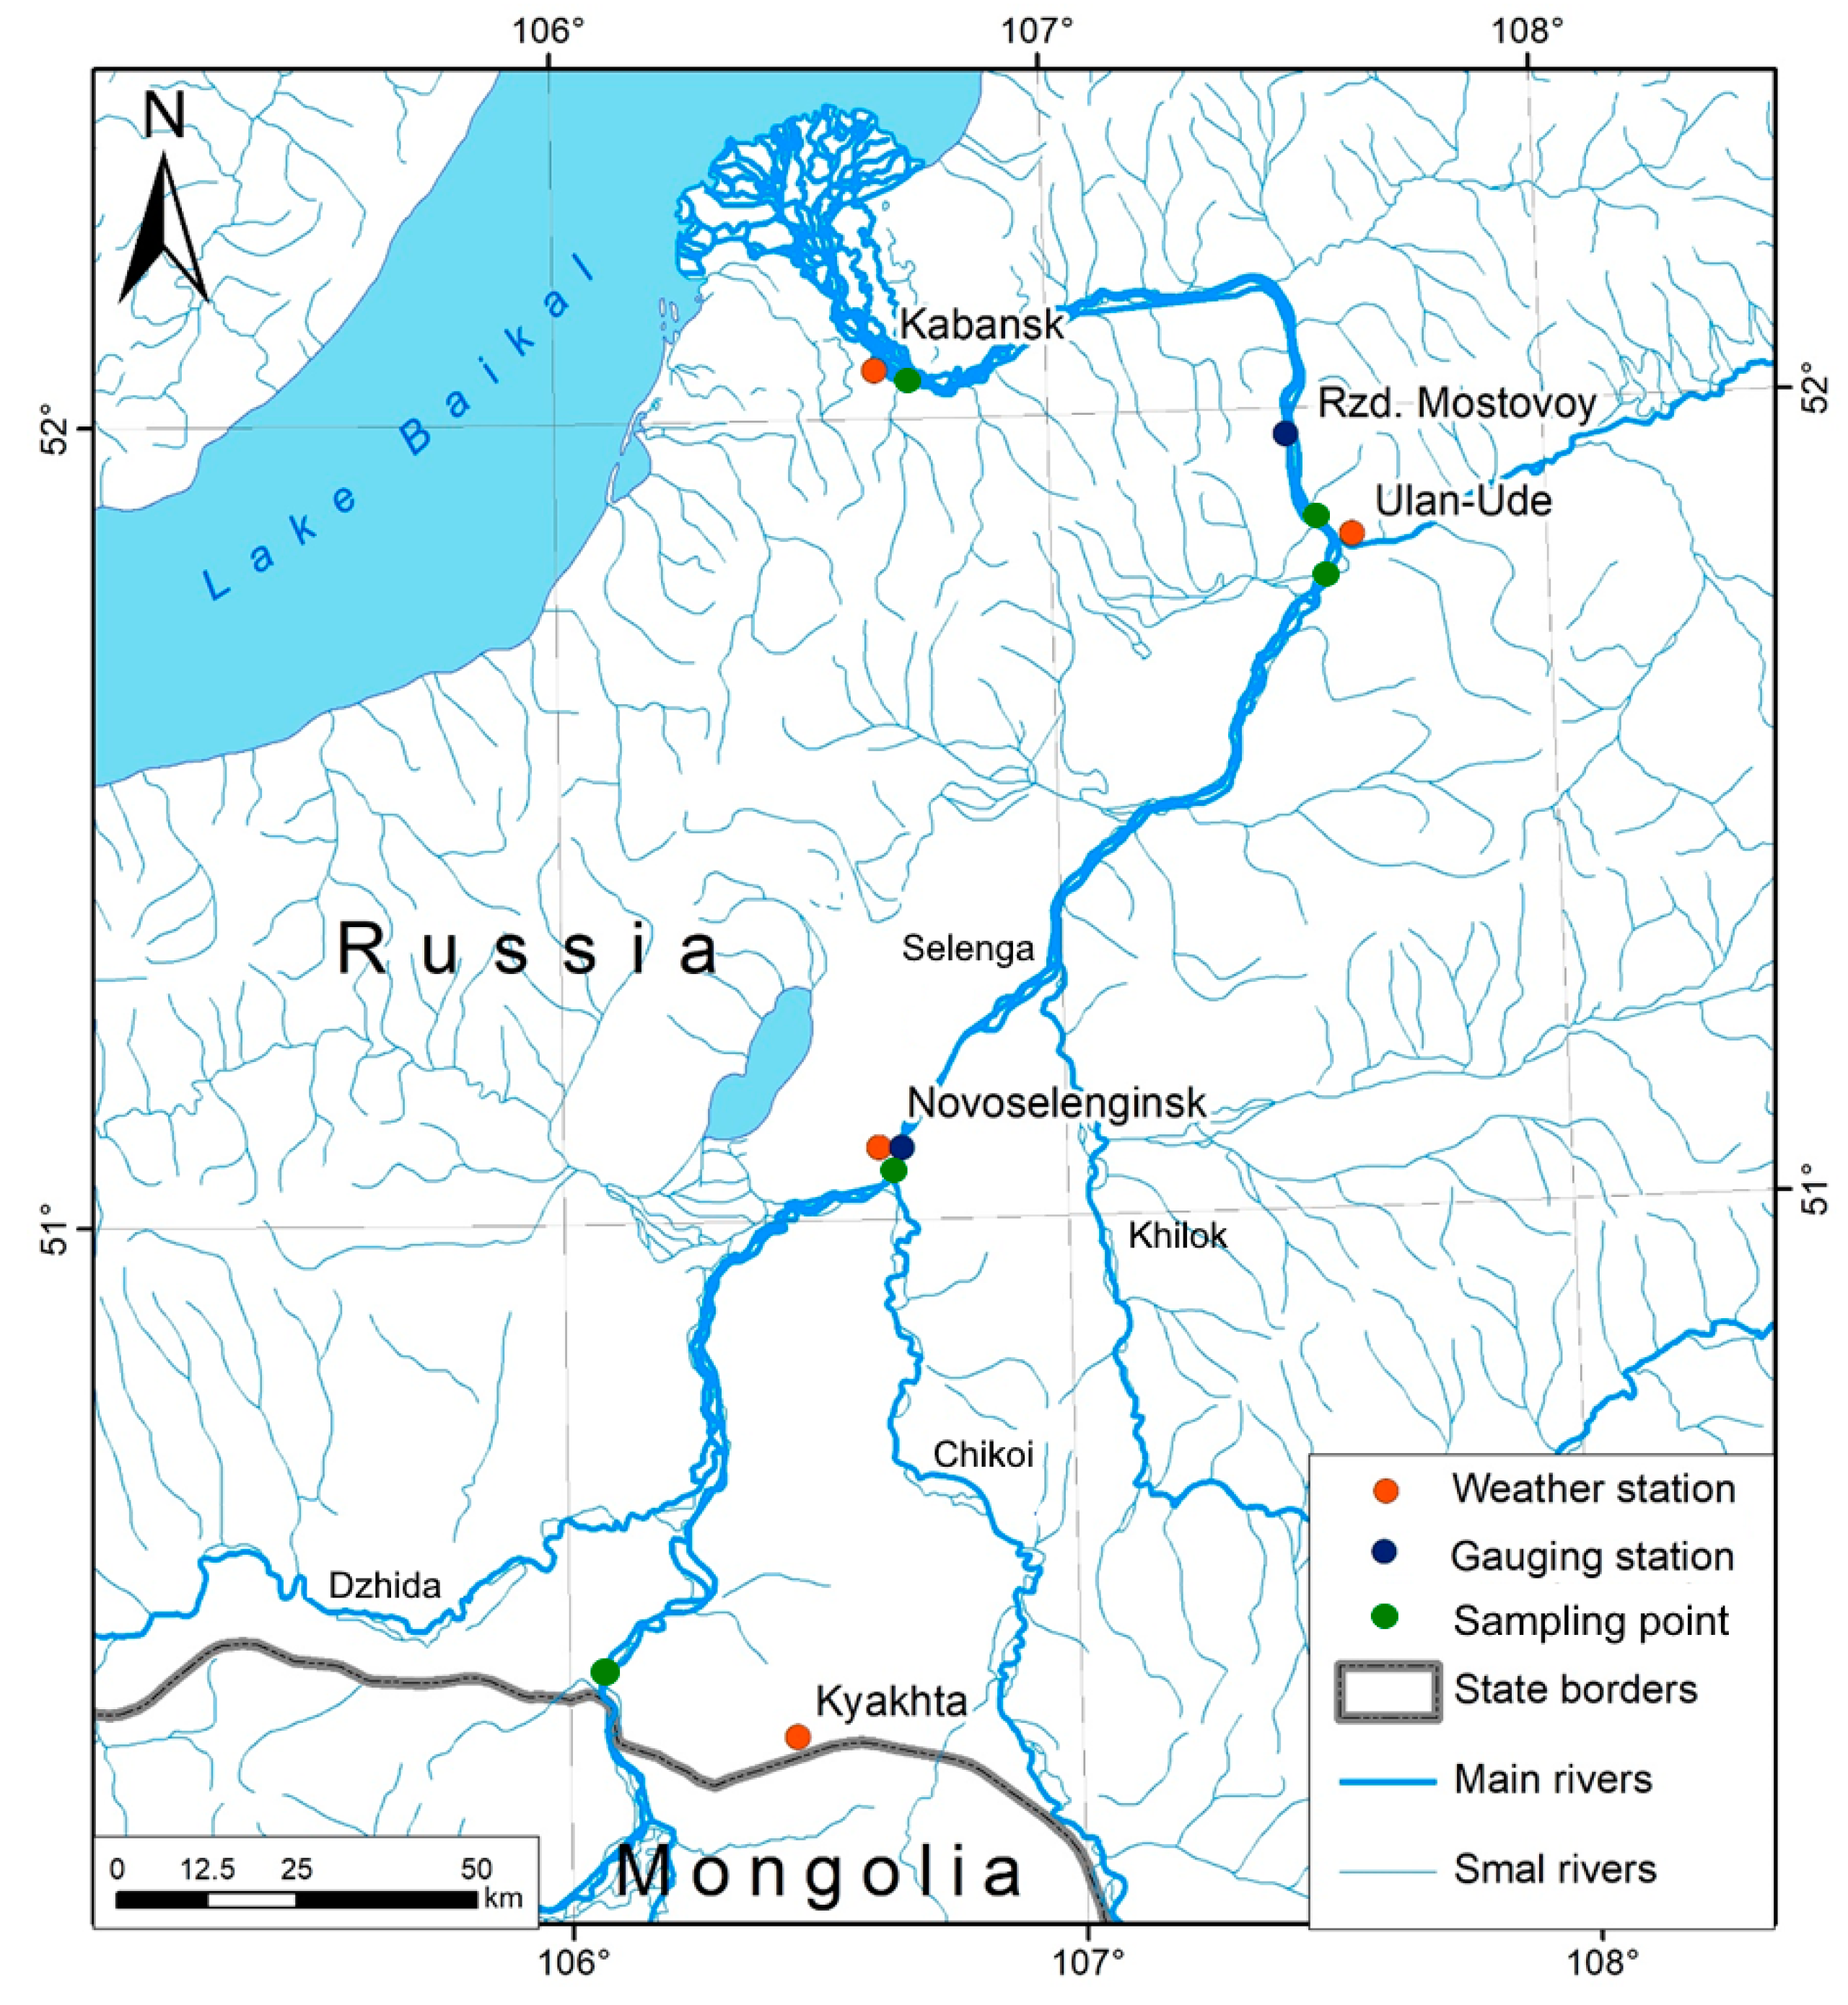
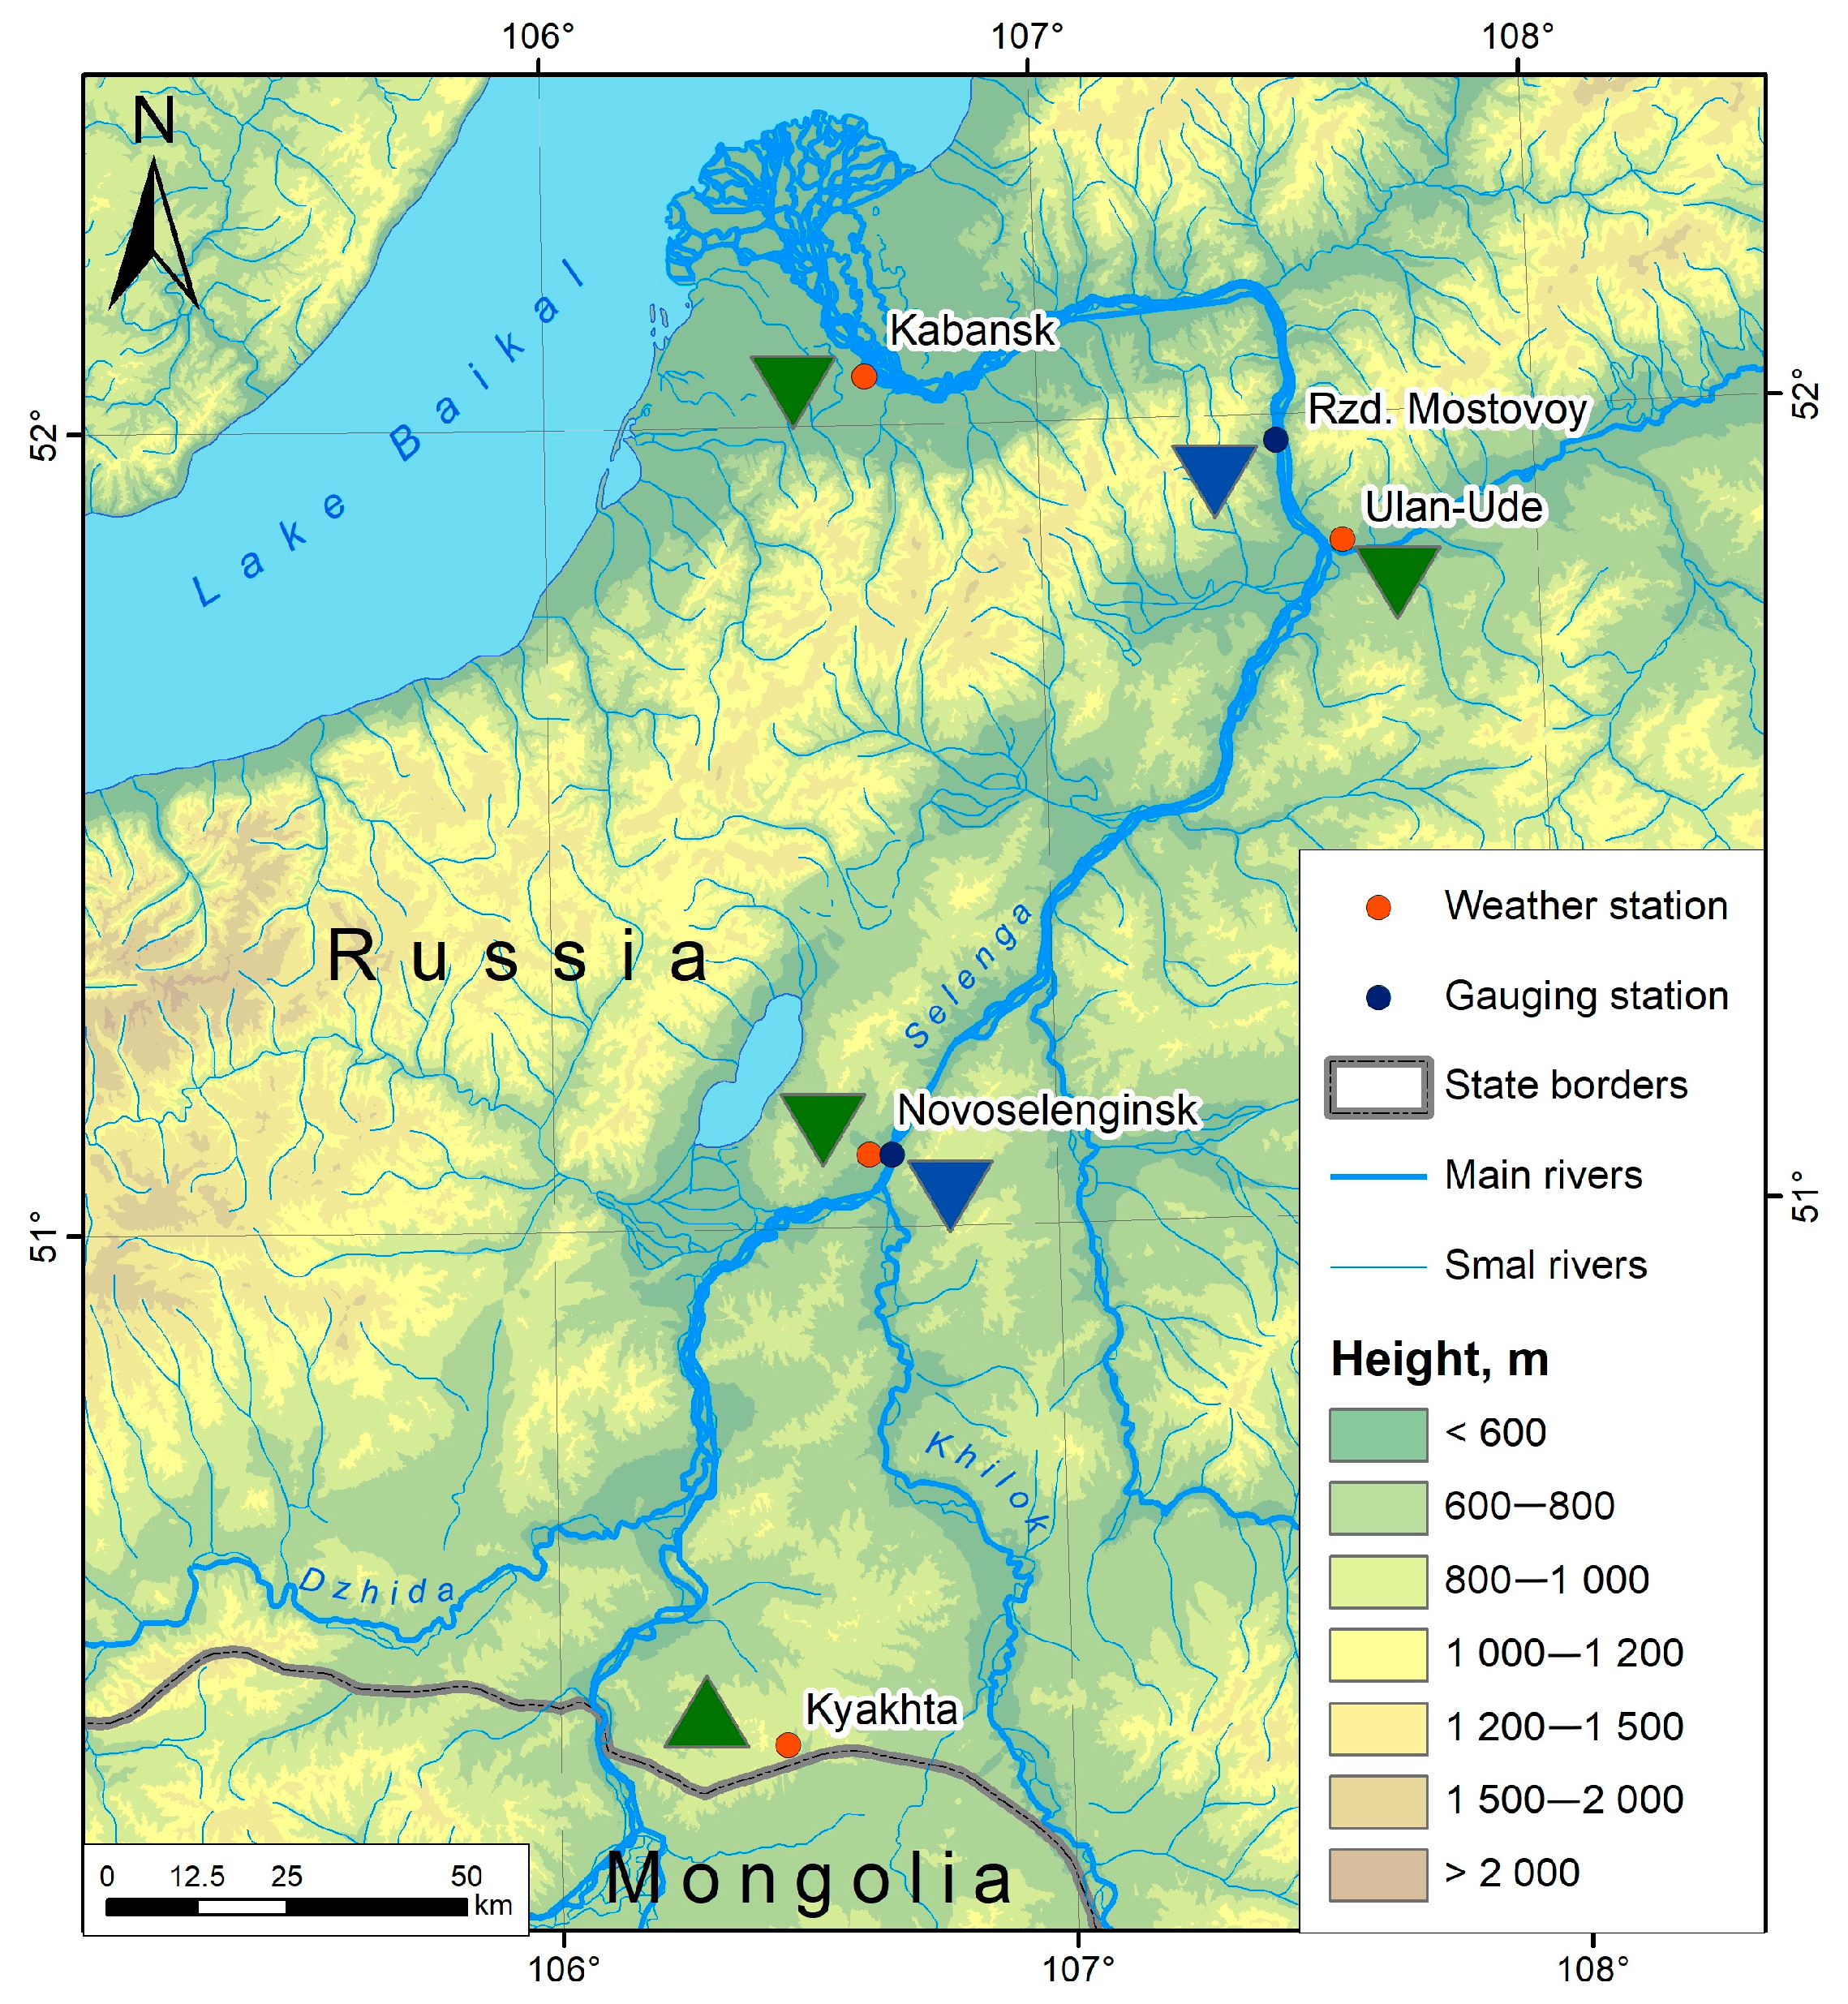
The Selenga River basin is an important and relevant model area for climate change research [12,13]. The study of changes in precipitation, as shown in [14], and their spatial and temporal distribution, as well as their response to climate change, which can be calculated even with incomplete data [15], is especially important for the basin of the Selenga River (the main tributary of Lake Baikal), which carries up to 50% of the water runoff and over 50% of the chemical runoff [16,17].
Since the start of monitoring in 1930s, the annual average flow of the rivers of the Selenga basin has shown cyclicity, comprising high water phases (12–17 years) and low-water phases (about 7 years) [18].
The ongoing hydroclimatic changes in the Selenga River catchment have led to the increase in the frequency of moderate flows (Q = 750–1250 m3/s) in the Selenga River during the past decades, and the decrease of high flows (Q > 1350 m3/s) [19]. A significant decreasing trend of average and maximum river flow (up to −2.9%/year) was registered for the half of the gauges in the eastern part of the Selenga River basin [20].
The Selenga River basin area overlaps with the industrially developed and densely populated areas of Mongolia and Buryatia. Currently, more than 2.2 million people live in the Mongolian part of the Selenga basin, accounting for about 67% of the country’s total population [21]. More than 85% of Buryatia’s population also lives in the Selenga basin [22]. Anthropogenic activity affects water quality, runoff, and soil cover. Large cities and industrial centers are located in the Russian part of the Selenga River basin.
The Buryat Center for Hydrometeorology and Environmental Monitoring regularly monitors water levels and quality in the Selenga River basin. The chemical composition of the water of the Selenga and its tributaries, as well as the ionic discharge into Lake Baikal, were studied in detail in the 1950s and 1960s [23,24]. These data on water quality can be taken as background data.
There are many studies on atmospheric circulation, climate change and hydrological processes in the Selenga River basin. Trend analysis showed a noticeable change in the hydrological conditions of flow formation of the flow of the Selenga River and its tributaries. Also, a positive trend in annual temperature values and a negative trend in the runoff of the Selenga and its tributaries were revealed [25,26]. The main cause for the variations in the runoff is the variability of the summertime precipitation [27,28].
In the 1980s, the anthropogenic impact on the water and its chemical composition significantly increased, leading to a deterioration in water quality [29,30,31]. At present, the ionic composition of the Selenga water has changed along its entire length (compared to the background period) due to increased economic activity and a decrease in water levels [32,33,34]. Moreover, changes in the precipitation levels affect the hydrological regime, which, in turn, controls the concentration of substances in the water [35]. Precipitation and runoff in the Selenga River basin have decreased from the highest reported peak in 1992 to its lowest (2004–2008) [36].
In this study we described the correlation between changes in water levels and chemical indicators in the Selenga, conducted spatiotemporal and seasonal analyses of changes in salinity and major ions in the river waters.
This paper aims to analyze the trend of precipitation, runoff, and major ions in the Selenga River basin. To do this we need to solve the following tasks: (i) to analyze spatiotemporal changes in precipitation, (ii) to analyze spatiotemporal changes in runoff, and (iii) to identify trends in spatiotemporal changes in concentrations of major ions.

2. Materials and Methods

2.1. Study Area

We investigated trends in precipitation, runoff, and major ion data for the Russian part of the Selenga River basin downstream (toward the confluence with Lake Baikal). The Selenga is a transboundary river with a length of 1024 km, and 46% of its annual flow is formed on the territory of Mongolia. It brings about 30 km3 of water to Lake Baikal on average per year, which is half of the total inflow to the lake. The catchment area of the river is 447,060 km2, the Russian part accounts for 148,000 km2. The average density of the Selenga River network in the Russian part of its basin reaches 0.47 km/km2. The largest tributaries in the Russian part are the Khilok (840 km) and the Chikoi (769 km). The Selenga River basin is located within the mountainous central part of the Asian mainland, stretching from southwest to northeast between 46°20′ and 53°00′ N, 96°50′ and 112°50′ E. In its Russian part, the watershed is bounded by Khamar-Daban and Ulan-Burgasy ridges; in the northeast, it passes through a poorly defined watershed of the headwaters of the Uda and Khilok rivers and further along Yablonovy ridge. In the east, the watershed continues along the ridges of the Khentei-Chikoi plateau. The southern boundary passes through the hills of Northern Khalkha (Mongolia) [37,38].
The climate of the region is sharply continental, with great annual and daily variations in air temperature and an uneven distribution of precipitation. The long-term average annual air temperature throughout the Selenga River basin has negative values, varying from −0.1 °C (Tsetserleg weather station) to −6.7 °C (Ikatsky Pereval weather station) [39,40]. January is the coldest month, while July is the warmest.
Air masses coming from the southeast bring the greatest amount of moisture to the Selenga River basin area, while the least amount—is from the north [41]. Air masses from the west and northwest bring significant but not extreme amounts of moisture. The average annual precipitation ranges from 230 to 700 mm [40].

2.2. Data Sources

Data on monthly and annual precipitation and runoff in the Russian part of the Selenga basin were retrieved from the Information System on Water Resources and Management in the Russian Rivers’ basins, (http://gis.vodinfo.ru, accessed on 2 December 2022), World Meteorological Organization (http://climexp.knmi.nl, accessed on 2 December 2022), and web portal “Weather and Climate” (http://pogodaiklimat.ru, accessed on 2 December 2022). The locations of the selected meteorological stations and gauging stations in the Selenga River basin are shown in Figure 1.

2.3. Rainfall and Runoff Trend Analysis in the Selenga River basin Using the Mann Kendall Statistic

Trend analyses of precipitation and runoff data were conducted using Mann Kendall (MK) test and Sen’s slope (SS) estimators. Data on average monthly precipitation (from 4 stations) and runoff (from 2 stations) in the study basin were analyzed. Monthly precipitation data are available for Kyakhta, Novoselenginsk, Ulan-Ude, and Kabansk monitoring stations from 1936 to 2021. Monthly runoff data for hydrological gauging stations Novoselenginsk and Mostovoi are available from 1990 to 2017. The nonparametric MK test, first proposed in 1945 and suitable for samples with outlying values [42], can be used to analyze hydrometeorological data [43]. To study seasonal and monthly fluctuations, we used Seasonal Kendall Test [44], which was well suited to determine trends in hydrometeorological data over the seasons [45]. The Seasonal Kendall test (Sk) accounts for seasonality by combining the results of individual MK tests (Si) for each of m seasons (it compares the data of each season separately—January with Januaries, February with Februaries, etc.) [44,46].
S k = i = 1 m S i
The Standard Normal Test Statistic:
Z S k = { S k 1 σ S k                     i f   S k > 0 0                                 i f   S k = 0 S k + 1 σ S k                     i f   S k < 0 ,
where
μ S k = 0
Positive values of ZS indicate increasing trends, while negative ZS values show decreasing trends. Testing trends is done at specific significance levels. When |ZS| ˂ Z1 − α/2, the null hypothesis is rejected and a significant trend exists in the time series. Z1 − α/2 is obtained from the standard normal distribution table. In this study, significance levels α = 0.01 and α = 0.05 were used. At the 5% significance level, the null hypothesis of no trend is rejected if |ZS| ˃ 1.96 and rejected if |ZS| ˃ 2.576 at the 1% significance level.
Variance
σ S k = i = 1 m ( n i 18 ) ( n i 1 ) ( 2 n i + 5 ) ,
where n i = number of data points for the ith season.
The Sen Slope Estimation method was then used to show the slope of the trend for the pairs of data (n) as suggested by Silva et al. [30].
Q i = X j Y k j k ,
where Xj and Xk were the data values at times j and k respectively, while j > k. When there was one datum in each period,
N = n ( n 1 ) / 2 ,
n was the number of periods.
When there were multiple observations during one or more periods—
N < n ( n 1 ) / 2
Then the n values of Qi were arranged in ascending order. The median of slope otherwise known as Sen’s slope estimator was calculated as follows [43]:
Q m e d = { Q [ ( n + 1 ) / 2 ] Q [ n / 2 ] + Q [ ( n + 2 ) / 2 ] 2         i f   n   i s   o d d   i f   n   i s   e v e n
The Qmed sign indicated the trend while the value or magnitude indicated steepness of that trend [36]. The confidence interval was computed as follows:
C α = Z 1 α / 2 V a r ( S ) ,
where Var(S) was as in Equation (4) above.
Z i α / 2 was taken from standard normal distribution table [43]. M1 and M2 indices were calculated as follows:
M 1 = n C α 2
M 2 = n + C α 2
Therefore, the lower and upper limits of the confidence interval (Qmin and Qmax) were the M1th largest and ( M 2 + 1 ) th largest slope estimates arranged in a chronological order. The following hypotheses were considered: null hypothesis (H0)—there is no trend in the data series; alternative hypothesis—there is a trend in the data series.

2.4. Field Sampling

The surface water of the Selenga was sampled at monitoring points, beginning from the border with Mongolia (Naushki settlement) to the Kabansk settlement: Naushki, Novoselenginsk, Ulan-Ude up stream, Ulan-Ude down stream and Kabansk (Figure 1). The sampling was conducted in different hydrological seasons (February–March, May, July, and September–October) during 2015−2021. A total of 124 samples of surface water were taken. The samples were preserved for further study in the laboratory.

Laboratory Analyses

We performed chemical analyses at the Laboratory of Nature Systems Chemistry (Baikal Institute of Nature Management SB RAS, Siberia, Russia) using Russian National standard methods (GOST). Concentrations of F, major anions (Cl, SO42−), and cations (K+, Na+, Ca2+, and Mg2+) were analyzed by ion chromatography (Dionex 1600, Thermo Fisher Scientific Inc., New York, NY, USA), with a 2–5% error. The reliability of the data obtained was controlled by evaluating the ionic balance error evaluation and comparing the calculated and measured specific conductivity [47].

3. Results

3.1. Rainfall Trend Analysis

Precipitation data trends were analyzed for the Kyakhta, Novoselenginsk, Ulan-Ude, and Kabansk stations. At three weather stations, precipitation data were continuous within the investigated time range, only at the Kabansk station, there was a small gap. Mean monthly precipitation data were presented in millimeters (mm).

3.1.1. Analysis of Rainfall Data for the Kyakhta Station

We used data on average monthly precipitation for the period from 1936 to 2021. The main statistical characteristics of the data set are presented in Table 1. In 5 of 12 months, the minimum amount of precipitation was 0 mm. The greatest amount of precipitation was recorded in August (231.0 mm), and the least—was in January and February (11.1 mm). An MK test (p < 0.05) performed over the 12-month season showed that the p-values were higher than the significance (alpha) level of 0.05 for 9 months, as shown in Table 2. The p-values were below the significance level (p = 0.008; 0.047; 0.032) for May, October, and November, respectively. Monthly precipitation data from the Kyakhta station showed no trend for 10 months, but only in two months (October, November), the data indicated a significant trend. The twelve-month MK test result was 5.019, which was above the significance level of 0.05, hence no significant trend was found in the data series.
SS test showed no change for four months and an upward trend in the remaining six months. For one month a small negative value was calculated. The sum value of 0.388 indicates that there is a weak upward trend in precipitation at this station (Table 2).
Figure 2 shows the general trend of precipitation recorded at the Kyakhta station from 1936 to 2021. The plot shows the tendency for a slow increase in precipitation near Kyakhta. This is consistent with the SS and MK values, which also indicate a positive trend in precipitation at the station (Figure 2).

3.1.2. Analysis of Rainfall Data for the Novoselenginsk Station

Precipitation data at the Novoselenginsk station also covered the period of 1936–2021. The minimum precipitation was the same (0.100 mm) for eight months (October through May); in the remaining four months (June through September) the minimums were 0.8 mm, 8.0 mm, 6.0 mm, and 2.0 mm, respectively. Precipitation was highest in the summer months, with the maximum in July at 171.0 mm (Table 3).
The MK and SS test values for precipitation data from the Novoselenginsk station are presented in Table 4. The p-value for August was the only one that was below the significance level of 0.05, indicating a trend in the data series. However, the overall p-value of 7.491 was well above the significance level of 0.05, indicating no significant trend.
The SS results showed no change for six months within a year, and downward trends—for four months. A slight positive trend was observed in March (0.011) and May (0.031). The overall SS value of −0.406 indicates a slight downward trend.
Precipitation recorded at the Novoselenginsk station from 1936 to 2020 shows a tendency to insignificant decrease (Figure 3), which is confirmed by the MK and SS calculations (Table 4).

3.1.3. Analysis of Rainfall Data for the Ulan-Ude Station

Data on average monthly precipitation covered the period from 1936 to 2021 (statistical data in Table 5). In 4 of 12 months the minimum amount of precipitation was 0 mm. The highest amount of precipitation was recorded in July (162 mm).
The MK test data (p < 0.05) showed that the p values for January and April were below the significance level (0.027 and 0.019, respectively); and for the other 10 months the p values were above alpha 0.05. The cumulative p value for the twelve months was 4.904, which was also above the significance level, hence there was no distinct trend for this data series (Table 6). The SS value for eight months had negative values, and for the remaining four months—zero values, demonstrating no trend.
The plot of precipitation at the Ulan-Ude station for the period of 1936–2021 shows a decreasing trend (Figure 4), which is also confirmed by the total SS value of 1.256.

3.1.4. Analysis of Rainfall Data for the Kabansk Station

Data on average monthly precipitation at the Kabansk station covered the period of 1936−2021. Over the entire study period, the minimum amount of precipitation (0 mm) was recorded in 7 months; the maximum—in August (451 mm) (Table 7).
The MK data (p < 0.05), showed that p values for six months were below the significance level of 0.05, the remaining months had higher values (Table 8). The sum of p-values for the twelve months was 2.101, which was above the alpha level, hence no significant trend was found. The SS data showed a downward trend in all months. The overall SS value of −1.428 indicates a slight downward trend (Figure 5).
The plot of precipitation recorded at Kabansk station from 1936 to 2021 shows a slight downward trend, which is consistent with the SS and MK data.

3.2. Runoff Data Analysis

Runoff trends were analyzed at two gauging hydrologic stations downstream of the Selenga River. The Novoselenginsk hydrologic station is located 140 km upstream of the Mostovoi station. Initial runoff data were presented in cubic meters per second (m3/s).

3.2.1. Analysis of Runoff Data for the Novoselenginsk Hydrological Gauging Station

The monthly runoff data from the Novoselenginsk hydrological station for the period of 1990–2017 were used for analysis. Due to the lack of available data on the average monthly river flow for the previous and subsequent years, the Mann Kendal trend analysis was carried out in this time interval.The minimum monthly runoff values at the station were recorded during the winter months and March: 56.571, 32.114, and 33.826 m3/s in January, February, and March, respectively (Table 9). Maximum absolute and mean runoff values were recorded from May through September. The high difference between the minimum and maximum flow values for June, July, August, and September resulted in high mean values and standard deviations for this period.
The MK results for the data from the Novoselenginsk hydrological station are presented in Table 10. Eight of the 12 hydrological months had p-values below the significance level of 0.05, demonstrating a trend, while the remaining four months showed no trend. However, the overall p-value of 1.619 indicated no significant trend in the data series.
SS for all months indicated a downward trend, except for April. The highest values of changes were observed in July, August and September.
The general trend of runoff at the hydrological gauging station Novoselenginsk is shown in Figure 6. During the period, the monthly runoff varied little from year to year and was less than 3000 m3/s, except for the month in 1992. The trend line shows a decrease in runoff at a low rate, which is confirmed by negative values of SS and MK.

3.2.2. Analysis of Runoff Data for the Mostovoi Hydrological Station

The Mostovoi hydrological station is located on the Selenga River, downstream of the Novoselenginsk station. The runoff trend at the Mostovoi station was analyzed from 1990 to 2017. The lowest runoff values were in January, February, and March (as at the Novoselenginsk station), and the highest rates were observed in the summer and fall months (Table 11). August had the highest values of mean monthly runoff and standard deviation.
The results of the SS and MK tests are shown in Table 12. The p-values for the six months were below the significance level, and above it for the remaining months. The sum of the MK p-values for the twelve months was 2.05, (above the significance level), demonstrating no significant trend. The SS and MK data had negative values, indicating a downward trend in the data series.
The overall runoff trend for the Mostovoi station is shown in Figure 7. It shows a decreasing trend in runoff (the same is observed at the upstream station). The linear trend line and predictive runoff model indicate a decreasing trend in runoff at the hydrologic station.

3.3. Summary of Trends

The direction of trends in precipitation and runoff levels relative to the altitudes of the study region is shown in Figure 8. The green up triangle shows a positive non–significant trend in precipitation, while the green down triangle indicates a negative non–significant trend. The blue down triangle represents a negative non-significant trend in runoff levels.

3.4. Trend Analysis of Major Ions (Correlation of Water Level Change with Chemical Runoff)

To analyze the correlation between changes in water levels and chemical indicators in the Selenga, we conducted spatiotemporal and seasonal analyses of changes in salinity and major ions in the river waters from the border with Mongolia (Naushki settlement) and to the river delta (Kabansk settlement). The analysis was conducted for a range of data from 2015 (with extremely low water levels), to 2021, when water levels were close to their maximum, and during the summer rainfall flooding, the river was observed reaching the floodplain at all observation stations.
A comparative analysis was performed at 5 stations from Naushki to the delta of the Selenga (Naushki, Novoselenginsk, 2 stations above and below Ulan-Ude, Kabansk). Figure 8 shows that the water level in the river was low in 2015 and 2017; starting from 2018, the water level began to increase. Mineralization of the Selenga water in the period of low water level was 158–268 mg/L. The increase in water level was accompanied by a decrease in salinity to 107–201 mg/L (Figure 9a,b), with the highest values being typical for the Naushki–Novoselenginsk section of the river. The decrease in salinity is insignificant downstream of the Selenga River, from Naushki to Novoselenginsk: the tributary flowing in here (the Dzhida River) has no effect due to the close values of salinity. Moving even further downstream, from Novoselenginsk to Kabansk, the Selenga water shows a decrease in salinity due to dilution by less saline waters of tributaries—the Chikoi, Khilok, and Uda rivers. As for seasonal changes, the maximum values of salinity are observed in the subglacial period when there is no runoff from the watershed, the minimum—is during the spring floods and summer rainfall floods.
Concentrations of major ions HCO3, SO42−, Cl, Ca2+, Mg2+, Na+, and K+ in the Selenga River water during 2015–2021 varied in the intervals (mg/L): 72−184; 6.3−17.8; 0.8−1.9; 17.4−41.2; 3.6−11.2; 4.3−9.4 and 1.0−2.1, respectively. The maximum concentrations of all components were observed in the subglacial period of 2015–2017. The spatial and seasonal dynamics of HCO3, Ca2+, Mg2+, and K+ ion concentrations correspond to the dynamics of total mineralization. The seasonal dynamics of SO42−, Cl, and Na+ ions are close to that for total mineralization, while the spatial dynamics are different and more complex (Figure 10 and Figure 11).

4. Discussion

The distribution of precipitation in the Selenga River basin is determined by atmospheric circulation conditions and the terrain [48]. In winter, the area of the river basin is affected by the Siberian anticyclone and therefore receives very little precipitation, which agrees with our findings. Analysis of the precipitation trend shows that most of it fall in the second half of summer and the first half of fall [49,50]. This is explained by the change of continental polar air to tropical sea air, which causes abundant precipitation. Up to 80−90% of the annual precipitation falls as rain [37,
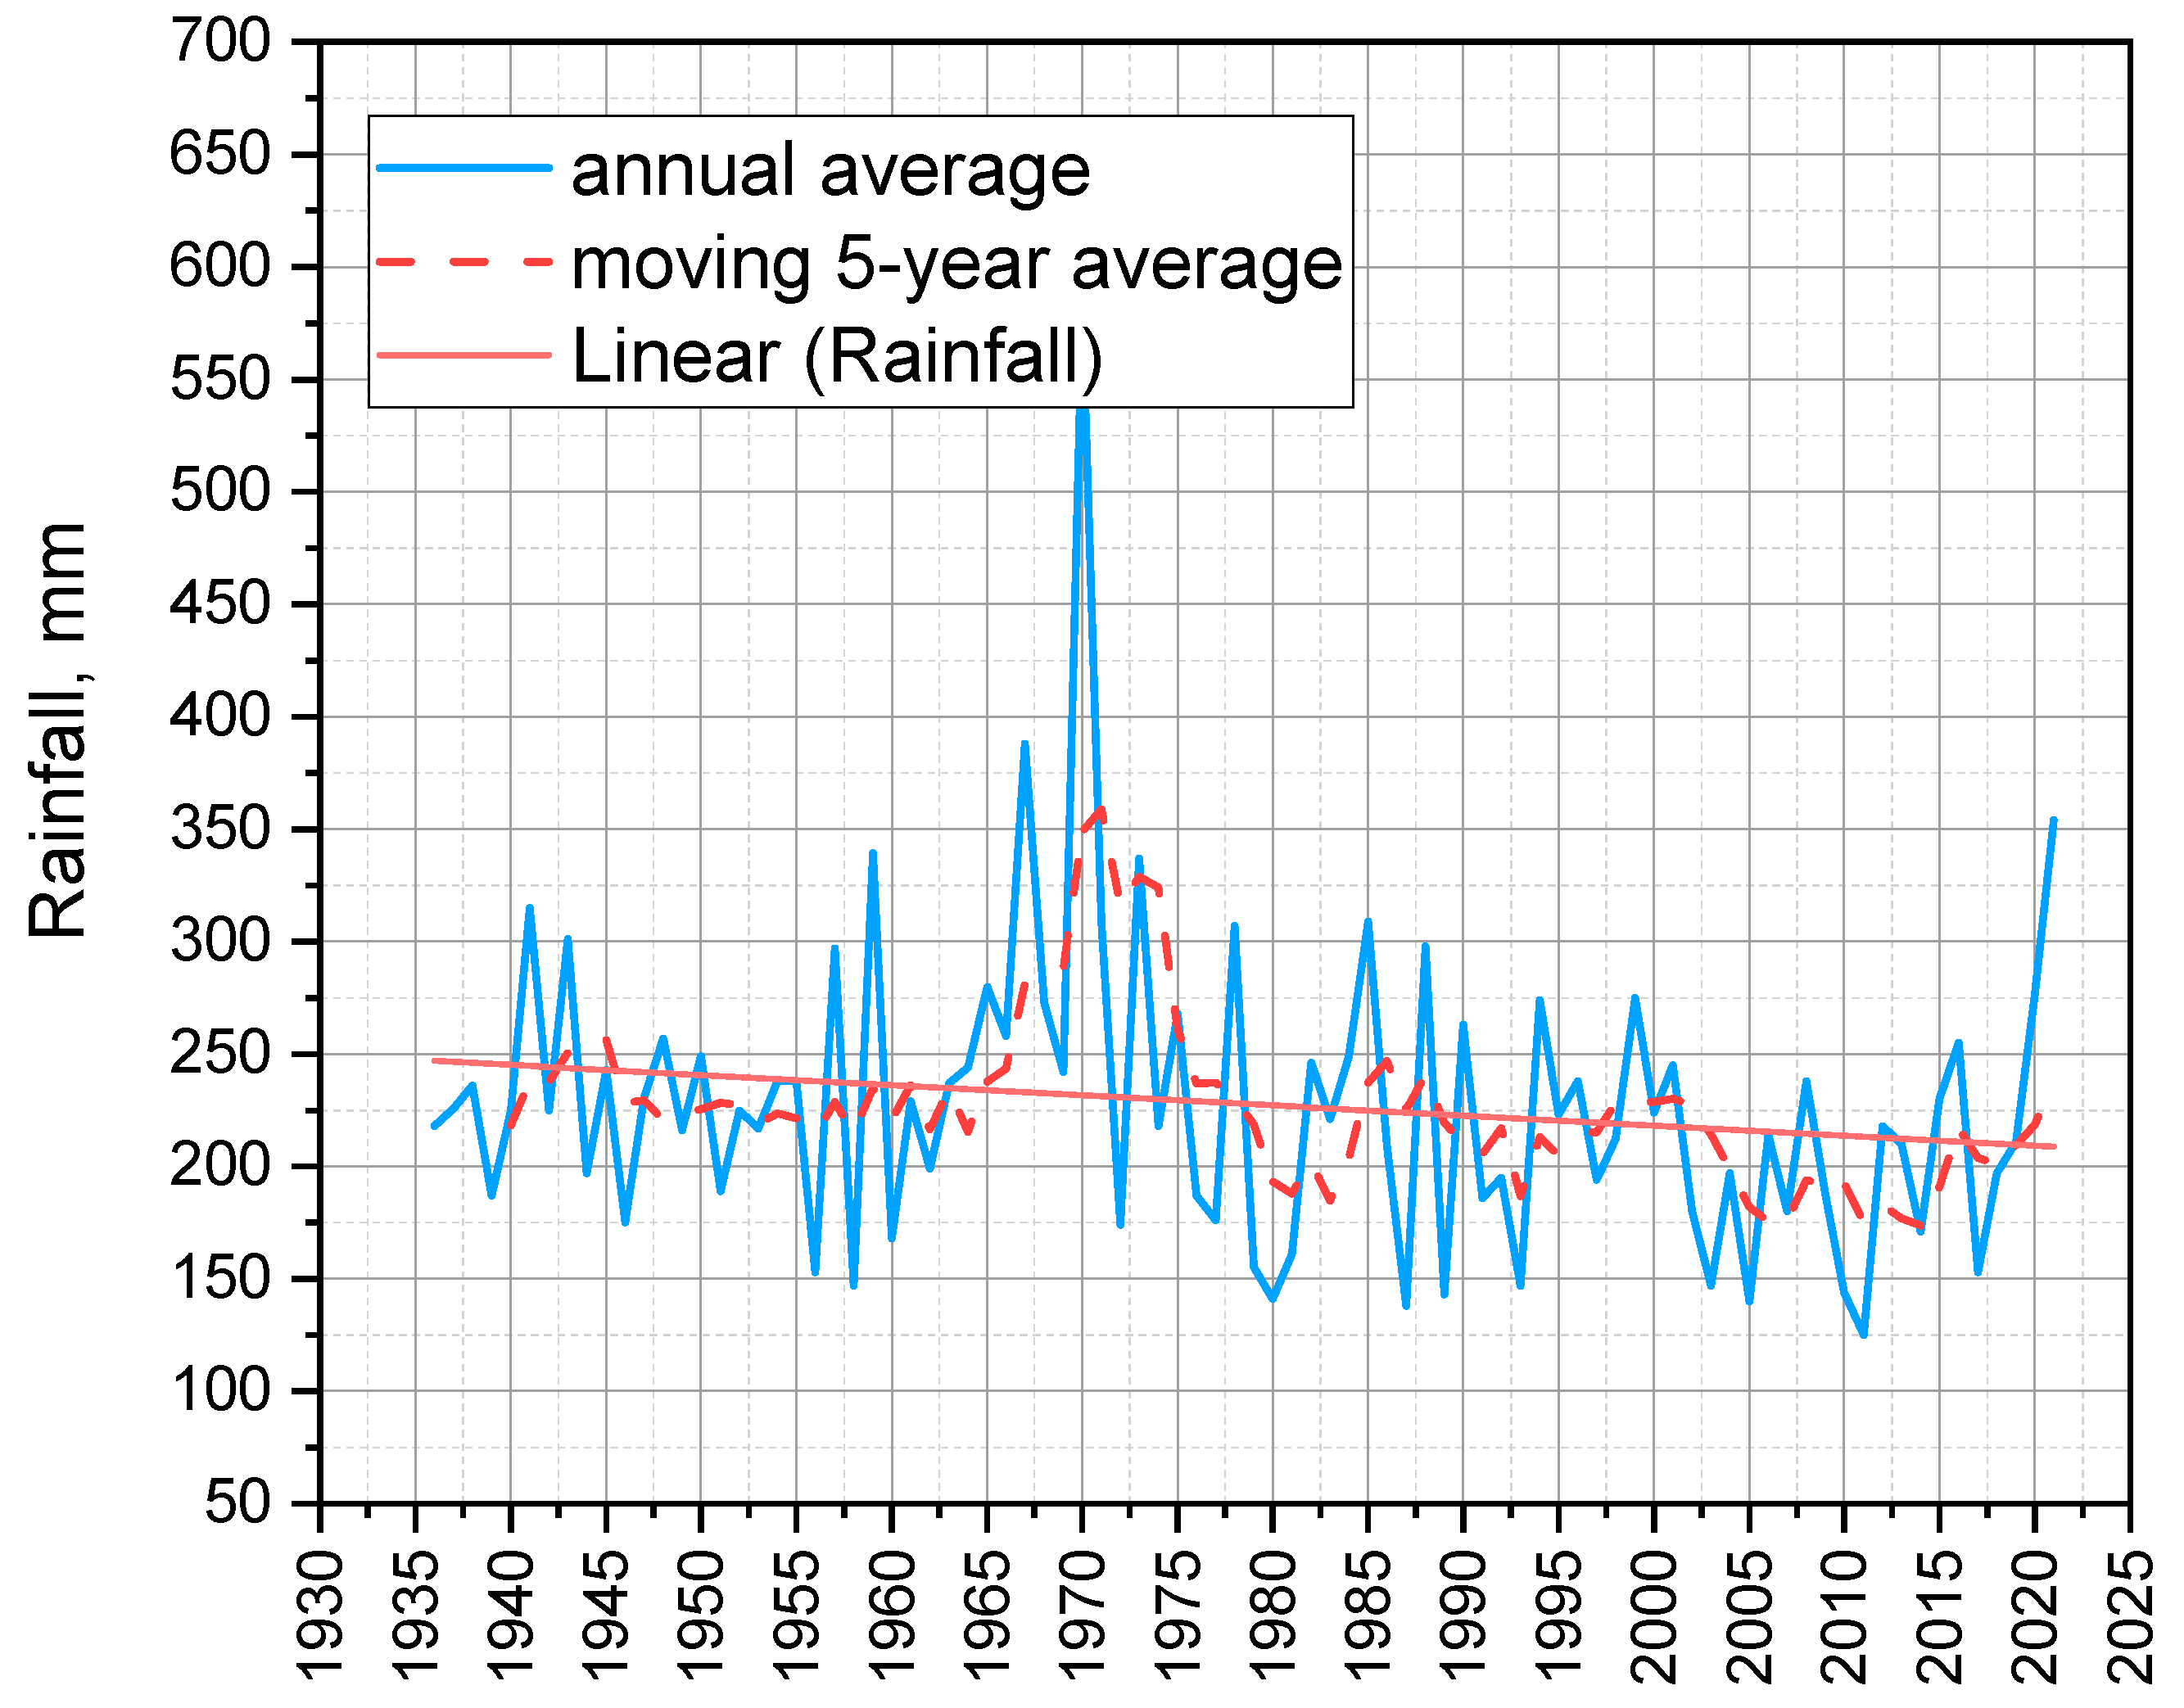
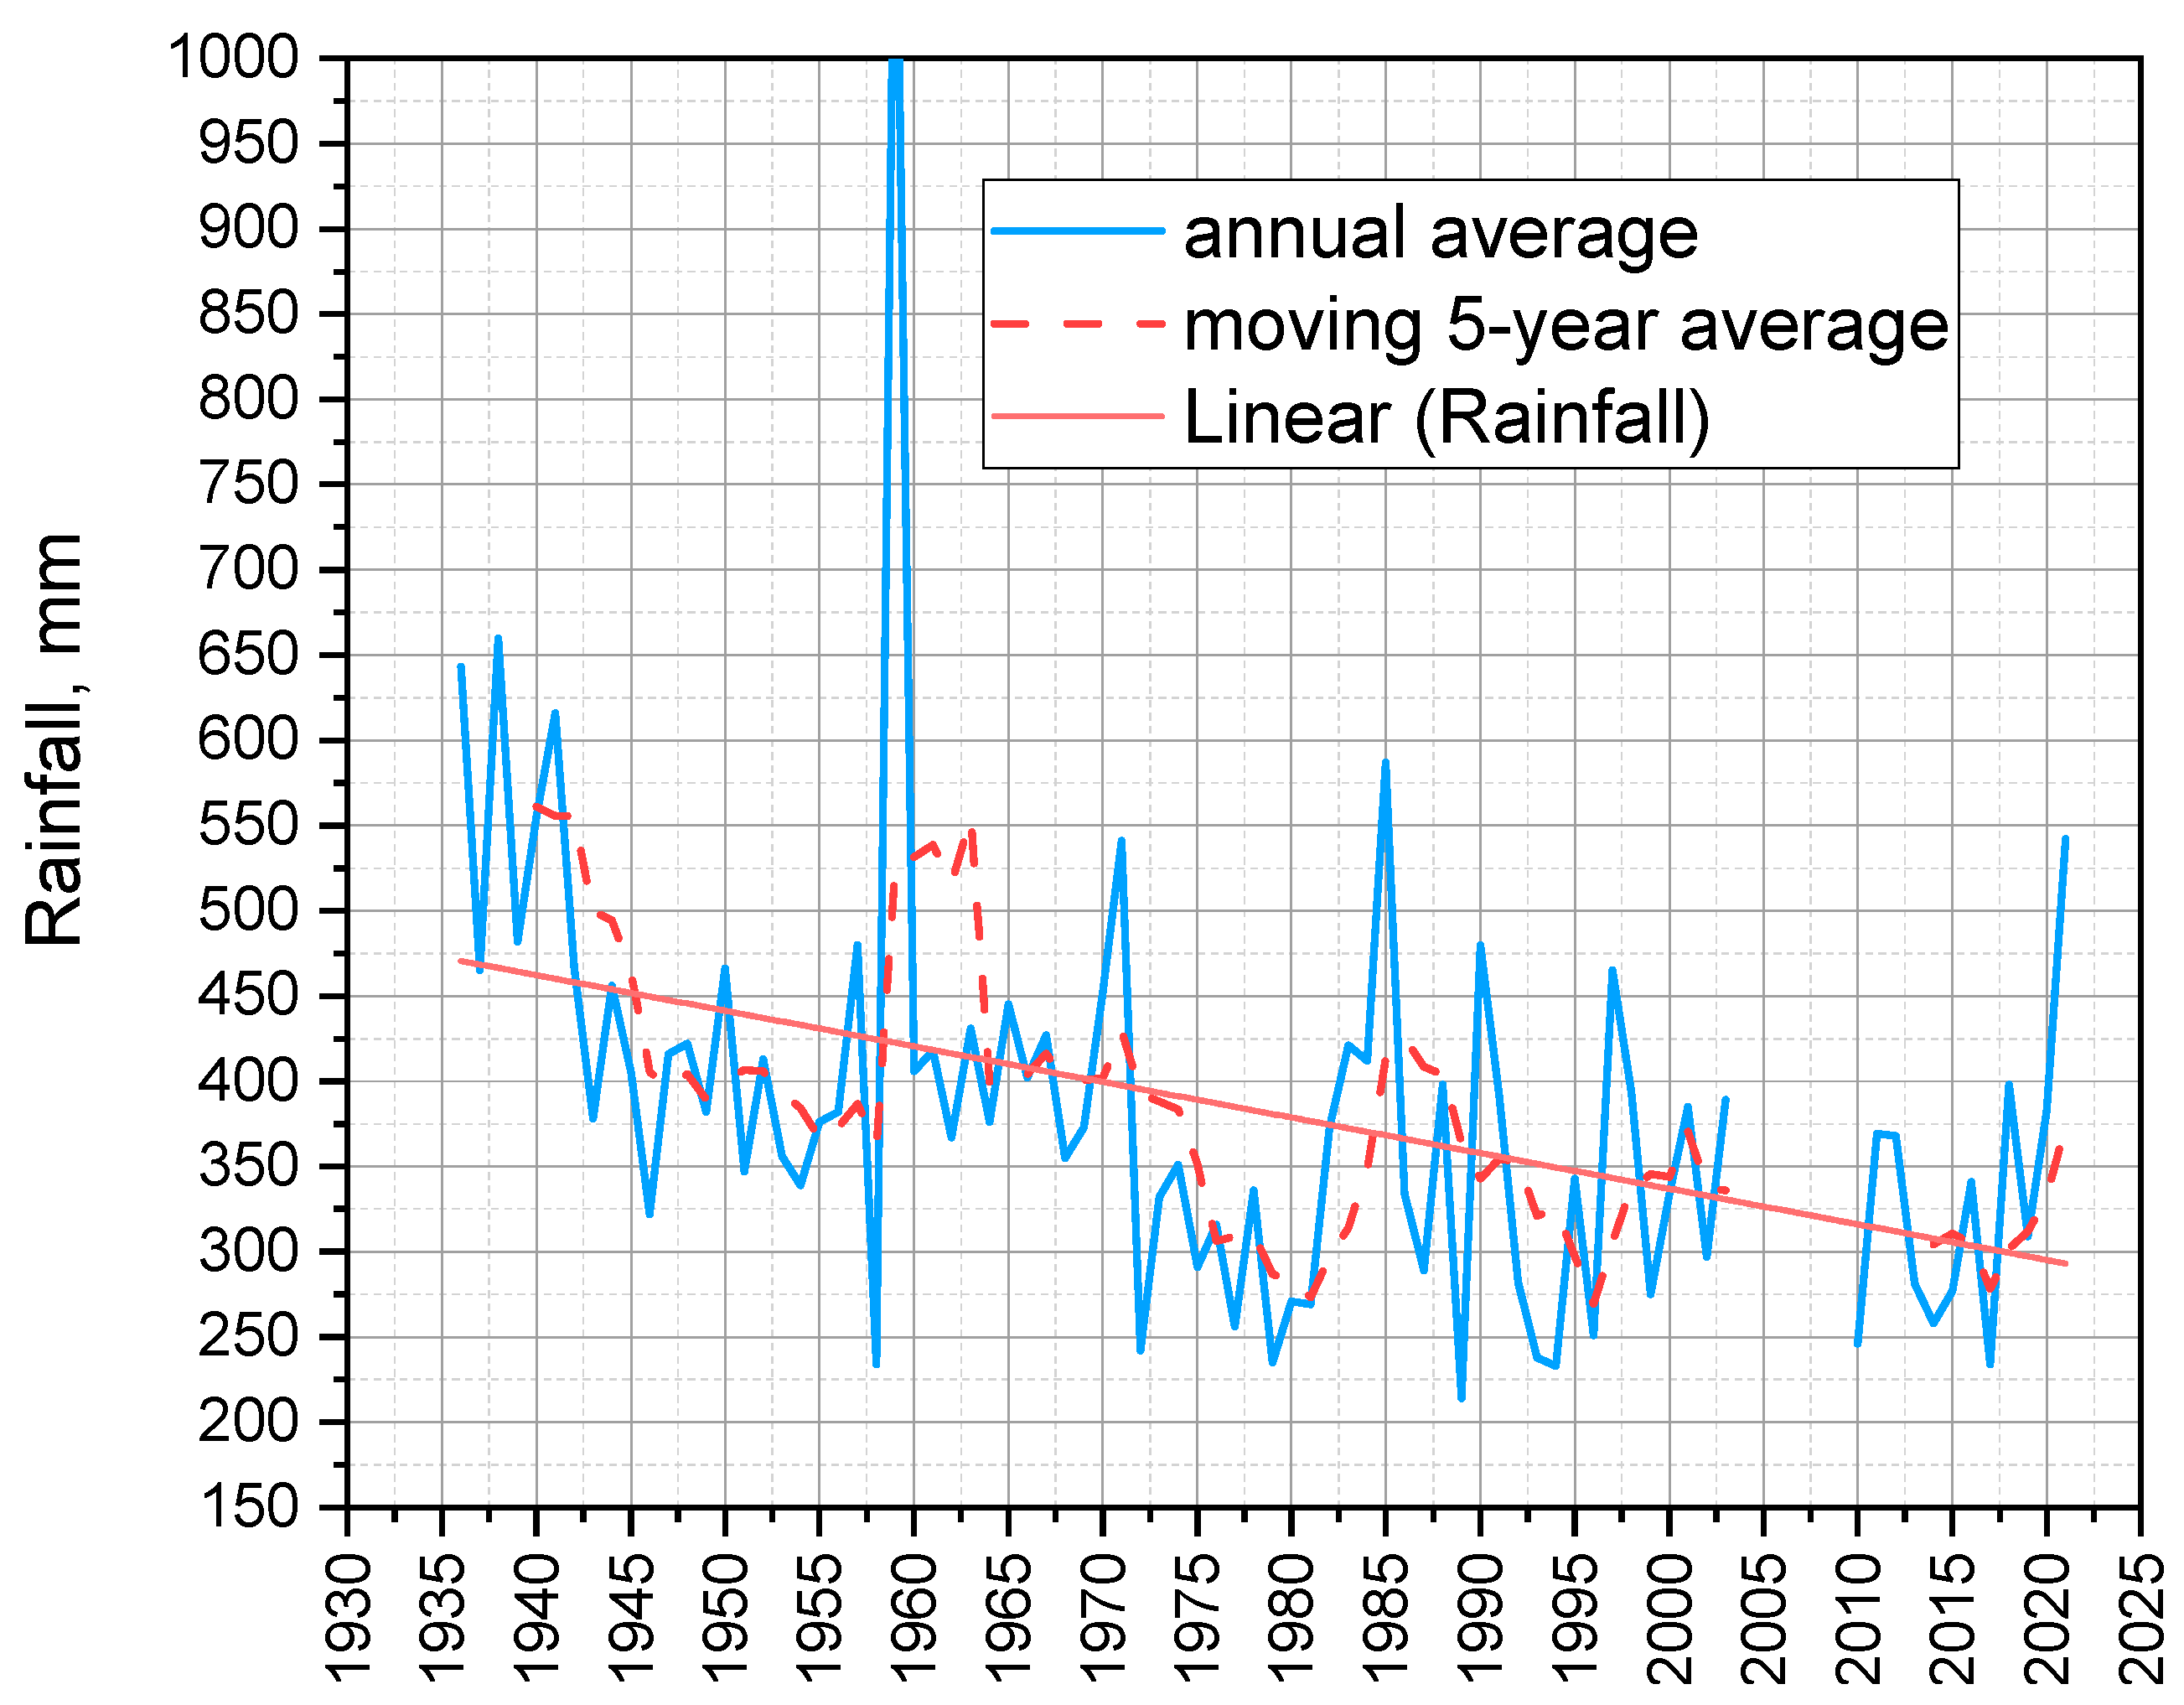
51]. Analysis of precipitation data for three weather stations shows a slight downward trend. Only one weather station shows a slightly positive trend. Overall, there is a slight negative trend throughout the Selenga River basin, which is consistent with the results of earlier studies [
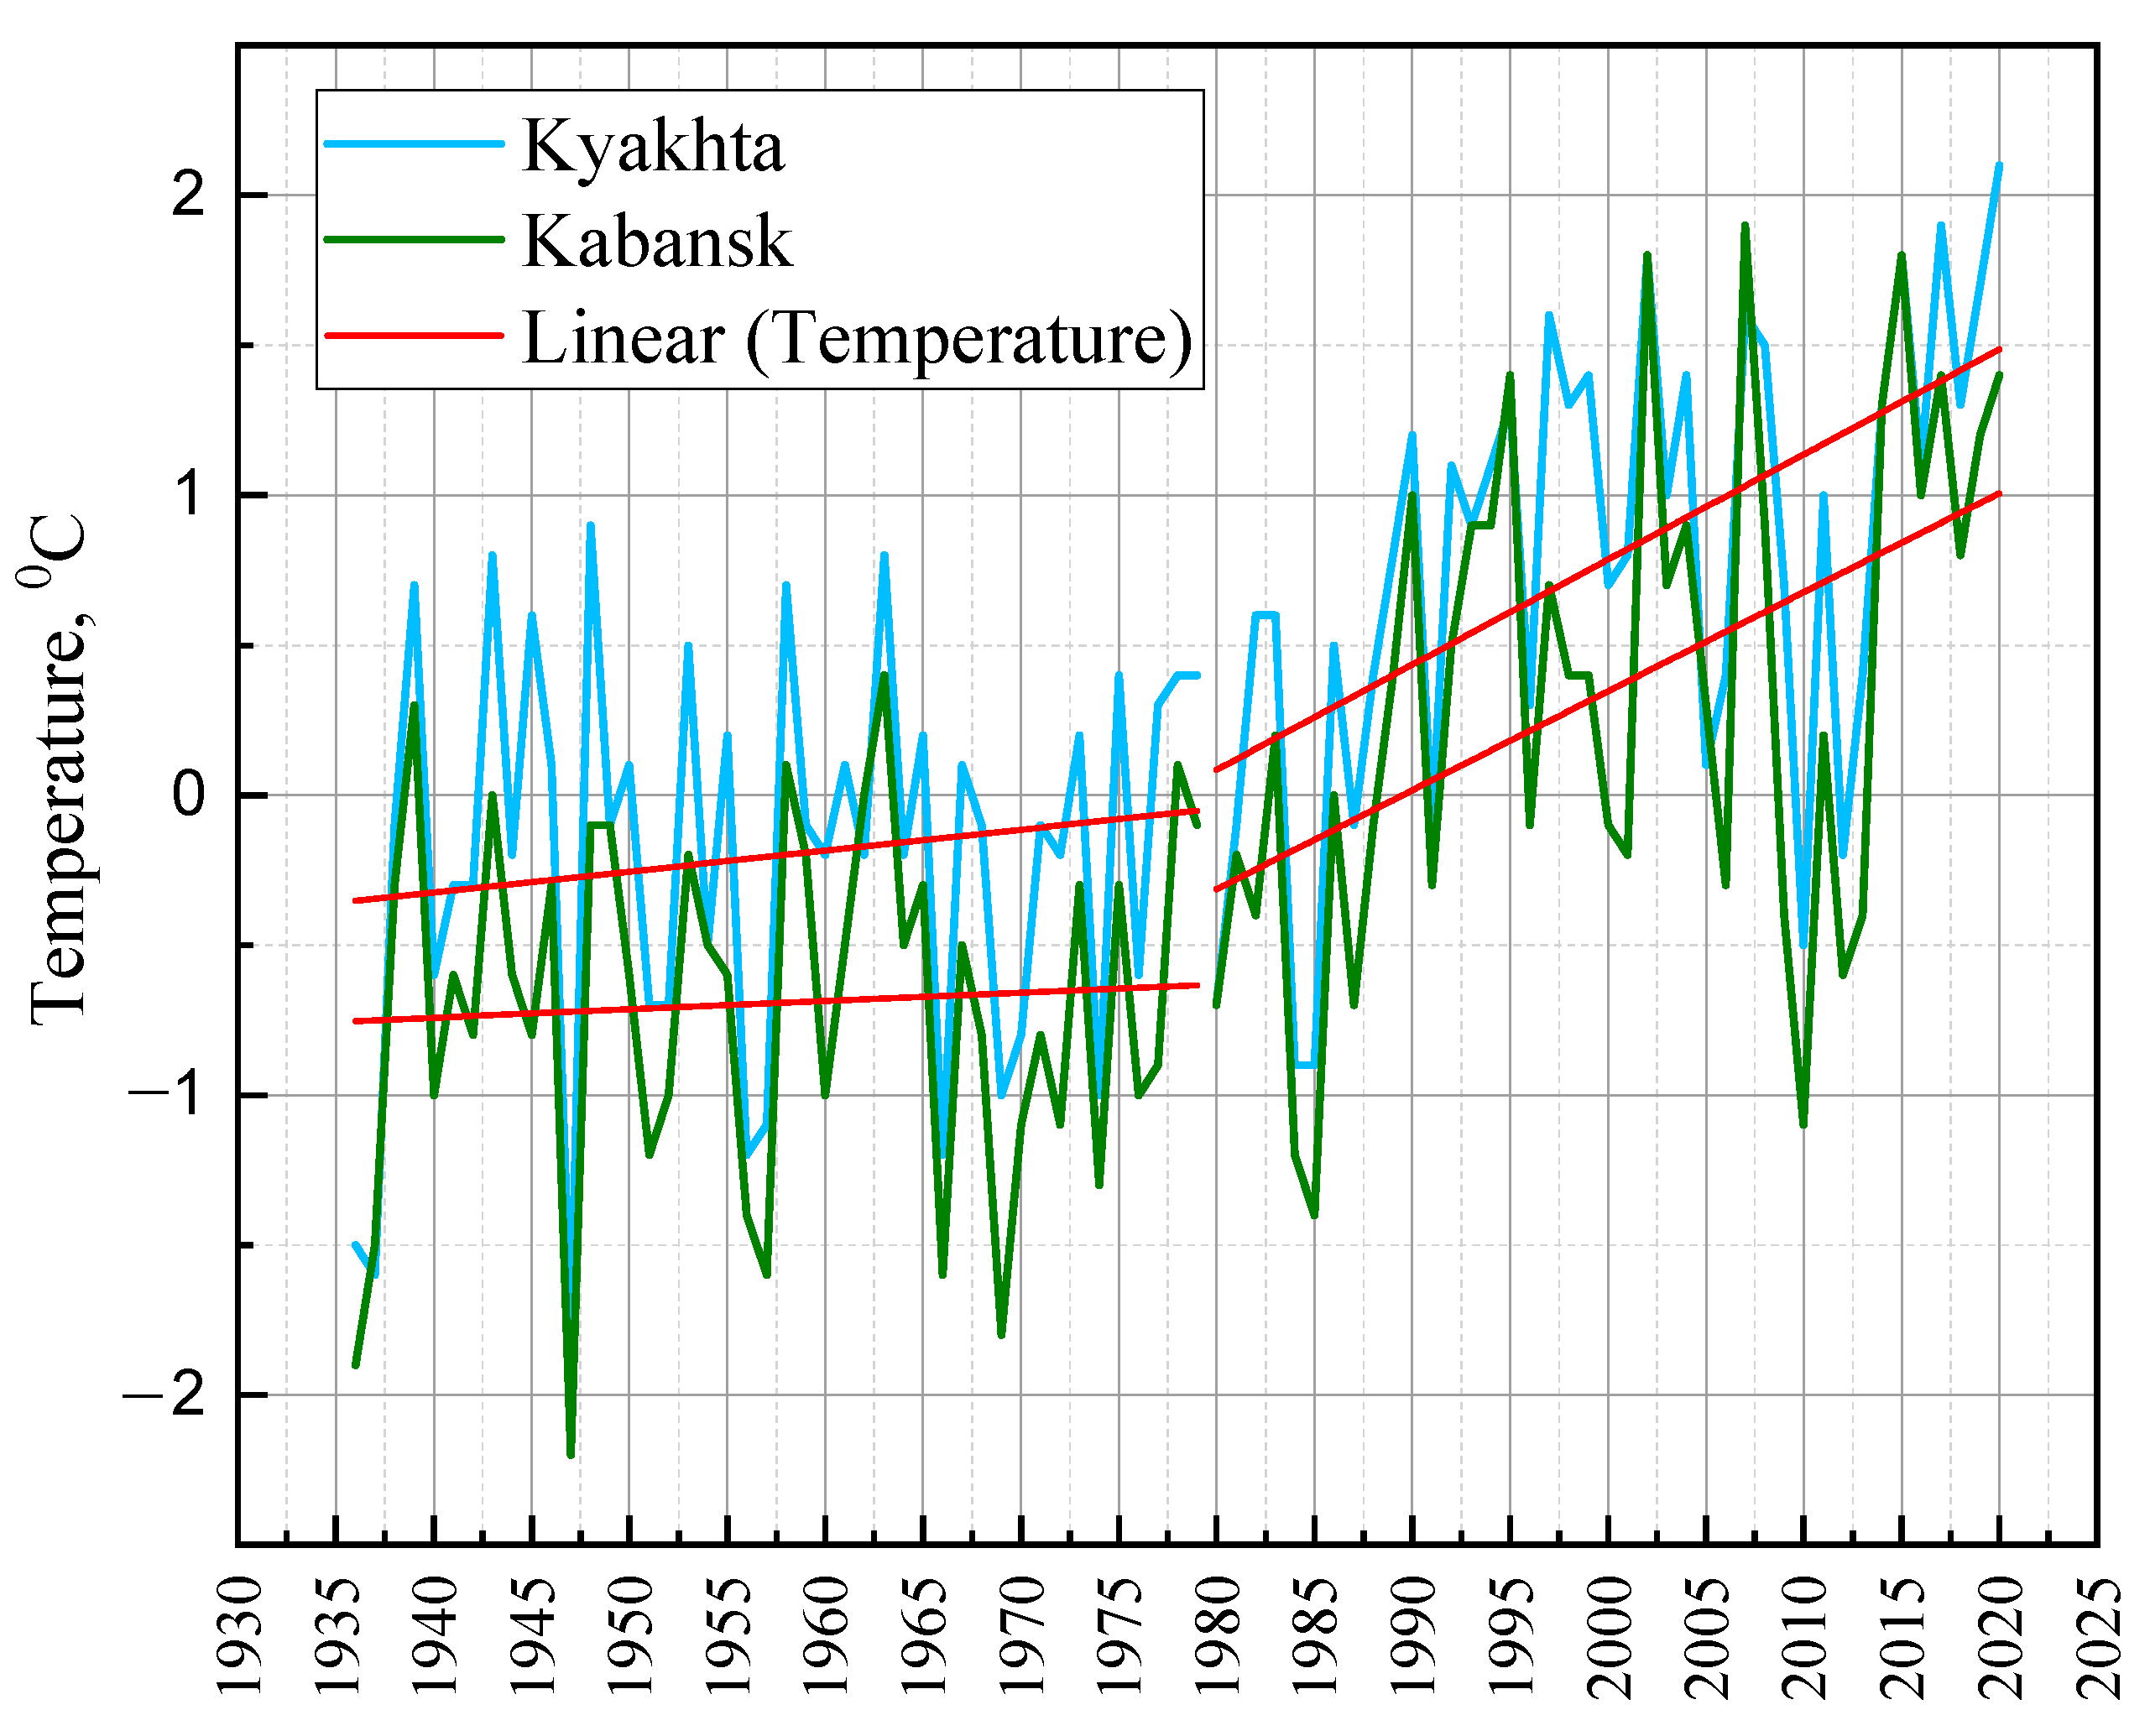
52]. The downward trend in the amount of precipitation can be related to changes in air temperature [53]. The global air temperature has increased by 1.2 °C since the beginning of industrialization [54], with a change in the atmospheric circulation, which in turn affects the amount of precipitation. During the period from 1936 to 2021, the mean annual air temperatures at the Kyakhta and Kabansk stations were 0.3 °C and −0.2 °C, respectively. The maximum 2.1 °C and the minimum 1.8 °C were recorded at the Kyakhta station in 2020 and 1947, respectively. The maximum value of 1.9 °C in 2007 and the minimum −2.2 °C in 1947 were recorded at the Kabansk station. Based on the graph, the air temperature began to rise sharply after 1980 (Figure 12). The consequence of such a sharp temperature rise can be climate change.
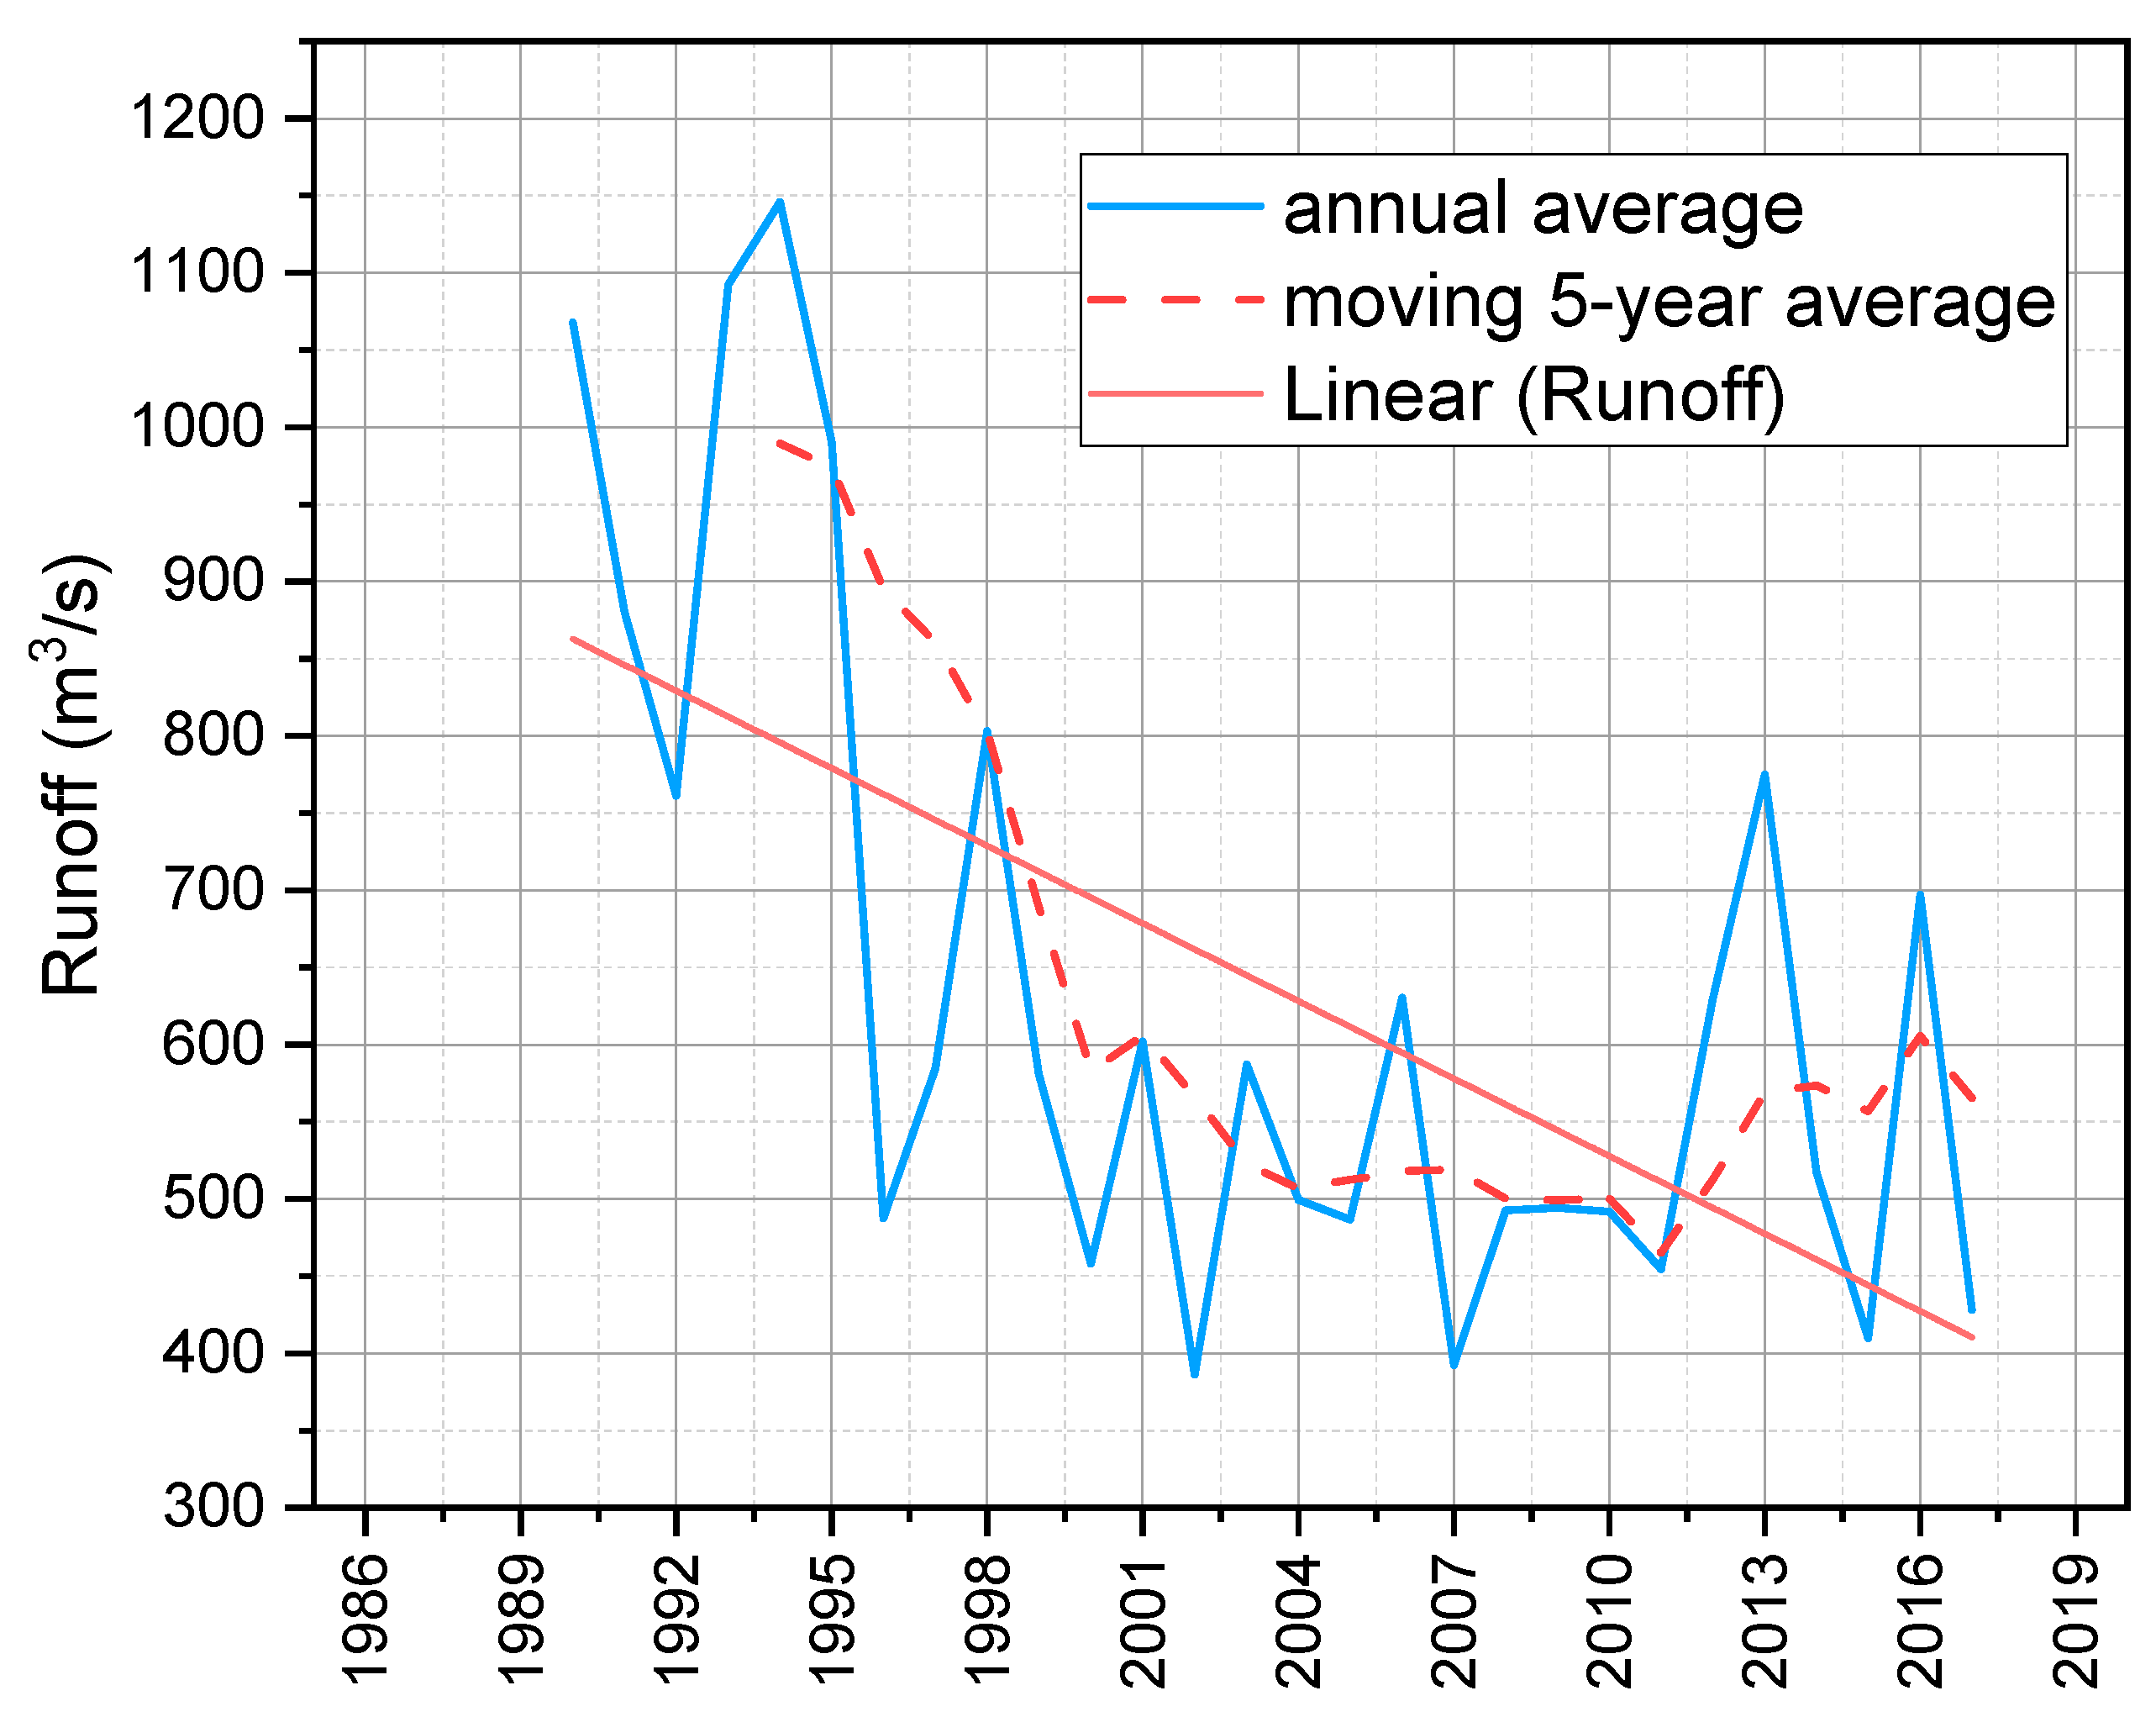
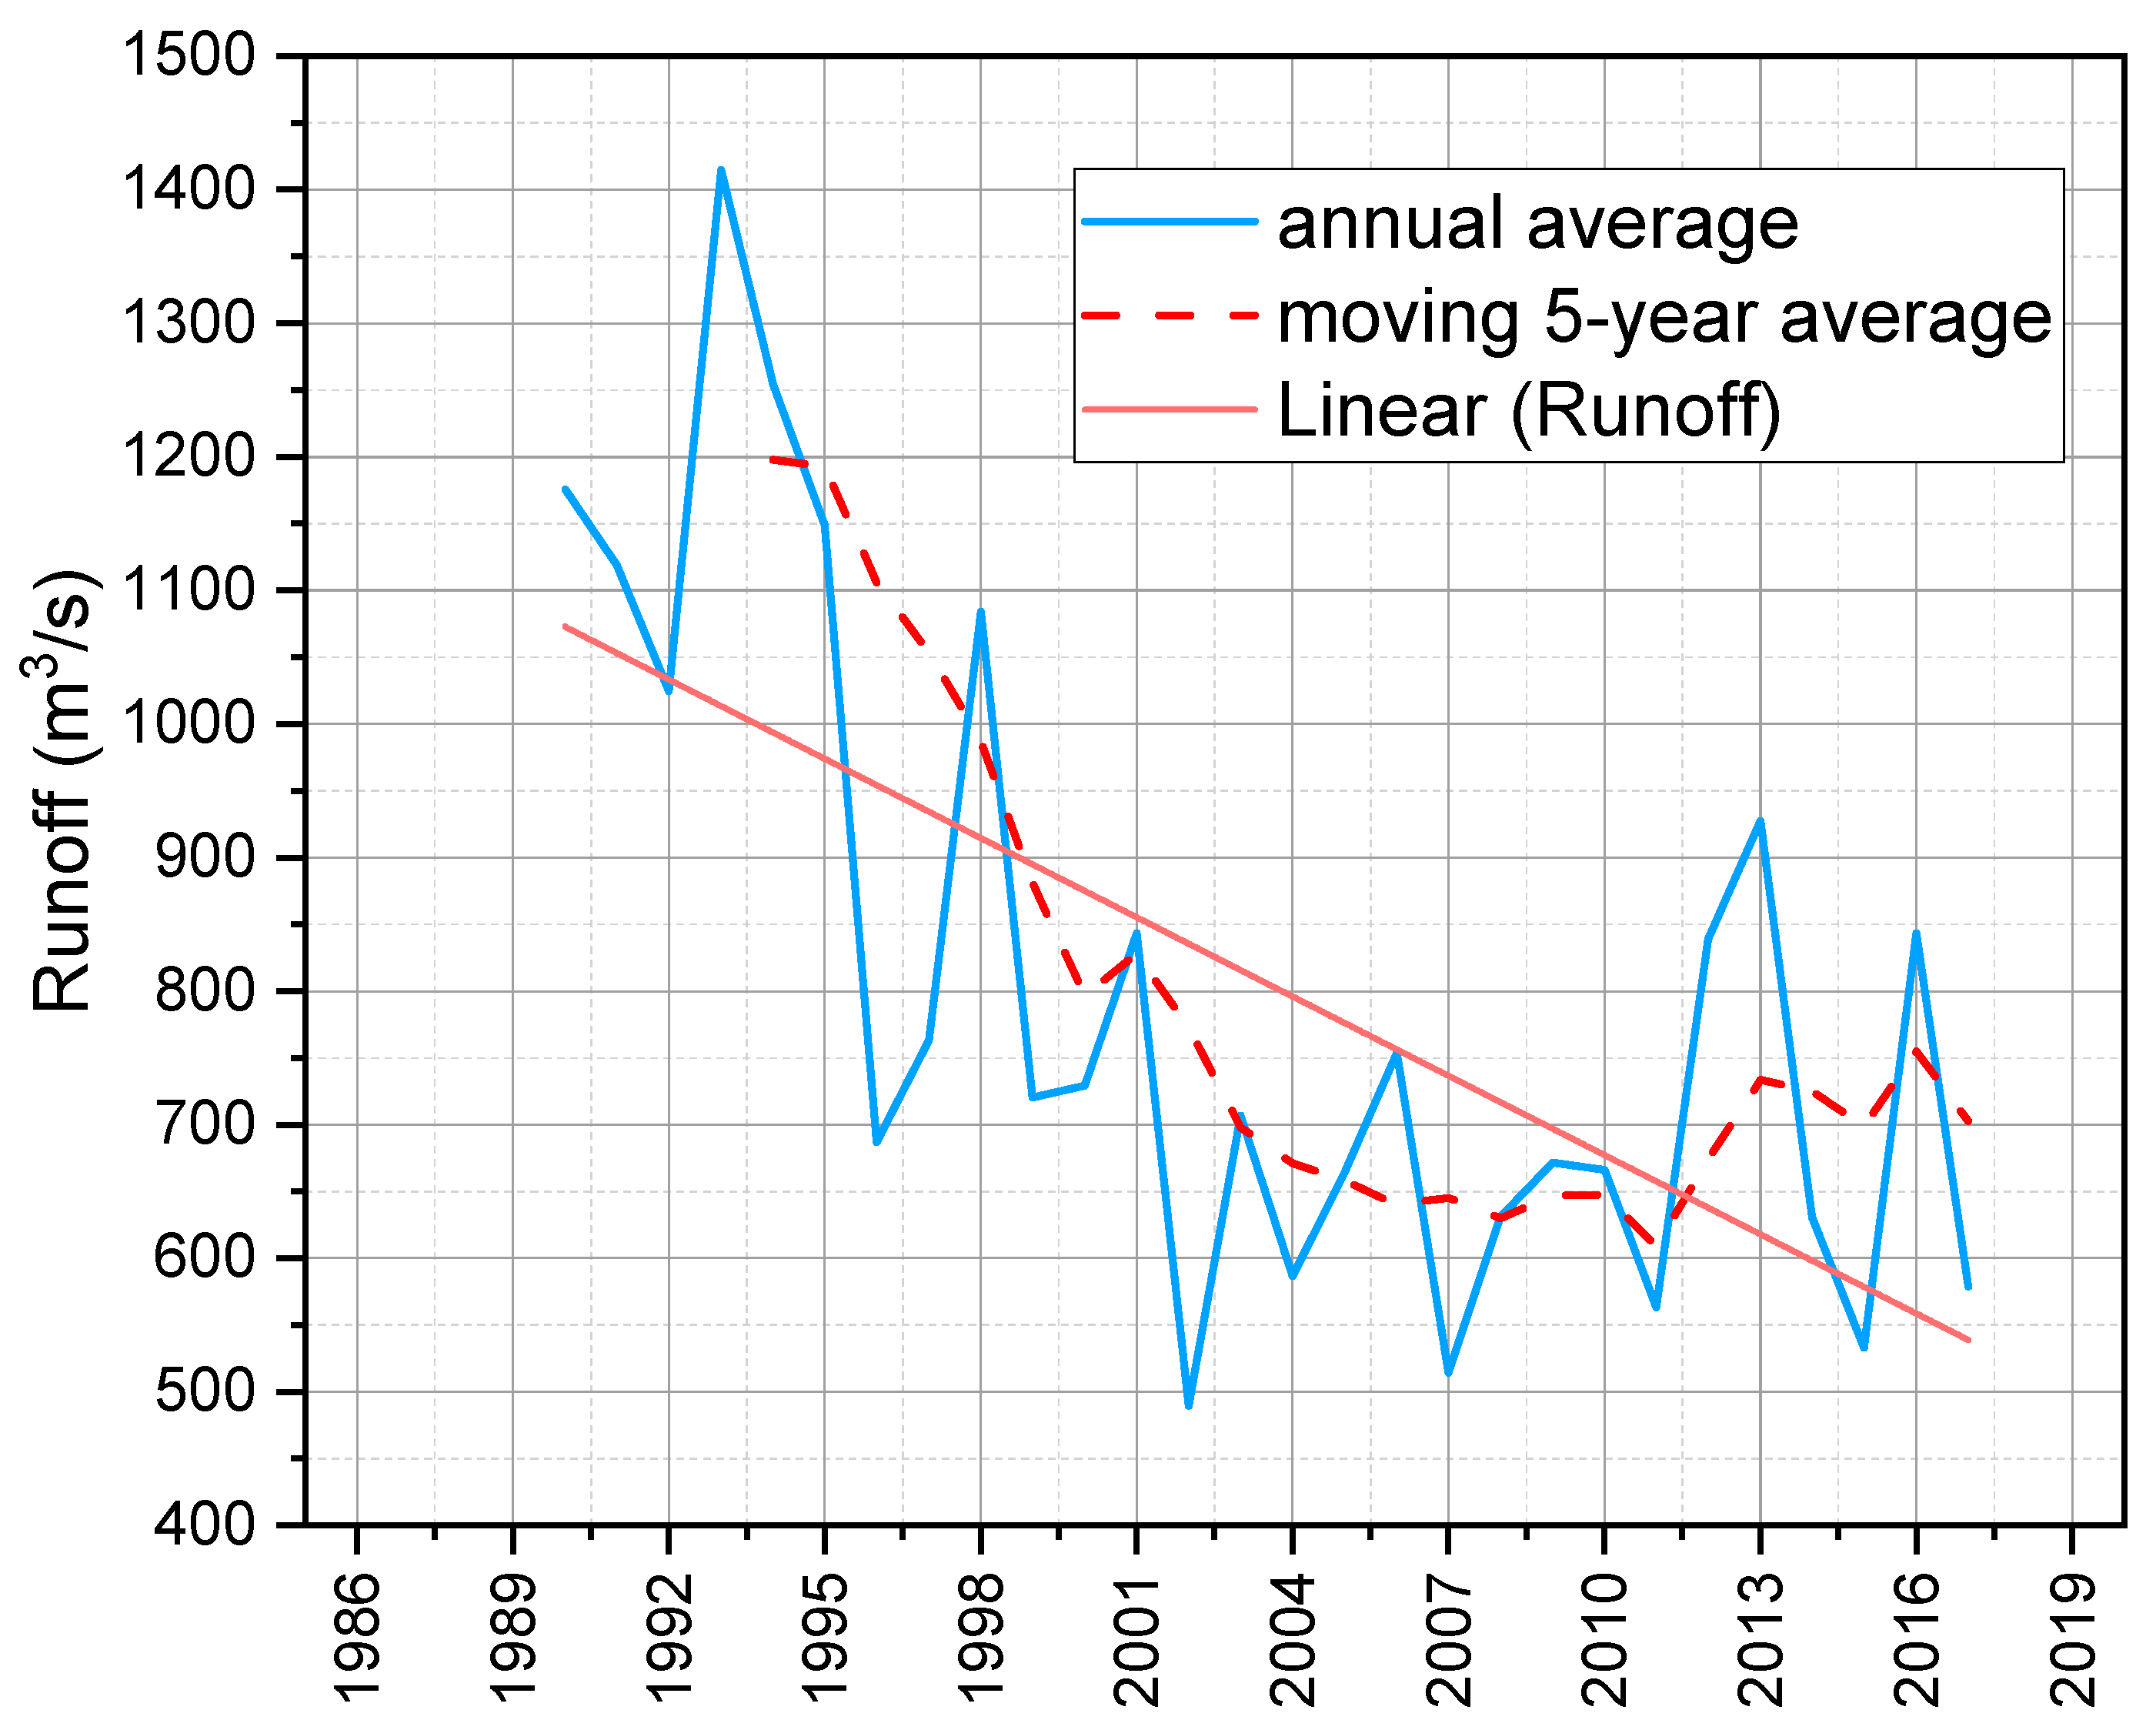
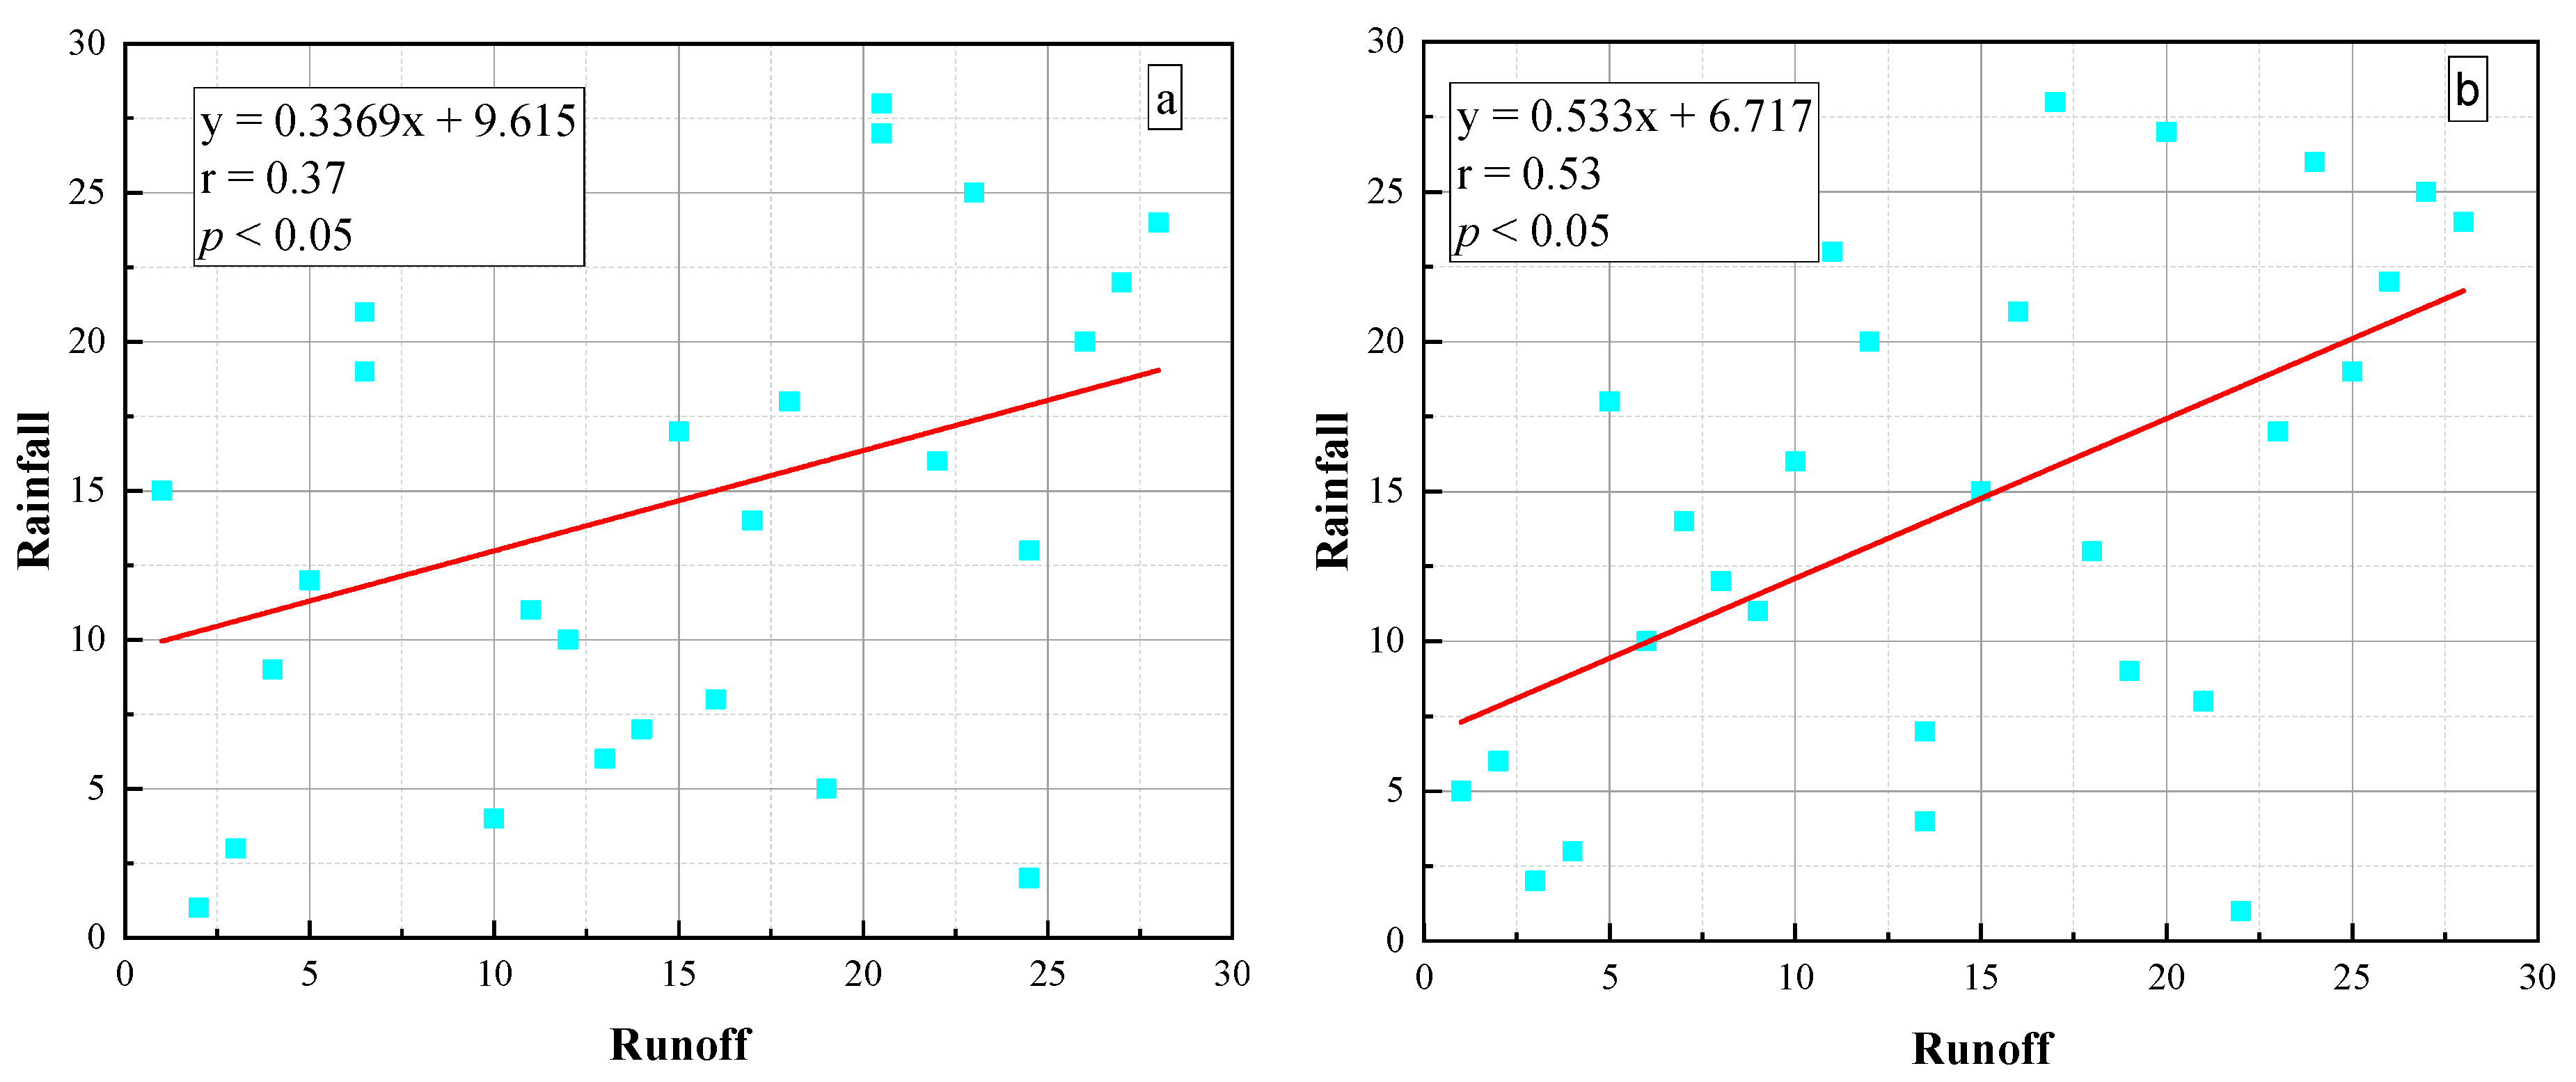
The analysis revealed an insignificant downward runoff trend at two hydrological stations in the Russian part of the Selenga basin. The maximum runoff and precipitation levels were recorded in the summer months and the first half of autumn. The lowest runoff values were in the winter period. Analysis of precipitation and runoff data in the Mongolian part of the Selenga River basin, performed by scientists from different countries, also showed a negative trend at some hydrological stations [15]. To assess the correlation between precipitation and runoff, we calculated Spearman rank correlation coefficients of the average annual data for two stations—Novoselenginsk and Mostovoi (Figure 13), for which a weak (r = 0.37) and a moderate correlation (r = 0.53) was identified, respectively.
We also carried out the correlation tests for air temperature and precipitation over the past 50 years, and calculated the Spearman rank correlation coefficient of the average annual data for the two stations (Figure 14). At the Novoselenginsk station, the rank correlation coefficient showed a moderate positive relationship (0.45), and strong relationship at the Ulan-Ude station (0.65).
The weak correlation between the Selenga runoff and precipitation for the weather stations located in close proximity to the river may be due to the strong dependence of the Selenga runoff on the runoff of its tributaries (especially large rivers—Chikoi and Khilok), which in turn are determined by precipitation in their watershed. In other words, the Selenga runoff depends on the amount of precipitation that falls throughout its watershed.
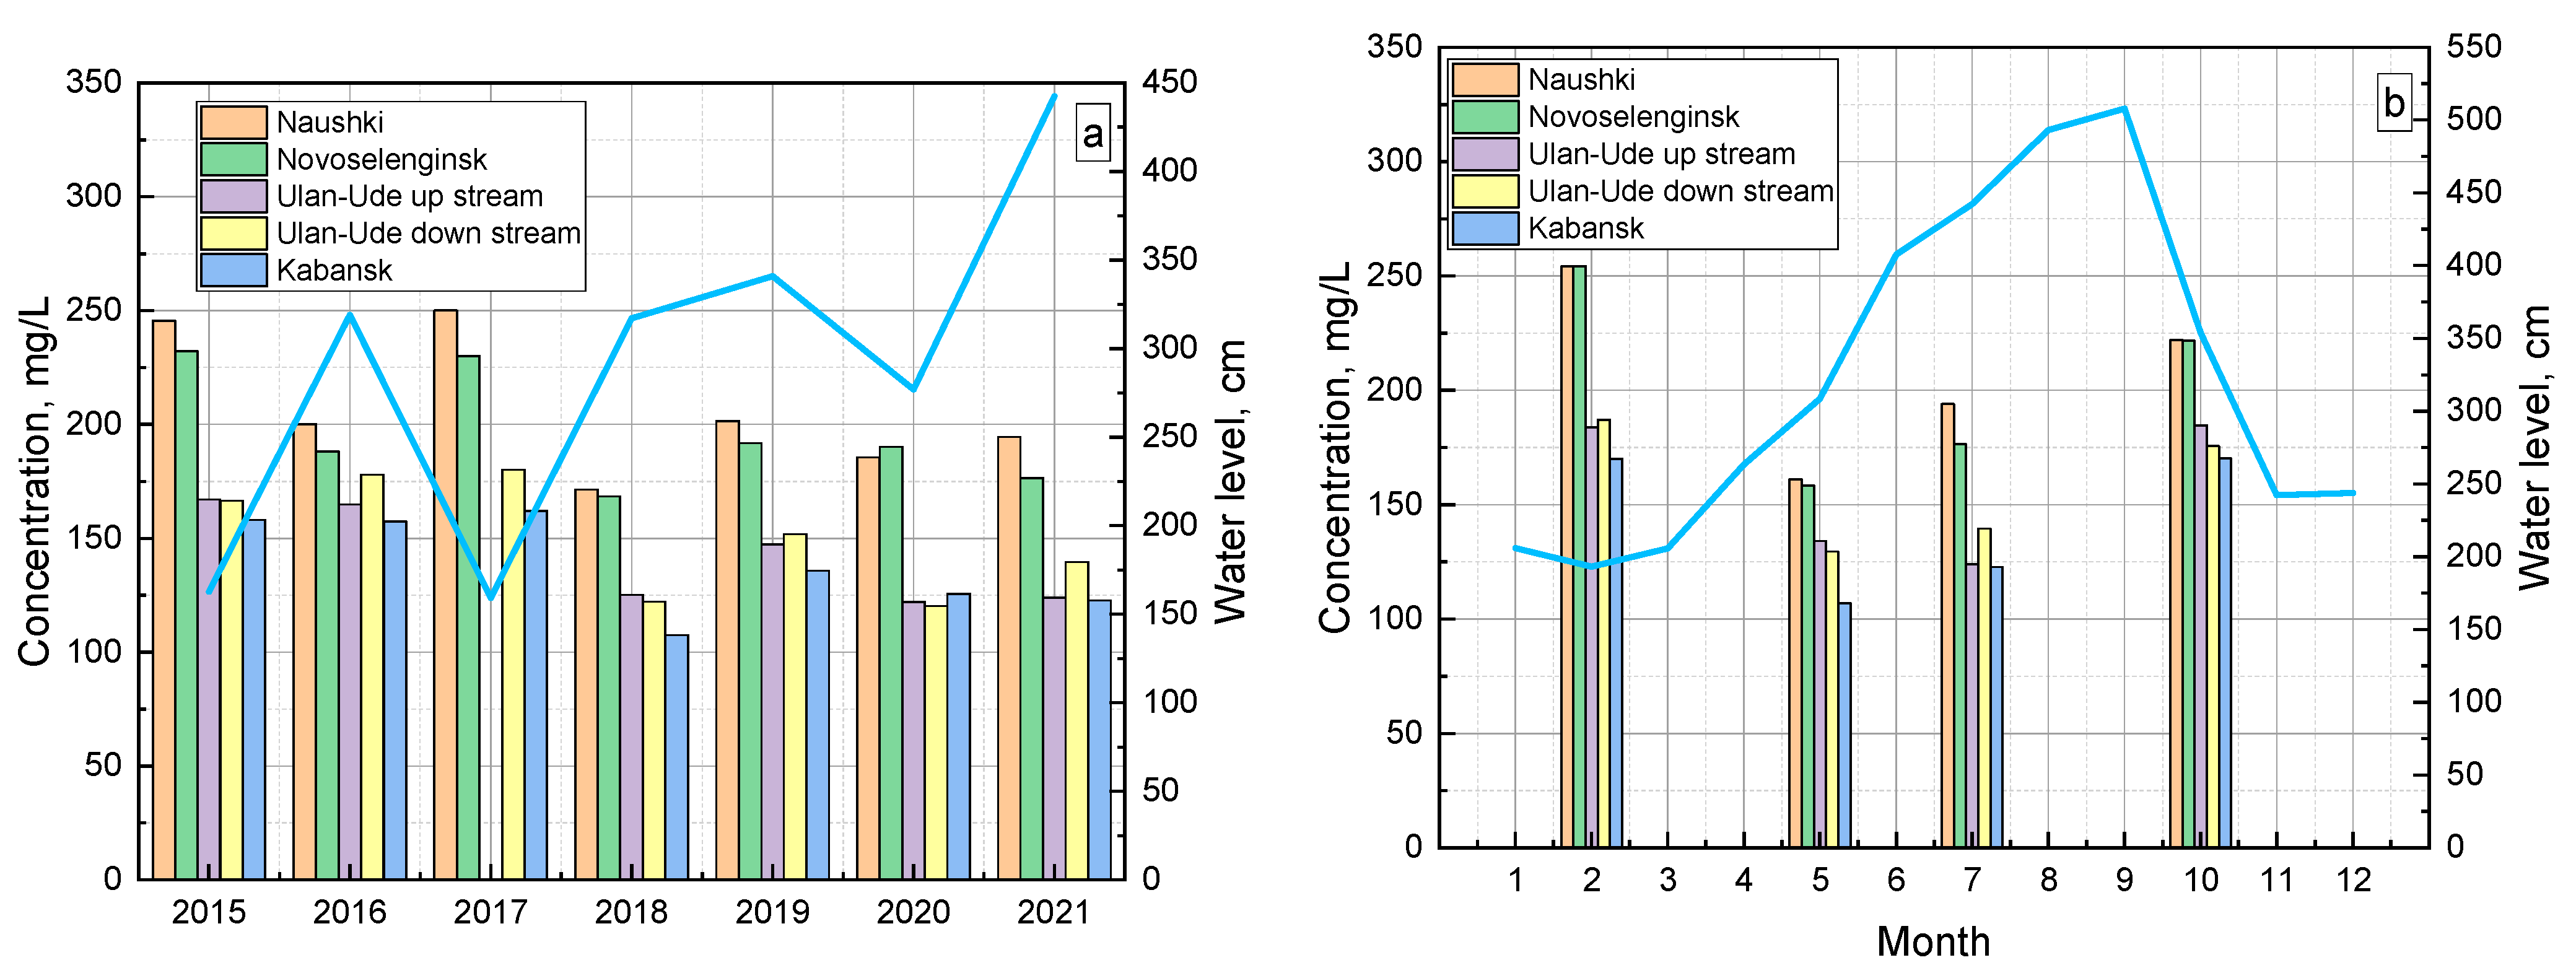
The water of the Selenga by chemical composition belongs to the hydrocarbonate class (the calcium group, the first type), according to O.A. Alekin’s classification. It has low mineralization, which varies depending on multi–year and seasonal fluctuations in water level [32,33]. The hydrochemical regime of the Selenga is characterized by an increase in major ions and salinity during the subglacial period, and a decrease during the spring flood and summer rainfall floods. Downstream of the Selenga (from Naushki settlement to the delta) salinity decreases by an average of 20–35% due to changing landscape conditions in the watershed, seasonal meteorological patterns, and the inflow of less saline tributaries that have a diluting effect. The spatial dynamics of SO42−, Cl, Na+ concentrations are influenced not only by the water level, but also by local sources of ions, such as meltwater or rainwater flushing from adjacent areas (ones with saline soils) and wastewater from the industrial complex in Ulan-Ude.
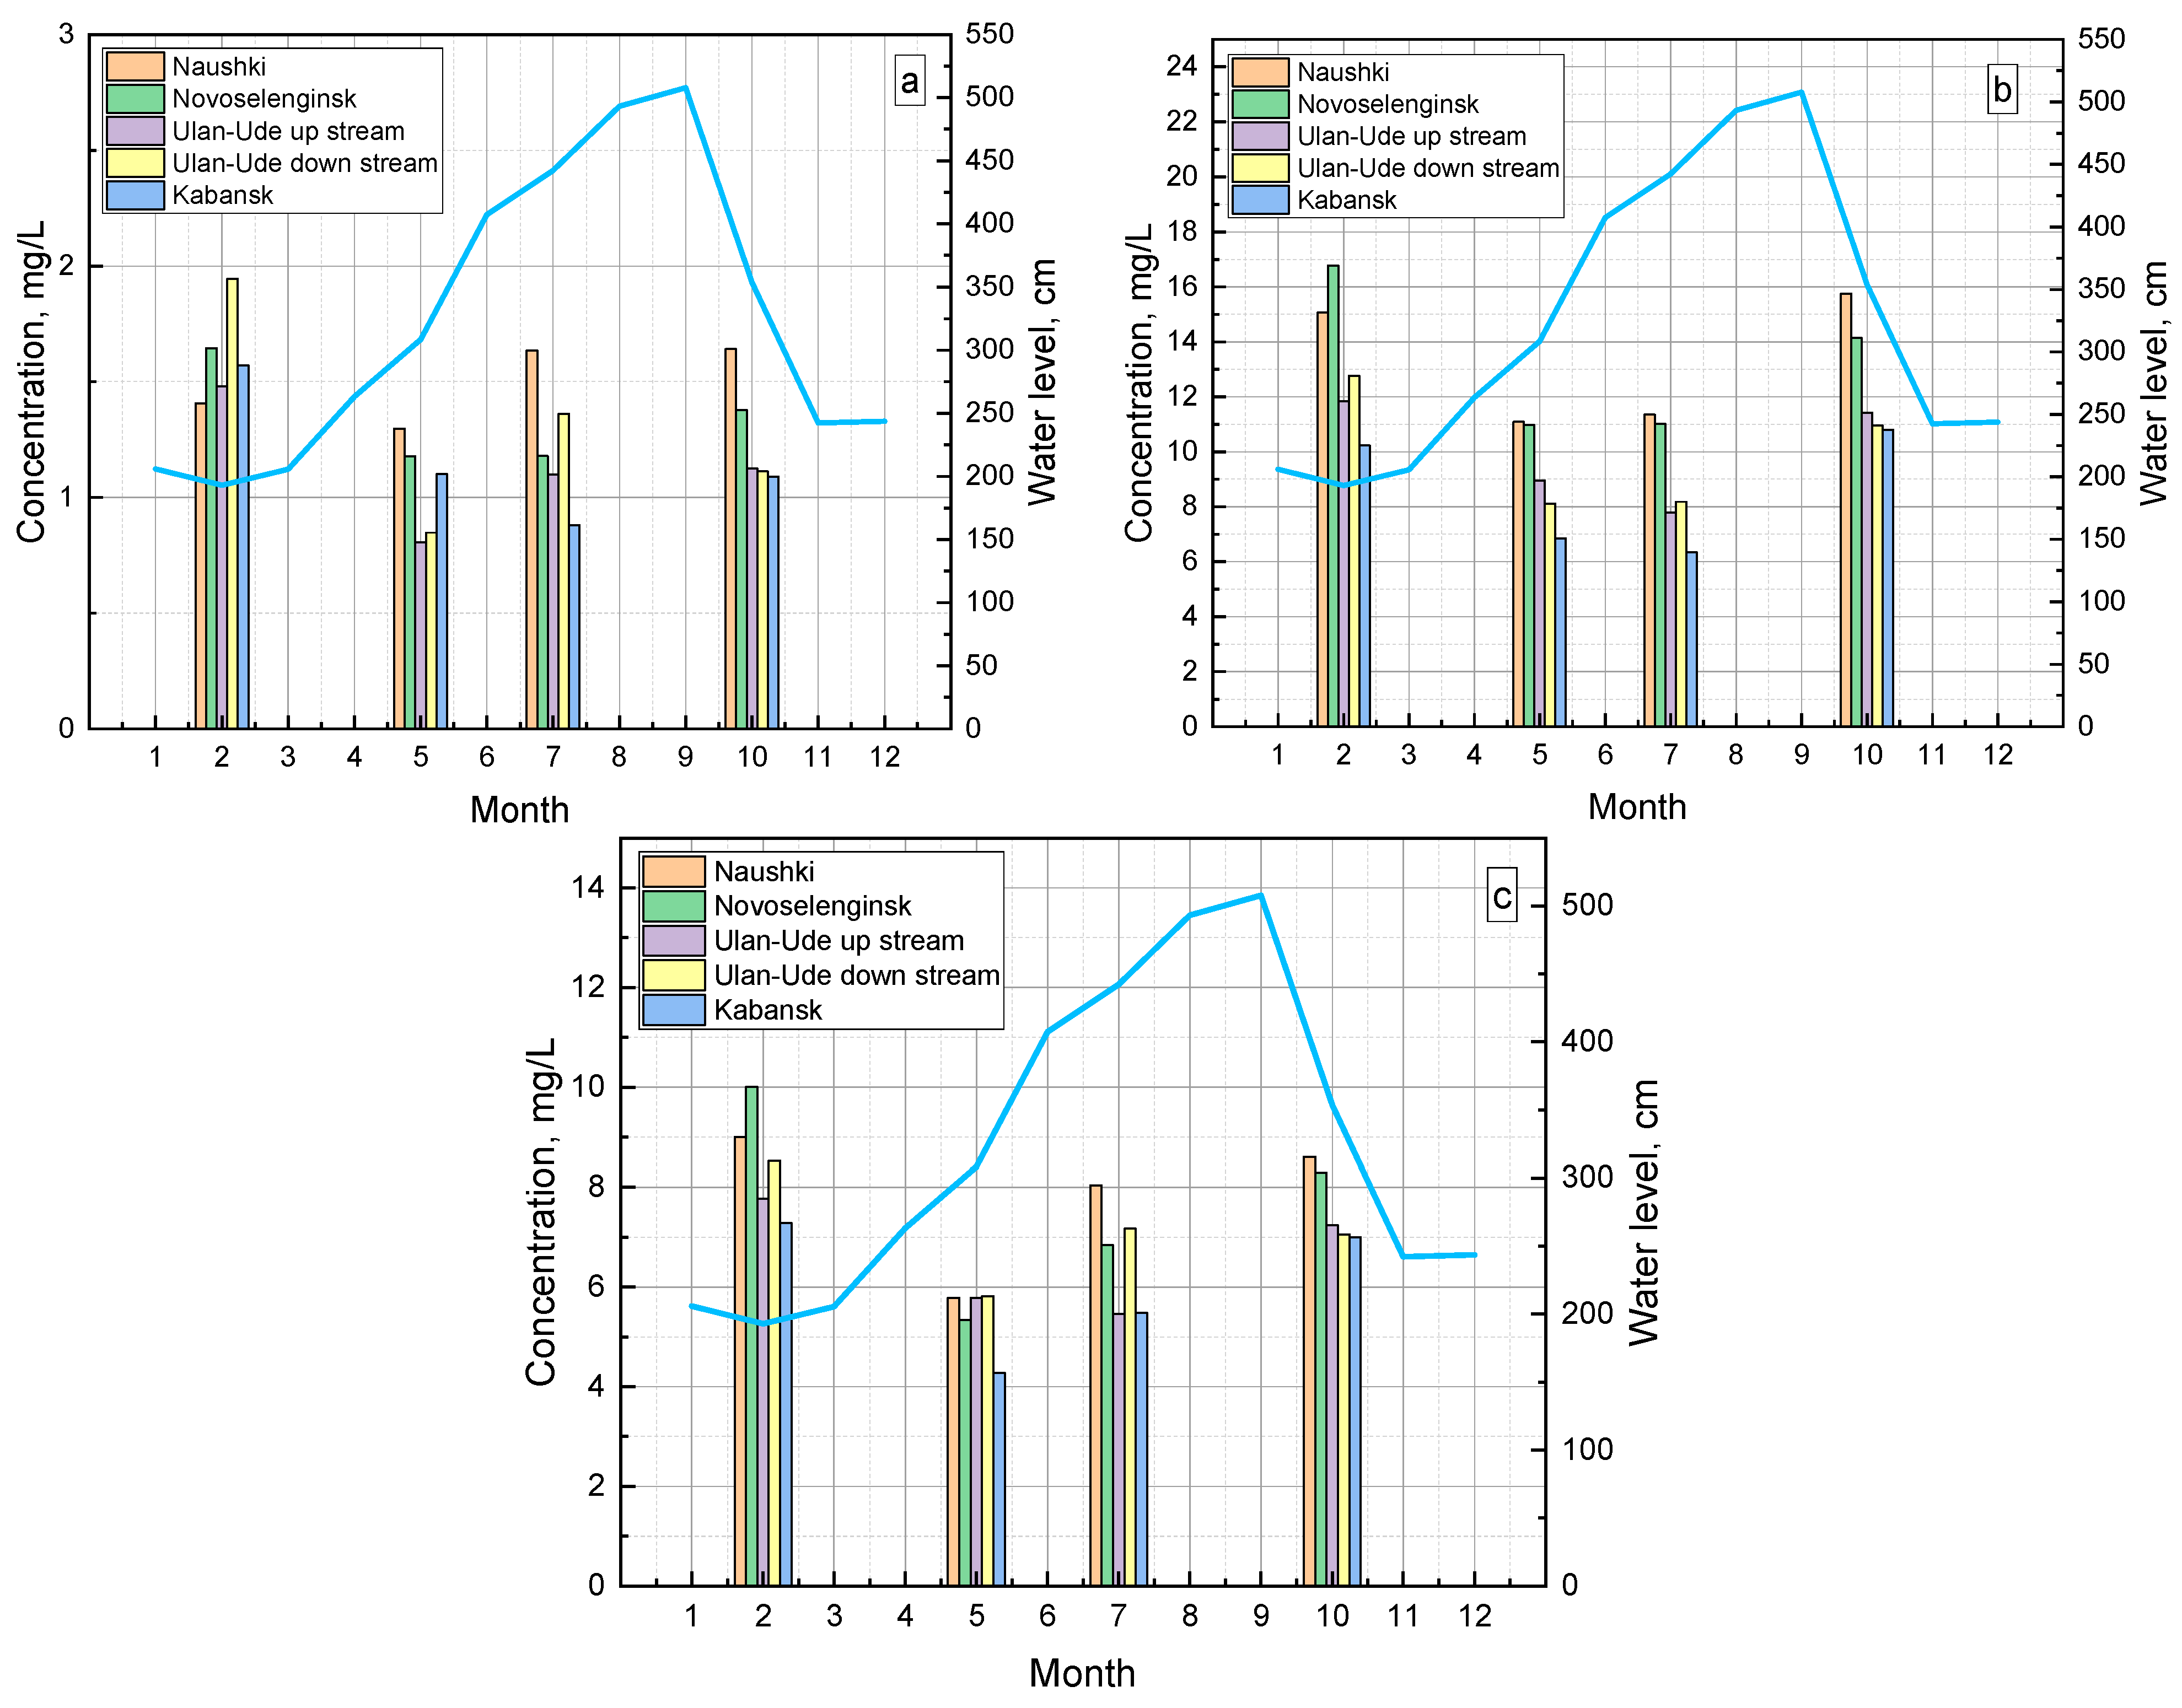
Comparison of these results with earlier observations (from the 1960s) showed a significant increase in sulfate concentrations in the water throughout the Russian section of the Selenga River, which is largely due to increased anthropogenic load. The increase in sulfate concentrations (especially in winter) is associated with both an increase in the proportion of underground feeding of the river in conditions of reduced water levels, as well as with the intensification of economic activity, mainly in the territory of Mongolia. The sulfate content has more than doubled in the waters coming from Mongolia. Compared to the pre–industrial period, the range of current SO42− concentrations in the Selenga water in winter increased from 7.2–10.4 mg/L [25] to 7.6–18.7 mg/L in 2010–2012. The sulfate concentrations we determined in winter 2018–2020 were in the range of 10.6–20.7 mg/L, confirming the increasing trend noted earlier [55].

5. Conclusions

Trend analysis of precipitation data for the Kyakhta, Novoselenginsk, Ulan-Ude, and Kabansk stations, as well as runoff data for the Novoselenginsk and Mostovoi hydrological stations, was performed using Mann Kendal and Sen’s slope statistical tests. We identified a slight downward trend at the Novoselenginsk, Ulan-Ude, and Kabansk weather stations, while a slight increase in precipitation was observed at the Kyakhta station. The results of the Mann Kendall test (p < 0.05) show that the data from the four weather stations show no significant changes in precipitation levels. The results of the Mann Kendal test at the Novoselenginsk and Mostovoi hydrological stations showed a downward trend in the runoff. The mean annual precipitation and runoff values shoed a direct positive correlation. Average annual air temperatures and precipitation levels showed a positive strong correlation. Analysis of runoff data for the Selenga for the period of 1990−2017 using the Mann-Kendal test showed a downward trend at the Novoselenginsk and Mostovoi stations (as well as for precipitation.
The hydrochemical regime of the Selenga is determined by the water level in the river and is characterized by an increase in major ions and salinity during the subglacial period and a decrease—during the open water period. An increase in water runoff is accompanied by a decrease in salinity and the content of major ions. Concentrations of sulfate, chloride, and sodium ions are also affected by local sources of their natural and anthropogenic origin. Communities living in the watershed of the Selenga River—the main tributary of Lake Baikal—should use water rationally and conserve the environment in the face of global climate change. Continuous monitoring of the basin’s water quality and anthropogenic impacts is also recommended.

Author Contributions

Conceptualization, T.Z.B., L.D.R. and V.G.S.; methodology, T.Z.B. and V.G.S.; software, T.Z.B.; validation, L.D.R., V.V.T. and B.V.S.; formal analysis, E.P.N. and B.V.S.; investigation, L.D.R., T.Z.B. and V.G.S.; resources, L.D.R.; data curation, T.Z.B. and B.Z.T.; writing—original draft preparation, T.Z.B., V.G.S. and L.D.R.; writing–review and editing, T.Z.B., P.W., V.S.B., Z.L. and S.D.; visualization, T.Z.B., V.G.S. and V.V.T.; supervision, L.D.R. and S.D.; project administration, S.D. and Z.L. All authors have read and agreed to the published version of the manuscript.

Funding

This research was funded by Science & Technology Fundamental Resources Investigation Program (Grant number No. 2022FY101900 and No. 2022FY101901) and within the framework of the State assignment of Baikal Institute of Nature Management SB RAS.

Institutional Review Board Statement

Not applicable.

Informed Consent Statement

Not applicable.

Data Availability Statement

Not applicable.

Conflicts of Interest

The authors declare no conflict of interest.

References

  1. Wang, Y.-S.; Gu, J.-D. Ecological responses, adaptation and mechanisms of mangrove wetland ecosystem to global climate change and anthropogenic activities. Int. Biodeterior. Biodegrad. 2021, 162, 105248. [Google Scholar] [CrossRef]
  2. Schneider, C.; Laizé, C.L.R.; Acreman, M.C.; Flörke, M. How will climate change modify river flow regimes in Europe? Hydrol. Earth Syst. Sci. 2013, 17, 325–339. [Google Scholar] [CrossRef] [Green Version]
  3. Huntington, T.G. Evidence for intensification of the global water cycle: Review and synthesis. J. Hydrol. 2006, 319, 83–95. [Google Scholar] [CrossRef]
  4. Opoku, E.E.O.; Boachie, M.K. The environmental impact of industrialization and foreign direct investment. Energy Policy 2020, 137, 111178. [Google Scholar] [CrossRef]
  5. Chugunkova, A.V. Modeling of Logging Industry Dynamics Under the Global Climate Change: The Evidence from Siberian Regions. J. Sib. Fed. Univ. Humanit. Soc. Sci. 2020, 13, 1870–1879. [Google Scholar] [CrossRef]
  6. Shimaraev, M.N.; Kuimova, L.N.; Sinyukovich, V.N.; Tsekhanovsky, V.V. Climate and hydrological processes in Lake Baikal in the 20th century. Russ. Meteorol. Hydrol. 2002, 3, 52–58. [Google Scholar]
  7. Sinyukovich, V.N.; Chernyshov, M.S. Water regime of lake Baikal under conditions of climate change and anthropogenic influence. Quat. Int. 2019, 524, 93–101. [Google Scholar] [CrossRef]
  8. Latysheva, I.V.; Sinyukovich, V.N.; Chumakova, E.V. Recent Peculiarities of Hydrological and Meteorological Regime of the Lake Baikal Southern Coast. News Irkutsk. State Univ. 2009, 2, 117–133. [Google Scholar]
  9. Sizova, L.N.; Kuimova, L.N.; Shimaraev, M.N. Influence of The Atmospheric circulation on Ice-Thermal processes on Lake Baikal during 1950–2010. Geogr. Nat. Resour. 2012, 2, 158–165. [Google Scholar]
  10. Bibi, S.; Song, Q.; Zhang, Y.; Liu, Y.; Kamran, M.A.; Sha, L.; Zhou, W.; Wang, S.; Gnanamoorthy, P. Effects of climate change on terrestrial water storage and basin discharge in the Lancang River Basin. J. Hydrol. Reg. Stud. 2021, 37, 100896. [Google Scholar] [CrossRef]
  11. Potemkina, T.; Potemkin, V. Actual inflow of riverine sediment load into Lake Baikal: Main tributaries the Selenga, Upper Angara, and Barguzin Rivers (Russia). Limnol. Freshw. Biol. 2021, 4, 1111–1114. [Google Scholar] [CrossRef]
  12. Törnqvist, R.; Jarsjö, J.; Pietroń, J.; Bring, A.; Rogberg, P.; Asokan, S.M.; Destouni, G. Evolution of the hydro-climate system in the Lake Baikal basin. J. Hydrol. 2014, 519, 1953–1962. [Google Scholar] [CrossRef] [Green Version]
  13. Dorjsuren, B.; Yan, D.; Wang, H.; Chonokhuu, S.; Enkhbold, A.; Yiran, X.; Girma, A.; Gedefaw, M.; Abiyu, A. Observed Trends of Climate and River Discharge in Mongolia’s Selenga Sub-Basin of the Lake Baikal Basin. Water 2018, 10, 1436. [Google Scholar] [CrossRef]
  14. Panagoulia, D. Assessment of daily catchment precipitation in mountainous regions for climate change interpretation. Hydrol. Sci. J. 1995, 40, 331–350. [Google Scholar] [CrossRef]
  15. Panagoulia, D.G. Catchment hydrological responses to climate changes calculated from incomplete climatological data. Exch. Process. Land Surf. Ranee Space Time Scales 1993, 212, 461–468. [Google Scholar]
  16. Chebykin, E.P.; Goldberg, E.L.; Kulikova, N.S. Elemental composition of suspended particles from the surface waters of Lake Baikal in the zone affected by the Selenga River. Russ. Geol. Geophys. 2010, 51, 1126–1132. [Google Scholar] [CrossRef]
  17. Sinyukovich, V. The water balance of the Selenga River basin. Geogr. Nat. Resour. 2008, 29, 54–56. [Google Scholar] [CrossRef]
  18. Frolova, N.L.; Belyakova, P.A.; Grigoriev, V.Y.; Sazonov, A.A.; Zotov, L.V.; Jarsjö, J. Runoff fluctuations in the Selenga River Basin. Reg. Environ. Chang. 2017, 17, 1965–1976. [Google Scholar] [CrossRef]
  19. Pietroń, J.; Nittrouer, J.A.; Chalov, S.R.; Dong, T.Y.; Kasimov, N.; Shinkareva, G.; Jarsjö, J. Sedimentation patterns in the Selenga River delta under changing hydroclimatic conditions. Hydrol. Process. 2018, 32, 278–292. [Google Scholar] [CrossRef]
  20. Grigorev, V.Y.; Kharlamov, M.A.; Semenova, N.K.; Sazonov, A.A.; Chalov, S.R. Impact of precipitation and evaporation change on flood runoff over Lake Baikal catchment. Environ. Earth Sci. 2022, 82, 16. [Google Scholar] [CrossRef]
  21. Mongolian Statistical Yearbook; Mongolian Statistical Information Service: Ulan-Bator, Mongolia, 2022; p. 792.
  22. Russian Statistical Yearbook; Report; Federal State Statistics Service: Moscow, Russia, 2022; p. 459.
  23. Votintsev, K.K.; Glazunov, I.V.; Tolmacheva, P. Hydrochemistry of Rivers of the Lake Baikal Basin; Nauka: Moscow, Russia, 1965. [Google Scholar]
  24. Bochkarev, P.F. Hydrochemistry of the Rivers of Eastern Siberia; Vostochno-Sibirskoe Knizhnoe Izdatelstvo: Irkutsk, Russia, 1959. [Google Scholar]
  25. Khazheeva, Z.I.; Plyusnin, A.M. Variations in climatic and hydrological parameters in the Selenga River basin in the Russian Federation. Russ. Meteorol. Hydrol. 2016, 41, 640–647. [Google Scholar] [CrossRef]
  26. Sinyukovich, V.; Sizova, L.N.; Shimaraev, M.N.; Kurbatova, N.N. Features of modern changes in the inflow of water into Lake Baikal. Geogr. Nat. Resour. 2013, 4, 57–63. [Google Scholar]
  27. Karthe, D.; Kasimov, N.S.; Chalov, S.R.; Shinkareva, G.L.; Malsy, M.; Menzel, L.; Theuring, P.; Hartwig, M.; Schweitzer, C.; Hofmann, J.; et al. Integrating multi-scale data for the assessment of water availability and quality in the Kharaa-Orkhon-Selenga river system. Geogr. Environ. Sustain. 2014, 7, 65–86. [Google Scholar] [CrossRef] [Green Version]
  28. Berezhnykh, T.V.; Marchenko, O.Y.; Abasov, N.V.; Mordvinov, V.I. Changes in the summertime atmospheric circulation over East Asia and formation of long-lasting low-water periods within the Selenga river basin. Geogr. Nat. Resour. 2012, 33, 223–229. [Google Scholar] [CrossRef]
  29. Obozhin, V.N.; Bogdanov, V.T.; Klikunova, O.F. Hydrochemistry of Rivers and Lakes in Buryatia; Nauka: Novosibirsk, Russia, 1984. [Google Scholar]
  30. Sorokovikova, L.M.; Sinyukovich, V.N.; Dryukker, V.V.; Potemkina, T.G.; Netsvetaeva, O.G.; Afanasyev, V.A. Ecological Characteristics of the Selenga River in Flooding Conditions. Geogr. Nat. Resour. 1995, 4, 64–70. [Google Scholar]
  31. Sorokovikova, L.M.; Sinyukovich, V.N.; Golobokova, L.; Chubarov, M.R. Formation of the dissolved solids discharge in the Selenga River under the present conditions. Water Resour. 2000, 27, 509–515. [Google Scholar]
  32. Sorokovikova, L.M.; Popovskaya, G.I.; Tomberg, I.V.; Sinyukovich, V.N.; Kravchenko, O.S.; Marinaite, I.I.; Bashenkhaeva, N.V.; Khodzher, T.V. The Selenga River water quality on the border with Mongolia at the beginning of the 21st century. Russ. Meteorol. Hydrol. 2013, 38, 126–133. [Google Scholar] [CrossRef]
  33. Chebykin, E.P.; Sorokovikova, L.M.; Tomberg, I.V.; Vodneva, E.N.; Rasskazov, S.V.; Khodzher, T.V.; Grachev, M.A. Current State of Waters of the Selenga River in the Territory of Russia According to the Main Components and Trace Elements. Chem. Interests Sustain. Dev. 2012, 20, 613–631. [Google Scholar]
  34. Kasimov, N.; Shinkareva, G.; Lychagin, M.; Kosheleva, N.; Chalov, S.; Pashkina, M.; Thorslund, J.; Jarsjö, J. River Water Quality of the Selenga-Baikal Basin: Part I—Spatio-Temporal Patterns of Dissolved and Suspended Metals. Water 2020, 12, 2137. [Google Scholar] [CrossRef]
  35. Potemkina, T.G.; Potemkin, V.L.; Fedotov, A.P. Climatic factors as risks of recent ecological changes in the shallow zone of Lake Baikal. Russ. Geol. Geophys. 2018, 59, 556–565. [Google Scholar] [CrossRef]
  36. Aminjafari, S.; Brown, I.; Chalov, S.R.; Simard, M.; Lane, C.R.; Jarsjö, J.; Darvishi, M.; Jaramillo, F. Drivers and extent of surface water occurrence in the Selenga River Delta, Russia. J. Hydrol. Reg. Stud. 2021, 38, 100945. [Google Scholar] [CrossRef] [PubMed]
  37. Galazy, G. The Lake Baikal; Atlas; Roskartography: Moscow, Russia, 1993; p. 160. [Google Scholar]
  38. Kasimov, N.S.; Kosheleva, N.; Lychagin, M.; Chalov, S.; Alekseenko, A.; Bazilova, V.; Beshentsev, A.; Bogdanova, M.; Chernov, A.; Dorjgotov, D.; et al. Environmental Atlas-Monograph “Selenga-Baikal”; Faculty of Geography of Lomonosov Moscow State University: Moscow, Russia, 2019. [Google Scholar]
  39. World Meteorological Organization. Available online: http://climexp.knmi.nl/getstations.cgi (accessed on 2 December 2022).
  40. Marchenko, O.Y. Conditions of Formation and Long-Term Changes of Extreme Water Content in the Selenga River Basin; Institute of Water Problems of the Russian Academy of Sciences: Moscow, Russia, 2013. [Google Scholar]
  41. Mann, H.B. Nonparametric Tests Against Trend. Econometrica 1945, 13, 245–259. [Google Scholar] [CrossRef]
  42. da Silva, R.M.; Santos, C.A.G.; Moreira, M.; Corte-Real, J.; Silva, V.C.L.; Medeiros, I.C. Rainfall and river flow trends using Mann–Kendall and Sen’s slope estimator statistical tests in the Cobres River basin. Nat. Hazards 2015, 77, 1205–1221. [Google Scholar] [CrossRef]
  43. Hirsch, M.R.; Slack, R.J. A nonparametric trend test for seasonal data with serial dependence. Water Resour. Bull. 1984, 20, 727–732. [Google Scholar] [CrossRef] [Green Version]
  44. Donald, W.M.; Jean, S.; Steven, A.D.; Jon, B.H. Statistical Analysis for Monotonic Trends, Tech Notes 6, November 2011; Developed for U.S. Environmental Protection Agency by Tetra Tech, Inc.: Fairfax, VA, USA, 2011; n23p. [Google Scholar]
  45. Helsel, D.; Hirsch, R.M.; Ryberg, K.R.; Archfield, S.A.; Gilroy, E.J. Statistical methods in water resources. In Techniques and Methods; Elsevier: Amsterdam, The Netherlands, 2020. [Google Scholar]
  46. Helsel, D.; Hirsch, R. Statistical Methods in Water Resources; Elsevier: Amsterdam, The Netherlands, 2002; Volume 49. [Google Scholar]
  47. Technical Documents for Wet Deposition Monitoring in East Asia. March 2000. Available online: http://www.eanet.asia/product/manual/prev/techwet.pdf (accessed on 30 September 2021).
  48. Gelfan, A.N.; Millionshchikova, T.D. Validation of a Hydrological Model Intended for Impact Study: Problem Statement and Solution Example for Selenga River Basin. Water Resour. 2018, 45, 90–101. [Google Scholar] [CrossRef]
  49. Badmaev, N.; Bazarov, A. Correlation analysis of terrestrial and satellite meteodata in the territory of the Republic of Buryatia (Eastern Siberia, Russian Federation) with forest fire statistics. Agric. For. Meteorol. 2021, 297, 108245. [Google Scholar] [CrossRef]
  50. Potemkina, T.; Potemkin, V. Quantifying the actual sediment load flux into Lake Baikal: A case study of the main tributary—The Selenga River (Russia). Int. J. Sediment Res. 2022, 37, 238–247. [Google Scholar] [CrossRef]
  51. Garmaev, E.Z.; Khristoforov, A.V. Water Resources of the Rivers of the Lake Baikal Basin: The Basics of Their Use and Protection; Geo: Novosibirsk, Russia, 2010. [Google Scholar]
  52. Frolova, N.L.; Belyakova, P.A.; Grigor’ev, V.Y.; Sazonov, A.A.; Zotov, L.V. Many-year variations of river runoff in the Selenga basin. Water Resour. 2017, 44, 359–371. [Google Scholar] [CrossRef]
  53. Oh, S.-G.; Son, S.-W.; Min, S.-K. Possible impact of urbanization on extreme precipitation–temperature relationship in East Asian megacities. Weather. Clim. Extrem. 2021, 34, 100401. [Google Scholar] [CrossRef]
  54. Wang, J.-W.; Huang, J.-T.; Fang, T.; Song, G.; Sun, F.-Q. Relationship of underground water level and climate in Northwest China’s inland basins under the global climate change: Taking the Golmud River Catchment as an example. China Geol. 2021, 4, 1–8. [Google Scholar] [CrossRef]
  55. Sorokovikova, L.M.; Sinyukovich, V.N.; Tomberg, I.V.; Marinaite, I.I.; Hodger, T.V. Assessment of the water quality of the tributaries of Lake Baikal by chemical indicators. Geogr. Nat. Resour. 2015, 1, 37–45. [Google Scholar]
Figure 1. Location of the Selenga River basin, water gauge stations, meteorological stations, and sampling points on the territory of Russia.
Water 15 00197 g001
Figure 2. Rainfall trend at the Kyakhta station for the period of 1936–2021.
Water 15 00197 g002
Figure 3. Rainfall trend at the Novoselenginsk station for the period of 1936–2021.
Water 15 00197 g003
Figure 4. Rainfall trend at the Ulan-Ude station for the period of 1936–2021.
Water 15 00197 g004
Figure 5. Rainfall trend at the Kabansk station for the period of 1936–2021.
Water 15 00197 g005
Figure 6. Runoff trend at the Novoselenginsk station for the period of 1990–2017.
Water 15 00197 g006
Figure 7. Runoff trend at the Mostovoi station for the period 1990–2017.
Water 15 00197 g007
Figure 8. Summary of rainfall and runoff trends.
Water 15 00197 g008
Figure 9. Spatiotemporal (a) and seasonal (b) changes in water salinity in the Selenga.
Water 15 00197 g009
Figure 10. Spatiotemporal changes in the content of major ions in the Selenga water ((a)—Cl, (b)—SO42−, (c)—Na+). (Data on Na+ ion content for 2017 are not available).
Water 15 00197 g010
Figure 11. Seasonal changes in the content of major ions in the Selenga water ((a)—Cl, (b)—SO42−, (c)—Na+).
Water 15 00197 g011
Figure 12. Changes in air temperature for the period of 1936–2020.
Water 15 00197 g012
Figure 13. Spearman rank correlation coefficient for the rainfall and the runoff average annual data: (a)—Novoselenginsk station, and (b)—Mostovoi station.
Water 15 00197 g013
Figure 14. Spearman rank correlation coefficient for the air temperature and the rainfall average annual data: (a)—the Novoselenginsk station, and (b)—the Ulan-Ude station.
Water 15 00197 g014
Table 1. Basic statistical characteristics of the Kyakhta rainfall data.
Variable (Month)MinimumMaximumMeanStd. Deviation
January0.00011.0003.8082.544
February0.00011.0003.2362.570
March0.00017.0004.6404.030
April0.20054.00011.67611.037
May4.00091.00028.47119.657
June9.000187.00058.08234.761
July17.000213.00082.94138.339
August26.000231.00078.75335.728
September4.00087.00039.84718.539
October0.20039.00013.4468.901
November0.00024.0006.8334.862
December0.00015.0004.8353.121
Table 2. SS and MK test results for the Kyakhta station.
Variable (Month)SSKendall tau (t)MKVariancep-ValueAlphaInterpretation
January0.000−0.011−36.00067,581.3330.8930.05Accept H0
February0.000−0.029−100.00068,214.0000.7050.05Accept H0
March0.0110.086298.00068,856.0000.2580.05Accept H0
April0.0350.095331.00069,155.6670.2100.05Accept H0
May0.2140.198703.00069,348.3330.0080.05Accept H0
June0.0000.00829.00069,371.0000.9150.05Accept H0
July−0.133−0.068−243.00069,382.3330.3580.05Accept H0
August0.0200.00931.00069,395.0000.9090.05Accept H0
September0.1250.097342.00069,338.0000.1950.05Accept H0
October0.0750.149524.00069,248.6670.0470.05Reject H0
November0.0410.163565.00068,895.0000.0320.05Reject H0
December0.0000.053182.00068,458.6670.4890.05Accept H0
Sum0.3880.7502626.000827,244.0005.0190.05Accept H0
Table 3. Basic statistical characteristics of the Novoselenginsk rainfall data.
Variable (Month)MinimumMaximumMeanStd. Deviation
January0.10019.0003.1423.158
February0.10038.0002.1154.339
March0.10020.0001.4522.455
April0.10046.0005.3786.905
May0.100101.00014.18913.454
June0.800106.00037.00922.633
July7.000151.00064.05930.585
August6.000171.00058.60029.002
September2.00077.00025.65916.060
October0.10081.0006.3269.547
November0.10021.0004.1603.845
December0.10033.0004.6804.868
Table 4. SS and MK test results for the Novoselenginsk station.
Variable (Month)SSKendall tau (t)MKVariancep-ValueAlphaInterpretation
January0.000−0.013−43.00065,723.0000.8700.05Accept H0
February0.0000.00932.00068,202.6670.9060.05Accept H0
March0.011−0.031−107.00068,394.3330.6850.05Accept H0
April−0.007−0.081−278.00068,721.3330.2910.05Accept H0
May0.0310.061213.00069,213.6670.4200.05Accept H0
June0.000−0.008−30.00069,352.0000.9120.05Accept H0
July−0.260−0.131−466.00069,366.6670.0770.05Accept H0
August−0.160−0.092−0.092−0.092−0.092−0.092Accept H0
September−0.021−0.031−110.00069,316.6670.6790.05Accept H0
October0.000−0.001−4.00068,970.0000.9910.05Reject H0
November0.000−0.004−14.00068,368.6670.9600.05Reject H0
December0.000−0.021−70.00068,300.6670.7920.05Accept H0
Sum−0.406−0.343−877.092753,929.6007.4910.05Accept H0
Table 5. Basic statistical characteristics of the Ulan-Ude rainfall data.
Variable (Month)MinimumMaximumMeanStd. Deviation
January0.40016.0005.2663.572
February0.0008.0002.9281.994
March0.00015.0003.0133.275
April0.00031.0006.6956.106
May0.40049.00016.18712.551
June3.000117.00037.15324.177
July11.000162.00068.61232.422
August10.000146.00062.35332.713
September7.00070.00027.68214.682
October0.00033.0008.0246.071
November1.00029.0009.3185.226
December2.00047.00011.0476.729
Table 6. SS and MK test results for the Ulan-Ude station.
Variable (Month)SSKendall tau (t)MKVariancep-ValueAlphaInterpretation
January−0.032−0.170−582.00068,746.6670.0270.05Reject H0
February0.000−0.040−135.00067,579.0000.6060.05Accept H0
March0.000−0.036−123.00068,365.0000.6410.05Accept H0
April−0.044−0.179−618.00068,910.0000.0190.05Reject H0
May0.0000.00930.00069,212.6670.9120.05Accept H0
June−0.083−0.066−235.00069,367.6670.3740.05Accept H0
July−0.255−0.134−478.00069,379.3330.0700.05Accept H0
August−0.139−0.067−238.00069,384.0000.3680.05Accept H0
September−0.027−0.031−110.00069,316.6670.6790.05Accept H0
October−0.035−0.120−415.00068,988.3330.1150.05Accept H0
November0.000−0.020−69.00068,937.6670.7960.05Accept H0
December−0.023−0.079−275.00069,049.6670.2970.05Accept H0
Sum−0.638−0.933−3248.000827,236.7004.9040.05Accept H0
Table 7. Basic statistical characteristics of the Ulan-Ude rainfall data.
Variable (Month)MinimumMaximumMeanStd. Deviation
January0.000171.00011.73219.445
February0.00023.0005.9334.865
March0.00050.0008.5917.605
April0.000105.00018.38915.369
May0.00088.00030.42720.073
June0.000189.00048.72036.219
July10.000307.00083.11048.727
August11.000451.00082.11061.347
September10.000148.00049.19527.882
October0.300105.00022.84515.878
November3.00073.00018.92712.317
December0.00068.00018.48012.030
Table 8. SS and MK test results for the Ulan-Ude station.
Variable (Month)SSKendall tau (t)MKVariancep-ValueAlphaInterpretation
January−0.045−0.156−504.00061,932.6670.0430.05Reject H0
February−0.053−0.204−657.00061,889.6670.0080.05Reject H0
March−0.071−0.207−668.00061,957.3330.0070.05Reject H0
April−0.182−0.270−887.00062,246.3330.0000.05Reject H0
May−0.038−0.033−108.00062,281.3330.6680.05Accept H0
June−0.200−0.122−402.00062,308.6670.1080.05Accept H0
July−0.407−0.159−526.00062,342.6670.0350.05Reject H0
August−0.050−0.024−81.00062,327.0000.7490.05Accept H0
September−0.143−0.105−348.00062,307.3330.1640.05Accept H0
October−0.035−0.114−376.00062,285.8880.1330.05Accept H0
November−0.065−0.103−336.00062,142.0000.1790.05Accept H0
December−0.139−0.206−678.00062,264.6670.0070.05Reject H0
Sum−1.428−1.703−5571.000746,285.6002.1010.05Accept H0
Table 9. Basic statistical characteristics of the Novoselenginsk runoff data (1990–2017).
Variable (Month)MinimumMaximumMeanStd. Deviation
January56.571301.565134.99655.177
February32.114248.78291.81445.217
March33.826824.911116.297144.643
April124.214895.381371.848212.061
May345.9031659.000788.890300.897
June416.7331993.786900.974389.413
July398.1613966.9321175.082766.570
August635.0003324.9741448.708684.632
September510.5852619.7931229.337567.326
October377.5721407.050790.555279.546
November198.233890.623385.294180.023
December100.990633.042205.639105.873
Table 10. SS and MK test results for the Novoselenginsk station.
Variable (Month)SSKendall tau (t)MKVariancep-ValueAlphaInterpretation
January−4.254−0.538−203.0002561.000<0.00010.05Reject H0
February−3.010−0.481−182.00012.0000.0000.05Reject H0
March−3.152−0.444−168.00012.0000.0010.05Reject H0
April1.3210.02610.00012.0000.8600.05Accept H0
May−9.174−0.159−60.00012.0000.2470.05Accept H0
June−6.971−0.132−50.00012.0000.3370.05Accept H0
July−20.999−0.206−78.00012.0000.1300.05Accept H0
August−42.180−0.434−164.00012.0000.0010.05Reject H0
September−35.459−0.339−128.00012.0000.0110.05Reject H0
October−15.887−0.302−114.00012.0000.0250.05Reject H0
November−10.337−0.381−144.00012.0000.0040.05Reject H0
December−4.286−0.400−151.0002561.0000.0030.05Reject H0
Sum−154.388−3.790−1432.0005242.0001.6190.05Accept H0
Table 11. Basic statistical characteristics of the Mostovoi runoff data (1990–2017).
Variable (Month)MinimumMaximumMeanStd. Deviation
January71.371271.000143.47349.618
February42.014204.000100.55139.862
March42.474239.000112.39044.004
April176.0001356.000538.796262.639
May566.0001755.8061074.043313.077
June606.9672065.0001124.700331.473
July556.8062142.0001250.298446.843
August752.0004356.0001803.969959.009
September533.0003875.0001595.908873.952
October379.0002587.0001136.551593.913
November224.6001248.000549.032299.622
December105.000426.000241.11181.809
Table 12. SS and MK test results for the Mostovoi runoff data (1990–2017).
Variable (Month)SSKendall tau (t)MKVariancep-ValueAlphaInterpretation
January−2.735−0.312−118.0000.0000.0200.05Reject H0
February−1.679−0.236−89.0002559.0000.0820.05Accept H0
March−1.669−0.239−90.0002560.0000.0790.05Accept H0
April5.3810.1430.1430.1430.1430.143Accept H0
May2.0530.03212.00012.0000.8300.05Accept H0
June−8.157−0.116−44.00012.0000.4000.05Accept H0
July−7.993−0.101−38.00012.0000.4690.05Accept H0
August−57.194−0.407−154.00012.0000.0020.05Reject H0
September−56.333−0.349−132.00012.0000.0090.05Reject H0
October−42.263−0.368−139.0002561.0000.0060.05Reject H0
November−29.183−0.529−200.00012.000<0.00010.05Reject H0
December−5.929−0.344−130.00012.0000.0100.05Reject H0
Sum−205.701−2.826−1121.867764.1432.050.05Accept H0
Disclaimer/Publisher’s Note: The statements, opinions and data contained in all publications are solely those of the individual author(s) and contributor(s) and not of MDPI and/or the editor(s). MDPI and/or the editor(s) disclaim responsibility for any injury to people or property resulting from any ideas, methods, instructions or products referred to in the content.

