
Water-Use Strategies and Habitat Adaptation of Four Tree Species in Karstic Climax Forest in Maolan

1
Guizhou Academy of Forestry, Guiyang 550005, China
2
Guizhou Libo Observation and Research Station for Karst Forest Ecosystem, Libo 558400, China
3
College of Life Sciences, Guizhou University, Guiyang 550025, China
*
Author to whom correspondence should be addressed.
Water 2023, 15(1), 203; https://doi.org/10.3390/w15010203
Submission received: 24 November 2022
/
Revised: 21 December 2022
/
Accepted: 28 December 2022
/
Published: 3 January 2023
(This article belongs to the Special Issue Forest Hydrology: Advances in Measuring and Modelling the Influences of Forests on Water Cycles)
Abstract
:The technique of stable hydrogen and oxygen isotope tracing has become an important means to study the mechanism of water movement due to its high sensitivity and traceability. In this study, four dominant tree species in the karst forest of Maolan, Guizhou Province, were selected, and their water-use strategies and the mechanism of maintenance of tree species diversity were investigated using the stable hydrogen and oxygen isotope tracing technique. The results show that: (1) The regional precipitation varied evidently with the alternation of seasons, i.e., the values of δD and δ18O in precipitation had a positive bias in spring and a negative bias in summer and autumn. The value of deuterium excess (d-excess) was between 11.67‰ and 31.02‰, with a mean value of 22.98‰. (2) The soil temperature (ST), soil water content (SWC) and precipitation, which have a significant positive correlation, imposed a joint impact on the dynamics of the soil evaporative fractionation. (3) The line-conditioned excess (LC-excess) varied seasonally in different water bodies, i.e., the relative evaporative fractionation of the rhizosphere soil of deciduous tree species was stronger than that of evergreen tree species, and the evaporative fractionation of hydrogen and oxygen isotopes in the leaf water of evergreen tree species was stronger than that of deciduous tree species in spring and summer. However, that of the latter was stronger than that of the former in autumn. (4) The soil water was the most important potential water source for dominant tree species in karst terrain (71%), followed by epikarstic water, which made up an effective supplement (29%). (5) Finally, trees of different life forms and species varied in capacity and proportion in terms of using the potential water sources in different seasons, i.e., deciduous tree species had a greater capacity for using water from potential sources and variable water-use strategies. This may be a major water-limiting mechanism that maintains photosynthesis in the leaves of evergreen tree species (leaves are evergreen and plants continue to grow via photosynthesis) and constrains photosynthesis in deciduous tree species (leaves fall and plants become dormant and stop growing). These results lead to the conclusion that the dominant tree species in karstic forests resist water stress and adjust water-use strategies towards each potential water source to adapt to the harsh karstic habitat through root plasticity and leaf defoliation.
1. Introduction
Water is one of the main factors limiting the growth and distribution of plants, and it is important to understand how plants grow in harsh habitats by identifying their water sources and how they use the water. Water-use strategies reflect the adaptability of plants to their environment. Plant species, growth stage and season are all key factors influencing the variability of plant water-use strategies. The theoretical assumption that no hydrogen–oxygen isotope fractionation occurs during water uptake at the root system and transport to the xylem has been widely applied to the study of plant water sources [1,2,3,4,5]. Moreover, this concept has been used in the field of studying water ecology due to the accuracy and high efficiency of measuring the stable isotope [6]. δ18O and δD are stable isotopic compositions of water bodies in nature. Studies have found that different water sources may have different stable isotope ratios [7,8]. As a result, δ18O and δD have become natural tracers of water vapor sources in water bodies [9]. Studies show that plant root systems can uptake water from soil water, rocky water and ground water at deeper [4] levels, and that tree species such as Juglans regia, Quercus variabilis, Populus alba, and Platycladus orientalis [10,11,12,13] can adjust their soil water uptake behavior to the depths of different environments. Although many researchers have studied the soil–plant atmosphere continuum (SPAC) with stable hydrogen and oxygen isotopes, most of them have focused on arid or semi-arid areas of normal terrain [14,15]. Humid or semi-humid areas are given less attention [16,17], and research on the dominant tree species communities in karstic climax forests is particularly sparse [18].
The special dual-structured hydrological system in karstic areas results in the severe infiltration of precipitation into a variety of microhabitat types, including shallow and discontinuous soil stratum, distributed mostly in rocky gullies and crevices. Plants tend to stretch their root system into rocky fissures, rather than across the soil surface, indicating that karstic plants may have special water-use strategies [14,19,20]. The application of the stable hydrogen and oxygen isotope technique provides a scientific method and tool for studying the water sources and water-use strategies of plants in karstic forest [14]. Different tree species deploy water strategies differently, and soil water and epikarstic water are the major water sources for karstic plants [16]. The transpiration of trees in exposed rocky areas may be influenced by changes in near-surface air temperature and water uptake along rock crevices [21]. Trees have a pronounced competitive root uptake mode [22], which is particularly intense where tree roots do not have access to ground water, especially in karstic areas where there is a ‘dual structure’ in the ground and bedrock that results in the rapid movement of surface water to ground water [23]. Many studies have been conducted on atmospheric precipitation and plants’ water sources in the karstic area in the central part of Guizhou [14,24], the karst peak-cluster depression basins in northwestern Guangxi [25,26], the karstic plateau area in the central part of Yunnan [16,27,28], and the karst peak clusters in Maolan of southern Guizhou [18,29]. These studies found that different woody plants in karstic areas use water from different sources, which has been proven in shrub species and young arbor trees [14,18]. However, a few comparative studies have been conducted on the dominant tree species, i.e., arbor trees, in karstic climax forest. Therefore, this study focuses on the four tree species (mature plants) in the karstic climax forest in Maolan and analyzes their water sources and water-use strategies via the stable isotope technique. The study aims to answer the following two questions: (1) How do the water sources of plants in karstic climax forest communities change with the seasons? (2) What are the water-use mechanisms and rocky habitat adaptation strategies of the tree species in karstic climax forest communities? By answering these two questions, the study reveals the water-use strategies and mechanism of stability maintenance of the dominant tree species in the karstic climax forest communities, and provides a basis for tree species selection for the conservation of karstic native forests and the restoration of degraded ecosystems in Maolan in the context of climate change.
2. Materials and Methods
2.1. Overview of Study Area and Selection of Tree Species
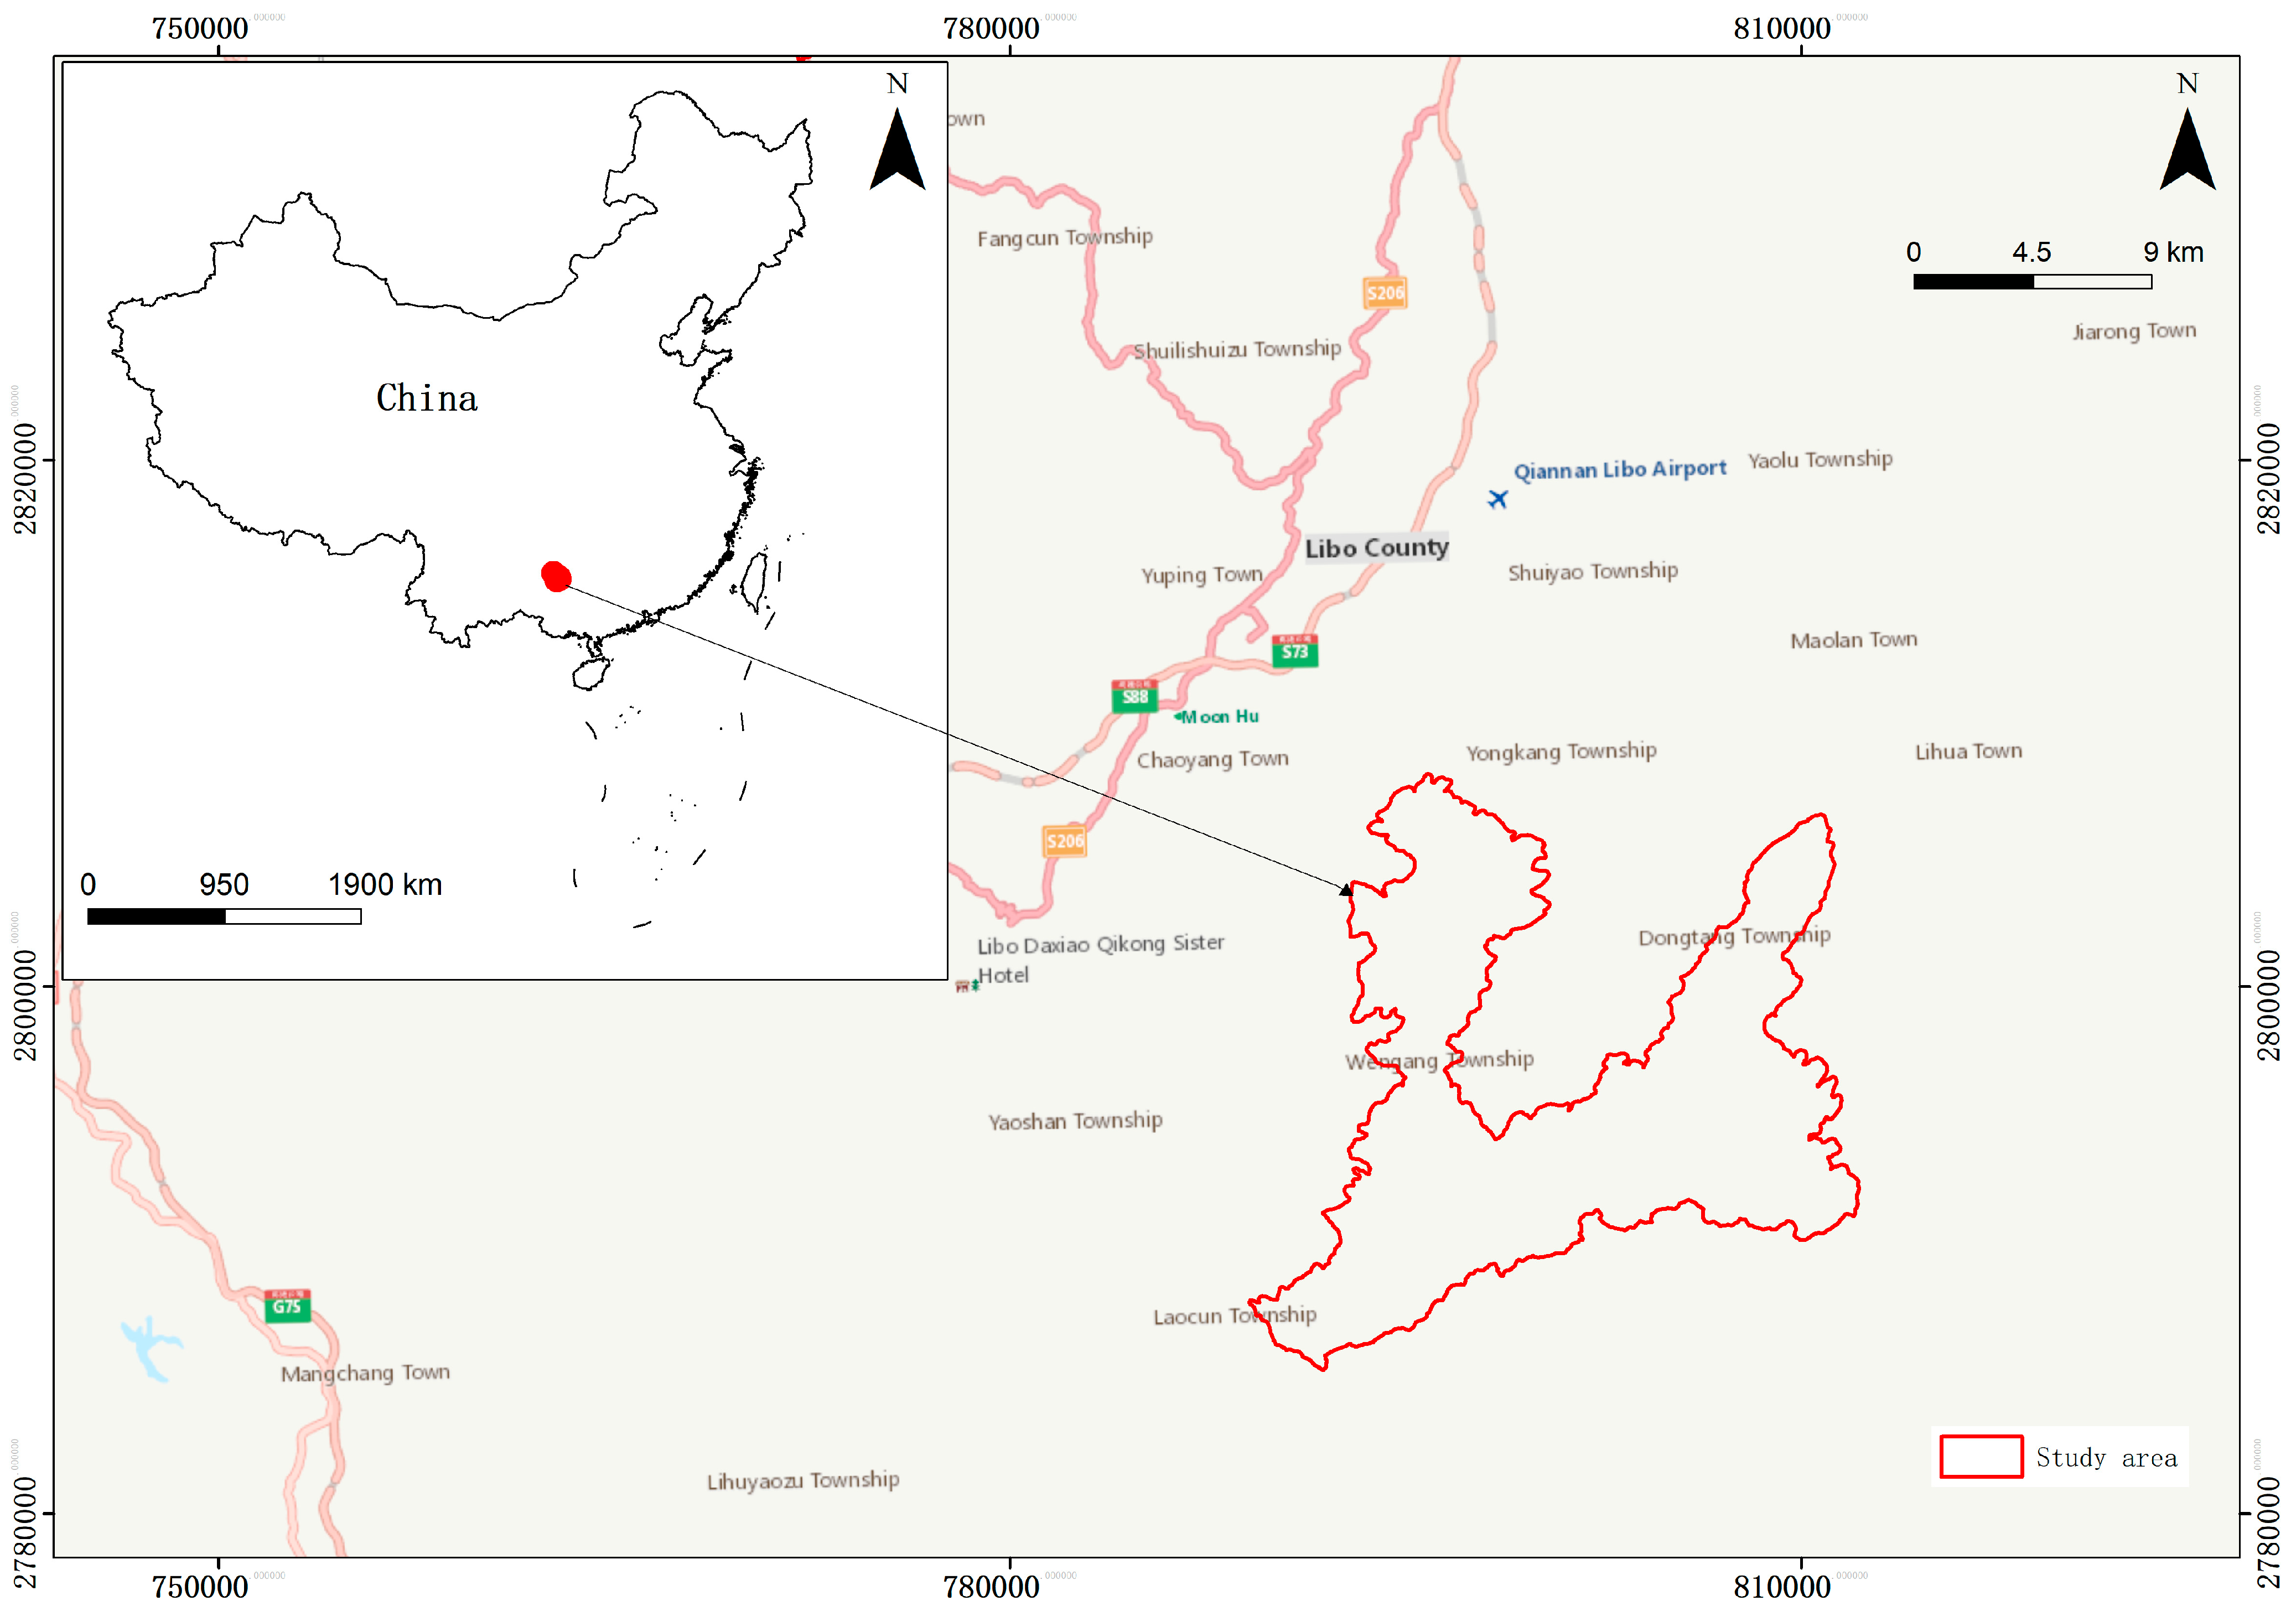
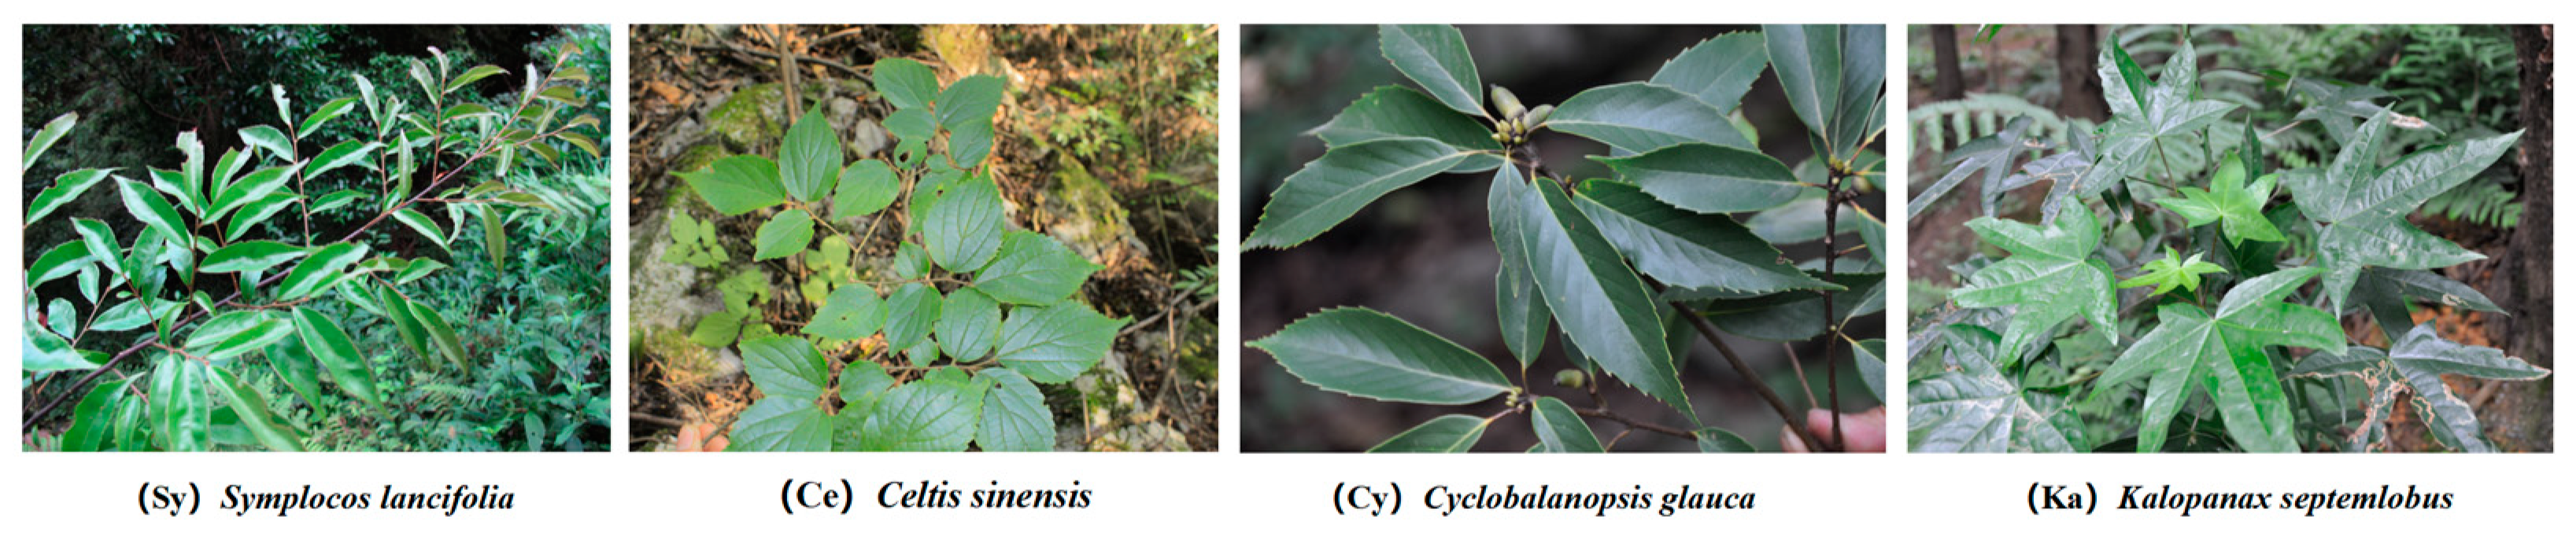
The study area is located at the Guizhou Karst Forest Ecosystem Positioning Observation and Research Station, which is in the Maolan National Nature Reserve (Figure 1). The average elevation of the reserve ranges from 550 to 850 m above sea level. It has a humid mid-subtropical monsoon climate with an average annual temperature of 15.3 °C. The average annual precipitation reaches 1752.5 mm, with an average annual relative humidity of 83%. The frost-free period is 315 days, and there are 1272.8 annual sunlight hours [30]. At the positioning observation station, the sample site for water monitoring has a size of 30 m × 30 m. It is on a downward slope, with sunlight and a slope degree of 13°. It consists of exposed karst terrain featuring black limestone soil, which is shallow and discontinuous on the upper stratum. As it lacks surface water, the soil has a low water holding capacity. The vegetation type comprises evergreen and deciduous broad-leaved mixed forest [31], and the main dominant tree species on the sample site of the community are deciduous species such as Celtis tetrandra, Kalopanax septemlobus and Platycarya longipes, and evergreen species such as Cyclobalanopsis glauca, Symplocos lancifolia and Acer wangchii. The root depth of these plants is more than 50 cm. In this study, the adult plants of four species from the abovementioned evergreen and deciduous species were selected to study their water-use and habitat adaptation strategies.
2.2. Sample Collection of Stable Hydrogen and Oxygen Isotope
2.2.1. Plant Sampling
Four representative tree species including evergreen and deciduous species were selected at the research site and these species’ more information can be seen in Table 1 and Figure 2.
For each species, the researchers selected three plants that were growing well, were pest- and disease-free, and had similar values of diameter at breast height (DBH) and tree height. Samples of twigs and leaves were collected in spring, summer and autumn, in time order. Specifically, samples were collected on 29 May (before rainfall), 18 July (before rainfall), 25 July (after rainfall), and 13 October (before rainfall) of 2020.
Twigs were cut from three different positions with averruncators between 8:00 and 10:00 in the morning. The chosen twigs were growing well with sunlight, and had a length of 40–50 cm and a diameter of 0.5–1 cm. They all had a 5–6 cm xylem (stem 10 cm from the twig end). When the phloem was removed, the xylem was swiftly contained in a 15 mL glass bottle with a screw top. After being sealed with parafilm and numbered, the bottle was immediately put into a portable icebox (around 4 °C) and then brought to the lab for freeze preservation (−20 °C). The samples from each period were sent for measurement at the Institute of Environment and Sustainable Development in Agriculture under the Chinese Academy of Agricultural Sciences (CAAS).
Leaves were also collected from each of the sampled species. Thirty to fifty healthy leaves (ten to fifteen in the case of Kalopanax septemlobus) were picked and wrapped in marked tinfoil to prevent water loss, and then put into a portable icebox (around 4 °C) for preservation. Leaf samples and twig samples were sent together for lab measurements.
2.2.2. Soil Sampling
Soil was collected at the same time and on the same days as the plant collection. Soil was manually drilled from a scope of 0.5–1.0 m around the non-primary root within the crown width. Following the practice of other researchers [18], the study used a soil drill with a length of 100 cm and an inner diameter of 3.5 cm to manually take the soil samples at the same level of depth from the soil profile for all the selected tree species. Samples were taken at 10 cm levels in the stratum between 0 and 30 cm below the ground, and at one single level in the stratum between 30 and 50 cm. These soil samples taken from different levels were mixed and then contained immediately in a 60 mL glass bottle with a screw top. After stopping the opening with a cork and sealing the seam with parafilm, the bottle was immediately put into a portable cooler box (around 4 °C) and then brought to the lab together with the plant samples for stable isotopic measurements.
2.2.3. Water Sampling
The sampling of atmospheric precipitation was conducted between 8:00 a.m. and 8:00 p.m. on the day of rainfall (≥0.1 mm). The sample rainfall was contained in a 30 mL polyethylene bottle which was sealed and numbered before preservation at a low temperature. At the same time, spring water was sampled from three sites of the epikarstic zone in the study area to represent the water from that zone [16,17].
All samples were collected on 29 May 2020 (before rainfall), 18 July 2020 (before rainfall), 25 July 2020 (after rainfall) and 13 October 2022 (before rainfall). A composite sample of previous rainfall was used for isotope analysis.
2.3. Stable Hydrogen and Oxygen Isotope Measurement
2.3.1. Sample Analysis
All the samples were sent for measurement at the Institute of Environment and Sustainable Development in Agriculture under the Chinese Academy of Agricultural Sciences (CAAS). The water samples were measured by means of cavity ring-down spectroscopy (CRDS), while the soil and plant samples were measured by firing at high temperature with the assistance of isotope ratio mass spectrometry (IRMS), Picarro-L115 I. Standard mean ocean water (SMOW) was adopted in the lab measurements. The measurement precision of δ18O was 0.15‰, while that of δD was 0.5‰. The formula for measurement is as follows:
δX (‰) = (Rsample/Rstandard − 1) × 100
In the aforementioned formula, Rsample represents the ratio of the isotopic enrichment in the samples (e.g., D/H, 18O/16O), and Rstandard is the measured isotope ratio for the universal reference material (RM). The stable isotopic compositions of hydrogen and oxygen adopt Vienna Standard Mean Ocean Water (V-SMOW).
Deuterium excess (d-excess) value can trace the water vapor sources and paths. Universally, most of the samples have a mean value of d-excess close to 10‰. Deuterium excess value is calculated with the formula below:
d-excess (‰) = δD − 8δ18O
2.3.2. LC-Excess Calculation for Various Water Bodies
The line-conditioned excess (LC-excess) values indicate the deviation between δD and the local meteoric water line (LMWL) in various water bodies. They reflect the evaporation of various water bodies from the atmospheric precipitation [24,32]. LC-excess value is calculated with the formula below:
LC-excess (‰) = δD − a × δ18O − b
In the aforementioned formula, “a” and “b” represent the LMWL slope and intercept, respectively, and δD and δ18O represent the isotopic ratio (‰) in various water bodies. The mean value of LC-excess in precipitation is 0‰. As the isotopic compositions in the precipitation water are influenced by evaporation, they are fractionated, and the LC-excess is usually less than 0‰.
2.3.3. Measurement of Proportion of Plant Water Sources
The IsoSource mixing model takes stable isotopic mass balance and water balance as the basic principle, and assumes all water sources together contribute 100% to the plant’s water use. The study substituted the stable isotopic compositions of the water in the plant xylem and in each water source into the IsoSource mixing model, and by calculating the proportion of stable isotopic compositions in the plant xylem water from each water source [2,17,33,34,35] the percentage of water contribution from each water source was calculated. Based on the characteristics of the stable isotopic compositions of the soil water at different depths up to 50 cm beneath the ground in the study area, the study divided the soil water into two layers, i.e., the top soil water in the first 10 cm beneath the ground, and the sub-soil water in the layer between 10 cm and 50 cm. Additionally, the values of δ18O in the water of the plant xylem, the epikarstic water, and the sub-soil water were substituted into the IsoSource mixing model as follows:
δX = f1δX1 + f2δX2 + f3δX3
f1 + f2 + f3 = 1
In the aforementioned formula, δX means δ18O contained in the plant xylem water, while δX1, δX2 and δX3 are δ18O in the top soil water (0–10 cm), the sub-soil water (10–50 cm) and the epikarstic water, respectively. f1, f2 and f3 represents the plant’s water uptake proportion from different sources.
The monitored factors include photosynthetically active radiation (PAR, W·m−2), atmospheric temperature (Ta, °C), relative humidity (RH, %), rainfall (mm), soil temperature (ST, °C) in the layers of 0–10 cm, 10–20 cm, 20–30 cm, and 30–50 cm, and soil water content (SWC, %).
2.4. Data Collection and Analysis
Environmental factors including rainfall (mm), soil temperature (ST, °C) and soil water content (SWC, %) were monitored using the automatic meteorological station “Cample”. Data were processed using Microsoft Excel 2016 software, and Oringin 2021 software was used for statistical analysis and drawing. The IsoSource mixing model was applied to calculate the contribution percentage of each water source to plant water uptake.
We used one-way analysis of variance (ANOVA) to test the differences in δ18O and δD values and the environmental factors affecting the branch and leaf water of different tree species. Pearson correlation analysis was used to analyze the relationship between them.
3. Results
3.1. Atmospheric Precipitation and Seasonal Variation in Isotopic Composition in Precipitation
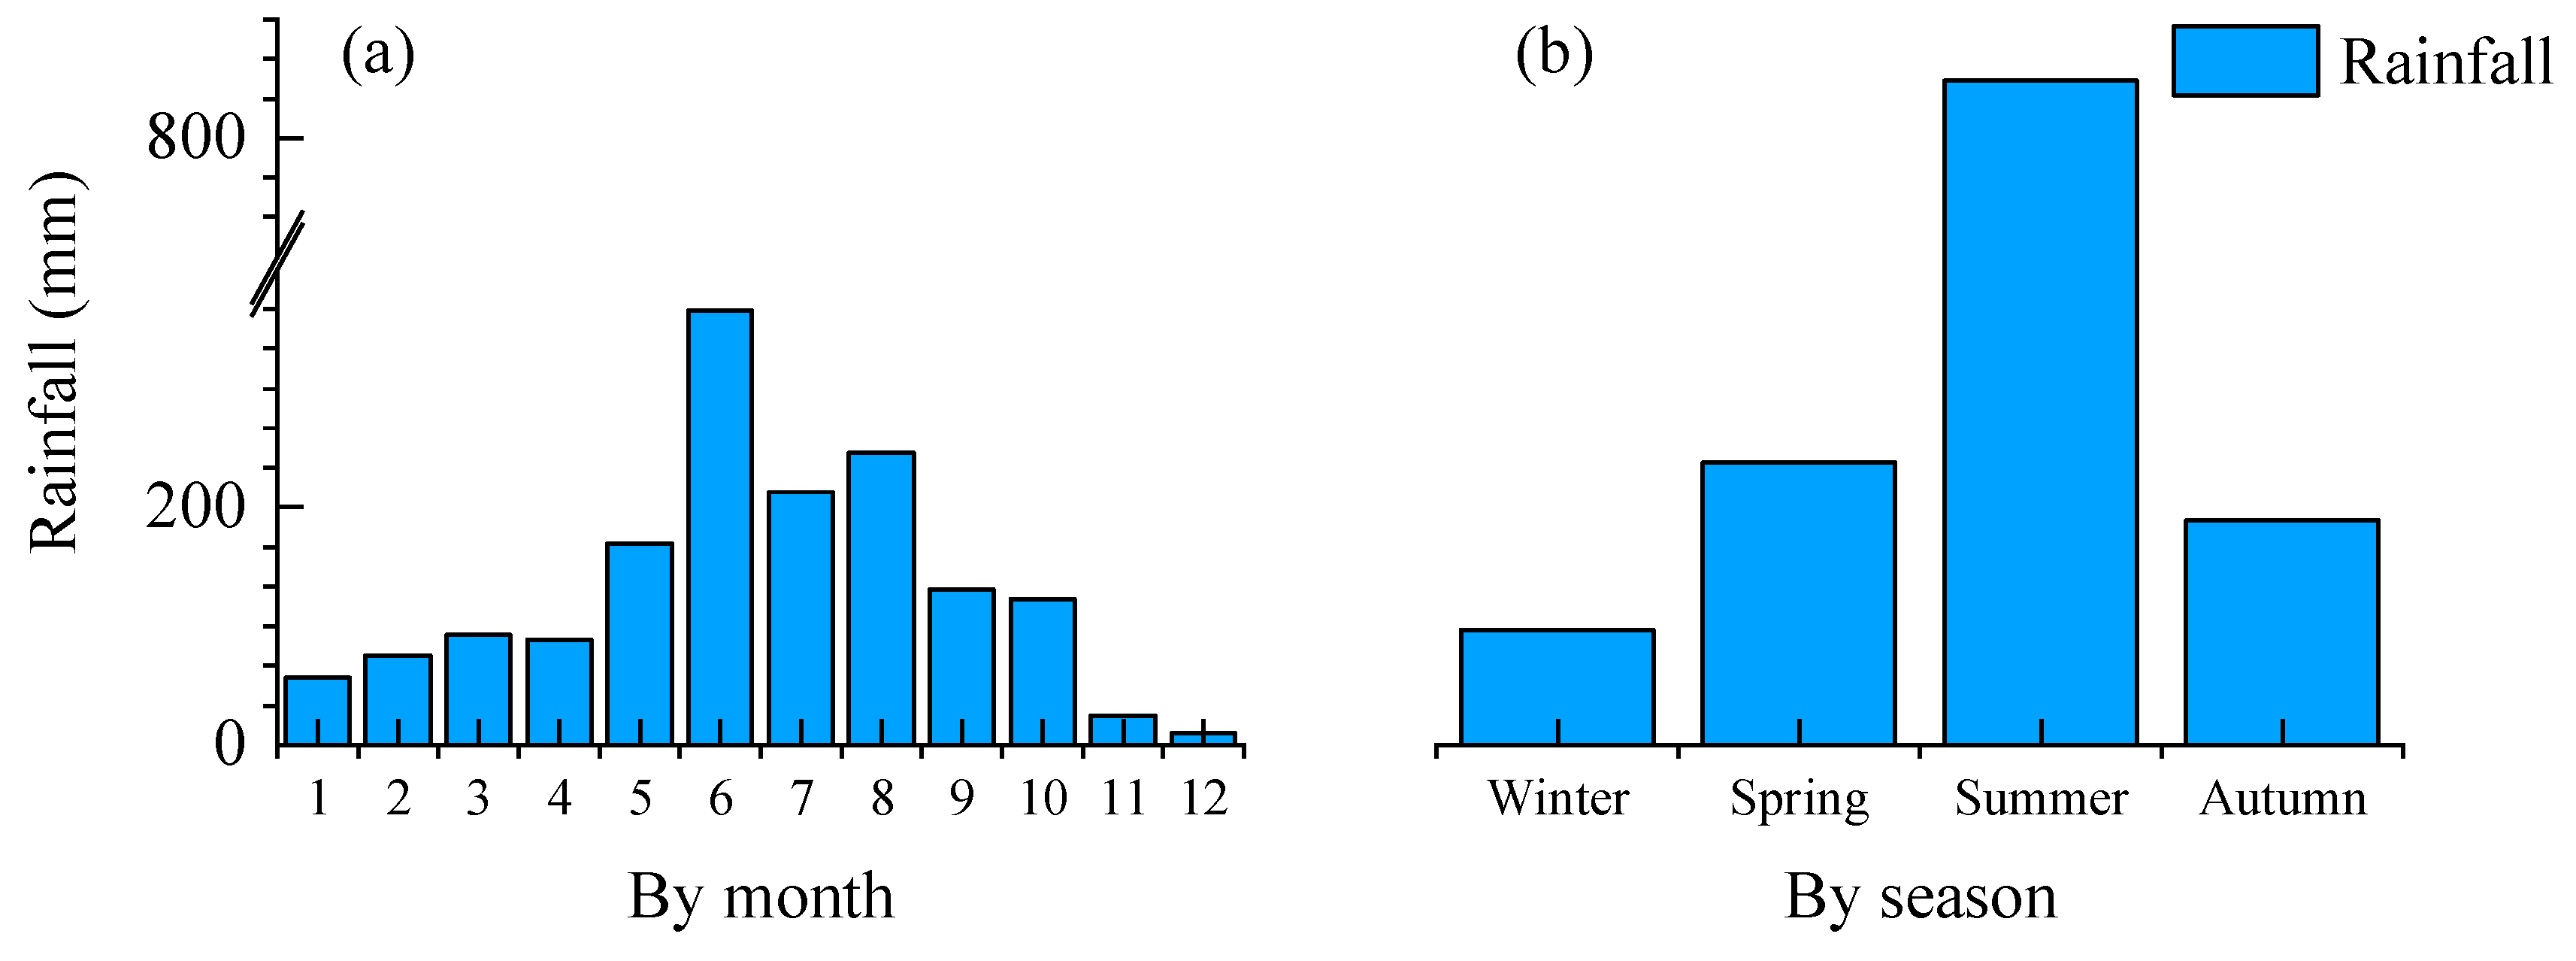
The monthly and seasonal variations in annual precipitation in the study area are shown in Figure 3. It can be seen that the accumulated precipitation on the monthly scale ranged from 10 to 366 mm, with a monthly average precipitation of 133 mm. While June saw the highest precipitation and December the lowest, the precipitation was mainly concentrated from May to October, with an accumulated precipitation of 1247.3 mm, accounting for 78.1% of the total annual volume, and an average precipitation intensity of 6.78 mmd−1. Precipitation on the seasonal scale was concentrated in spring and summer, accumulating 1174.9 mm, accounting for 73.6% of the total annual volume with an average precipitation intensity of 6.39 mmd−1 (including 823.9 mm in summer, accounting for 51.61% of the total annual precipitation with an average precipitation intensity of 8.96 mmd−1, and 351 mm in spring, accounting for 21.99% of the total annual volume with an average precipitation intensity of 3.82 mmd−1). Seasonally, the order of precipitation quantity is as follows: summer (824 mm) > spring (351 mm) > autumn (279 mm) > winter (143 mm). The precipitation intensity order is as follows: summer (8.96 mmd−1) > spring (3.82 mmd−1) > autumn (3.07 mmd−1) > winter (1.57 mmd−1).
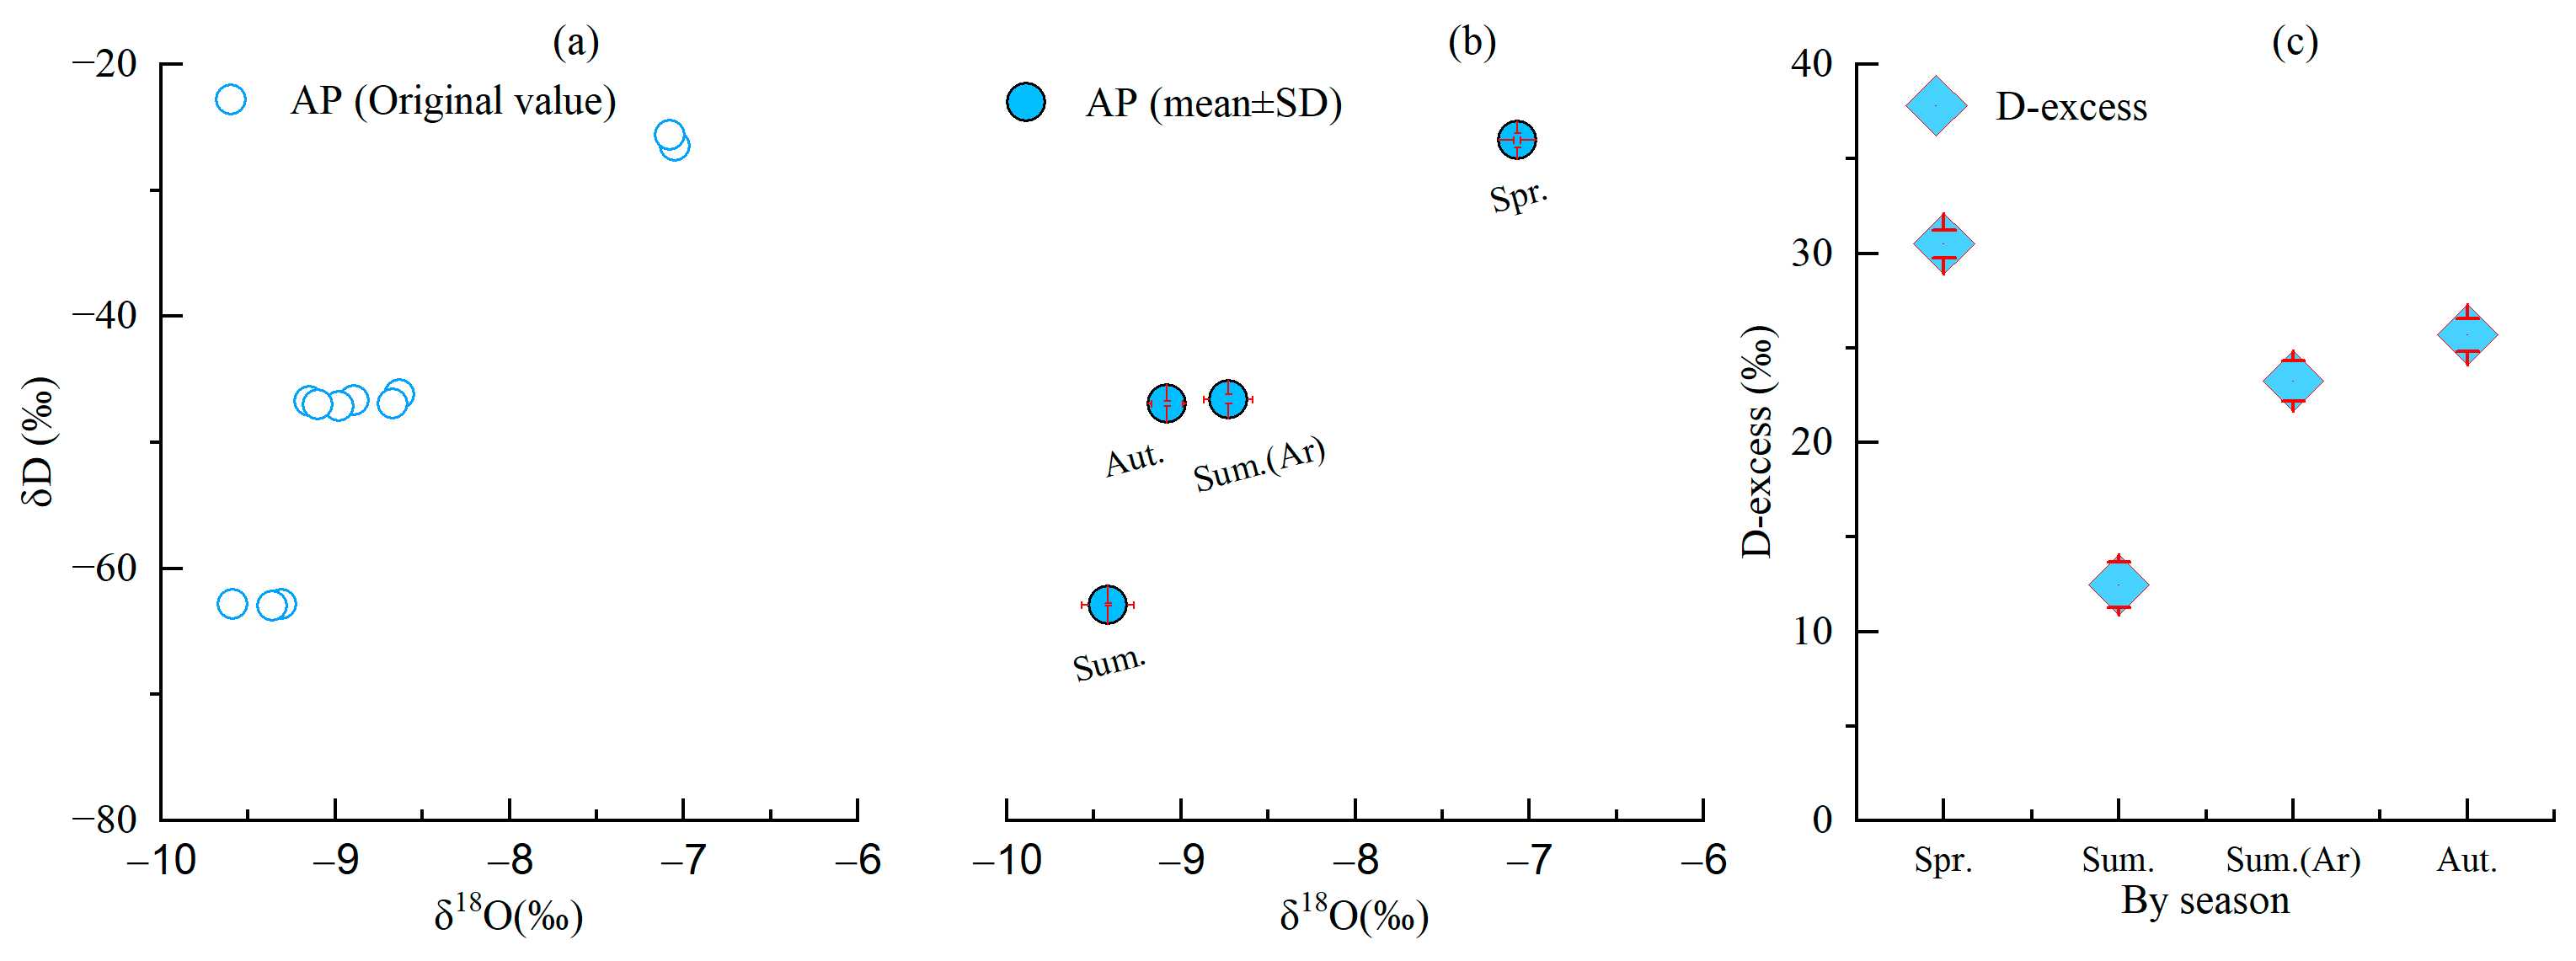
The seasonal variation characteristics of the stable isotope of hydrogen (δD), the stable isotope of oxygen (δ18O) and d-excess (‰) in relation to atmospheric precipitation (rainfall) are shown in Figure 4. It can be seen that the stable isotopic compositions of precipitation varied significantly against seasonal alternations as a result of the influence of the different sources of water vapor in the monsoon region during the winter and summer months. Spring showed the highest mean values of δD and δ18O in terms of atmospheric precipitation (−7.07‰, −26.04‰), followed by summer (−8.73‰, −46.58‰), with the lowest values in autumn (−9.42‰, −62.88‰). Thus, the values of δD and δ18O in terms of precipitation have a positive bias in the spring and a negative bias in summer and autumn. This result is similar with previous report in karst peak-cluster depression area in Guangxi [25]. In summer, the values of δD and δ18O in terms of atmospheric precipitation reduced after rainfall compared with those before rainfall. The d-excess values ranged from 11.67‰ to 31.02‰, with a mean value of 22.98‰.
3.2. Seasonal Variation in Soil Temperature, Soil Humidity and Isotopic Compositions
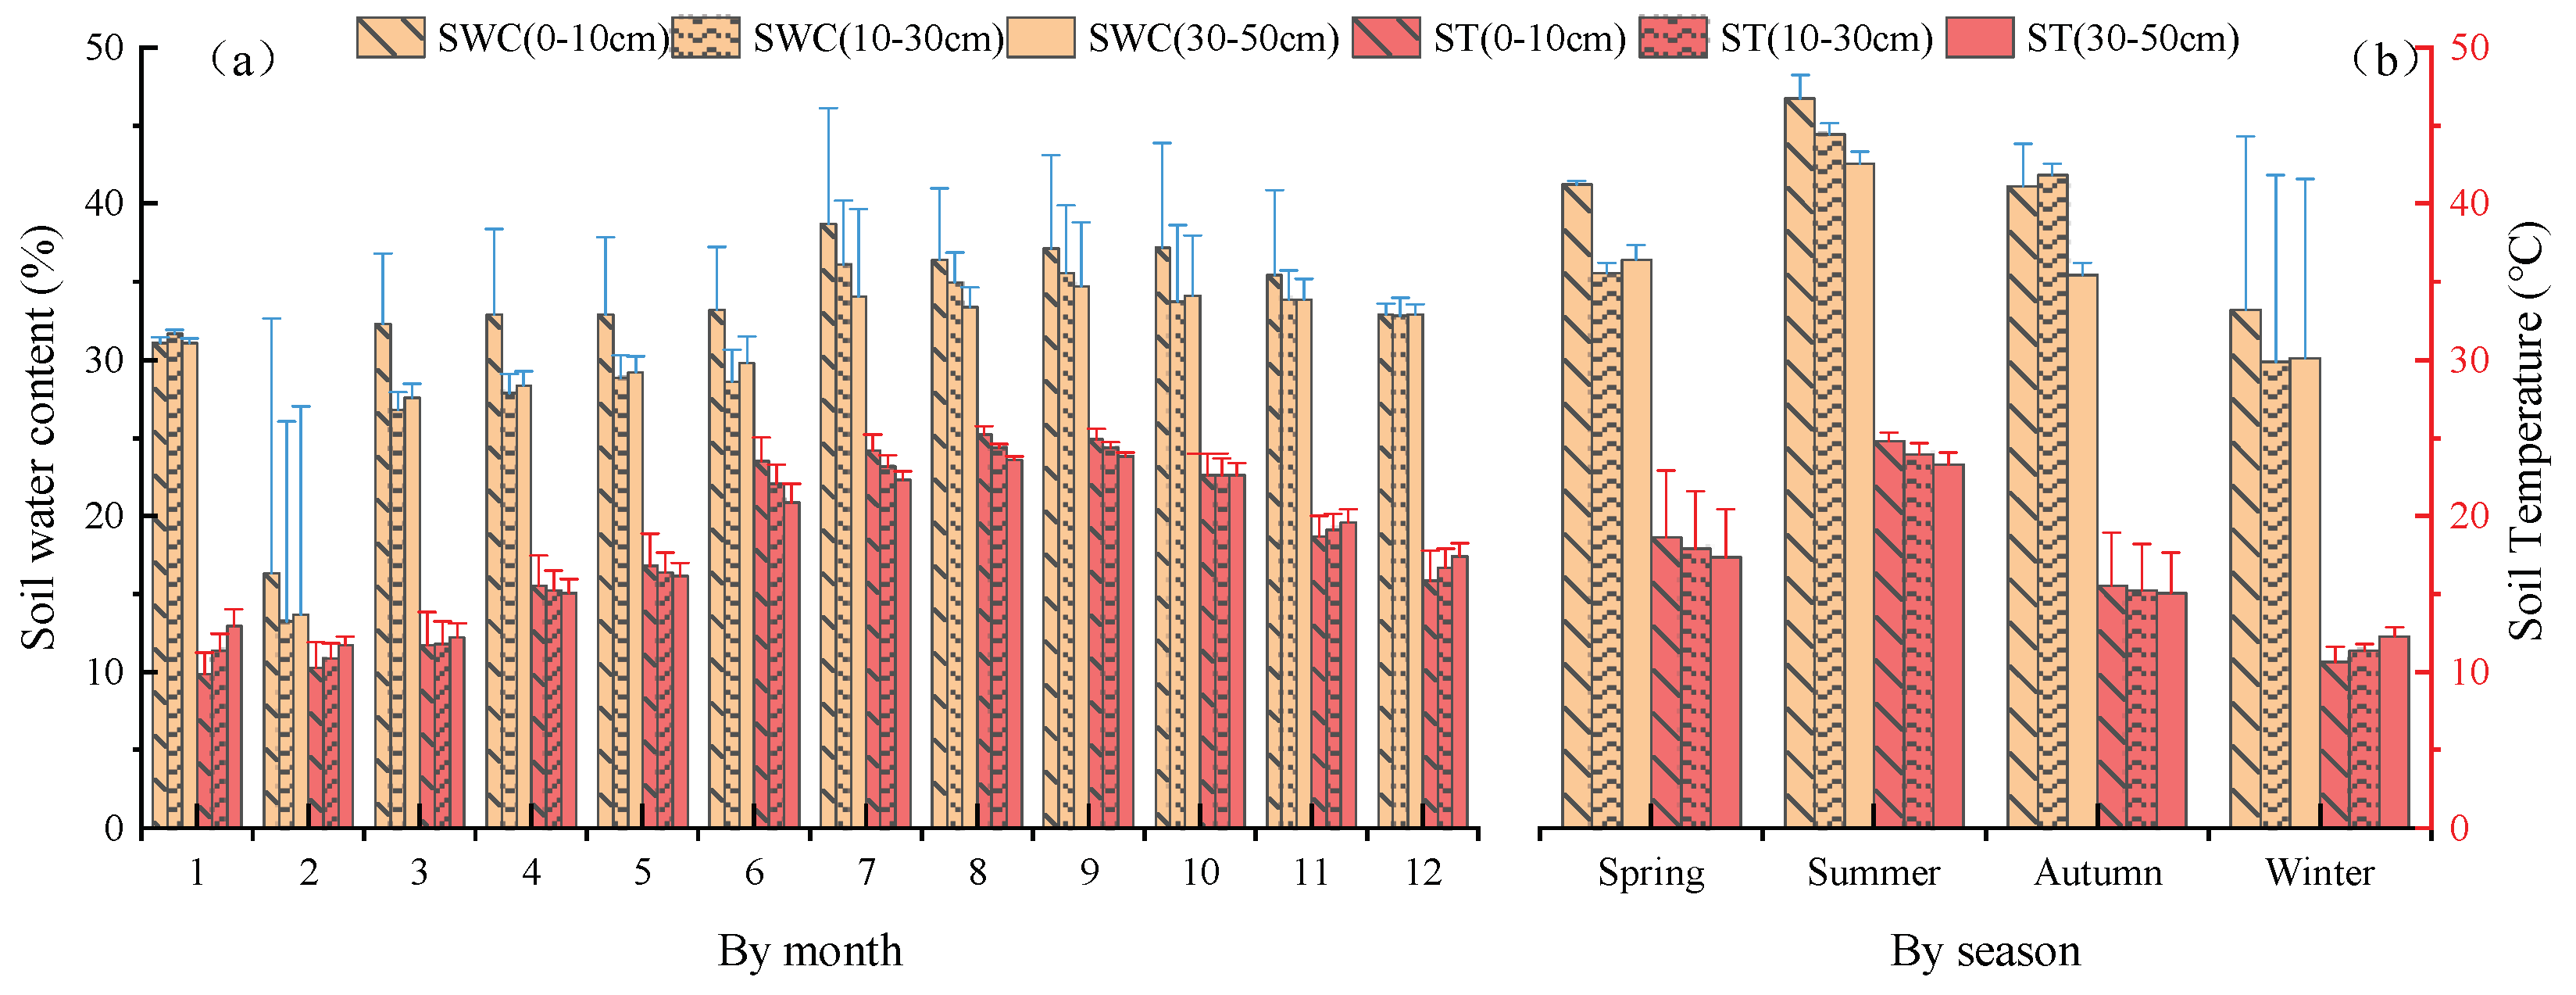
The monthly variation in soil water content and soil temperature for different soil layers in the study area are shown in Figure 5. It can be seen that the temperature in different soil layers varied in different seasons. In autumn, the deeper the soil layer was, the higher the soil water content increased. In spring and summer, the deeper the soil layer was, the lower the soil water content became. The soil temperature first increased and then decreased, as the soil layer was deeper in all seasons studied. The difference in temperature between soil layers varied from season to season, with the highest in winter and spring, followed by summer, with the lowest values in autumn.
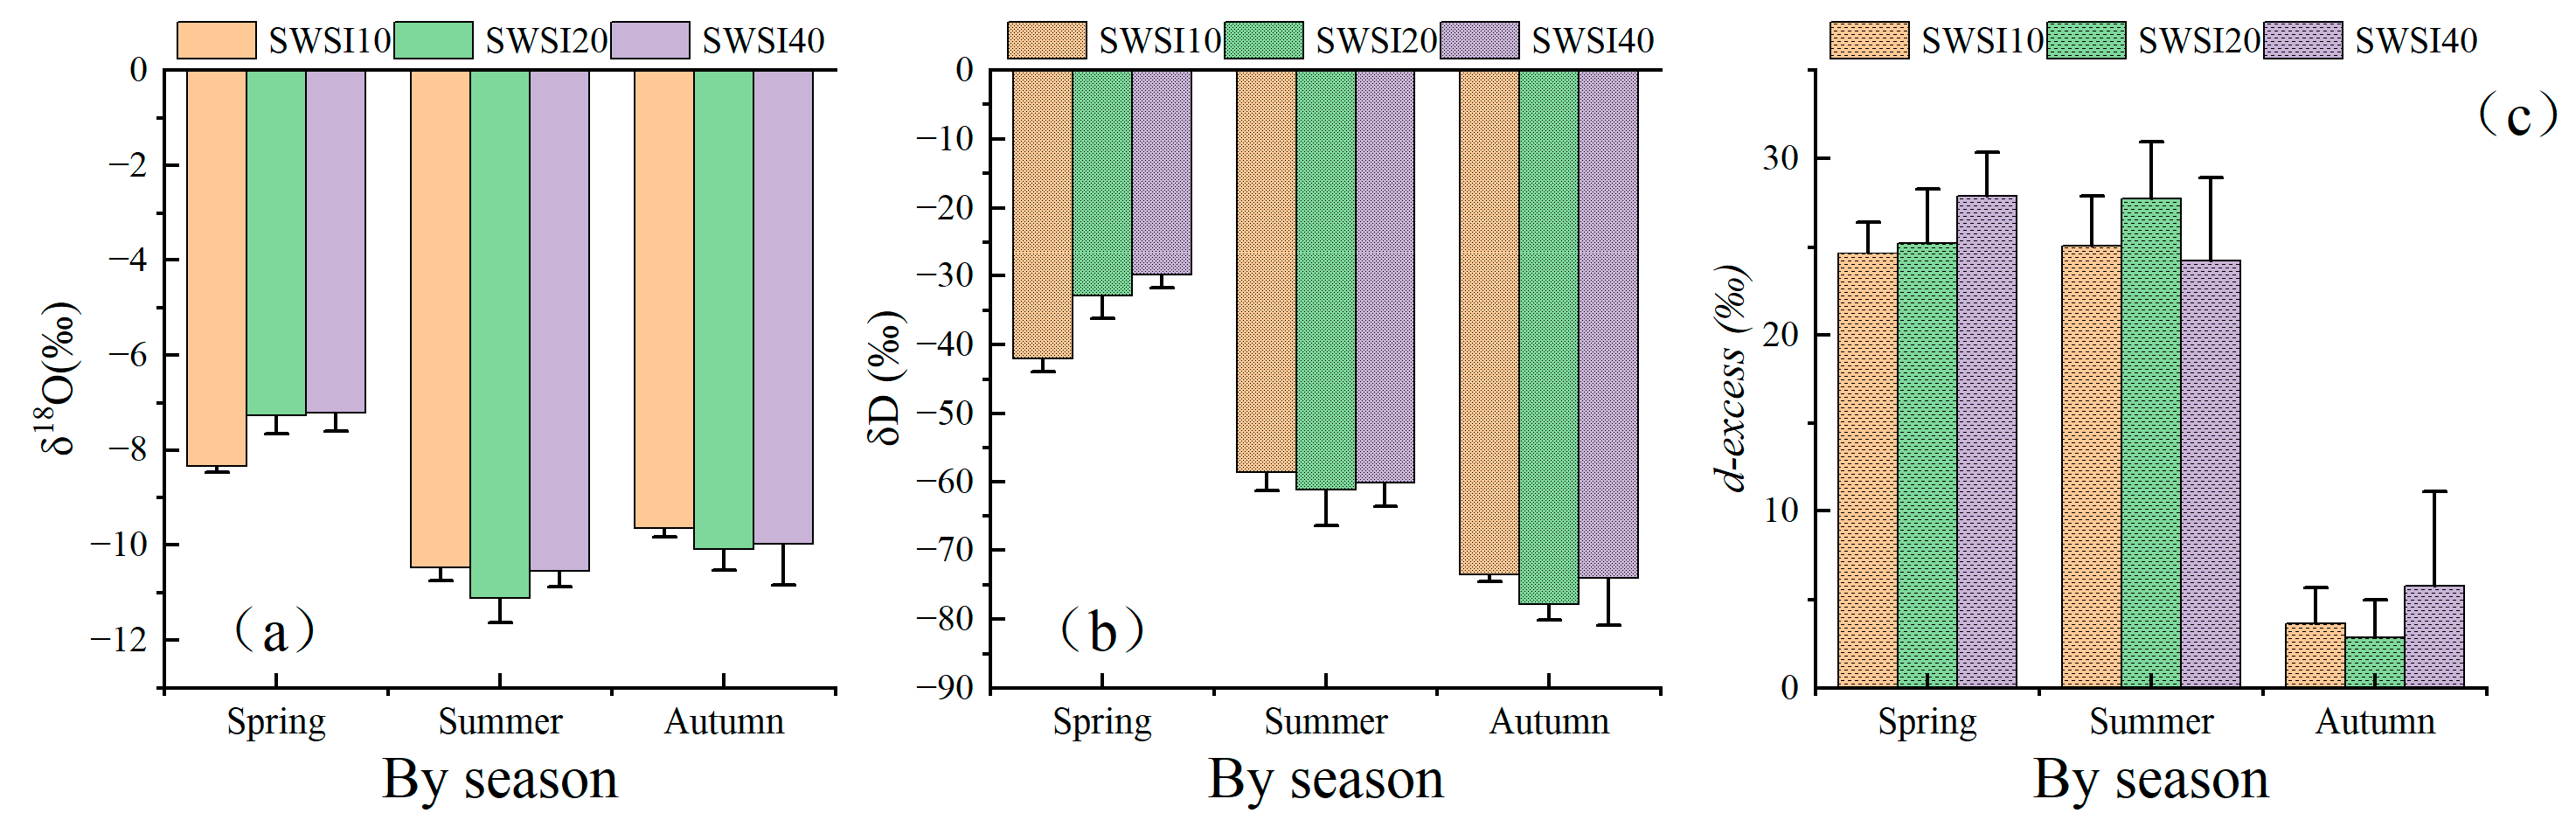
Figure 6 shows the seasonal variation in δD and δ18O values in different soil waters at the sample sites. The results show that the δD and δ18O values of water in the same soil layer varied significantly between seasons. The δ18O value in the soil water of the layers S0–10 cm and S10–30 cm differed highly significantly (p < 0.01), followed by the δ18O value in the soil layers S10–30 cm and S30–50 cm (p < 0.05). All soil layers sampled (S0–10 cm, S10–30 cm, S30–50cm) showed highly significant differences (p < 0.01) in the δD value. The δ18O value of different soil layers varied at different depths, even in the same seasons. Specifically, in spring, the δ18O value of the soil water first increased and then decreased with deeper soil layers. In summer and autumn, it first decreased and then increased with deeper soil layers. As for the δD value of the soil water, in spring, it increased gradually as the soil layer became deeper. In summer and autumn, it first decreased and then increased as the soil layer became deeper.
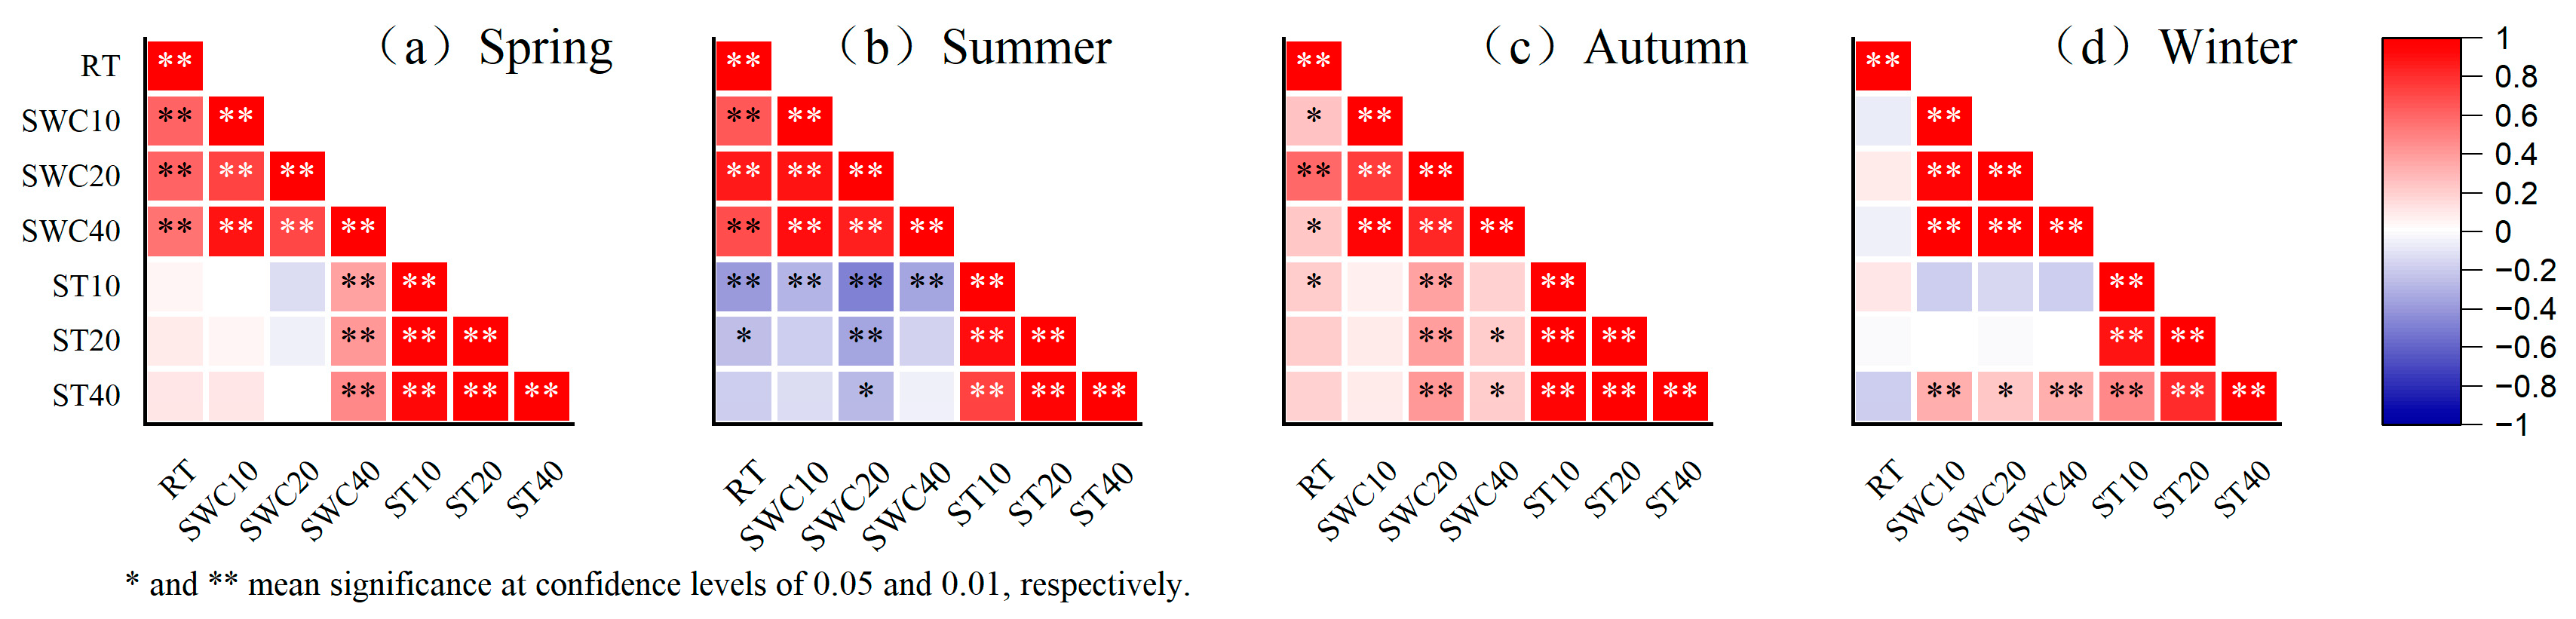
Figure 7 shows the correlations between temperature (ST), soil water content (SWC) and rainfall at different depths of soil, which are all highly significant (p < 0.01). The relatively lower soil water content and higher soil temperature in spring made the evaporative fractionation of the soil more obvious in spring. Moreover, for the evergreen tree species’ growing process and the deciduous tree species’ growing process in their leaf expansion periods, the δD and δ18O values in different soil layers were higher than usual in spring. In summer, the high intensity of daily average rainfall of 8.96 mmd−1 (higher than that in spring (3.82 mmd−1)) reduced the δD and δ18O values in soil water. In winter, as the low intensity of daily average rainfall (3.07 mmd−1) led to a low soil water content and a higher soil temperature than usual, soil water fractionation occurred easily. This is reflected by a higher δ18O value than that in summer and a lower δD value than that in summer due to the lower temperature and minimal plant growth experienced in winter.
3.3. LC-Excess Distribution Characteristics in Different Water Bodies by Season
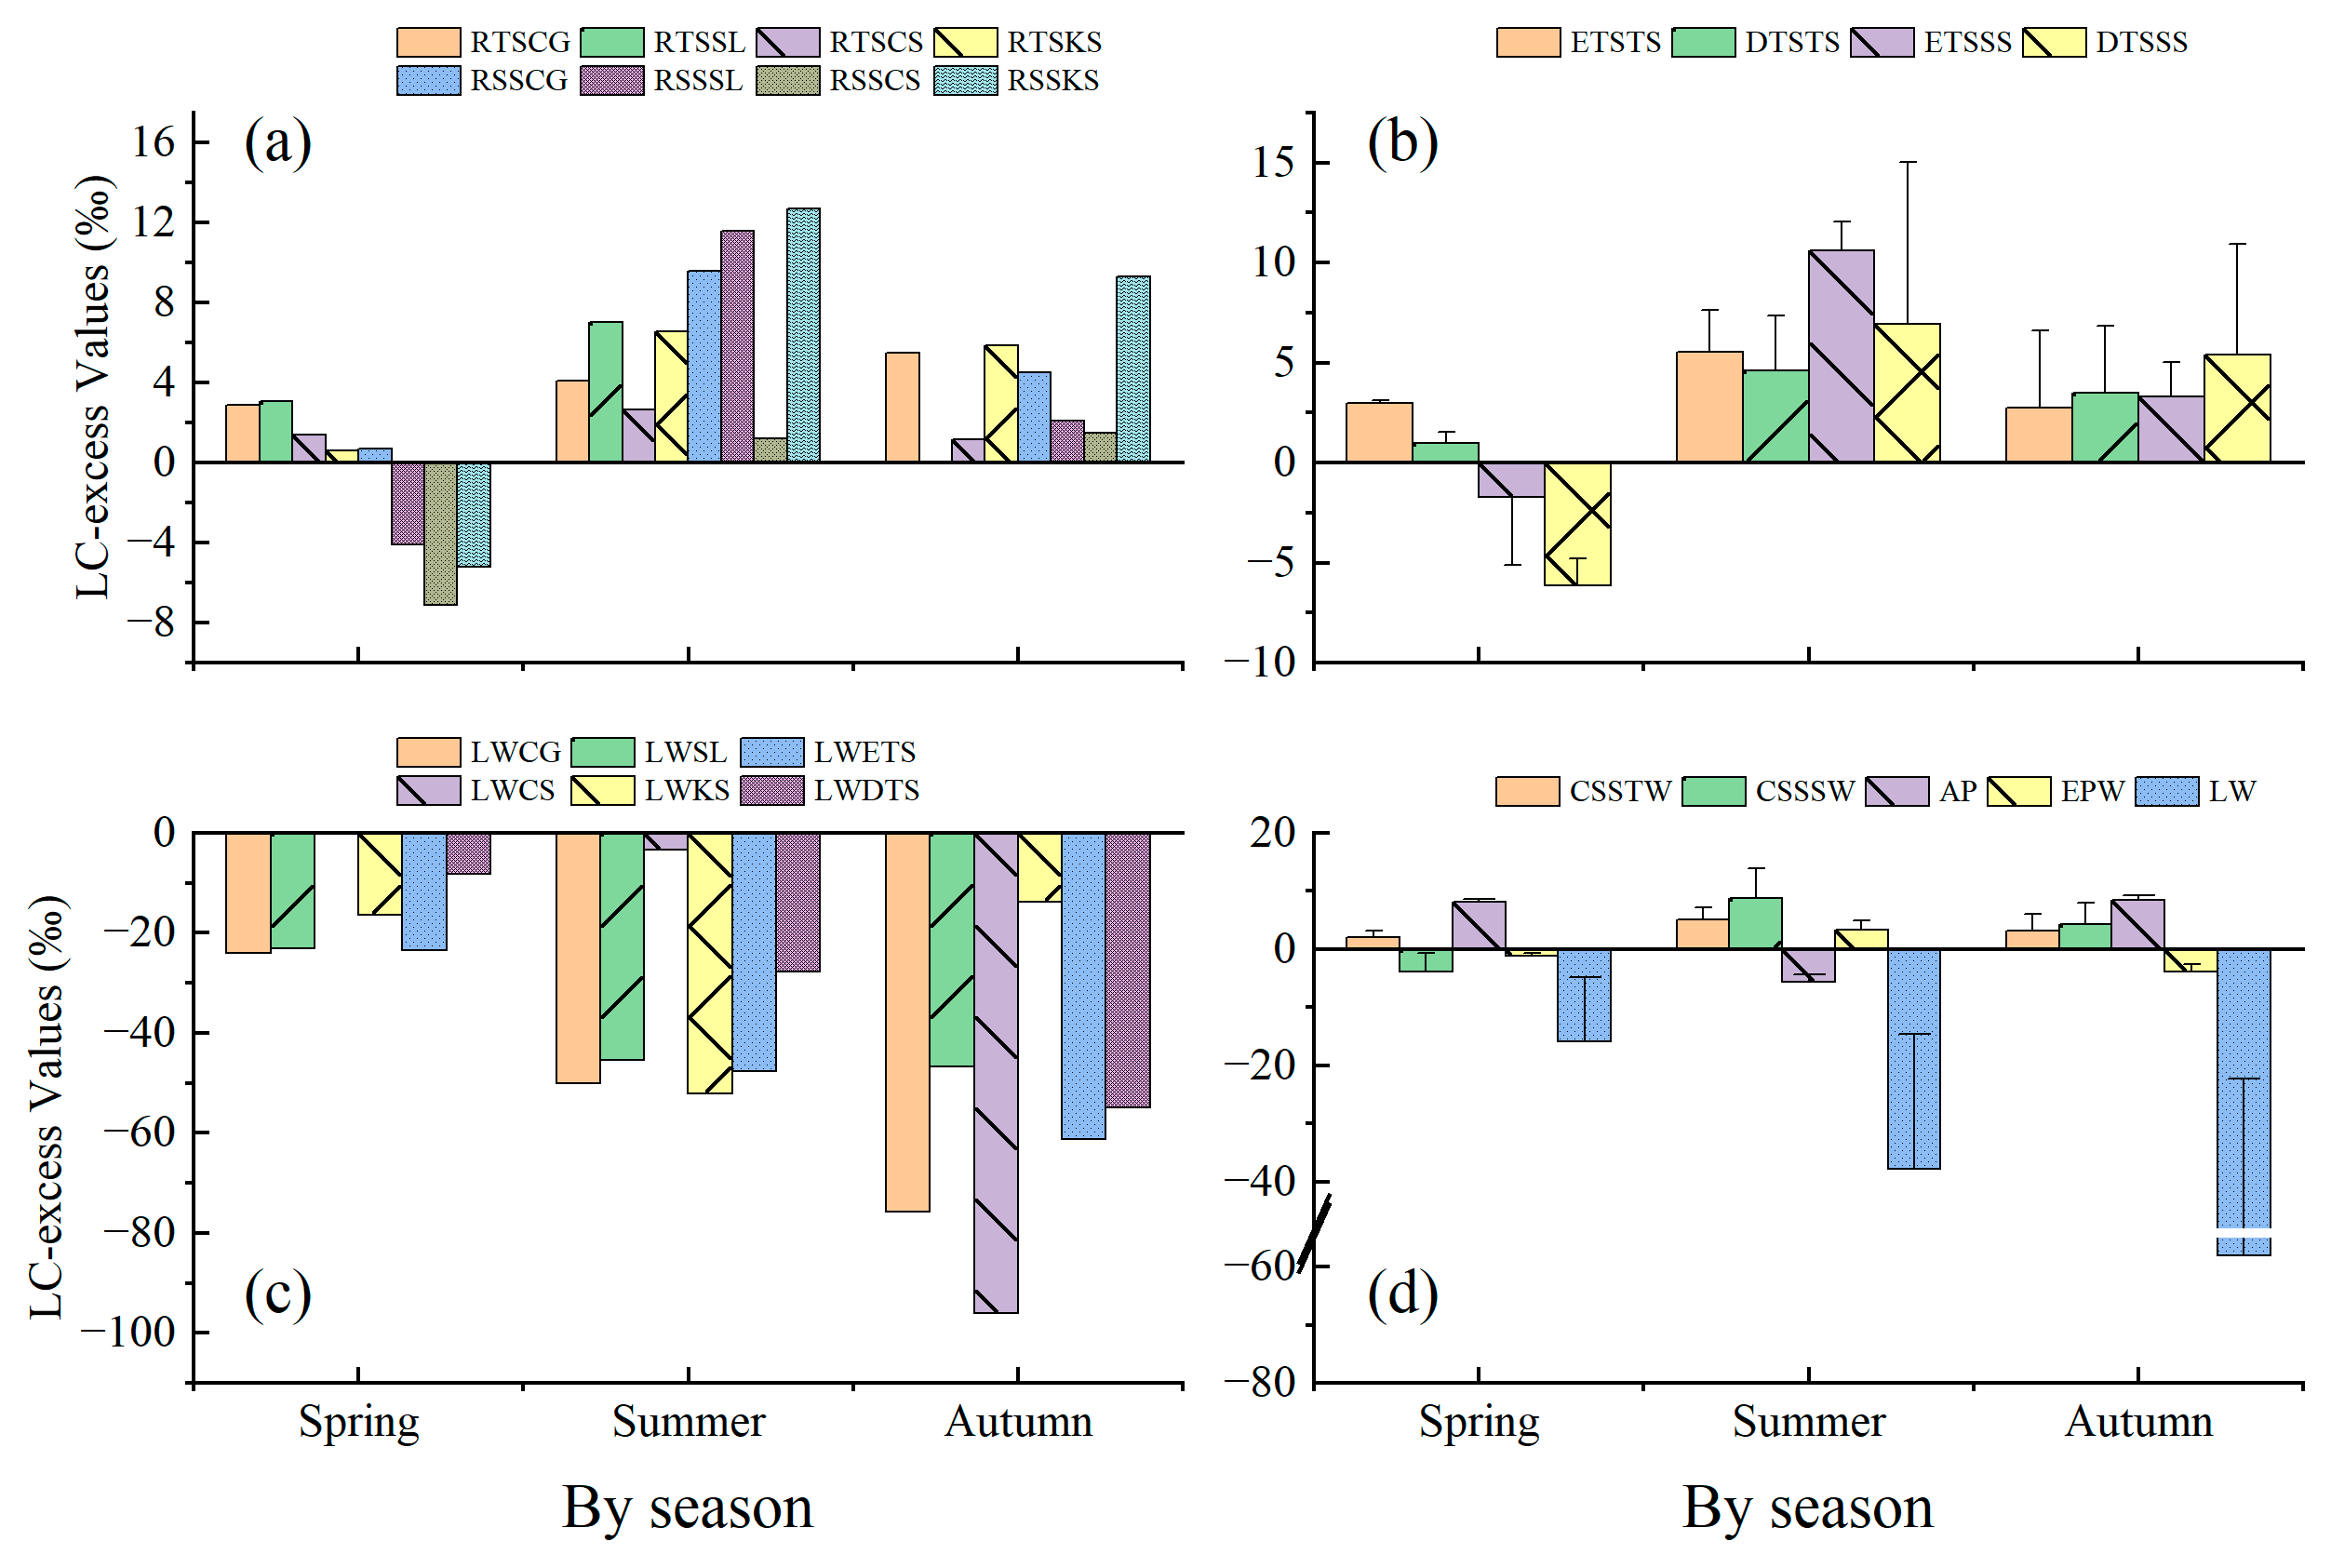
Figure 8 shows the LC-excess value variation in different water bodies, including epikarstic water (EPW), atmospheric precipitation (AP), and soil water at the sample site (CSSTW, CSSSW). It can be seen that the LC-excess value in the epikarstic water varied seasonally, with the highest level in autumn, followed by spring and summer. This reached a highly significant level (p < 0.01) between summer and spring/autumn, and a significant level (p < 0.05) between spring and autumn. In summer, the epikarstic water value was influenced by evaporation. The LC-excess value of atmospheric precipitation varied seasonally, with the highest in summer followed by spring and autumn. The LC-excess value varied highly significantly (p < 0.01) in different seasons. For atmospheric precipitation, the LC-excess value was higher in spring (−1.21‰) than in autumn (−3.83‰). In autumn, as the atmospheric precipitation was greatly influenced by evaporation, it was enriched with isotopes of δD and δ18O. In summer; however, as there had been precipitation in spring and ample summer precipitation, the isotopes of δD and δ18O were less influenced by evaporation.
Figure 8 also shows the LC-excess value variation in the rhizosphere soil water of different life forms and tree species in different seasons. It can be seen that, in spring, the LC-excess value of the sub-soil water was below zero, with a significant evaporative fractionation, and this evaporative fractionation was greater in the rhizosphere soil water of deciduous tree species than evergreen species. The LC-excess value of the top soil water was above zero, with no significant evaporative fractionation, and this evaporative fractionation was greater in the rhizosphere soil water of deciduous tree species than evergreen species. In summer and autumn, the LC-excess values of the rhizosphere soil water of different life forms were all above zero, with no significant evaporative fractionation in either top soil water or sub-soil water. However, the value was still closer to zero in the top soil water than in the sub-soil water, and the top soil water was prone to evaporative fractionation. This is related to the special dual-structured hydrological system found in karstic areas which leads to severe rainfall seepage.
Figure 8 shows the LC-excess value variation in leaf water for the four selected tree species in different seasons. It can be seen that, in spring and summer, the LC-excess values in the leaf water of evergreen tree species were generally negative, compared with deciduous tree species, indicating that the evaporative fractionation of the isotopic compositions in the leaf water of evergreen tree species was greater than deciduous tree species, with the opposite occurring in autumn. The evaporative fractionation of the leaf water in Symplocos lancifolia, Cyclobalanopsis glauca, and Celtis sinensis was greatest in autumn, followed by summer and spring. The evaporative fractionation of leaf water in Kalopanax septemlobus was greater in summer than in spring and autumn. This may be related to leaf size.
3.4. Plant Hydrogen and Oxygen Isotope Response to Precipitation
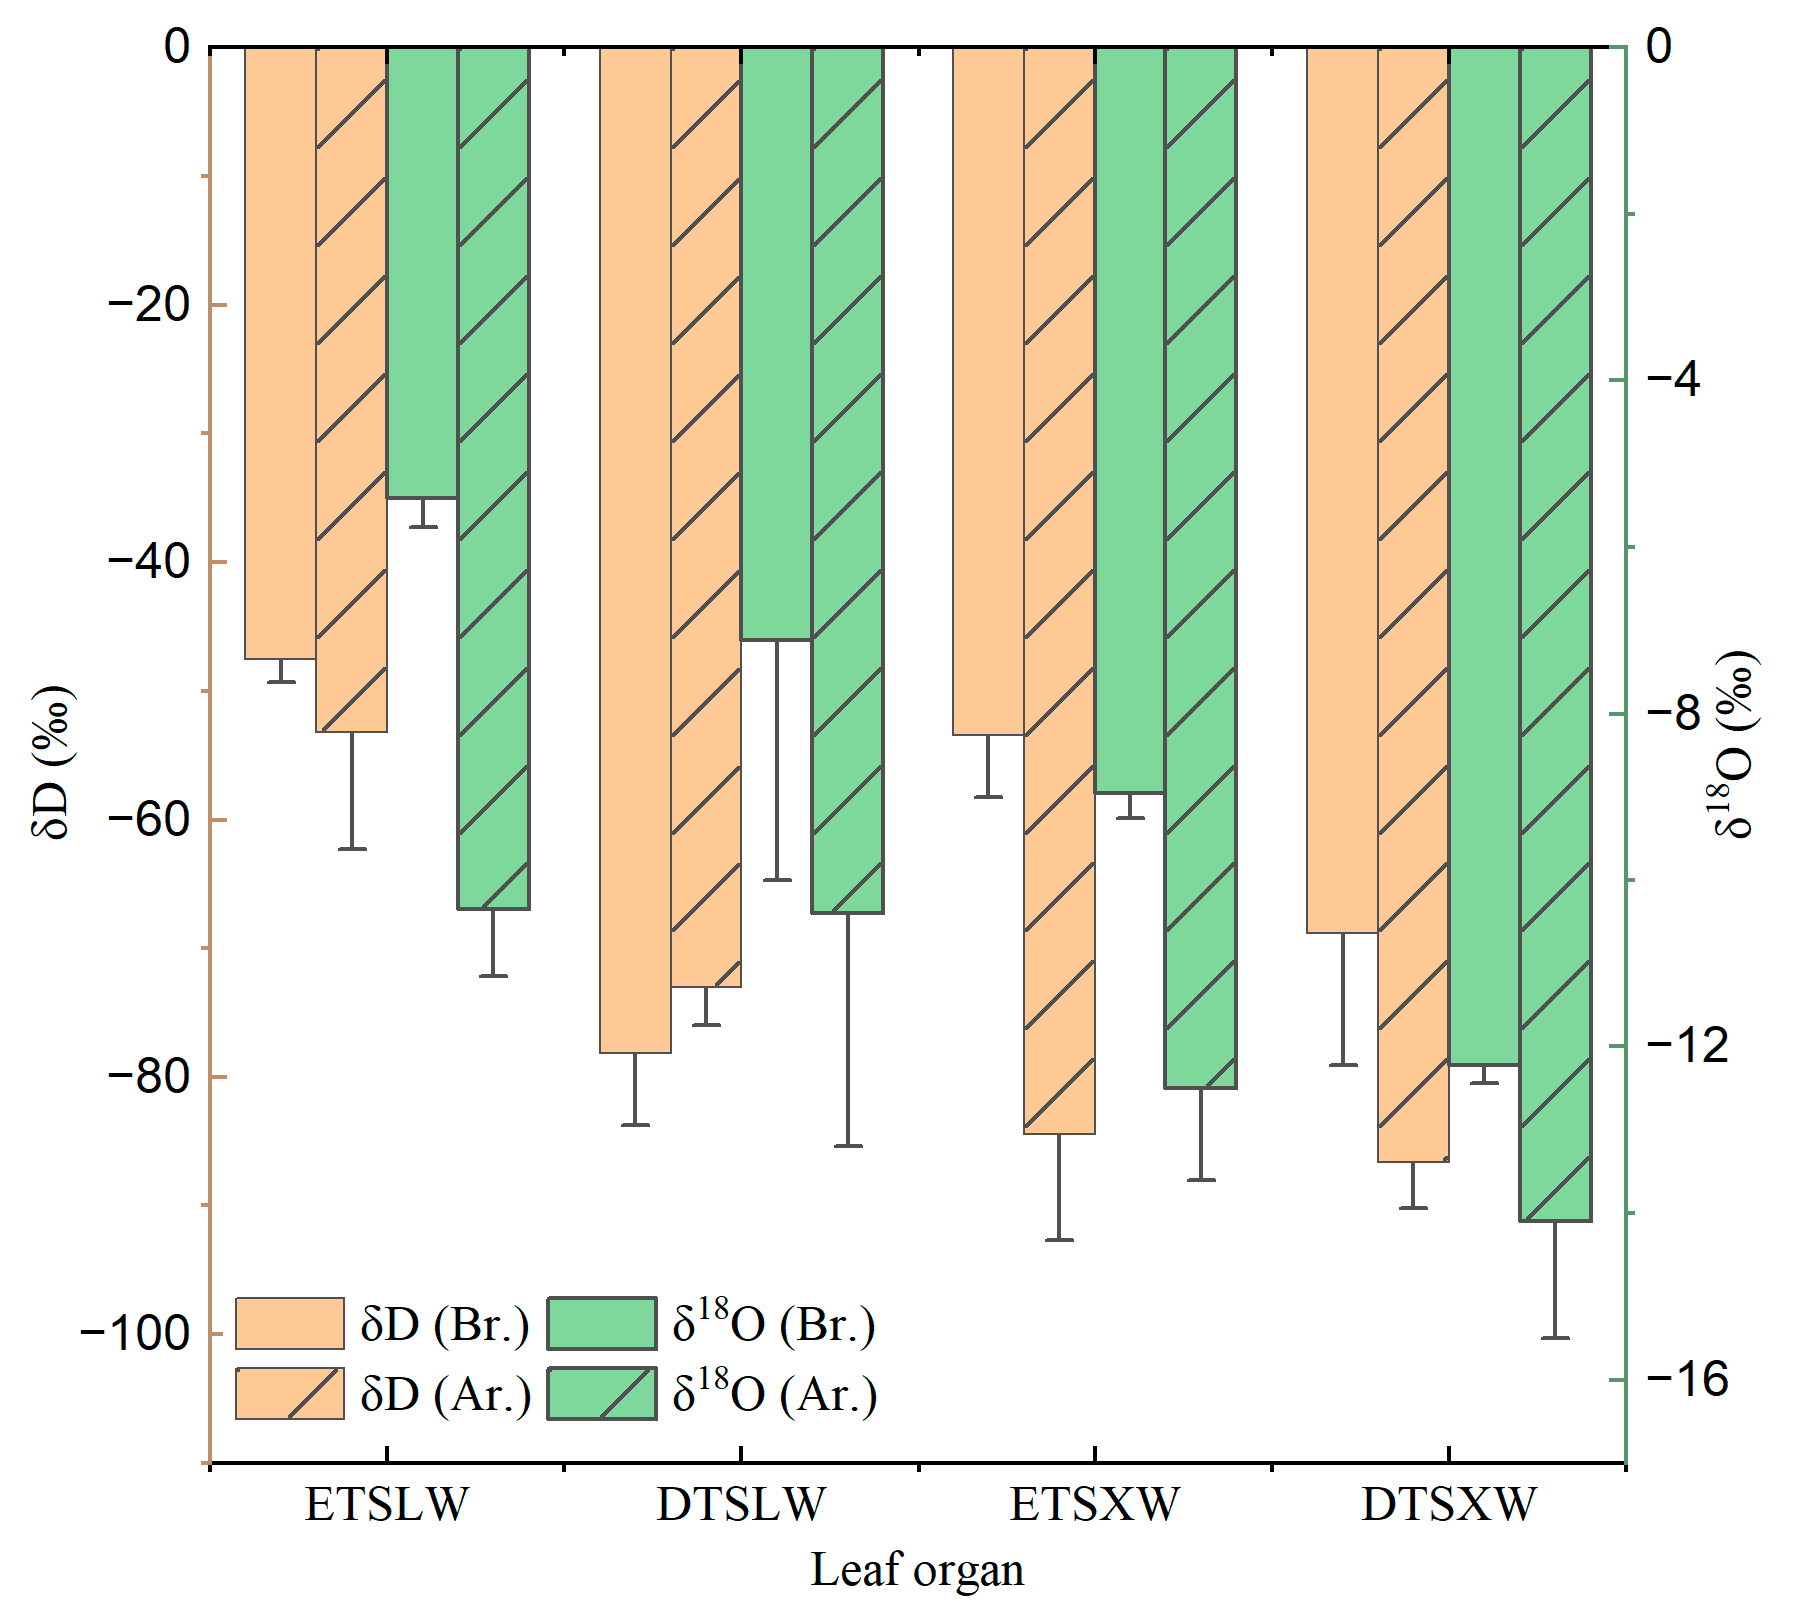
Figure 9 shows the hydrogen and oxygen isotopic characteristics of xylem water and leaf water before and after rainfall in summer. It can be seen that both xylem water and leaf water were influenced by precipitation. The δD and δ18O values in leaf water and xylem water were higher before rainfall than those after rainfall. Before rainfall, the δ18O value in the leaf water of evergreen tree species (−5.41‰) was higher than that of deciduous species (−7.11‰); after a rainfall, the δ18O value in the leaf water of evergreen tree species (−10.35‰) was close to that of deciduous species (−10.40‰). However, the xylem water of different life forms varied significantly. In terms of tree species, before rainfall, the δ18O value in the leaf water of Celtis sinensis was the highest (−5.06‰), followed by Cyclobalanopsis glauca (−5.16‰), Symplocos lancifolia (−5.65‰), and Kalopanax septemlobus (−9.15‰). After rainfall, the order turned to Symplocos lancifolia (−10.14‰), Celtis sinensis (−10.25‰), Kalopanax septemlobus (−10.56‰), and Cyclobalanopsis glauca (−10.57‰), with no significant difference (mean value ± standard deviation: −10.57‰ ± 0.22‰).
The δD value in leaf water of the selected tree species varied similarly to the δ18O value. The δ18O value in the leaf water of different life forms (evergreen and deciduous) and species varied significantly. Before rainfall, it was higher in evergreen tree species (−47.52‰) than in deciduous ones (−53.18‰); after rainfall, it was higher in deciduous tree species (−78.19‰) than in evergreen ones (−73.05‰). This is perhaps related to the fact that fractionation forms in leaf water, i.e., thermodynamic equilibrium fractionation, kinetic fractionation and biochemical fractionation, have different intensities [36].
3.5. Relation between Tree Stem Isotopic Compositions and Potential Water Sources
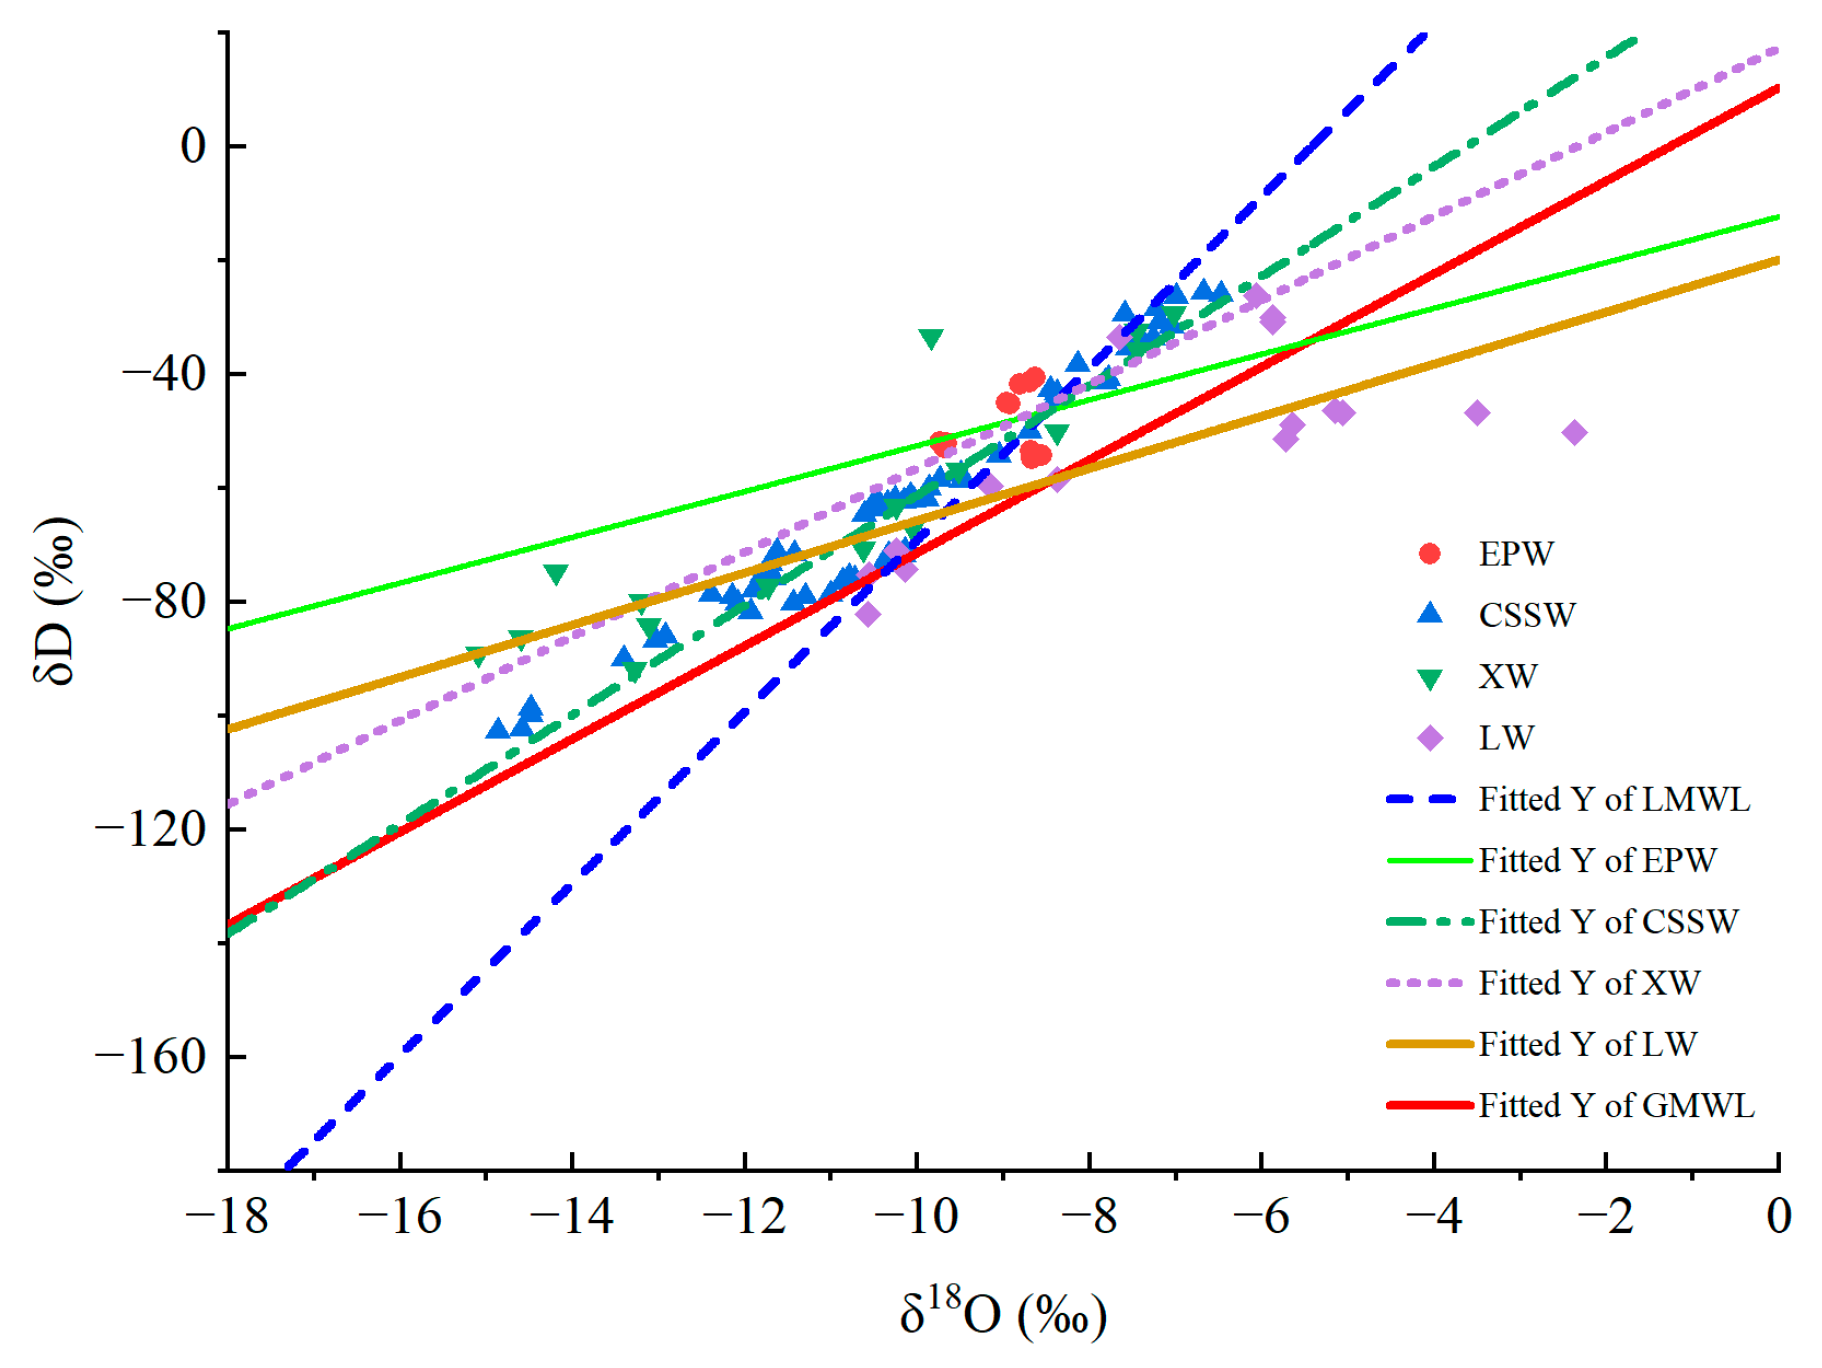
The experimental measurement of the samples showed a generally high significant difference for both δD and δ18O values (p < 0.01). Figure 10 shows the linear regression of δD and δ18O in xylem water and other water bodies. The hydrogen and oxygen isotopes in atmospheric precipitation fractionate during evaporation and condensation, resulting in a linear relationship between the values of δD and δ18O. This relationship is expressed by the least square method in a line equation. In the study, this line equation is expressed as LMWL = 15.09δ18O + 81.807 (R2 = 0.95, n = 12). The equation expressing the linear regression of δD and δ18O for global atmospheric precipitation is GMWL = 8.17δ18O + 10.35. By comparison, the former has a larger slope and intercept, which may be related to the fact that the study area is subject to continental water vapor sources and secondary evaporation under clouds [9]. Compared with the results of studying karstic peak clusters in Libo of Guizhou [29], expressed as δD = 8.59δ18O + 17.70 (R2 = 0.98, n = 108), the equation in this study has a larger slope and intercept. The main reason perhaps lies in the sample quantity and the time of sampling. Except for leaf water, the δD and δ18O values of the samples of xylem water, soil water and epikarstic water lie above or around the line of regional atmospheric precipitation, indicating that evaporation imposes a comparatively low influence on the isotopic compositions in each of those water bodies and that they vary seasonally. Regarding spring water, the variation in isotopic composition is slow, and smaller than precipitation.
The equations expressing the line relationship between δD and δ18O in plant xylem water are δDevergreen = 10.15 δ18O + 39.98 (R2 = 0.97) and δDdeciduous = 8.26 δ18O + 29.96 (R2 = 0.89); those for soil water are SWLevergreen = 9.30 δ18O + 31.21 (R2 = 0.86) and SWLdeciduous = 8.60 δ18O + 27.22 (R2 = 0.92). This shows that the δD and δ18O values of xylem water in deciduous tree species are closer to those in soil water, indicating that deciduous tree species have a stronger capacity to use soil water than evergreen tree species do. The equations for leaf water are δDevergreen = 5.57 δ18O − 12.72 (R2 = 0.67) and δDdeciduous = 0.70 δ18O − 48.06 (R2 = 0.01). The slope of deciduous tree species is larger than that of evergreen tree species, indicating that δ18O enrichment is more likely to occur in leaves of deciduous tree species.
3.6. Water Sources for Plant Use and Their Contributions
The δ18O values of the xylem water of different tree species and different water sources were also compared with the visual analysis method [11]. It is assumed that when the main water sources are identified as the ones that have a δ18O value close to or overlapping the plant water’s δ18O value, the main water uptake sources of different tree species or life forms can be preliminarily identified. Figure 11 shows the relationship between seasons and the main water-use sources. It can be seen that atmospheric precipitation constituted the primary water source for plants. Plants used it differently in different seasons, i.e., they took water from atmospheric precipitation most in spring, followed by summer and autumn.
In spring, the value of δ18O in the xylem water of evergreen tree species (i.e., Symplocos lancifolia and Cyclobalanopsis glauca) was closer to that of sub-soil water (10–50 cm), while the value of δ18O in the xylem water of deciduous tree species was closer to that of top soil water and epikarstic water (Ws). This indicated that top soil water and epikarstic water may be the main potential water sources of deciduous tree species, while sub-soil water is the main source for evergreen tree species, which use epikarstic water less than deciduous tree species.
In summer, the value of δ18O in the xylem water of evergreen tree species was closer to that of epikarstic water, and the top-down order was Cyclobalanopsis glauca (−8.38‰), Symplocos lancifolia (−9.52‰), Celtis sinensis (−10.24‰), and Kalopanax septemlobus (−14.19‰). In the same season, the mean value of δ18O in epikarstic water was −8.71‰, within the scope of −8.38‰ to 9.52‰; the value of δ18O in top soil water (0–10 cm) was −9.64 ± 0.18‰ (mean value ± standard deviation), and in sub-soil water (10–50 cm) was −10.04 ± 0.58‰ (mean value ± standard deviation), indicating that epikarstic water and top soil water may be the main water uptake sources for evergreen tree species Cyclobalanopsis glauca and Symplocos lancifolia, while sub-soil water was the main source for deciduous tree species.
In autumn, the value of δ18O in the xylem water of evergreen tree species was closer to that of sub-soil water, and was also closer to that of epikarstic water compared with deciduous tree species, and the value of δ18O in the xylem water of deciduous tree species was closer to that of sub-soil water, indicating that sub-soil water may be the main water uptake source for deciduous tree species, while top soil water and sub-soil water were the main sources for evergreen tree species, which may also use epikarstic water to some extent. This may be an important water constraint that affects the photosynthesis of leaves from evergreen tree species (the leaves are always green and the plant continues to grow normally through photosynthesis) and limits the photosynthesis of the leaves from deciduous tree species (where the leaves fade and the plant gradually becomes dormant to the point where it stops growing).
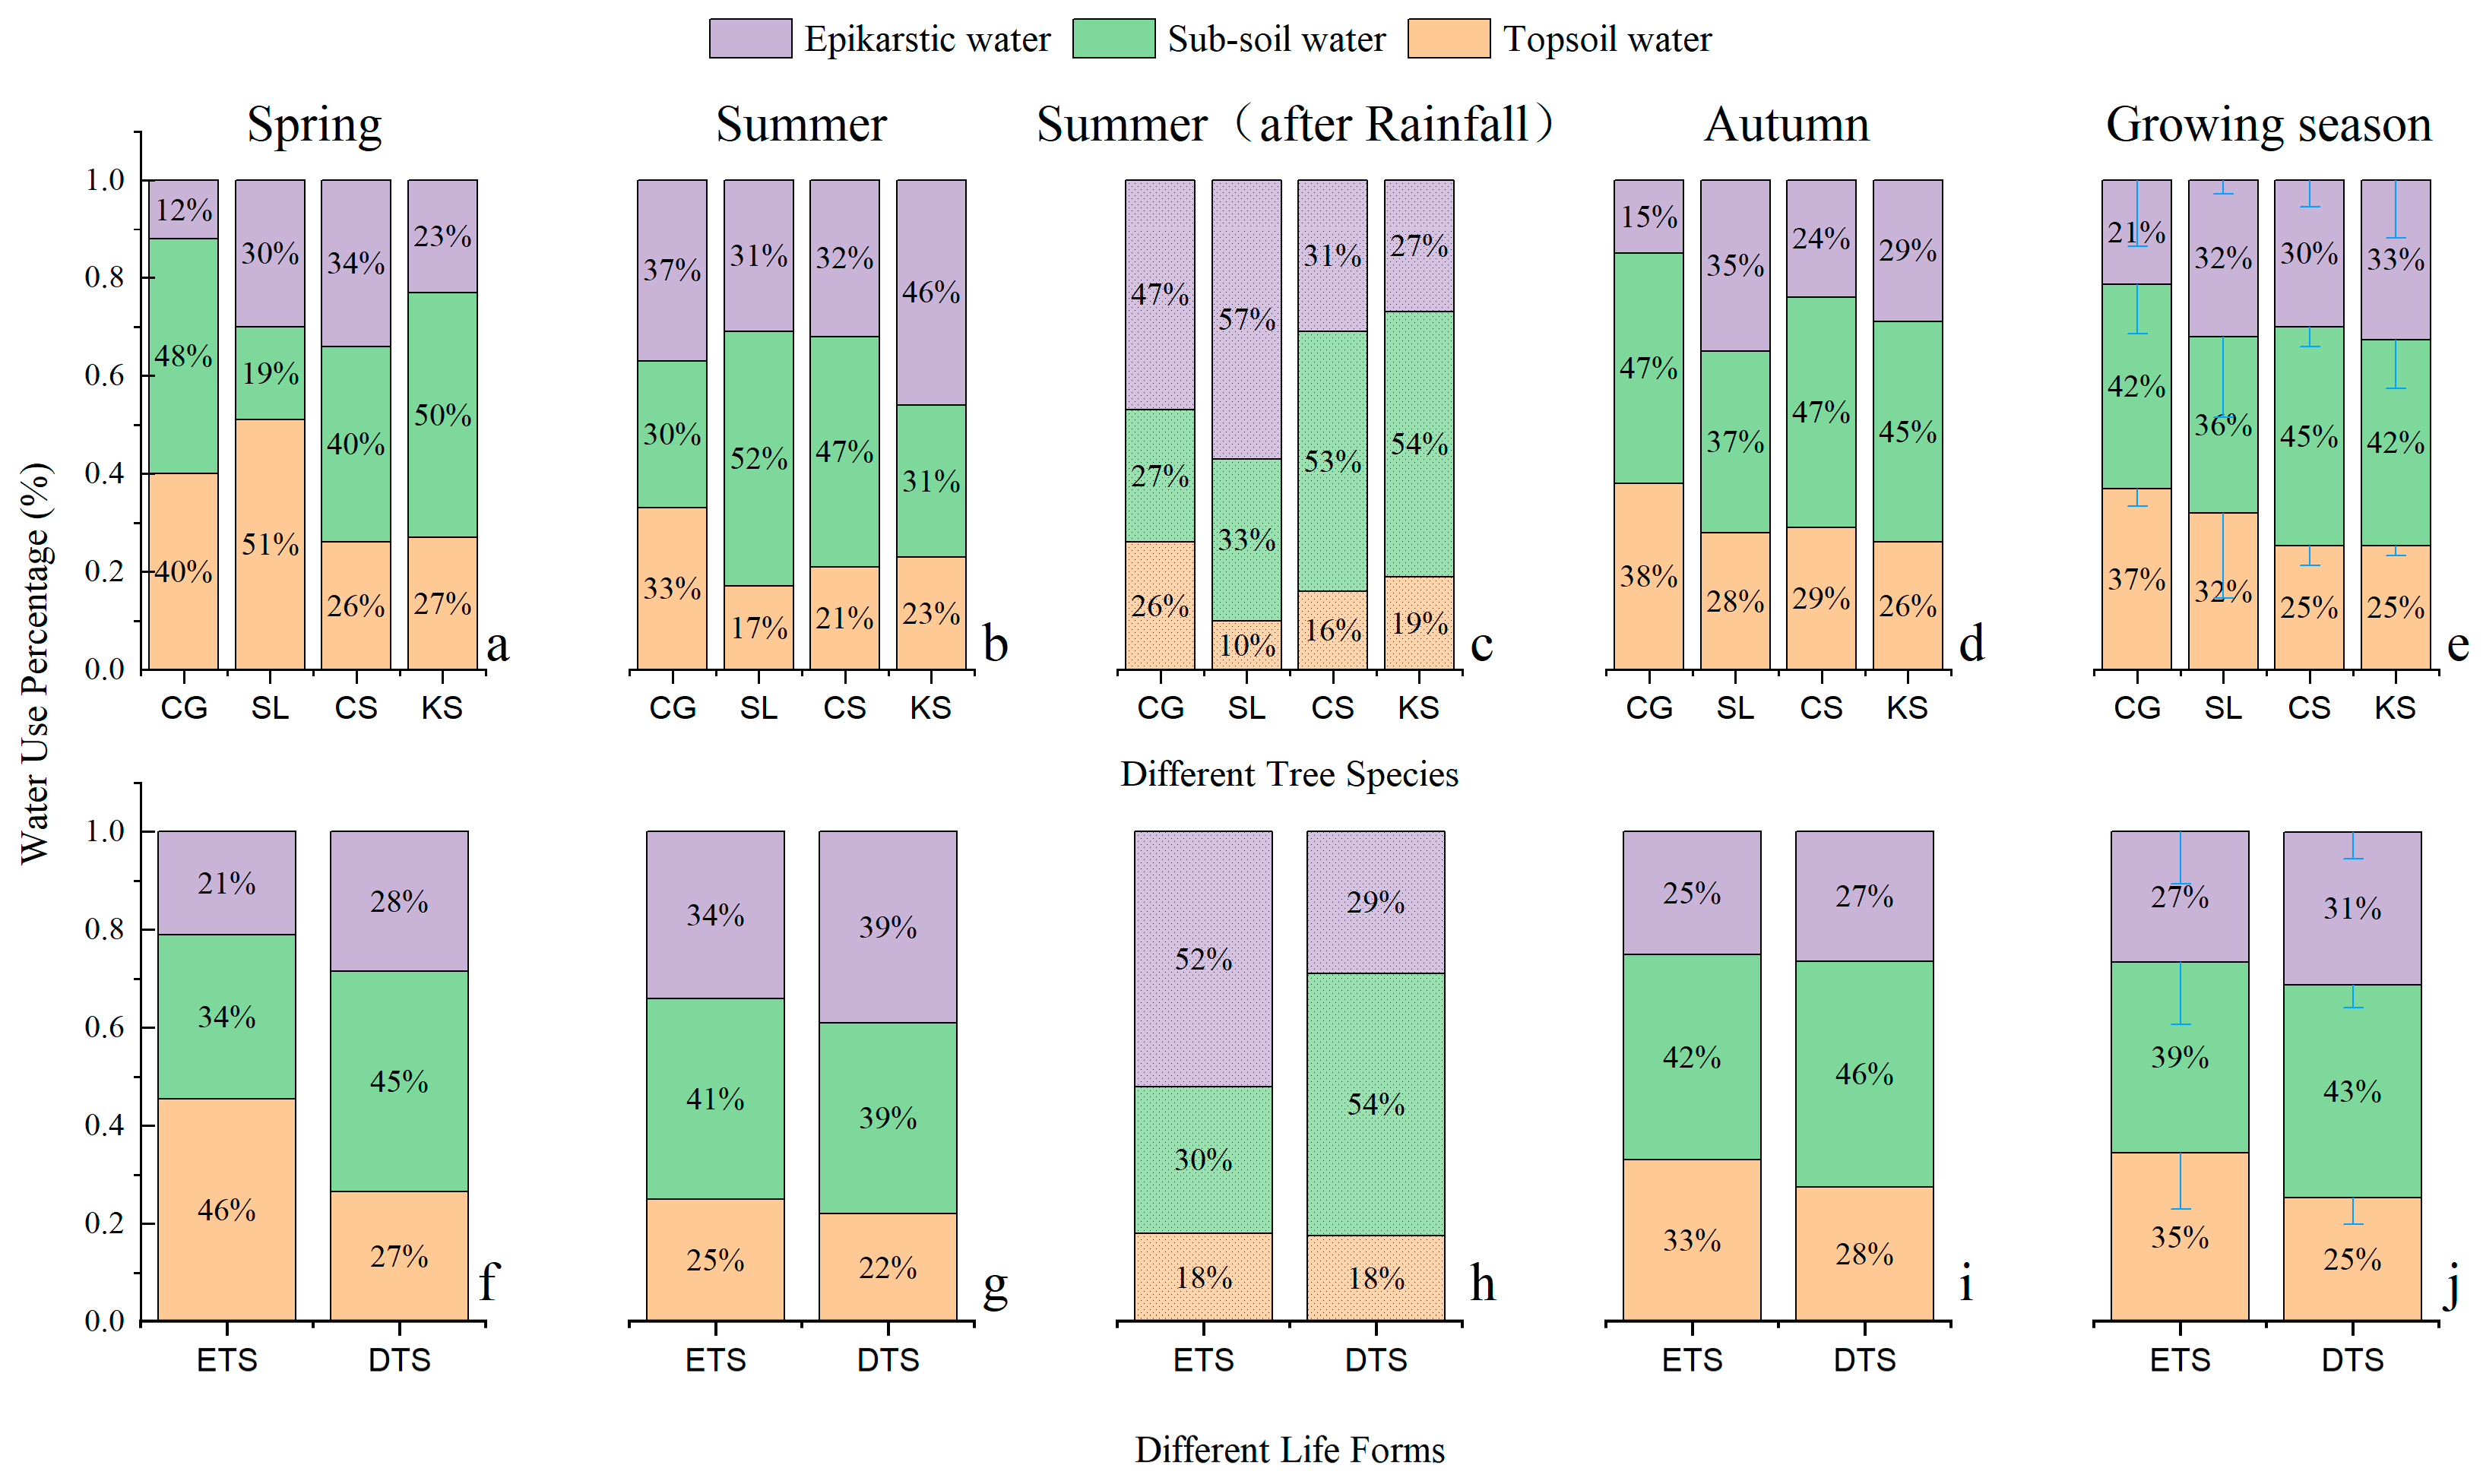
To quantify the percentage of the contribution of the potential water-use sources to plant growth via water use, this study applied the IsoSource mixing model to calculate the potential water use percentage of the four tree species in different seasons, as shown in Figure 12. Soil water was the most important potential water source for the plants, with an average contribution of 71%, ranging from 67.33% to 78.67% in the study, and epikarstic water contributed 29%. With respect to tree species, Cyclobalanopsis glauca used top soil water, sub-soil water and epikarstic water with proportions of 37%, 41.67% and 21.33%, respectively; Symplocos lancifolia used top soil water, sub-soil water and epikarstic water with proportions of 32%, 36% and 32%, respectively; Celtis sinensis used top soil water, sub-soil water and epikarstic water with proportions of 25.33%, 44.67% and 30%, respectively; and Kalopanax septemlobus used top soil water, sub-soil water and epikarstic water with proportions of 25.33%, 42% and 32.67%, respectively.
The tree species of different life forms varied significantly by season in terms of potential water-source use. Specifically, in spring, the evergreen tree species used top soil water, sub-soil water and epikarstic water with proportions of 45%, 33.5% and 21%, respectively, while the deciduous tree species used top soil water, sub-soil water and epikarstic water with proportions of 26.5%, 45% and 28.5%, respectively; in summer, the evergreen tree species used top soil water, sub-soil water and epikarstic water with proportions of 25%, 41% and 34%, respectively, while deciduous tree species used top soil water, sub-soil water and epikarstic water with proportions of 22%, 39% and 39%, respectively. In autumn, the evergreen tree species used top soil water, sub-soil water and epikarstic water with proportions of 33%, 42% and 25%, respectively, while the deciduous tree species used top soil water, sub-soil water and epikarstic water with proportions of 27.5%, 46% and 26.5%, respectively.
When comparing the potential water-source use in different conditions of precipitation in summer, the study found that the evergreen tree species used top soil water, sub-soil water and epikarstic water with proportions of 25%, 41% and 34%, respectively, before rainfall, and these proportions changed to 18%, 30% and 52%, respectively, after rainfall. That is to say, rainfall reduced the percentage of water use of evergreen tree species from soil water (including reductions in top soil water by 7% and sub-soil water by 11%), but increased the percentage of water use from epikarstic water by 18%. The deciduous tree species used top soil water, sub-soil water and epikarstic water with proportions of 22%, 39% and 39%, respectively, before rainfall, and these proportions changed to 17.5%, 53% and 29%, respectively, after a rainfall. That is to say, rainfall reduced the percentage of water use of deciduous tree species from epikarstic water by 10%, but increased the percentage of water use from sub-soil water by 14%, and slightly reduced the percentage of water use from top soil water by 4.5%.
Due to the unique characteristics of shallow and discontinuous karst top soil, plants in adaptation areas are mostly distributed in terrain such as stone ditches and stone cracks, and the plant roots are mostly shuttled in the rock cracks and less concentrated on the soil surface. Moreover, plants can adapt to adverse environments by adjusting root water uptake strategies under different arid climate conditions, thereby maintaining normal growth and development.
4. Discussion
4.1. Characteristics of Isotopic Variation
Stable hydrogen and oxygen isotopic compositions are fine tracers stored in natural water bodies and plant tissues [37] with highly sensitive and accurate traceability. In this study, the mean values of δD and δ18O in atmospheric precipitation were the highest in spring (−7.07‰, −26.04‰), followed by summer (−8.73‰, −46.58‰), and the lowest in autumn (−9.42‰, −62.88‰), i.e., the values of δD and δ18O in precipitation had a positive bias in spring and a negative bias in summer and autumn. This result shows similarity to the study by Hu, K et al. [25]. The hydrological connectivity in karstic catchment regulates the water sources and flowing path [38], remarkably influencing the characteristics of isotopic dynamics in epikarstic water. The study found that the values of δD and δ18O in the xylem water of the tree species was between those of soil water and epikarstic water. The epikarstic zone develops deeply with spacious water storage [39], indicating that the soil water and epikarstic water constitute reliable potential water sources for these tree species. This result is consistent with that reported in the study on the karstic plateau and habitats in the central part of Guizhou conducted by Rong, L et al., 2012 [18], and Du, X et al., 2015 [14]. Leaves grow with photosynthesis and generate transpirational pull, which is an important process for plants to maintain their own water needs. Variation in stable isotopic composition in leaves indicates the connections between interior and exterior matters and energy, and reflects information regarding plants’ peripheral climate and ecology.
The significant differences in isotopic composition in the xylem water of plants in arid karstic areas imply evident differences in the eco-hydrological niche among species [40]. The study shows that the value of δD measured in the leaf water of different life forms (i.e., evergreen and deciduous) and tree species varied significantly. Specifically, the value was higher in evergreen tree species (−47.52‰) than in deciduous tree species (−53.18‰) before rainfall; however, it was higher in deciduous tree species (−78.19‰) than in evergreen tree species (−73.05‰) after rainfall. This is perhaps related to the fact that fractionation forms in leaf water, i.e., thermodynamic equilibrium fractionation, kinetic fractionation and biochemical fractionation, are of different intensities [36]. Further investigations may be necessary to measure the percentage of different fractionation models’ contribution to the variation in hydrogen and oxygen isotopic values in plant leaves, as well as their variation mechanisms.
Soil water stable isotope compositions (SWSI) and soil water content (SWC) are widely used to explain the process of water exchange at the land–atmosphere interface [41]. The values of δ18O and δD of the soil water in karstic areas show significant seasonal variation [42]. In this study, researchers found that the hydrogen and oxygen isotopic values of water in the same soil layer varied significantly between seasons, and the δ18O value of soil water varied with soil depth in the same season. Specifically, in spring, the δ18O value of the soil water first increased and then decreased as the soil layer became deeper, and the δD value of the soil water also increased gradually as the soil layer became deeper; in summer and autumn, the values of both δ18O and δD first decreased and then increased as the soil layer became deeper. Such patterns of variation deepen the heterogeneity of karstic stony habitats with shallow and discontinuous soil cover, pronounced precipitation, and seasonal effects, as well as frequent temporary droughts. This results in intra- or interspecies niche differentiation, and a high regional species diversity is thus maintained.
4.2. Characteristics of LC-Excess Value Variation
Under balanced conditions, the linear regression between δD and δ18O is δD = 8 δ18O, and δD = δ18O = 0 refers to the average stable isotopic concentration in oceanic water. Craig et al. observed that δD and δ18O values in atmospheric precipitation at a global level are linearly related by δD = 8 δ18O + 10 [43]. This equation is known as the “Global Meteoric Water Line” (GMWL). The line-conditioned excess (LC-excess) represents the deviation degree of the δD value of different water bodies with the local meteoric water line (LMWL) and indicates the evaporation degree of different water bodies against local atmospheric precipitation [24,32]. This has been universally adopted to evaluate the traits of the evaporative fractionation of hydrogen and oxygen isotopic compositions [44,45,46]. LC-excess value variation in deeper soil layers is closely related to climatic conditions [47]. The study showed that the LC-excess value in the epikarstic water varied seasonally: it was highest in autumn, followed by spring and summer. It reached a highly significant level (p < 0.01) between summer and spring/autumn, and a significant level (p < 0.05) between spring and autumn. In summer, the epikarstic water was influenced by evaporation. The LC-excess value in atmospheric precipitation varied seasonally: highest in summer, followed by spring and autumn. The LC-excess value varied very significantly (p < 0.01) in different seasons. For atmospheric precipitation, the LC-excess value was higher in spring (−1.21‰) than in autumn (−3.83‰). In autumn, as the atmospheric precipitation was greatly influenced by evaporation, and was enriched with isotopes of δD and δ18O. In summer, however, as there had been spring precipitation and ample summer precipitation, the humidity was high, and rainfall occurred frequently, the isotopes of δD and δ18O were less influenced by evaporation.
The evaporative fractionation of hydrogen and oxygen isotopic compositions mainly occurs in the water stored in soil layers [7]. This study shows the LC-excess value variation in rhizosphere soil water of different life forms and tree species in different seasons. In spring, the LC-excess value of the sub-soil water was below zero, with a significant evaporative fractionation, and this evaporative fractionation was greater in the rhizosphere soil water of deciduous tree species than in that of evergreen species. The LC-excess value of the top soil water was above zero, with no significant evaporative fractionation, and this evaporative fractionation was greater in the rhizosphere soil water of deciduous tree species than in that of evergreen species. In summer and autumn, the LC-excess values of rhizosphere soil water of different life forms were all above zero, with no significant evaporative fractionation in either top soil water or sub-soil water. However, it was still closer to zero in top soil water than in sub-soil water, and the top soil water was prone to evaporative fractionation. This is related to the special dual-structured hydrological system found in karstic areas which leads to severe rainfall seepage [29], and the isotopic variation model was different from that of non-karstic areas [48]. Karst soil water movement mainly has two modes: plug flow and preferential flow, which constitute the downward mode; and surface evaporation and root hydraulic lift, which constitute the upward mode [27].
δD and δ18O values in each part of a leaf are also linearly related to some extent, which is known as the leaf water transpiration line [49]. The LC-excess traits of the leaf water in the four selected tree species from the four seasons are shown in Figure 8. It can be seen that, in spring and summer, the LC-excess value in the leaf water of the evergreen tree species was generally negative, compared with that of deciduous tree species, indicating that the evaporative fractionation of isotopic composition in the leaf water of evergreen tree species was greater than that of deciduous tree species, and this was the opposite in autumn. The evaporative fractionation of the leaf water in Symplocos lancifolia, Cyclobalanopsis glauca, and Celtis sinensis was greatest in autumn, followed by summer and spring. The evaporative fractionation of leaf water in Kalopanax septemlobus was greater in summer than in spring and autumn. This may be related to leaf size.
4.3. Water-Use Sources and Strategies of Plants in Karstic Areas
Trees change morphologically and physiologically in response to changes in the environment and their corresponding adaptive strategies. To some extent, these adaptive strategies are functional. Plant communities with different functional strategies differ from each other in terms of water use [50]. Water availability in the habitat is one of the key factors shaping the forest eco-system and its adaptive response to environmental stress [51]. The non-fractionation process based on rhizosphere soil water absorption and water transmission within the plants provides a theoretical basis for studying the water sources of plants [52]. The study shows that soil water constitutes the primary potential water source for plants, with an average contribution of 71% (ranging from 67.33% to 78.67% in the study). Epikarstic water contributed 29%. With respect to tree species, Cyclobalanopsis glauca used top soil water, sub-soil water and epikarstic water with proportions of 37%, 41.67% and 21.33%, respectively; Symplocos lancifolia used top soil water, sub-soil water and epikarstic water with proportions of 32%, 36% and 32%, respectively; Celtis sinensis used top soil water, sub-soil water and epikarstic water with proportions of 25.33%, 44.67% and 30%, respectively; and Kalopanax septemlobus used top soil water, sub-soil water and epikarstic water with proportions of 25.33%, 42% and 32.67%, respectively. These results suggest that deciduous species have a wider range of water-use strategies and are more adaptable, which may be related to their root distribution in karstic areas [53,54]. To put it another way, deciduous species grow deep-reaching and wide-branching root systems [55]. This may be one of the mechanisms resulting in deciduous species’ higher adaptability to harsh karstic habitat featuring temporary and frequent droughts and shallow and discontinuous soil cover. In the study, tree species of different life forms varied significantly by season in terms of potential water sources. Specifically, in spring, the evergreen tree species used top soil water, sub-soil water and epikarstic water with proportions of 45%, 33.5% and 21%, respectively, while the deciduous tree species used top soil water, sub-soil water and epikarstic water with proportions of 26.5%, 45% and 28.5%, respectively; in summer, the evergreen tree species used top soil water, sub-soil water and epikarstic water with proportions of 25%, 41% and 34%, respectively, while the deciduous tree species used top soil water, sub-soil water and epikarstic water with proportions of 22%, 39% and 39%, respectively. In autumn, the evergreen tree species used top soil water, sub-soil water and epikarstic water with proportions of 33%, 42% and 25%, respectively, while the deciduous tree species used top soil water, sub-soil water and epikarstic water with proportions of 27.5%, 46% and 26.5%, respectively. This is mainly due to the fact that the root system is the main organ of water acquisition and use by plants, and in the present study, Cyclobalanopsis glauca, Symplocos lancifolia, Celtis sinensis, and Kalopanax septemlobus are all tree species with deep roots and high drought tolerance and adaptability. This result, however, is different from the findings of some other researchers, which indicate that the deciduous species Platycarya longipes reduces its water use from epikarstic water when the dry season comes. The reason for this difference may be related to the distribution of the plant root system [56], the environmental conditions at the time of the study, and the fact that the test material was a young tree of Platycarya longipes [18]. Deciduous tree species use a greater proportion of water in deeper soil layers than evergreen species do, which may be related to the transpiration strength of the trees. Previous studies have found that when the top soil is relatively dry, plants (the four selected tree species) turn to deeper water sources to meet their needs of transpiration, causing the enrichment of δ18O in tree leaves [57]. However, further studies on transpiration in these four species are needed to support this statement. This study found that evergreen tree species reduced the percentage of water use from soil water (including top soil water reduced by 7% and sub-soil water by 11%), but increased the percentage of water use from epikarstic water by 18%. Deciduous tree species reduced the percentage of water use from epikarstic water by 10%, but increased the percentage of water use from sub-soil water by 14%, and slightly reduced the percentage of water use from top soil water by 4.5%. The four tree species differ from each other significantly regarding using epikarstic water, showing their different water-use strategies. This may be an important water constraint that affects the photosynthesis of the leaves from evergreen tree species (the leaves are always green and the plant continues to grow normally through photosynthesis) and limits the photosynthesis of the leaves from deciduous tree species (where the leaves fade and the plant gradually becomes dormant to the point where it stops growing), thus enabling these species to co-exist with other species in the complex karstic environment.
Water stress (lack of rainfall or shallow soil cover) is prominent in karstic areas. Maintaining growth and development through longitudinal root growth to obtain more water is a manifestation of the plasticity of roots in water uptake at depth [58], which is related to soil water availability, sap flow velocity, and water-use rate in the different growing stages of the tree species [59]. For trees, the main practice is to use soil water in the rainy season and ground water in the dry season [17]. Previous studies have found that plants vary in terms of root water uptake mode [60], and variation is also found in potential water-source use. Such variation is associated with the plants’ growing stages, seasons, soil water, phenological stages, the size of the trees, etc., even if it involves only a single species [61]. The study of plant water-use strategies also requires a comprehensive analysis of the soil nutrient conditions and the water physiological characteristics of plants growing in different habitats so as to reveal the relationship between water transformation, nutrient cycling and water use by plants [35]. Unfortunately, the present study lacks a comparative analysis of the various development stages of different tree species in the same community, and their intrinsic mechanisms and water-use strategies in karstic habitats need to be studied further.
5. Conclusions
Precipitation in the study area was mainly concentrated in the summer. In terms of precipitation intensity, summer came first (8.96 mmd−1), followed by spring (3.82 mmd−1), autumn (3.07 mmd−1) and winter (1.57 mmd−1). Influenced by the water vapor of different sources in winter and summer in the monsoon region, the stable isotopic precipitation compositions varied significantly by season. The values of δD and δ18O in precipitation had a positive bias in spring and a negative bias in summer and autumn. The value of deuterium excess (d-excess) was between 11.67‰ and 31.02‰, with a mean value of 22.98‰.
Trees of different life forms and species varied in capacity and proportion in terms of using potential water sources in different seasons. Specifically, in spring, deciduous tree species used top soil water and epikarstic water as the main potential water sources, while evergreen tree species mainly used sub-soil water, and used epikarstic water less than deciduous species did. In summer, evergreen tree species mainly used top soil water and epikarstic water, while deciduous species used sub-soil water. In autumn, deciduous species acquired water mainly from sub-soil water, while evergreen species used soil water (both top soil water and sub-soil water) as well as epikarstic water as much as possible.
Soil water was the most important potential water source for dominant tree species in karst terrain, with an average contribution of 71% ranging from 67.33% to 78.67% in the study, followed by epikarstic water with a contribution of 29%. Trees of different species and life forms varied in capacity and proportion in terms of the use of potential water sources in different seasons. Overall, deciduous tree species had greater potential water-use capacity and variable water-use strategies.
Author Contributions
Conceptualization—F.D.; methodology and software—C.Y., J.C. and T.Z.; validation and formal analysis—J.C. and C.Y.; investigation—J.C. and P.W.; resources and data curation—F.D. and C.Y.; writing—original draft preparation, C.Y. and J.C.; writing—review and editing—F.D. and C.Y.; visualization—Y.Y. and P.W.; supervision, project administration and funding acquisition—F.D. All authors have read and agreed to the published version of the manuscript.
Funding
This research was financially supported by the National Natural Science Foundation of China (Project No. 31760240).
Data Availability Statement
The data presented in this study are available on request from the corresponding author.
Acknowledgments
We are very grateful to Zhou Hua for his assistance in this field and laboratory work.
Conflicts of Interest
The authors declare no conflict of interest.
Abbreviations
| SL | Symplocos lancifolia |
| CG | Cyclobalanopsis glauca |
| CS | Celtis sinensis |
| KS | Kalopanax septemlobus |
| AP | atmospheric precipitation |
| EPW | epikarstic water |
| SW | soil water |
| ST | soil temperature |
| SD | soil depth |
| XW | xylem water |
| LW | leaf water |
| CSSW | community sample site soil water |
| CSSTW | community sample site top soil water |
| CSSSW | community sample site sub-soil water |
| RTSSL | rhizosphere top soil of Symplocos lancifolia |
| RTSCG | rhizosphere top soil of Cyclobalanopsis glauca |
| RTSCS | rhizosphere top soil of Celtis sinensis |
| RTSKS | Rhizosphere Top soil of Kalopanax septemlobus |
| RSSSL | rhizosphere sub-soil of Symplocos lancifolia |
| RSSCG | rhizosphere sub-soil of Cyclobalanopsis glauca |
| RSSCS | rhizosphere sub-soil of Celtis sinensis |
| RSSKS | rhizosphere sub-soil of Kalopanax septemlobus |
| ETST | evergreen tree species top soil |
| ETSS | evergreen tree species sub-soil |
| DTST | deciduous tree species top soil |
| DTSS | deciduous tree species sub-soil |
| SWSI | soil water stable isotope compositions |
| SWC | soil water content |
References
- Shi, H.; Liu, S.R.; Zhao, X.G. Application of stable hydrogen and oxygen isotope in water circulation. J. Soil Water Conserv. 2003, 17, 163–166. [Google Scholar]
- Duan, D.Y.; Ouyang, H. Application of stable hydrogen and oxygen isotope in analyzing plant water use sources. Ecol. Environ. 2007, 16, 655–660. [Google Scholar]
- Nie, Y.P.; Cheng, H.S.; Wang, K.L.; Susanne, S. Challenges and probable solutions for using stable isotope techniques to identify plant water sources in karst regions: A review. Chin. J. Appl. Ecol. 2017, 28, 2361–2368. [Google Scholar]
- Miguez-Macho, G.; Fan, Y. Spatiotemporal origin of soil water taken up by vegetation. Nature 2021, 598, 624–628. [Google Scholar] [CrossRef]
- Yu, J.J.; Li, Y.F. Uncertainties in the usage of stable hydrogen and oxygen isotopes for the quantification of plant water sources. Acta Ecol. Sin. 2018, 38, 7942–7949. [Google Scholar]
- Yang, K.Y.; Jia, Z.Q.; Li, Q.X.; Feng, L.L.; He, L.X.Z. Research progress in plant water use strategy and its threshold. World For. Res. 2017, 30, 13–18. [Google Scholar]
- Sprenger, M.; Tetzlaff, D.; Tunaley, C.; Dick, J.; Soulsby, C. Evaporation fractionation in a peatland drainage network affects stream water isotope composition. Water Resour. Res. 2017, 53, 851–866. [Google Scholar] [CrossRef] [Green Version]
- Liu, L.; Jia, G.D.; Yu, X.X.; Zhang, Y.E. Daily variations of δ~(18)O and its quantitative distinction in evapotranspiration components of Platycladus orientalis plantation during the rapid growth season in the mountainous area of Beijing. J. Beijing For. Univ. 2017, 39, 61–70. [Google Scholar]
- Zhang, G.L.; Jiao, Y.M.; He, L.P.; Liu, X.; Liu, C.J.; Yan, X.J.; Wang, M. Hydrogen and oxygen isotopes in precipitation in Southwest China:progress and prospects. J. Glaciol. Geocryol. 2015, 37, 1094–1103. [Google Scholar]
- Liu, Z.Q.; Yu, X.X.; Lou, Y.H.; Jia, J.B.; Jia, G.D.; Lu, W.W. Water use strategy of Quercus variabilis in Beijing mountainous area. J. Beijing For. Univ. 2016, 38, 40–47. [Google Scholar]
- Li, X.S.; Jia, D.B.; Qian, L.J.; Feng, Y. Water use strategy of poplar (Populus alba) in different growing seasons based on isotopic analysis. Chin. J. Ecol. 2018, 37, 840–846. [Google Scholar]
- Wang, X.; Jia, G.D.; Deng, W.P.; Liu, Z.Q.; Liu, Z.H.; Qiu, G.F.; Li, W.L. Long-term water use characteristics and patterns of typical tree species in seasonal drought regions. Chin. J. Appl. Ecol. 2021, 32, 1943–1950. [Google Scholar]
- Feng, Y.; Jia, D.B.; Li, X.S.; Zhang, Y.Q. Study on water sources of poplar in arid and semiarid regions based on stable isotopes. Water Sav. Irrig. 2019, 4, 27–31. [Google Scholar]
- Du, X.L.; Wang, S.J.; Luo, X.Q. Characteristics of water sources of common plant species in various microhabitats in karst rocky desertification area in central Guizhou Province. Resour. Environ. Yangtze Basin 2015, 24, 1168–1176. [Google Scholar]
- Cheng, L.P.; Liu, W.Z. Characteristics of stable isotopes in soil water under several typical land use patterns on Loess Tableland. Chin. J. Appl. Ecol. 2012, 23, 651–658. [Google Scholar]
- Zhu, X.Q.; Fan, T.; Guan, W.; Qin, N. Soil-water utilization levels in a Cyclobalanopsis glaucoides virgin forest on the Central Yunnan Karst Plateau. J. Zhejiang A F Univ. 2014, 31, 690–696. [Google Scholar]
- Wang, R.; Zhang, X.P.; Dai, J.J. Variation in water uptake sources of typical plants in subtropical area based on stable isotope measurements. J. Soil Water Conserv. 2020, 166, 205–212. [Google Scholar]
- Rong, L.; Wang, S.J.; Yu, G.S.; Deng, X.Q.; Ran, J.C. Stable isotope analysis of water wources of four woody species in the Libo karst forest. Sci. Silvae Sin. 2012, 48, 14–22. [Google Scholar]
- Yang, R.; Yu, L.F.; An, M.T. Analysis on microhabitat characteristic in karst region—Taking Maolan nature reserve as an example. Guizhou Agric. Sci. 2008, 36, 168–169. [Google Scholar]
- Long, J.; Wu, Q.S.; Li, J.; Liao, H.K.; Liu, L.F.; Huang, B.C.; Zhang, J.M. Effects of different microhabitat types on rock dissolution in Maolan karst forest, Southwest China. Acta Pedologica Sinica 2021, 58, 151–161. [Google Scholar]
- Li, H.X.; Zhou, H.Y.; Wei, X.H.; Lu, N.; Liang, Z.X. Variations in sap flow of Zenia insignis under different rock bareness rate in North Guangdong, China. J. Mt. Sci.-Engl. 2019, 16, 2320–2334. [Google Scholar] [CrossRef]
- Smith, D.M.; Jarvis, P.G. Physiological and environmental control of transpiration by trees in windbreaks. For. Ecol. Manag. 1998, 105, 159–173. [Google Scholar] [CrossRef]
- Zhang, Z.F.; You, Y.M.; Huang, Y.Q.; Li, X.C.; Zhang, J.C.; Zhang, D.N.; He, C.X. Effects of drought stress on Cyclobalanopsis glauca seedlings under simulating karst environment condition. Acta Ecol. Sin. 2012, 32, 6318–6325. [Google Scholar] [CrossRef] [Green Version]
- Zhang, Y.Q.; Zhang, Z.C.; Chen, X.; Wang, G.; Cheng, Q.B.; Liu, H.; Peng, T. Spatiotemporal features of deuterium and oxygen-18 in karst water and its relation to hydrological regime in the karst catchment of Southwest China—A case study of Houzhai catchment. Earth Environ. 2022, 50, 1–9. [Google Scholar]
- Hu, K.; Chen, H.; Nie, Y.P.; Yang, J.; Wang, K.L. Characteristics of seasonal variation of deuterium and oxygen-18 isotope composition of precipitation in karst peak-cluster depression area, northwest Guangxi of China. Trans. Chin. Soc. Agric. Eng. 2013, 29, 53–62. [Google Scholar]
- Zou, Q.Y.; Chen, H.S.; Ma, X.Y.; Nie, Y.P. Water source identification for plants growing on karst rock outcrops based on rainfall-exclusion experiment. J. Appl. Ecol. 2019, 30, 759–767. [Google Scholar]
- Mou, Y.; Fan, T.; Hu, H.H. Stable isotope analysis of soil water sources and migrations under different microhabitats in karst forest-lake basin of southeast Yunnan Province. J. Fujian Agric. For. Univ. 2020, 49, 540–549. [Google Scholar]
- Hu, H.H.; Chen, J.H.; Mou, Y.; Fang, W.; Kuang, Y.Y.; Fan, T. Differences of water use strategies of Pinus yunnanensis in different rescovery modes in karst mountainous in Southeast Yunnan. J. Northwest For. Univ. 2021, 36, 37–44. [Google Scholar]
- Liu, W.; Wang, S.J.; Luo, W.J. The response of epikarst spring to precipitation and its implications in karst peak-cluster region of Libo County, Guizhou Province, China. Geochimica 2011, 40, 487–496. [Google Scholar]
- Yu, L.F.; Zhu, S.Q.; Ye, J.Z.; Wei, L.M.; Chen, Z.R. Dynamics of a degraded karst forest in the process of natural restoration. Sci. Silvae Sin. 2002, 38, 1–7. [Google Scholar]
- Yuan, C.J.; Ding, F.J.; Liu, Y.H. Effects of weather conditions on sap flow of dominant tree species Acer wangchii in Karst forest. Jiangsu Agric. Sci. 2018, 46, 118–122. [Google Scholar]
- Dai, J.J.; Zhang, X.P.; Luo, Z.D.; Wang, R.; Liu, F.J.; He, X.G. Variation of stable isotopes in soil water under Cinnamomum camphora woods in Changsha and its influencing factors. Acta Pedol. Sin. 2020, 57, 1514–1525. [Google Scholar]
- Phillips, D.L.; Gregg, J.W. Source partitioning using stable isotopes: Coping with too many sources. Oecologia 2003, 136, 261–269. [Google Scholar] [CrossRef] [PubMed]
- Gong, G.L.; Chen, H.; Duan, D.Y. Comparison of the methods using stable hydrogen and oxygen isotope to distinguish the water source of Nitraria Tangutorum. Acta Ecol. Sin. 2011, 31, 7533–7541. [Google Scholar]
- Han, L.; Han, Y.G.; Huang, X.Y.; Gao, Y.; Sun, Z.J. Hydrogen and oxygen stable isotope tracer plant water source and water use strategy in arid region. J. Anhui Agric. Univ. 2020, 47, 435–441. [Google Scholar]
- Luo, L.; Yu, W.S.; Wan, S.M.; Zhou, P. Advances in the study of stable isotope composition of leaf water in plants. Acta Ecol. Sin. 2013, 33, 1031–1041. [Google Scholar] [CrossRef]
- Xu, Q.; Wang, T.; Gao, D.Q. Application of carbon, hydrogen and oxygen stable isotope on hydrologic cycle of grassland ecosystem. For. Res. 2019, 32, 130–136. [Google Scholar]
- Zhao, M.; Hu, Y.D.; Zeng, C.; Liu, Z.H.; Yang, R.; Chen, B. Effects of land cover on variations in stable hydrogen and oxygen isotopes in karst groundwater: A comparative study of three karst catchments in Guizhou Province, Southwest China. J. Hydrol. 2018, 565, 374–385. [Google Scholar] [CrossRef]
- Zhang, Z.C.; Chen, X.; Chen, Q.B.; Li, S.L.; Yue, F.J.; Peng, T.; Waldron, S.; Oliver, D.M.; Soulsby, C. Coupled hydrological and biogeochemical modelling of nitrogen transport in the karst critical zone. Sci. Total Environ. 2020, 732, 138902. [Google Scholar] [CrossRef]
- Ding, Y.L.; Nie, Y.P.; Chen, H.S.; Wang, K.L.; Querejeta, J.I. Water uptake depth is coordinated with leaf water potential, water-use efficiency and drought vulnerability in karst vegetation. New Phytol. 2020, 229, 1339–1353. [Google Scholar] [CrossRef]
- Liu, Q.; Wang, T.; Liu, C. Characterizing the spatiotemporal dynamics of soil water stable isotopes on a karst hillslope in southwestern China. J. Hydrol. 2021, 610, 127964. [Google Scholar] [CrossRef]
- Zhang, T.; Li, J.H.; Pu, J.B.; Huo, W.J.; Wang, S.N. Spatiotemporal variations of soil water stable isotopes in a small karst sinkhole basin. Environ. Earth Sci. 2021, 80, 29. [Google Scholar] [CrossRef]
- Craig, H. Isotopic variations in meteoric waters. Science 1961, 133, 1702–1703. [Google Scholar] [CrossRef] [PubMed]
- Landwehr, J.M.; Coplen, T.B. Line-conditioned excess: A new method for characterizing stable hydrogen and oxygen isotope ratios in hydrologic systems. In Isotopes in Environmental Studies; IAEA: Vienna, Austria, 2004. [Google Scholar]
- Sprenger, M.; Leistert, H.; Gimbel, K.; Weiler, M. Illuminating hydrological processes at the soil-vegetation-atmosphere interface with water stable isotopes. Rev. Geophys. 2016, 54, 674–704. [Google Scholar]
- McCutcheon, R.J.; McNamara, J.P.; Kohn, M.J.; Evans, S.L. An evaluation of the ecohydrological separation hypothesis in a semiarid catchment. Hydrol. Process. 2016, 31, 783–799. [Google Scholar] [CrossRef]
- Xiang, W.; Si, B.C.; Li, M.; Lu, Y.W.; Yl, A.; Zhao, M.H.; Feng, H. Stable isotopes of deep soil water retain long-term evaporation loss on China’s loess plateau. Sci. Total Environ. 2021, 784, 147153. [Google Scholar] [CrossRef] [PubMed]
- Liu, W.; Wang, S.J.; Luo, W.J.; Rong, L. Comparative research on soil water movement between karst and non-karst plots in Libo county of Guizhou province, China. Earth Environ. 2011, 39, 137–149. [Google Scholar]
- Allison, G.B.; Gat, J.R.; Leaney, F.W.J. The relationship between deuterium and oxygen-18 delta values in leaf water. Chem. Geol. 1985, 58, 145–156. [Google Scholar] [CrossRef]
- Wang, Y.P.; Liu, W.J.; Li, P.J.; Li, J.T. Advances in studies on plant water use strategy. Guihaia 2010, 30, 82–88. [Google Scholar]
- Looker, N.; Martin, J.; Hoylman, Z.; Jencso, K.; Hu, J. Diurnal and seasonal coupling of conifer sap flow and vapor pressure deficit across topoclimatic gradients in a subalpine catchment. Ecohydrology 2018, 11, e1994. [Google Scholar] [CrossRef]
- Casa, J.D.L.; Barbeta, A.; Rodríguez-Ua, A.; Wingate, L.; Ogée, J.; Gimeno, T.E. Revealing a significant isotopic offset between plant water and its sources using a global meta-analysis. Copernic. GmbH 2021, 1–31. [Google Scholar] [CrossRef]
- Fu, Y.H.; Yu, L.F.; Huang, Z.S.; Li, H.X.; Hou, D.H. Study on root habitat and typesin typical karst rocky desertification areas. Sci. Soil Water Conserv. 2012, 10, 66–72. [Google Scholar]
- Liu, H.; Gleason, S.M.; Hao, G.; Hua, L.; He, P.; Goldstein, G.; Ye, Q. Hydraulic traits are coordinated with maximum plant height at the global scale. Sci. Adv. 2019, 5, v1332. [Google Scholar] [CrossRef] [PubMed] [Green Version]
- Huang, T.L.; Tang, L.X.; Chen, L.; Zhang, Q.Y. Root architecture and ecological adaptation strategy of three shrubs in karst area. Sci. Soil Water Conserv. 2019, 17, 89–94. [Google Scholar]
- Zhang, X.; Yang, Z.; Zhang, J.P. Lithologic types on hill slopes and revegetation zoning in the Yuanmou hot and dry valley. Sci. Silvae Sin. 2003, 39, 16–22. [Google Scholar]
- Wen, X.F.; Zhang, S.C.; Sun, X.M. Recent advances in H218O enrichment in leaf water. J. Plant Ecol. 2008, 32, 961–966. [Google Scholar]
- Fu, S.L.; Liu, S.Q. Drought relief characters of several species on limestone area. J. Soil Water Conserv. 2001, 2001, 89–90. [Google Scholar]
- Schwendenmann, L.; Pendall, E.; Sanchez-Bragado, R.; Kunert, N.; Hölscher, D. Tree water uptake in a tropical plantation varying in tree diversity: Interspecific differences, seasonal shifts and complementarity. Ecohydrology 2015, 8, 1–12. [Google Scholar] [CrossRef]
- Fan, T.; Wang, Y.H.; Guo, L.J.; Li, J. Stable isotope analysis of water uptake sources of secondary forests in the central Yunnan karst plateau. Adv. Mater. Res. 2014, 955–959, 3795–3799. [Google Scholar] [CrossRef]
- Penna, D.; Geris, J.; Hopp, L.; Scandellari, F. Water sources for root water uptake: Using stable isotopes of hydrogen and oxygen as a research tool in agricultural and agroforestry systems. Agr. Ecosyst. Environ. 2020, 291, 106790. [Google Scholar] [CrossRef]
Figure 1.
Location of study area in Southwest China.

Figure 2.
Images of the four tree species.

Figure 3.
Accumulated precipitation by month (a) and by season (b).

Figure 4.
Seasonal variation in (a) δD and δ18O original values, (b) average value of δD and δ18O original values and (c) d-excess value in terms of atmospheric precipitation and d-excess (‰). Red line stands for positive (upper and right) and negative (down and left) standard deviation.
Figure 4.
Seasonal variation in (a) δD and δ18O original values, (b) average value of δD and δ18O original values and (c) d-excess value in terms of atmospheric precipitation and d-excess (‰). Red line stands for positive (upper and right) and negative (down and left) standard deviation.

Figure 5.
Soil water content and soil temperature in different soil layers at sampling site from January to December 2020. (a) By month. (b) By season. Blue and red line represents standard deviation.
Figure 5.
Soil water content and soil temperature in different soil layers at sampling site from January to December 2020. (a) By month. (b) By season. Blue and red line represents standard deviation.

Figure 6.
Seasonal variation in (a) Δd, (b) δ18O and (c) d-excess of soil water in different soil layers. Black line represents standard deviation.
Figure 6.
Seasonal variation in (a) Δd, (b) δ18O and (c) d-excess of soil water in different soil layers. Black line represents standard deviation.

Figure 7.
Correlation of soil temperature and soil water content for different soil layers and precipitation levels. (a) In spring. (b) In summer. (c) In autumn. (d) In winter.
Figure 7.
Correlation of soil temperature and soil water content for different soil layers and precipitation levels. (a) In spring. (b) In summer. (c) In autumn. (d) In winter.

Figure 8.
(a) Seasonal variation in LC-excess values of rhizosphere soil water of different tree species; (b) description of life forms at sample site; (c) seasonal variation in LC-excess values of leaf water (LW) of different tree species and different life forms at sample site; (d) seasonal variation in LC-excess values of community sample site soil water (CSSTW, CSSSW), atmospheric precipitation (AP), epikarstic water (EPW), and leaf water (LW).

Figure 9.
Characteristics of δD and δ18O in xylem and leaf water before and after rainfall in summer. Black line represents standard deviation.
Figure 9.
Characteristics of δD and δ18O in xylem and leaf water before and after rainfall in summer. Black line represents standard deviation.

Figure 10.
Linear relationship of δD and δ18O in soil water (CSSW), xylem water (XW), leaf water (LW), local atmospheric precipitation (LMWL), global atmospheric precipitation (GMWL) and epikarstic water (EPW).
Figure 10.
Linear relationship of δD and δ18O in soil water (CSSW), xylem water (XW), leaf water (LW), local atmospheric precipitation (LMWL), global atmospheric precipitation (GMWL) and epikarstic water (EPW).

Figure 11.
Correlation of plant xylem water, atmospheric precipitation, soil water and epikarstic water in different seasons. (a) In spring. (b) In summer. (c) In summer (Ar.). (d) In autumn.
Figure 11.
Correlation of plant xylem water, atmospheric precipitation, soil water and epikarstic water in different seasons. (a) In spring. (b) In summer. (c) In summer (Ar.). (d) In autumn.

Figure 12.
Plant water-use contribution from potential sources by season and before/after rainfall: (a,f) in Spring; (b,g) in Summer; (c,h) in Summer (after Rainfall); (d,i) in autumn; (e,j) in growing season. Blue solid line in e and j represents standard deviation.
Figure 12.
Plant water-use contribution from potential sources by season and before/after rainfall: (a,f) in Spring; (b,g) in Summer; (c,h) in Summer (after Rainfall); (d,i) in autumn; (e,j) in growing season. Blue solid line in e and j represents standard deviation.


Table 1.
Information for four sampling trees in Maolan. DBH is the diameter at breast height. CW is the canopy width of a tree. The number after “±” represents the standard deviation.
Table 1.
Information for four sampling trees in Maolan. DBH is the diameter at breast height. CW is the canopy width of a tree. The number after “±” represents the standard deviation.
| Tree Species (Code) | Life Form | Leaf Life | Leaf Size | Leaf Texture | Tree Height/m | DBH/cm | CW/m2 |
|---|---|---|---|---|---|---|---|
| Cyclobalanopsis glauca (CG) | Big tree | Evergreen | Medium | Leathery | 21.4 ± 0.2 | 22.3 ± 0.3 | 16.2 ± 0.4 |
| Symplocos lancifolia (SL) | Small tree | Evergreen | Small | Filmy | 16.8 ± 0.1 | 18.4 ± 0.2 | 13.6 ± 0.3 |
| Celtis sinensis (CS) | Big tree | Deciduous | Medium | Thick papery | 17.6 ± 0.3 | 17.2 ± 0.4 | 11.3 ± 0.5 |
| Kalopanax septemlobus (KS) | Big tree | Deciduous | Large | Papery | 13.2 ± 0.1 | 15.4 ± 0.2 | 10.4 ± 0.4 |
Disclaimer/Publisher’s Note: The statements, opinions and data contained in all publications are solely those of the individual author(s) and contributor(s) and not of MDPI and/or the editor(s). MDPI and/or the editor(s) disclaim responsibility for any injury to people or property resulting from any ideas, methods, instructions or products referred to in the content. |
© 2023 by the authors. Licensee MDPI, Basel, Switzerland. This article is an open access article distributed under the terms and conditions of the Creative Commons Attribution (CC BY) license (https://creativecommons.org/licenses/by/4.0/).
Share and Cite
MDPI and ACS Style
Ding, F.; Yuan, C.; Zhou, T.; Cheng, J.; Wu, P.; Ye, Y. Water-Use Strategies and Habitat Adaptation of Four Tree Species in Karstic Climax Forest in Maolan. Water 2023, 15, 203. https://doi.org/10.3390/w15010203
AMA Style
Ding F, Yuan C, Zhou T, Cheng J, Wu P, Ye Y. Water-Use Strategies and Habitat Adaptation of Four Tree Species in Karstic Climax Forest in Maolan. Water. 2023; 15(1):203. https://doi.org/10.3390/w15010203
Chicago/Turabian StyleDing, Fangjun, Congjun Yuan, Ting Zhou, Juan Cheng, Peng Wu, and Yuyan Ye. 2023. "Water-Use Strategies and Habitat Adaptation of Four Tree Species in Karstic Climax Forest in Maolan" Water 15, no. 1: 203. https://doi.org/10.3390/w15010203
Note that from the first issue of 2016, this journal uses article numbers instead of page numbers. See further details here.