
Characteristics of Shallow Flows in a Vegetated Pool—An Experimental Study
by
 and
and
Parsa Parvizi
1, 
Hossein Afzalimehr
2,*,
Jueyi Sui
3,
Hamid Reza Raeisifar
2 and
Ali Reza Eftekhari
2 1
Department of Hydraulic, Isfahan University of Technology, Isfahan 8415683111, Iran
2
Department of Civil Engineering, Iran University of Science and Technology, Tehran 1311416846, Iran
3
School of Engineering, University of Northern British Columbia, Prince George, BC V2N 4Z9, Canada
*
Author to whom correspondence should be addressed.
Water 2023, 15(1), 205; https://doi.org/10.3390/w15010205
Submission received: 3 November 2022
/
Revised: 1 December 2022
/
Accepted: 13 December 2022
/
Published: 3 January 2023
(This article belongs to the Special Issue Fluvial Hydraulics in the Presence of Vegetation in Channels)
Abstract
:Pools are often observed in gravel-bed rivers, together with the presence of vegetation patches. In the present study, a conceptual model of a gradual varied flow with both convective deceleration and acceleration flow sections has been constructed in a flume to study turbulent flow structures. Vegetation patches with extended canopies were planted in the pool sections in order to increase the thickness of the boundary layer inside the inner zone. The effects of different flows (namely decelerating, uniform and accelerating flows) along an artificial pool on flow velocity, shear stress and bursting events have been investigated. In addition, due to the occurrence of secondary currents in shallow streams, the characteristics of turbulent shallow flow have been investigated along two axes that are parallel to the sidewall of the flume. The results showed that the application of the log law should be used with care to estimate shear velocity along a pool with a vegetated bed. The presence of a vegetation patch causes an increase in Reynolds shear stress, especially along the entrance section of the pool where the flow decelerates. The results of the quadrant analysis reveal that the sweep and ejection events have the most dominant influence over the vegetation patch in the pool; however, the contributions of outward and inward events increase near the bed, especially in the entrance section of the pool where the flow is decelerating. The distribution of stream-wise RMS of turbulence intensity along the pool generally presents a convex shape.
1. Introduction
In natural rivers, bed morphology affects the flow patterns. Due to the process of the removal and deposition of sediments, and the combination of secondary currents with the sequence of convergent and divergent streams, regular patterns of sequential pool and riffle bed-forms appear very often in gravel-bed rivers. In other words, both the accelerating and decelerating flows often occur in a quasi-periodic manner along riffle and pool sections in gravel-bed rivers. For a flow along a river reach with both accelerating and decelerating sections, characteristics of the turbulent flow, sediment transportation, velocity and shear stress distributions are very different from those in a channel with a flat bed [1]. In recent years, researchers have investigated some of the important hydrodynamic processes of the flow in pools, including the generation of turbulent vortices and the lateral convergence and divergence of the flow associated with bed forms [2,3,4,5,6,7,8,9]. It has been reported that in narrow channels with an aspect ratio less than five, the secondary currents significantly affect the characteristics of the distribution of turbulent flow. For instance, the presence of negative vertical velocities indicates that the maximum velocity should occur under the water surface [10].
Conducted previous experiments to study flow characteristics in the artificial pools have been reported that the secondary currents along the central line of the channel indicate a convergent flow in the decelerating section and divergent flow in the accelerating sectio [11,12,13,14]. The presence of vegetation in a channel bed has significant impacts on the stability of hydrodynamic structures of the flow, and has been investigated through different previous studies [15,16,17,18,19,20,21]. The reduction in flow velocity due to the presence of vegetation patches in channel beds is another reason for determining flow resistance in the presence of vegetation patches [17,22]. On the other side, the presence of vegetation patches in a channel bed leads to the reduction in sediment erosion due to the decrease in shear stress, and increase in the thickness of the boundary layer. The increase in the thickness of the boundary layer leads to a decrease in the velocity in this layer [11,23,24,25] The momentum exchange between the top and bottom parts of vegetation makes it difficult to analyze vertical velocity distributions [25,26]. When an aspect ratio is less than five, the dip phenomenon occurs in open channels and can reach up to 35% of the flow depth. Under such a flow condition, the maximum flow velocity is clearly different from the velocity value at the water surface [23,27].
The results of the quadrant analysis used for assessing the structures of flow in both laboratory flumes and natural rivers showed that they are in good agreement, namely, ejection events appear near the bed, and sweep events occur near the water surface, which are dominant occurrences in the pool zone [12,28]. By studying simulated flow conditions in pool–riffle sequences, and comparing against their field observations have been investigated that the model simulations against field observations has little discrepancies [12]. To our knowledge, however, most experimental studies have been carried out in laboratory flumes with small aspect ratios (W/h < 5) in order to extend the results to natural rivers. In addition, most of the turbulent data available have been collected for artificial pools where the vegetation is not prevalent, which are different from the pools with vegetated cover [11,29].
Effective planning for the maintenance of natural bed-forms, such as pool–riffle sequences, is important for managers and requires extended studies of artificial pools and riffles in laboratories (e.g., [11]). In other words, to analyze the interaction between turbulent flow and vegetated pool beds, a better understanding of the hydraulic processes in a laboratory scale is required. This experimental study was carried out to investigate the effects of irregular bed shape and vegetation on hydraulic parameters such as shear velocity, friction coefficient and Reynolds stress to investigate their interaction with the desired laboratory conditions. Moreover, the impact of different aspect ratios on the characteristics of turbulent flow in a shallow stream over a vegetated pool bed has been considered for evaluation. Then, it is possible to obtain meaningful results through comparing vegetated pool data with the sandy pool data. In addition, the effect of vegetation patches on turbulent flow structures along a vegetated pool has been investigated by means of quadrant analysis. However, the limitations of the experiment included the formation of a balanced bed shape within a certain range of sediment particle size in a laboratory flume to create flow conditions comparable to those in natural rivers. The diameter of the sediment particles of the bed material in a flume should be selected in a way that their movement threshold is higher than the flow velocity. The limitation of the flume length forced us to build the desired pool in a fully developed flow condition. Since the boundary layer should develop along the entire water depth, the flow should travel a certain distance within the channel in order to achieve the same shape of velocity profiles. To ensure the creation of a developed flow, and to avoid the influence of the vortices caused by the downstream exit-gate of the flume, the longitudinal dimensions of all sections (entrance, pool and exit) were equal to 1.5 m. The 1.5 m pool section was constructed at the distance of 4.5 m to 6 m from the entrance of the flume. Moreover, studies in natural rivers have shown that the angle for pool-shape channels is normally less than 7.8 degrees. Thereby, considering an angle of 10 degrees in this research, the experimental conditions are close to the real conditions in natural rivers.
In addition, the limitations of the acoustic doppler velocity (ADV) device used for measuring the flow separation area have been noticed in this experiment. It happens because of the lack of recirculation in the flow rate, and the existence of the separation area on the bed surface. Furthermore, the study of shallow flow over rough beds shows that many methods and estimations do not have the necessary accuracy. Presently, to estimate the friction factor or roughness coefficient using the reported hydraulic models, one is unable to obtain results with the necessary accuracy. One of the main reasons for these poor predictions is the weakness of the estimation, since the existing methods do not use all data in a velocity profile to determine shear velocity, thus leading to poor predictions of the roughness coefficient, which is one of the key parameters of hydraulic models.
2. Materials and Methods
2.1. Theory
The flow velocities in the stream-wise (u), vertical (w) and lateral (v) directions were decomposed into time-averaged (, and turbulent components (). In addition, the velocity profiles near the bed follow the law of the wall, which is as follows:
where is the shear velocity, is the von Karman coefficient equivalent to 0.41, and is the reference bed level, which is dependent on the roughness height of the bed material. It has been found that the inner zone of each velocity profile can be extended to a relative depth of for uniform and non-uniform flows [13,30,31].
One of the methods used to determine the bed level involves solving the log law function so that it fits well with the measured data by using the trial-and-error method. However, in the present study, the equivalent roughness has been considered equal to of the sandy bed material for the non-vegetated bed, and equal to vegetation height in the presence of vegetation in the channel bed [32]. The validation of the logarithmic law has been conducted by plotting (u) against , where the breakpoint between segments was allowed to vary within the range of [33,34].
At present, there are several methods for determining the shear velocity, which is considered as the most fundamental scale for dimensioning the average velocity. Using the logarithmic method, one can obtain the shear velocity by calculating the regression fitting line for data in the inner layer with the flow depth of. Using data collected from laboratory experiments, the shear velocity can be obtained by the following equations, where and C are the maximum velocity, boundary layer displacement thickness, and constant coefficient, respectively. According to the results of other researchers, C is equal to 4.4 in sandy bed rivers, and θ is the momentum thickness of the boundary layer [31].
Reynolds shear stress has been calculated from turbulent fluctuations in the stream-wise and vertical directions using the following equations, in which is the water density. The Reynolds stress profiles are non-linear for non-uniform flows and follow a concave shape for the accelerated flows and convex shape for the decelerating flows.
To obtain the value of turbulence intensity, RMS parameters have been used, which can be expressed by the following equations:
Quadrant analysis has been used to study coherent flow structures within or above a vegetation patch, and to investigate the relationship between time fluctuations of the velocity components (), especially their relationship with the trigonometric circle system in four quadrants of the coordinate system. In recent years, many studies have been conducted to assess the coherent flow structures in the downstream region of a vegetation patch. The results of previous studies reveal that there exists a small margin of ejection dominancy around the top edge behind a submerged vegetation patch. In addition, both the ejection and sweep events are dominant bursting events in the vicinity of the toe of the vegetation patch, which positively contribute to the downward momentum flux, and are involved in near-bed turbulence. Moreover, a notable feature of the flow has also been revealed, that is, the dominance of outward and inward interactions in the shear layer was induced by the flow above the vegetation patch [14,35,36].
To assess the contribution of each pseudo-oscillatory process event, a computer program has been formulated using MATLAB, and the results are presented in the following sections. According to the analysis of velocity fluctuations, the outward interaction occurs when , ; the ejection event occurs when , ; the inward interaction occurs when , ; and the sweep interaction occurs when , [32,37,38,39].
2.2. Experimental Setup
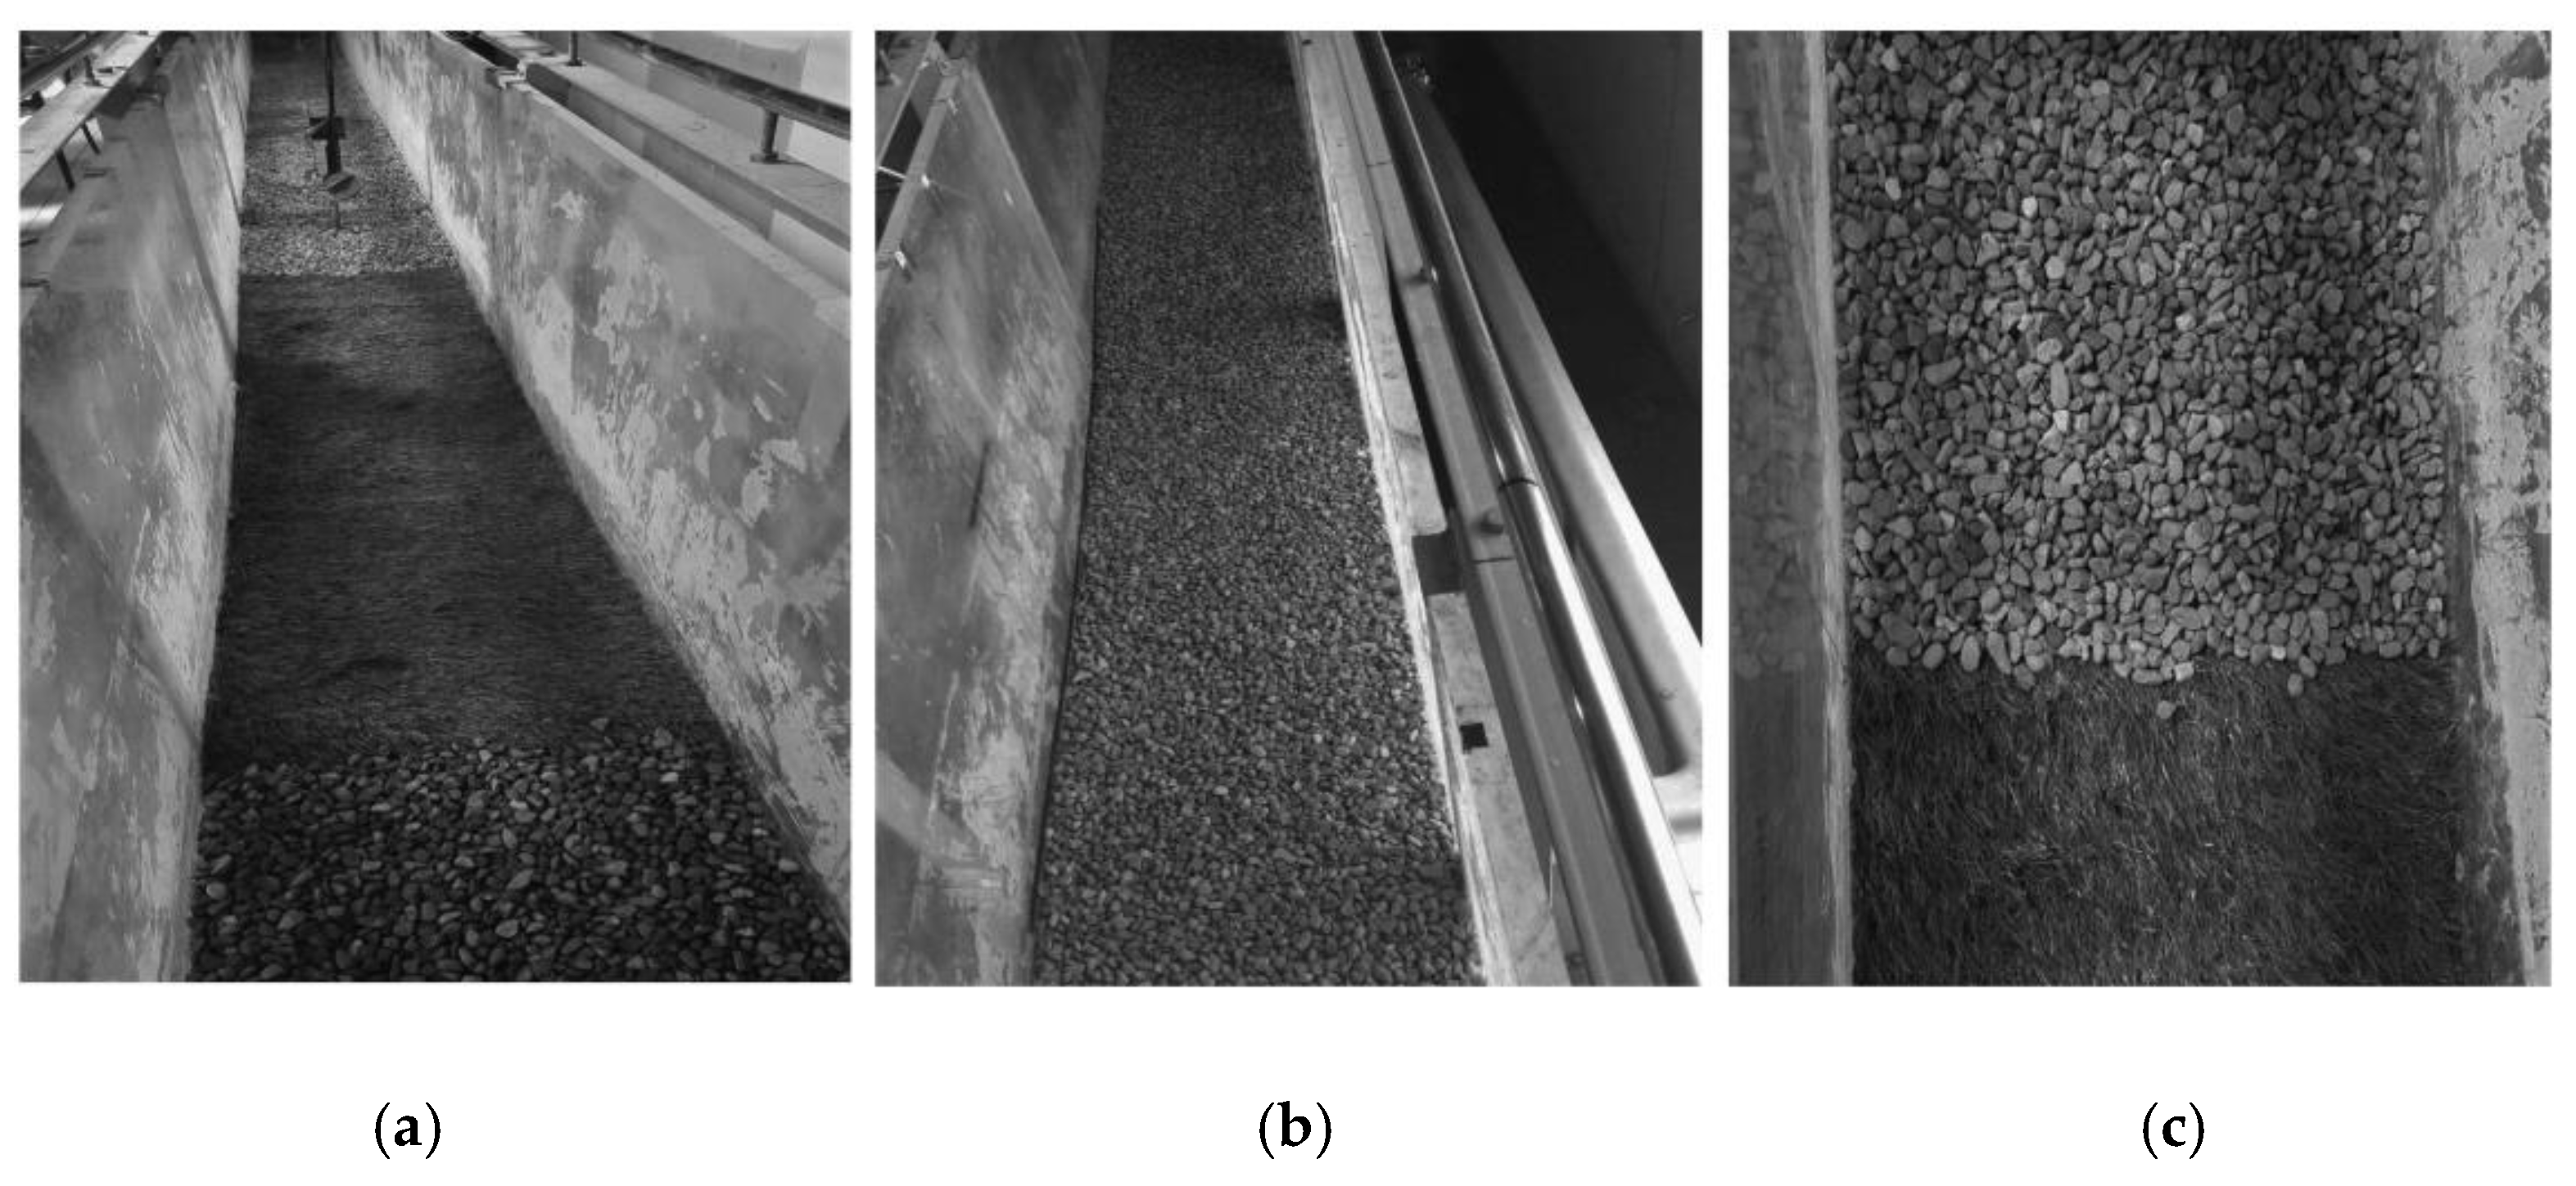
Laboratory experiments were conducted in a flume, which was 0.4 m wide, 0.6 m deep, and 8 m long with a maximum discharge of 50 L/s. To compare the results of the present study to the previous studies conducted using artificial pools, the flow rate of 10 L per second was chosen for this study. Due to the limitation of the flume length, and to ensure a fully developed flow in the pool, the desired pool bed form was built in the flume section located at a distance of 4.5 to 6 m from the flume entrance. Both the entrance and exit slopes of the pool were constructed at an angle of 10° over a stream-wise distance of 1.5 m to create a pool with a series of three sections, which were as follows: the entrance section, middle pool and exit section. Along the entrance section, the increase in the flow depth created the decelerating section. Along the second section (or middle pool section), the channel bed was flat, and was a transition section. The flow depth along the third section decreased and created an accelerating flow. The bed material had a smooth surface of the sand particles with a uniform distribution, and the median grain size (d50) was 10.4 mm. The smooth surface of the channel bed was carefully prepared to eliminate large-scale variation in the bed topography. The artificial vegetation patch with a height of about 2.5 cm was placed over the middle pool section, which was 1.5 m long (Figure 1).
The laboratory experiments were carried out under two flow conditions, as given in Table 1, with a constant Reynolds numbers and different Froude numbers (condition 1: ), and (condition 2: ). In this study, two flow depths of 20 cm and 15 cm upstream of the pool section were used, and the corresponding aspect ratios were 2.0 and 2.7, respectively. Measurements of the flow velocity were conducted at 13 cross sections, with the first cross section located at 1.5 m upstream of the pool and the last was located at 1.0 m downstream of the pool. To assess the side effects of the flume wall on the turbulence, at each cross section, velocity profiles at two different locations were compared. One location was 20 cm from the sidewall, and the other was 10 cm from the sidewall. For each velocity profile, about 20 to 25 point velocities at different distances from the channel bed were measured.
The velocity data were collected using an ADV, and the minimum SNR was considered as 15. In addition, the data correlation coefficient value was observed to be more than 70 percent. Most of the velocity data collected in this study were considered with high SNR values and correlation, although some data were filtered to remove aberrant data. The objectives of this study were to investigate the velocity, Reynolds stress and turbulence intensity along a pool covered by sand and a submerged vegetation patch. The estimation of shear velocity was examined by different methods. In addition, the contribution of each bursting process along this pool was investigated using quadrant analysis.
3. Results and Discussions
3.1. Shear Velocity Distribution and Logarithmic Law
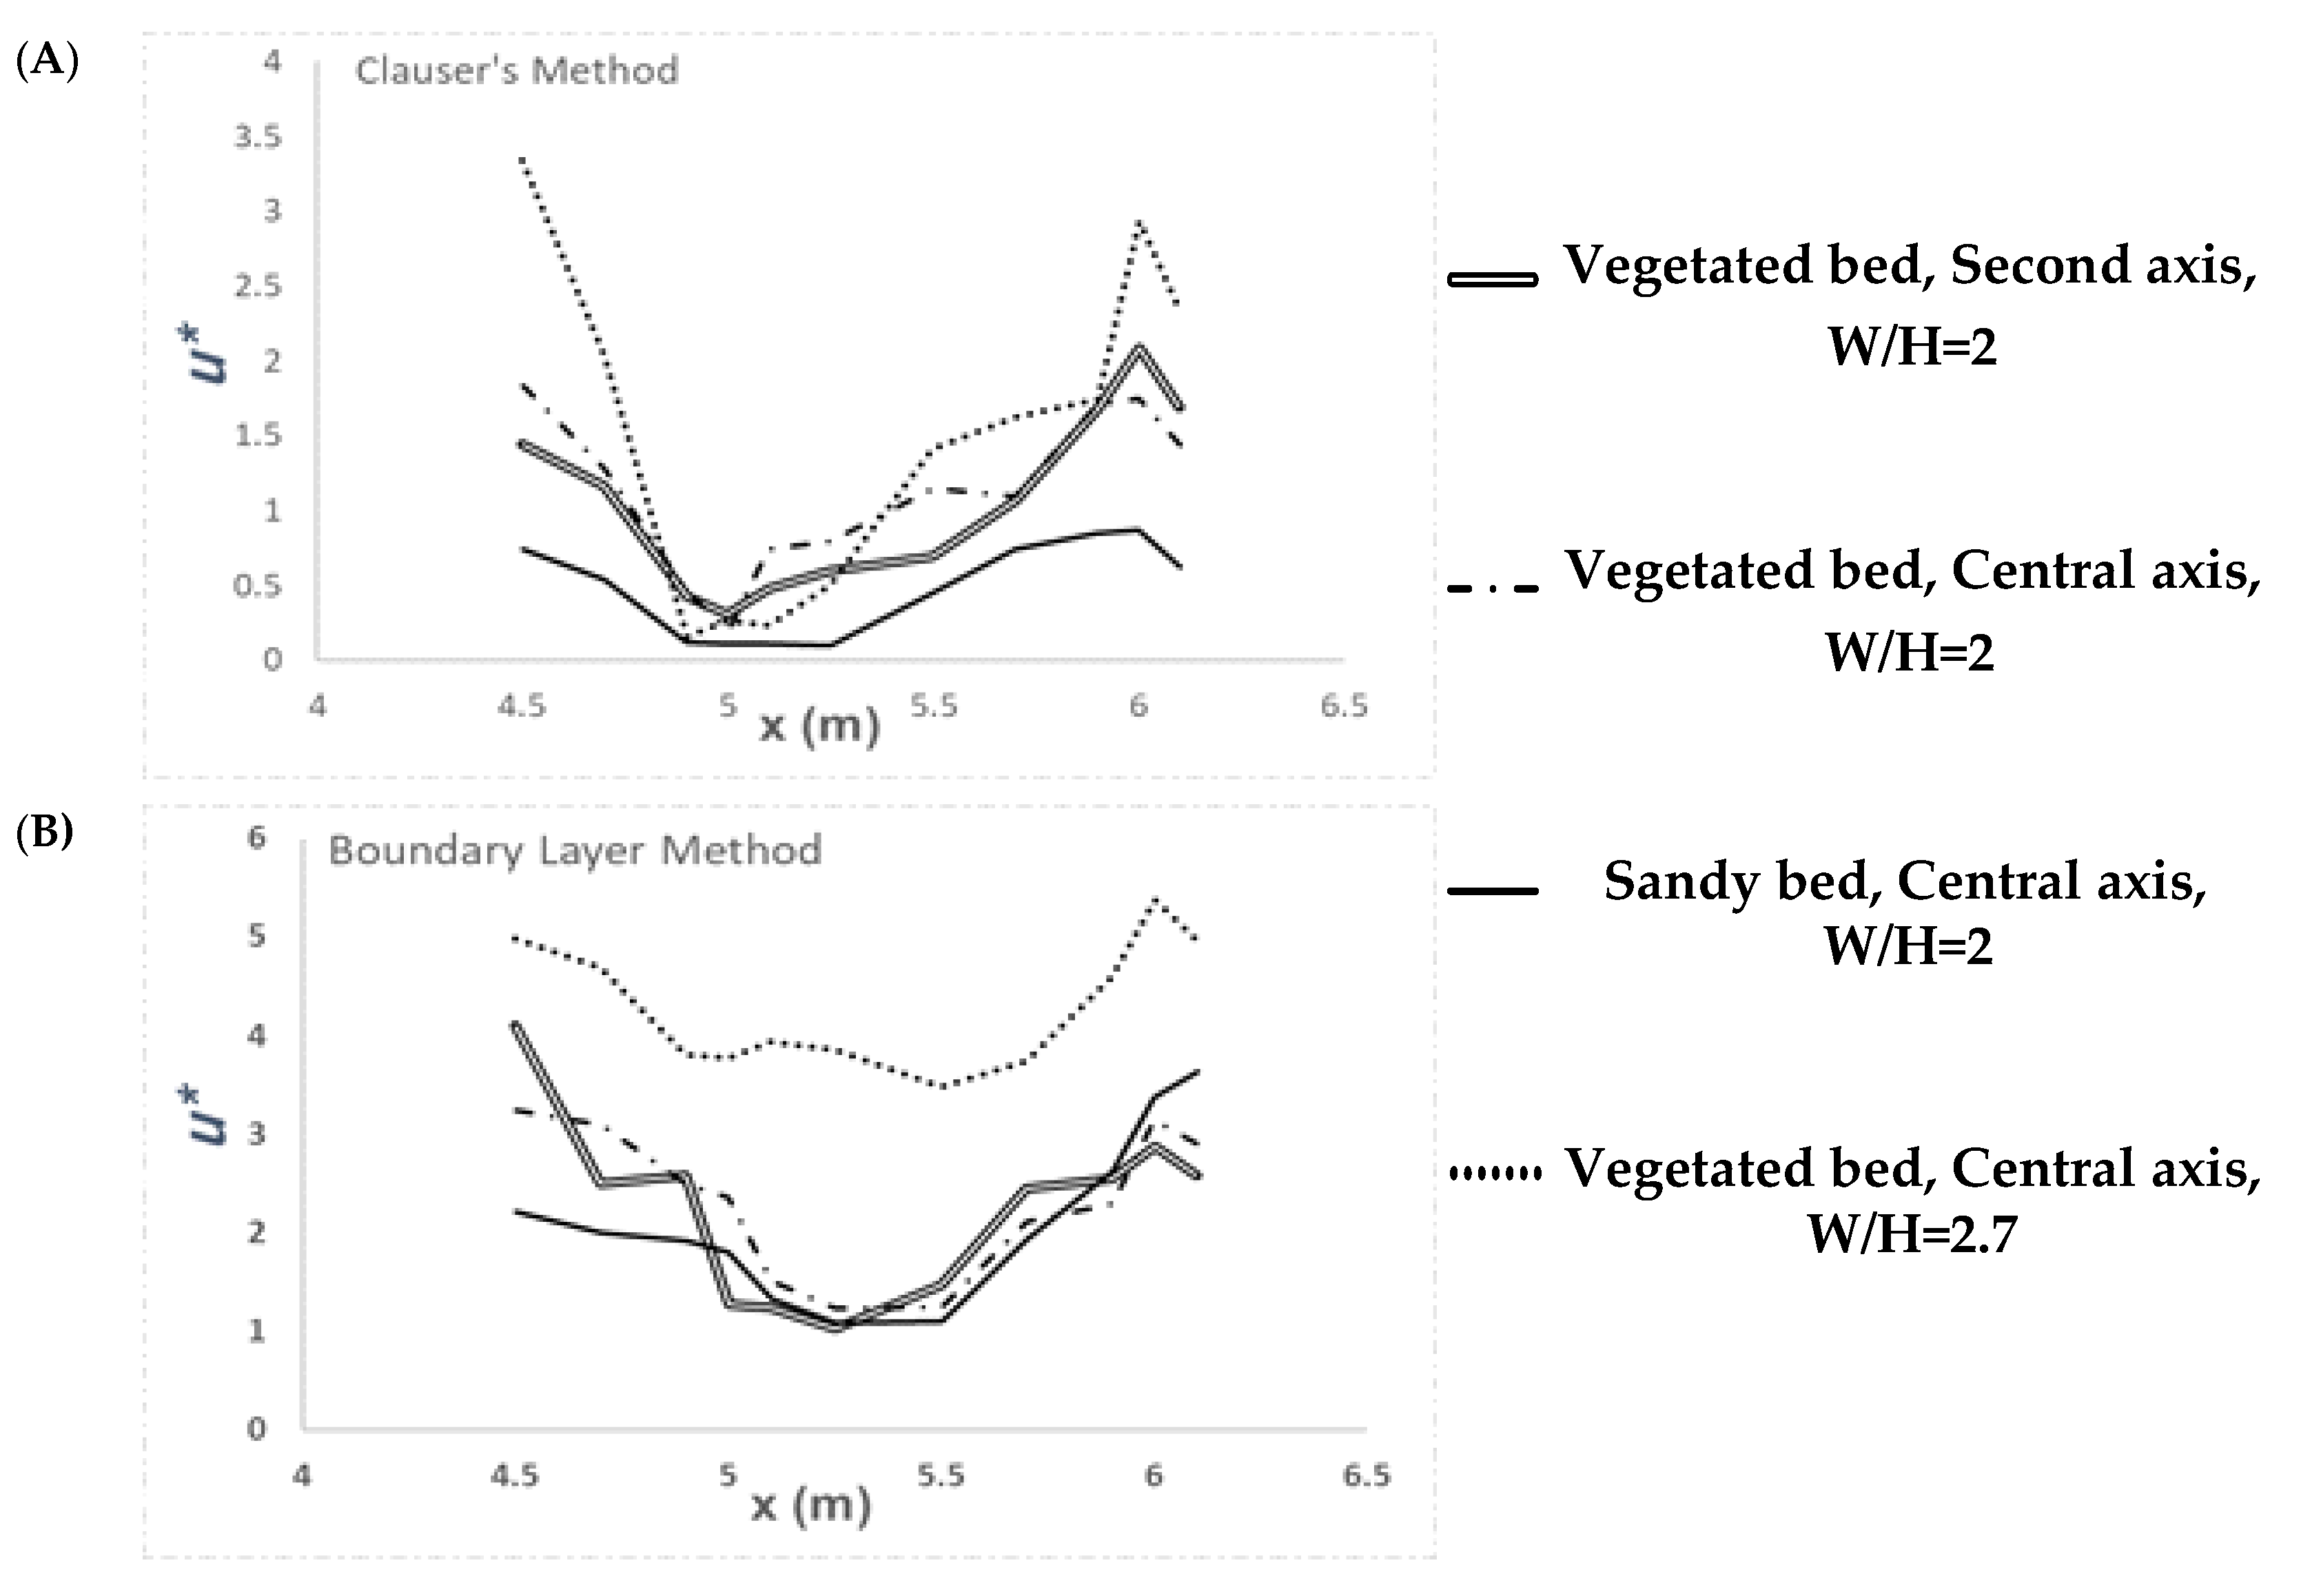
Figure 2 shows the distributions of shear velocity () under the conditions of different aspect ratios (W/H) and vegetation coverage (with or without the presence of vegetation). One can observe from Figure 2 that some irregularities exist in the value of shear velocity near the sidewall. Overall, the value of decreased in the CDF (decelerating flow) section, and increased in the CAF (accelerating flow) section, indicating the impact of the secondary currents on the shear velocity. The presence of the vegetation patch in the pool bed resulted in an increase in the shear velocity, particularly in the CDF section. Under the condition of the same flow discharge, by increasing the aspect ratio (namely, the increase in flow velocity), the value of obtained using the boundary layer method increased. By comparing results of shear velocity determined by the two methods, the estimated using the boundary layer method was higher than that obtained using the logarithmic method, since the logarithmic method considers all point velocities of velocity profiles when calculating . The results of this study confirm those of previous studies that the distribution of shear velocity over a pool bed and bedform is a function of the flow depth [11,12,40].
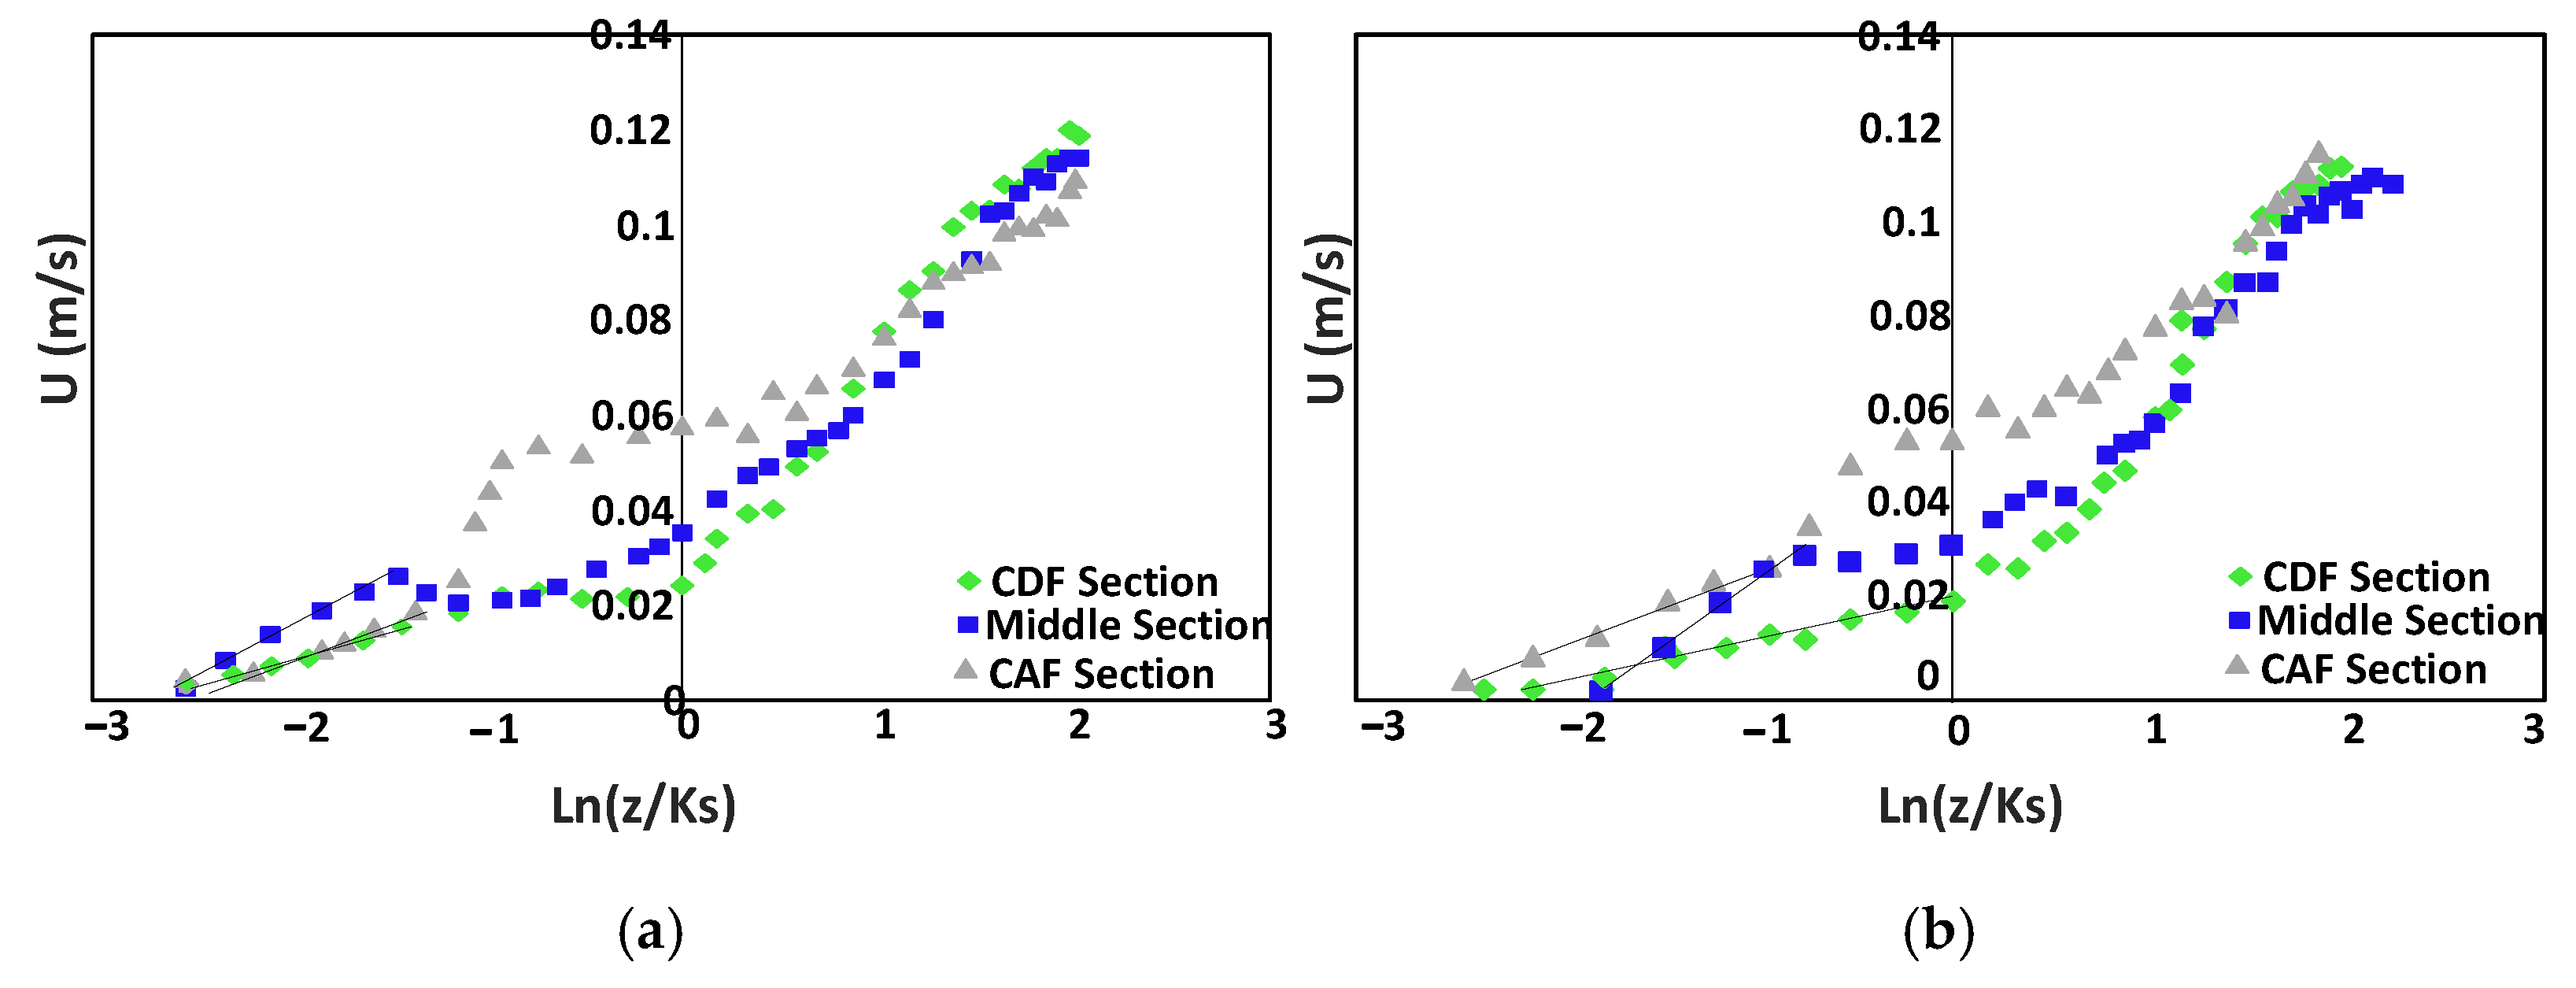
Figure 3 shows the results for assessing the validity of the logarithmic law over the pool in the presence of vegetation in the pool section along two axes of the channel at the distance of 10 and 20 cm from the sidewall, respectively. By using a trial-and-error method, it was found that the logarithmic law fits the data measured near the bed of the boundary layer well with a strong correlation, as the R2 values show in Table 2. According to Figure 3, along the CAF (acceleration flow) section, the velocity data collected for the outer layer of the flow at a depth of 1.0 > z/h > 0.2 (till water surface) are above the regression line, implying a dominant adverse pressure gradient (∂p/∂x > 0). However, a favorable pressure gradient (∂p/∂x < 0) is dominant in the CDF (deceleration flow) and middle pool sections of the pool, where the data points collected for the outer layer of flow (1.0 > z/h > 0.2) are below the regression line. Approaching the sidewall, the validity of the logarithmic law for the velocity data near the bed region has also been confirmed. For flow with a relatively low Reynolds number, the boundary layer tends to be a laminar boundary layer. As the Reynolds number increases, the boundary layer becomes unstable with small disturbances. Further growth of these disturbances results in the transition to a turbulent boundary layer. Most practical flows involve high Reynolds numbers and turbulent boundary layers. Because of the three-dimensional interchanges in momentum, a turbulent boundary layer is thicker and has a larger wall velocity gradient than that of a laminar layer with the same Reynolds number. The increased momentum near the wall allows a turbulent boundary layer to withstand a larger unfavorable pressure gradient than a laminar layer without separating, but results in higher wall shear stress and drag.
The positive pressure gradient along the entrance section of the pool and the negative pressure gradient around the riffle zone play important roles in the gradient of the log law function. The positive pressure gradient helps the development of the flow separation zone where the turbulence intensity is high, thus, resulting in a relatively sharp pressure gradient in the middle pool section. In fact, the positive or unfavorable pressure gradient tends to decelerate the flow, and leads to an increased boundary layer thickness; thus, the velocity gradient at the wall will decrease. The unfavorable pressure gradient can cause the separation of the boundary layer, which often results in drastic changes in the flow patterns. Along the flow direction, the negative or favorable pressure gradient, which accelerates the flow, will result in a decrease in the boundary layer thickness and increase in the velocity gradient at the wall. However, there is no flow separation in the riffle zone due to a negative pressure gradient, which shows a negligible departure from the logarithmic law [31,41,42,43].
3.2. Velocity Distribution along the Pool
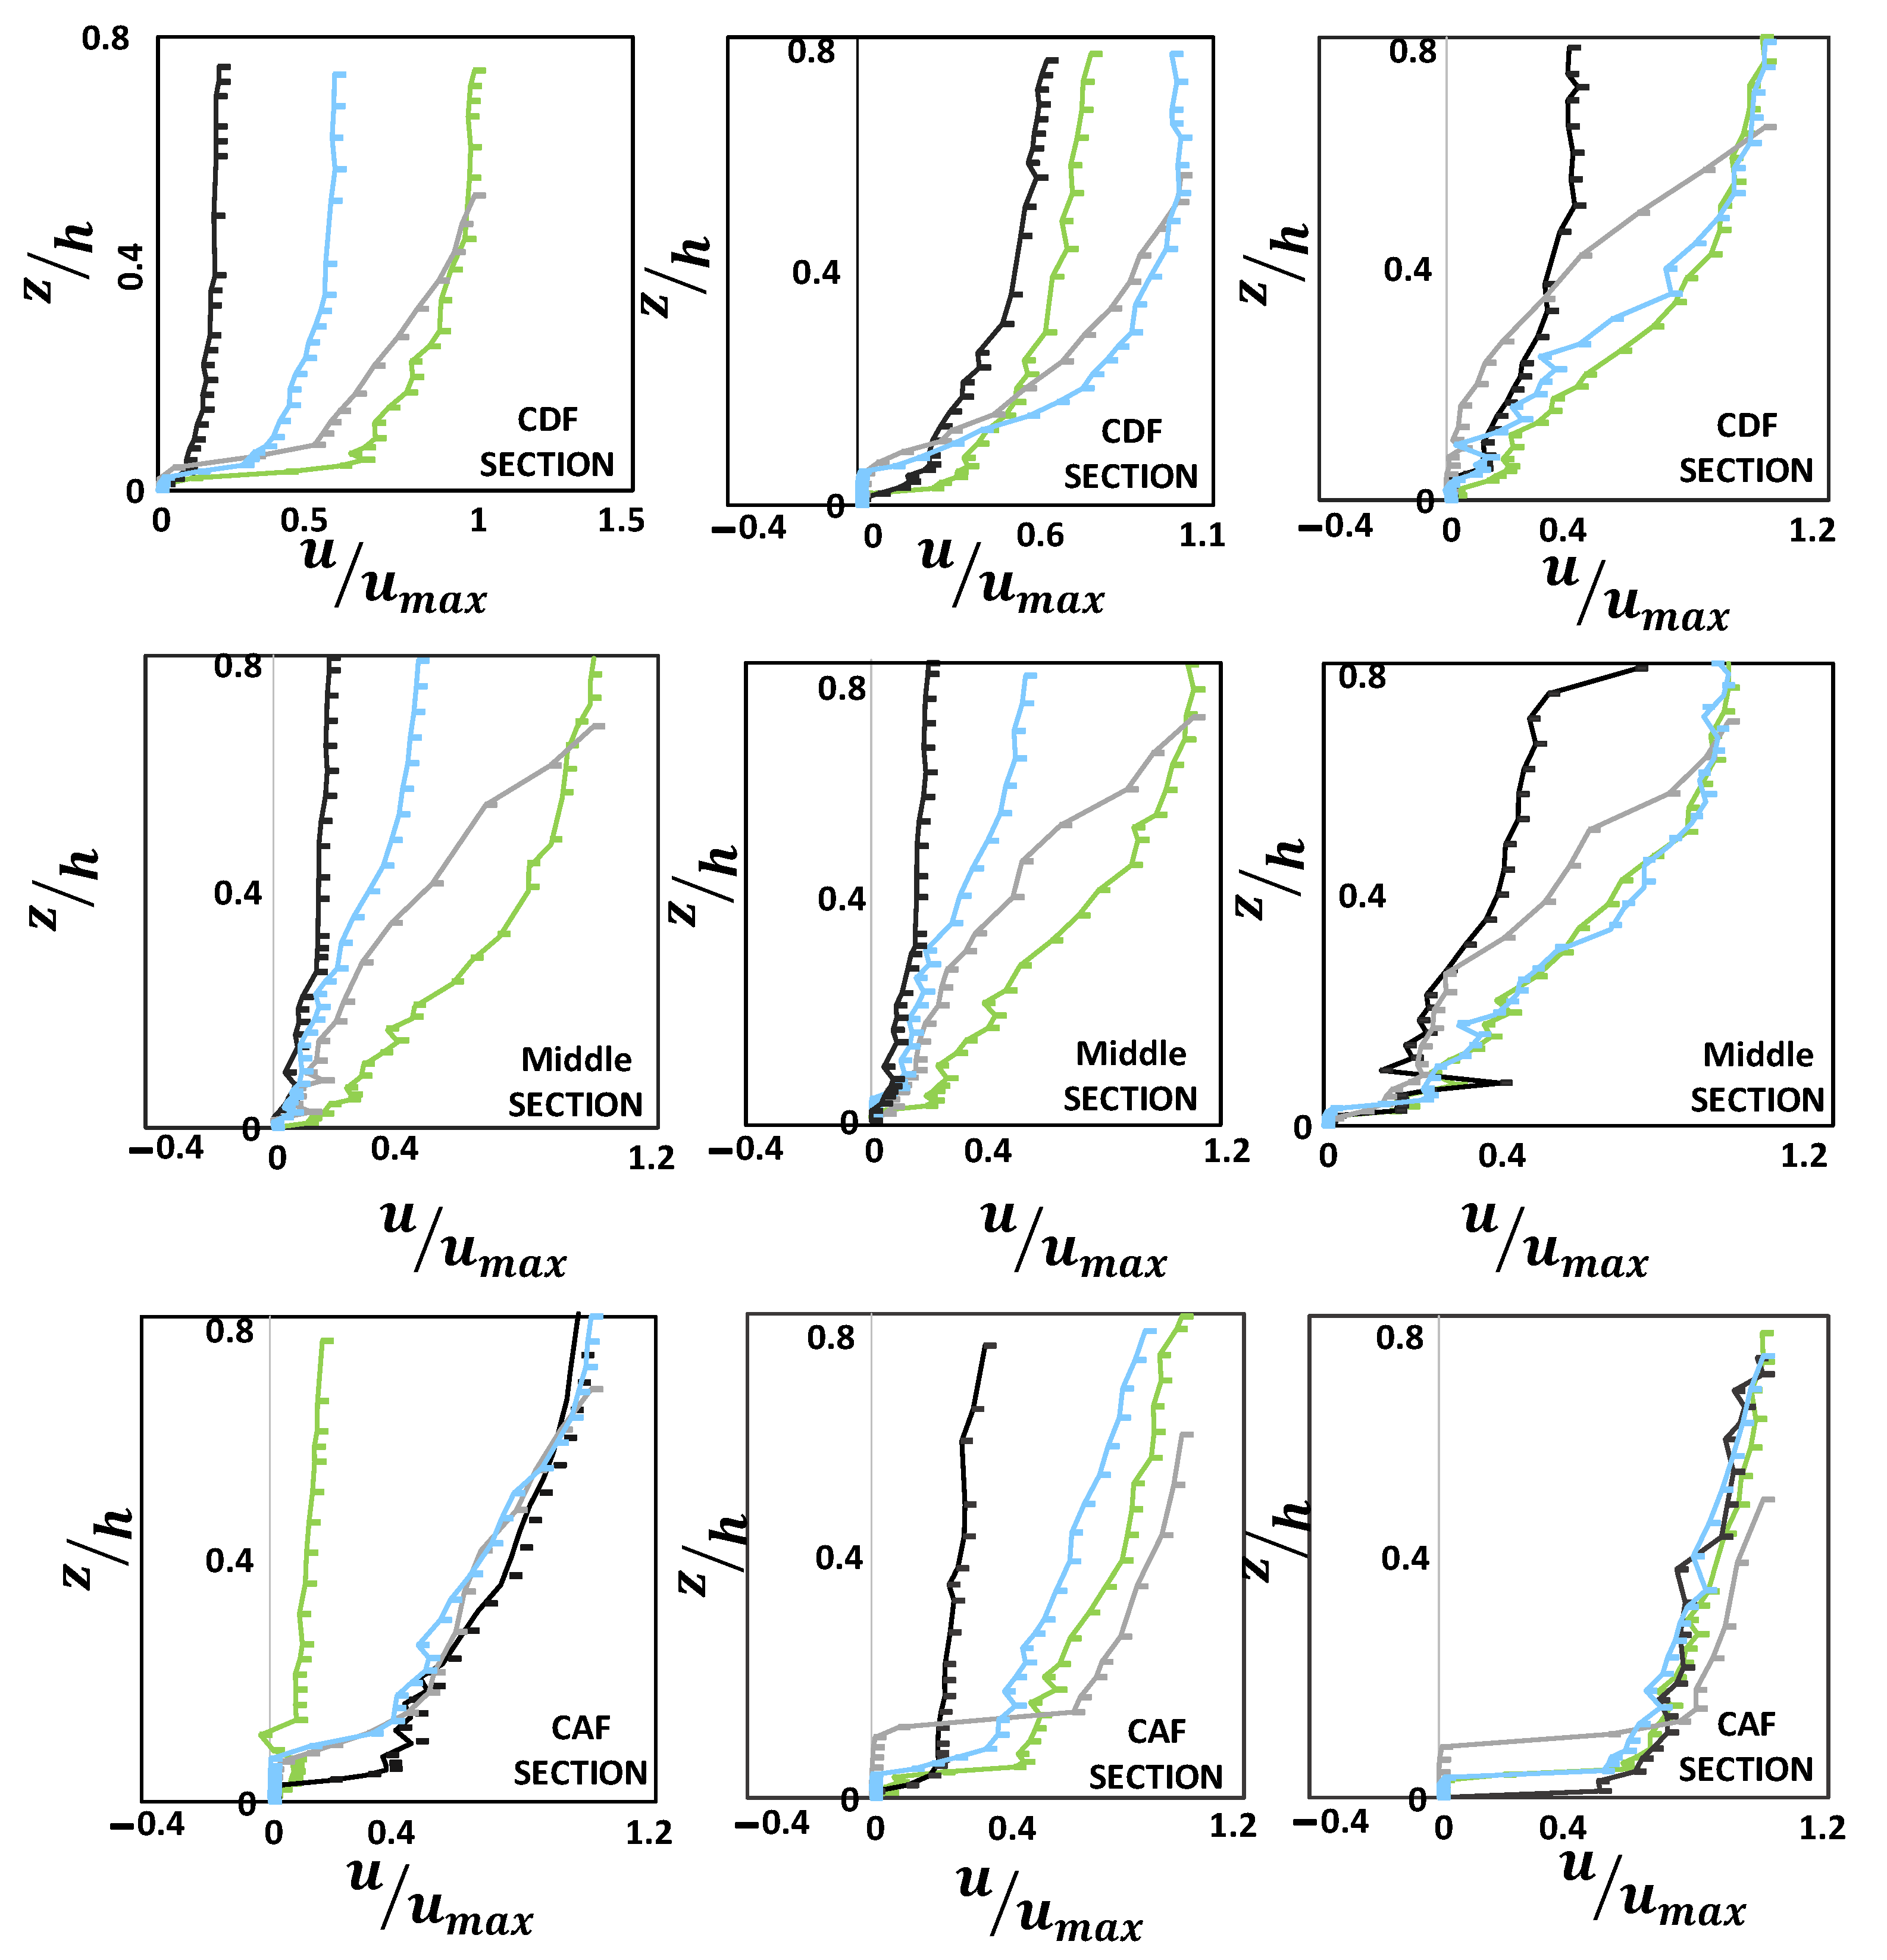
As shown in Figure 4, the dimensionless stream-wise velocity profiles are presented along the entire pool, where the mean point velocity (u) was converted to dimensionless velocity by dividing it by the maximum velocity (umax) of each velocity profile. Also, the depth related to a velocity point measurement (z) became dimensionless depth by dividing it to the flow depth (h).
The results of the velocity distributions show that the maximum velocity occurs near the water surface. On the other hand, since it is difficult to measure velocity by ADV devices in the flow separation zone where the intensity of turbulence is high, negative stream-wise velocities were not observed in the present experimental study. Moreover, the difference between velocity profiles along the central axis and those along the second axis indicates the strength of the secondary currents in the presence of vegetation in the channel bed. The velocities near the bed in the decelerating flow section decreased with the increasing flow depth; and the velocities near the bed increased along the accelerating flow section with the decrease in the flow depth. These results are consistent with those of other studies [11,44].
Furthermore, dimensionless flow velocities in the outer zone (z/h > 0.2) in the decelerating flow section are higher than those in the accelerating flow section, which is consistent with the findings reported in the previous work [13,45]. In the presence of vegetation in the channel bed of the pool, by increasing the aspect ratio, the velocity profiles show an S-shaped distribution. For these velocity profiles, the velocity gradient in the upper part is very small; the velocity gradient is higher in the middle part; and in the region near the bed, the velocity follows a logarithmic distribution. This result confirms the findings of other studies [46]. The effect of the increased aspect ratio on the velocity profiles in the central axis of the pool channel resulted in an increase in the average flow velocity, and a larger velocity gradient along the entire channel bed of the pool. In addition, the region with the minimum velocity values was located at the end of the middle part of the pool section, leading to the presence of a non-uniform flow in the middle part of the pool section. Failure to create a uniform flow in the middle pool section was due to the residual effect of the decelerating flow. This observation is consistent with the results of previous study for a non-uniform open channel flow [47].
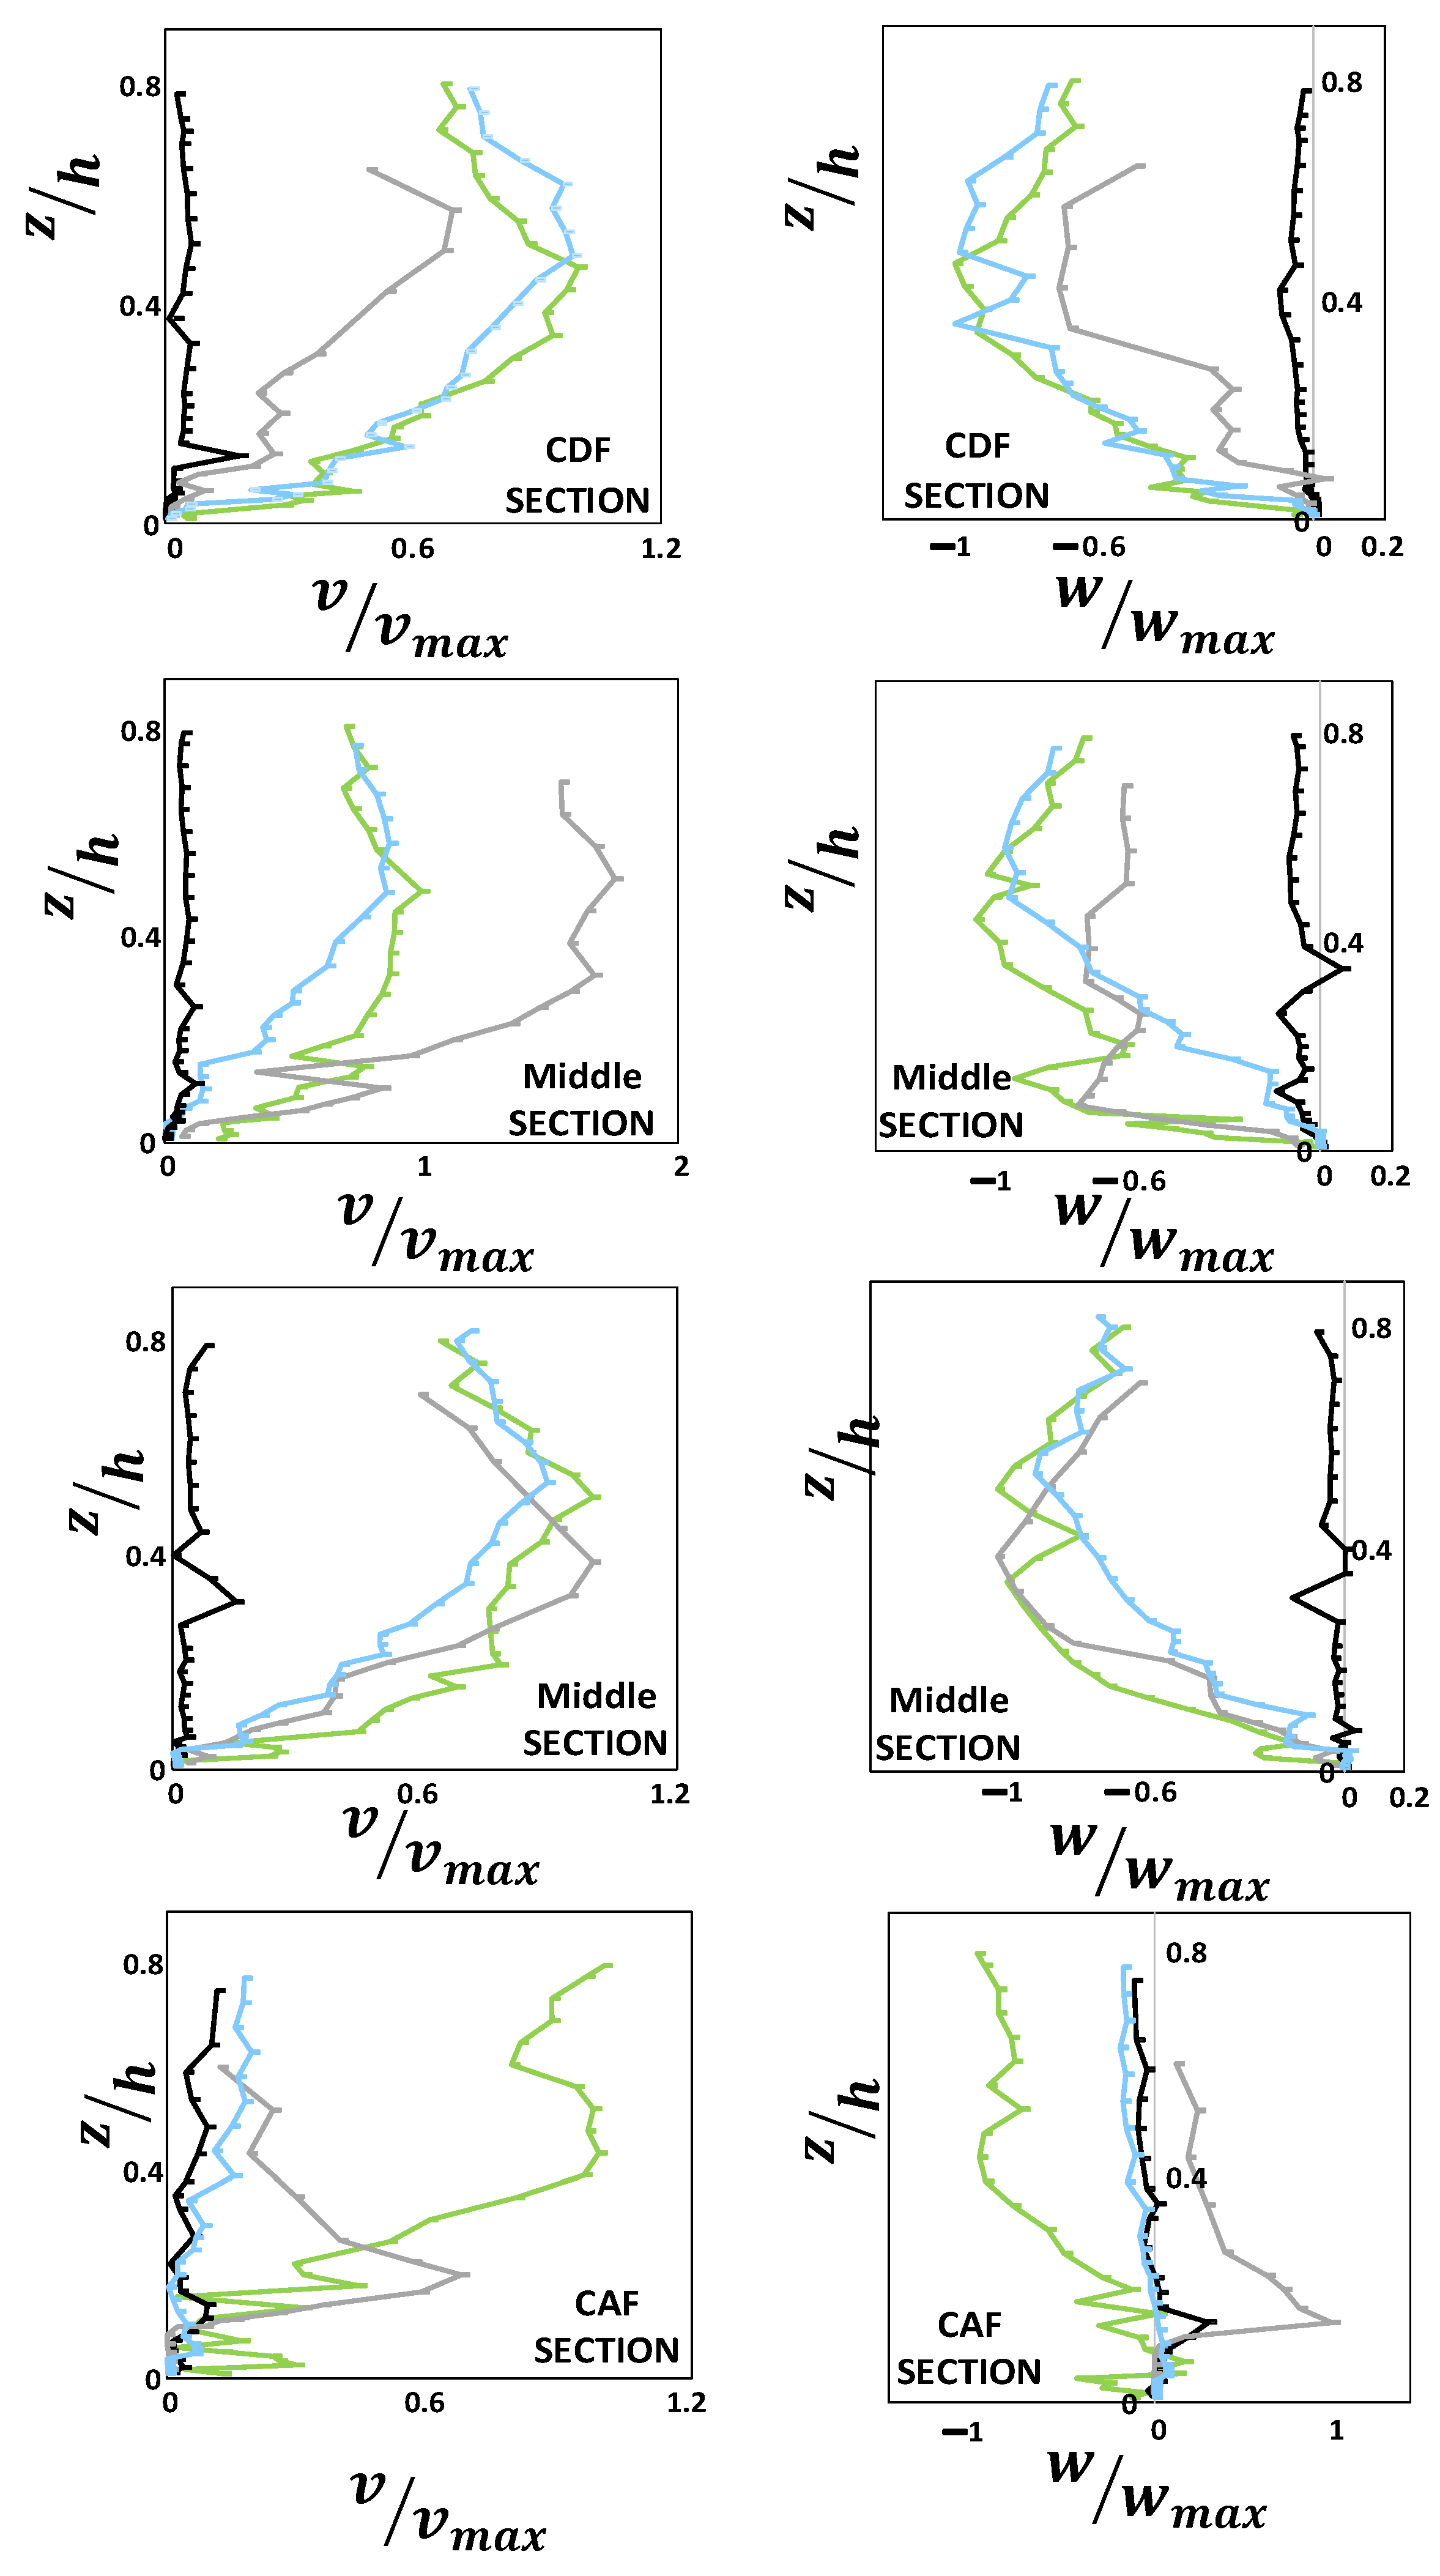
To further investigate the impacts of secondary currents on the characteristics of flow velocity, the velocity components in other two directions were examined, namely the spanwise velocity component (v), and the vertical velocity component (w). As shown in Figure 5, the velocity profiles (v, w) are presented at four cross sections along the pool, namely one cross section in the deceleration section, two cross sections in the middle pool section, and one cross section in the acceleration section. The results show that the occurrences of both positive and negative velocity values in the spanwise and the vertical directions are responsible for the difference in the pattern of secondary currents along the pool bed. The opposite effect of accelerating and decelerating flow on the secondary currents along the pool bed was also reported by other researchers [47].
3.3. Quadrant Analysis of Bursting Events
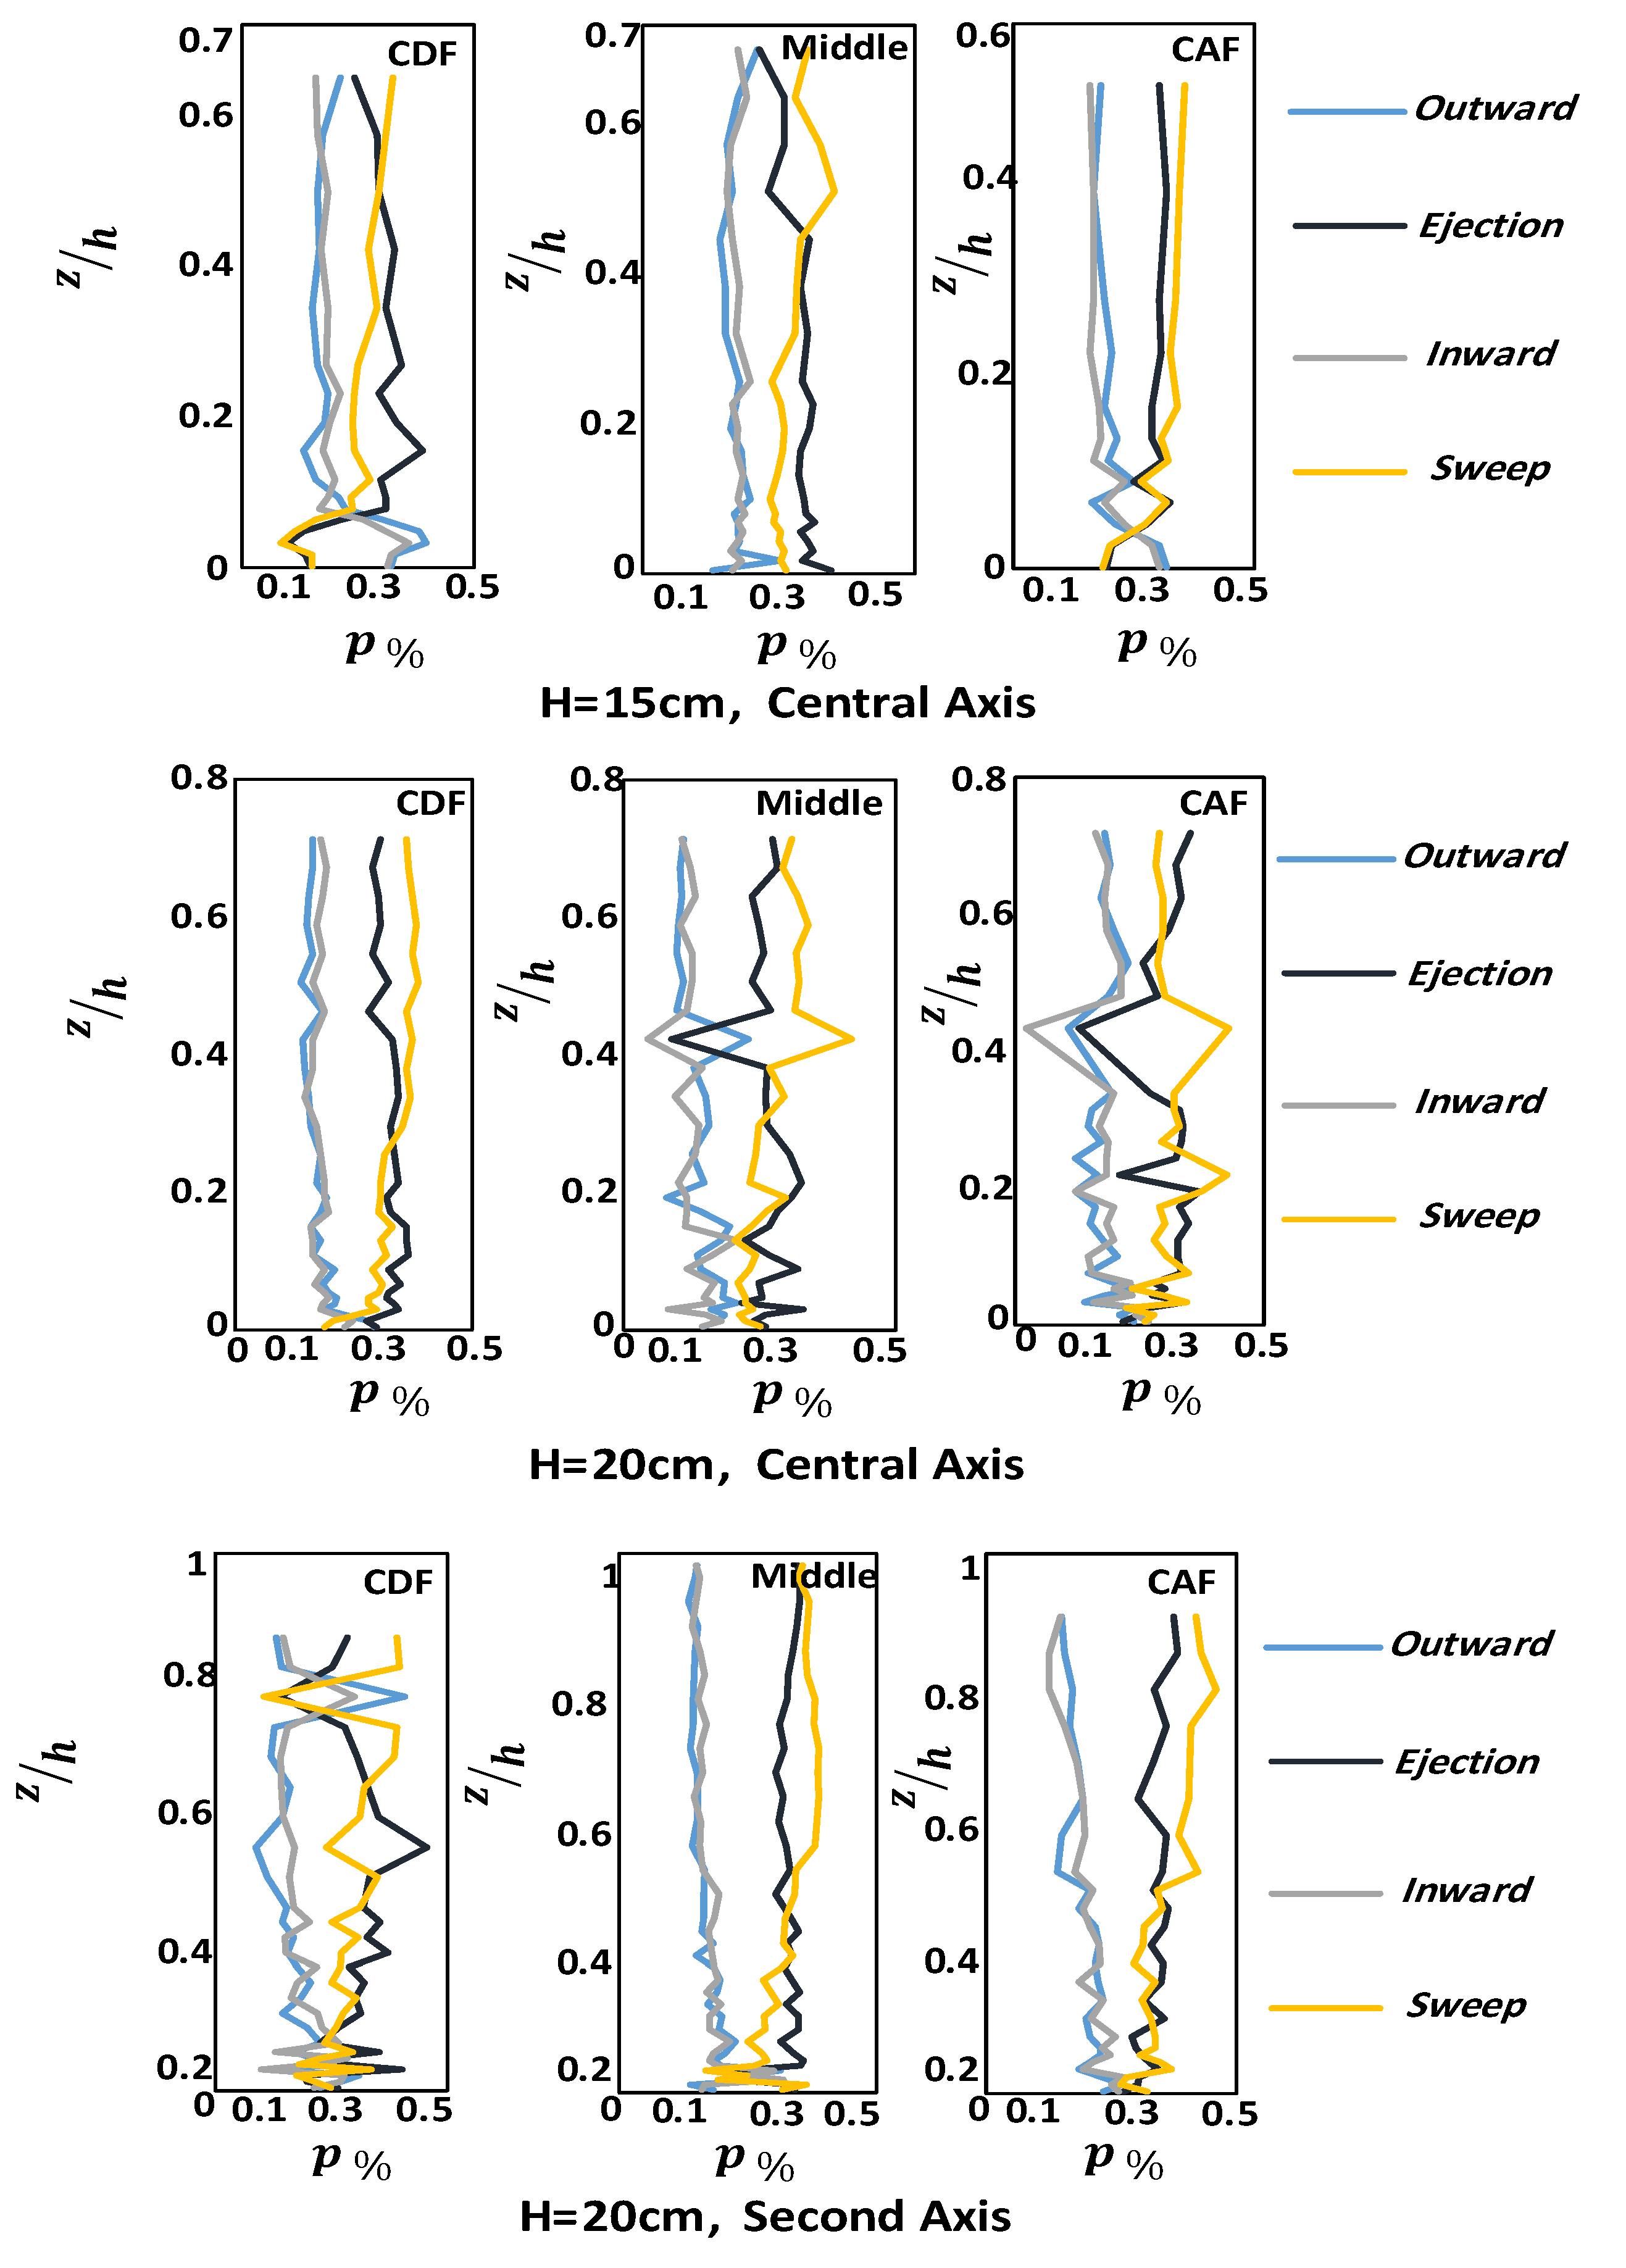
To determine the effects of the aspect ratio and vegetation cover on the distributions of bursting process events in the flow over the pool bed, quadrant analysis was investigated. One can observe from Figure 6 that in the inner zone over the vegetation patch, both the sweep and ejection interactions are dominant events along the central channel axis. This result is consistent with that reported by previous researchers for an open channel with dense vegetation [32]. However, for both the entrance and exit sections of the pool where the flow decelerates and accelerates, respectively, near the bed, the outward and inward events show more contribution to Reynolds shear stress at the central axis of the channel. Approaching the channel sidewall, the interaction of vegetation and decelerating flow reveals a complex pattern, indicating the contribution of all events to Reynolds shear stress. It has been also observed that, with a higher aspect ratio, the inward and outward interaction over the vegetation patch indicates that the flow velocity distribution is affected by the bursting process events. With the decrease in the flow depth along the pool with the vegetated bed, the sweep and ejection events were observed as the dominant events in the pool.
Moreover, approaching the sidewall of the flume, the contribution of the sweep event was noted as dominant; however, the distribution of ejection varies in the CDF, middle and CAF section of the pool. Some considerable scattering in the distribution of the events is due to the presence of more pronounced (higher) roughness. The results of the quadrant analysis of the bursting process events along both the central and second axes indicate that, near the water surface, the dominant events are generally sweeps, followed by ejections, and then outward and inward interactions (Figure 6), thus resulting in positive Reynolds stress values, as shown in Figure 7.
3.4. Distribution of Shear Stress and Longitudinal Turbulence Intensities
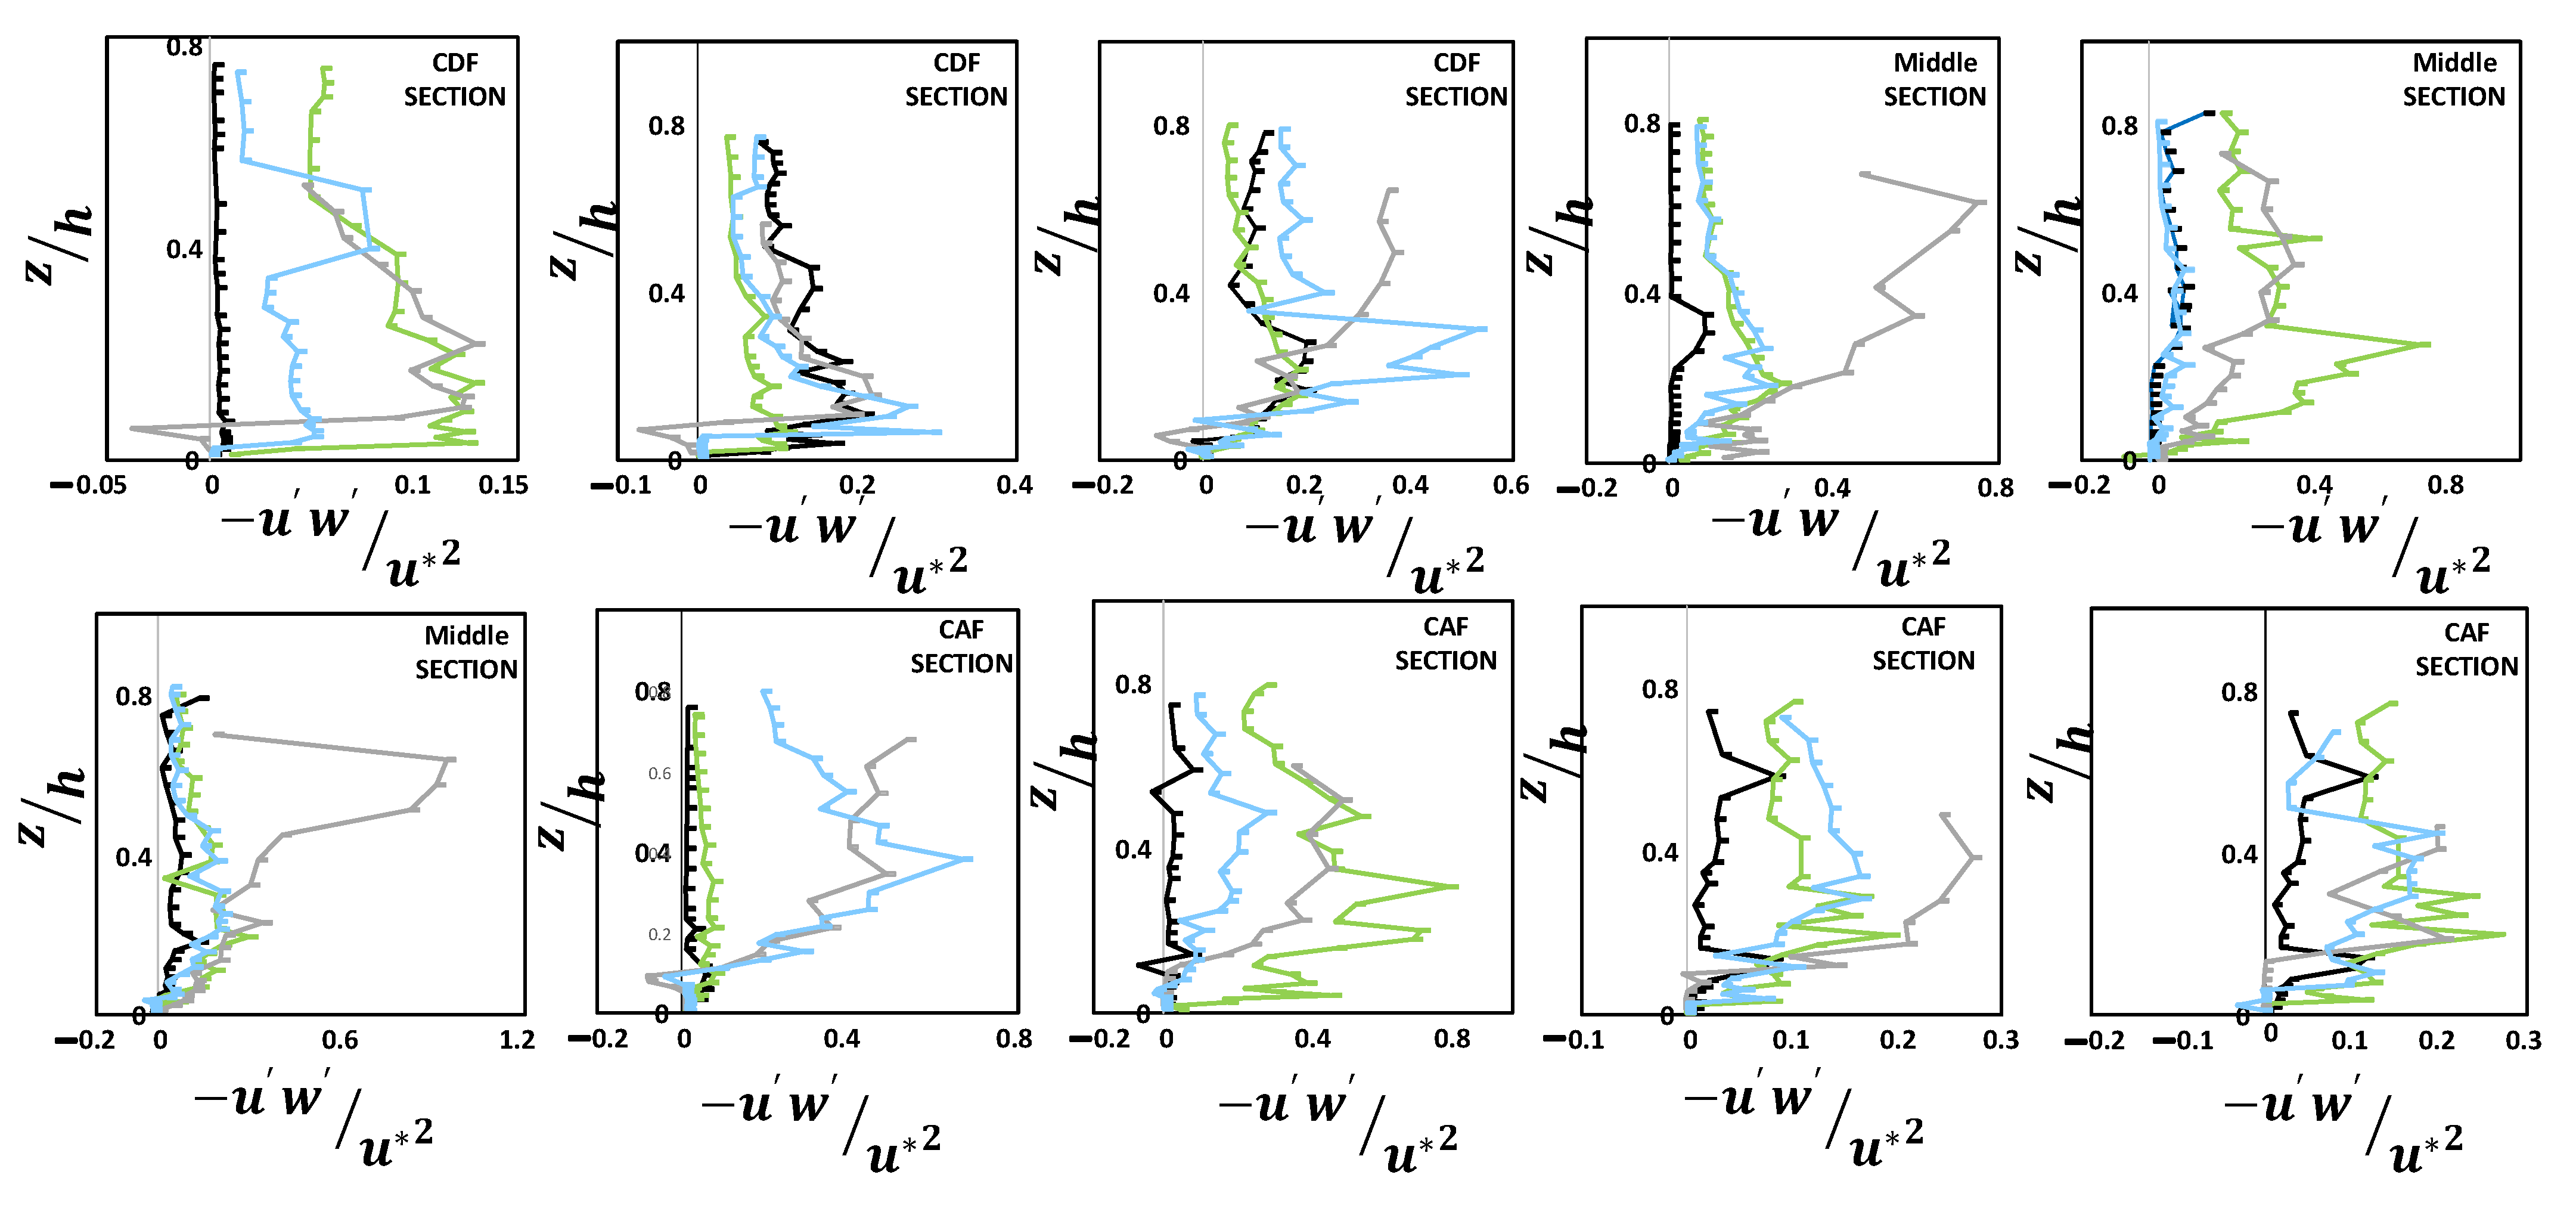
The dimensionless Reynolds shear stress (RSS) profiles along the entire pool section are presented in Figure 7. The absence of negative values of shear stress near the water surface indicates that the maximum velocity occurs near the water surface. In addition, the less frequent outward interactions lead to negative values for u′w′, resulting in positive Reynolds stress. In addition, in the middle pool section, the shear stress profiles do not follow the trend of a linear shape, indicating that there is no uniform flow in the middle pool section. By comparing the results of Reynolds shear stress along the central axis of the channel over the sand bed to those over the vegetated bed, it has been observed that the high values of RSS occur over the sand bed in the decelerating section of the pool. In the presence of vegetation in the bed, when approaching the sidewall, the distribution of Reynolds shear stresses shows smaller values. The shape and the location of the maximum value of the Reynolds stress distribution depend on the slopes of the entrance and the exit sections of the pool [18]. The RSS distribution in the decelerating flow section and middle pool section shows a convex shape. Previous researchers found that at the beginning of the accelerating flow section, the shear stress profiles have a convex shape [47]. However, in the present study, the Reynolds shear stress profiles along the accelerating flow section have a concave shape first and then convex shape at the final sections of the pool exit (close to the crest of the bed form).
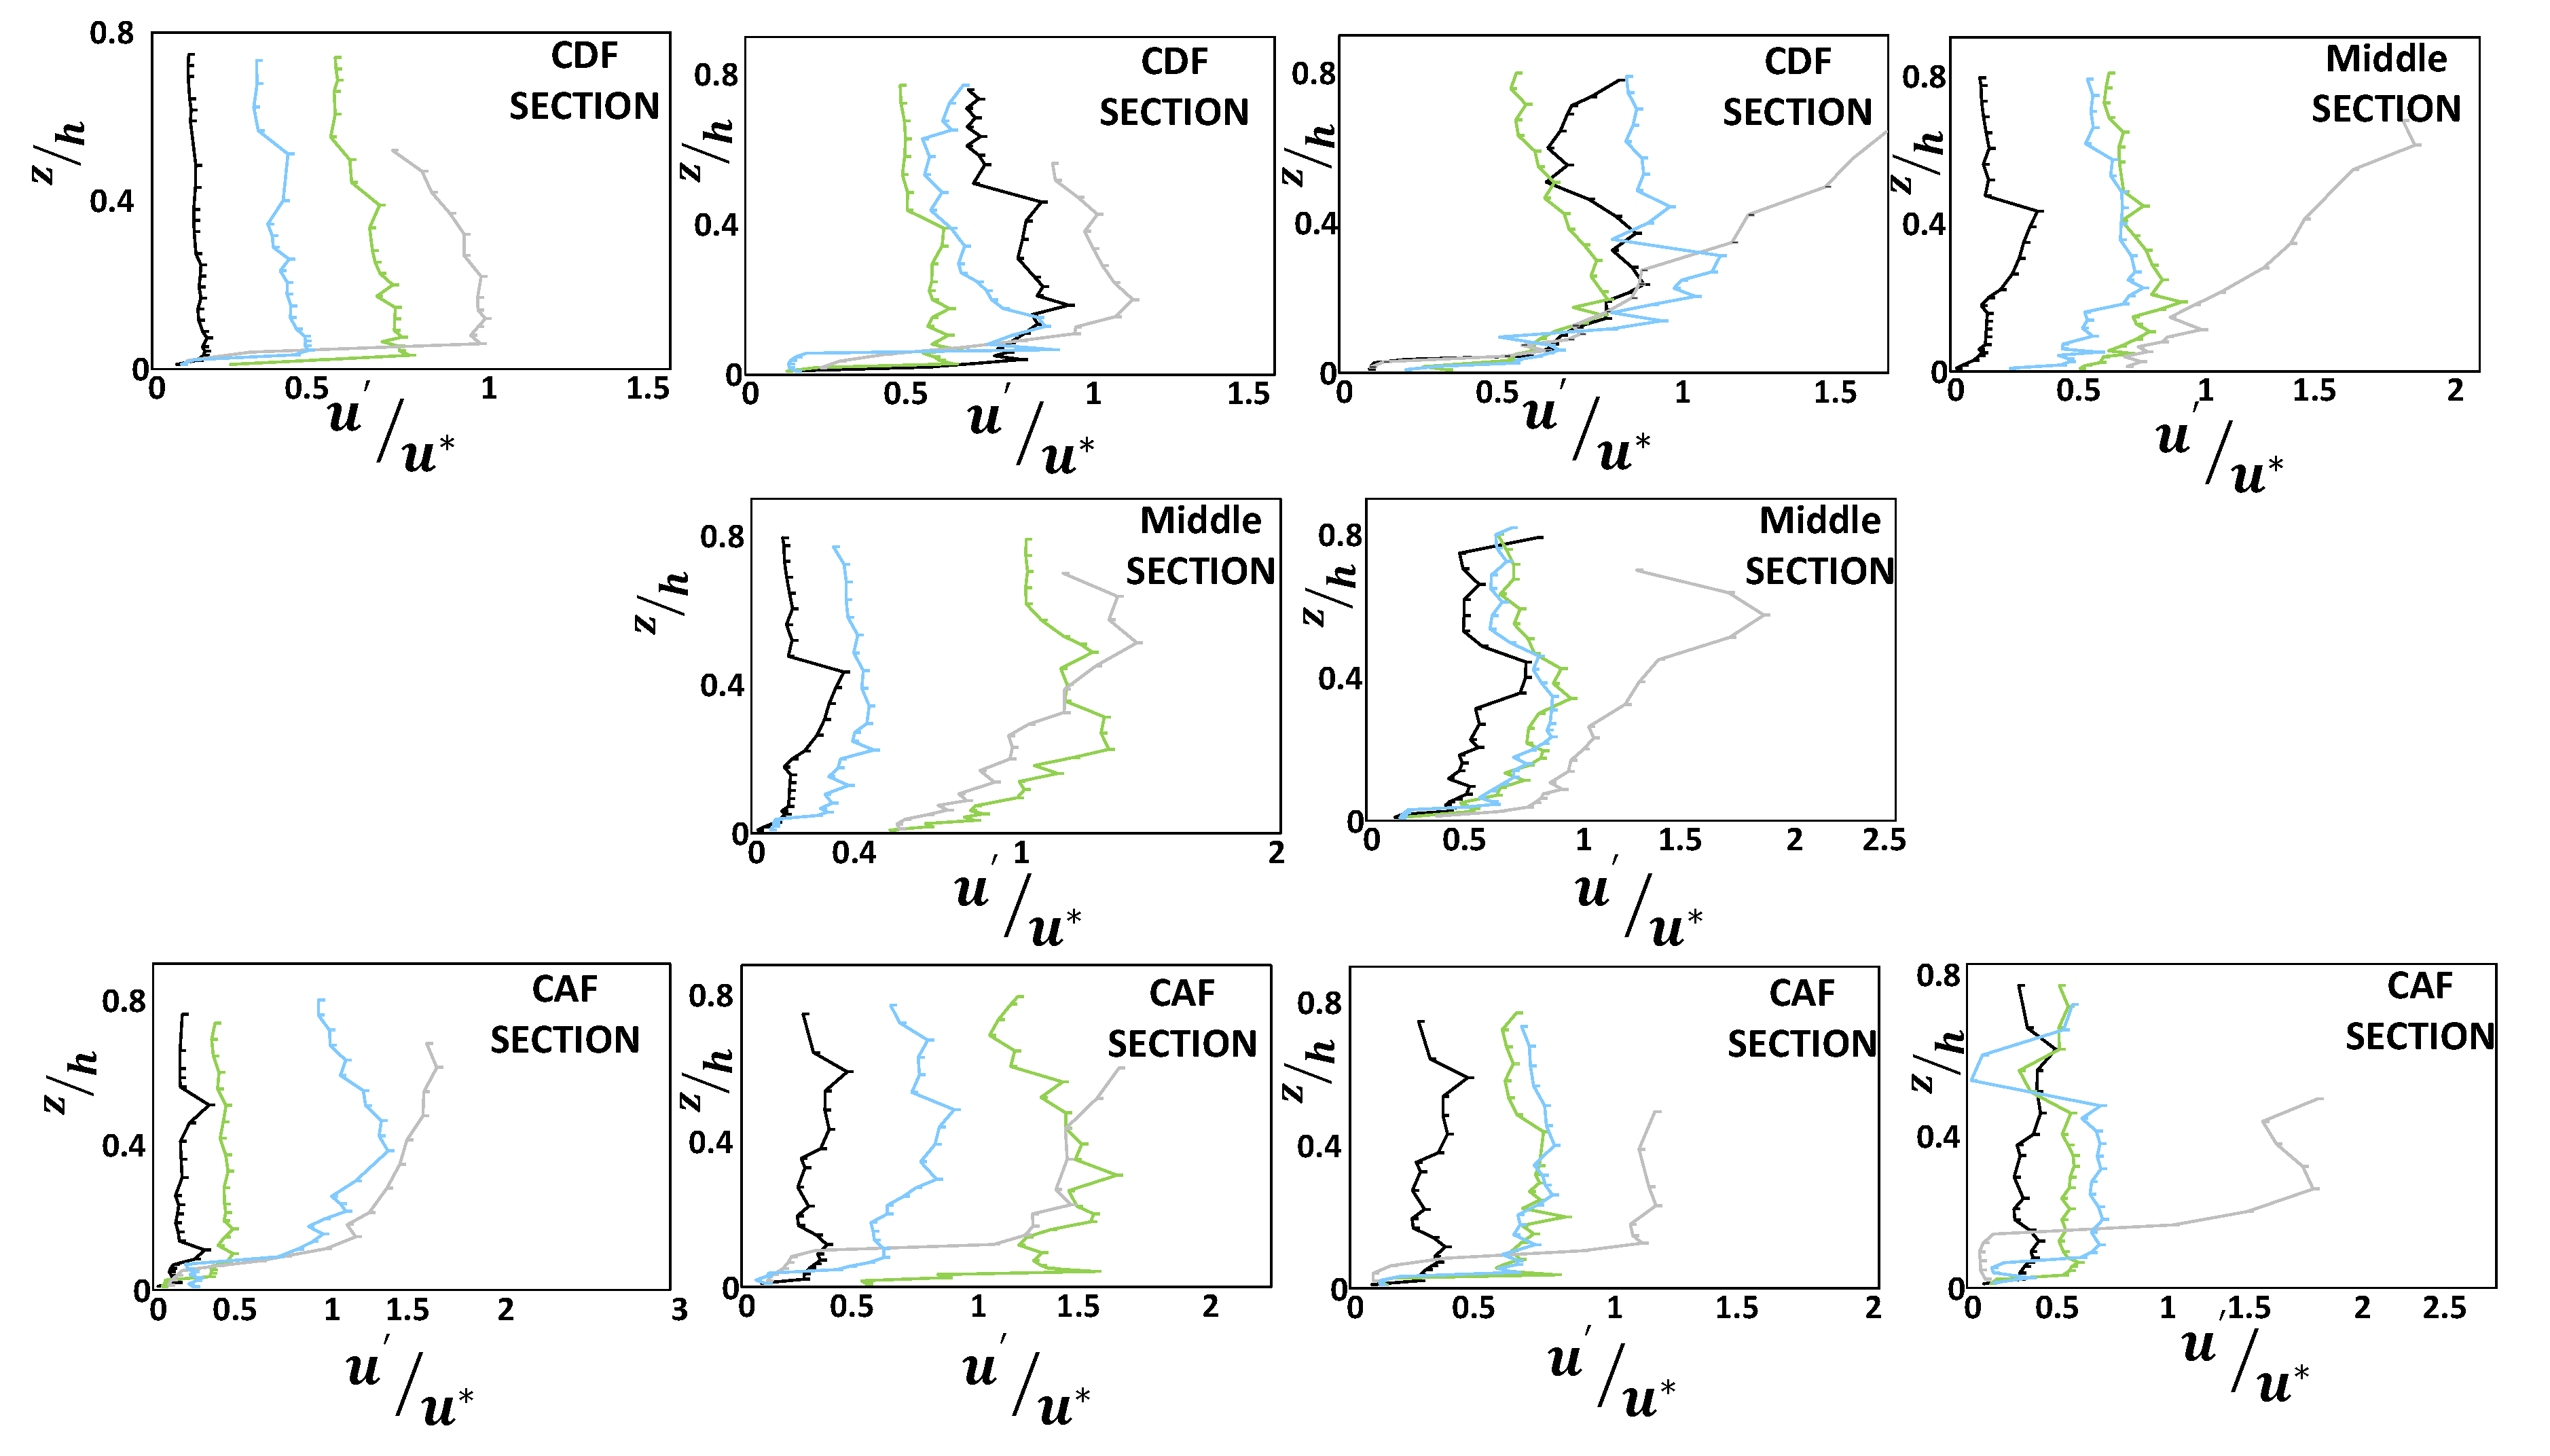
One can observe from Figure 7 that the distributions of turbulence intensities show different patterns. The non-uniform flow is generated due to the interaction of the vegetation and bed form, different pressure gradients, and the change in roughness from the sand bed to vegetated bed. Figure 8 shows the dimensionless turbulence intensities based on the mean square of the velocity fluctuations. The presence of vegetation patches in the bed leads to the higher turbulence intensities in the middle pool section and accelerating flow section. However, along the entrance section of the pool (decelerating flow section), the presence of vegetation in the bed resulted in a lower turbulence intensity. In the inner layer of the flow, the turbulence fluctuations are lower in the middle pool section, and higher in both the accelerating and decelerating sections of the pool. The effect of both lateral and vertical turbulence intensities was not clearly observed, and was not reported in this study.
4. Conclusions
The interaction between bed forms and vegetation patches in mountainous streams is a challenging subject for river engineers. Considering the importance of vegetation in stabilizing bed forms, both laboratory and analytical work has been conducted on bed forms in the presence of vegetation in the past several decades. However, our knowledge about the interaction of flow and bed forms with vegetation still needs to be clarified, including how bed forms and vegetation affect sediment transfer and production of turbulence, which is one of the reasons for this innovative study in the field of environmental hydraulics. To better understand this interaction, a laboratory study has been carried out in a flume with an artificial pool covered by vegetation patches. In addition, in fluvial hydraulics, it is essential to know the flow structures and estimate the related parameters for describing turbulence distributions. This study focused on the turbulent flow structures in an artificial pool in the presence and absence of vegetation patches over the pool. The results of our laboratory experiments revealed that the logarithmic law is valid for flow velocities within artificial pools in the presence of vegetation patches over the bed. However, towards the water surface, significant deviations of the velocity data from the logarithmic law have been observed. This suggests that, to calculate the fluvial parameters of a pool in the presence of vegetation patches in the bed, the logarithmic law should be used with care.
The shear velocities have been estimated by using both the boundary layer characteristics method and logarithmic method. The estimated shear velocities, obtained by the boundary layer characteristics method, are larger than those obtained via the logarithmic method, since the boundary layer characteristics method considers all point velocities of each profile for calculating shear velocity u*. The presence of vegetation patches in the pool bed resulted in an increase in the shear velocity, particularly in the entrance section of the pool where the flow decelerates. The results of the quadrant analysis reveal that sweep events play the most important role in different parts of the artificial pool, followed by ejection events. However, near the bed, especially along the pool entrance section where the flow is decelerating, the role of outward and inward events is considerable. Along the axis near the sidewall of the flume, the contributions of all events of the bursting process near the bed are complex. This is partly caused by the effect of vegetation patches on the turbulent flow structures. Near the water surface, in general, the sweep events play a dominant role, followed by ejection interactions.
The Reynolds shear stress and turbulence intensity distributions over the sand bed were compared to those in the pool with a vegetation patch. In the presence of vegetation in the channel bed of the pool, by increasing the aspect ratio, the velocity profiles show an S-shaped distribution. For these velocity profiles, the velocity gradient in the upper part is very small; the velocity gradient is higher in the middle part; and in the region near the bed, the velocity follows a logarithmic distribution. The presence of a submerged vegetation patch in the pool bed led to the occurrence of inward and outward events along the pool. The results of the quadrant analysis show that the occurrence of sweep and ejection events over the vegetation patch in the pool depends on the flow velocity distribution. With the decrease in the flow depth over the vegetated pool bed, sweep and ejection events were observed in the pool. In the presence of vegetation in the bed, by approaching the sidewall, the distribution of Reynolds shear stresses shows smaller values. Near the sidewall, the logarithmic law of the flow velocity in the inner region of the boundary layer near the bed is confirmed. The opposite effect of accelerating flow and decelerating flow on the secondary currents along the pool bed is due to the occurrence of positive and negative pressure gradients along the pool. Approaching the sidewall of the flume, the aspect ratio had no significant effects on the occurrence of bursting events. In the presence of vegetation in the bed, by approaching the sidewall, the distribution of Reynolds shear stresses shows smaller values.
The results of this research reveal that the interaction between vegetation and different sections of a pool (entrance, middle pool and exit sections) has a significant impact on the estimations of Reynolds shear stress, turbulence intensity and shear velocity, as well as the contributions of bursting events.
Application and extension of the results of the present study may help to better understand the key parameters in fluvial hydraulics, including the resistance to flow and sediment transport parameters. This may help river engineers to decrease the cost of projects. A variety of studies on pool bed forms must be carried out in order to improve our knowledge about the interaction of flow in pools under different conditions. For example, the effects of a moving bedform of a pool on the flow structure can be investigated by considering different sand granularities in a pool, or the impact of different types and densities of vegetation on the flow structure in a pool can also be studied. Numerical modeling of the flow over a pool bed in the presence and absence of vegetation is also suggested.
Author Contributions
P.P., experimental works, methodology, software; writing—original draft; H.A., supervision, writing—review, methodology, validation and editing. J.S., writing—review, methodology, validation and editing. H.R.R., methodology and validation. A.R.E., methodology and validation. All authors have read and agreed to the published version of the manuscript.
Funding
This research received no external funding.
Institutional Review Board Statement
Not applicable.
Informed Consent Statement
Not applicable.
Data Availability Statement
Data are contained within the article.
Conflicts of Interest
The authors declare no conflict of interest.
References
- Tabarestani, E.S.; Afzalimehr, H.; Pham, Q.B. Flow structure investigation over a pool-rife sequence in a variable width river. Acta Geophys. 2022, 70. [Google Scholar] [CrossRef]
- Keller, E. Areal sorting of bed-load material: The hypothesis of velocity reversal: Reply. Geol. Soc. Am. Bull. 1972, 83, 915–918. [Google Scholar] [CrossRef]
- Clifford, N.; Richards, K. The reversal hypothesis and teh maintenance of riffle-pool sequences: A review and field appraisal. In Lowland Floodplain Rivers: Geomorphological Perspectives; Wiley: Hoboken, NJ, USA, 1992; pp. 43–70. [Google Scholar]
- Clifford, N. Morphology and stage-dependent flow structure in a gravel-bed river. In Coherent Flow Struct. Open Channels; Wiley: Chichester, UK, 1996; pp. 545–566. [Google Scholar]
- Thompson, D.M. The role of vortex shedding in the scour of pools. Adv. Water Resour. 2006, 29, 121–129. [Google Scholar] [CrossRef]
- Booker, D.; Sear, D.; Payne, A. Modelling three-dimensional flow structures and patterns of boundary shear stress in a natural pool–riffle sequence. Earth Surf. Process. Landf. J. Br. Geomorphol. Res. Group 2001, 26, 553–576. [Google Scholar] [CrossRef]
- Wilkinson, S.N.; Keller, R.J.; Rutherfurd, I.D. Phase-shifts in shear stress as an explanation for the maintenance of pool–riffle sequences. Earth Surf. Process. Landf. 2004, 29, 737–753. [Google Scholar] [CrossRef]
- MacWilliams, M.L., Jr.; Wheaton, J.M.; Pasternack, G.B.; Street, R.L.; Kitanidis, P.K. Flow convergence routing hypothesis for pool-riffle maintenance in alluvial rivers. Water Resour. Res. 2006, 42. [Google Scholar] [CrossRef] [Green Version]
- Sawyer, A.M.; Pasternack, G.B.; Moir, H.J.; Fulton, A.A. Riffle-pool maintenance and flow convergence routing observed on a large gravel-bed river. Geomorphology 2010, 114, 143–160. [Google Scholar] [CrossRef]
- Chao, L.; Shan, Y.-Q.; Yang, K.-J.; Liu, X.-N. The characteristics of secondary flows in compound channels with vegetated floodplains. J. Hydrodyn. Ser. B 2013, 25, 422–429. [Google Scholar]
- MacVicar, B.J.; Rennie, C.D. Flow and turbulence redistribution in a straight artificial pool. Water Resour. Res. 2012, 48. [Google Scholar] [CrossRef]
- Fazel Najafabadi, E.; Afzalimehr, H.; Sui, J. A comparison of two-dimensional and three-dimensional flow structures over artificial pool-riffle sequences. Can. J. Civ. Eng. 2017, 44, 1084–1098. [Google Scholar] [CrossRef] [Green Version]
- Song, T.; Chiew, Y. Turbulence measurement in nonuniform open-channel flow using acoustic Doppler velocimeter (ADV). J. Eng. Mech. 2001, 127, 219–232. [Google Scholar] [CrossRef]
- Okamoto, T.-A.; Nezu, I. Spatial evolution of coherent motions in finite-length vegetation patch flow. Environ. Fluid Mech. 2013, 13, 417–434. [Google Scholar] [CrossRef]
- Huai, W.-X.; Zhang, J.; Katul, G.G.; Cheng, Y.-G.; Tang, X.; Wang, W.-J. The structure of turbulent flow through submerged flexible vegetation. J. Hydrodyn. 2019, 31, 274–292. [Google Scholar] [CrossRef]
- Huai, W.; Zeng, Y.; Xu, Z.; Yang, Z. Three-layer model for vertical velocity distribution in open channel flow with submerged rigid vegetation. Adv. Water Resour. 2009, 32, 487–492. [Google Scholar] [CrossRef]
- Jahadi, M.; Afzalimehr, H.; Ashrafizaadeh, M.; Kumar, B. A numerical study on hydraulic resistance in flow with vegetation patch. ISH J. Hydraul. Eng. 2022, 28, 243–250. [Google Scholar] [CrossRef]
- Nosrati, K.; Afzalimehr, H.; Sui, J. Interaction of Irregular Distribution of Submerged Rigid Vegetation and Flow within a Straight Pool. Water 2022, 14, 2036. [Google Scholar] [CrossRef]
- Wang, J.; He, G.; Dey, S.; Fang, H. Influence of submerged flexible vegetation on turbulence in an open-channel flow. J. Fluid Mech. 2022, 947, A31. [Google Scholar] [CrossRef]
- Shahmohammadi, R.; Afzalimehr, H.; Sui, J. Impacts of Turbulent Flow over a Channel Bed with a Vegetation Patch on the Incipient Motion of Sediment. Can. J. Civ. Eng. 2018, 45, 803–816. [Google Scholar] [CrossRef]
- D’Ippolito, A.; Calomino, F.; Penna, N.; Dey, S.; Gaudio, R. Simulation of accelerated subcritical flow profiles in an open channel with emergent rigid vegetation. Appl. Sci. 2022, 12, 6960. [Google Scholar] [CrossRef]
- Afzalimehr, H.; Riazi, P.; Jahadi, M.; Singh, V.P. Effect of vegetation patches on flow structures and the estimation of friction factor. ISH J. Hydraul. Eng. 2021, 27, 390–400. [Google Scholar] [CrossRef]
- Stephan, U.; Gutknecht, D. Hydraulic resistance of submerged flexible vegetation. J. Hydrol. 2002, 269, 27–43. [Google Scholar] [CrossRef]
- Nepf, H.; Ghisalberti, M. Flow and transport in channels with submerged vegetation. Acta Geophys. 2008, 56, 753–777. [Google Scholar] [CrossRef]
- Luhar, M.; Rominger, J.; Nepf, H. Interaction between flow, transport and vegetation spatial structure. Environ. Fluid Mech. 2008, 8, 423–439. [Google Scholar] [CrossRef]
- Nepf, H.M.; Vivoni, E. Flow structure in depth-limited, vegetated flow. J. Geophys. Res. Ocean. 2000, 105, 28547–28557. [Google Scholar] [CrossRef]
- Afzalimehr, H.; Subhasish, D. Influence of bank vegetation and gravel bed on velocity and Reynolds stress distributions. Int. J. Sediment Res. 2009, 24, 236–246. [Google Scholar] [CrossRef]
- Fazlollahi, A.; Afzalimehr, H.; Sui, J. Effect of slope angle of an artificial pool on distributions of turbulence. Int. J. Sediment Res. 2015, 30, 93–99. [Google Scholar] [CrossRef]
- MacVicar, B.; Obach, L. Shear stress and hydrodynamic recovery over bedforms of different lengths in a straight channel. J. Hydraul. Eng. 2015, 141, 04015025. [Google Scholar] [CrossRef]
- Nezu, I.; Rodi, W. Open-channel flow measurements with a laser Doppler anemometer. J. Hydraul. Eng. 1986, 112, 335–355. [Google Scholar] [CrossRef]
- Afzalimehr, H.; Rennie, C.D. Determination of bed shear stress in gravel-bed rivers using boundary-layer parameters. Hydrol. Sci. J. 2009, 54, 147–159. [Google Scholar] [CrossRef] [Green Version]
- Afzalimehr, H.; Moghbel, R.; Gallichand, J.; Sui, J. Investigation of turbulence characteristics in channel with dense vegetation. Int. J. Sediment Res. 2011, 26, 269–282. [Google Scholar] [CrossRef]
- MacVicar, B.; Roy, A. Sediment mobility in a forced riffle-pool. Geomorphology 2011, 125, 445–456. [Google Scholar] [CrossRef]
- Carling, P.A.; Orr, H.G. Morphology of riffle–pool sequences in the River Severn, England. Earth Surf. Process. Landf. J. Br. Geomorphol. Res. Group 2000, 25, 369–384. [Google Scholar] [CrossRef]
- Przyborowski, Ł.; Łoboda, A.M.; Bialik, R.J. Effect of two distinct patches of Myriophyllum species on downstream turbulence in a natural river. Acta Geophys. 2019, 67, 987–997. [Google Scholar] [CrossRef] [Green Version]
- Mayaud, J.R.; Wiggs, G.F.; Bailey, R.M. Dynamics of skimming flow in the wake of a vegetation patch. Aeolian Res. 2016, 22, 141–151. [Google Scholar] [CrossRef] [Green Version]
- Robinson, S.K. Coherent motions in the turbulent boundary layer. Annu. Rev. Fluid Mech. 1991, 23, 601–639. [Google Scholar] [CrossRef]
- Poggi, D.; Katul, G.; Albertson, J. Momentum transfer and turbulent kinetic energy budgets within a dense model canopy. Bound.-Layer Meteorol. 2004, 111, 589–614. [Google Scholar] [CrossRef]
- Dey, S.; Nath, T.K. Turbulence characteristics in flows subjected to boundary injection and suction. J. Eng. Mech. 2010, 136, 877–888. [Google Scholar] [CrossRef]
- Parvizi, P.; Afzalimehr, H.; Singh, V.P. Impact of pool and vegetated bottom on turbulant flow structure. Int. J. Hydraul. Eng. 2021, 10, 8–18. [Google Scholar]
- Afzalimehr, H.; Anctil, F. Accelerating shear velocity in gravel-bed channels. Hydrol. Sci. J. 2000, 45, 113–124. [Google Scholar] [CrossRef] [Green Version]
- Kironoto, B.; Graf, W.H.; Reynolds. Turbulence characteristics in rough non-uniform open-channel flow. Proc. Inst. Civ. Eng.-Water Marit. Energy 1995, 112, 336–348. [Google Scholar] [CrossRef]
- Afzalimehr, H. Effect of non-uniformity of flow on velocity and turbulence intensities over a cobble-bed. Hydrol. Process. Int. J. 2010, 24, 331–341. [Google Scholar] [CrossRef]
- Najafabadi, E.F.; Afzalimehr, H.; Rowiński, P.M. Flow structure through a fluvial pool-riffle sequence–Case study. J. Hydro-Environ. Res. 2018, 19, 1–15. [Google Scholar] [CrossRef]
- Coles, D. The law of the wake in the turbulent boundary layer. J. Fluid Mech. 1956, 1, 191–226. [Google Scholar] [CrossRef] [Green Version]
- Thornton, C.I.; Abt, S.R.; Morris, C.E.; Fischenich, J.C. Calculating shear stress at channel-overbank interfaces in straight channels with vegetated floodplains. J. Hydraul. Eng. 2000, 126, 929–936. [Google Scholar] [CrossRef]
- MacVicar, B.J.; Rennie, C.D. Lateral distribution of turbulence and secondary currents in non-uniform open channel flow. In Proceedings of the 33rd IAHR Congress: Water Engineering for a Sustainable Environment Hydraulics, Vancouver, BC, Canada, 9–14 August 2009; pp. 1908–1915. [Google Scholar]
Figure 1.
Experimental setup. (a) Vegetated pool; (b) sandy pool; (c) vegetated boundary.

Figure 2.
Distributions of shear velocity determined using two methods: (A) Clauser’s method; (B) the boundary layer method.
Figure 2.
Distributions of shear velocity determined using two methods: (A) Clauser’s method; (B) the boundary layer method.

Figure 3.
Validity of the logarithmic law method. (a) Central axis; (b) Second axis.

Figure 4.
Distributions of stream-wise velocity profiles. Note: green line: central axis over vegetated bed with w/h = 2; black line: central axis over sandy bed with w/h = 2; gray line: central axis over vegetated bed with w/h= 2.7; blue line: second axis over vegetated bed with w/h = 2.
Figure 4.
Distributions of stream-wise velocity profiles. Note: green line: central axis over vegetated bed with w/h = 2; black line: central axis over sandy bed with w/h = 2; gray line: central axis over vegetated bed with w/h= 2.7; blue line: second axis over vegetated bed with w/h = 2.

Figure 5.
Distributions of velocity profiles. Note: green line: central axis over vegetated bed with w/h = 2; black line: central axis over sandy bed with w/h = 2; gray line: central axis over vegetated bed with w/h = 2.7; blue line: second axis over vegetated bed with w/h = 2.
Figure 5.
Distributions of velocity profiles. Note: green line: central axis over vegetated bed with w/h = 2; black line: central axis over sandy bed with w/h = 2; gray line: central axis over vegetated bed with w/h = 2.7; blue line: second axis over vegetated bed with w/h = 2.

Figure 6.
Bursting events in quadrant analysis.

Figure 7.
Distribution of Reynolds shear stress. Note: green line: central axis over vegetated bed with w/h = 2; black line: central axis over sandy bed with w/h = 2; gray line: central axis over vegetated bed with w/h = 2.7; blue line: second axis over vegetated bed with w/h = 2.
Figure 7.
Distribution of Reynolds shear stress. Note: green line: central axis over vegetated bed with w/h = 2; black line: central axis over sandy bed with w/h = 2; gray line: central axis over vegetated bed with w/h = 2.7; blue line: second axis over vegetated bed with w/h = 2.

Figure 8.
Distribution of stream-wise RMS of turbulence intensity. Note: green line: central axis over vegetated bed with w/h = 2; black line: central axis over sandy bed with w/h = 2; gray line: central axis over vegetated bed with w/h = 2.7; blue line: second axis over vegetated bed with w/h = 2.
Figure 8.
Distribution of stream-wise RMS of turbulence intensity. Note: green line: central axis over vegetated bed with w/h = 2; black line: central axis over sandy bed with w/h = 2; gray line: central axis over vegetated bed with w/h = 2.7; blue line: second axis over vegetated bed with w/h = 2.


Table 1.
Hydraulic conditions of laboratory experiments.
| Q (L/s) | H (m) | W (m) | Uavg (cm/s) | W/H | Re × 104 | Fr |
|---|---|---|---|---|---|---|
| 10 | 0.20 | 0.4 | 12.5 | 2.0 | 2.5 | 0.09 |
| 10 | 0.15 | 0.4 | 16.7 | 2.7 | 2.5 | 0.13 |
Table 2.
Determinations of logarithmic law.
| x | Equation | f | |||
|---|---|---|---|---|---|
| Central Axis | CDF Section | 0.98 | 0.00464 | 0.011 | |
| Middle Sect. | 0.90 | 0.008 | 0.032 | ||
| CAF Section | 0.96 | 0.0108 | 0.059 | ||
| Second Axis | CDF Section | 0.89 | 0.0042 | 0.009 | |
| Middle Sect. | 0.97 | 0.006 | 0.018 | ||
| CAF Section | 0.93 | 0.0105 | 0.058 |
Disclaimer/Publisher’s Note: The statements, opinions and data contained in all publications are solely those of the individual author(s) and contributor(s) and not of MDPI and/or the editor(s). MDPI and/or the editor(s) disclaim responsibility for any injury to people or property resulting from any ideas, methods, instructions or products referred to in the content. |
© 2023 by the authors. Licensee MDPI, Basel, Switzerland. This article is an open access article distributed under the terms and conditions of the Creative Commons Attribution (CC BY) license (https://creativecommons.org/licenses/by/4.0/).
Share and Cite
MDPI and ACS Style
Parvizi, P.; Afzalimehr, H.; Sui, J.; Raeisifar, H.R.; Eftekhari, A.R. Characteristics of Shallow Flows in a Vegetated Pool—An Experimental Study. Water 2023, 15, 205. https://doi.org/10.3390/w15010205
AMA Style
Parvizi P, Afzalimehr H, Sui J, Raeisifar HR, Eftekhari AR. Characteristics of Shallow Flows in a Vegetated Pool—An Experimental Study. Water. 2023; 15(1):205. https://doi.org/10.3390/w15010205
Chicago/Turabian StyleParvizi, Parsa, Hossein Afzalimehr, Jueyi Sui, Hamid Reza Raeisifar, and Ali Reza Eftekhari. 2023. "Characteristics of Shallow Flows in a Vegetated Pool—An Experimental Study" Water 15, no. 1: 205. https://doi.org/10.3390/w15010205
Note that from the first issue of 2016, this journal uses article numbers instead of page numbers. See further details here.