
The Effect of Multi-Source DEM Accuracy on the Optimal Catchment Area Threshold
1
College of Civil and Hydraulic Engineering, Ningxia University, Yinchuan 750021, China
2
College of Civil Engineering and Architecture, Zhejiang University of Water Resources and Electric Power, Hangzhou 310018, China
3
Zhejiang Institute of Water Resources and Ocean Engineering, Hangzhou 310018, China
*
Author to whom correspondence should be addressed.
Water 2023, 15(1), 209; https://doi.org/10.3390/w15010209
Submission received: 4 November 2022
/
Revised: 22 December 2022
/
Accepted: 27 December 2022
/
Published: 3 January 2023
(This article belongs to the Special Issue Artificial Intelligence, Machine Learning and Digital Innovation in Water Management)
Abstract
:This study attempts to investigate the relationship between the accuracy of different Digital Elevation Model (DEM) and fractal dimension D and to solve the problem of determining the optimal catchment area threshold in plain watersheds. In this study, the fractal dimensions of the Shuttle Radar Topographic Survey Digital Elevation Model (SRTM) V4.1 DEM, Hydrology 1K (HYDRO1K) DEM, and Advanced Spaceborne Thermal Emission and Reflection Radiometer Global Digital Elevation Model (ASTER GDEM) with 90 m horizontal resolution and 30 m ASTER GDEM were calculated using the box dimension method, and the relationship between the horizontal resolution and accuracy of three data sources and fractal dimension D was studied. The optimal catchment area threshold in the study area was determined. The response of river network similarity and topographic features to DEM accuracy was explored, and the optimal catchment area threshold for the study area was verified. The result shows that, with the increase in the catchment area threshold, the fractal dimension D shows three stages of rapid decline, gentle fluctuation, and tend to 1. Compared with the horizontal resolution of DEM, the vertical accuracy has more influence on the fractal dimension D. The fractal dimension D accuracy increases with the increase in the vertical accuracy of DEM. The main order of influence of the three data sources is SRTM V4.1 DEM > ASTER GDEM > HYDRO1K DEM. The fractal dimension of the digital river network extracted by SRTM V4.1 DEM is 1.0245, the same as the fractal dimension of the actual river network. The optimal catchment area threshold of the study area is 4.05 km2, which has the highest coincidence with the actual river network. In summary, using the SRTM V4.1 DEM as the DEM data source is feasible to determine the optimal catchment area threshold in plain watersheds.
1. Introduction
Extracting river network using DEM is the primary part of building a hydrological distributed model. Determining the optimal catchment area threshold is the focus of river network extraction. The box dimension method is more efficient and accurate than other methods for calculating the optimal catchment area threshold, such as the mean-variable-point method and the river network density method. It can effectively describe the self-similarity of the river network and improve the accuracy of the catchment area threshold. Therefore, calculating the fractal dimension D by the box dimension method and comparing it with the fractal dimension of the actual river network is an important method to determine the optimal catchment area threshold [1,2,3,4].
The catchment area threshold is the minimum catchment area required to support the permanent existence of a river [5]. The river network extracted from the same basin under different catchment area thresholds has self-similarity, which is consistent with fractal theory and can be described by fractal dimension. Lin [6] proposed to use the value at the inflection point of the catchment area threshold as the fractal dimension of the study area; Wang [7] studied the relationship between fractal dimension and catchment area threshold based on Horton’s theorem, presented using the point where the fractal dimension tends to be flat as the optimal catchment area threshold.
Meanwhile, the database of DEM is an integral part of the study of topographic elements and hydrological parameters [8]. The global DEM data currently free to download and widely used include SRTM DEM, HYDRO1K DEM, and ASTER GDEM. Parameter differences in horizontal resolution and vertical accuracy exist between different DEM data sources, affecting grid extraction accuracy [9]. The increase in the grid increases the arbitrariness of the flow determination in the flatlands, and the decrease in the accuracy leads to the decrease in the number of grids exceeding the catchment area threshold, which changes the catchment area threshold and affects the basin characteristics of the digital river network. The current study mainly focuses on the same DEM data source and resamples it by the bilinear method [10], cubic convolution method [11], and nearest neighbor method [12] to generate DEM with different resolutions to investigate the effect of horizontal resolution on watershed characteristics. The DEM accuracy is more sensitive for rivers with large topographic relief, so the research focuses on highland areas, such as the Tibetan Plateau [13,14,15] and the Zagros Mountains [16,17]. Esmaeel [18] studied the effect of resolution on the flood characteristics of the Atrak River basin in Iran.
A great deal of research has been conducted by scholars to address the uncertainty of the sought event. Sharafati [19] used the SWAT-CUP model in the calibration and validation phase while introducing frequency analysis to improve the accuracy of the calculation results; Gaur [20] used the analysis of variance (ANOVA) technique for early warning of flood response; Ehteram [21] performed evolutionary algorithms and multi-criteria decision making for climate change uncertainty. Cai [22] used the stability index to evaluate the reasonableness of the threshold; Lu [23] proposed a moderate index method to deduce the optimal catchment area using the blue line river network. Based on this, Zhang [24] established a complete system to test the reasonableness of thresholds in the case of river networks without the “Blue Line”, using the number of water system sub-dimensions as the judgment index. Abbasian [25] used copulas to develop a bivariate drought index of precipitation-temperature decile index (PTDI) to assess future changes in dry/heat conditions. Ömer E. [26] investigated the combined effects of data length, spin-up period, and spatial resolution on meso-scale hydrological model. Results show it can reduce the computational burden, and streamflow could be reasonably simulated.
Based on the above studies, the following problems are found: (1) The accuracy studies of DEM focus on horizontal resolution, and there are few studies on different vertical accuracies among multi-source DEM. (2) There are more studies for cases with large topographic undulations and fewer studies for plain areas. (3) To determine the optimal catchment area threshold by studying the relationship between the fractal dimension D and the accuracy of different DEM data sources, few scholars have conducted corresponding studies; (4) The evaluation of the reasonableness of the threshold value is relatively small, and it is not combined with the influence of topographic factors.
This work’s primary goal is to investigate the effects of the horizontal resolution and vertical accuracy of different DEM data sources on the fractal dimension. The box dimension method is used to determine the optimal catchment area threshold in the study area. The response of river network similarity and topographic features to DEM accuracy are explored to evaluate the reasonableness of the optimal catchment area threshold in the study area.
2. Data Sources and Methods
2.1. Overview of the Study Area
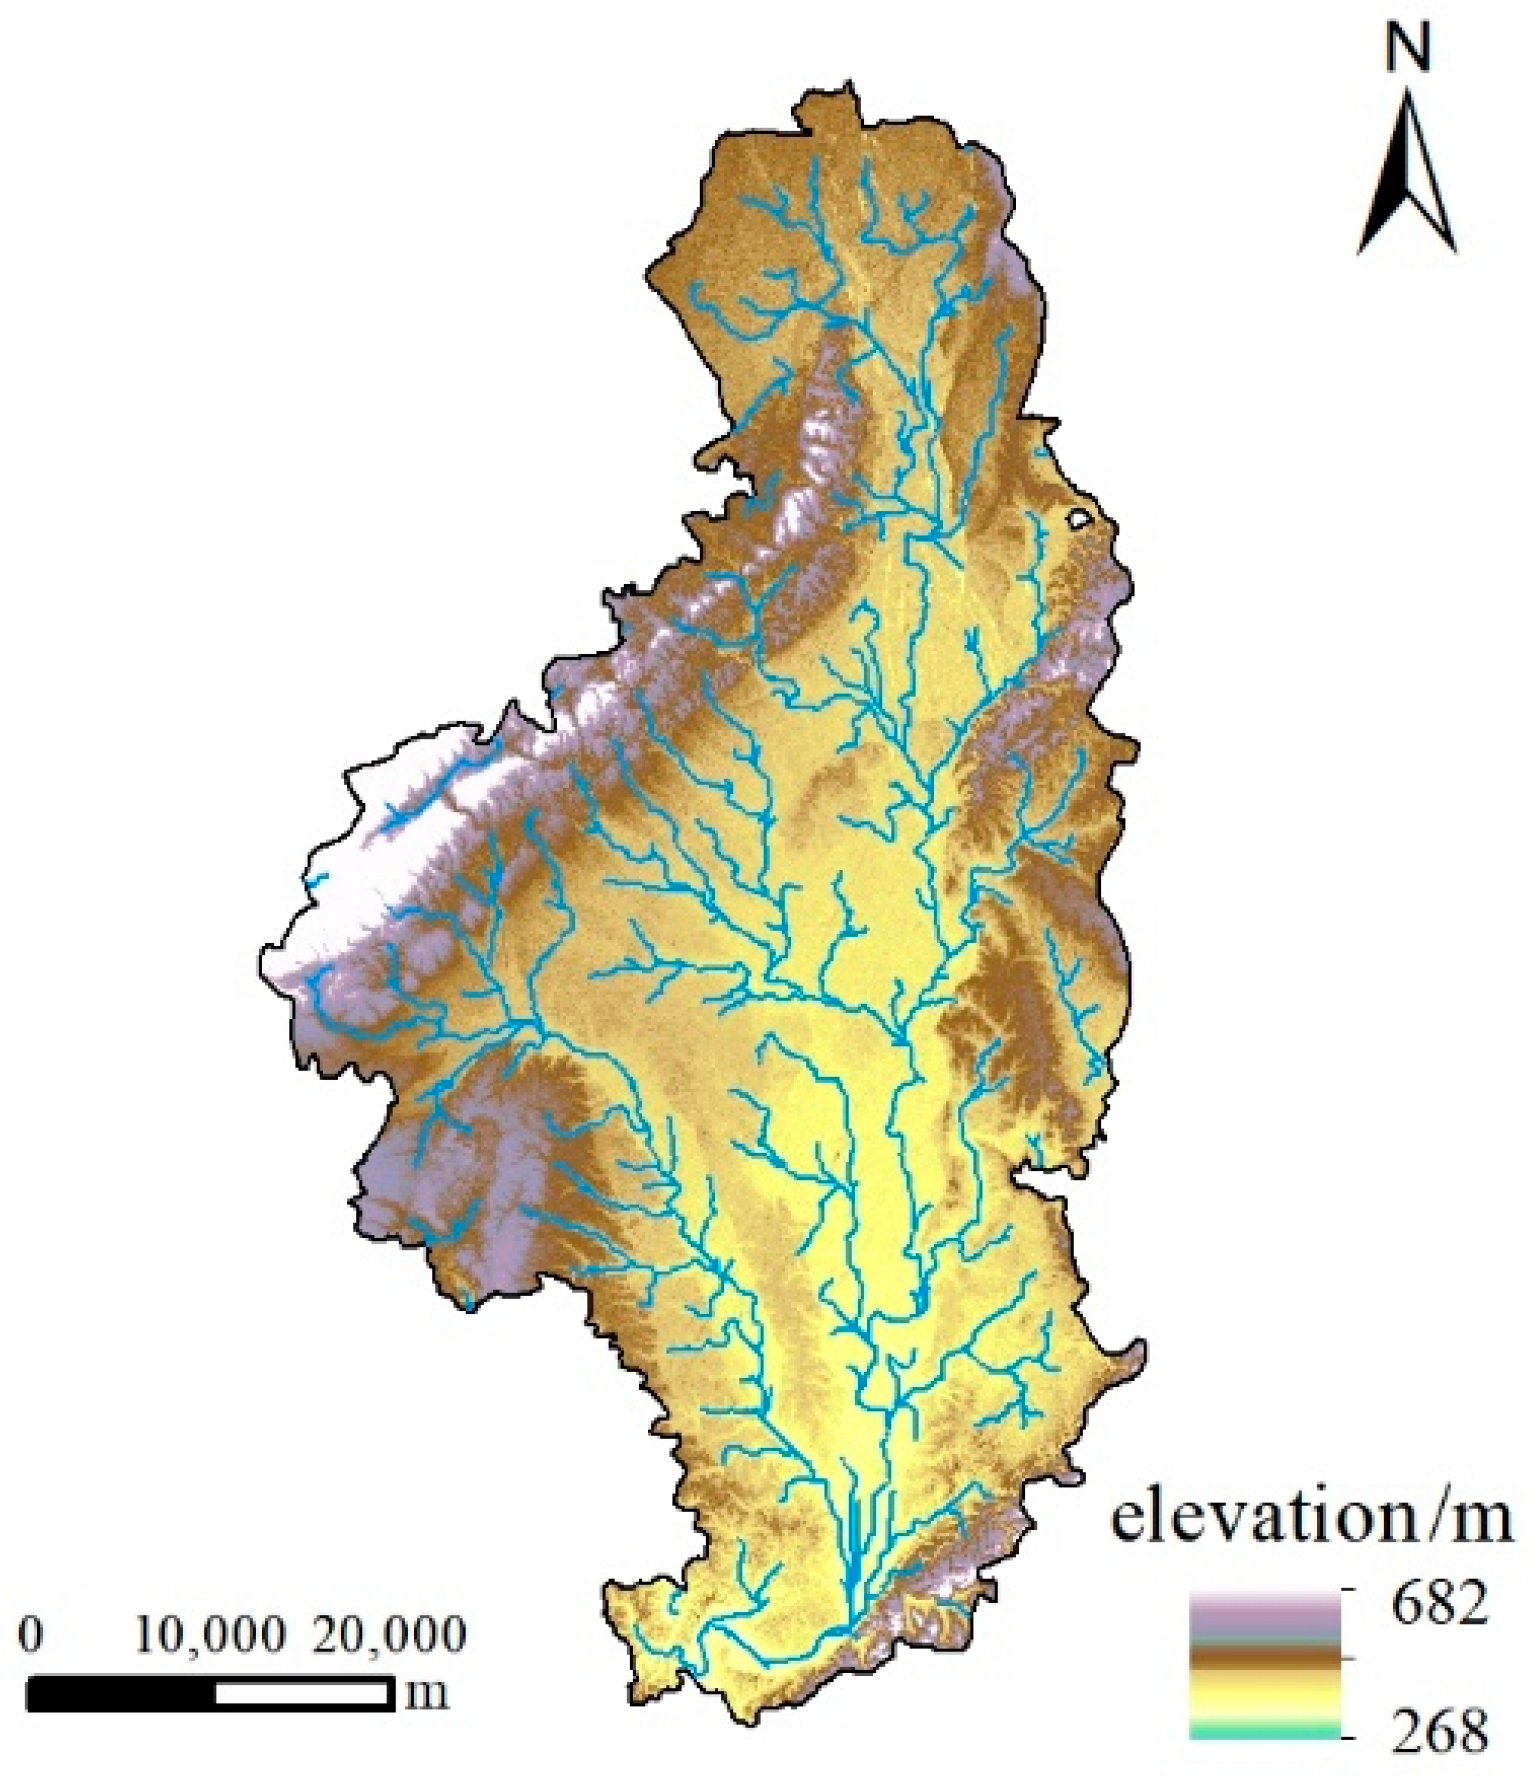
The research object of this paper is the water source area of Tongjiyan, which is located in the middle section of Minjiang River, in the middle of Chengdu Plain, with geographical coordinates between 103°41’~103°55’ E and 29°51’~30°27’ N, spanning Chengdu and Meishan cities from north to south. The watershed covers an area of 772.6 km2, with an average annual precipitation of 1024 mm and average annual evaporation of 781 mm, with rain and heat in the same season. The main geomorphological form is mainly plains and hills, with an elevation of 268~682 m and slight topographic undulation. The water system in the region is well developed, including the mainstream Minjiang River and its tributaries, Simeng River, Mao River, and Liquan River, forming a large irrigation area. The actual river network shape is determined, the corresponding digital river network is unique, and the fractal dimension of the water system is also uniquely determined. The accurate water system fractal dimension should be calculated from the actual river network to obtain. Based on the 1:50,000 topographic map obtained from the local hydrological management office and digitized by ARCGIS map, the actual river network in the water source area of Tongjiyan was extracted, as shown in Figure 1.
2.2. Data Sources and Pre-Processing
The three types of DEM data include ASTER GDEM, SRTM V4.1 DEM, and HYDRO1K DEM. Specific data are presented in Table 1. The first two types of data originated from the Geospatial Data Cloud of the Computer Network Information Center of the Chinese Academy of Sciences. ASTER GDEM has a horizontal resolution of 30 m, a vertical accuracy of ±20 m, and a horizontal accuracy of ±30 m. SRTM V4.1 has a horizontal resolution of 90 m, a nominal absolute elevation accuracy of ±16 m, and a nominal absolute plane accuracy of ±20 m. HYDRO1K was based on the global DEM GTOPO30 with multi-source data, combined with the Digital Chart of the World (DGW) basin network and boundaries, with enhanced hydrological characteristics.
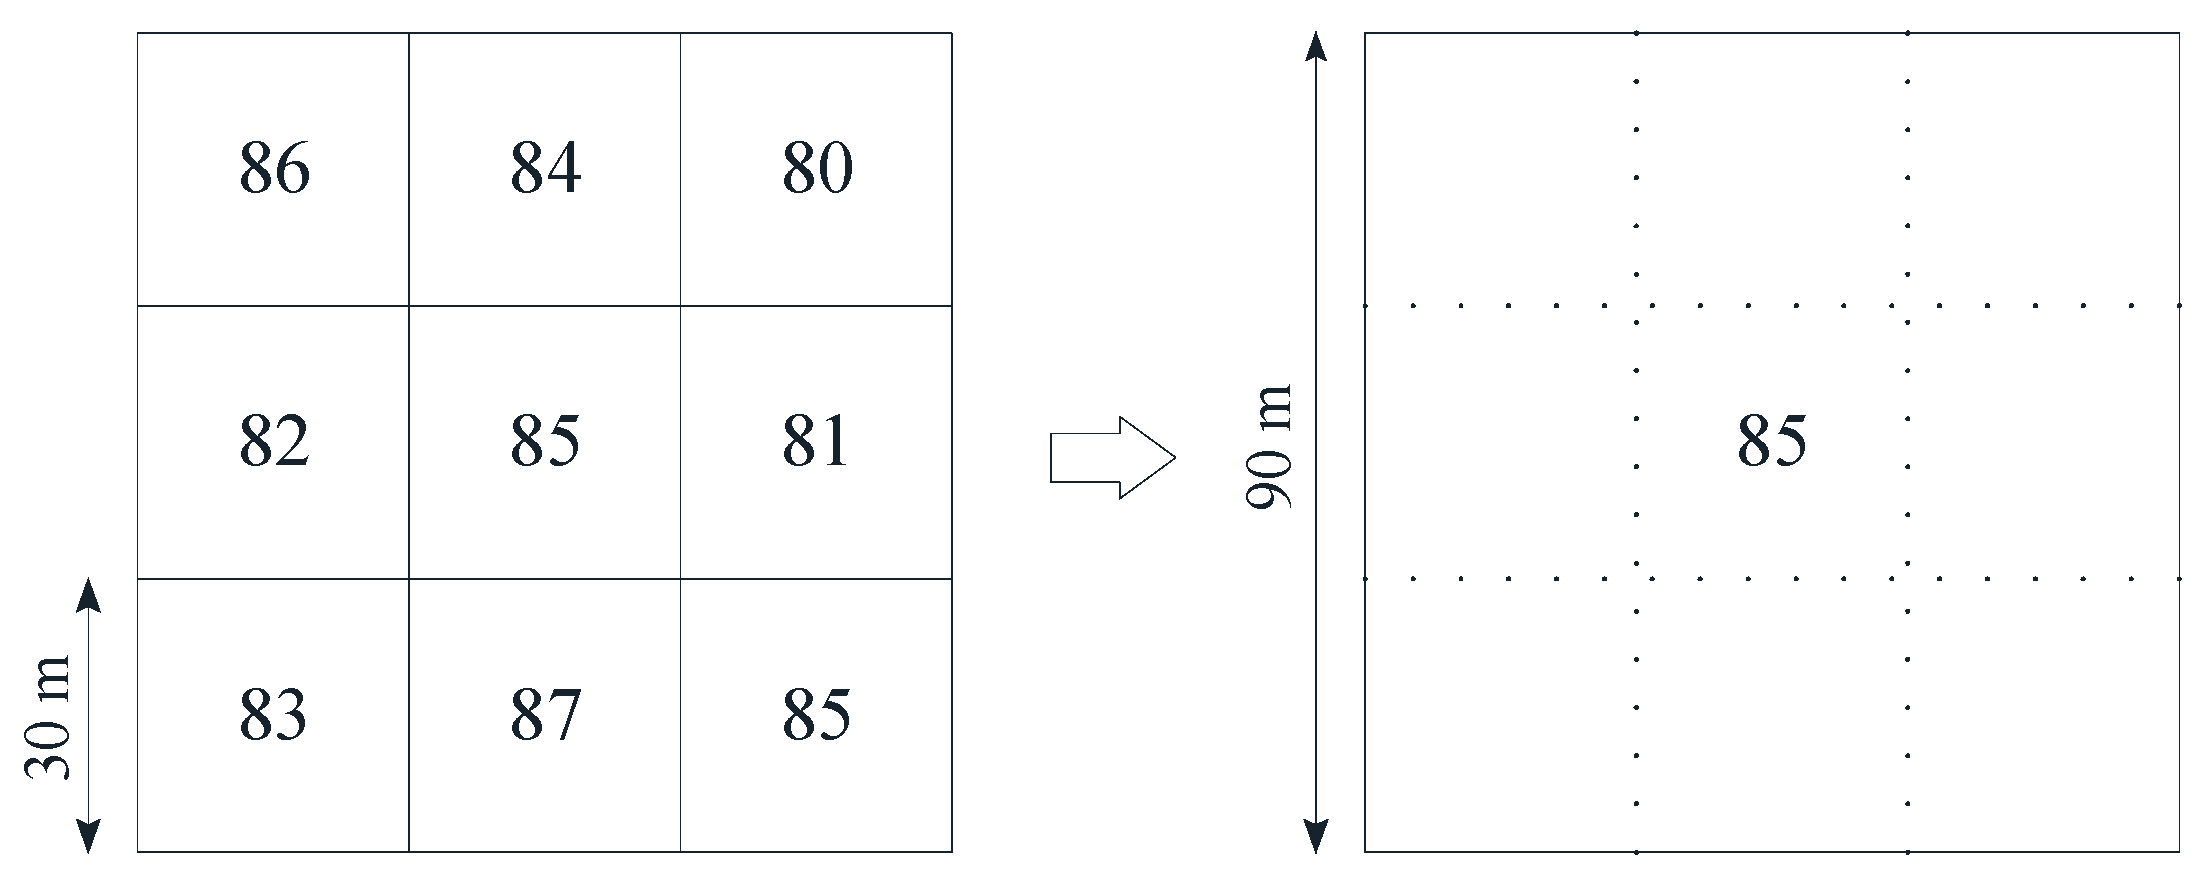
Meanwhile, in order to eliminate the influence of the horizontal resolution of the DEM, the nearest neighbor assignment method is used. The biggest advantage of this method is that it does not change any values of the cells in the input raster dataset and guarantees the DEM accuracy. Resampling of 30 m resolution into 90 m ASTER GDEM and HYDRO1K DEM in Figure 2.
2.3. River Network Extraction Method
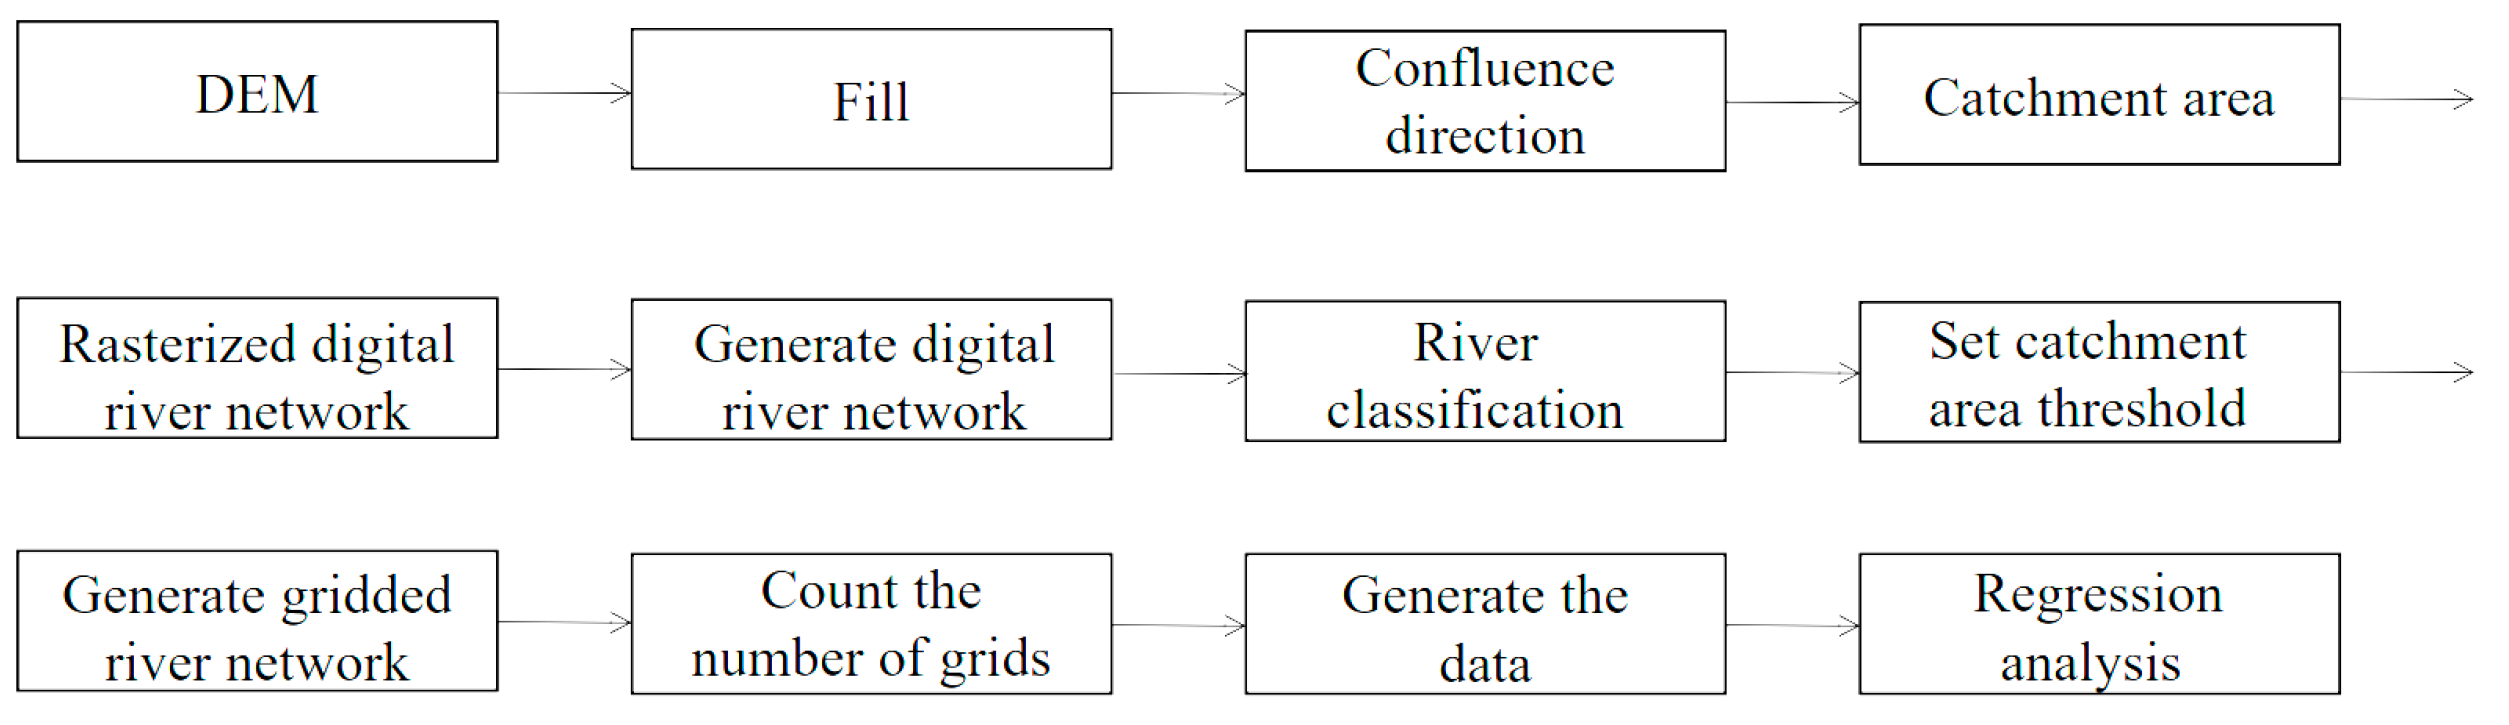
In Figure 3, the process of extracting the river network using ArcGIS software hydrological analysis tool includes the following four main processes: terrain pre-processing, determining the flow direction, generating confluence raster, and river network extraction.
Topographic pre-processing. Most of the original DEM data have depressions or spikes, which can cause the extracted water system to break or flow in the wrong direction, so the original DEM data need to be filled with depressions while cutting little local peaks, that is, “cutting peaks and filling valleys”.
ArcGIS software uses the single flow direction D8 algorithm, which uses the numbers 1, 2, 4, 8, 16, 32, 64, and 128 to represent the 8 directions of east, southeast, south, southwest, west, northwest, north, and northeast, and takes the center raster as the reference, calculates the distance power difference with the surrounding raster, and sets the largest result as the outflow. The largest result is set as the outflow position. The flow direction raster data are generated.
Generate the sink raster. The cumulative value per water unit can be generated by entering the flow direction raster file in ArcGIS hydrological analysis tools. The value of the raster cell in the basin reflects the strength of the convergence ability of the water flow. The larger the value, the more water flows to the raster, and the easier the basin is to generate surface runoff.
River network extraction. Threshold selection is an essential basis for river network extraction, which directly affects the accuracy of river network extraction. In the “Raster Calculator” tool, we set different thresholds for sink accumulation, screen out the raster that exceeds the sink accumulation threshold, extract the river network, and finally convert the raster-type river network into a vector-type river network.
2.4. Box Dimension Method
The water system calculated by the box dimension method can effectively describe the spatial and hierarchical structure of the water system and river network. The larger the fractal dimension of the water system, the more complex the river network. The research method is mainly to cover the fractal structure with square boxes with side length s, count the number of non-empty square boxes N(s), and obtain the corresponding N(s) value by reducing the value of side length s, and the two are negatively correlated. When s→0, the number of box dimensions is defined as:
where D is the fractal dimension of the fractal object.
In this paper, we use ArcGIS software to extract a digital river network based on 3 kinds of DEM data, rasterize the river network, set the number of catchment area threshold raster (1, 500, 1000, 2000, 3000, 4000, 5000, 6000, 7000, and 8000), and by changing the cell sizes (50, 100, 200, and 500). The absolute value of the slope of the line, which is the corresponding fractal dimension D, is compared with the fractal dimension of the actual river network, and the fractal dimension with the smallest absolute error corresponding to the catchment area threshold is the best result.
2.5. River Network Hedge Differential Evaluation System
River network overlap can effectively quantify the accuracy between different river networks. The ratio of the polygonal area and the basin’s total area is used to calculate the ratio of the overlapping difference between the two river networks. The smaller the value, the better the coincidence of the two water systems. The calculation formula is:
where P is the river network overlap difference; Si is the polygon area produced by the superposition of two river networks; M is the total area of the watershed. The judgment criteria [27] are as follows: when the set difference is less than 2%, the river network has a high degree of coincidence; when the set difference is between 2% and 3%, the degree of coincidence is more satisfactory; when the set difference is greater than 3%, the degree of coincidence is poor.
3. Results and Analysis
3.1. Calculation Results and Analysis of Box Dimension Method
The four DEM data were extracted from the series of threshold river networks in the water source area of Tongjiyan with the set scale-free interval, and the corresponding fractal dimension D and correlation coefficient R2 were calculated using Equation (1). The data are shown in Table 2.
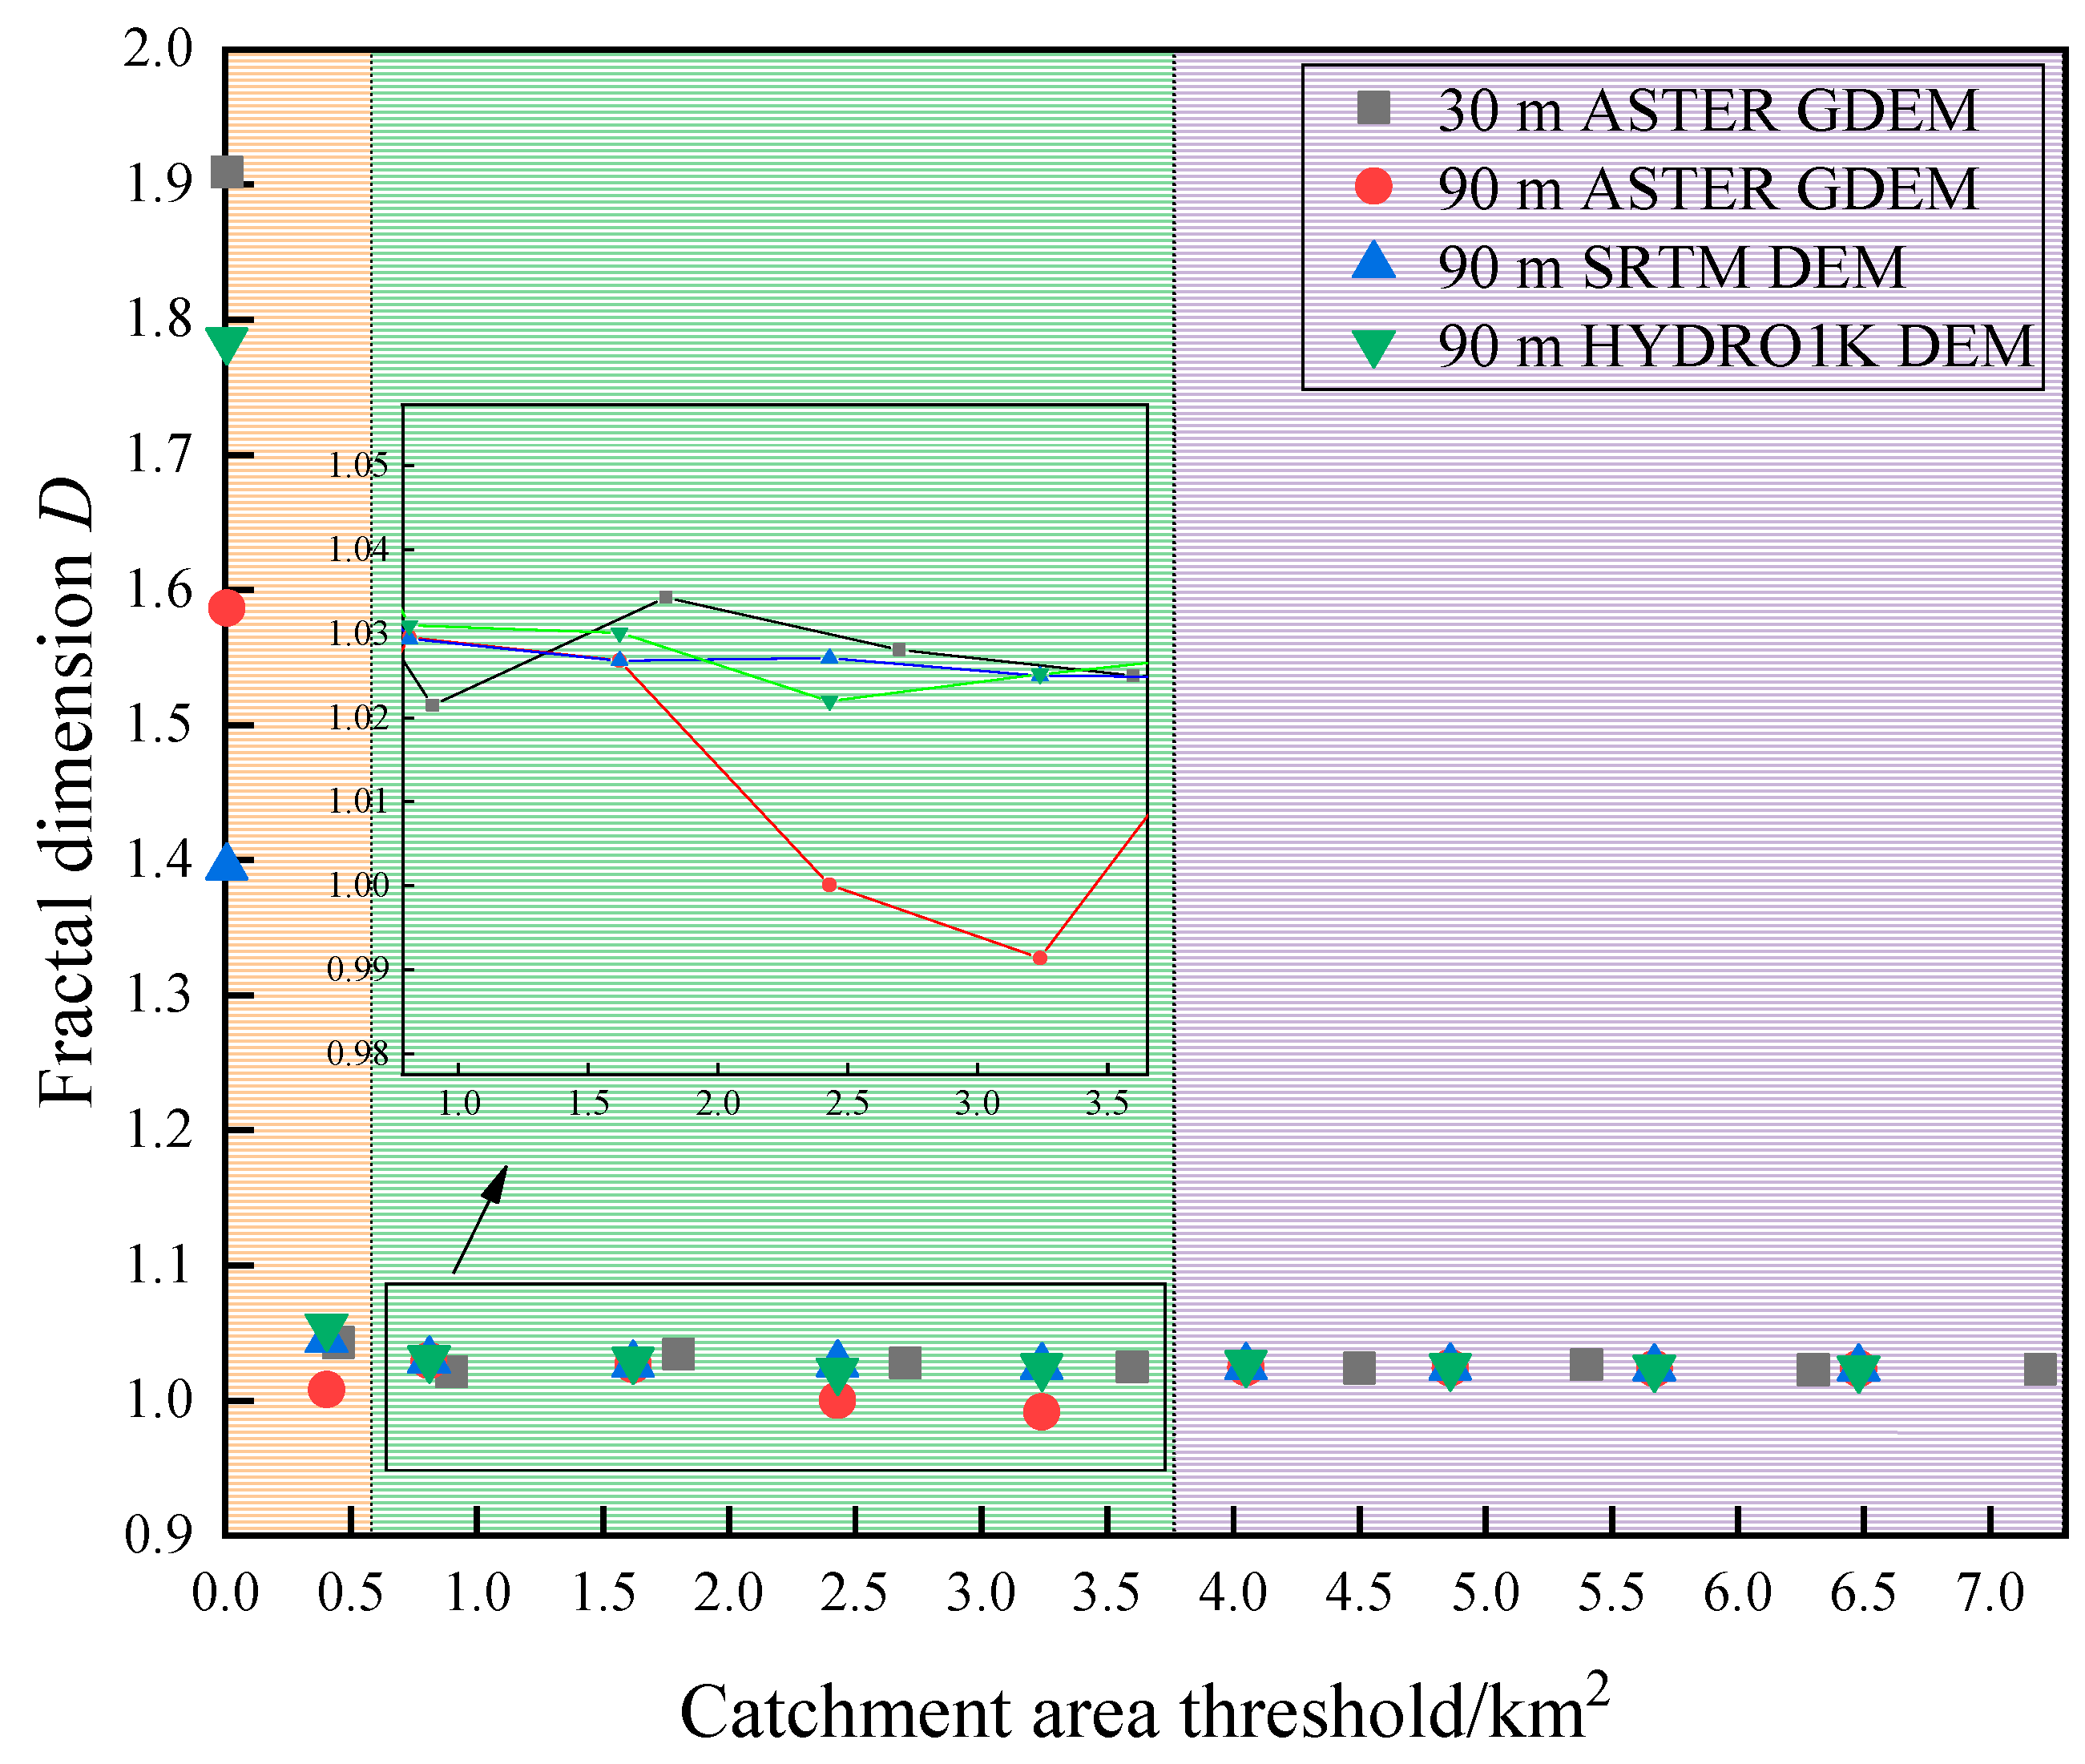
Figure 4 displays the findings of the link between the catchment area threshold and fractal dimension. The four DEM accuracies exhibit the same fractal dimension D trend with catchment area threshold, which can be divided into three stages: rapid decline, gentle fluctuation, and tend to 1. In the rapid decline stage, when the number of catchment raster is 1, the fractal dimension calculated by the three different DEM data has the greatest difference, which is 1.3948 for 90 m SRTM V4.1, 1.5866 for 90 m ASTER GDEM, 1.7845 for 90 m HYDRO1K, and 1.9091 for 30 m ASTER GDEM. The minimum catchment area threshold is 0.0009 km2 for the 30 m accuracy and 0.0081 km2 for the 90 m accuracy. In the gentle fluctuation stage, the change in fractal dimension changes smoothly as the catchment area threshold increases in the range of 0.450–3.600 km2. Decreasing by 0.02 for 90 m SRTMV4.1, 0.0296 for 90 m HYDRO1K, 0.0382 for 90 m ASTER GDEM, and 0.0213 for 30 m ASTER GDEM. The R2 of their fits all reach above 0.9990. Tending to 1 stage, the fractal dimension is basically constant with the increase in the catchment area threshold, and the value tends to 1.
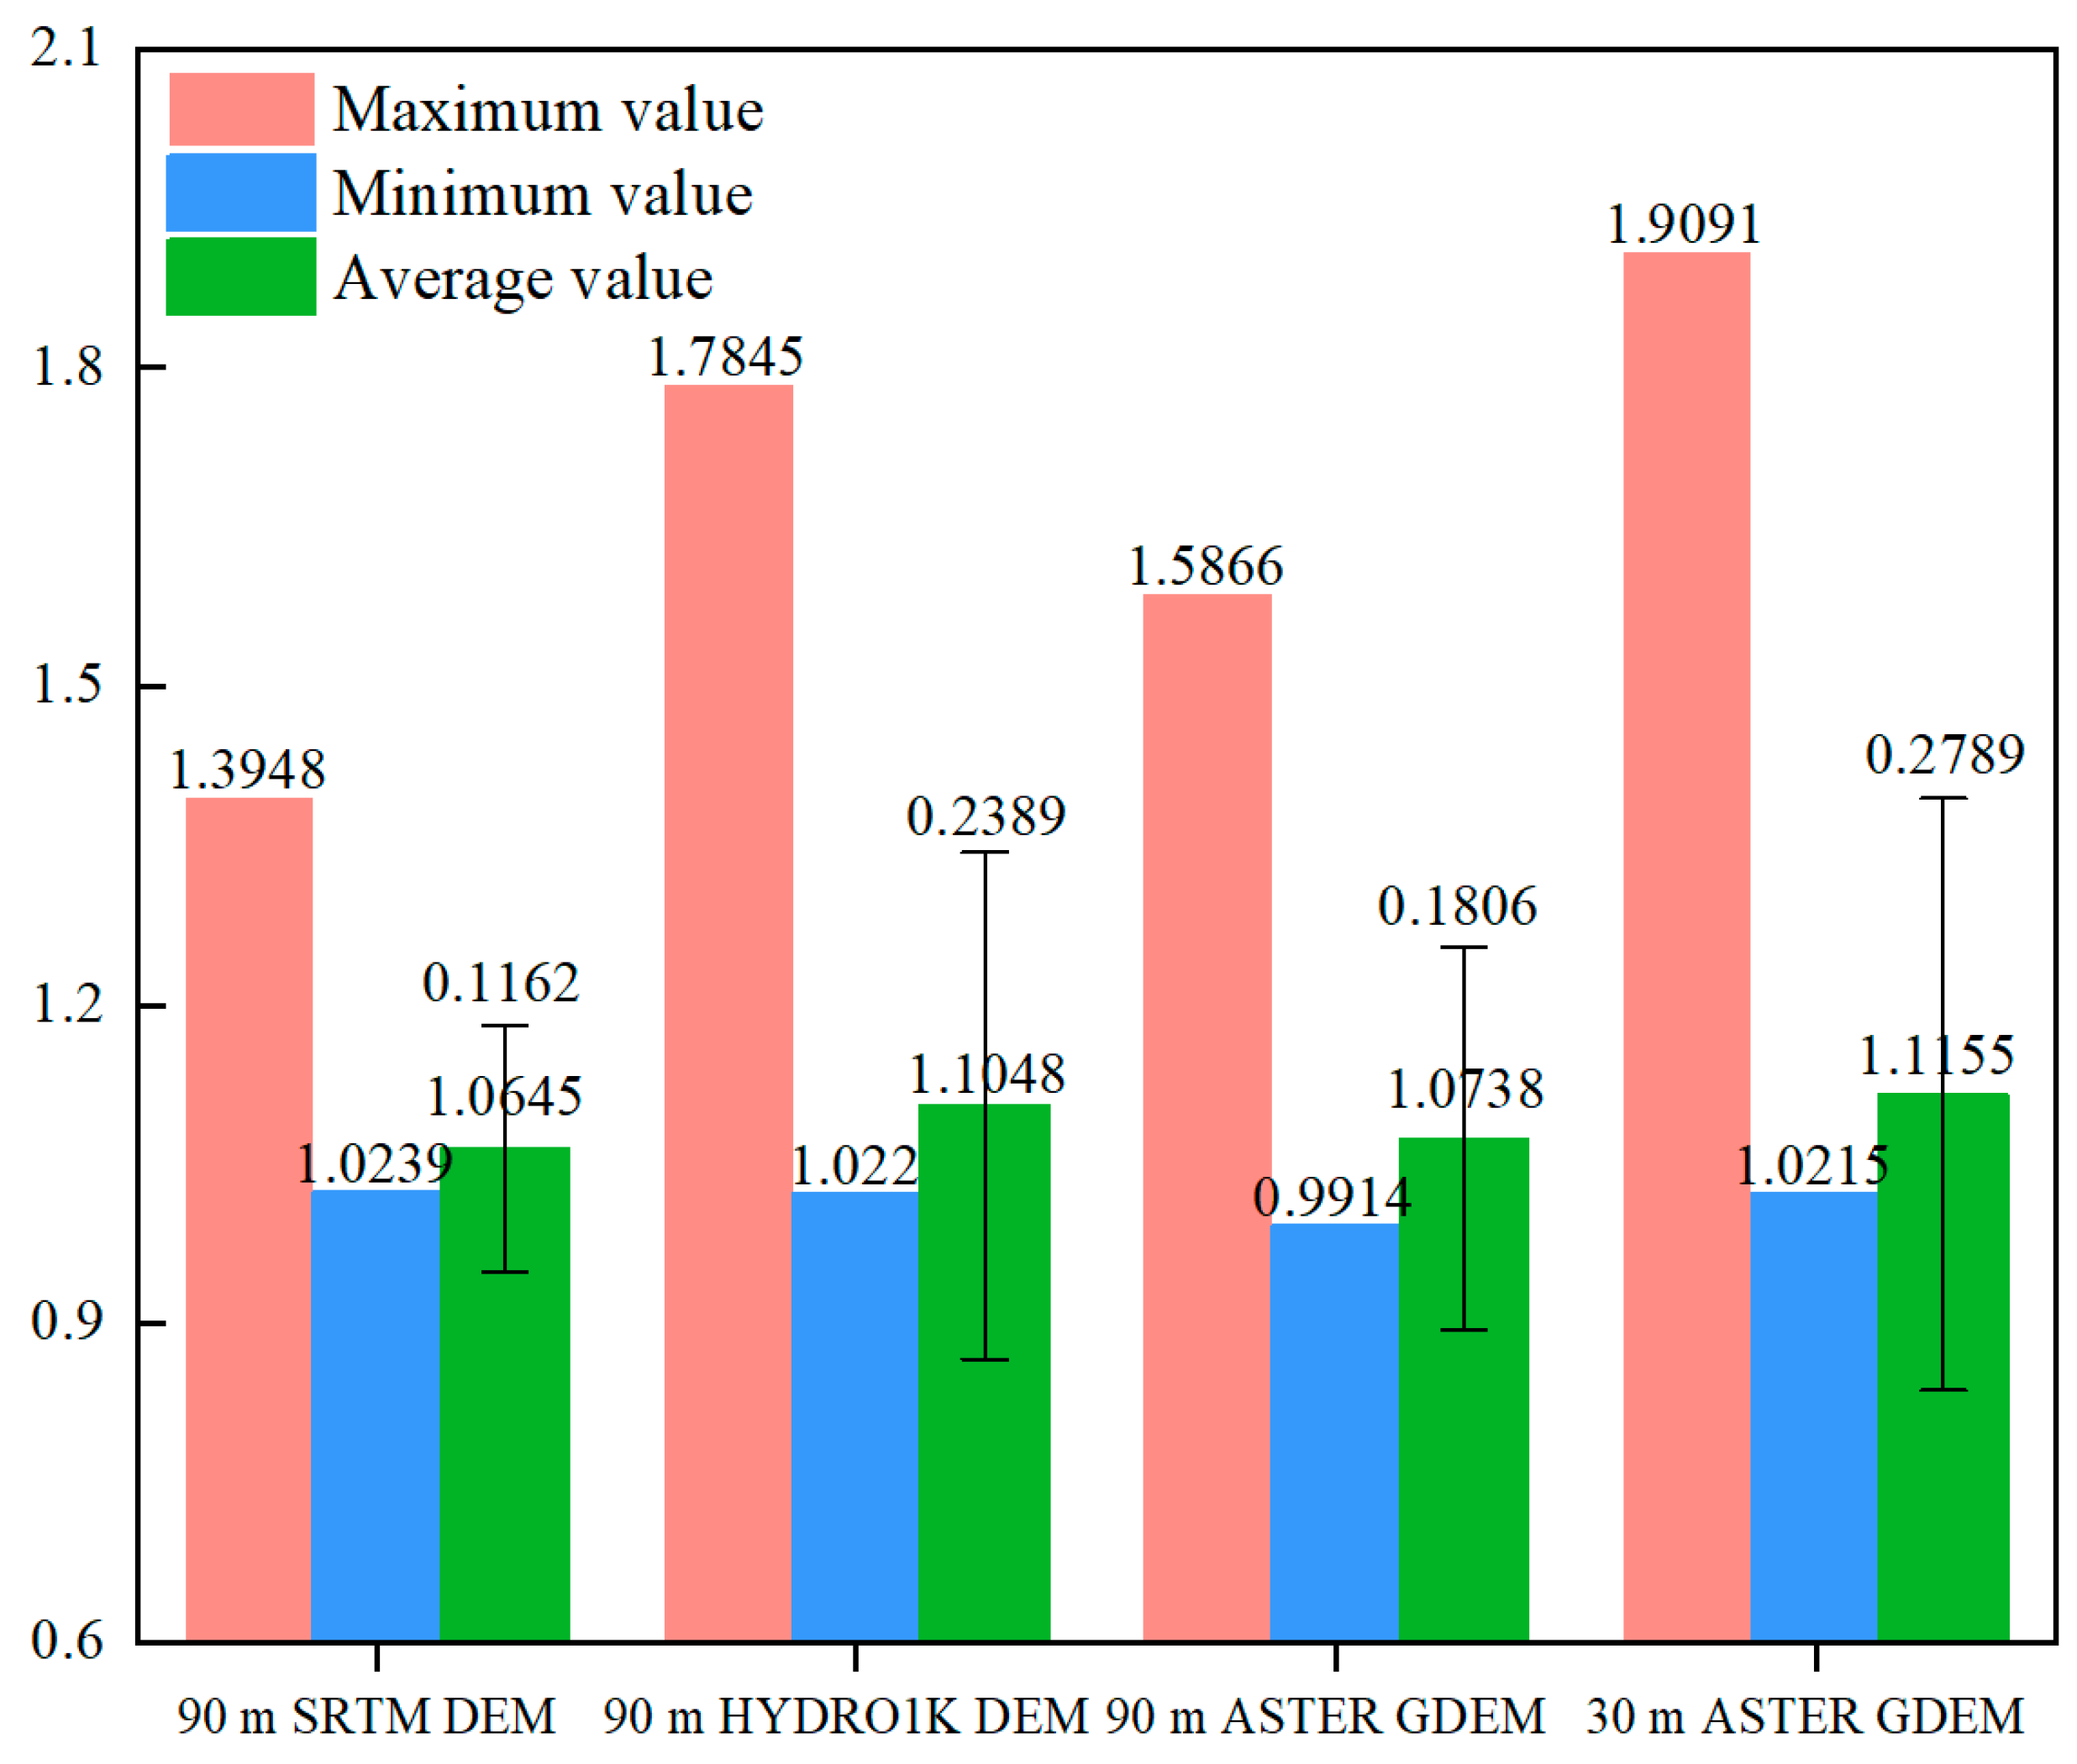
The differences in horizontal resolution and vertical accuracy of different DEM data sources make the extracted river network information differ. In this paper, we use the resampled 90 m ASTER GDEM as an intermediate variable to explore the effects of horizontal resolution and vertical accuracy of DEM on a fractal dimension by calculating the statistical eigenvalues of the fractal dimension of four kinds of DEM data in Figure 5.
The effect of vertical accuracy on the fractal dimension of different DEM (SRTM V4.1, ASTER GDEM, and HYDRO1K) was judged at the same horizontal resolution (90 m). Comparing the fractal dimension calculated by four types of DEM data, it is found that SRTM V4.1 has a more concentrated fractal dimension under the series threshold. Because of the higher vertical accuracy, with a mean squared error of 0.1162, which is 0.42 times higher than that of ASTER GDEM, 0.48 times higher than HYDRO1K. The obtained fractal dimension is more accurate.
The effect of the horizontal resolution of the same DEM (ASTER GDEM) on the fractal dimension was judged under the same vertical accuracy. Comparing the fractal dimensions calculated from the 90 m ASTER GDEM and 30 m ASTER GDEM after resampled, it was found that the fractal dimensions calculated from the 90 m ASTER GDEM varied more smoothly than those from the 30 m ASTER GDEM. The mean squared error was 0.1806, 0.65 times higher than the 30 m ASTER GDEM, with higher fractal dimension accuracy and better resampled effect.
It is found that the vertical accuracy of DEM has more influence on the fractal dimension accuracy than the horizontal resolution. The fractal dimension D increases with the increase in the vertical accuracy of DEM. The influence of DEM data sources’ accuracy on the fractal dimension is SRTM V4.1 > ASTER GDEM > HYDRO1K.
3.2. Selection of Optimal Catchment Area Thresholds for Watersheds
When determining the optimal catchment area threshold using the box dimension method, selecting different DEM data sources will result in different river networks, which is highly arbitrary. Therefore, an accurate catchment area threshold should be determined for a watershed.
As shown in Table 3, the fractal dimension of the three DEM data sources calculated under the set threshold was compared with that of the actual river network to determine the optimal catchment area threshold for each DEM dataset. SRTM V4.1 data were calculated with a fractal dimension of 1.0245, which is consistent with the actual river network, and the optimal catchment area threshold is 4.05 km2. Therefore, 4.05 km2 is the optimal catchment threshold for the water source area of Tongjiyan. However, the fractal dimensions calculated by the three DEM data are very close to each other, so the reasonableness of the optimal catchment area threshold is evaluated.
3.3. Evaluation of the Reasonableness of the Optimal Catchment Area Threshold
The accuracy of the extracted digital river network reflects the optimal catchment area thresholds calculated by different DEM data sources. The reasonableness of the catchment area thresholds is evaluated by comparing the similarity of the river network and the response of topographic features to the DEM accuracy. When the higher the accuracy of DEM, the smaller the set difference calculation results, the more obvious the influence on the topographic factor, and the greater the undulation.
3.3.1. Similarity of River Network
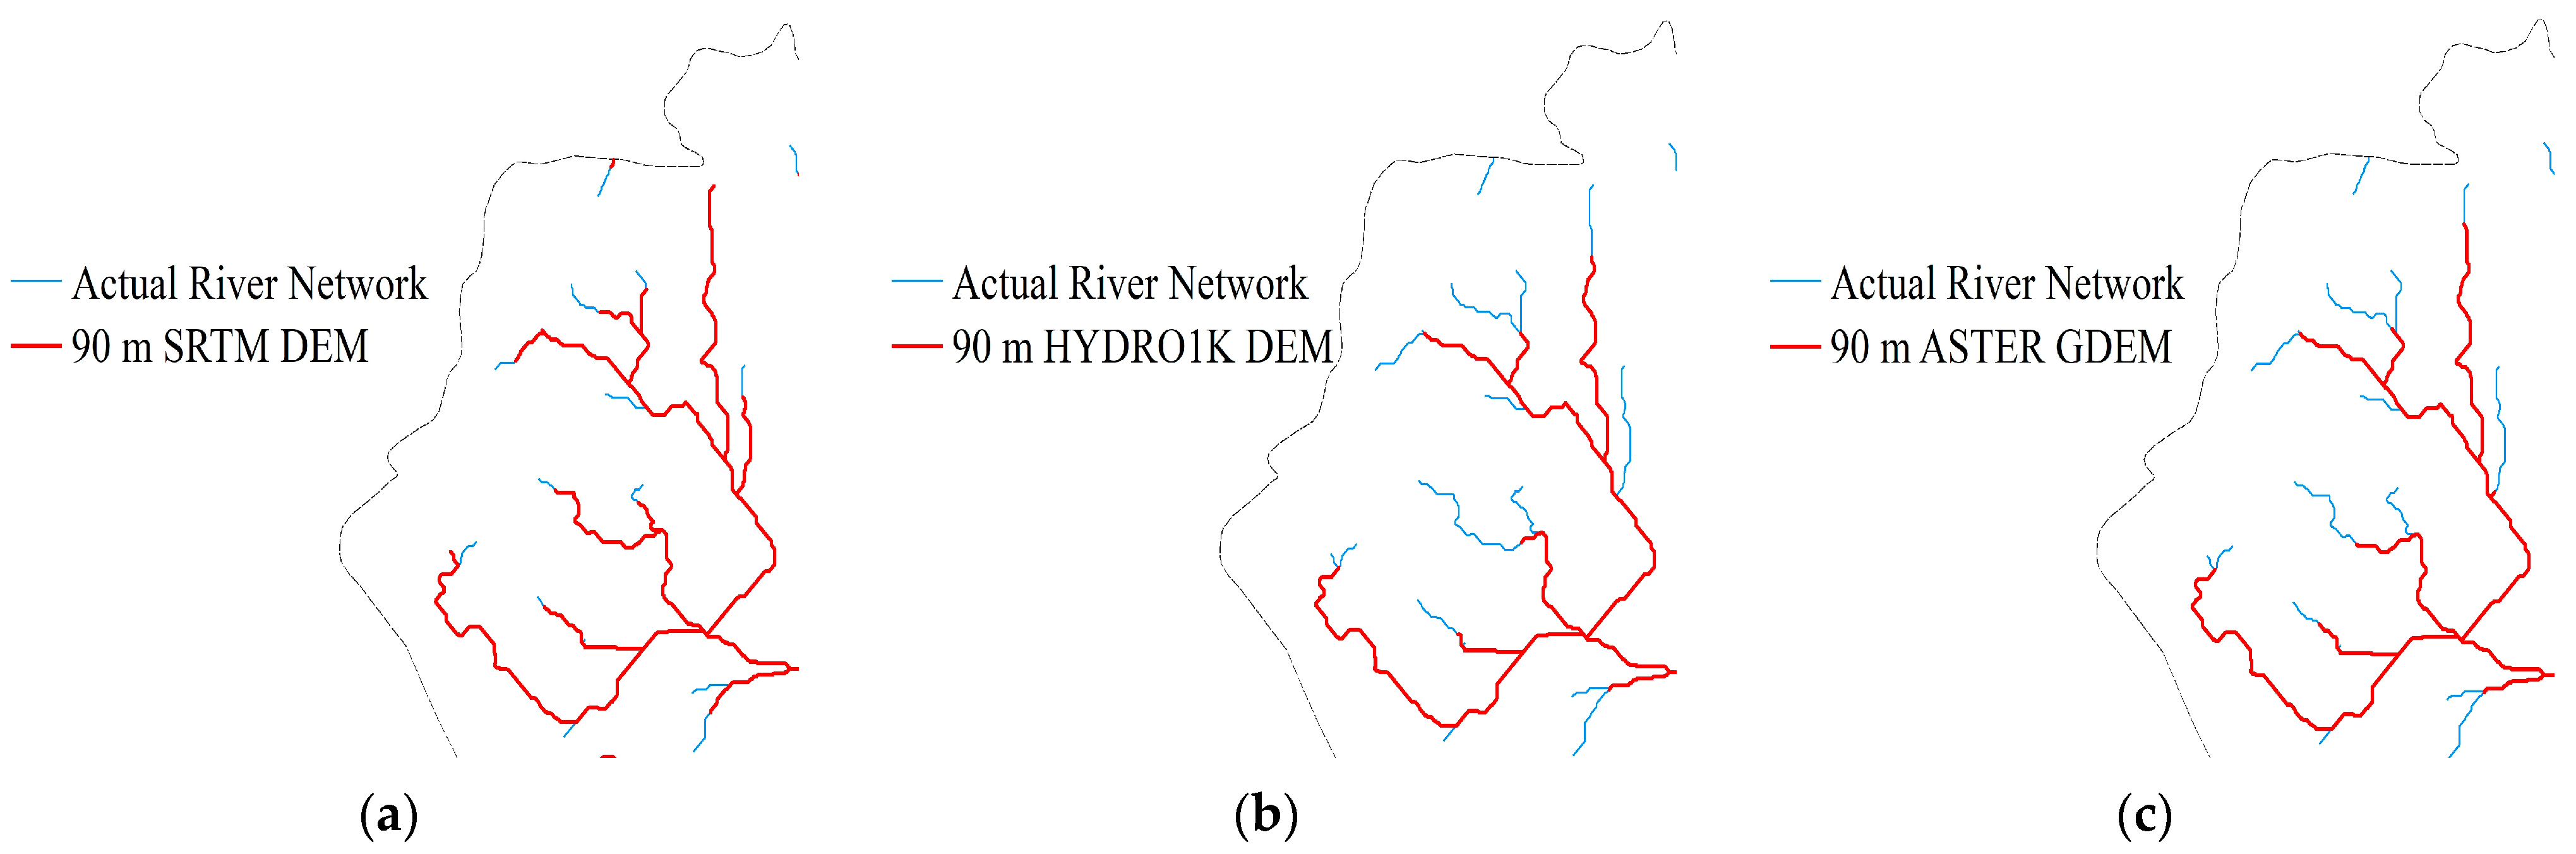
In contrast with the actual river network, the digital river network was created using the best catchment area threshold from the corresponding three DEM data sources. Local fine tributaries indicate the overlaid effect because the mainstem river network is mostly consistent with one another, as seen in Figure 6. The finest superimposed effect with the actual river network is produced by the SRTM V4.1, followed by the ASTER GDEM, while the poorest superimposed effect is produced by the HYDRO1K.
The polygon area of the digital river network extracted by the three DEM accuracies and the actual river network superimposed on each other were counted. The values of the overlapping difference were calculated by introducing Equation (2). The results are shown in Table 4. The overlapping difference of the river network calculated by the digital river network extracted by the three DEM accuracies under the optimal catchment area threshold is small. The polygon area generated by the SRTM V4.1 is 6.93 km2, and the catchment area is 772.08 km2. The river network overlap calculated by the ASTER GDEM is 2.306%, which is satisfactory and good; the river network overlap calculated by the HYDRO1K is 2.763%, which is poor. The river network overlap difference calculated by SRTM V4.1 is 0.39 times of ASTER GDEM and 0.32 times of HYDRO1K. The extracted digital river network is the most accurate. It best matches the actual river network, which effectively verifies the reasonableness of the optimal catchment area threshold in the water source area of Tongjiyan.
3.3.2. Response of Terrain Features to DEM Accuracy
Different DEM accuracy directly affects the topographic characteristics of the study area and indirectly affects the determination of the optimal catchment area threshold. By studying the slope and elevation variations extracted from different DEM data sources, the optimal catchment area threshold for the study area is evaluated for reasonableness.
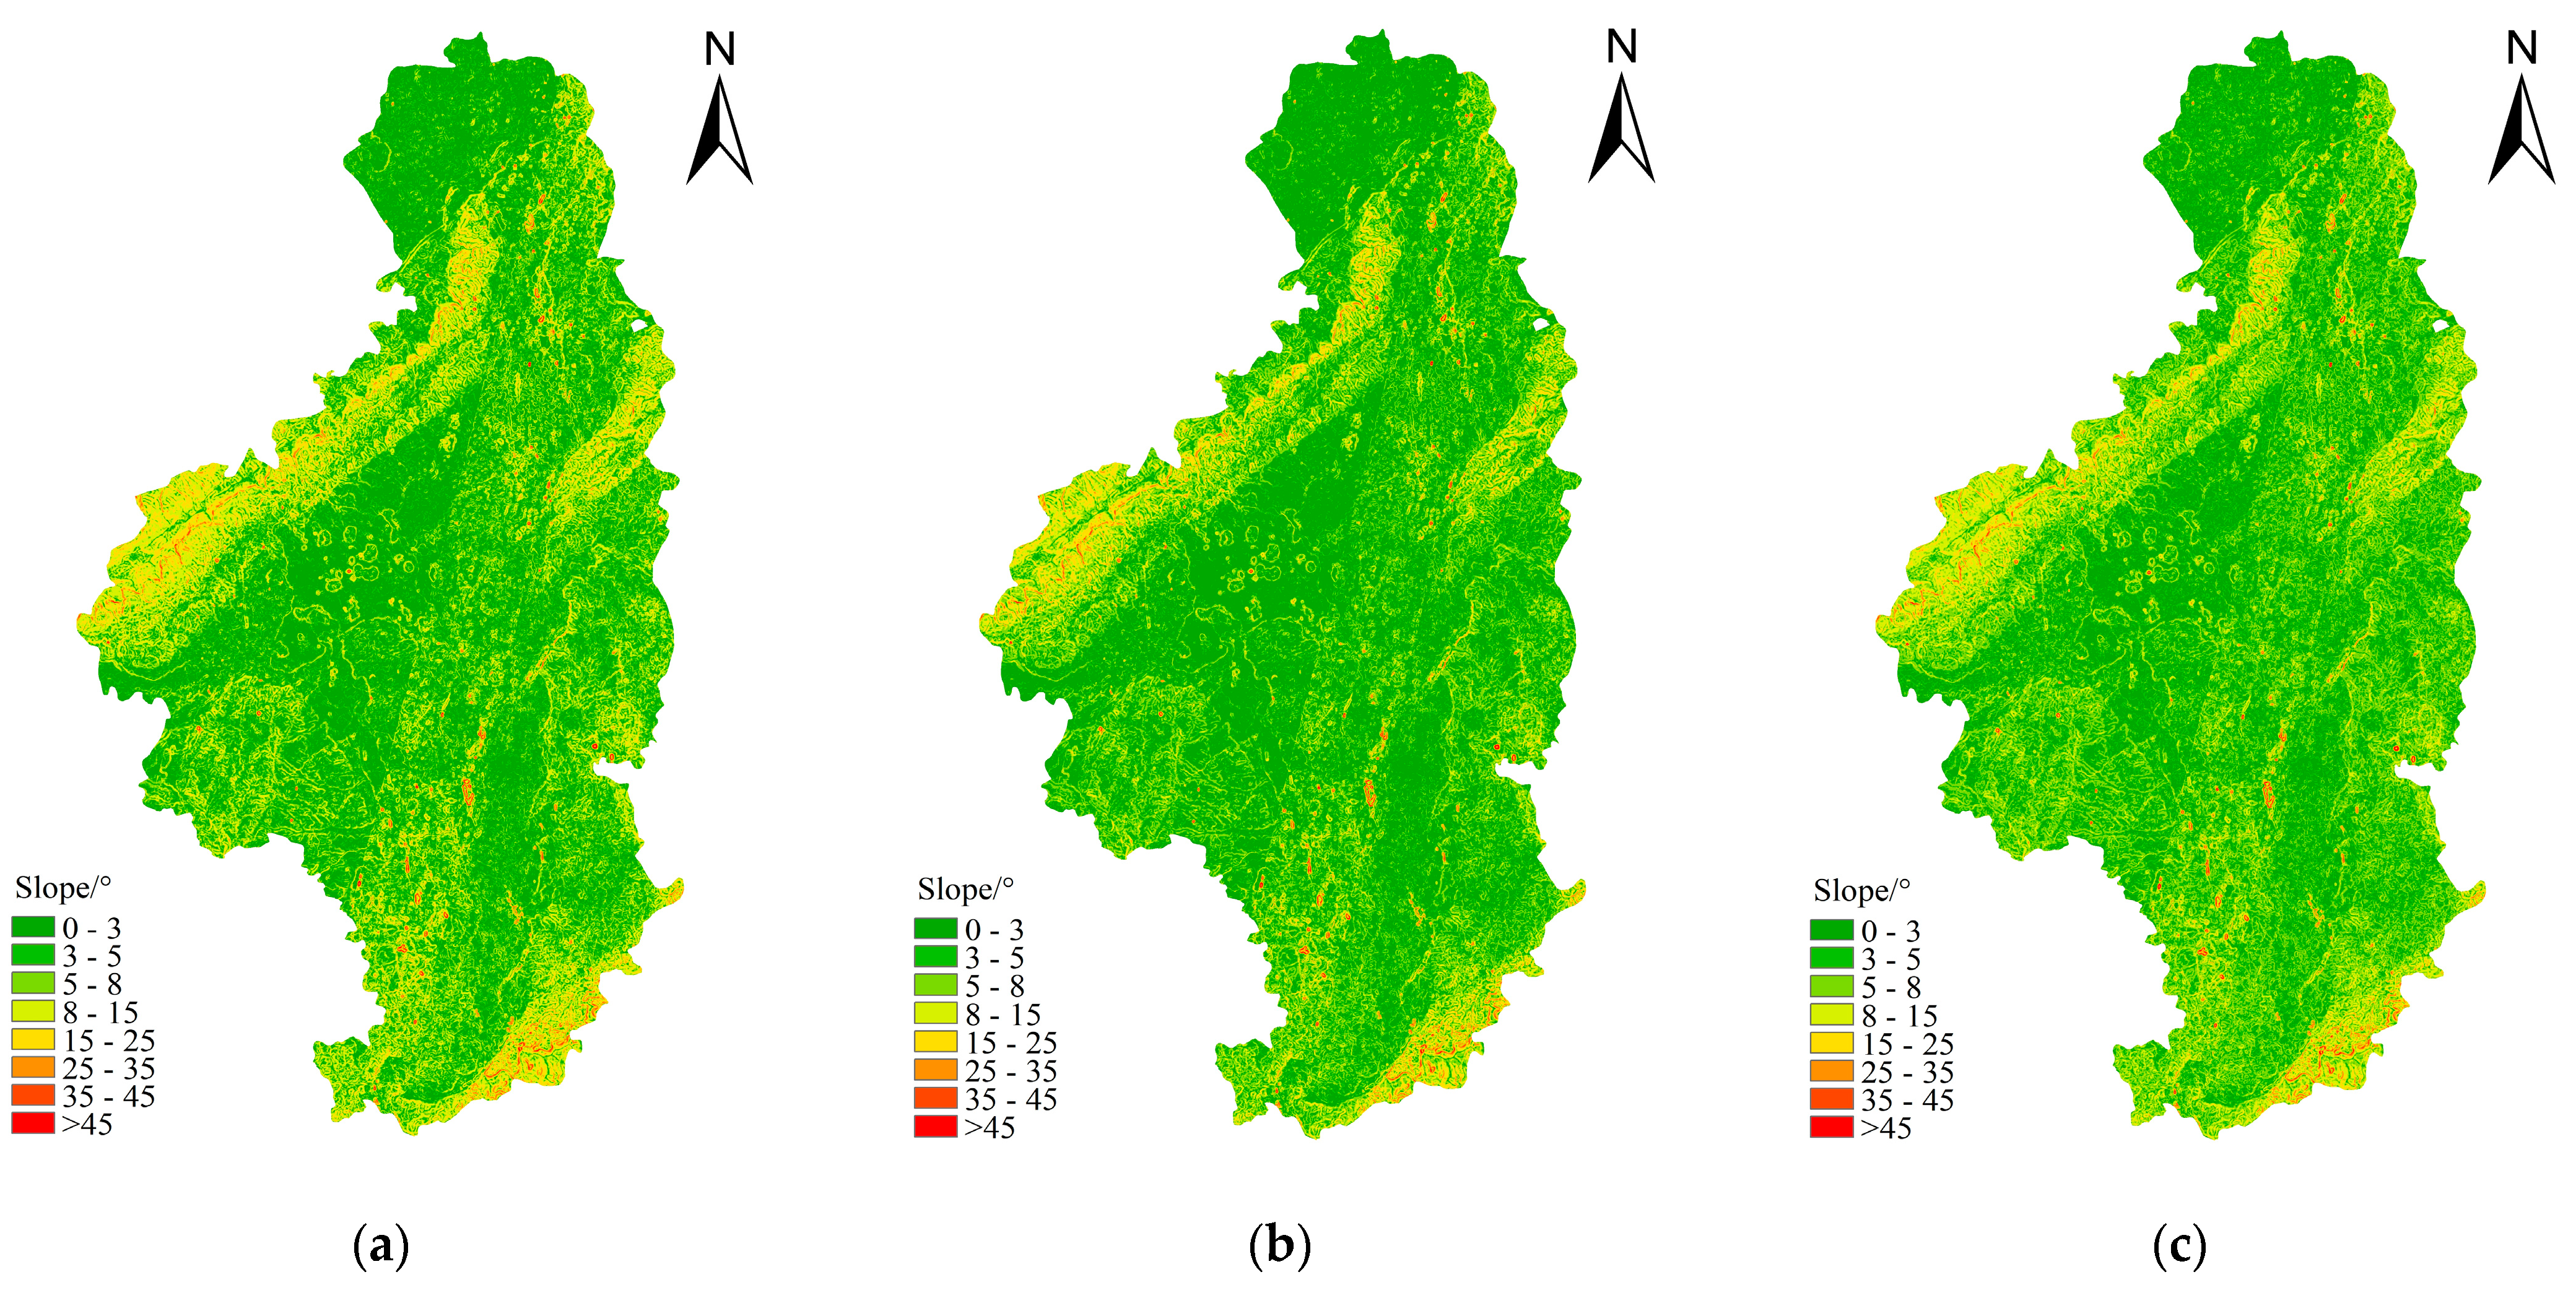
The slope is the jitter of the surface unit, reflecting the undulating changes of the terrain. The elevation of the study area ranges from 268 to 682 m. The topography is mainly plain, with a high terrain edge and low middle. In Figure 7, the corresponding slope maps were extracted from the 3 kinds of DEM data, and the slope was divided into 8 intervals (0°~3°, 3°~5°, 5°~8°, 8°~15°, 15°~25°, 25°~35°, 35°~45°, and >45°). It is found that the overall slope changes extracted from the three DEM data are similar and close to the actual terrain. SRTM V4.1 and ASTER GDEM extracted slope distribution among the zones is close, with a large distribution of steep slope zones (8°~25°) in the edge zone, and the middle zone is dominated by the slope of gentle slope zones (0°~8°), with more distribution among the slope zones and obvious overall slope changes; while HYDRO1K edge zone slope steep slope area (8°~25°) distribution area is less than the first two, the middle zone gentle slope area (0°~8°) distribution area is large, the overall slope change is more gentle. Combined with Table 5, the maximum slope of 71.10°, the average slope of 5.40°, and the standard deviation of the slope of 5.04 extracted by SRTM V4.1 are larger than those of ASTER GDEM and HYDRO1K, indicating that the slope variation extracted under SRTM V4.1 is larger, and the topographic relief is more obvious.
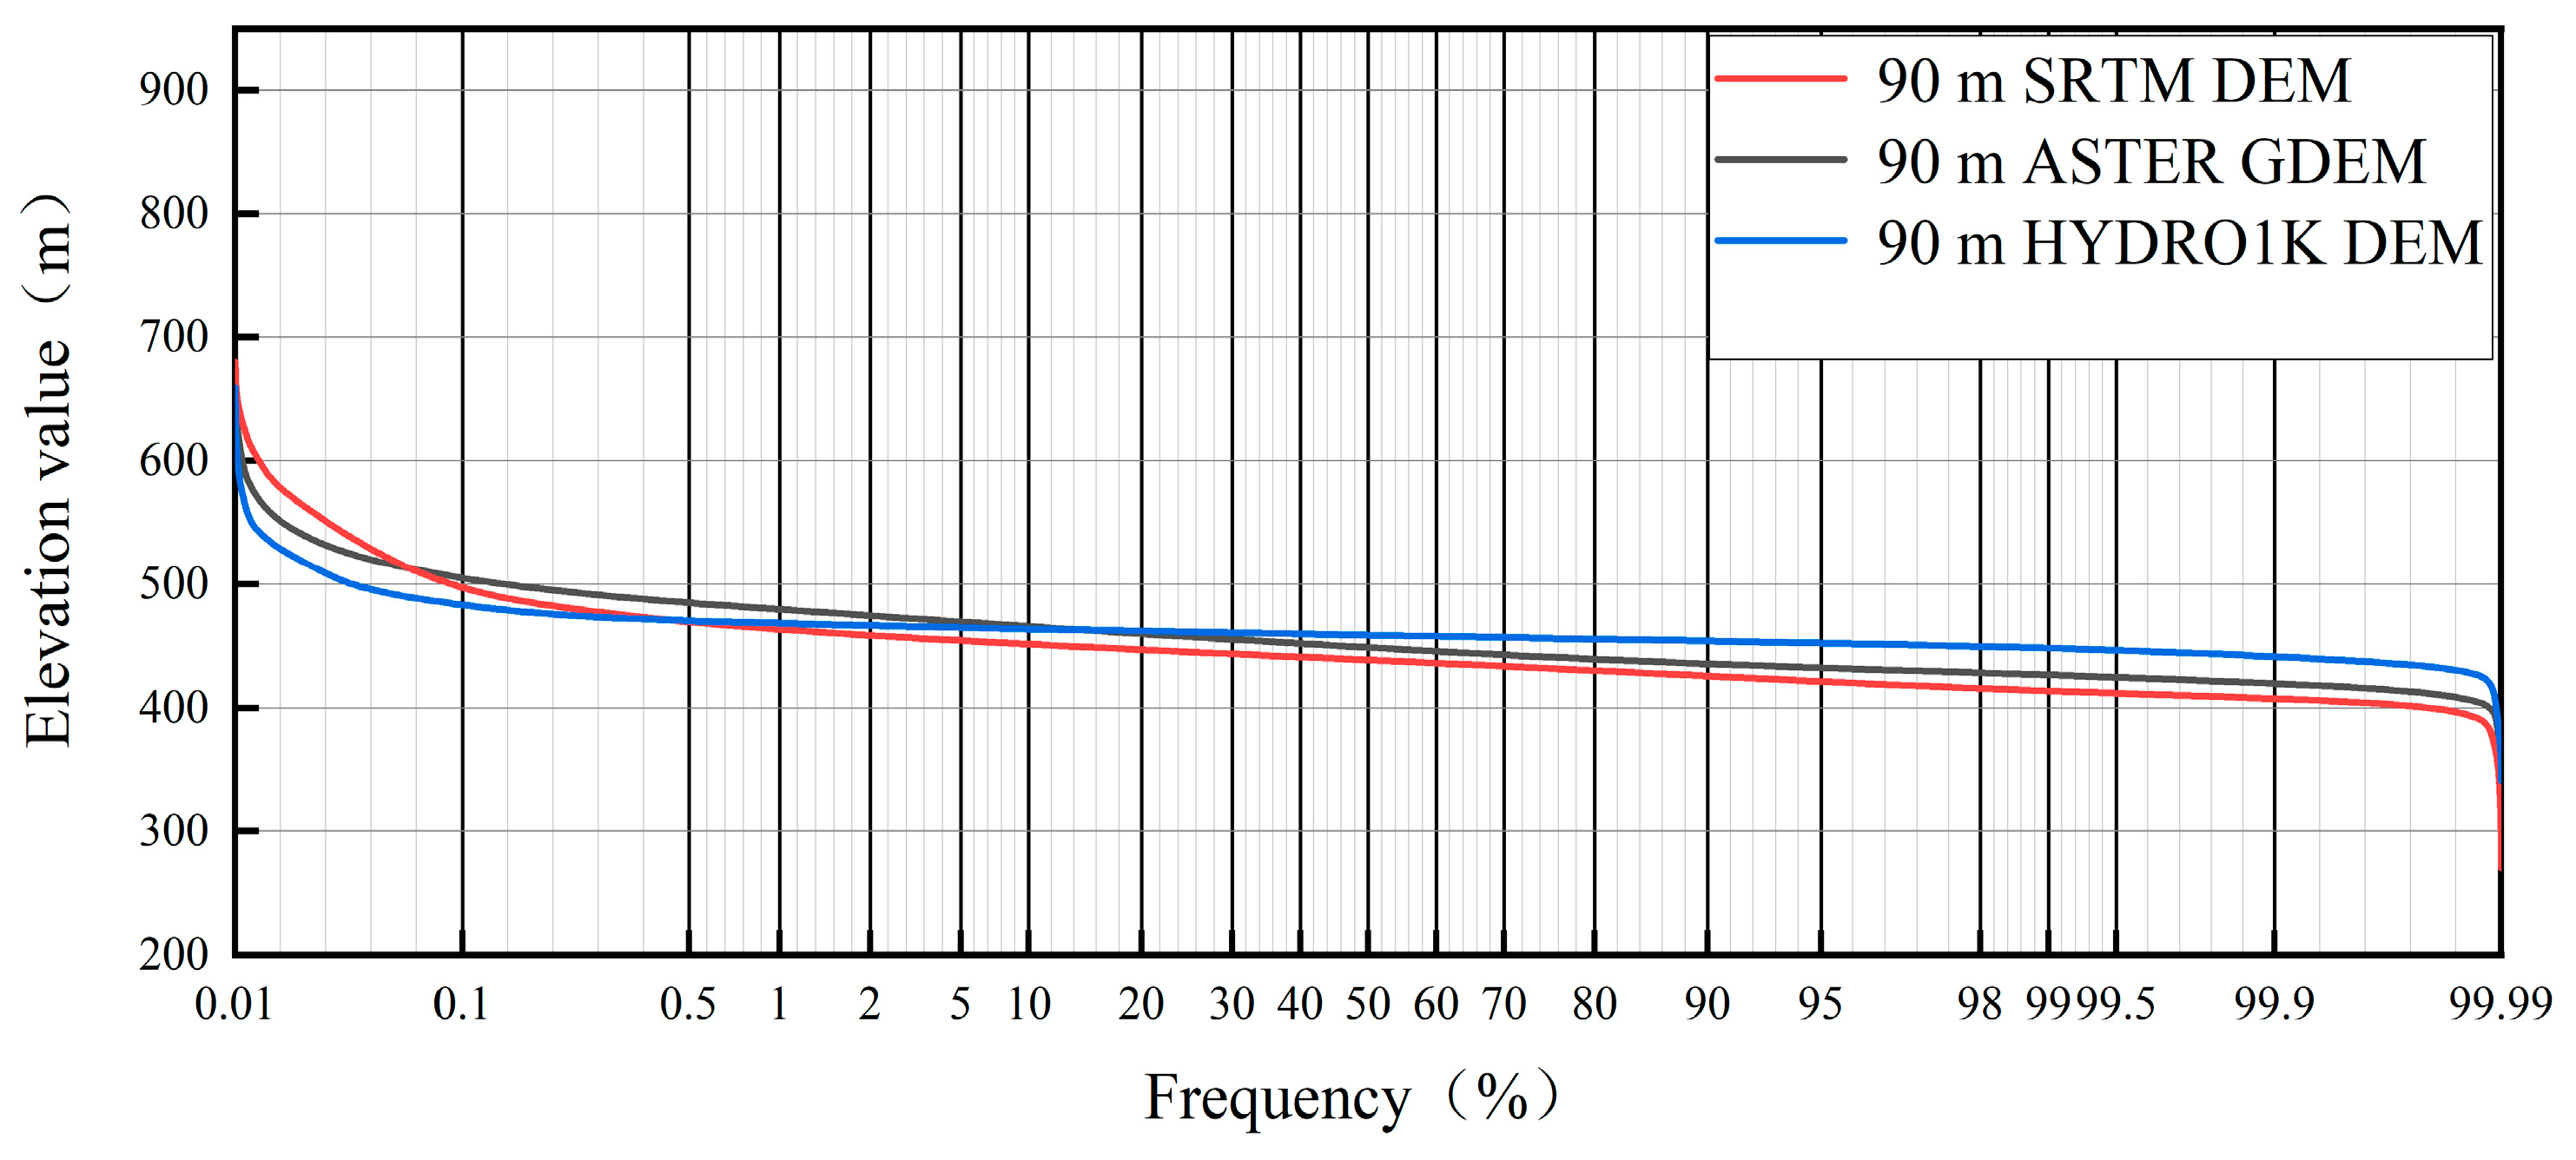
In Figure 8, the elevation changes reflect the topographic relief of the study area, and the elevation cumulative distribution reflects the frequency distribution of the study area at the corresponding elevations. In the 0.01~0.1% cumulative frequency interval, the three DEM shows a rapidly decreasing trend, but the SRTM V4.1 decreases more slowly than the other two DEM, indicating that the geographical area extracted by the SRTM V4.1 is larger in the larger elevation interval; in the 0.1~99.9% cumulative frequency interval, all three DEM show a slowly decreasing trend, and the watershed elevation In the interval from 0.1% to 99.9% of the cumulative frequency, all three DEM show a slowly decreasing trend, and the watershed elevation is mainly concentrated in this interval, in which HYDRO1K has the smallest change, and SRTM V4.1 has the largest change; in the interval from 99.9% to 99.99% of the cumulative frequency, the three DEM drop rapidly to the minimum elevation, indicating that the geographical area occupied by the minimum elevation interval is smaller. Combined with Table 5, the maximum elevation value of SRTM V4.1 is 680 m, the minimum elevation value is 268 m, and the average elevation is 461 m. The variation is larger than that of ASTER GDEM and HYDRO1K, reflecting the large topographic relief of the study area reflected by SRTM V4.1.
By comparing the three types of DEM data sources between slope and elevation changes, the topographic features of the study area reflected by the SRTM V4.1 are more obvious, which is conducive to improving the accuracy of river network water system extraction and the accurate calculation of the optimal catchment area threshold.
4. Discussion
Catchment area threshold selection is one of the important parameters for extracting digital river network by DEM. The optimal catchment area threshold can effectively reflect the precision of the river network and the structure of the water system. It is of great significance for fractal dimension calculation.
For the same watershed, different DEM accuracies have differences in the extracted watershed features. In this paper, we investigate the relationship between DEM accuracy and fractal dimension. The results show that the vertical accuracy of DEM has a greater impact on the fractal dimension accuracy. The increase in vertical accuracy reduces the fluctuation of fractal dimension and improves the fractal dimension accuracy, which is consistent with the results of Zheng [9]. Meanwhile, the relationship between the fractal dimension and catchment area threshold is studied, and the fractal dimension shows two stages of rapid decrease and leveling off as the catchment area threshold increases, which is consistent with the study of Zheng [28]. The study is consistent. Based on the box dimension method, the fractal dimensions calculated from three DEM data sources were compared with the fractal dimensions of the actual river network to determine the optimal catchment area threshold for the basin.
In this paper, the river network ensemble difference is introduced to evaluate the reasonableness of the optimal catchment area threshold. The calculation results show that the set difference calculated by SRTM V4.1 is 0.898%, which means that the gap between the extracted digital river network and the actual river network is small. The reason that there is still a gap is mainly that the DEM accuracy is not enough to extract the fine tributaries with smaller river classes. The DEM accuracy affects the topographic features of the extracted watershed [29], including slope and elevation changes. SRTM V4.1 and ASTER GDEM extracted slopes are very close to each other, which is consistent with the study of Liu et al. [30]. This has a direct effect on the slope [31]. While DEM accuracy has less effect on the slope, the reason why the slope is still similar based on the three data sources is mainly because of the vast watershed area, flat terrain, and low undulation. For the elevation change, the elevation information extracted from SRTM V4.1 indicates that the geographical area occupied by the larger elevation and smaller elevation intervals is larger. This implies that the SRTM V4.1 extracted watersheds have greater undulation [32], which is favorable for water system formation. In summary, the reaction of the topographic features and river network ensemble difference to the DEM accuracy successfully confirms the logic of the best catchment area threshold choice.
Although this paper analyzed the effect of different DEM accuracy on catchment area thresholds, it did not consider the role of other factors. Therefore, further research should be conducted on the effects of map source scale, meteorological characteristics in the watershed, and human factors. For the threshold validation method, the comparison of river classification by Strahler or Shreve with the river network ensemble difference in this paper will be the next research direction. The ARCGIS software selected in this paper has powerful hydrological processing tools, which contain efficient algorithms and accurate calculation results, but there are also some problems, so the use of different software and algorithms needs further research in order to provide a theoretical basis for the selection of suitable DEM data in determining the optimal catchment area threshold and the extraction of high precision water system. It provides great help for the research of this paper.
5. Conclusions
With the increase in the catchment area threshold, the fractal dimension D shows three stages of rapid decline, gentle fluctuation, and tend to 1.
Compared to the horizontal resolution, the vertical accuracy of the DEM had a bigger impact on the fractal dimension accuracy, and as the vertical accuracy of the DEM improved, so did the accuracy of the fractal dimension D. The three DEM data sources sets were mostly influenced in the following order: SRTM V4.1 DEM > ASTER GDEM > HYDRO1K DEM.
The DEM vertical accuracy can be improved to enable precise ideal catchment area thresholds.
The SRTM V4.1 DEM is feasible as a DEM data source for determining the optimal catchment area threshold in plain watersheds.
Author Contributions
Conceptualization, H.W. and X.H.; methodology, H.L.; investigation, X.H. and Q.L.; writing—original draft preparation, H.W.; writing—review and editing, X.L. and Q.L. All authors have read and agreed to the published version of the manuscript.
Funding
This research was funded by the Fundamental Public Welfare Research Program of Zhejiang Province (LGN18E090002) and Key R&D Program of Zhejiang (2022C02035).
Institutional Review Board Statement
Not applicable.
Informed Consent Statement
Informed consent was obtained from all subjects involved in the study.
Data Availability Statement
Not applicable.
Acknowledgments
The authors greatly appreciate the support of the Fundamental Public Welfare Research Program of Zhejiang Province under Grant LGN18E090002 and Key R&D Program of Zhejiang under Grant 2022C02035. The work was strongly supported by Professor Li’s team. The opinions and statements do not necessarily represent those of the sponsors.
Conflicts of Interest
The authors declare no conflict of interest.
References
- Sun, A.L.; Yu, Z.B.; Yang, C.G.; Gu, H. Impact factors of contribution area threshold in extracting drainage network for rivers in China. J. Hydraul. Eng. 2013, 44, 901–908. [Google Scholar]
- Dou, M.; Yu, L.; Jin, M. Study on relationship between box dimension and connectivity of river system in Huaihe River basin. J. Hydraul. Eng. 2019, 50, 670–678. [Google Scholar]
- Wang, G.Z.; Li, Z.Y.; Zhang, J.Y.; Qu, J.G.; Hao, J.; Wang, Z.M. Influence of Grid Sizes’ change on the fractal dimension of water systems. J. Irrig. Drain. 2017, 36, 215–217. [Google Scholar]
- Yang, J.L. Digital determination of catchment area threshold based on fractal dimension. Sci. Surv. Mapp. 2011, 36, 33–34. [Google Scholar]
- O’Callaghan, J.F.; David, M. The extraction of drainage networks from digital elevation data. Comput. Vis. Graph. Image Process. 1984, 27, 323–344. [Google Scholar]
- Lin, F.; Chen, X.W.; Wang, L. Calculation of the fractal dimension in Jiulongjiang River basin based on DEM. J. Water Resour. Water Eng. 2009, 20, 29–32. [Google Scholar]
- Wang, L.; Chen, X.W. Study on relationship between extracted river network and fractal dimension based on DEM. J. Geo-Inf. Sci. 2007, 4, 133–137. [Google Scholar]
- Li, W.T.; Wang, C.; Li, P.; Gu, L.W. Influences of DEM generalization methods on extracting accuracy of hydrological structure information. Bull. Soil Water Conserv. 2012, 32, 168–171. [Google Scholar]
- Zheng, N.J. Fractal analysis of drainage networks based on box dimension. China Rural. Water Hydropower 2020, 5, 33–38. [Google Scholar]
- Zhu, J.W. On the methods of DEM construction based on stereo image matching data. Bull. Surv. Mapp. 2008, 11, 38–40. [Google Scholar]
- He, D.L.; Wen, J.G.; Xiao, Q.; You, D.Q.; Wu, X.D.; Lin, X.W.; Wu, S.B. An accuracy assessment method of DEM upscaling based on energy factor. Geomat. Inf. Sci. Wuhan Univ. 2019, 44, 570–577. [Google Scholar]
- He, L.; Sun, H.; Huang, Y.L.; Huang, X.Y. Study on resampling methods of MODIS 1B data. Remote Sens. Informa. 2007, 3, 39–43. [Google Scholar]
- Jiang, G.X.; Xie, Y.L.; Gao, Z.Y.; Zhou, P. Evaluation on elevation accuracy of commonly used DEM in five typical areas of China. Res. Soil Water Conserv. 2020, 27, 72–80. [Google Scholar]
- Chen, G.H.; Li, Z.W.; Xu, X.W.; Sun, H.; Ha, G.; Guo, P.; Su, P.; Yuan, Z.; Li, T. Co-seismic surface deformation and late Quaternary accumulated displacement along the seismogenic fault of the 2021 Madoi M7.4 earthquake and their implications for regional tectonics. Chin. J. Geophys. 2022, 65, 2984–3005. [Google Scholar]
- Tang, G.A.; Na, J.M.; Cheng, W.M. Progress of DEM terrain analysis on regional geomorphology in China. Acta Geod. Cartogr. Sin. 2017, 46, 1570–1591. [Google Scholar]
- Saied, P. Coupling of DEM and remote-sensing-based approaches for semi-automated detection of regional geostructural features in Zagros Mountain, Iran. Arab. J. Geosci. 2013, 6, 91–99. [Google Scholar]
- Saied, P.; Jonathan, L.; Michael, C. Use of LiDAR-derived DEM and a stream length gradient index approach to investigation of landslides in Zagros Mountains, Iran. Geocarto Int. 2018, 33, 912–926. [Google Scholar]
- Parizi, E. Application of Unmanned Aerial Vehicle DEM in flood modeling and comparison with global DEMs: Case study of Atrak River Basin, Iran. J. Environ. Manag. 2022, 317, 115492. [Google Scholar] [CrossRef]
- Ahmad, S.; Elnaz, P. A strategy to assess the uncertainty of a climate change impact on extreme hydrological events in the semi-arid Dehbar catchment in Iran. Theor. Appl. Climatol. 2020, 139, 389–402. [Google Scholar]
- Srishti, G.; Arnab, B.; Rajendra, S. Modelling potential impact of climate change and uncertainty on streamflow projections: A case study. J. Water Clim. Chang. 2020, 12, 384–400. [Google Scholar]
- Ehteram, M. Reservoir operation based on evolutionary algorithms and multi-criteria decision making under climate change and uncertainty. J. Hydroinformatics 2018, 20, 332–355. [Google Scholar] [CrossRef]
- Cai, L.Y.; Tang, G.A.; Xiong, L.Y.; Kamila, J.L.; Xie, T. An analysis on fractal characteristics of typical landform patterns in Northern Shanxi Loess Plateau based on DEM. Bull. Soil Water Conserv. 2014, 34, 141–144. [Google Scholar]
- Lu, Z.X.; Zou, S.B.; Xiao, H.L.; Yin, Z.L.; Ruan, H.W.; Gao, H.S. How to determine drainage area threshold in alpine regions of upper reaches of Heihe River. J. Glaciol. Geocryol. 2015, 37, 493–499. [Google Scholar]
- Zhang, P.J.; Meng, X.M.; Zhou, H.; Liu, D.F. Applicability analysis of different flow accumulation threshold determination methods in loess eroded area. Water Resour. Power 2019, 37, 26–29. [Google Scholar]
- Sadegh, A.M.; Reza, N.M.; Abrishamchi, A. Increasing risk of meteorological drought in the Lake Urmia basin under climate change: Introducing the precipitation–temperature deciles index. J. Hydrol. 2020, 592, 125586. [Google Scholar]
- Ömer, E.; Mehmet, C.D.; Martijn, J.B. Effect of data length, spin-up period and spatial model resolution on fully distributed hydrological model calibration in the Moselle basin. Hydrol. Sci. J. 2022, 67, 759–772. [Google Scholar]
- Song, H.H. Research on SRTM Void-filling and precision detection of SRTM data in China. Master’s Thesis, China University of Geosciences, Wuhan, China, 2018. [Google Scholar]
- Zheng, W.; Gao, H.L.; Zhang, M.H.; Zhang, Q.F. Study on methods of determining optimal catchment area threshold in Zhifanggou catchment. Res. Soil Water Conserv. 2020, 44, 901–908. [Google Scholar]
- Wijaya, O.T.; Yang, T.-H. A novel hybrid approach based on cellular automata and a digital elevation model for rapid flood assessment. Water 2012, 13, 1311. [Google Scholar] [CrossRef]
- Liu, Y.; Zhou, M.C.; Chen, Z.J.; Li, S.W. Comparison of drainage network extraction from different DEM data sources: A case study of Hanjiang River basin. Sci. Geogr. Sin. 2012, 32, 1112–1118. [Google Scholar]
- Wang, F.; Wang, C.M. Research for the influences of DEM resolution on topographical factors—A case study of Mengyin County. Res. Soil Water Conserv. 2009, 16, 225–229. [Google Scholar]
- Ma, Y.M.; Zhang, L.H.; Zhang, K.; Zhu, Z.R.; Wu, Z.F. Accuracy analysis of watershed system extraction based on the SWAT model and multi-source DEM data. Geogr. Geo.-Inf. Sci. 2019, 21, 1527–1537. [Google Scholar]
Figure 1.
Actual river network in the water source area of Tongjiyan.

Figure 2.
The nearest neighbor distribution method (numbers represent elevation values).

Figure 3.
Flow chart of river network extraction.

Figure 4.
Fractal dimension D versus catchment area threshold.

Figure 5.
Statistical eigenvalues of fractal dimensions of the four DEM data.

Figure 6.
Effect of overlaying 3 kinds of DEM data sources. (a) SRTM V4.1 DEM. (b) HYDRO1K DEM. (c) ASTER GDEM.
Figure 6.
Effect of overlaying 3 kinds of DEM data sources. (a) SRTM V4.1 DEM. (b) HYDRO1K DEM. (c) ASTER GDEM.

Figure 7.
Slope maps extracted from three types of DEM data sources. (a) SRTM V4.1 DEM. (b) HYDRO1KDEM. (c) ASTER GDEM.
Figure 7.
Slope maps extracted from three types of DEM data sources. (a) SRTM V4.1 DEM. (b) HYDRO1KDEM. (c) ASTER GDEM.

Figure 8.
Cumulative distribution of elevation extracted from three kinds of DEM data.


Table 1.
Introduction of DEM data sources.
| Data Sources | Publishing Organization | Data Range | Access Channels | Horizontal Resolution | Vertical Accuracy |
|---|---|---|---|---|---|
| ASTER GDEM | METI/NASA | 83° N~83° S | http://www.gscloud.cn (accessed on 14 March 2022) | 30 m | 20 m |
| SRTM V4.1 DEM | USGS/NASA | 60° N~56° S | http://www.gscloud.cn (accessed on 14 March 2022) | 90 m | Nominal: 16 m; Actual: 9 m |
| HYDRO1K DEM | USGS/EROS | Global | https://lta.cr.usgs.gov/ HYDRO1K (accessed on 14 March 2022) | 1000 m | 30 m |
Notes: METI: Ministry of Economy, Trade, and Industry; NASA: National Aeronautics and Space Administration; USGS: United States Geological Survey; EROS: Earth Remote Observation System.
Table 2.
The coefficients of each of the three DEM at the set threshold.
| Raster | 90 m SRTM GDEM | 90 m HYDRO1K DEM | 90 m ASTER GDEM | 30 m ASTER GDEM | ||||||||
|---|---|---|---|---|---|---|---|---|---|---|---|---|
| Threshold /km2 | D | R2 | Threshold /km2 | D | R2 | Threshold /km2 | D | R2 | Threshold /km2 | D | R2 | |
| 1 | 0.0081 | 1.3948 | 0.9861 | 0.0081 | 1.7845 | 0.9990 | 0.0081 | 1.5866 | 0.9991 | 0.0090 | 1.9091 | 0.9992 |
| 500 | 0.4050 | 1.0450 | 0.9996 | 0.4050 | 1.0548 | 0.9991 | 0.4050 | 1.0080 | 0.9993 | 0.4500 | 1.0428 | 0.9991 |
| 1000 | 0.8100 | 1.0294 | 0.9999 | 0.8100 | 1.0310 | 0.9990 | 0.8100 | 1.0296 | 0.9999 | 0.9000 | 1.0215 | 0.9995 |
| 2000 | 1.6200 | 1.0268 | 0.9999 | 1.6200 | 1.0301 | 0.9993 | 1.6200 | 1.0268 | 0.9999 | 1.8000 | 1.0343 | 0.9999 |
| 3000 | 2.4300 | 1.0271 | 0.9999 | 2.4300 | 1.0220 | 0.9998 | 2.4300 | 1.0001 | 0.9999 | 2.7000 | 1.0281 | 0.9999 |
| 4000 | 3.2400 | 1.0250 | 0.9999 | 3.2400 | 1.0252 | 0.9999 | 3.2400 | 0.9914 | 0.9999 | 3.6000 | 1.0252 | 0.9999 |
| 5000 | 4.0500 | 1.0245 | 0.9999 | 4.0500 | 1.0278 | 0.9999 | 4.0500 | 1.0249 | 0.9999 | 4.5000 | 1.0239 | 0.9999 |
| 6000 | 4.8600 | 1.0242 | 0.9999 | 4.8600 | 1.0251 | 0.9999 | 4.8600 | 1.0242 | 0.9999 | 5.4000 | 1.0240 | 0.9999 |
| 7000 | 5.6700 | 1.0239 | 0.9999 | 5.6700 | 1.0241 | 0.9999 | 5.6700 | 1.0237 | 0.9999 | 6.3000 | 1.0228 | 0.9999 |
| 8000 | 6.4800 | 1.0240 | 0.9999 | 6.4800 | 1.0237 | 0.9999 | 6.4800 | 1.0235 | 0.9999 | 7.2000 | 1.0230 | 0.9999 |
Table 3.
Results of optimal catchment area thresholds for the three DEM data.
| Data Sources of DEM | Fractal Dimension D | Optimal Catchment Area Threshold/km2 |
|---|---|---|
| Actual River Network | 1.0245 | / |
| SRTM V4.1 DEM | 1.0245 | 4.05 |
| HYDRO1K DEM | 1.0241 | 5.67 |
| ASTER GDEM | 1.0242 | 4.86 |
Table 4.
Results of river network ensemble difference for three kinds of DEM data sources.
| Data Sources of DEM | Polygon Area /km2 | Watershed Area /km2 | River Network Overlap Difference/% |
|---|---|---|---|
| SRTM V4.1 DEM | 6.93 | 772.08 | 0.898 |
| HYDRO1K DEM | 21.30 | 770.89 | 2.763 |
| ASTER GDEM | 17.79 | 771.39 | 2.306 |
Table 5.
Topographic feature parameters of the three DEM data.
| Data of DEM | Maximum Slope/° | Average Slope/° | Standard Deviation of Slope | Maximum Elevation/m | Minimum Elevation/m | Undulation/m |
|---|---|---|---|---|---|---|
| 90 m SRTM DEM | 71.10 | 5.40 | 5.04 | 680 | 268 | 412 |
| 90 m HYDRO1K DEM | 70.89 | 5.01 | 4.64 | 669 | 285 | 384 |
| 90 m ASTER GDEM | 69.83 | 5.09 | 4.79 | 675 | 289 | 386 |
Disclaimer/Publisher’s Note: The statements, opinions and data contained in all publications are solely those of the individual author(s) and contributor(s) and not of MDPI and/or the editor(s). MDPI and/or the editor(s) disclaim responsibility for any injury to people or property resulting from any ideas, methods, instructions or products referred to in the content. |
© 2023 by the authors. Licensee MDPI, Basel, Switzerland. This article is an open access article distributed under the terms and conditions of the Creative Commons Attribution (CC BY) license (https://creativecommons.org/licenses/by/4.0/).
Share and Cite
MDPI and ACS Style
Wu, H.; Liu, X.; Li, Q.; Hu, X.; Li, H. The Effect of Multi-Source DEM Accuracy on the Optimal Catchment Area Threshold. Water 2023, 15, 209. https://doi.org/10.3390/w15010209
AMA Style
Wu H, Liu X, Li Q, Hu X, Li H. The Effect of Multi-Source DEM Accuracy on the Optimal Catchment Area Threshold. Water. 2023; 15(1):209. https://doi.org/10.3390/w15010209
Chicago/Turabian StyleWu, Honggang, Xueying Liu, Qiang Li, Xiujun Hu, and Hongbo Li. 2023. "The Effect of Multi-Source DEM Accuracy on the Optimal Catchment Area Threshold" Water 15, no. 1: 209. https://doi.org/10.3390/w15010209
Note that from the first issue of 2016, this journal uses article numbers instead of page numbers. See further details here.