
Effect of Contact Area on Deflection Flow Behavior in a Bifurcated Fracture


1
State Grid Anhui Electric Power Co., Ltd., Hefei 230061, China
2
Anhui Huadian Engineering Consulting and Design Co., Ltd., Hefei 230022, China
3
School of Resources and Environmental Engineering, Hefei University of Technology, Hefei 230009, China
*
Author to whom correspondence should be addressed.
Water 2023, 15(1), 213; https://doi.org/10.3390/w15010213
Submission received: 4 December 2022
/
Revised: 30 December 2022
/
Accepted: 31 December 2022
/
Published: 3 January 2023
(This article belongs to the Section Hydrology)
Abstract
:The factors affecting the deflection flow in a bifurcated fracture under the effect of the fracture contact area are discussed. The effects of the contact area and cross-section on the deflection flow are determined using a combination of experiments and numerical simulations. The contact and seepage changes in bifurcated fractures under a confining pressure are monitored using a pressure film. A parallel plate bifurcated fracture model with a single contact area is established, which is in good agreement with the results of the laboratory experiments. Based on numerical simulation experiments, under the effects of the contact area and cross-section, the change in the effective flow path is the main reason for the change in the deflection flow behavior. The proportion of the flow path of the entire fracture is used to reflect the deflection flow characteristics under different contact areas and cross-sectional areas. For a given contact area, the larger the cross-section of the contact area, the larger the difference in the outlet flow of the bifurcated fracture and the more obvious the deflection flow behavior. As the contact area increases and the cross-section is constant, the effective path of the fluid does not change, and the deflection flow behavior does not change. This explanation of the cause of fracture deflection flow is of great significance for studying fracture seepage.
1. Introduction
In many types of geological projects, such as the prevention and control of groundwater pollution [1,2] and seepage in a dam foundation [3,4], the contact deformation and development of mass fractures under in situ stress leads to sewage infiltration, and the collapse of the dam foundation is the key factor affecting the project. Therefore, fracture contact and seepage in rocks are the focus of engineering stability studies.
Fractures are channels for the hydraulic exchange between fluids, and they range in size from a few microns to large faults. The sides of fractures can come into contact with each other under in situ stress, which hinders fluid flow. Zimmerman et al. [5] studied the hydraulic behavior in fractures under different contact conditions by changing the fracture contact area, which can better reflect the fracture seepage characteristics under stress [6]. Through the fracture seepage experiment, Watanabe et al. [7] also found that fracture contact causes a change in the aperture of the fracture, resulting in the deflection flow behavior. The change in the aperture under stress is the main reason for the occurrence of deflection flow. In addition, many scholars have used 3-D scanning technology to import fracture surface data into software in order to conduct numerical simulations [8,9,10,11,12]. Zhang et al. [13] established a numerical model of seepage in a single rough fracture, studied the seepage characteristics under different roughnesses and used the radius of the contact area to reflect the deflection flow in the fracture. Wang et al. [14] prepared two types of rock samples with the same specifications, one containing a single hydraulic fracture and the other containing a single artificial fracture, and the seepage mechanism under the same stress was studied. It was found that fracture roughness was an important factor affecting the deflection flow. Therefore, the contact area of a fracture with a certain roughness under pressure makes the fluid flow through preferential flow paths where the asperities are smaller or there is lower roughness. This type of deflection flow behavior occurs more easily in bifurcated fractures.
The deflection flow effect is an important discovery for describing fluid flow in bifurcated fractures. In bifurcated fractures, in the two directions of the fracture channel, differences in the roughness, fracture width, and other reasons result in hydraulic inequality, and thus, the flow is skewed toward one side of the channel. Kordilla et al. [15] used a stable fluid to observe the liquid flow process in a pipeline and established a theoretical shunt model based on a force balance. Liu et al. [16] used a pigment as a tracer to observe the change in the fluid after passing through the fracture intersection point and found that the fluid mainly flowed forward due to the inertia effect. It has been observed that when the hydraulic gradient reaches a certain value, the fluid flow exhibits nonlinear behavior [17,18,19,20]. Johnson et al. [21] designed intersecting fractures with a certain roughness, established a numerical model to capture the observed fluid flow and mixing behaviors, and studied seepage in bifurcated fractures, improving our understanding of fluid flow in fracture networks.
The establishment of the experimental device extends to the seepage mechanism in bifurcated fractures. However, the closure of the fracture aperture under stress is not considered, especially the change in the eccentric flow behavior after the fracture surfaces come into contact. The fracture width is not equal due to the closure of the fracture under stress and the roughness of the fracture surface. When the flow passes through the confluence point, it will shift toward the wider fractures, and thus, the amount of water flowing into the narrower fractures is reduced [22,23,24,25]. This type of dynamic process under hydraulic and external stress makes studying the deflection flow behavior in fractures more important.
Therefore, in this study, the deflection flow behavior in bifurcated fractures under the effect of the contact area was studied through experiments and numerical simulation. The goals of this study were to: (1) analyze the deflection flow behavior in bifurcated fractures under experimental conditions; (2) simulate the influence of the contact area on the deflection flow behavior; and (3) determine the cause of deflection flow in bifurcated fractures.
2. Establishing the Experimental and Numerical Models
2.1. Rock Sample Preparation
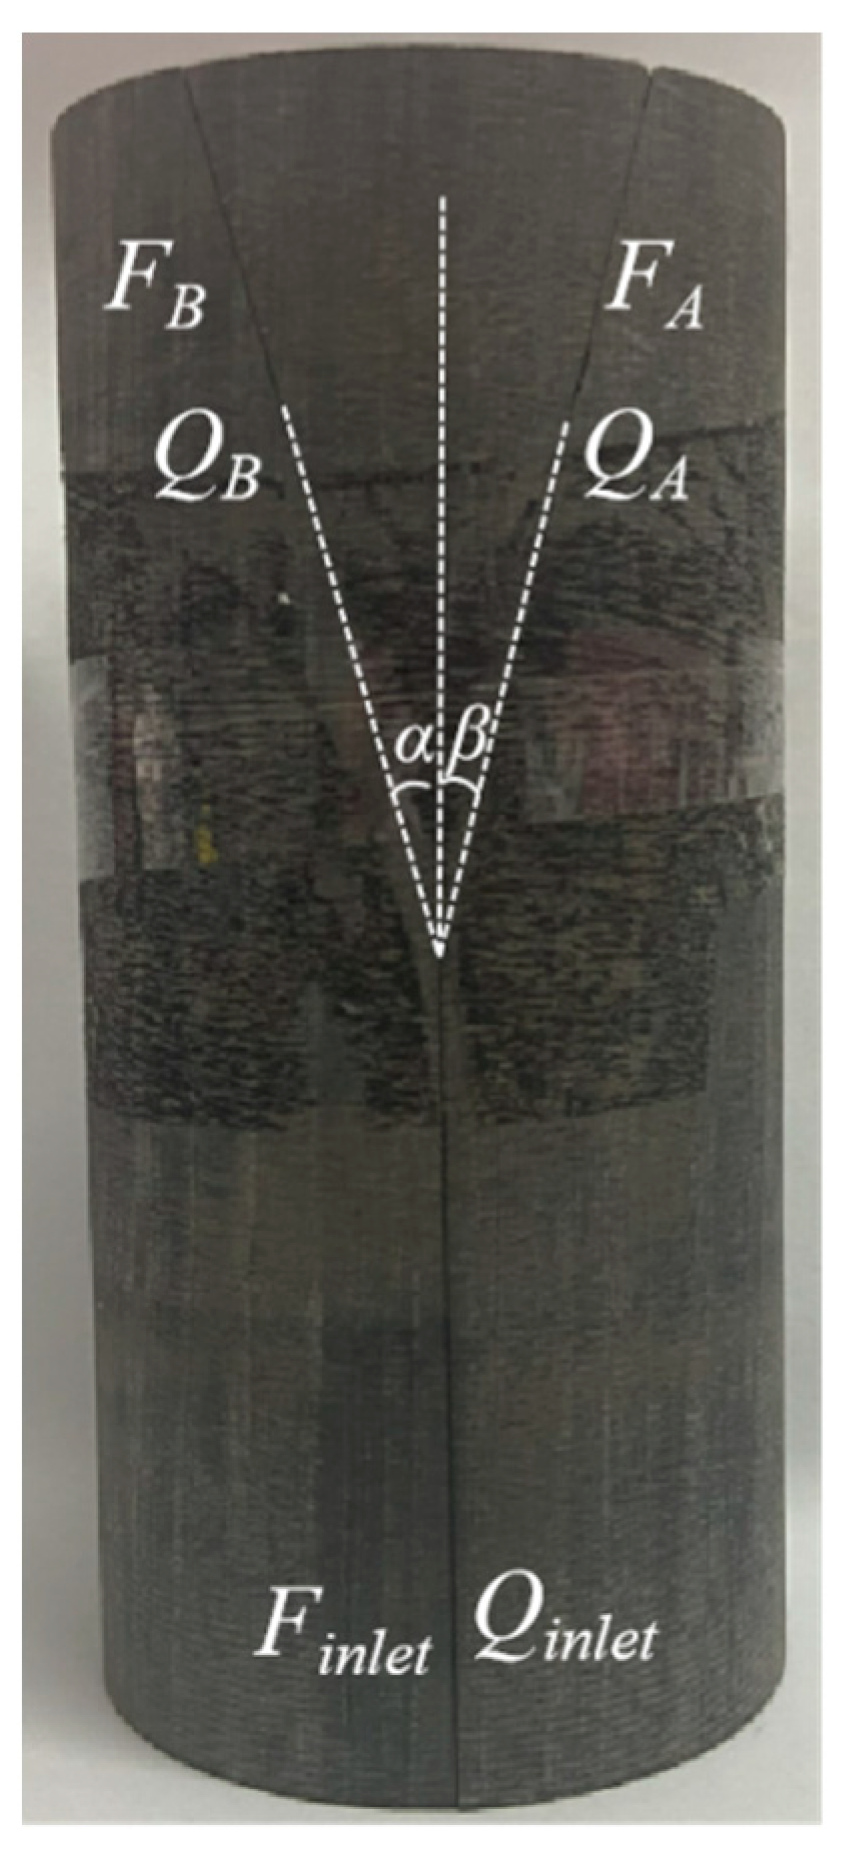
To better study the fracture closure and seepage mechanism of bifurcated fractures under stress, Shale containing natural bifurcated fractures was identified and cut into cylindrical samples with diamond wire (Figure 1). To prevent the influence of angle asymmetry on the fracture seepage, the two fractures in different directions were positioned symmetrically during the rock cutting (α = β = 15°). We labeled the channels of the bifurcated fractures to facilitate easy understanding and description during the experiments. FA, FB, and Finlet denote the different fractures. QA, QB, and Qinlet are the flow volumes through the corresponding fractures.
2.2. Establishing the Numerical Model
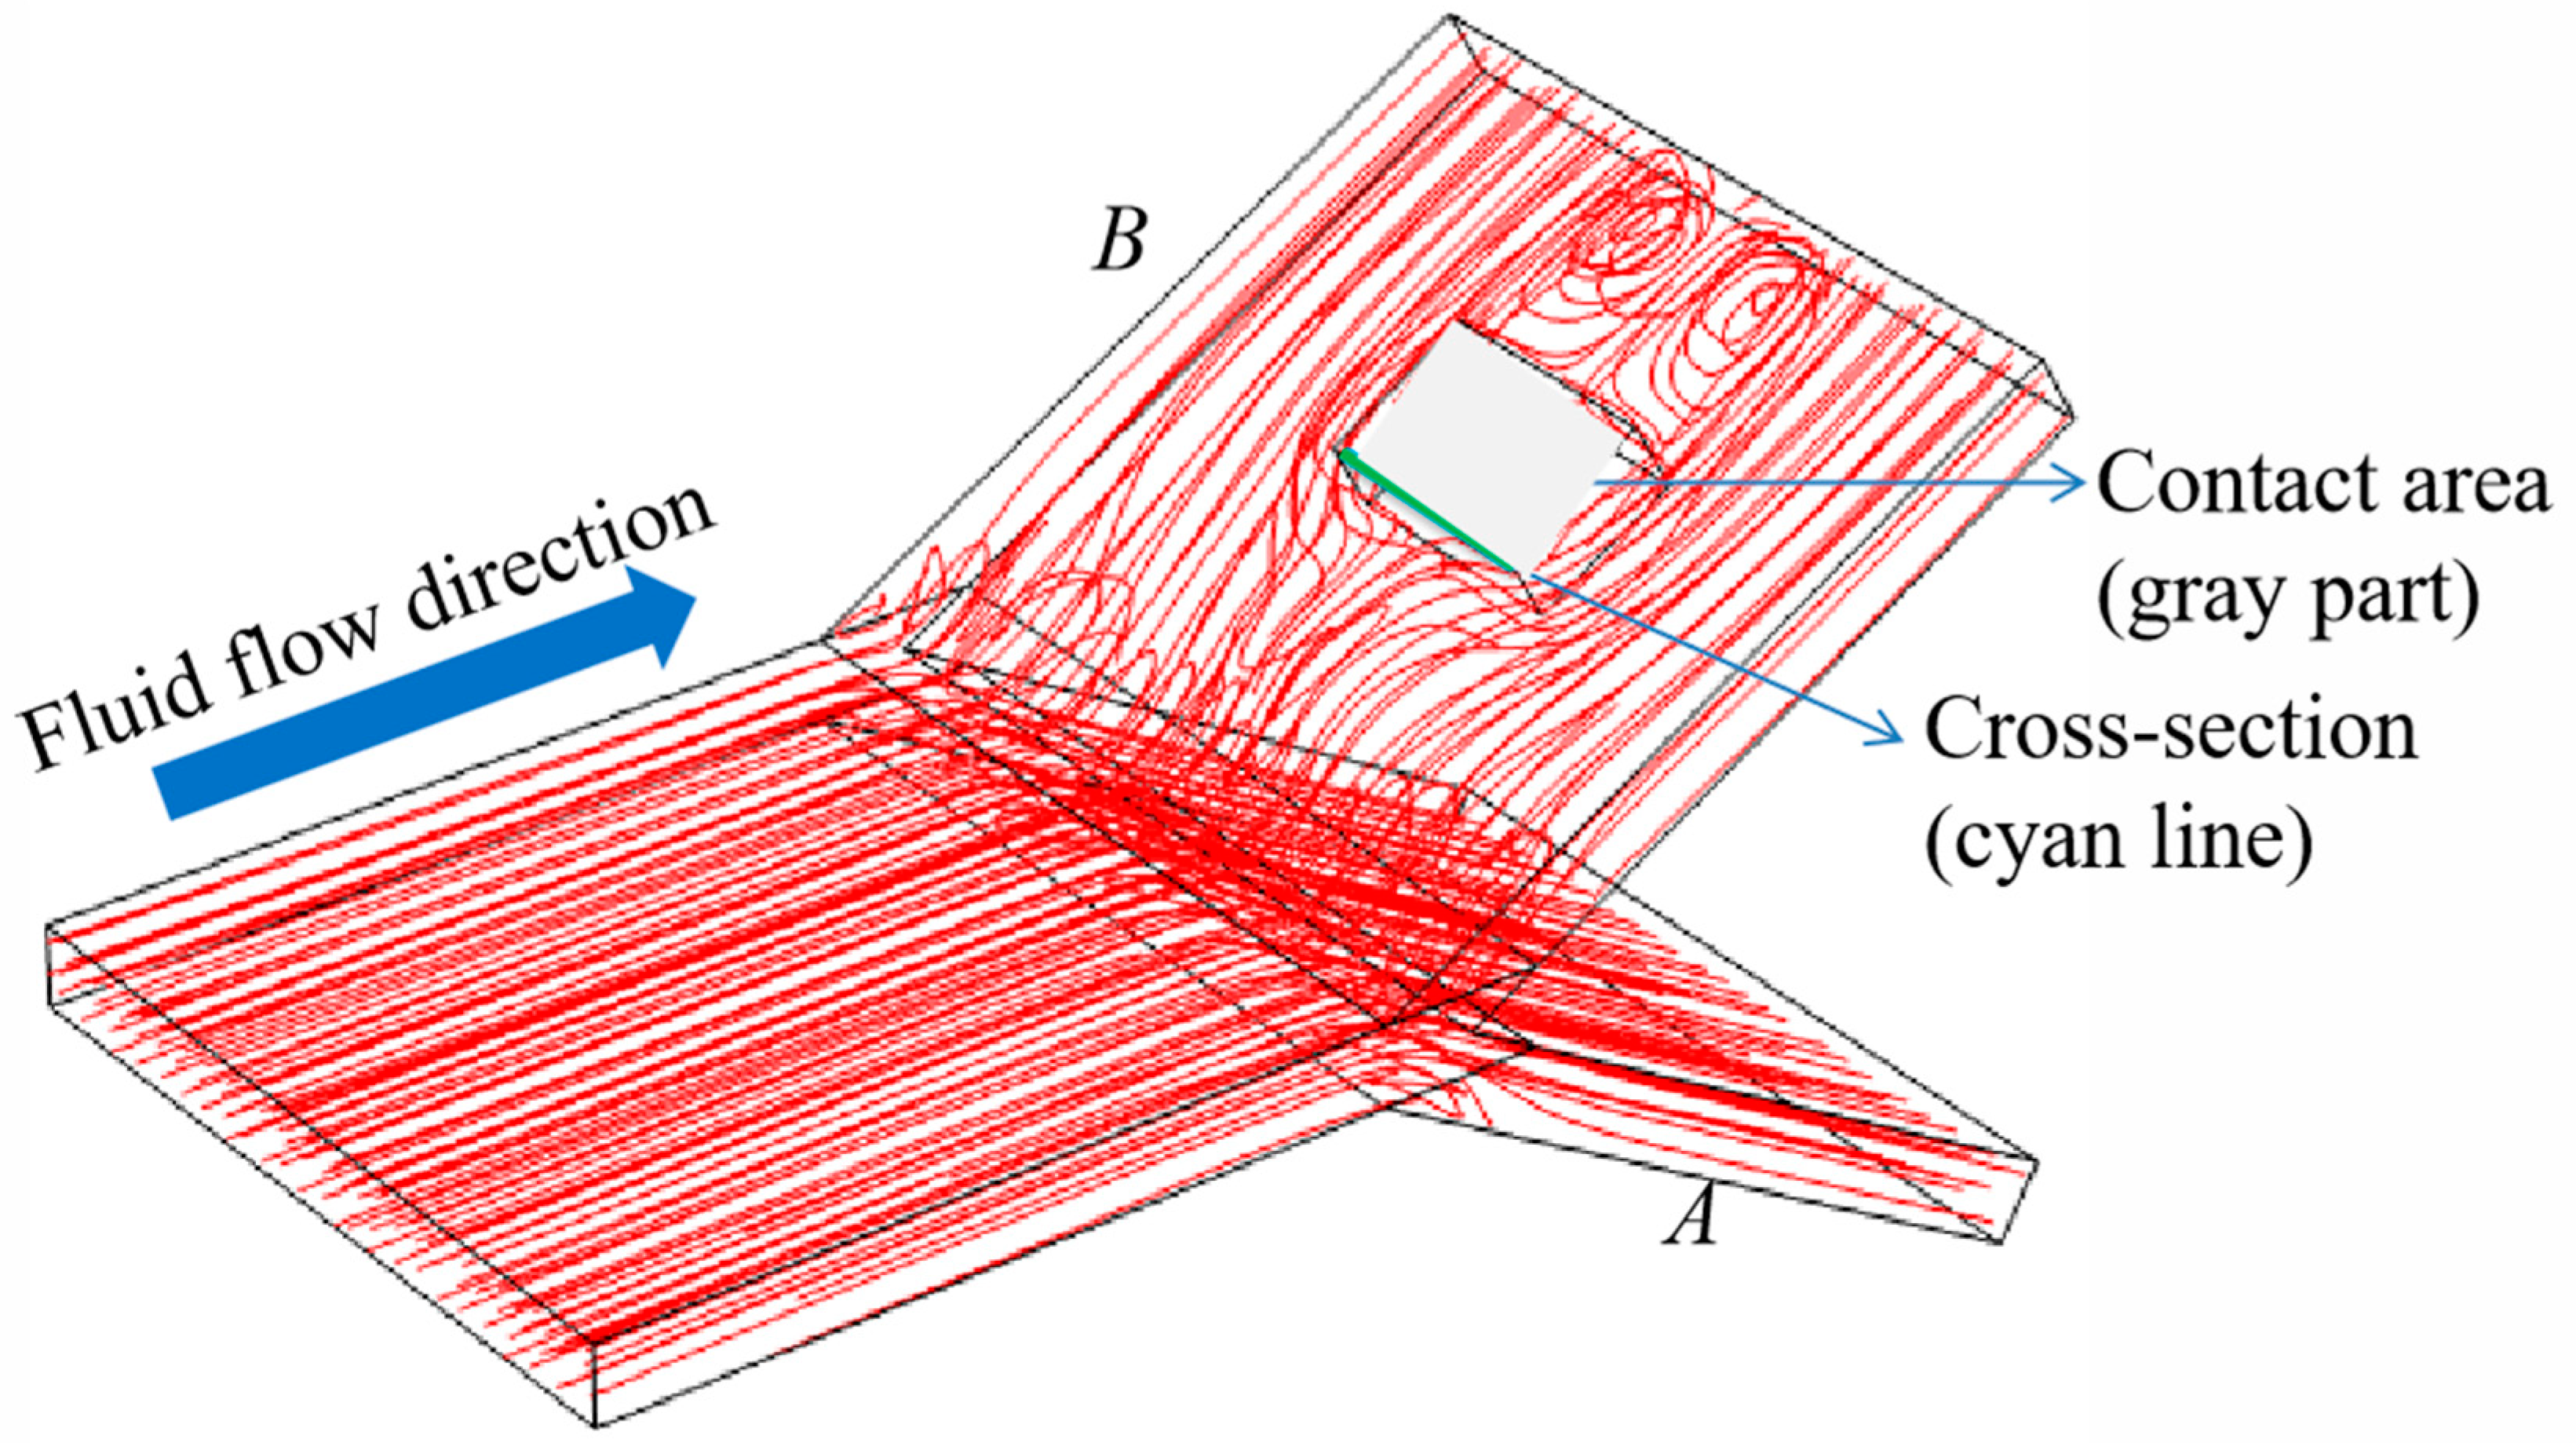
The different roughness qualities of the fractures in different directions would result in different seepage in the fractures. Therefore, to effectively prevent the influence of the fracture surface roughness on the fracture seepage, the bifurcated fracture model was used to consider the seepage, and a rectangular block was set up inside the fracture to control the quantitative contact area. A rectangular contact was set to prevent the influence of the curvature on the seepage while keeping the rectangular position the same. The model has one fluid inlet and two outlets (The permeability of shale is negligible in the experiment). To study the influence of the contact on the fracture seepage more effectively, the change in the contact in the single fracture was considered in the experiments, and the contact area would also produce different seepage results. To investigate which contact parameters affect the seepage results, the effects of the contact area and cross-section length perpendicular to the direction of fluid flow on the seepage were explored.
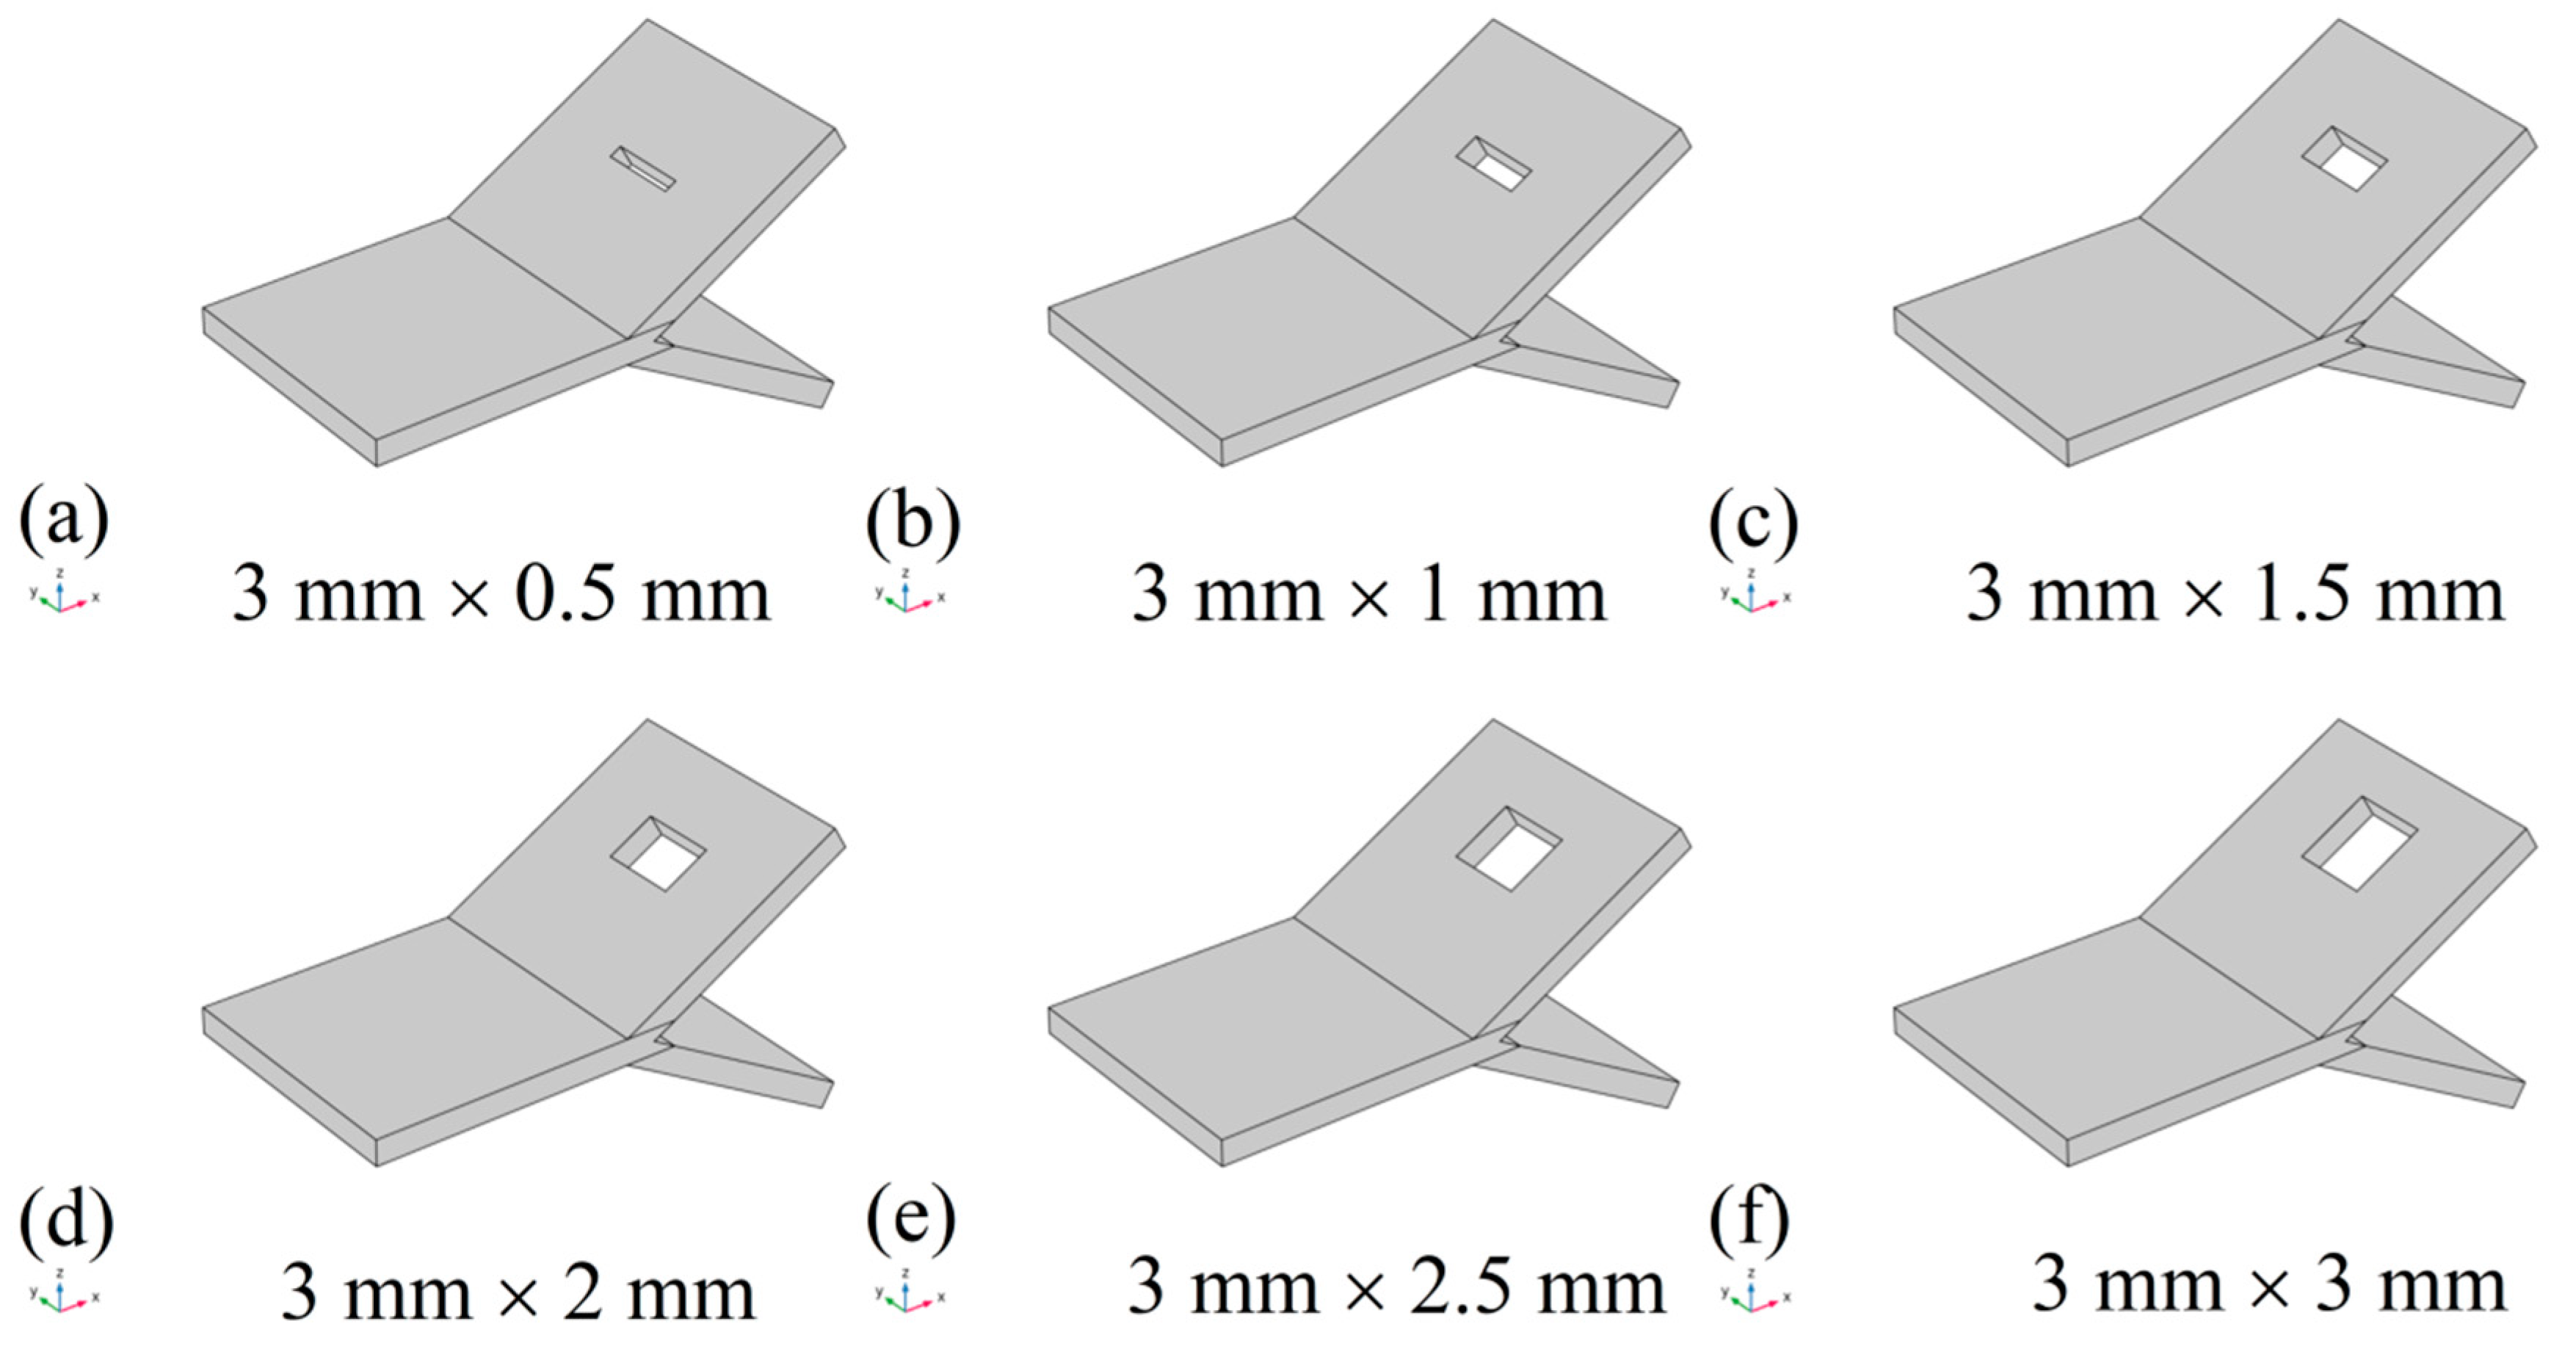
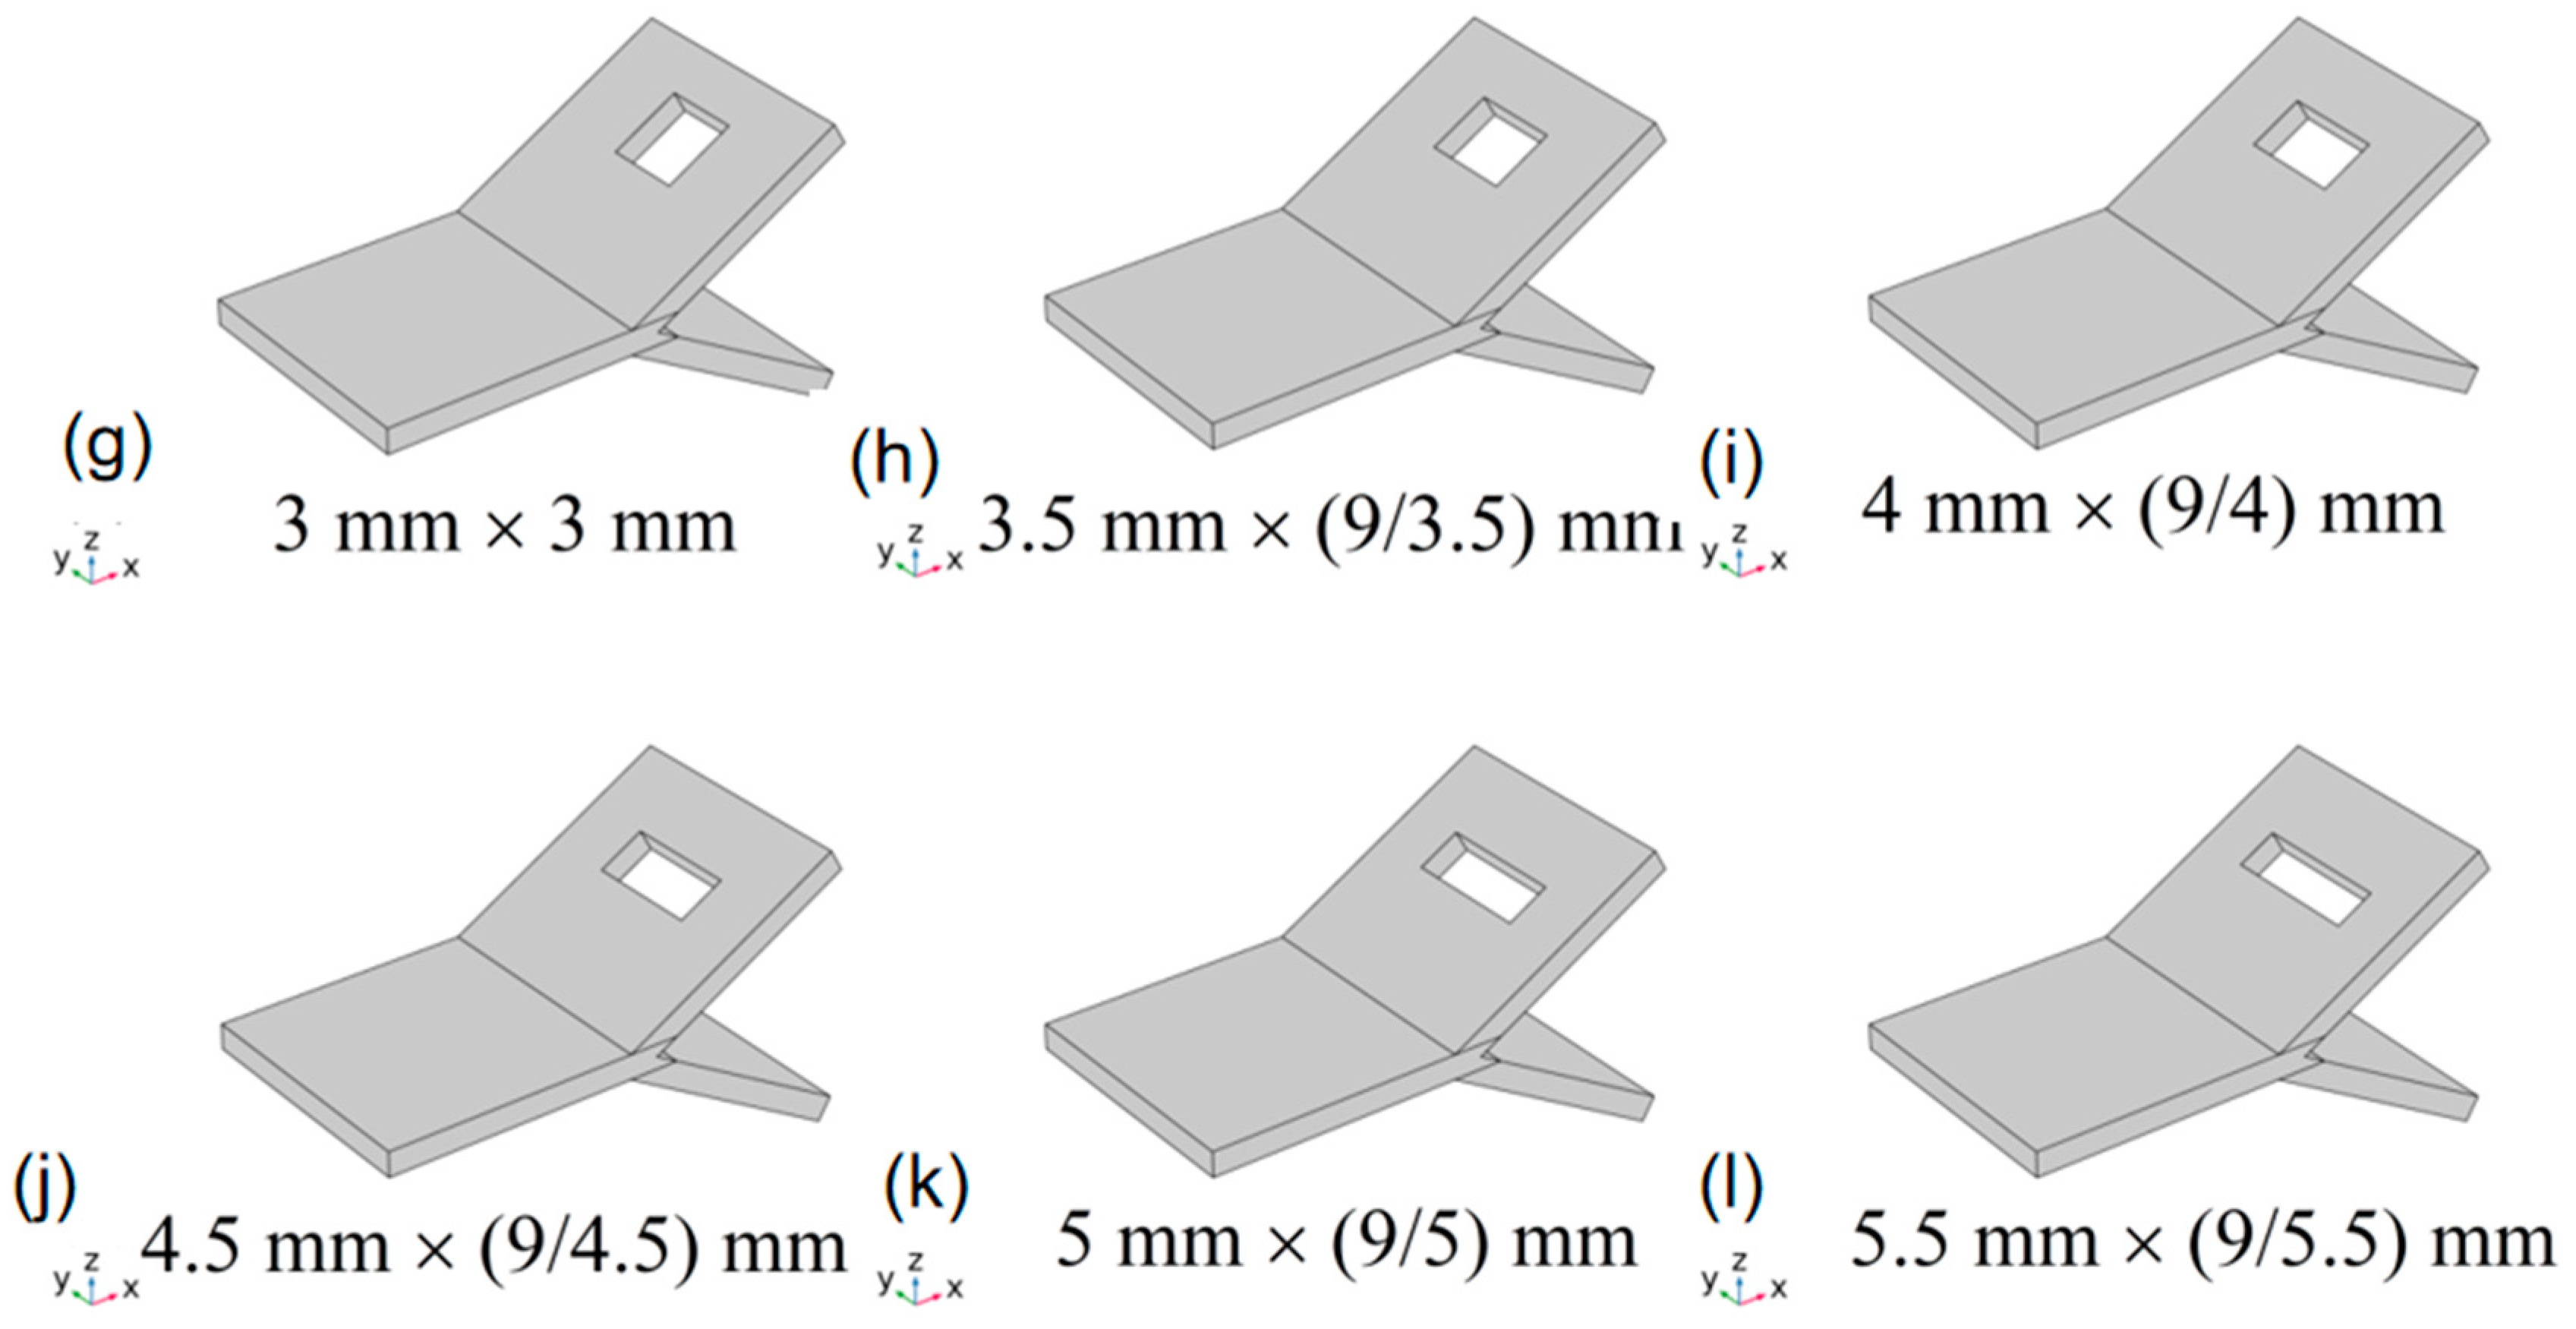
The assumptions of the model are as follows. The direction of the fluid flow is always perpendicular to the cross-section of the contact area, and the aperture of the fracture is the same everywhere, except in the contact area. The contact area hinders the fluid flow (Figure 2). The contact area refers to the size of the contact surface generated by the contact between fracture surfaces, and the cross-section length refers to the length of the contact area perpendicular to the direction of fluid flow. Therefore, there is a contact area on one side of the bifurcated fractures and no contact area on the other side; thus, the effect of the fracture contact on the deflection flow behavior can be better observed. The aperture, width, length, and angle of the designed bifurcated fractures are 1 mm, 10 mm, 20 mm, and 15° (Figure 3). The contact area and cross-section of the designed bifurcated fractures are shown in Table 1 and Table 2. We used the stable flow analysis module from the COMSOL software, set up the corresponding water inlet, outlet, and boundary conditions and analyzed the corresponding water velocity changes at the exits under the condition of fixed inflow flow.
3. Experiments
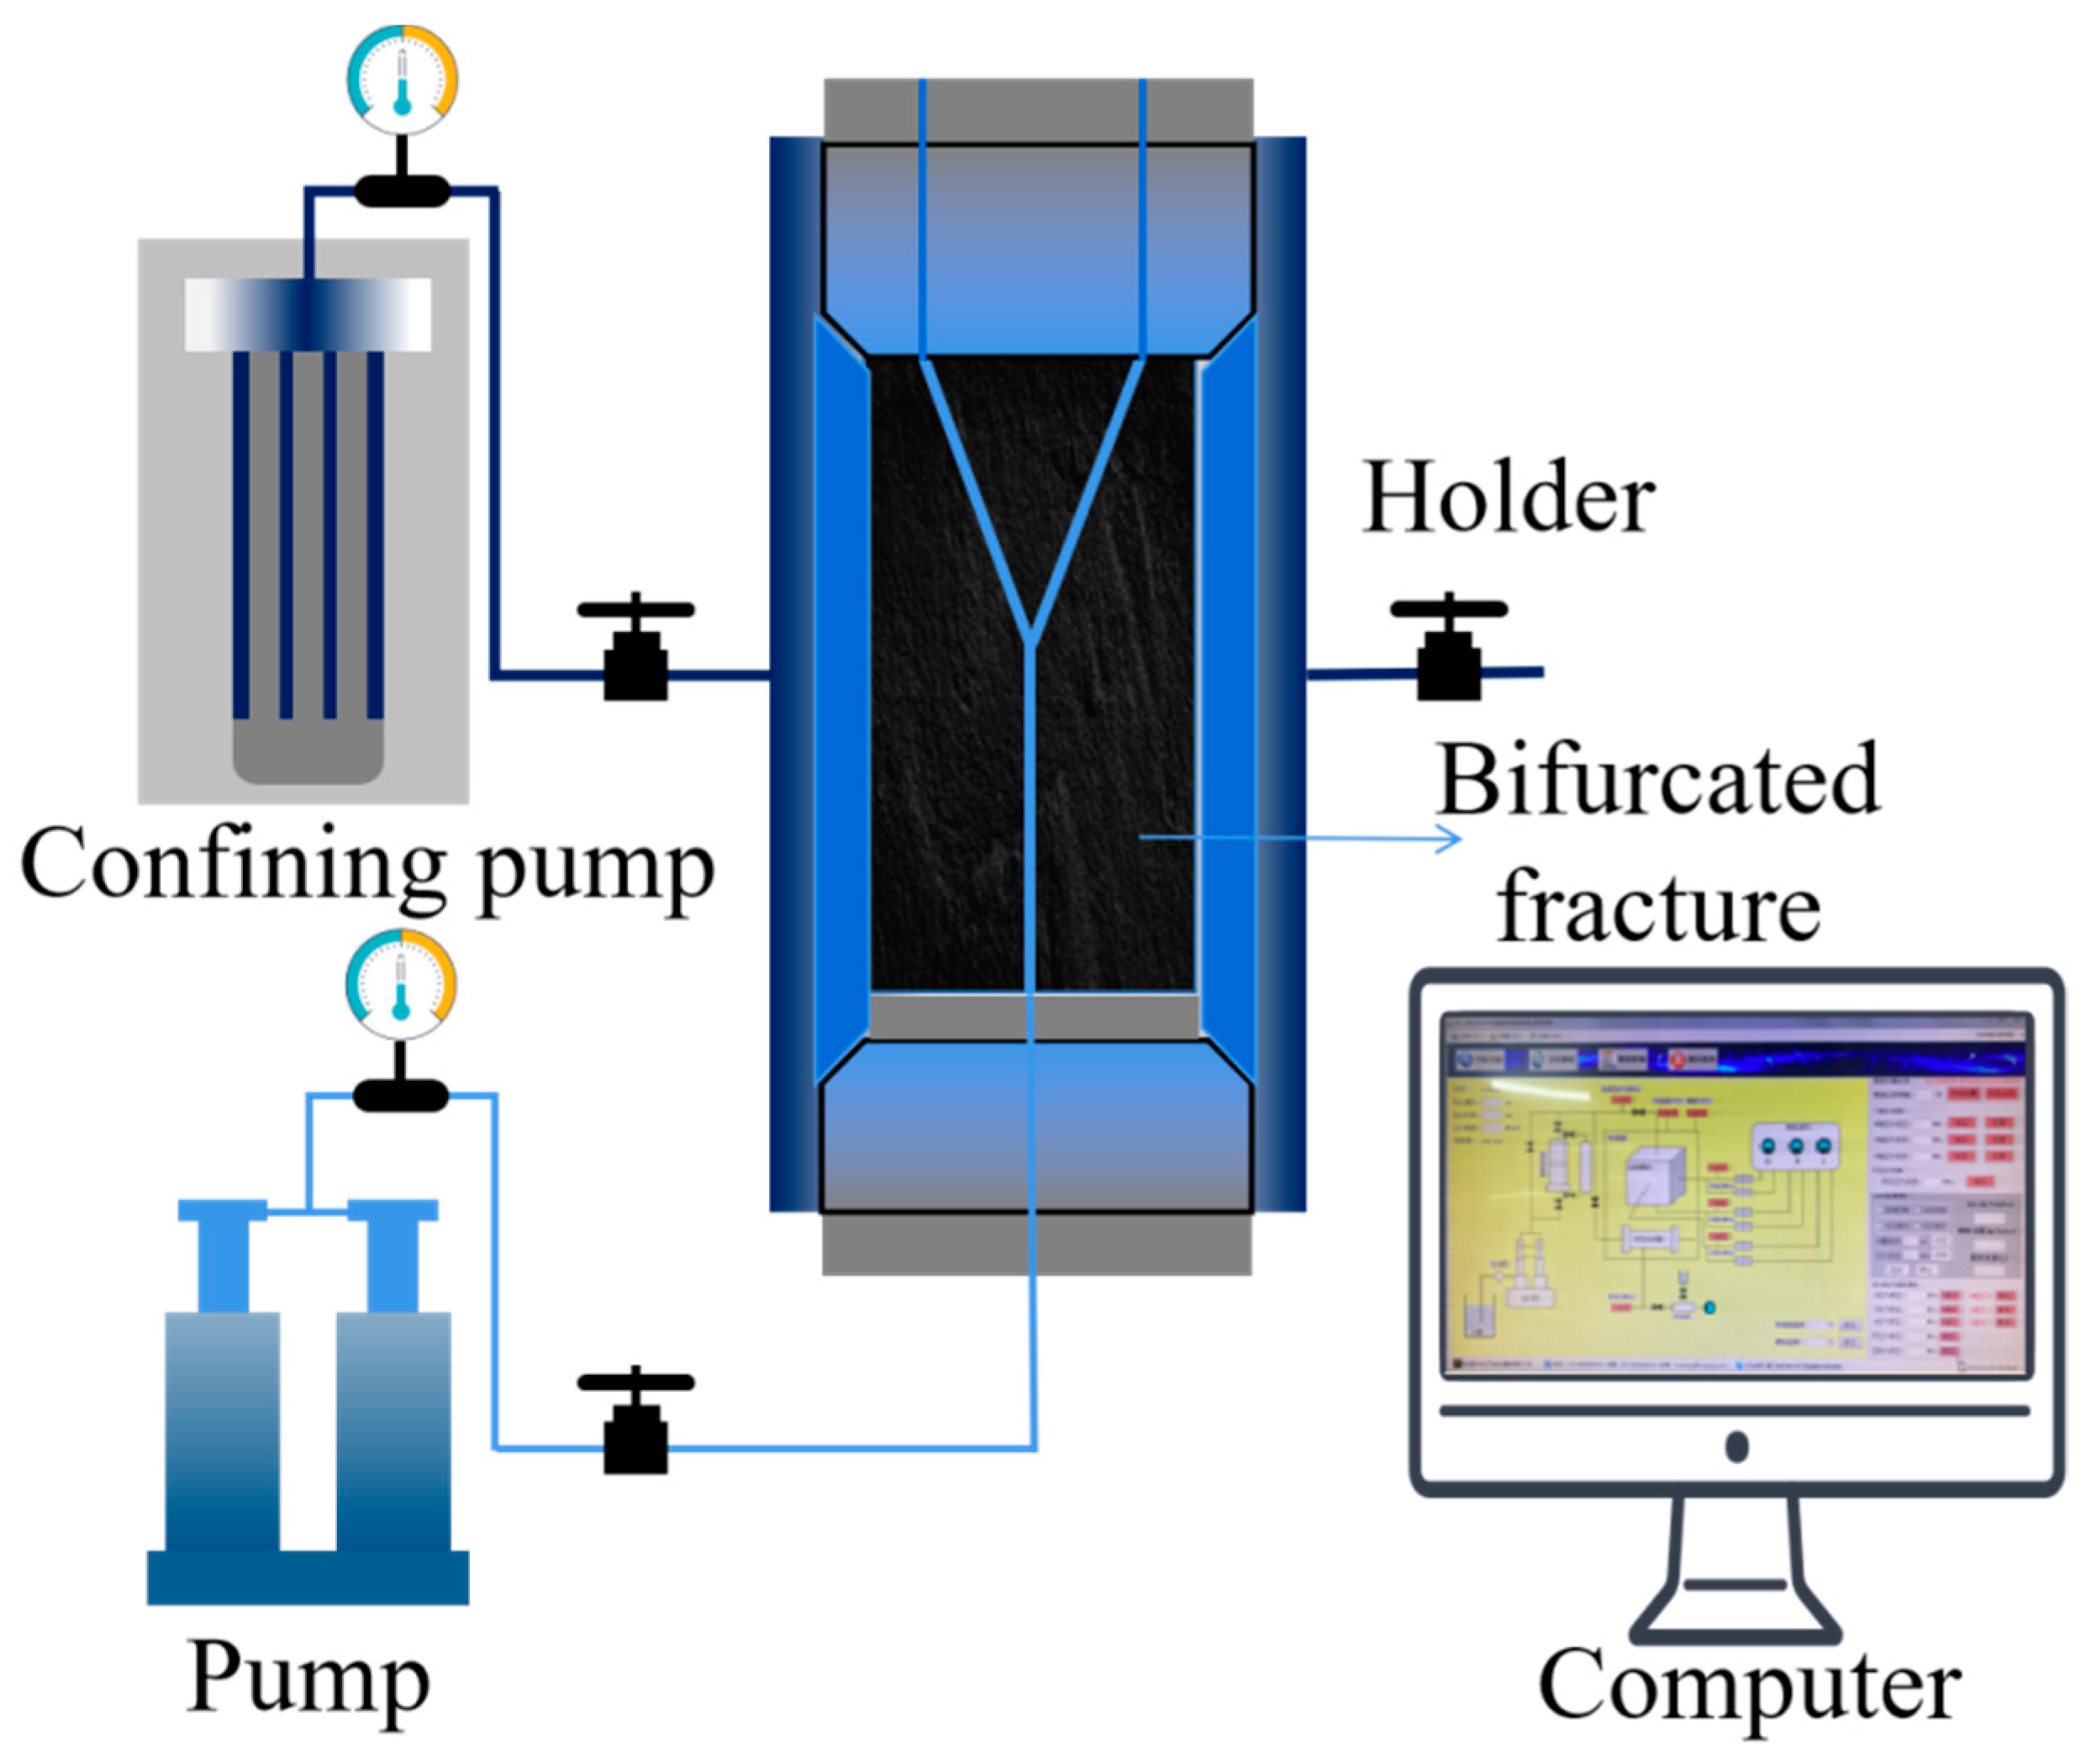
An illustration of the experimental design is shown in Figure 4. The outer wall of the holder and the rubber sleeve form an airtight space that provides confining pressure (blue part). The fluid passing through the rock will only flow through the fracture under confining pressure, and a flow balance is set up at the outlet of the instrument to monitor the flow rate. The rock sample containing bifurcated fractures was placed in the holder. The single fracture was set as the inlet, and the two bifurcated fractures were set as the outlets. Two pumps were used to provide the confining pressure and flow. The fluid flowed out along the shunt as it passed through the bifurcated fractures. The influence of fluid mixing at the outlet was avoided in the experiment. In the experiment, the confining pressure (Pc) was set to 1–6 MPa, and the inlet flow was set (Figure 5). The flow balance was used to monitor the flow at the two outlets. The deflection flow behavior in the bifurcated fractures after fracture contact under confining pressure was studied.
The numerical simulation process adopted a similar design to that in the experiments, and the inlet flow was set as 1 m/s to monitor the flow from the two outlets.
4. Results and Discussion
4.1. Nonlinear Flow Behavior in Bifurcated Fractures
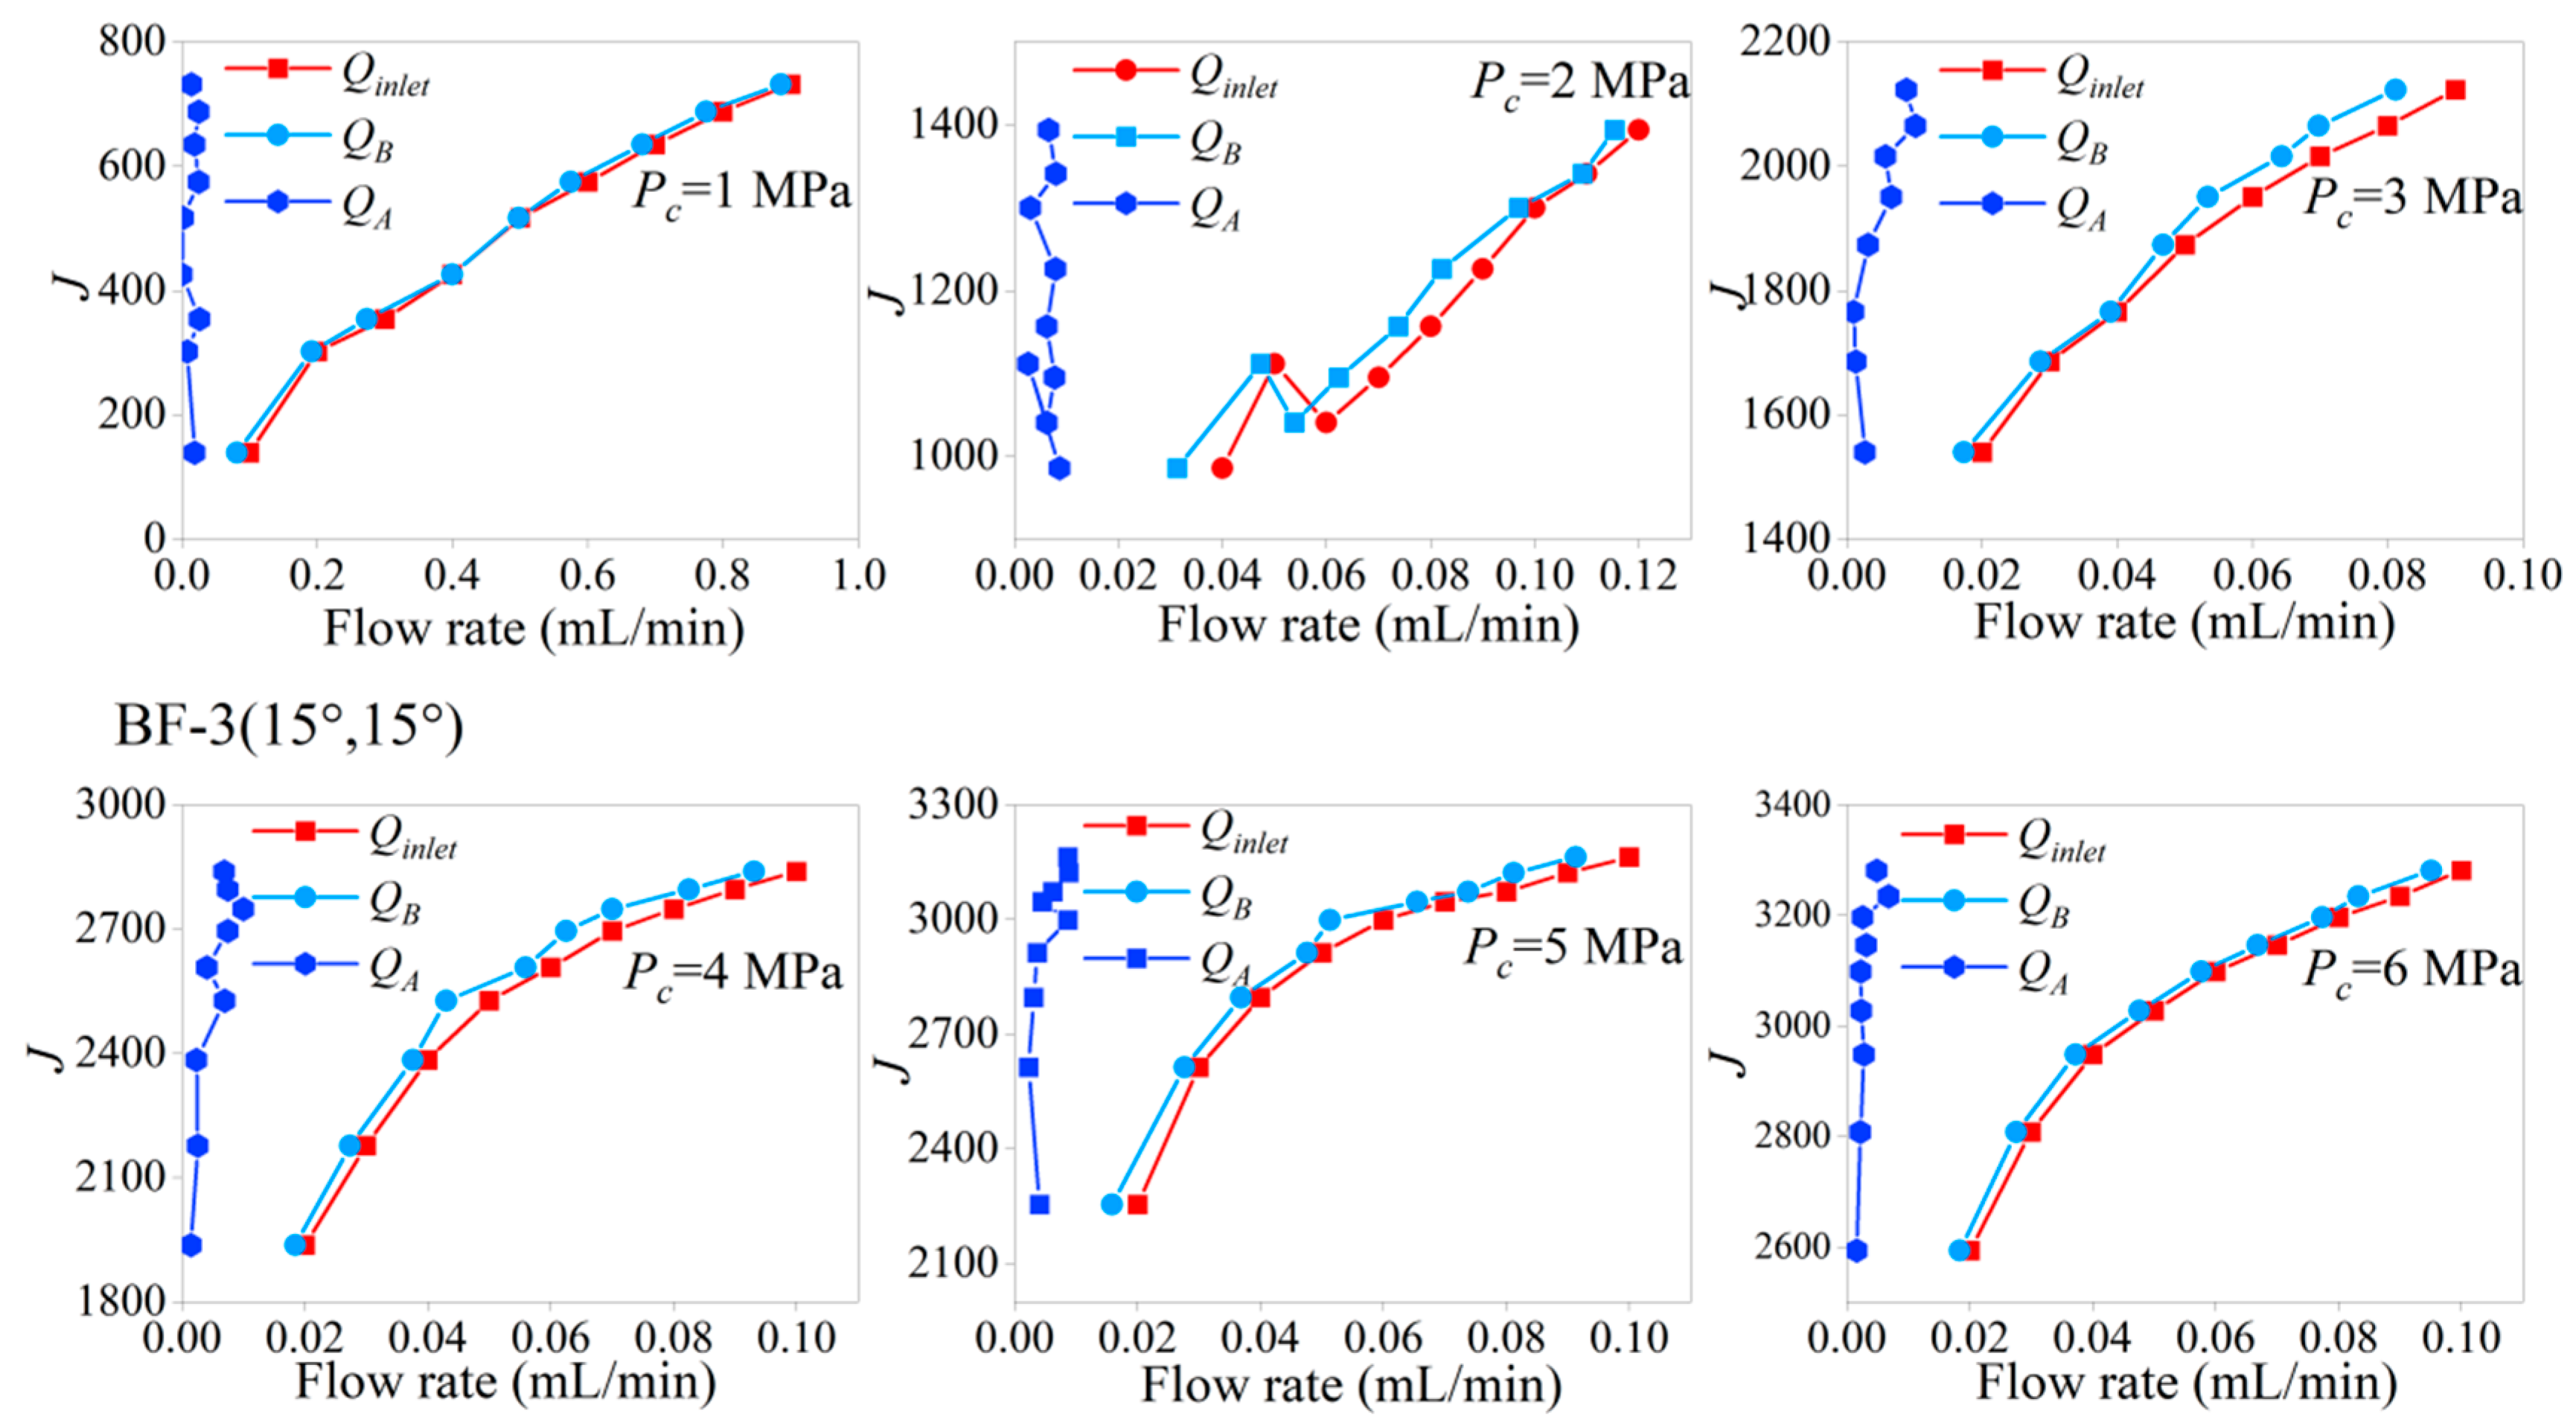
For the seepage in the bifurcated fractures, the relationship between the hydraulic slope (J) and fluid flow volume (Q) is shown in Figure 5. These results show that J increases nonlinearly as Q increases.
Figure 5 shows when the angle of the bifurcated fracture was symmetric and when the outlet flows of the fractures were different. The flow in FB was much larger than that in FA (1–6 MPa). This deflection flow behavior was caused by the different contact areas of the rock fracture surfaces under the confining pressure. The fracture contact reflects the water-conducting property of the fracture (Nemoto et al., 2009). The size of the contact area determines the seepage properties of the different fractures. To further confirm that fracture contact had a substantial effect on the seepage, a pressure measuring film was used to study the fracture contact under different confining pressures.
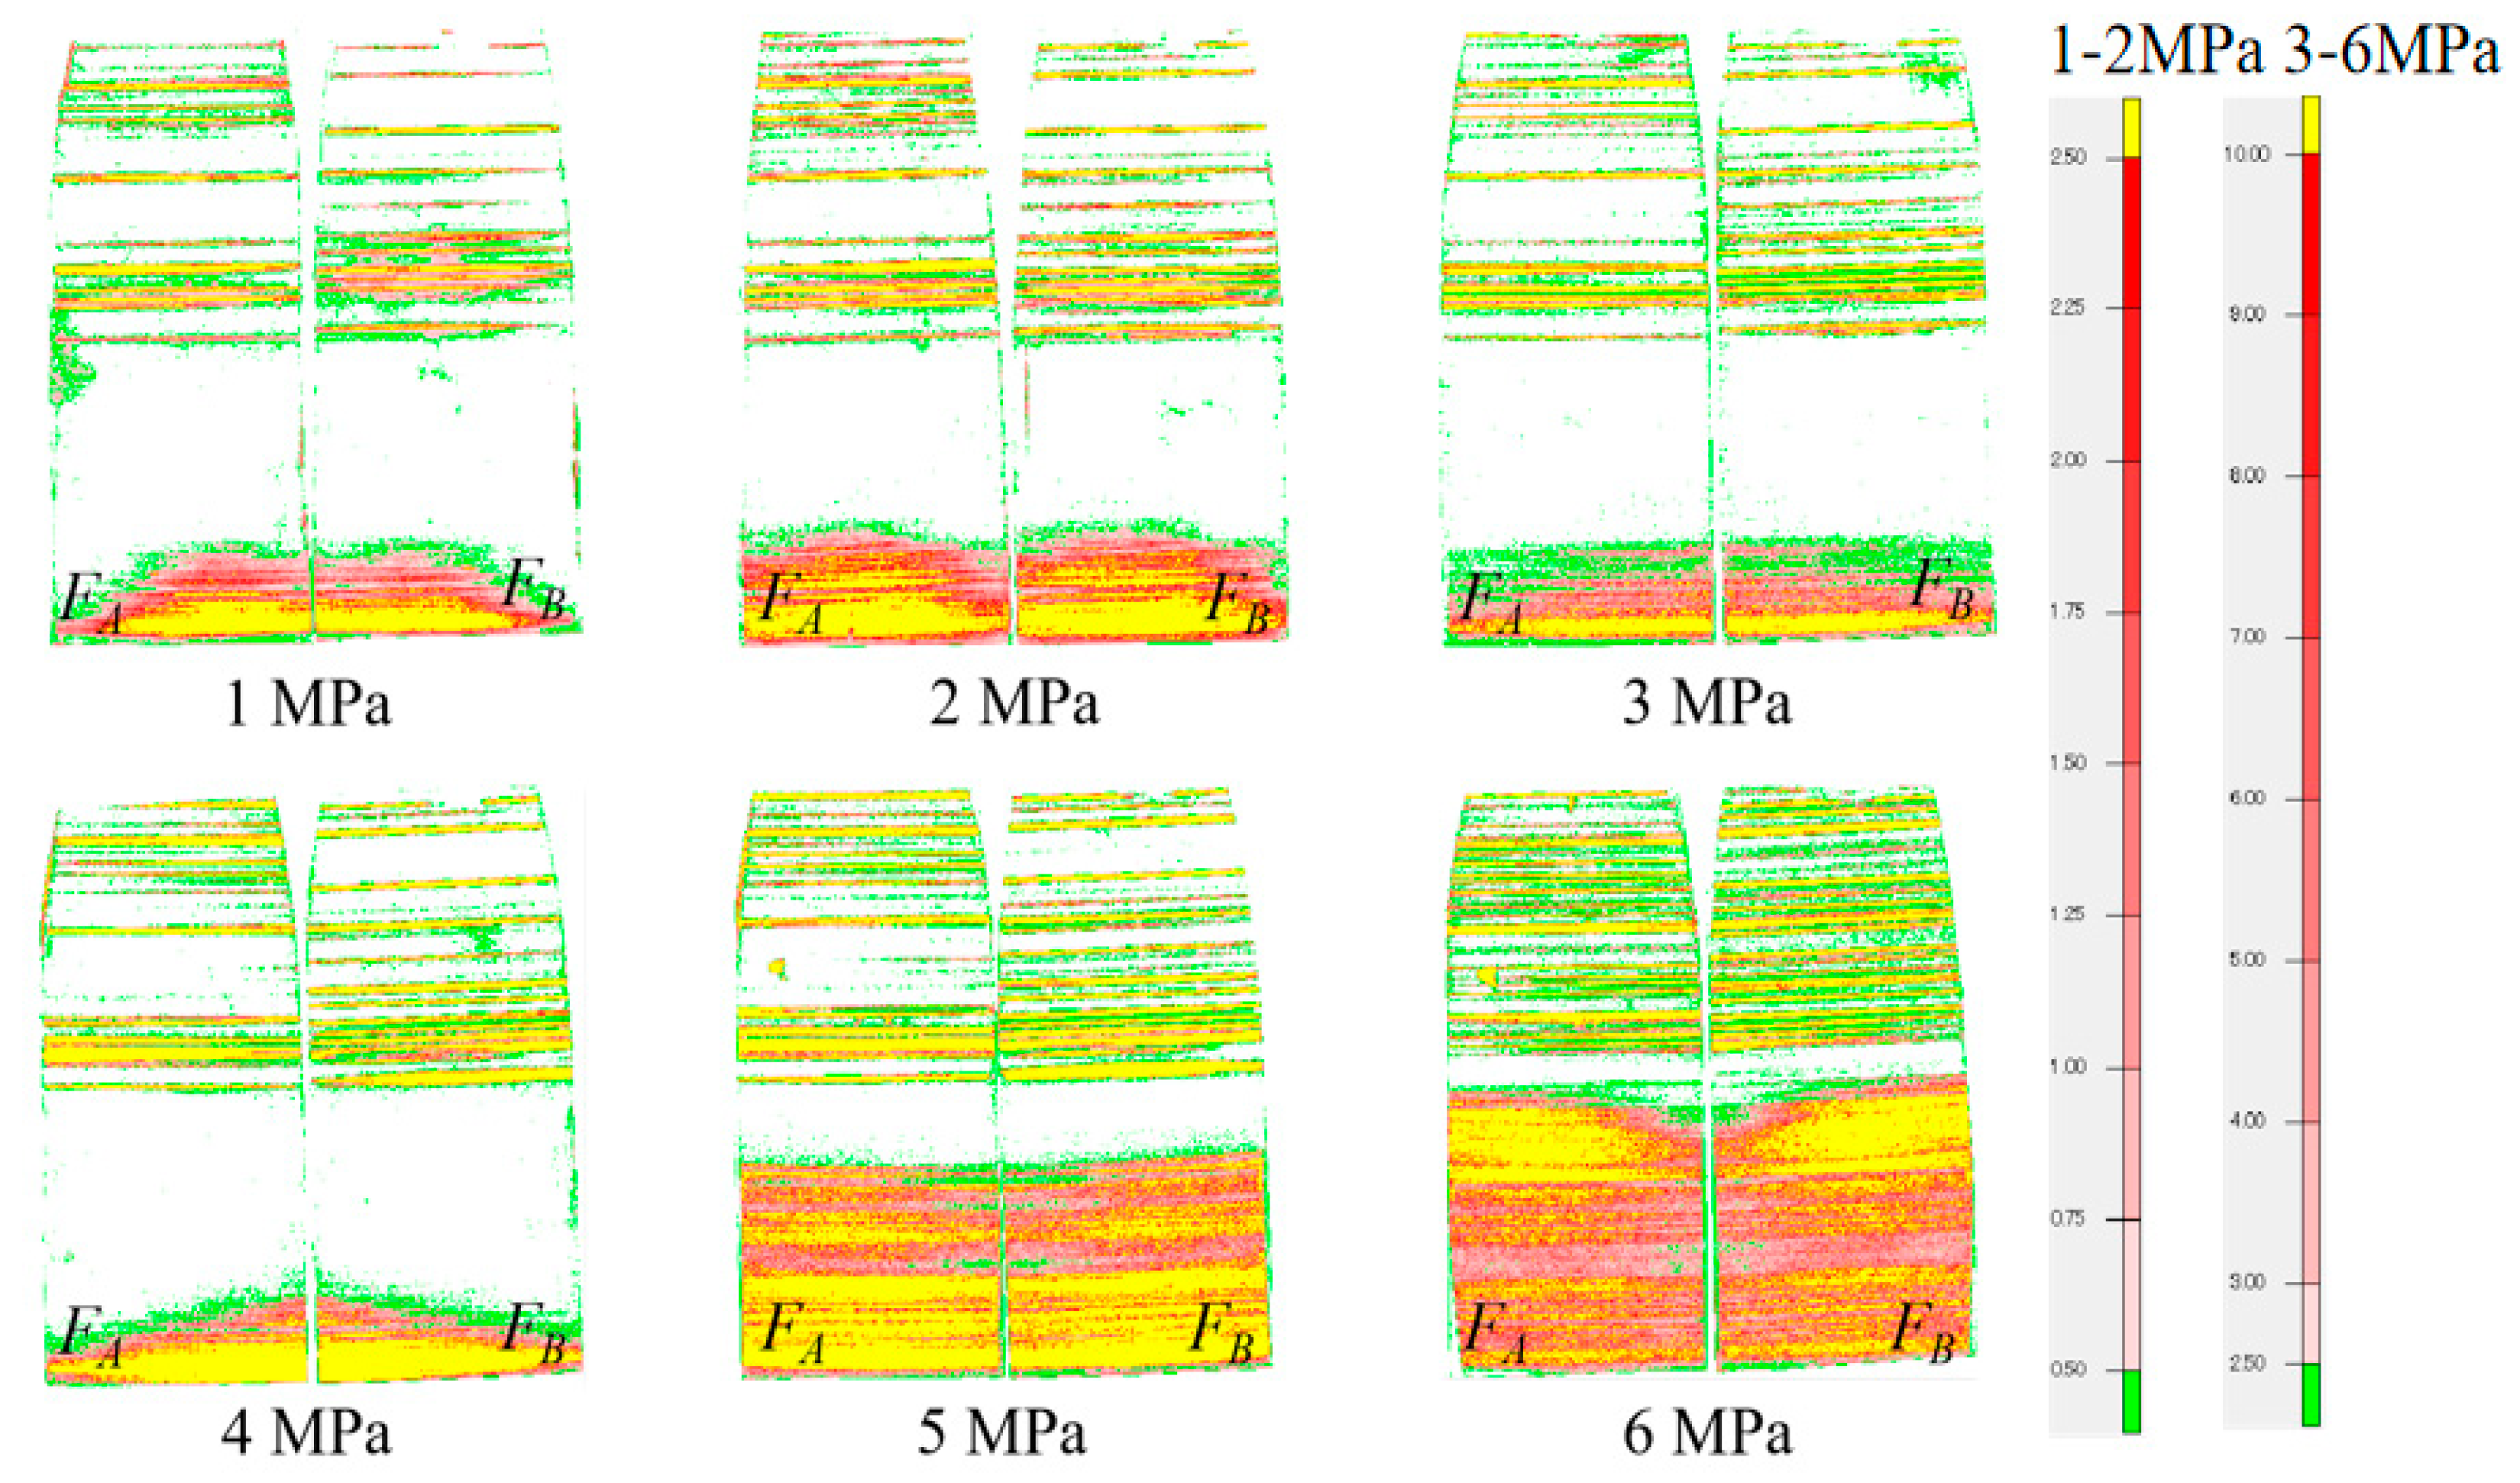
There are many microcapsules with red pigments on the surface of Fuji pressure film. When the fracture surfaces come into contact, the capsules break, the pigment spreads, and red traces can be clearly seen on the pressure film. The greater the pressure on the fracture, the redder of color will be. Therefore, the change in the contact of the fracture with increasing pressure can be clearly observed using this mechanism.
We measured the fracture contact under different confining pressures (1–6 MPa). The differences in contact areas in the bifurcated fractures during pressurization are shown by the red areas in Figure 6. In addition, to analyze the performance under the different pressures in more detail, we used software to process the pressure film (Figure 6).
Each contact position in the fracture under a confining pressure was obtained from Figure 6. As the pressure increased, the contact areas of the fractures increased. We calculated the contacts and stresses of the two bifurcated fractures under pressure (Table 3). It was found that the pressure area and stress of the pressure film corresponded to the seepage in the bifurcated fractures. When the load on one side was greater than that on the other side, the contact hindered the seepage of the fluid, causing the fluid to flow selectively [7,26]. The strip-like contact area in the fracture also hindered the gradual fluid flow, resulting in a large difference in the outlet flows of the bifurcated fractures.
Through the experiments described above, it was proven that the fracture contact area had an effect on the seepage, resulting in the deflection flow behavior. However, through an analysis of the fracture contact (Table 3) and outflow (Figure 5), it was found that they are not well correlated. In Figure 5, most of the fluid flowed out of FB, and only a small part of it flowed out of FA. In Table 1, there was little difference in the contact areas of the bifurcated fractures under stress. The difference between the two datasets proves that other relevant factors also hindered the fluid flow. As the fluid passed through the contact area, it flowed around both sides until the contact was bypassed. When the cross-section of the fracture contact was longer, the time it took for the fluid flow to pass the contact was greater. Moreover, the fluid velocity gradually decreased as the contact area increased. Therefore, the deflection flow behavior of the fluid was not controlled by a single factor, i.e., the contact area and the cross-section of the contact may also have affected the deflection flow behavior. In the numerical simulations, a single contact was set, and different areas and cross-sections of the contract were set to explore the causes of deflection flow.
4.2. Effect of Contact Area on Defection Flow Behavior for a Given Cross-Section
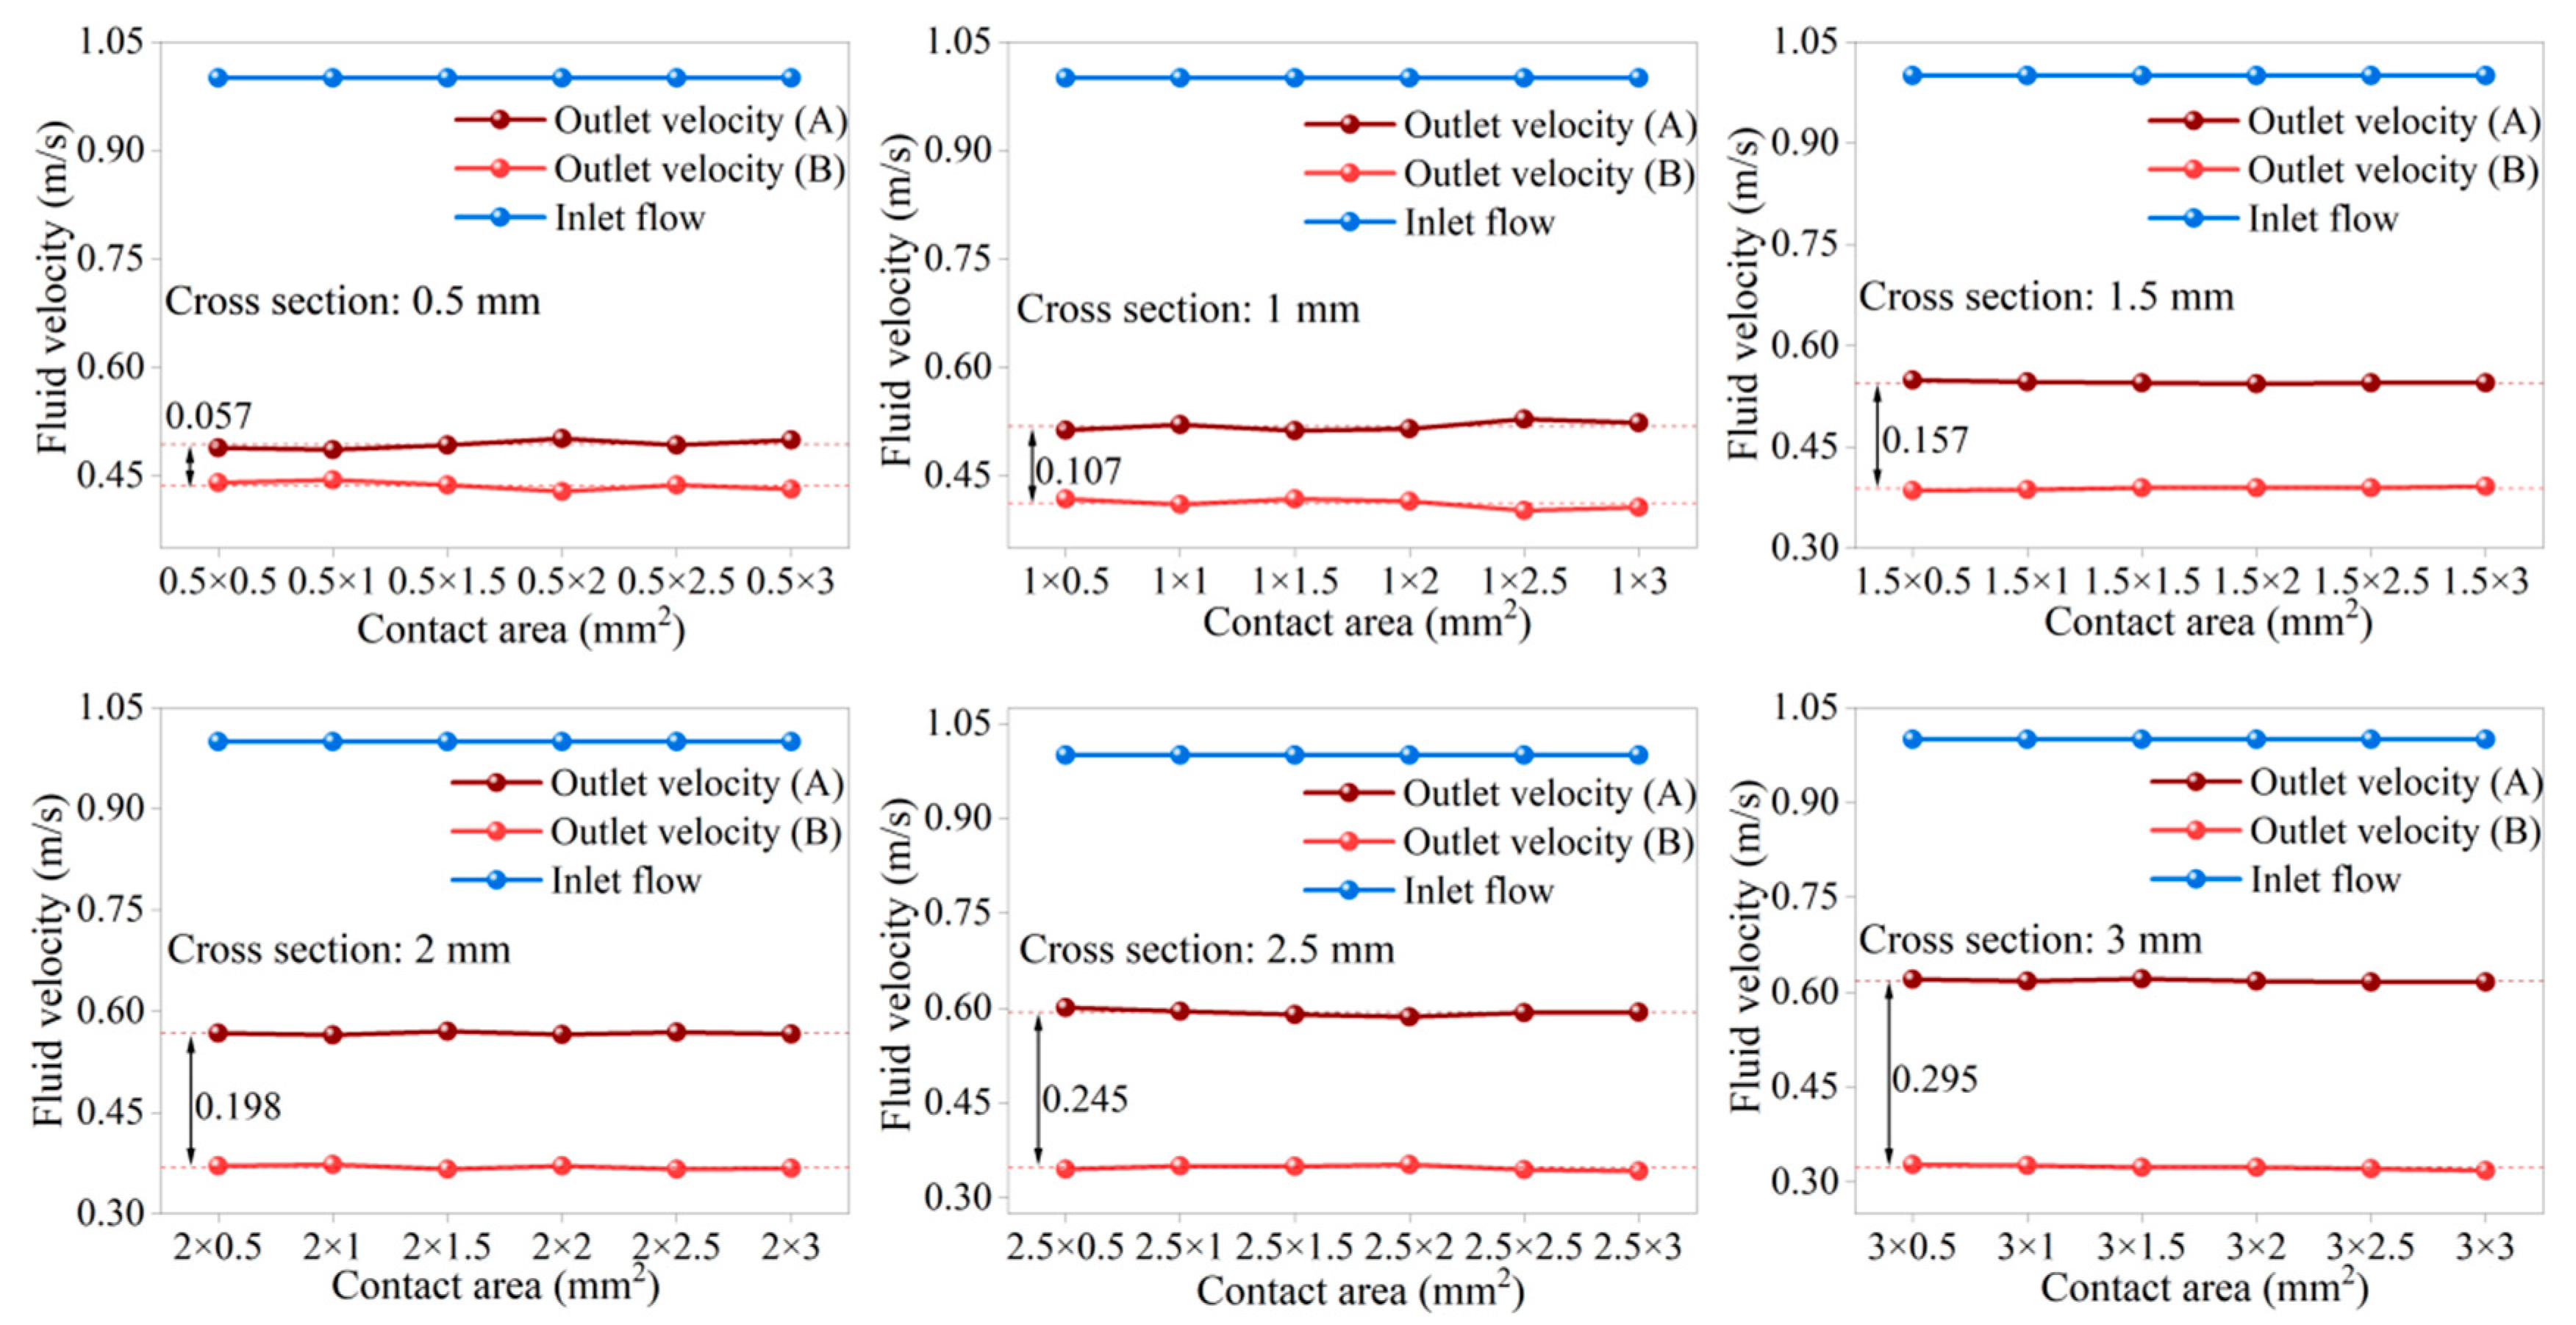
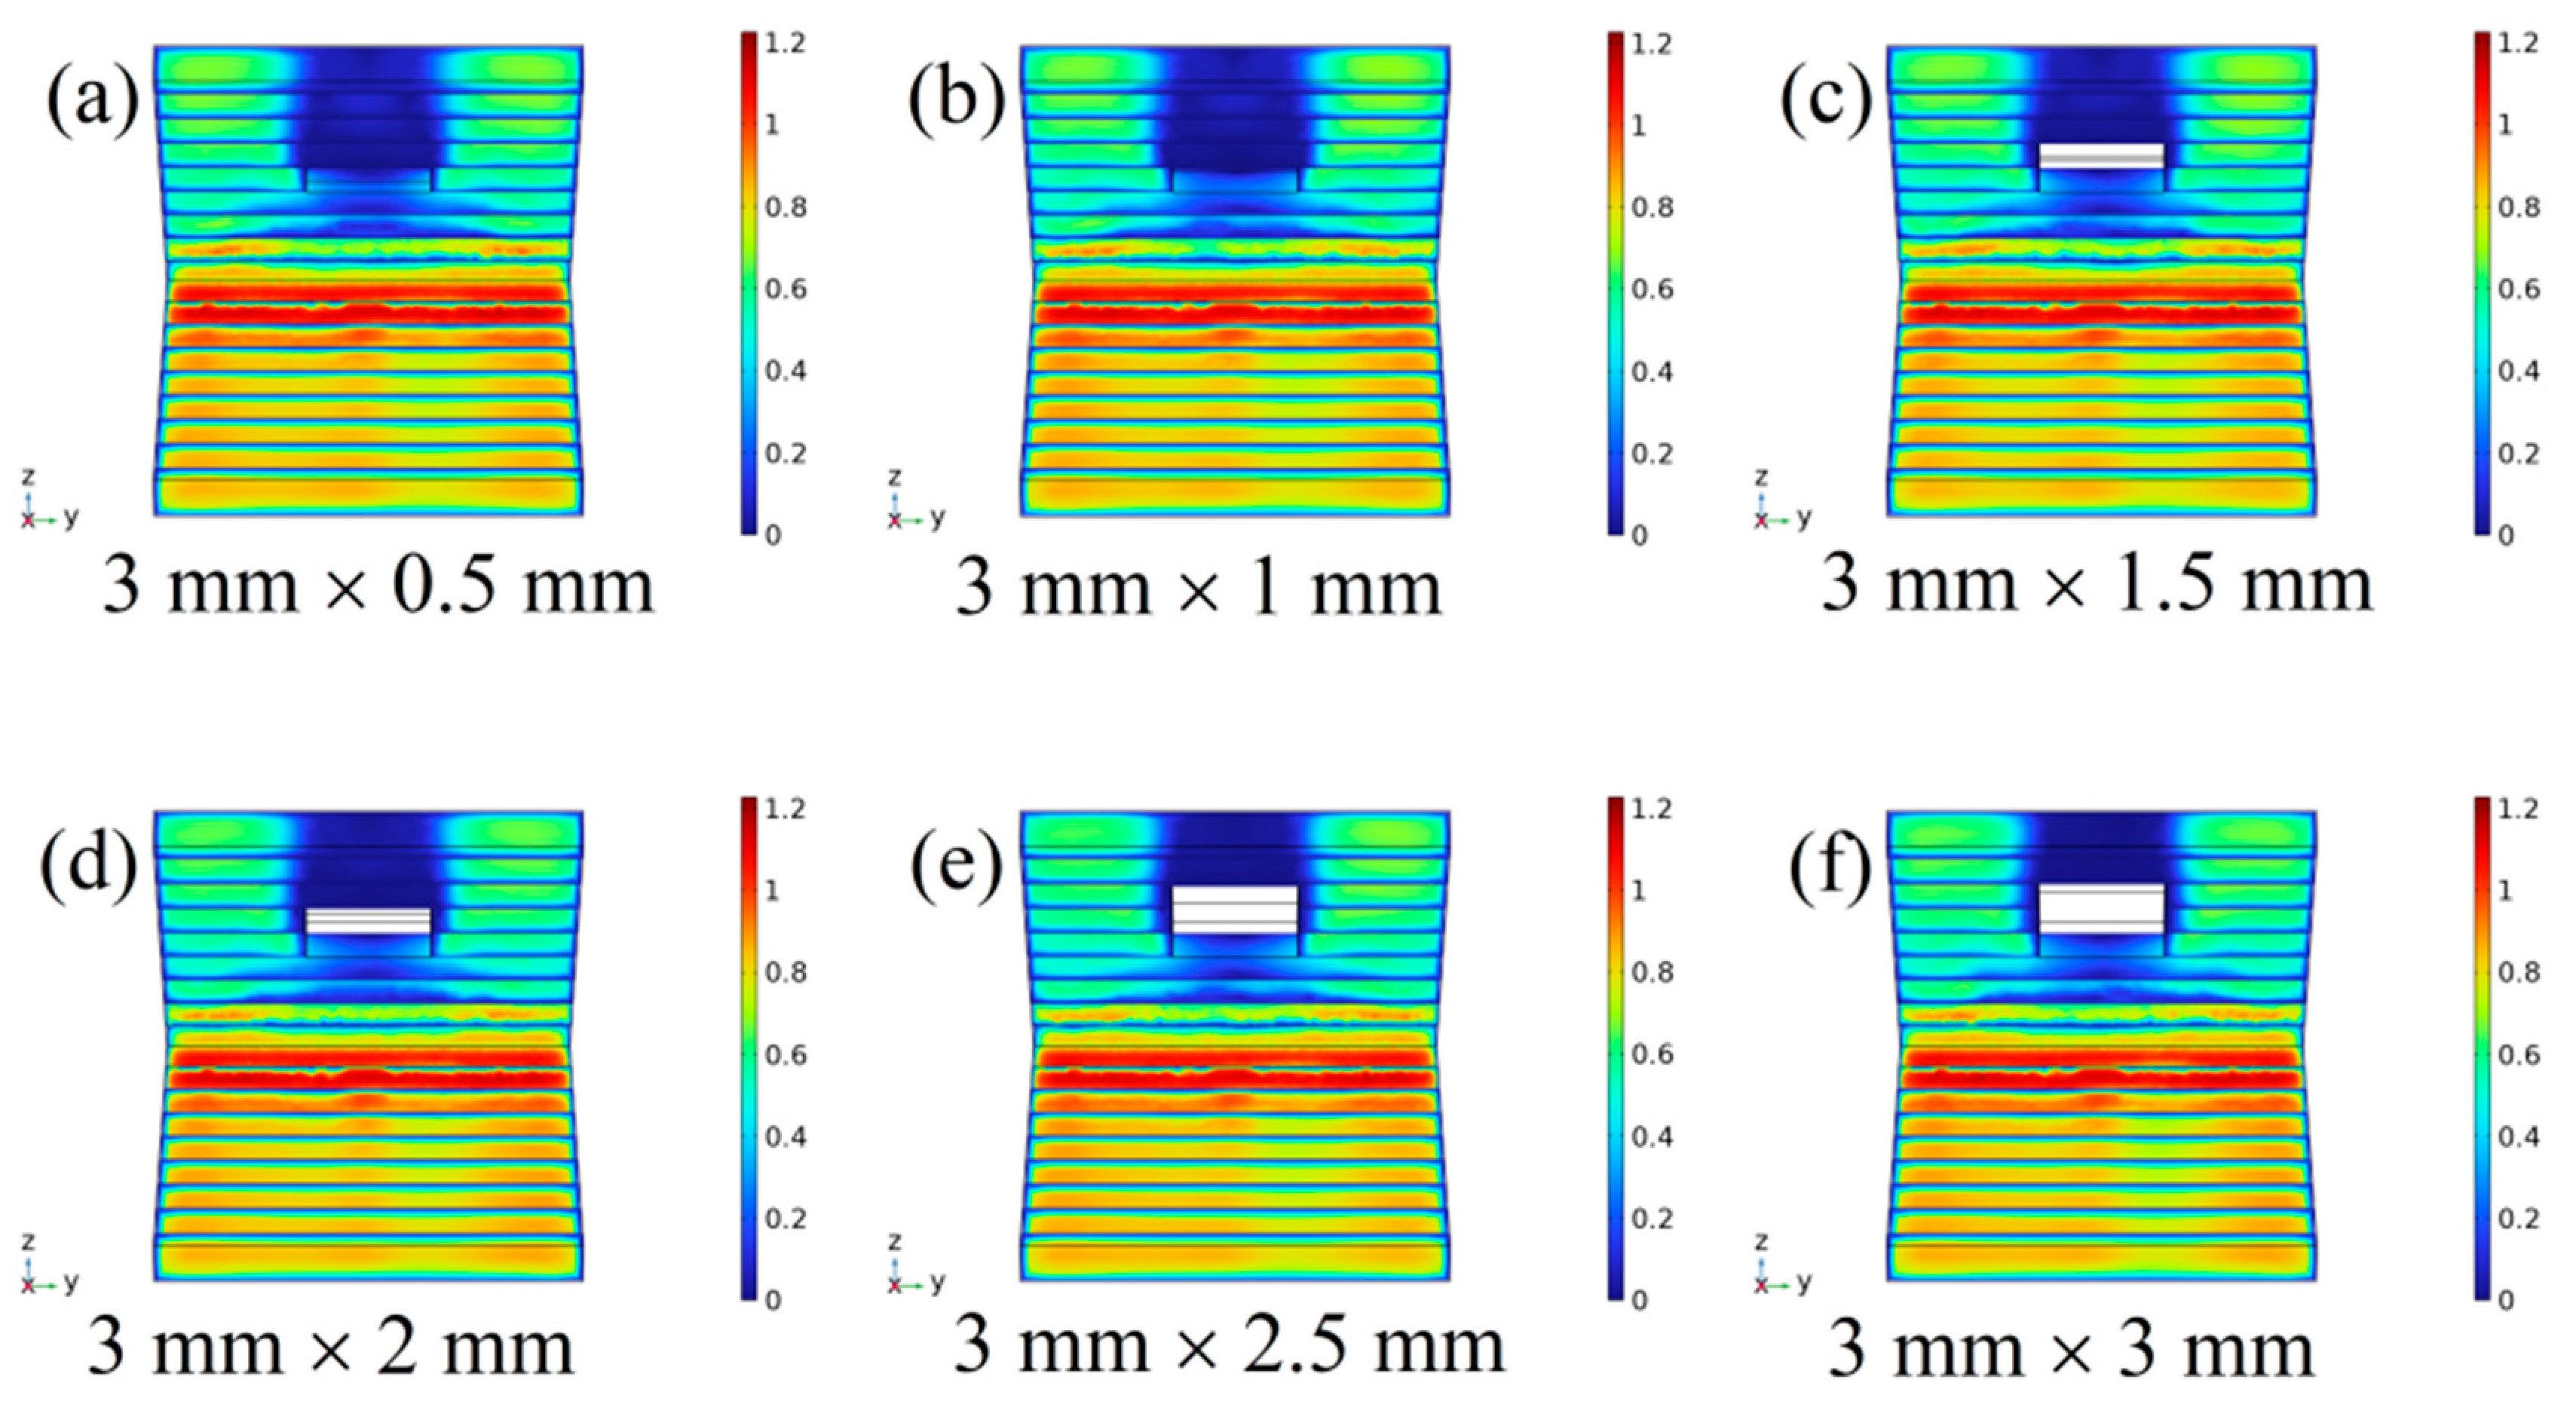
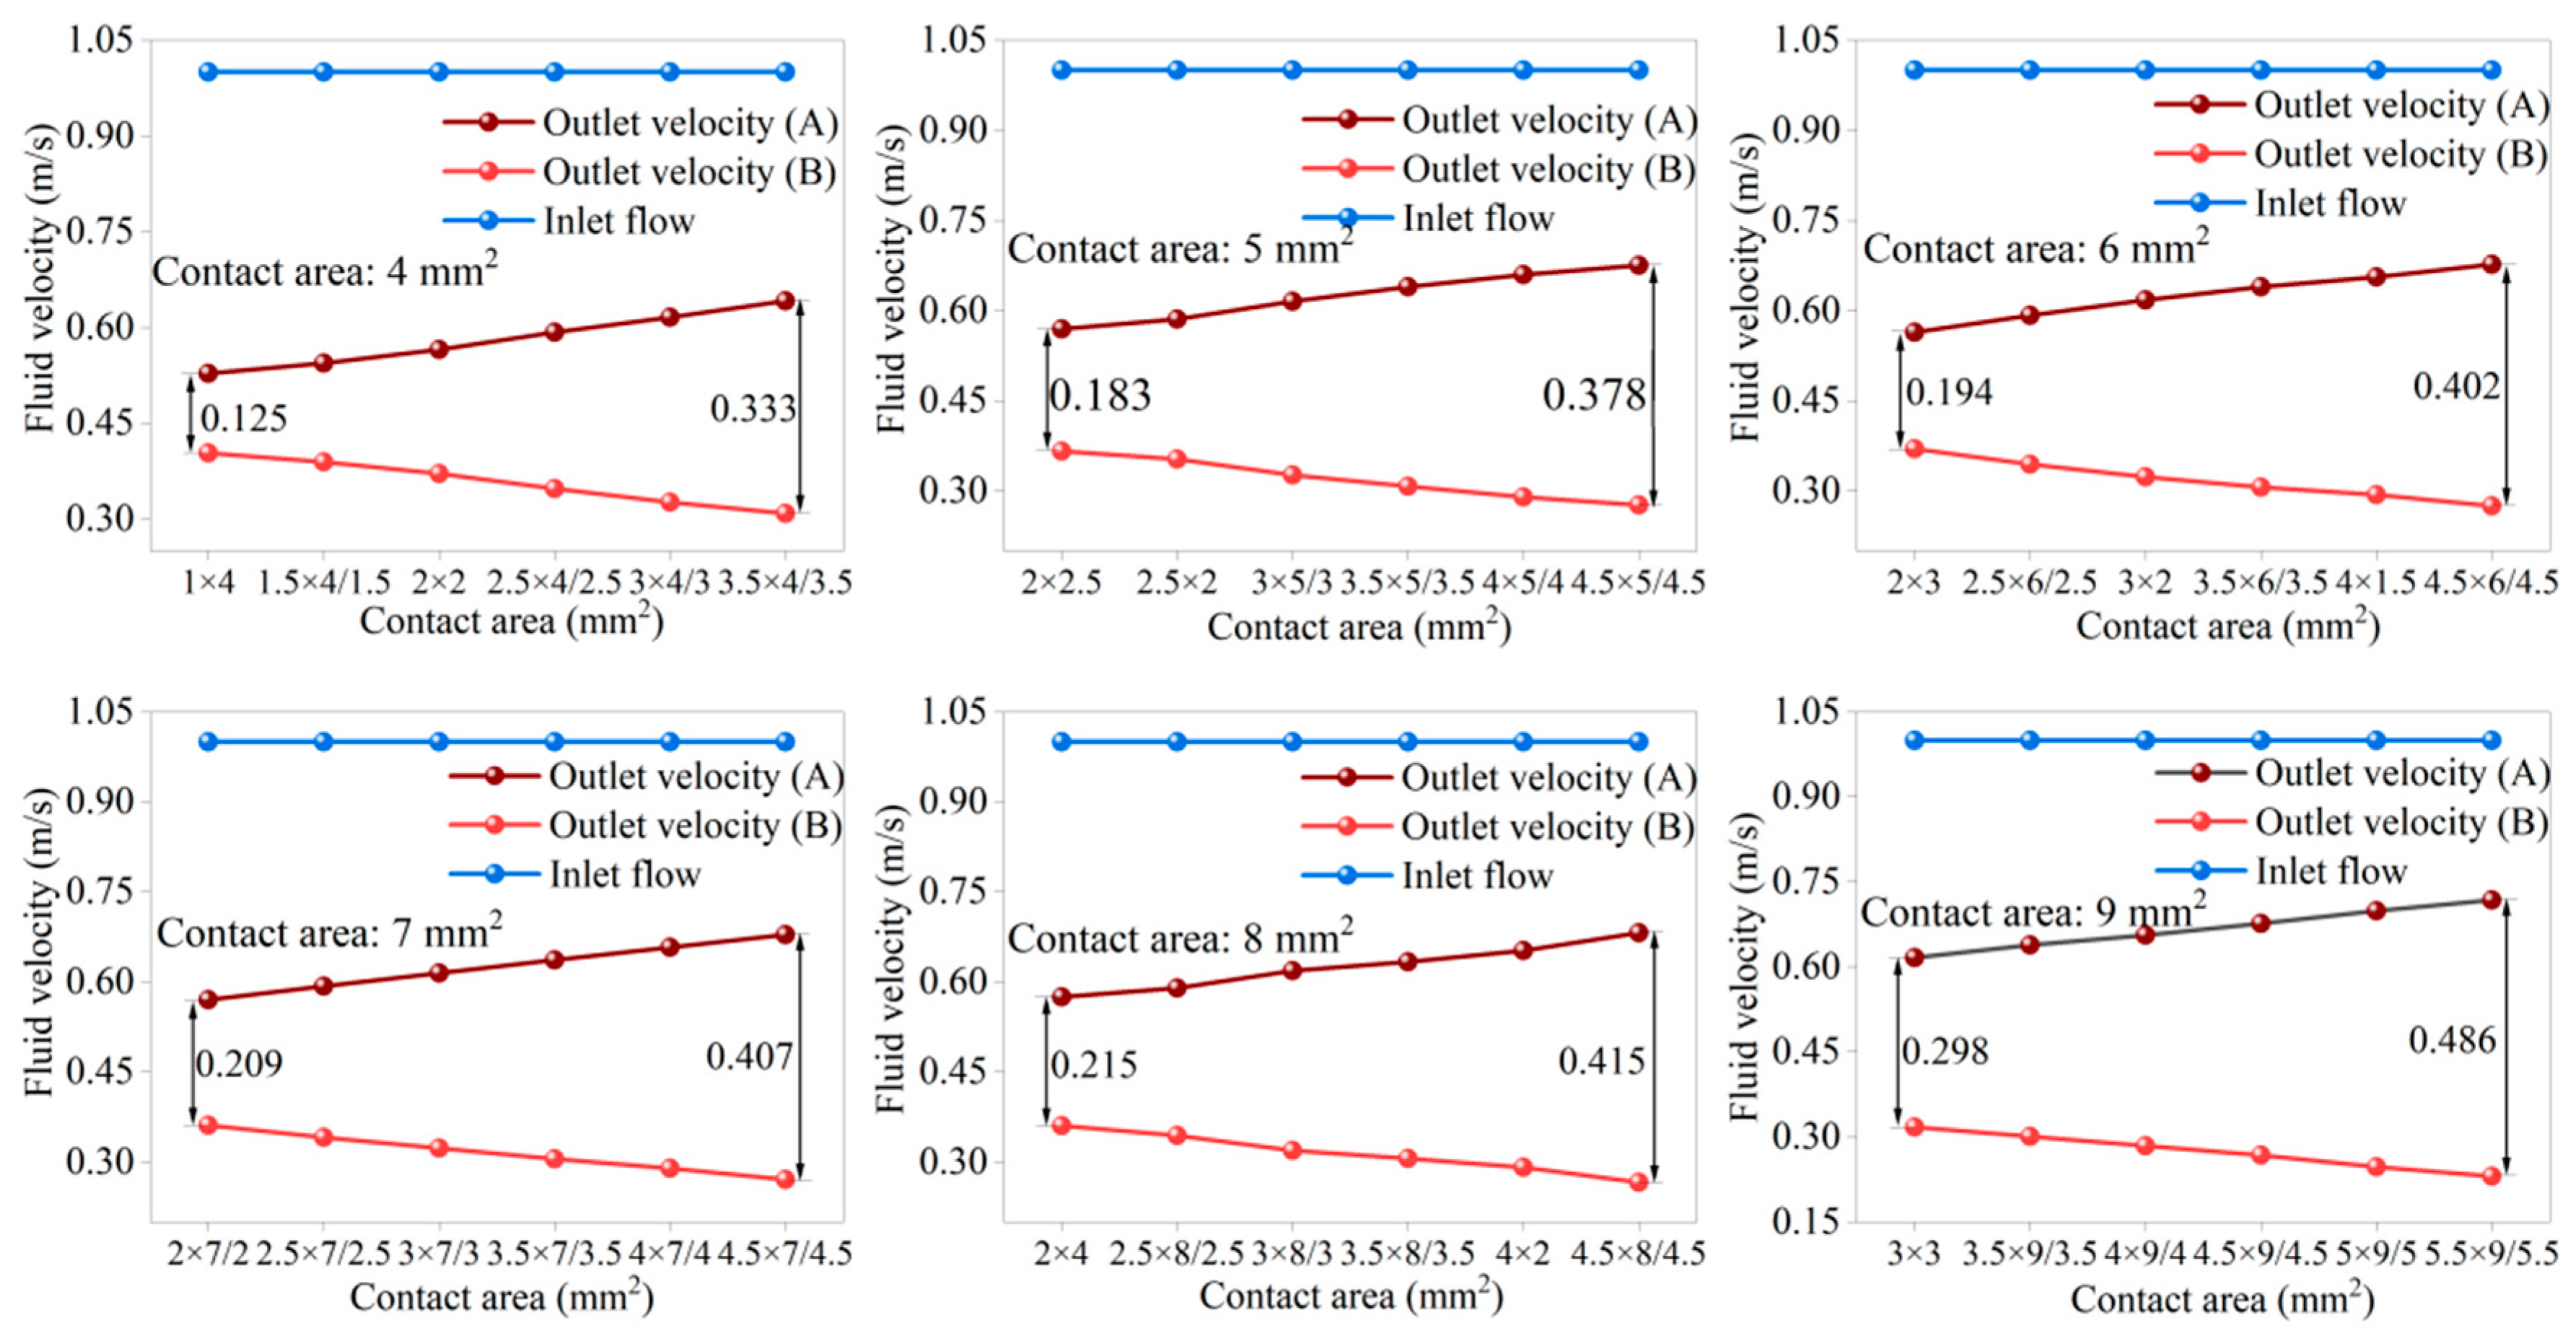
The simulation results of fracture contact are given below (Figure 7, Figure 8, Figure 9, Figure 10). For a single contact area, the unequal velocity on both sides of the bifurcated fracture is a manifestation of the deflection flow behavior. However, for a given cross-section, increasing the contact area does not change the original deflection flow behavior, and the outflow velocities of the two fractures remain almost unchanged (Table 4, when the length of the cross-section is constant, the gradual increase in the contact area has little effect on the velocity at the fracture outlet). In addition, in Figure 7, as the cross-section of the contact area increases gradually, the velocity difference between the two outlet flows of the bifurcated fractures gradually increases. The change in velocity in the entire fluid flow process is linearly correlated with the contact area. For the reason that the effective flow path of the fluid does not change when the cross-section is held constant, the velocity of the fluid does not change as the contact area changes, which is the main reason why the deflection flow behavior of the fracture remains unchanged (Figure 8). The contact area hinders the flow path of the fluid, and the area behind the contact area is a low-velocity zone (blue). As the contact area increases, the cross-section is held constant, and although the area behind the contact area gradually decreases, the proportion of the effective flow path to the overall fracture does not change, so it does not affect the velocity in the bifurcated fracture as a whole. Therefore, the velocity diagrams for different contact areas are almost the same (Figure 8). This indicates that the contact area is not a primary controlling factor for defection.
In Table 4, the velocity difference change is very small, about 0.29 m/s, indicating that the effect on the deflection flow behavior of different contact areas with the same cross-section (3 mm) is very small. The cross-section may be the controlling factor for the differential flow rate. We then investigate the effect of different cross-sections on the deflection flow behavior.
4.3. Effect of Cross-Section on Deflection Flow Behavior for a Given Contact Area
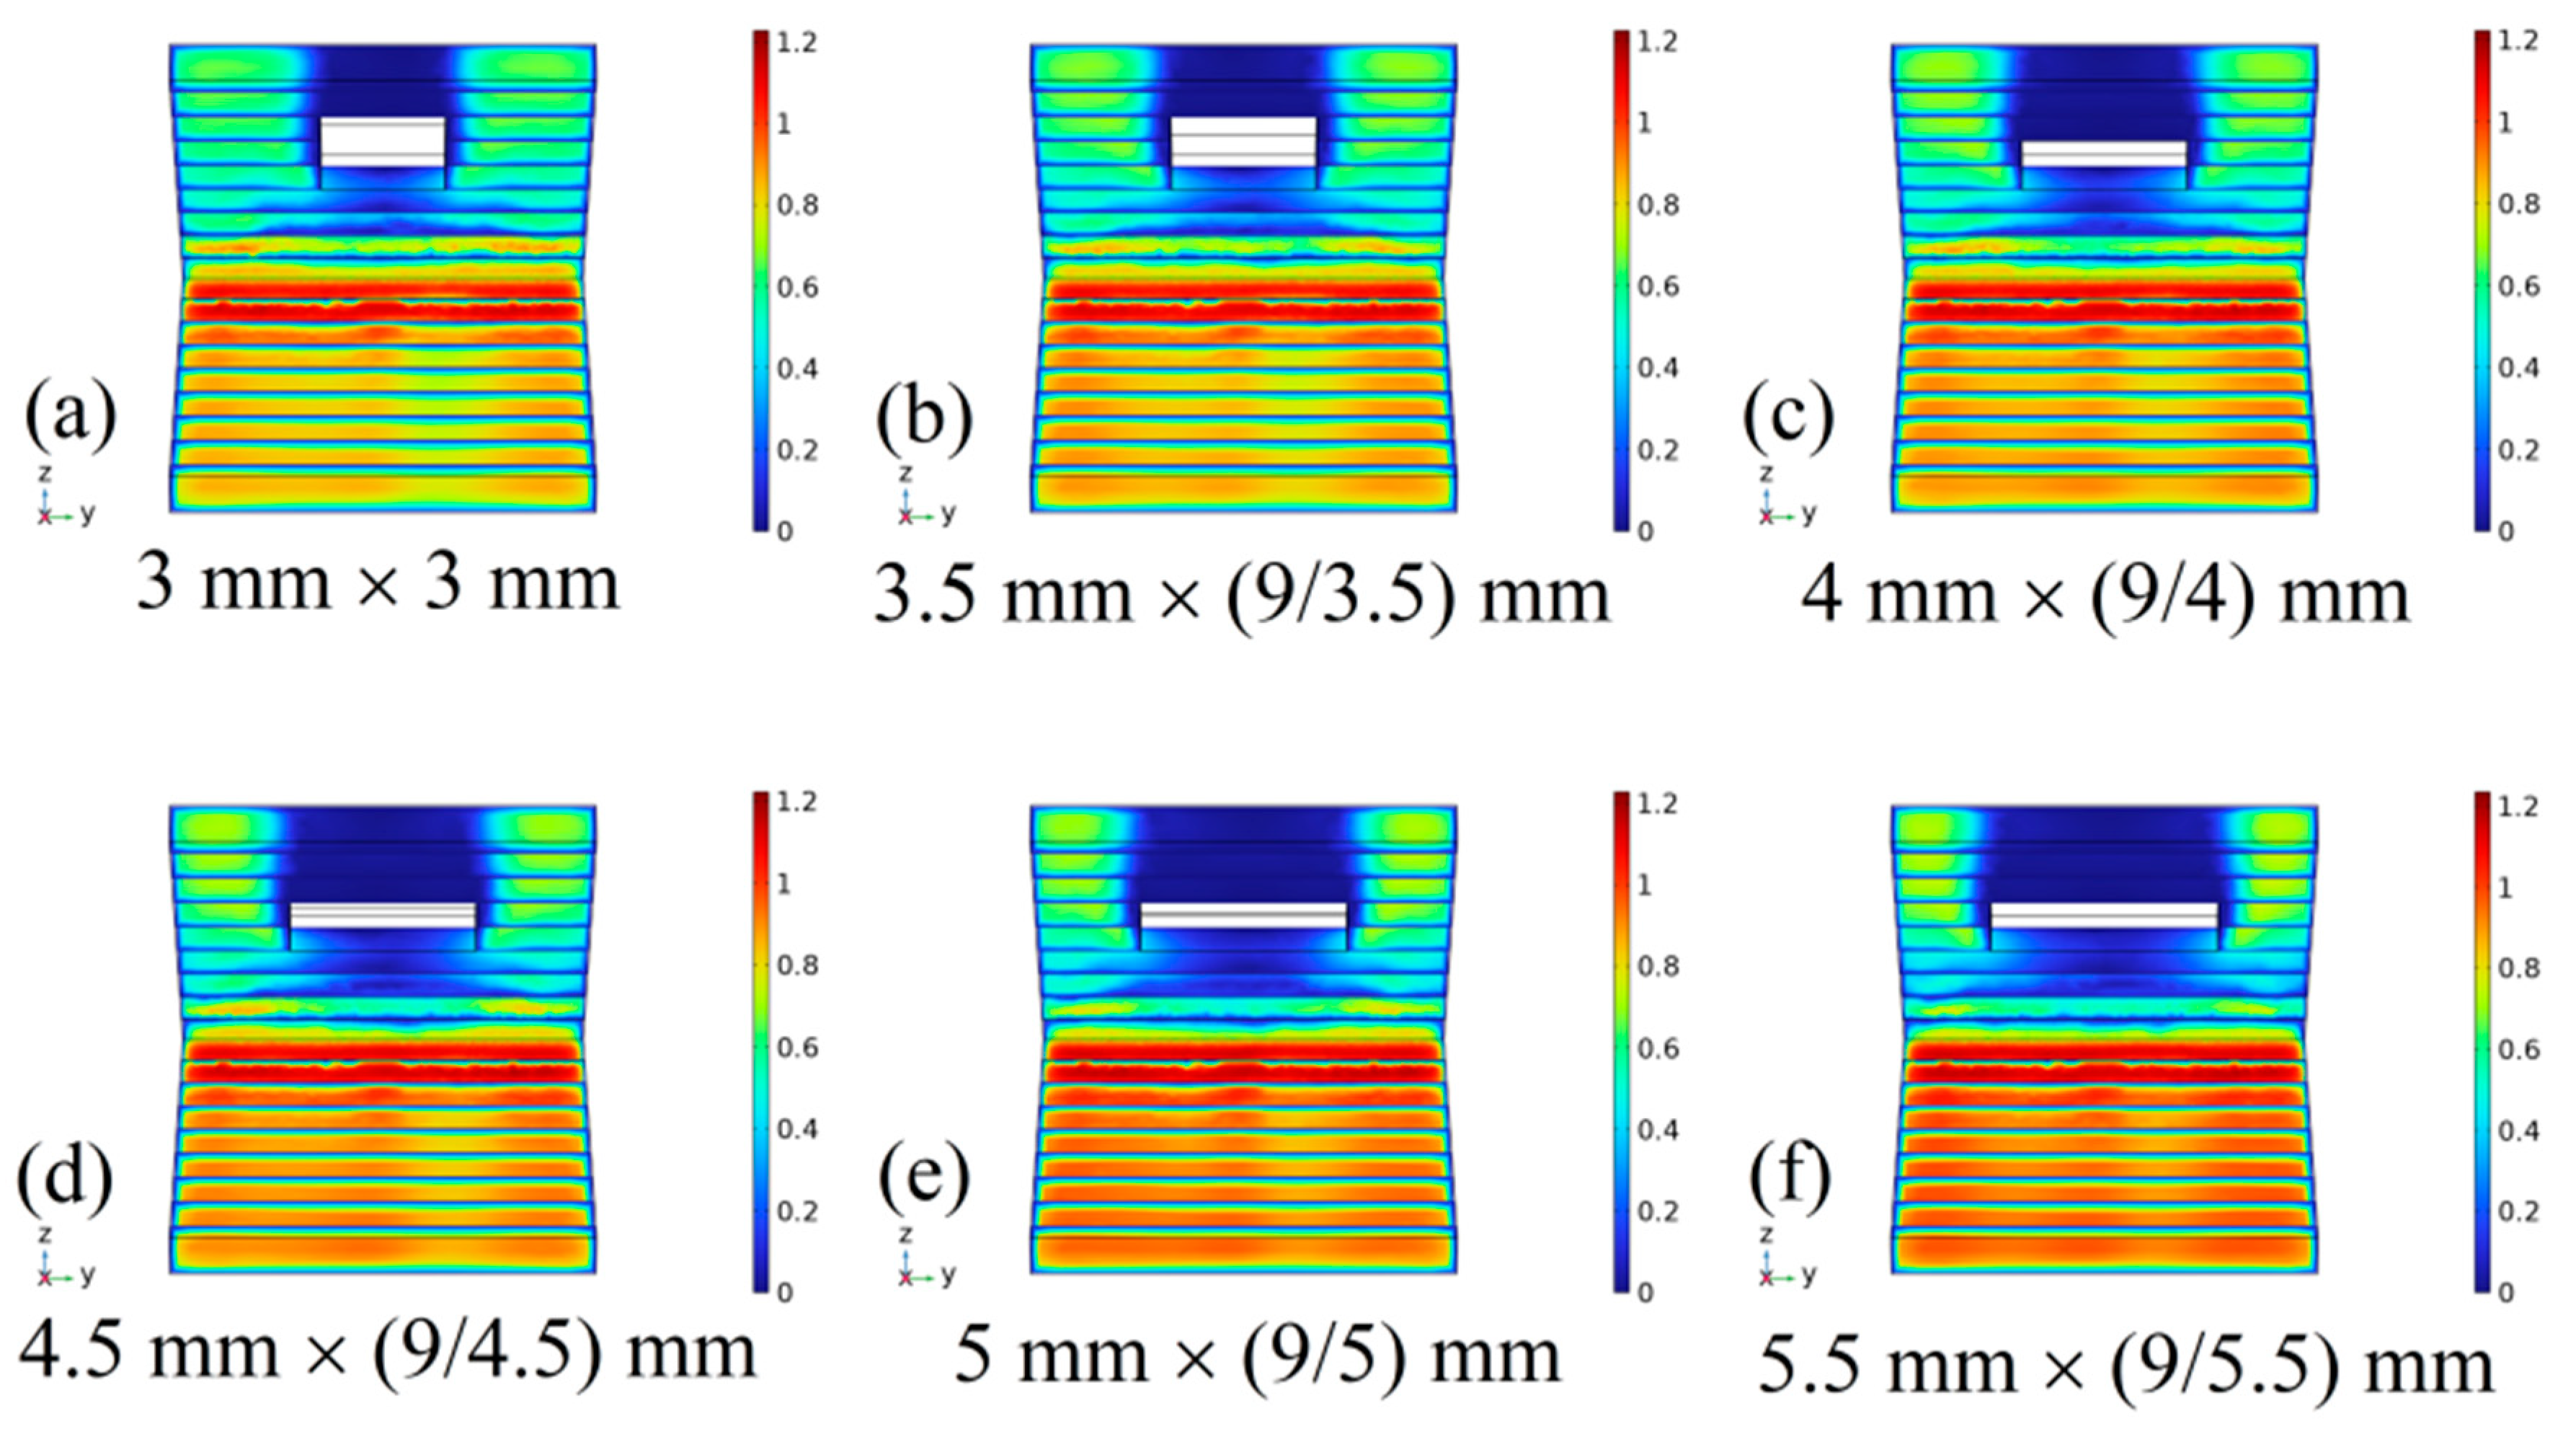
For a given contact area, the velocity in the bifurcated fracture changes significantly as the cross-section increases. The velocity decreases linearly on one side of the contact area, while it increases linearly on the other side (excluding the contact area) (Figure 9). The effect of the change in the cross-section on the deflection flow behavior is significant. The velocity difference between the bifurcated fracture on both sides becomes greater. (Table 5, with the increase in the cross-section length, the outlet velocity of the fracture with contact area decreases gradually, while the outlet velocity of the fracture without contact area increases). As the cross-section gradually increases, the difference between the velocities in the two fractures gradually increases. Increasing the cross-section leads to a decrease in the effective path in the flow area, so the fluid will flow preferentially toward the channel with easier flow conditions. The flow resistance in the flow channel without contact is smaller than that in the channel with contact. Therefore, the velocity of the fluid in the channel without contact increases as the cross-section increases (the color gradually turns red) (Figure 10). Similar to the results presented in the previous section, the area behind the contact area is a low-velocity zone (blue), and the area of this low-velocity zone affects the overall velocity of the fluid. Although the velocity of the fluid does not change as the cross-section in the low-velocity zone increases, the decrease in the effective path of the fluid leads to the proportion of the high-velocity region to the entire fracture gradually decreasing, resulting in a gradual decrease in the average velocity. The fluid tends to flow toward the fracture without contact, and the increase in fluid causes the velocity to gradually increase. Therefore, as is shown in Figure 10, the blue area on the side containing the contact area gradually increases, and the velocity on the other side gradually decreases (turns red). When the length of the cross-section increases, the difference value of the fracture becomes greater, and the deflection behavior of the fracture becomes more obvious, indicating that the cross-section is the factor affecting the change of the deflection flow behavior.
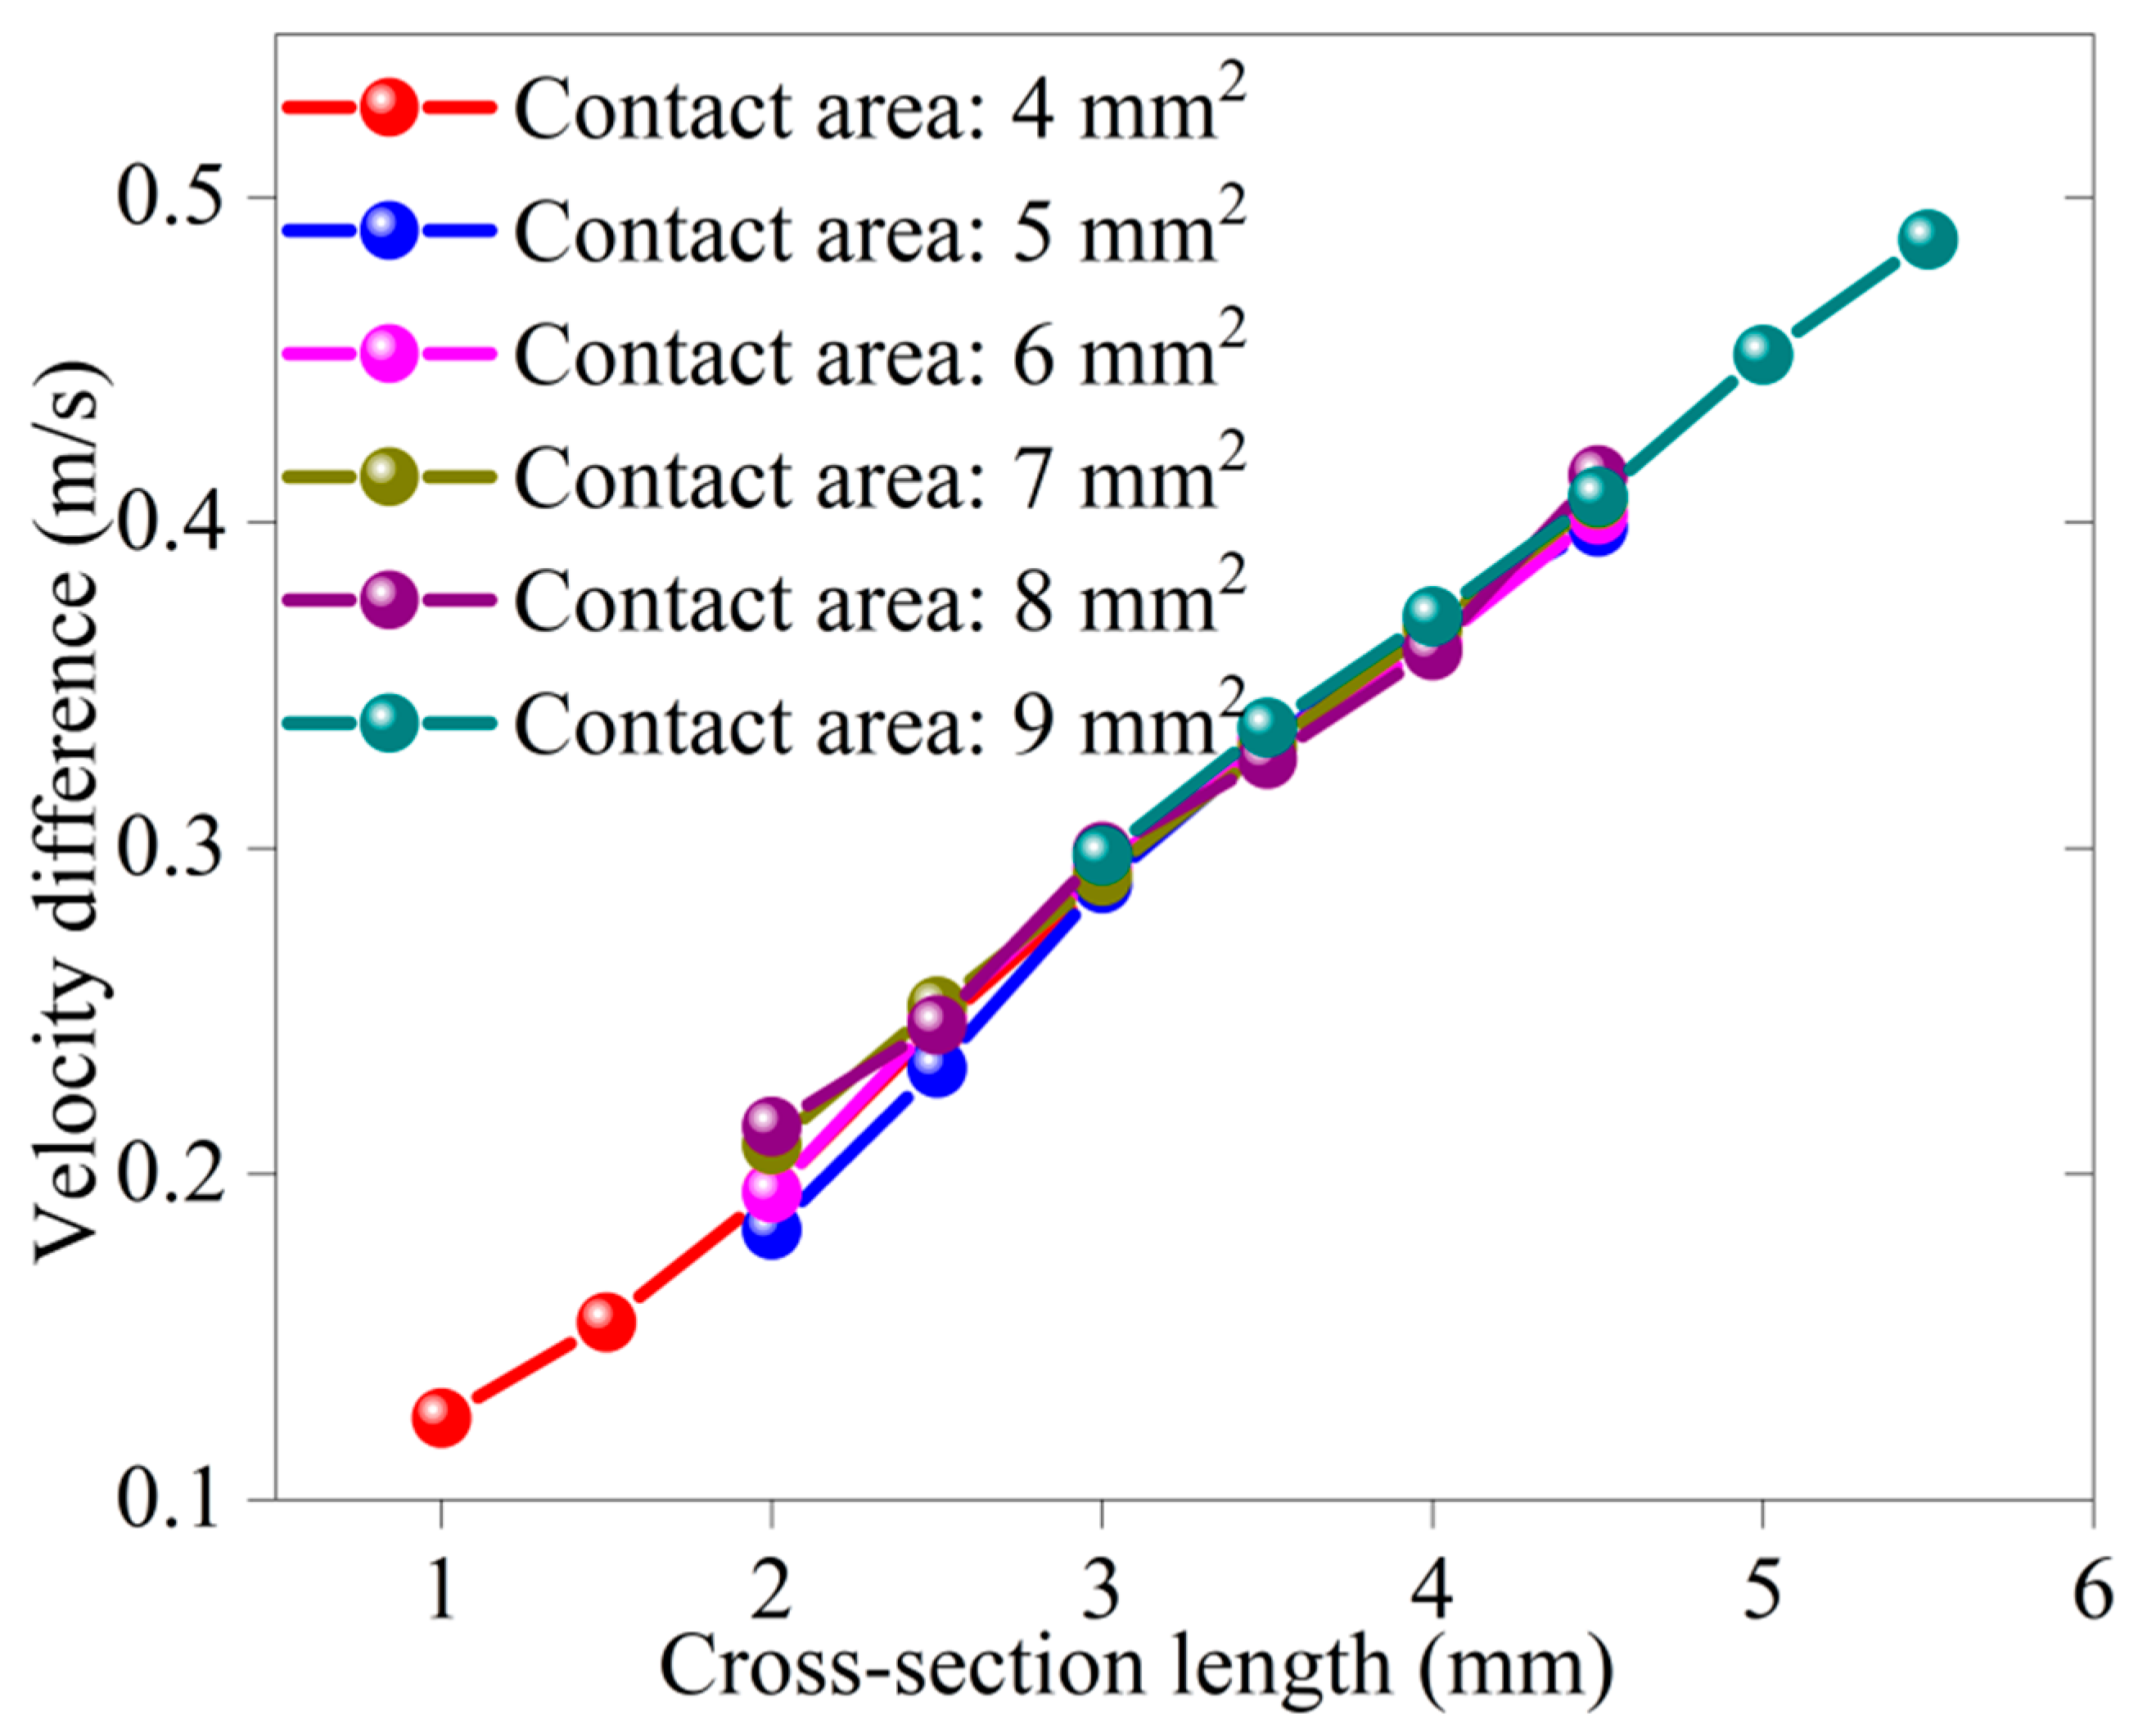
In Table 5, the velocity difference change is distinct, and the maximum deflection flow difference has been reached to be near 0.49 m/s, indicating that the effect on the deflection flow behavior of the same contact areas (9 mm2) with different cross-sections is very obvious. The cross-section may be the controlling factor for the differential flow rate. We present the analysis of the deflection flow caused by different contact cross-sectional areas with different contact areas (Figure 11), and we obtain this certain linear relationship between the deflection flow difference and the contact cross-sectional area. This is because the increased contact cross-section area of one channel reduces its own circulation channel and increases the flow rate of the other channel. The main reason for the velocity difference is the fracture contact cross-section. It is possible to predict the velocity difference after the cross-section continues to change according to the corresponding relationship. This has certain theoretical significance for the flow control of groundwater and bifurcation pipelines.
5. Conclusions
The reason for the occurrence of the deflection flow behavior in bifurcated fractures was studied through experiments and numerical simulations. The fracture contact area affected the fluid flow. By investigating the effects of the contact area and the cross-section of the contact, we determined the cross-section is the main factor affecting the deflection flow behavior. This was expanded through numerical simulations based on laboratory experiments.
The cross-section of the contact area is an important factor affecting the deflection flow behavior. The velocity difference in the bifurcated fractures increases as the cross-section increases.
The fluid velocity decreases as the cross-section increases, and there are linear relationships between the velocity and the contact area and the cross-section. The main reason for this is that as the ratio of the cross-section of the contact area to the width of the fracture gradually increases, the flow path of the fluid shrinks and the velocity decreases accordingly. When the cross-section is held constant, changing the contact area has little effect on the fluid velocity. This is due to the constant flow path of the fluid.
We propose a theory that the cross-sectional area of the contact region controls the bifurcation gap partial flow, whose deflection flow difference may be linear and related to the cross-sectional area of the respective bifurcation contact area.
Author Contributions
Conceptualization, Z.C. and H.M.; methodology, R.L.; software, P.F.; validation, P.F. and H.M.; formal analysis, H.M.; investigation, P.F.; resources, R.L.; data curation, H.M.; writing—original draft preparation, P.F.; writing—review and editing, H.M.; visualization, Z.C.; supervision, J.Q.; project administration, Z.C.; funding acquisition, J.Q. All authors have read and agreed to the published version of the manuscript.
Funding
This research was funded by [National Natural Science Foundation of China] grant number [41772250] awarded to Jiazhong Qian.
Data Availability Statement
The data that support the findings of this study are available from the corresponding author upon reasonable request.
Acknowledgments
The authors also thank the anonymous reviewers for their helpful comments and suggestions.
Conflicts of Interest
The authors declare that they have no known competing financial interests or personal relationships that could have appeared to influence the work reported in this paper.
References
- Pujari, P.R.; Padmakar, C.; Labhasetwar, P.K.; Mahore, P.; Ganguly, A.K. Assessment of the impact of on-site sanitation systems on groundwater pollution in two diverse geological settings—A case study from India. Environ. Monit. Assess. 2012, 184, 251–263. [Google Scholar] [CrossRef]
- Zhu, X.; Liu, J.; Zhu, J.; Chen, Y. Characteristics of distribution and transport of petroleum contaminants in fracture-karst water in Zibo Area, Shandong Province, China. Sci. China Ser. D: Earth Sci. 2000, 43, 141–150. [Google Scholar] [CrossRef]
- Zhao, E.; Jiang, Y. Seepage Evolution Model of the Fractured Rock Mass under High Seepage Pressure in Dam Foundation. Adv. Civ. Eng. 2021, 2021, 1–18. [Google Scholar] [CrossRef]
- Chai, J.; Xu, W. Coupling analysis of unsteady seepage and stress fields in discrete fractures network of rock mass in dam foundation. Sci. China Technol. Sci. 2011, 54, 133–139. [Google Scholar] [CrossRef]
- Zimmerman, R.W.; Chen, D.-W.; Cook, N.G. The effect of contact area on the permeability of fractures. J. Hydrol. 1992, 139, 79–96. [Google Scholar] [CrossRef] [Green Version]
- Walsh, J. Effect of pore pressure and confining pressure on fracture permeability. Int. J. Rock Mech. Min. Sci. Géoméch. Abstr. 1981, 18, 429–435. [Google Scholar] [CrossRef]
- Watanabe, N.; Hirano, N.; Tsuchiya, N. Determination of aperture structure and fluid flow in a rock fracture by high-resolution numerical modeling on the basis of a flow-through experiment under confining pressure. Water Resour. Res. 2008, 44, 1–11. [Google Scholar] [CrossRef]
- Blaisonneau, A.; Peter-Borie, M.; Gentier, S. Evolution of fracture permeability with respect to fluid/rock interactions under thermohydromechanical conditions: Development of experimental reactive percolation tests. Geotherm. Energy 2016, 4, 1563. [Google Scholar] [CrossRef] [Green Version]
- Pan, D.D.; Li, S.C.; Xu, Z.H. Seepage calculation model and numerical analysis of rock fracture considering effect of contact area and clastic rock. J. Cent. South Univ. 2019, 50, 1677–1685. [Google Scholar]
- Zhang, Q.; Ju, Y.; Gong, W.; Zhang, L.; Sun, H. Numerical simulations of seepage flow in rough single rock fractures. Petroleum 2015, 1, 200–205. [Google Scholar] [CrossRef] [Green Version]
- Li, M.; Liu, X.; Li, Y.; Hou, Z.; Qiao, S. The effect of contact areas on seepage behavior in 3D rough fractures under normal stress. Int. J. Geomech. 2021, 22, 04022019. [Google Scholar] [CrossRef]
- Mehr, S.S.; Raeisi, E. Investigation of seepage flow path(s) in the right embankment of Sheshpeer Dam, the Zagros Region, Iran. Carbonates Evaporites 2019, 34, 1321–1331. [Google Scholar] [CrossRef]
- Zhang, A.; Yang, J.; Cheng, L.; Ma, C. A simulation study on stress-seepage characteristics of 3D rough single fracture based on fluid-structure interaction. J. Pet. Sci. Eng. 2022, 211, 110215. [Google Scholar] [CrossRef]
- Wang, J.; Ma, H.; Qian, J.; Feng, P.; Tan, X.; Ma, L. Experimental and theoretical study on the seepage mechanism characteristics coupling with confining pressure. Eng. Geol. 2021, 291, 106224. [Google Scholar] [CrossRef]
- Kordilla, J.; Noffz, T.; Dentz, M.; Geyer, T.; Tartakovsky, A.M. Effect of Unsaturated Flow Modes on Partitioning Dynamics of Gravity-Driven Flow at a Simple Fracture Intersection: Laboratory Study and Three-Dimensional Smoothed Particle Hydrodynamics Simulations. Water Resour. Res. 2017, 53, 9496–9518. [Google Scholar] [CrossRef]
- Liu, J.; Wang, Z.; Qiao, L.; Guo, J.; Li, W. Nonlinear Flow Model for Rock Fracture Intersections: The Roles of the Intersecting Angle, Aperture and Fracture Roughness. Rock Mech. Rock Eng. 2022, 55, 2385–2405. [Google Scholar] [CrossRef]
- Wilson, C.R.; Witherspoon, P.A. Flow interference effects at fracture intersections. Water Resour. Res. 1976, 12, 102–104. [Google Scholar] [CrossRef]
- Kaiming, T. The hydraulic properties of crossing-flow in an intersected fracture. Acta Geol. Sin. 1986, 2, 202–214. [Google Scholar]
- Zhu, H.; Yi, C.; Jiang, Y.; Xie, H.; Yang, M. Effect of fractures cross connection on fluid flow characteristics of mining-induced rock. J. China Univ. Min. Technol. 2015, 44, 24–28. [Google Scholar]
- Wang, Z.; Liu, J.; Qiao, L.; Yang, J.; Guo, J.; Li, K. A model for nonlinear flow behavior in two-dimensional fracture intersections and the estimation of flow model coefficients. Appl. Hydrogeol. 2022, 30, 865–879. [Google Scholar] [CrossRef]
- Johnson, J.; Brown, S.; Stockman, H. Fluid flow and mixing in rough-walled fracture intersections. J. Geophys. Res. Earth Surf. 2006, 111, B12206. [Google Scholar] [CrossRef]
- Yang, F.; Li, Z.; Yuan, Y.; Liu, C.; Zhang, Y.; Jin, Y. Numerical and Experimental Investigation of Internal Flow Characteristics and Pressure Fluctuation in Inlet Passage of Axial Flow Pump under Deflection Flow Conditions. Energies 2021, 14, 5245. [Google Scholar] [CrossRef]
- Gudmundsson, A.; Simmenes, T.H.; Larsen, B.; Philipp, S.L. Effects of internal structure and local stresses on fracture propagation, deflection, and arrest in fault zones. J. Struct. Geol. 2010, 32, 1643–1655. [Google Scholar] [CrossRef]
- Zhang, X.; Jeffrey, R.G.; Thiercelin, M. Deflection and propagation of fluid-driven fractures at frictional bedding interfaces: A numerical investigation. J. Struct. Geol. 2007, 29, 396–410. [Google Scholar] [CrossRef]
- Zhang, X.; Jeffrey, R.G. The role of friction and secondary flaws on deflection and re-initiation of hydraulic fractures at orthogonal pre-existing fractures. Geophys. J. Int. 2006, 166, 1454–1465. [Google Scholar] [CrossRef] [Green Version]
- Nemoto, K.; Watanabe, N.; Hirano, N.; Tsuchiya, N. Direct measurement of contact area and stress dependence of anisotropic flow through rock fracture with heterogeneous aperture distribution. Earth Planet. Sci. Lett. 2009, 281, 81–87. [Google Scholar] [CrossRef]
Figure 1.
Preparation of bifurcated fractures.

Figure 2.
Schematic diagram of the fluid flow.

Figure 3.
The structures of the bifurcated fractures (the contact area is defined as fracture A, that without contact area is defined as fracture B). (a–f): same cross-section and different areas (the cross-section is 3 mm); and (g–l): same area and different cross-sections (the contact area is 9 mm2).


Figure 4.
Diagram of the experimental equipment used in the tests.

Figure 5.
Curve change of flow rate and hydraulic slope in fracture seepage experiments.

Figure 6.
Compression performance of pressure film under different pressures.

Figure 7.
Variations in the velocities at the outlets of the bifurcated fractures for a constant cross-section.
Figure 7.
Variations in the velocities at the outlets of the bifurcated fractures for a constant cross-section.

Figure 8.
Velocity variations in the bifurcated fracture B for a constant cross-section of 3 mm (velocity: m/s). (a–f): Velocity variations in the bifurcated fracture B for a constant cross-section of 3 mm with different contact areas.
Figure 8.
Velocity variations in the bifurcated fracture B for a constant cross-section of 3 mm (velocity: m/s). (a–f): Velocity variations in the bifurcated fracture B for a constant cross-section of 3 mm with different contact areas.

Figure 9.
Variations in velocities at the outlets of the bifurcated fractures for a constant contact area.
Figure 9.
Variations in velocities at the outlets of the bifurcated fractures for a constant contact area.

Figure 10.
Velocity variations in the bifurcated fracture B for a constant contact area of the contact area is 9 mm2 (velocity: m/s). (a–f): Velocity variations in the bifurcated fracture B for a constant area of 9 mm2 with different contact cross-sections.
Figure 10.
Velocity variations in the bifurcated fracture B for a constant contact area of the contact area is 9 mm2 (velocity: m/s). (a–f): Velocity variations in the bifurcated fracture B for a constant area of 9 mm2 with different contact cross-sections.

Figure 11.
Outlet velocity difference of bifurcated fracture.


Table 1.
Setting of contact area in fracture model: the same cross-section and different contact areas.
Table 1.
Setting of contact area in fracture model: the same cross-section and different contact areas.
| Width Length | 0.5 mm | 1 mm | 1.5 mm | 2 mm | 2.5 mm | 3 mm |
|---|---|---|---|---|---|---|
| 0.5 mm | 0.5 × 0.5 | 0.5 × 1 | 0.5 × 1.5 | 0.5 × 2 | 0.5 × 2.5 | 0.5 × 3 |
| 1 mm | 1 × 0.5 | 1 × 1 | 1 × 1.5 | 1 × 2 | 1 × 2.5 | 1 × 3 |
| 1.5 mm | 1.5 × 0.5 | 1.5 × 1 | 1.5 × 1.5 | 1.5 × 2 | 1.5 × 2.5 | 1.5 × 3 |
| 2 mm | 2 × 0.5 | 2 × 1 | 2 × 1.5 | 2 × 2 | 2 × 2.5 | 2 × 3 |
| 2.5 mm | 2.5 × 0.5 | 2.5 × 1 | 2.5 × 1.5 | 2.5 × 2 | 2.5 × 2.5 | 2.5 × 3 |
| 3 mm | 3 × 0.5 | 3 × 1 | 3 × 1.5 | 3 × 2 | 3 × 2.5 | 3 × 3 |
Table 2.
Setting of contact area in fracture model: the same contact area and different cross-sections.
Table 2.
Setting of contact area in fracture model: the same contact area and different cross-sections.
| 4 mm2 | 5 mm2 | 6 mm2 | 7 mm2 | 8 mm2 | 9 mm2 |
|---|---|---|---|---|---|
| 1 × (4/1) | 2 × (5/2) | 2 × (6/2) | 2 × (7/2) | 2 × (8/2) | 3 × (9/3) |
| 1.5 × (4/1.5) | 2.5 × (5/2.5) | 2.5 × (6/2.5) | 2.5 × (7/2.5) | 2.5 × (8/2.5) | 3.5 × (9/3.5) |
| 2 × (4/2) | 3 × (5/3) | 3 × (6/3) | 3 × (7/3) | 3 × (8/3) | 4 × (9/4) |
| 2.5 × (4/2.5) | 3.5 × (5/3.5) | 3.5 × (6/3.5) | 3.5 × (7/3.5) | 3.5 × (8/3.5) | 4.5 × (9/4.5) |
| 3 × (4/3) | 4 × (5/4) | 4 × (6/4) | 4 × (7/4) | 4 × (8/4) | 5 × (9/5) |
| 3.5 × (4/3.5) | 4.5 × (5/4.5) | 4.5 × (6/4.5) | 4.5 × (7/4.5) | 4.5 × (8/4.5) | 5.5 × (9/5.5) |
Table 3.
Stress response of pressure film under pressure.
| Confining Pressure (MPa) | Fracture Channel | Pressed Area (mm2) | Average Pressure (MPa) | Load (N) |
|---|---|---|---|---|
| 1 | FA | 761 | 1.22 | 931 |
| FB | 776 | 1.53 | 1187 | |
| 2 | FA | 594 | 1.56 | 927 |
| FB | 778 | 1.61 | 1252 | |
| 3 | FA | 619 | 6.3 | 3899 |
| FB | 796 | 6.81 | 5421 | |
| 4 | FA | 660 | 7.35 | 4851 |
| FB | 866 | 7.65 | 6625 | |
| 5 | FA | 651 | 8.1 | 5272 |
| FB | 987 | 8.75 | 8636 | |
| 6 | FA | 1126 | 8.67 | 9762 |
| FB | 1202 | 9.35 | 11,239 |
Table 4.
Velocity variations in the two bifurcated fractures for different contact areas (cross-section is 3 mm).
Table 4.
Velocity variations in the two bifurcated fractures for different contact areas (cross-section is 3 mm).
| Contact Area (mm2) | Fluid Outlet (without Contact Area) (m/s) | Fluid Outlet (with Contact Area) (m/s) | Velocity Difference (m/s) |
|---|---|---|---|
| 3 × 0.5 | 0.62013 | 0.32373 | 0.29240 |
| 3 × 1 | 0.61760 | 0.32640 | 0.29120 |
| 3 × 1.5 | 0.62085 | 0.32361 | 0.29724 |
| 3 × 2 | 0.61727 | 0.32344 | 0.29383 |
| 3 × 2.5 | 0.61582 | 0.32104 | 0.29478 |
| 3 × 3 | 0.61570 | 0.31786 | 0.29784 |
Table 5.
Velocity variations in the bifurcated fractures (contact area is 9 mm2).
| Contact Area (mm2) | Fluid Outlet (without Contact Area) (m/s) | Fluid Outlet (with Contact Area) (m/s) | Velocity Difference (m/s) |
|---|---|---|---|
| 3 × 3 | 0.61570 | 0.31786 | 0.29784 |
| 3.5 × (9/3.5) | 0.63818 | 0.30104 | 0.33714 |
| 4 × (9/4) | 0.65597 | 0.28481 | 0.37116 |
| 4.5 × (9/4.5) | 0.67626 | 0.26823 | 0.40803 |
| 5 × (9/5) | 0.69883 | 0.24724 | 0.45159 |
| 5.5 × (9/5.5) | 0.71770 | 0.23072 | 0.48698 |
Disclaimer/Publisher’s Note: The statements, opinions and data contained in all publications are solely those of the individual author(s) and contributor(s) and not of MDPI and/or the editor(s). MDPI and/or the editor(s) disclaim responsibility for any injury to people or property resulting from any ideas, methods, instructions or products referred to in the content. |
© 2023 by the authors. Licensee MDPI, Basel, Switzerland. This article is an open access article distributed under the terms and conditions of the Creative Commons Attribution (CC BY) license (https://creativecommons.org/licenses/by/4.0/).
Share and Cite
MDPI and ACS Style
Cheng, Z.; Liu, R.; Ma, H.; Feng, P.; Qian, J. Effect of Contact Area on Deflection Flow Behavior in a Bifurcated Fracture. Water 2023, 15, 213. https://doi.org/10.3390/w15010213
AMA Style
Cheng Z, Liu R, Ma H, Feng P, Qian J. Effect of Contact Area on Deflection Flow Behavior in a Bifurcated Fracture. Water. 2023; 15(1):213. https://doi.org/10.3390/w15010213
Chicago/Turabian StyleCheng, Zhiyu, Rui Liu, Haichun Ma, Peichao Feng, and Jiazhong Qian. 2023. "Effect of Contact Area on Deflection Flow Behavior in a Bifurcated Fracture" Water 15, no. 1: 213. https://doi.org/10.3390/w15010213
Note that from the first issue of 2016, this journal uses article numbers instead of page numbers. See further details here.