
Urban Flood Loss Estimation and Evacuation Design Based on a 500-Year Extreme Flood Event in Syracuse City
1
Department of Geography and the Environment, Syracuse University, Syracuse, NY 13244, USA
2
School of Resources and Environment, Anhui Agricultural University, Hefei 230036, China
*
Author to whom correspondence should be addressed.
Water 2023, 15(1), 3; https://doi.org/10.3390/w15010003
Submission received: 6 December 2022
/
Revised: 15 December 2022
/
Accepted: 16 December 2022
/
Published: 20 December 2022
(This article belongs to the Section Hydrology)
Abstract
:To understand the potential risk of flooding in Syracuse City, New York State, USA, this research attempted to accomplish the flood hazard assessment for a simulated 500-year flood event in the downstream floodplain of Onondaga Creek within Syracuse. Based on the commonly used category of flood damages, the flood damage of Syracuse was divided into loss of buildings and loss of population. The results showed that the city’s center would have the highest damage rate for buildings and a total of 1139 buildings would be inundated, of which 326 buildings would be severely damaged by more than 80%. Furthermore, about 7390 people would be directly affected by the flood event, among which approximately 900 people might lose their lives. Communities near Onondaga Creek were assigned designated evacuation shelters based on the accessibility and distance to the shelters. The shortest available evacuation routes were calculated. More shelters should be provided in the central downtown area, with its large population, and distributed along the western bank of Onondaga Creek. This research offered a first approximate flood loss estimation that might lead to more attention and studies concerning a potential flood hazard in the future. It also provided science-based guidelines for city authorities to refer to in practical flood hazard mitigation.
1. Introduction
Floods can cause massive negative impacts on human beings and their living environments, such as the loss of human lives and economic value, destruction of the infrastructure, land and soil degradation, crop and vegetation damage, and the submergence of cities [1,2]. Urbanization has increased the frequency and magnitude of floods and reduced the permeability of the ground surface, encouraging flash floods even for regular rainfall events [3]. According to the Sixth Assessment Report of the Intergovernmental Panel on Climate Change (IPCC), extreme weather events, such as heavy storms, will occur more frequently in the future [4]. Assessing the flood exposure of infrastructure is crucial for sustainable flood risk management [5,6]. Therefore, knowledge of the degree and extent of the flood impact on an urban area is essential for determining mitigation strategies and designing flood evacuation [7].
The classification of flood damage and the methodology for estimating the damage in different categories differ in different countries. In fact, to classify flood damage in all affected sectors (i.e., people, economic activities, physical infrastructure, properties, and ecological systems), it is vital to be able to show what is actually damaged; therefore, a multisectoral understanding of loss suffered during individual flood events is needed [8,9,10]. In this context, flood damage can be further categorized into economic, social, and environmental objects [11].
A variety of methods for flood damage estimation in urban areas have been developed thus far. Some of them, such as simple empirical models, economic models, Input–Output models, and computational general equilibrium (CGE) models have been widely used to characterize the damage estimation process [12]. These models are based on the same definition of flood damage:
Flood damage = Exposed objects × Damage curve (or function)
In this equation, the exposed objects during a specific flood event may be represented by the inundation characteristics, which can be obtained from the modeling results [13]. These characteristics could be flood extent, depth, or velocity, depending on the specifically used damage curve (or function), which is usually obtained from hydraulic modeling analyses for the selected study area.
The flood depth is the most common characteristic chosen to estimate flood damages. Along this line, the depth or stage damage curves (or functions) have been developed in many places around the world as a commonly used technique to assess flood impacts [14]. Several types of curves (or functions) exist in terms of the availability of information and assessment goals [15], which may be generally classified as empirical vs. synthetic ones, or as relative vs. absolute ones. Empirical curves (or functions) are derived from the real damage data collected during actual flood events. When these data are available, empirical curves can be created by interpolating a curve describing the relationship between depths and costs [16]. Alternatively, a synthetic curve (or function) relies on expert opinions and what-if questions to estimate the magnitude of damage for every stage of the flood water [17]. Depth damage curves (or functions) can also be classified as absolute or relative, depending on if the cost is given in economic terms or as a percentage of the total value of the affected assets. A relative curve (or function) expresses the magnitude of losses as a percentage of the total value of the damaged property, whereas an absolute curve (or function) shows the extent of damage in monetary value. Roccati et al. [18] studied the choice of the depth-damage function used in flood damage analysis. They selected four depth-damage functions and applied them to historical flooding events in a catchment in Italy. Dano et al. [8] suggested a synthetic method for constructing depth-damage function curves for residential, commercial, agricultural, and industrial categories in Malaysia. Their approach is based on an interview survey (questionnaire) for the damage data.
Flood evacuation has become an emerging issue due to its effectiveness in reducing flood damage [19]. There is no doubt that the ultimate goal of flood emergency evacuation is to evacuate people to safe areas as quickly as possible. Evacuation conditions have a direct impact on reducing the life risk of flood hazards [20]. Therefore, flood evacuation involves two fundamental issues, which are evacuation shelters and evacuation routes. The essential purpose of studies that examine flood evacuation is to reduce the risk to human life by scientifically selecting shelter sites and evacuation routes. At present, the research on flood evacuation is mainly embodied in developing evacuation modeling technology, influencing the factors of flood evacuation, shelter siting, and evacuation routes [21].
In the research area of modeling flood evacuation, the main question is: how can evacuation problems be transformed into network optimization problems, which means optimizing for the shortest path, minimized cost, and fastest time? The point-line combination theory is capable of providing reasonable answers to this question. Its basic idea is (1) abstracting the roads in the study area as “line sets”, and the submerged units and shelters as “point sets”, and then (2) designing the flood emergency evacuation routes to the designated shelters based on a series of methods.
The scientific site selection of emergency shelters is not only beneficial to management but also essential for reducing life and economic losses caused by flooding. Scholars over the years have studied various siting models to solve siting problems, including static and dynamic siting models [22]. There are three main types of mathematical models describing static site selection: the P-median model, the P-center model, and the land scale coverage model. These models can incorporate constraints, such as the maximum and minimum size of the facility and the maximum travel distance into the mathematical equations [23]. The distance is the limiting condition to ensure that all demand points can be within the maximum service distance of the facilities. In theory, the siting of flood emergency shelters should consider more factors than location. Studies involving more factors than just location have been conducted to evaluate flood emergency shelters [24,25]. In combination with the social and geographical conditions of the flood-prone area, factors such as population density, traffic conditions, and elevation are selected as indicators for evaluating these shelters. The cluster analysis module in the GIS (Geographic Information System) platform is specially designed to solve these siting problems and has a powerful performance in integrating these limitation factors by spatial analysis [26]. Because of its advantages, the cluster analysis module is used in the selection process of emergency shelter sites in this study.
Evacuation routes are determined using modeling methods that can be broadly divided into microscopic, mesoscopic, and macroscopic, depending on their scale [27]. The microscopic modeling method is based on the transportation trajectory of the evacuation individuals. However, the mesoscopic modeling method is based on the transportation trajectory of the evacuation unit. The macroscopic modeling method is based on the evacuation starting point and traffic allocation. All of these methods involve calculating the evacuation routes, which may be achieved in two ways: (1) mathematical analysis and (2) computer simulation [28]. GIS network analysis is one of the computer simulation methods frequently used to select the optimal evacuation path. The pathfinding tool of the network analysis module in the GIS platform is often used to find the best evacuation route for the affected population and calculate the evacuation time [22]. The locations and capacities of shelters can be combined with available traffic networks to minimize the evacuation time. In addition, network algorithms embedded in a GIS platform can be used to identify alternative evacuation routes in an emergency. With the help of GIS tools, the successful planning of a flood emergency evacuation, including routing and siting, has excellent potential to mitigate flood damage to human life.
This research aims to conduct a flood hazard assessment for the Onondaga Creek floodplain in Syracuse City by focusing on flood damage estimation and evacuation design. The selected study area is within the projected inundation zone of a 500-year flood event by the Federal Emergency Management Agency (FEMA). Due to the limited research on pluvial flooding in Syracuse, its population and assets are exposed to the risks imposed by this type of flooding. Flood damages are divided into specific damages to buildings and population, which are then calculated using the functions of the inundation depth and different types of exposed objects in the study area. Flood evacuation design will be achieved by identifying the spatial distribution of flood evacuation shelters and analyzing the spatial accessibility of the evacuation shelters based on the conditions and distances of the evacuation routes.
2. Study Area and Historical Flood Events
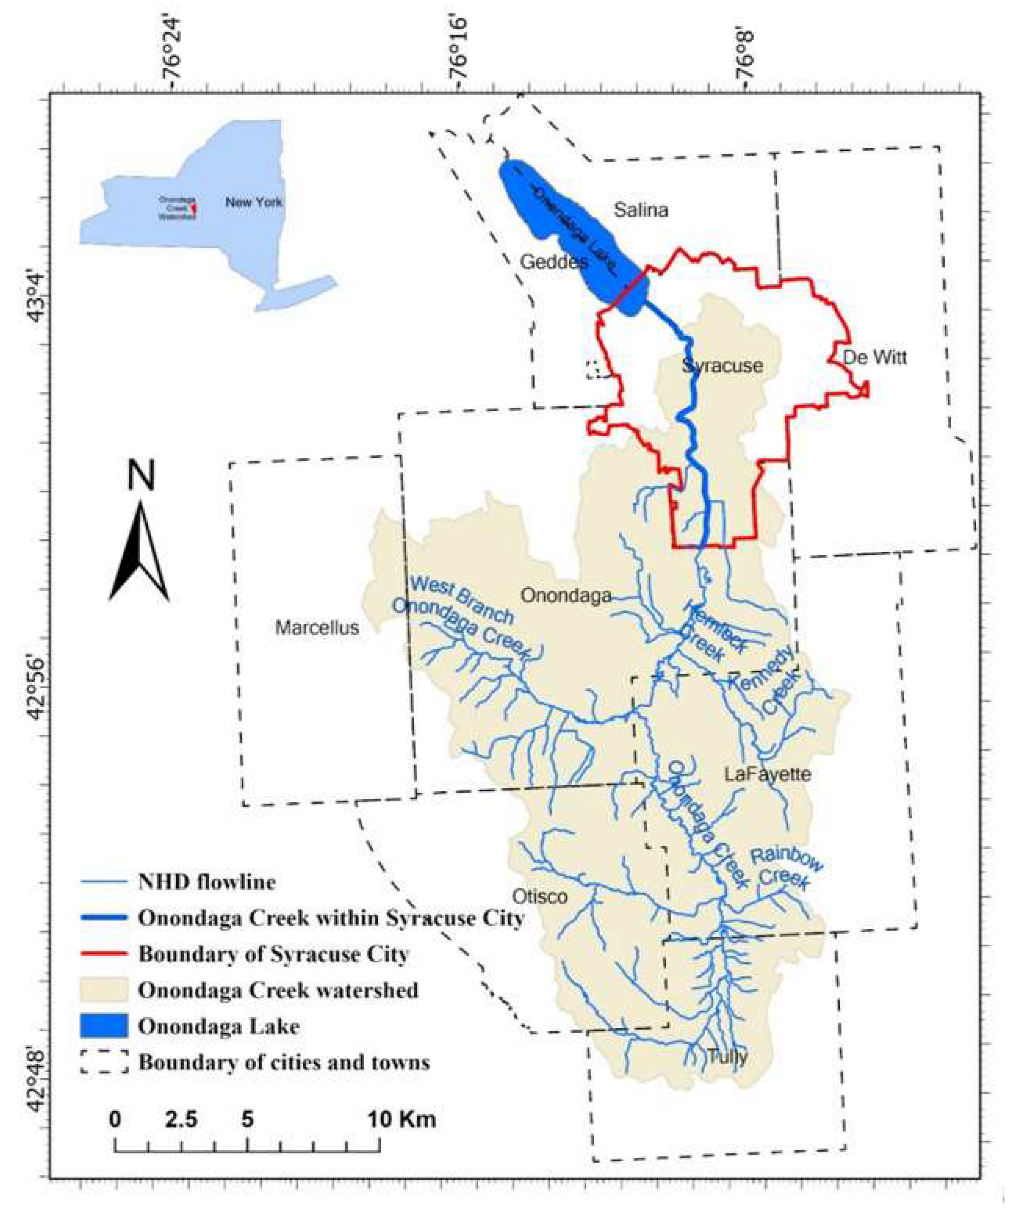
For this study, Syracuse City was chosen as the study area, which is located at the northern side of Onondaga County, New York (Figure 1). Syracuse City has a humid continental climate with distinct seasonal variations [29]. The thirty-year average annual, minimum, and maximum temperatures are 9, −10, and 28 °C, respectively [30]. The average annual precipitation of Syracuse between 1981 and 2010 was about 1065.14 mm [31]. A large proportion of the precipitation occurs as snowfall, mainly caused by lake-effect snowstorms in the long, cold winter with an annual average snow accumulation of about 293 cm, making Syracuse the snowiest city in the United States [32]. Due to changes in the weather pattern in Syracuse, the number of heavy storm events doubled in the 25 years from 1989 to 2013 [33].
Geomorphologically, a majority of Syracuse serves as the downstream area of the Onondaga Creek watershed with an area of approximately 290 km2. The valley along the watershed was scoured by glaciers that created a terminal moraine at its headwaters in Tully. The mainstream of the watershed, Onondaga Creek, runs from the southwest in Tully along the valley to the north joined by the main tributary, the West branch on the west in the middle reach, then passes through the heart of Syracuse and finally drains into Onondaga Lake (Figure 1). Onondaga Creek has a total length of about 49 km, 14.5 km of which is within the City of Syracuse (Figure 1).
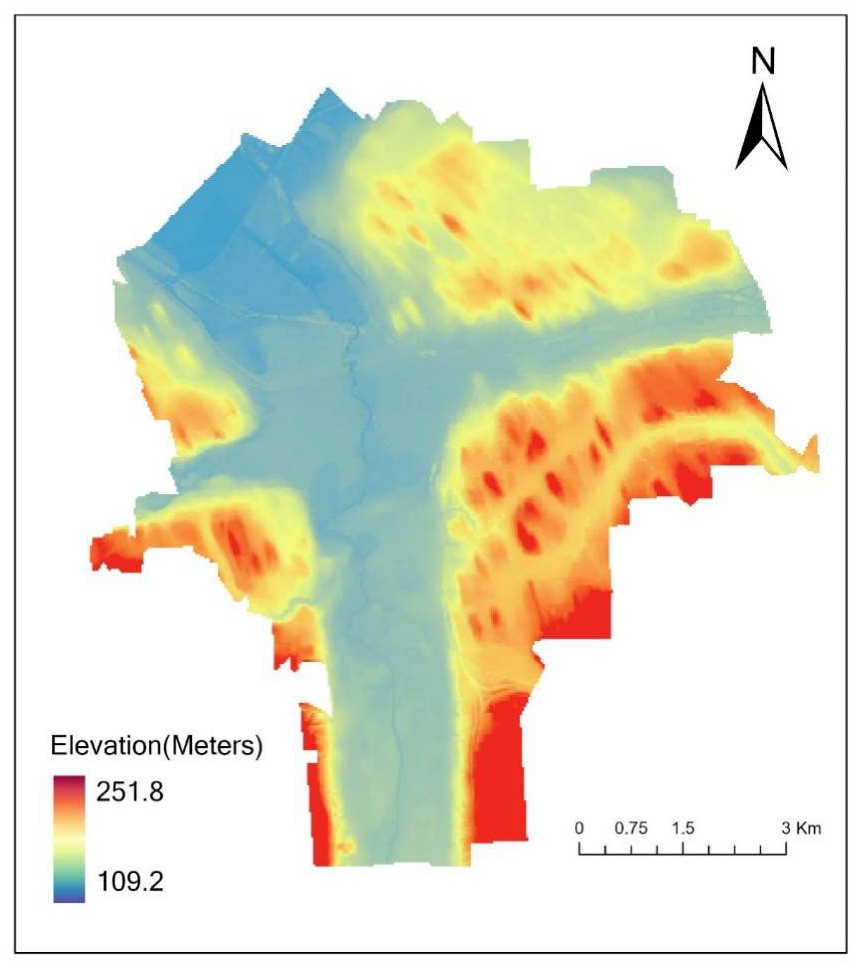
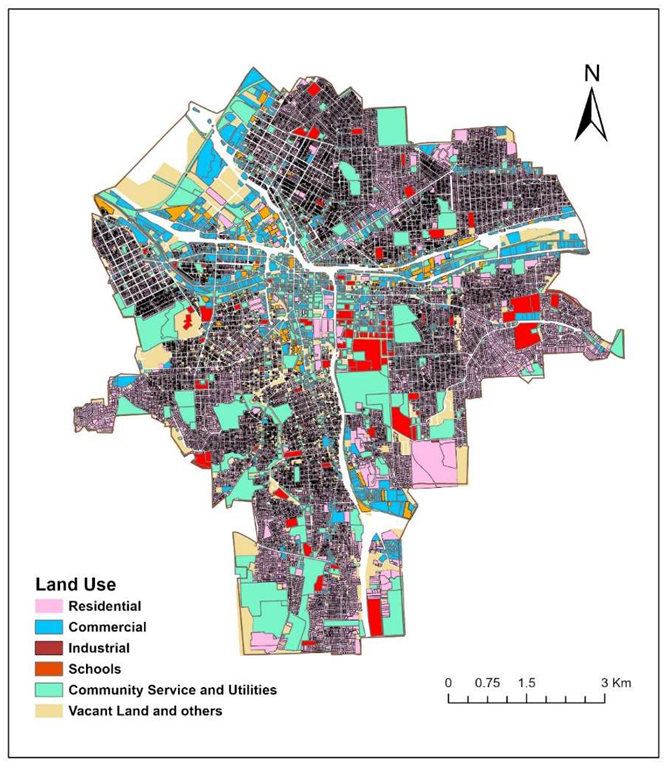
The topography of Syracuse features low, flat areas along with the downstream of Onondaga Creek and extends in two narrow belts towards the east and west, respectively (Figure 2). This area has an elevation ranging between 109 m and 140 m and is bounded by higher lands with variable hilly slopes. The low-elevation area constitutes the floodplain of the downstream reach of the Onondaga Creek and is the area directly susceptible to flooding. In the City of Syracuse, essential land uses include types of residential, commercial, industrial, schools, community service and utilities, etc. (Figure 3). The commercial areas are mainly in Downtown Syracuse, and a considerable number of residential and commercial buildings are distributed in the north and south of the city center, which are crossed by Onondaga Creek.
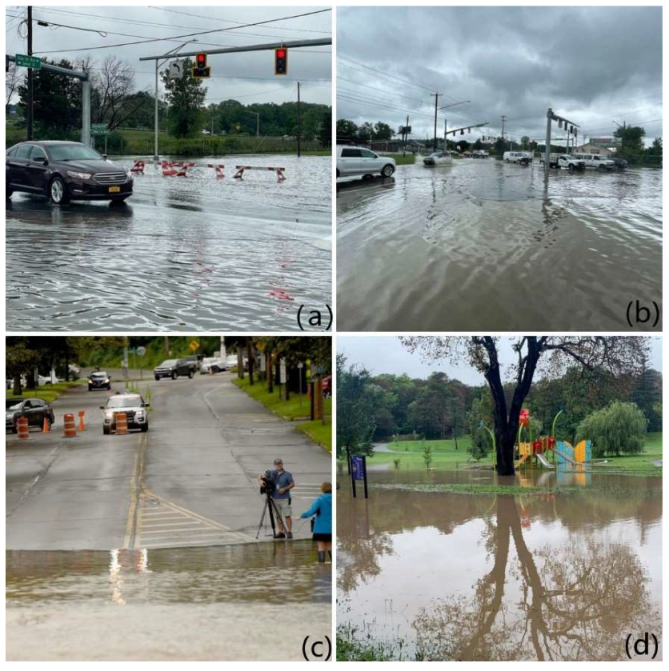
Citizens who live in the neighboring communities of Onondaga Creek have always faced a high potential risk of flood hazards [34,35]. Historical records have shown that Onondaga Creek overflowed and caused 28 flood hazards from 1865 to 2007, most of which occurred either in winter or early spring owning to high-volume snowmelt flows caused by unseasonably warm weather [36,37]. The spring snowmelt flooding events in March 1950, March 1960, and March 1964 caused extensive damage to local communities and buildings in the floodplain of Onondaga Creek [37]. Among these flooding events, the largest one occurred on 3 July 1974. This flood had a peak discharge of about 92.3 m3/s and an estimated recurrence interval of 40 years. The most recent flood event occurred on August 19, 2021, after heavy summer rainfall within the Central New York area. With a peak discharge of 89.2 m3/s, the flooding of Onondaga Creek caused the inundation of civil infrastructure in Syracuse (Figure A1).
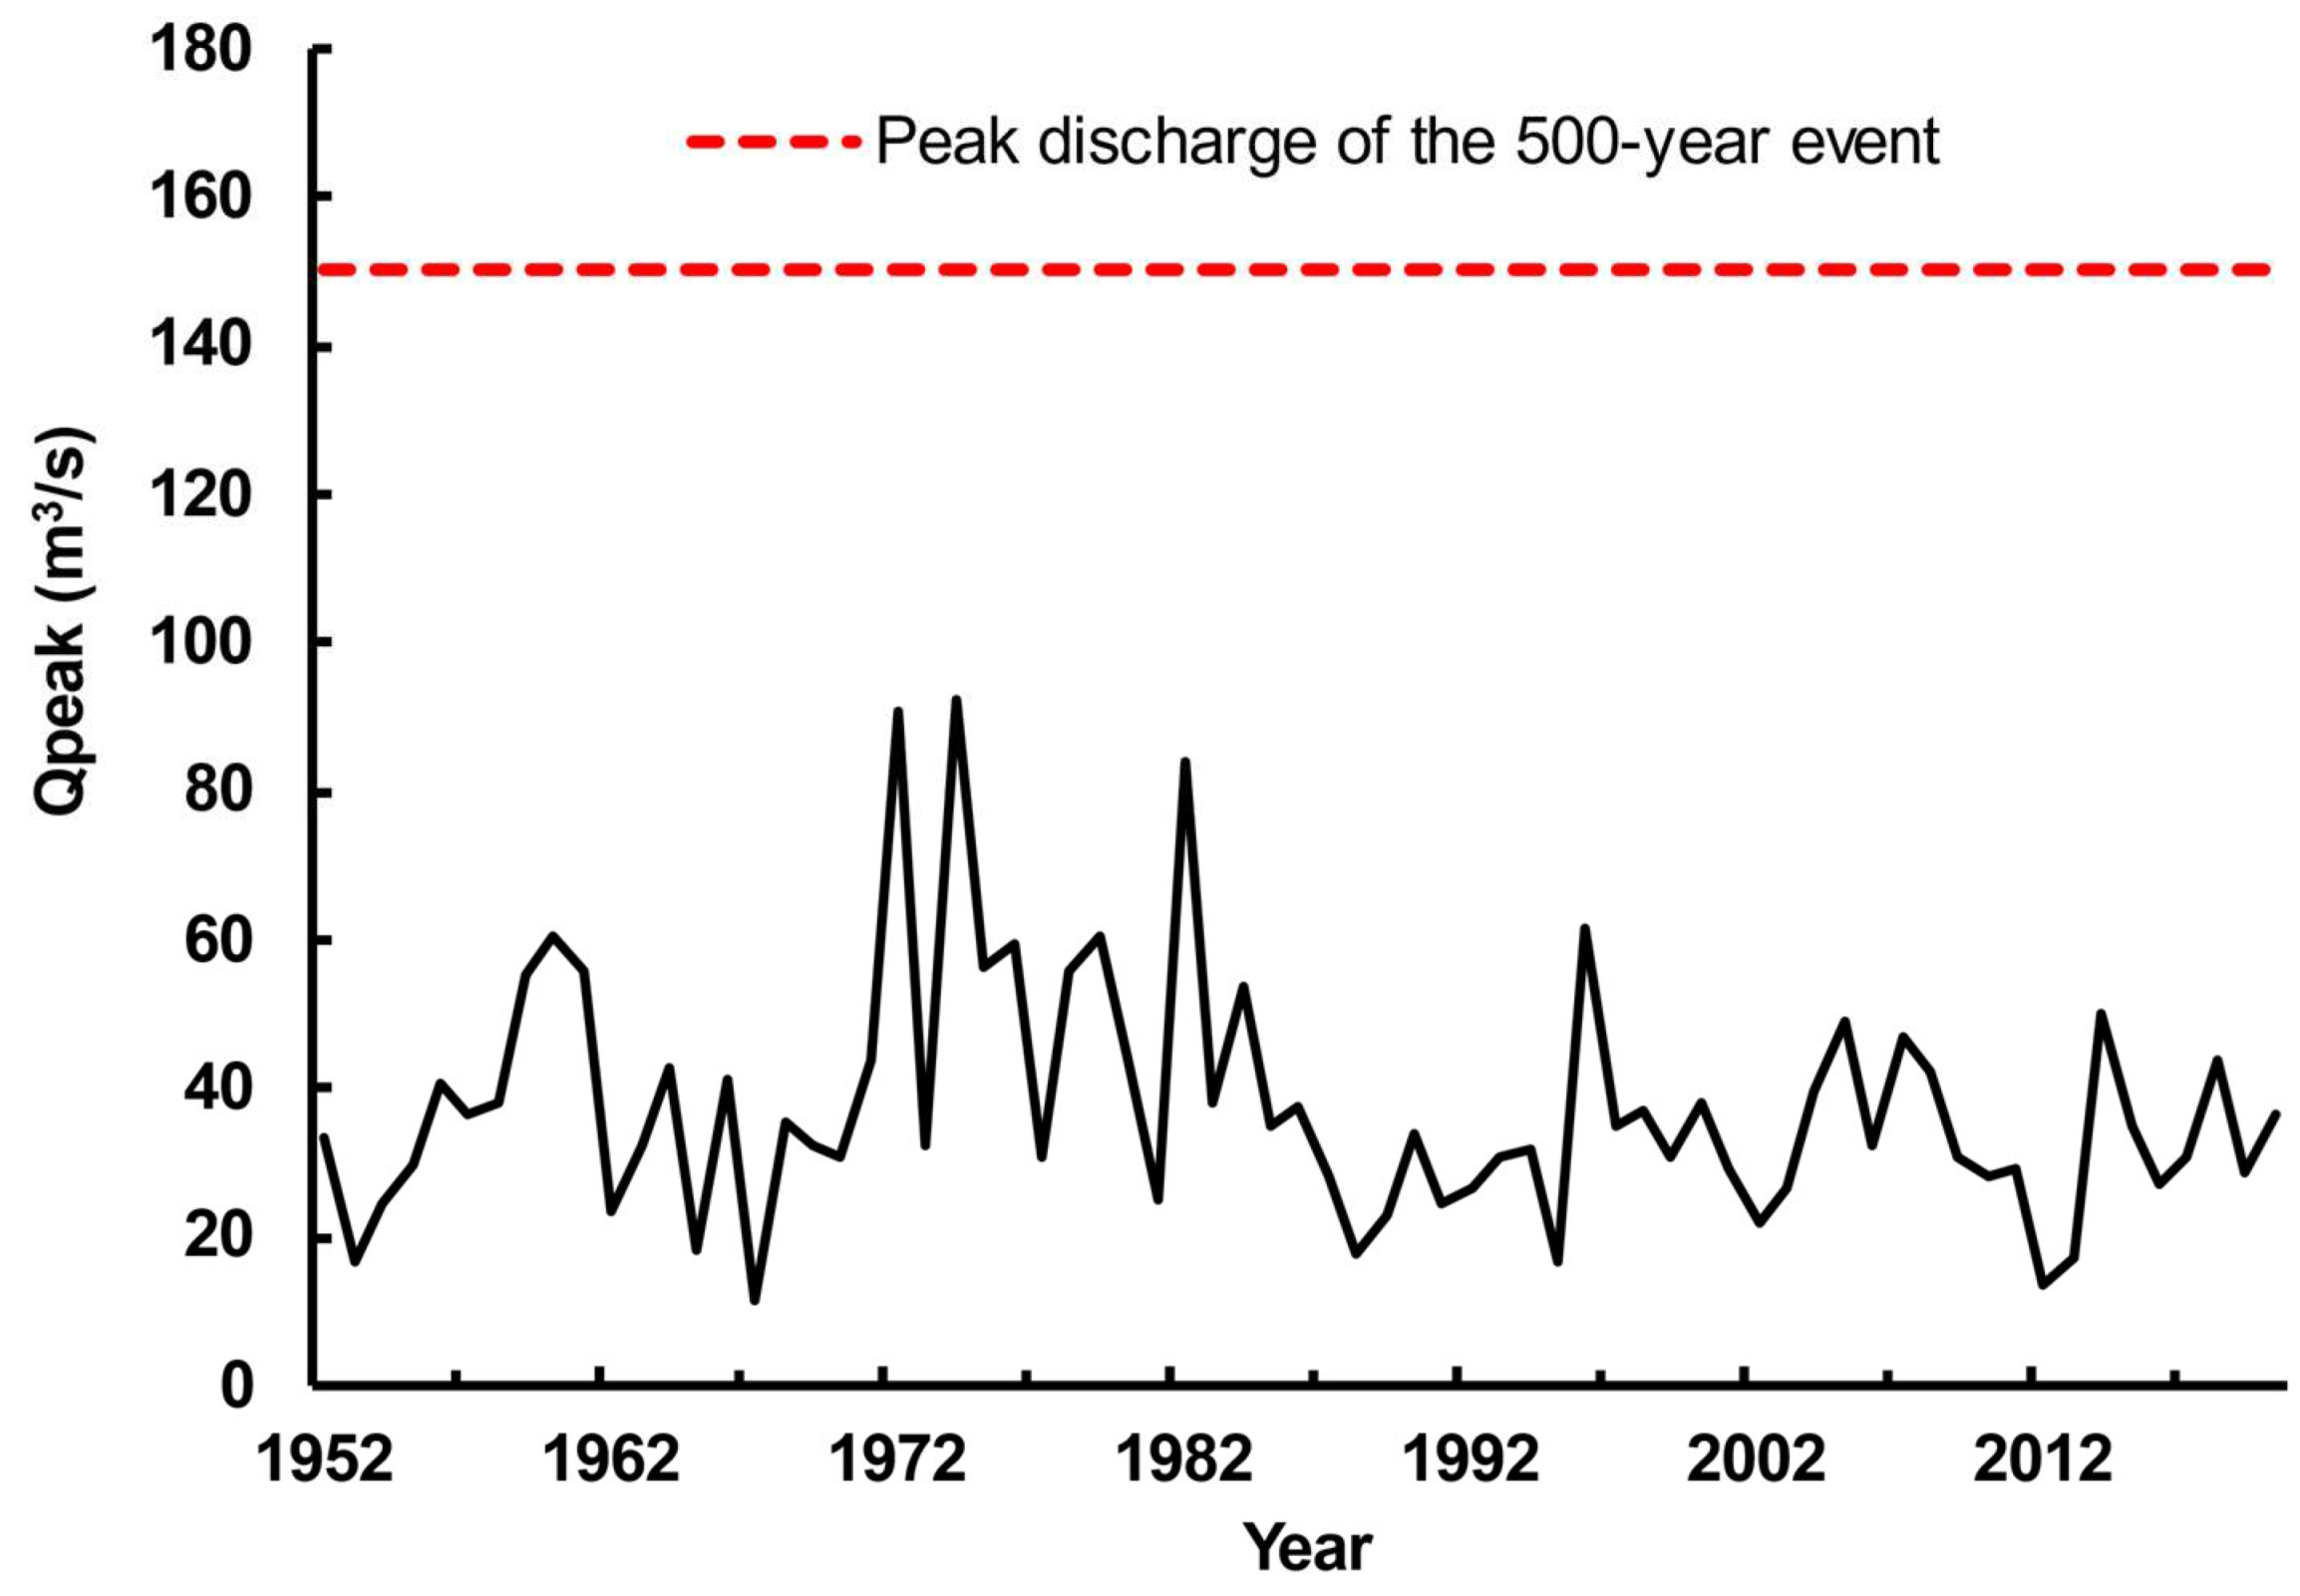
Historically, because a 500-year storm event is an extreme flood event that has not occurred in Onondaga Creek, its true hydrograph is unknown. Thus, the magnitude of the flooding may only be estimated. Gao et al. [38] developed a method of constructing this hydrograph by analyzing historical discharge data and reported its peak discharge as 150.1 m3/s. Compared to the peak discharges available from 1952 to 2020 in the USGS gauging station located at Dorwin Avenue (numbered 04239000), the peak discharge of this estimated 500-year flood event is much higher than the highest peak discharge that was measured in 1974 (Figure A2). Therefore, this estimated 500-year storm event represents an extreme event in the hydrological history of Onondaga Creek and is used as the target flood event for flood hazard assessment in this study. Actually, human-induced climate change has resulted in uncharacteristic weather patterns that have generated unprecedented events (>500-year return period) in New York State [39,40,41,42].
3. Methods
3.1. Data Collection
Data from different sources have been collected, processed, and integrated using digital image processing and GIS techniques, which are summarized in Table 1.
The DEM (Digital Elevation Model) of the study area generated from LIDAR (Light Detection and Ranging) data with the resolution of 0.3 m spatial resolution was obtained from the United States Geological Survey (USGS) open-source: https://apps.nationalmap.gov/downloader/#/ (accessed on 1 July 2020). The Landsat-8 images with 30 m spatial resolution were downloaded in the GeoTIFF format from the USGS Earth Explorer Website (http://earthexplorer.usgs.gov/, accessed on 1 July 2020). It was further used to extract the green land areas and calculate the NDVI for Syracuse. All of the images were free of clouds and sensor defects. The social and economic data about Syracuse City, including census, land use, and building footprints, were collected from Syracuse Onondaga County Planning Agency (SOCPA). The hydrological data, including annual peak discharges and the associated water stages of the Onondaga Creek, were obtained from the USGS gauging station located at Dorwin Avenue (numbered 04239000) (https://waterdata.usgs.gov/nwis, accessed on 1 July 2020). The software package used for processing the images and determining the values of the study was ENVI 5.1. The ArcGIS Pro was used to analyze the processed data and to visualize the results.
3.2. Flood Simulation
To achieve the goal of successful and accurate flood damage estimation, it is necessary to acquire the information on inundation characteristics that typically contain inundation volume, area, and depth in a potentially flood-affected region. Three steps are referred to as the flood simulation process. The first step is to determine the floodplain extent of the study area from the existing DEM data, calculate the flow water volume curve, and obtain the maximum water storage volume. The second step is calculating the storm runoff and finding the areas where runoff water may accumulate. The third and final step is to determine the flow direction to the inundated areas and estimate the extent and depth of each inundated area using a water balance equation [7,42].
To complete this simulation process and acquire the necessary data, researchers widely adopt HEC-RAS as a supportive tool [43]. HEC-RAS, which refers to the Hydrologic Engineering Center’s River Analysis System developed by the U.S. Army Corps of Engineers, is an integrated software system designed for interactive use in a multi-tasking environment. As an open-source software package, HEC-RAS is freely downloadable and used to simulate hydrodynamic processes for flood events [14].
This study used the simulation results from the earlier work of Gao et al. [38] as both a reference and for input data to further calculate the flood damage of the simulated 500-year flood event. HEC-RAS 2D was used to simulate the hydraulic and hydrological processes of the selected flood event in the study reach of Onondaga Creek. Running HEC-RAS 2D was performed by some basic input data, including (1) high-resolution DEM representing the morphology of the study river channel and its adjacent area; (2) distributed values of surface roughness, which might be assigned using the available land use and land cover data (LULC); (3) field-observed hydraulic data, which were typically discharged and stage data, as well as channel cross-sections. To assure the accuracy of the determined values of the spatially distributed surface roughness, LULC types of the study area were classified using both the 2010 LIDAR data and the 2009 New York State 4-ban leaf-off ortho-photographs.
3.3. Approaches to Flood Damage Estimation
Based on the specific physical setting and socioeconomic status of the study area, the flood damage was divided into damage to buildings (constructive damage) and damage to human lives (social damage).
3.3.1. Buildings Damage Estimation
A depth-damage curve describes the relationship between the depth of flood inundation and the degrees of damage caused by the associated inundation [44]. The two elements (depth and damage) are combined to calculate the expected damage for a specific flood event, i.e., the storm event with the 500-year return period in this study.
Given that there was no such curve available for representing the flood damage in the studied area, the first step in developing the flood depth-damage curve was gathering relevant information. Earlier studies have proved that different types of buildings have different ratios of damage to the same flood event [45]. The inundated buildings are broadly categorized into residential, commercial, and industrial based on their land-use purposes. As a result, to generate a more accurate estimation result of flood damage, three different depth-damage functions should be used for these three types of buildings.
The depth-damage functions developed by Karamouz et al. [45] were adopted in this study mainly because of the following two reasons: (1) The lack of data for establishing specific equations for the study area. To produce a depth-damage equation for a given study area, abundant damage records at the individual building level of earlier flood events are needed. Since there have been very few flooding events for Onondaga Creek in the past 100 years, there are not many records of flood damage available. The existing data are far less than what are needed for constructing an accurate and productive depth-damage function. (2) The depth-damage functions developed by Karamouz et al. [45] were for New York City and the Hudson River, which are also within New York State and, indeed, not very far from the City of Syracuse. Therefore, the physical conditions of their study area are more or less similar to those in Syracuse. This similarity could greatly reduce the magnitude of errors arising from directly applying the existing equations to the study area of this study without calibration parameters.
To generate flood depth-damage functions for buildings located within New York State, a synthetic method that allowed for the conversion of available data to reliable estimation of flood damage was developed by Karamouz et al. [45]. This method aimed at establishing damage curves based on synthetic relative depths for the different types of damage described above. For different types of land use, these functions are based on the relationship between the direct economic cost of flood damage and flood water depth. These depth-damage curves, which were derived from the United States Army Corps of Engineers (USACE) technical guidance and the HAZUS software database, were subsequently used to quantify damage for a certain inundation water depth.
In each grid cell covering the study area, the percentage of damage corresponding to the maximum depth of water from the designed flood event was determined using the equation generated from the USACE guidance and HAZUS database. The relationship between the percent of damage and the inundation depth was then introduced to the GIS platform. Therefore, given all of the information and reasons discussed above, in this study, the relationship between inundation depth and damage ratio was described by the following equations [45]:
where x was the flood inundation depth, and Y depicted the damage ratio of each type of building.
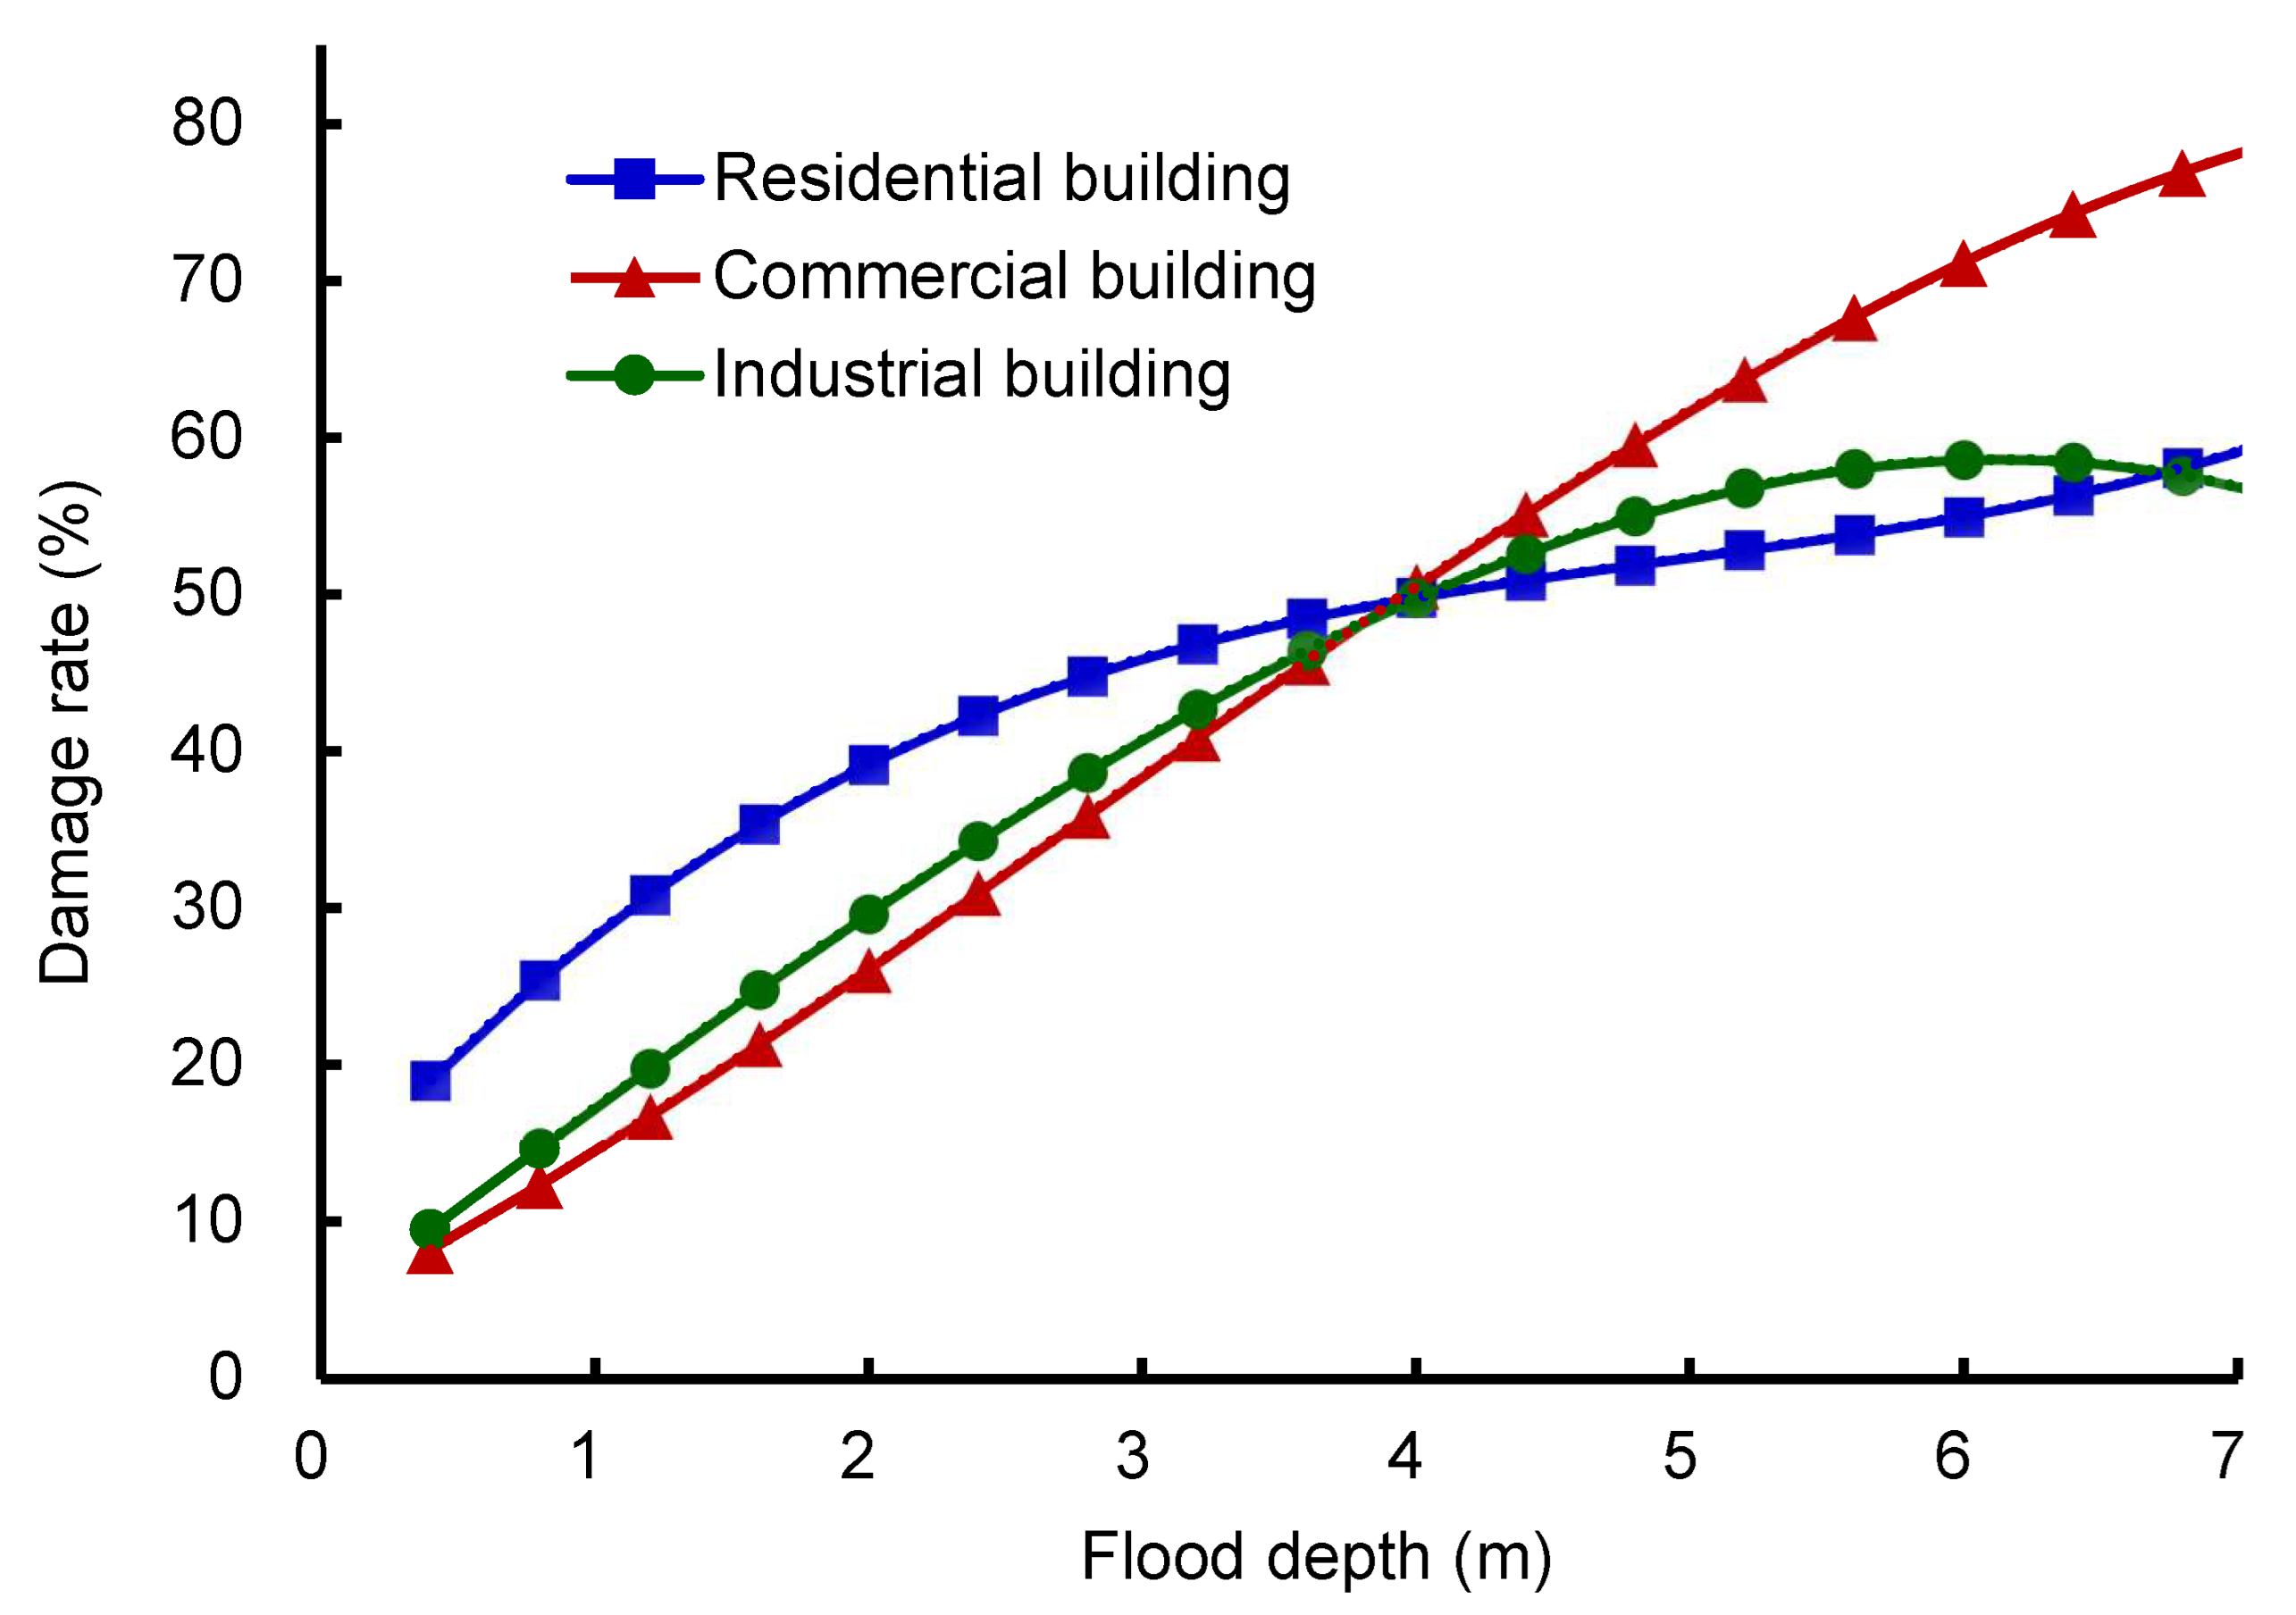
Residential: Y = 0.2391x3 − 3.5524x2 + 19.933x + 11.623
Commercial: Y = −0.1347x3 + 1.1448x2 + 9.1078x + 4.4057
Industrial: Y = −0.1273x3 + 0.1163x2 + 12.923x + 4.3553
Based on the Equations (2)–(4), the depth-damage curves for different types of buildings were established in Figure 4. These curves are non-linear and intersect at one threshold, representing the 50% damage rate at an inundation depth of 4 m. Before this threshold, the damage rate of residential buildings is higher than that of the other two types of buildings for any inundation depth, but its rate of increase is less than that of the latter. After this threshold, the depth-damage functions of residential and industrial buildings tend to converge at the damage rate of 60% as the flood depth increases to about 6 m, while that of commercial buildings remains the highest among the three types of buildings.
3.3.2. Population Damage Estimation
Loss of life has been determined with the method proposed by Boyd et al. [46], and a flood fatality function is established based on historical flood data. This model is widely adopted by flood research and has proved to be effective and efficient since it only requires the input data of inundation depths [47,48].
Equation (5) provided the relationship between fatalities and flood depth. The loss of population caused by a flood event was achieved by multiplying the casualty rate by the population in the flooded area. In this function, fatalities could never exceed 34% due to the nature of the exponential function, which seemed reasonable for the historical flood hazard events. This limiting condition was addressed based on the statistics that, in most flood events, a large portion of the population should be able to escape from floods, either through self-evacuations or evacuation forces from outside.
Based on the 2010 census data for Syracuse, the population living within the flooded area could be estimated. The corresponding loss of this population was then calculated using Equation (5) [46].
where h represented the inundation depth, and F(h) represented the population death rate.
F(h) = 0.34/(1 + exp (20.37 − 6.18h))
3.4. Framework of Flood Evacuation Design
To mitigate the adverse effects of flood disasters on urban residents, designing flood evacuation plans based on the flood simulation results is critical in flood emergency management [21]. According to the existing literature [25], practical shelter assignment and proficient evacuation route planning require a suitable spatial distribution of evacuation shelters. Moreover, the shortest route from buildings within the expected flood inundation area to the designated evacuation center should be identified.
3.4.1. Spatial Distribution Analysis of Shelter Demand and Evacuation Resources
The characteristics, including spatial distribution of both population and designated evacuation shelters, are critical for disaster preparation planning and emergency resource allocation [26,49]. In this study, the original individual census tract was divided into smaller spatial units to obtain the required information and estimate the spatial distribution of the information in the study area. The fishnet boundaries that are 200 m wide for each were employed to convert the data at the scale of the census tract into a smaller unit. When this step was completed, the study area of Syracuse, which represented the shape and location and contains various data features, was divided into smaller cell grids with a width of 200 m. For each 200 m width grid, one population point was generated to represent people who live within the grid. By using small spatial grids to obtain the spatial distribution of the population in Syracuse, this approach may better suggest and identify the spatial variations of the impacted residents.
In this study, potential flood shelters were selected on the basis of two criteria. The first was the building type, and the second was the location of the buildings based on the extent of the flood inundation. Public service buildings were considered in this study as potential shelters, including educational institutions (such as schools and colleges), religious buildings, cultural facilities, and civic or community centers.
3.4.2. Spatial Accessibility Estimation of Evacuation Shelters
After the distribution of potential emergency shelters and inundated residential buildings were determined, the next step was to measure the accessibility of shelters. The goal of this task was to compute the distance from inundated population points to the potential flood shelters identified in the previous section. Walking is considered the primary method of moving to the closest shelter since some people may not have access to vehicles in emergency circumstances [50].
This study applied a distance-based approach based on the actual road network to analyze the availability of shelters for the inundated population. In calculating the accessibility of each shelter, the centroid point feature of each grid unit was generated. These centroids represented the population within each grid area and, thus, were called population points. A road network analysis was conducted at this stage, using the GIS platform to generate evacuation routes for each population point. Mohamed [51] suggested that suitable shelters should be established at the nearest locations as the best solution for all evacuees. Following this suggestion, this study employed a “closest facility” analysis to create the transportation route between the population points and designated emergency evacuation shelters. Dijkstra’s algorithm, the most popular and frequently used route-searching algorithm, was applied to find the shortest evacuation paths [52].
Dijkstra’s algorithm is an algorithm for the single-source shortest path problem in a directed graph with nonnegative edge length [53]. It uses a similar approach to a breadth-first search to solve the single-source shortest path problem for empowered graphs. The analysis steps and pseudocode are as follows [54]:
Step 0: Set , Set , .
Step 1: Set and
Step 2: If , then stop; for v ∈ V, π(v) is the shortest path length from s to v.
Step 3: For v ∈ X, set
Set . Go to Step 1.
Dijkstra’s algorithm searches for the path from the starting point to other vertexes until it reaches the destination point, which is the evacuation shelter in our case. Since it is extremely tough and even dangerous to cross a flooded river during a flood event, the locations of flooded pathways should not be taken into account. The distances between the inundated population points and identified flood shelters were then calculated separately for each grid point. The shortest evacuation route starting from the residential buildings within the potential flooded region to the designated evacuation center was subsequently proposed. According to the guidelines from the literature [55], the ideal length of an on-foot evacuation route should be less than 3 km. Therefore, a three-kilometer transportation distance was considered appropriate and available for the accessibility measurement.
4. Results
4.1. Flood Inundation Mapping
The inundation of the 500-year flood in Syracuse City was simulated using HEC-RAS and the GIS platform. Figure 5 shows the inundation extent; the darker the color corresponding to the deeper depth of inundation. The maximum water depth was 18 m. The Onondaga Creek passed through Syracuse City, causing severe flooding in the downtown area. Flooding might cause the inundation of land along both riversides of Onondaga Creek, which would lead to a total inundation area of 30.03 km2. The land close to the upper reach of Onondaga Creek, which was located on the south side of the city, was less inundated compared to that which was close to the downstream side. The majority of the inundation was caused by overflow in the middle section of Onondaga Creek, where more attention should be paid in further damage estimation analyses.
4.2. Loss of Buildings in a 500-Year Flood Event
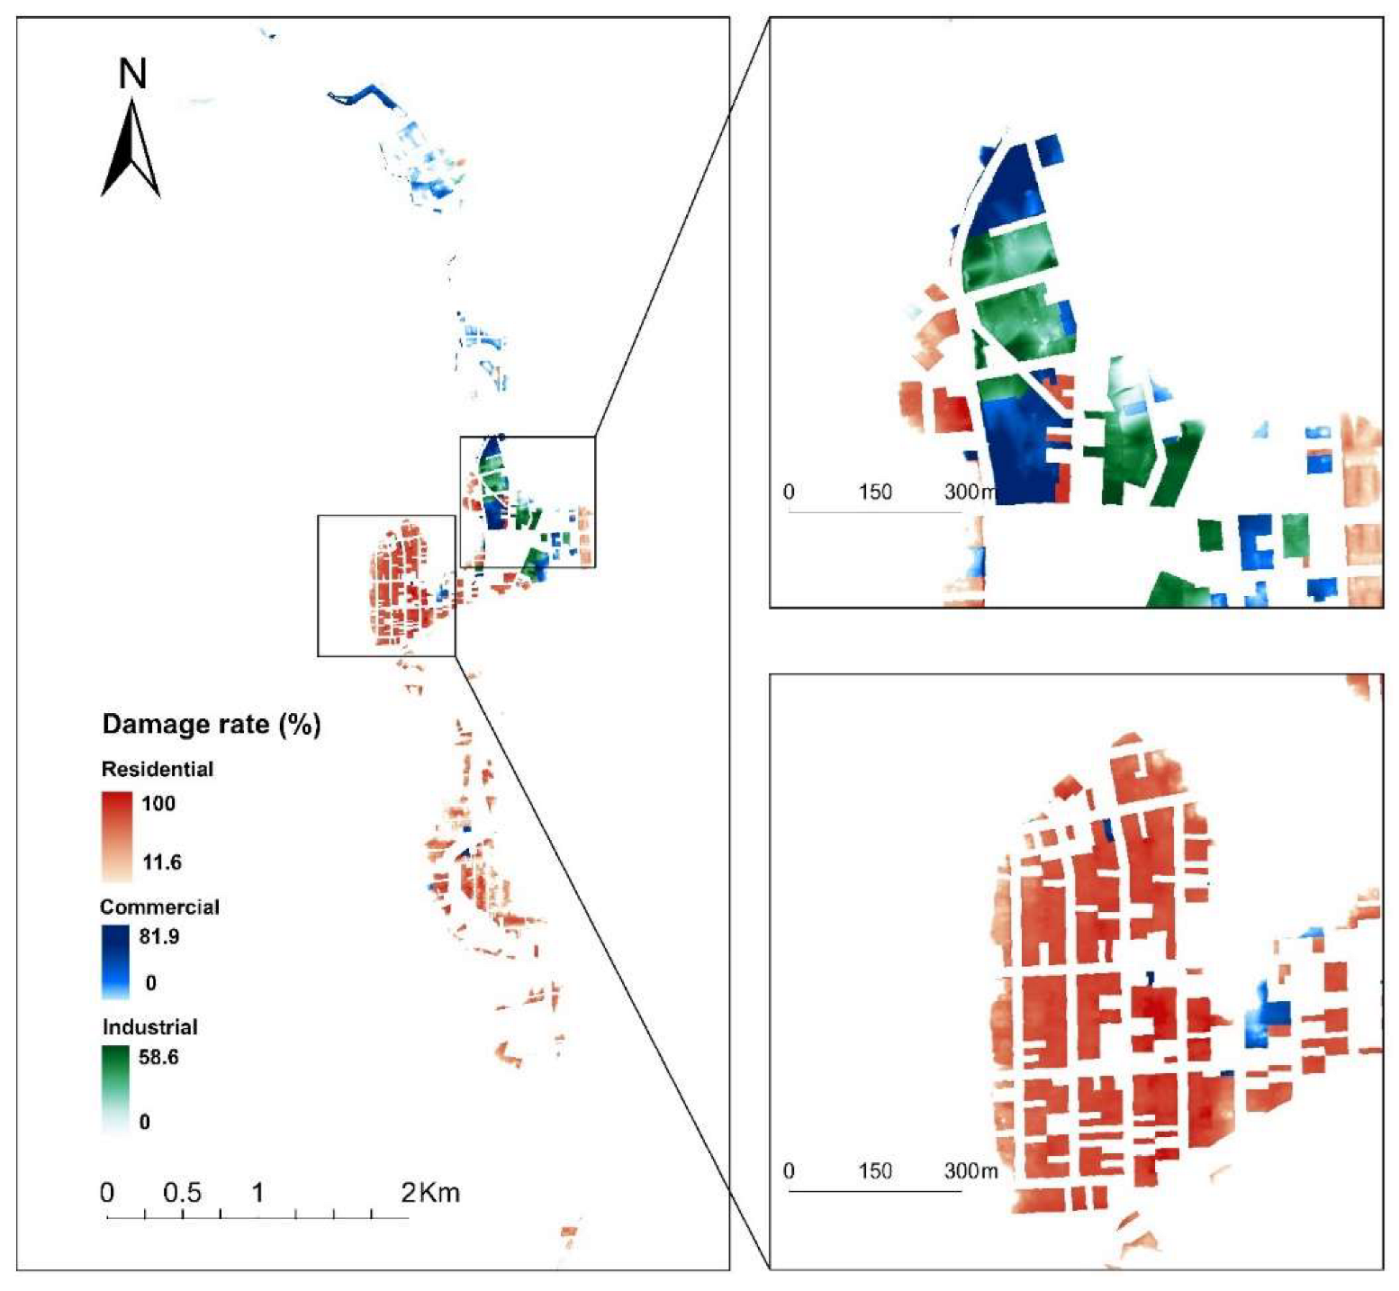
Based on the simulated 500-year flood, the influenced area and building footprint data of Syracuse were overlayed. The result was calculated using the three depth-damage equations (i.e., Equations (2)–(4)), which indicated that a total of 1139 buildings, occupying an area of 748,872 m2, would be flooded during this projected extreme event. Among these inundated buildings, 997, which covered an area of 465,256 m2, were residential buildings; 116, which covered an area of 178,990 m2, were commercial buildings; and 26, which covered 104,625 m2, were industrial buildings. The damage rate of residential buildings ranged from 11.6% to 100%. That of commercial buildings ranged from 0% to 81.9%. The industrial buildings had a lower damage rate compared to the other two, which ranged from 0% to 58.6%. A total of 326 buildings would be severely damaged by more than 80%, with the remaining 1000 buildings suffering various degrees of damage (Figure 6).
Figure 6 shows the inundated buildings, mainly in densely populated urban center areas and residential areas in the south of the city, with the inundation depths ranging from 0 to 5.78 m. The buildings in the central city and in the southern residential areas suffered heavy losses, which can be seen from the enlarged map in Figure 6. The upper enlarged figure suggests that commercial and industrial buildings located in the downtown area would suffer severe damage during the projected flood event. This also means that economic and industrial activity in Syracuse would be strongly disturbed by this projected extreme flood. The lower enlarged figure indicates that many people living in the downtown area might need emergency shelter services, since their homes would be heavily damaged during this event. Because of the high population density and damaged residential buildings in this area, this figure also reveals that we should pay more attention to evacuation planning in this area.
4.3. Loss of Population in a 500-Year Flood Event
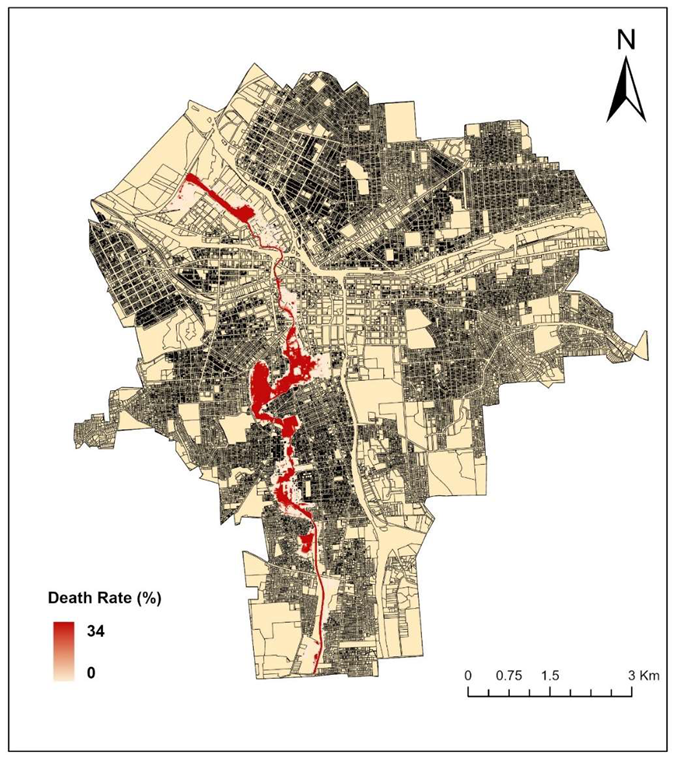
Many scholars have studied the death rate of floods using inundation depth. Literature suggests that the death rate of a population is strongly related to the inundation depth [28]. This study produced an estimate of the loss of population based on the death rate and inundation depth determined using the equation expressed in Figure 7.
In Figure 7, the darker the red color was, the higher the death rate was. There was a high death rate in residential areas in the south of Syracuse. The city center had the highest death rate, which reached 0.34. These two areas corresponded to larger flooding areas and deeper water depths, which in conjunction with a higher population density, resulted in more severe population casualties. The number of victims in a flooded area mainly depended on the number of residents living there. Applying this death rate matrix to the population distribution map, the total number of victims could reach 900 people.
4.4. Identification of Flood Shelters
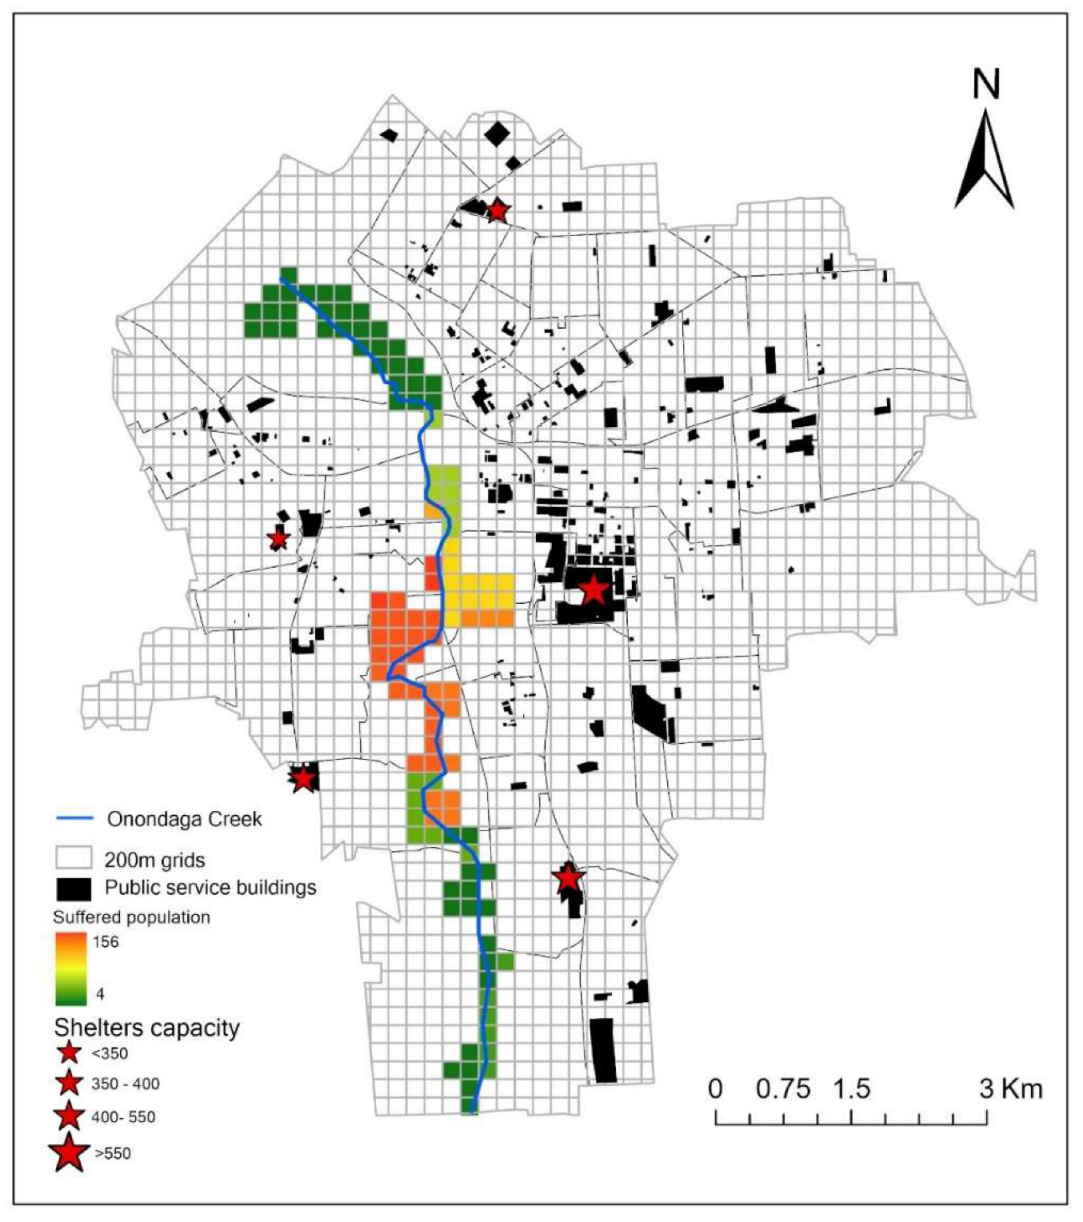
Figure 8 illustrates the spatial distribution of both the inundated population and the designated evacuation shelters in the study area. The total estimated population demand for the shelter of each grid area was classified by natural breaks and shown in different colors, from green to red. The areas with many suffered populations (yellow and red grids) were primarily located in the middle part of the study area, while the southern and northern parts of the city had fewer suffered populations (green grids).
Different types of land use (e.g., school buildings, religious institutions, and community centers) were considered as possible evacuation locations. According to this classification, there were 275 eligible buildings in the Syracuse area (blue polygons in Figure 8). Based on the above results and taking into account (i) the distribution of the population that needs to evacuate, (ii) the capacity of the evacuation point itself, and (iii) the distance to the evacuation route, five shelters were selected as the main evacuation points (red star in Figure 8).
According to the resultant map (Figure 8), the calculated shelter capacity ranges from 350 to 2500. Shelter capacity was illustrated by using symbols of different sizes. Figure 8 also shows the locations of the designated evacuation shelters. The shelter with the greatest capacity (the biggest red star) was located in the center of the city.
4.5. Determination of Flood Evacuation Routes
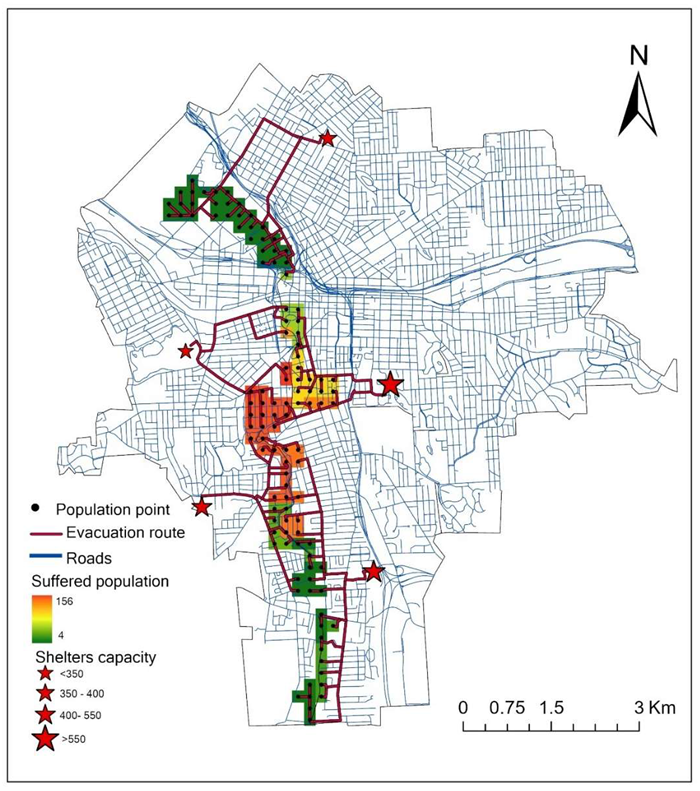
From the distribution pattern of inundated population grids (Figure 8 and Figure 9), it was obvious to see that the most crowded evacuation points were located around the central part of Syracuse. In particular, these places were either communities crossed by Onondaga Creek or mesh blocks near a dense population.
Figure 9 shows the evacuation routes from every population point in each grid to the closest designated evacuation shelters, along with the actual existing road network. The population that needed to evacuate was divided into three groups. Their respective evacuation routes were as follows: (1) For the affected people who lived close to the upper reach of Onondaga Creek, the evacuation route was to the shelter located southeast of the city. (2) For the affected people who lived close to the middle reach of the creek, there were three main evacuation routes. Because of the large number of potentially affected people in the central downtown area, one evacuation route led to the college station on the river’s east bank and the other two to the river’s west bank. The specific choice of the evacuation point was based on proximity. (3) For people who were affected by overflow in the downstream creek, the evacuation route led to the shelter in the northern part of the city.
5. Discussion
5.1. Urban Pluvial Flooding
Although there have been many advances in regulations to assess flood hazard in urban areas, the majority of these studies have focused on coastal or fluvial flooding [56,57]. However, in urban environments, pluvial flooding remains to be an imperative issue in need of attention [58]. Due to the limited research on pluvial flooding in Syracuse City, its population and assets are exposed to the risks imposed by this type of flooding, as their primary metrics for delineating flood risk are the traditional riverine flood zones designated by the Federal Emergency Management Agency (FEMA).
Urban pluvial flooding usually occurs more frequently than fluvial flooding, potentially leading to equivalent or even higher human life and assets damage for pluvial as opposed to fluvial flood events [59,60]. As a case study in Nagoya City, Japan, has shown, pluvial flooding presents comparable risks to fluvial flooding in urban settings where the main population and assets are not located around streams [60]. Many contemporary cities are becoming more prone to pluvial flooding and its associated risks [58], requiring much work on this understudied phenomenon.
Due to the different driving mechanisms of fluvial and pluvial flooding, the approaches to model them are distinguished. Although the hazard sources of fluvial flooding are river networks, the modelling approach typically involves the assessment of flood-flow frequency using either historical discharge data or a design storm, followed by the analysis of the water surface profile [43,61]. The same approach, however, does not apply to pluvial flooding. In urban settings, pluvial flooding usually occurs when the volume of runoff exceeds the capacity of natural and engineered drainage systems [39]. This category of flooding is, therefore, related to depressions, where low lying areas are surrounded by higher elevation areas, and the subsurface drainage network [61]. Thus, pluvial flood risks have been investigated by identifying depressions in a GIS environment using a high-resolution DEM [61,62,63].
To address this issue, this research implemented an existing HEC-RAS 2D simulation to screen for pluvial flooding risk in Syracuse using a 1 m resolution DEM with a 500-year storm event. Additionally, the land use or cover within areas at high risk from pluvial flooding were investigated and compared to the FEMA floodplain.
5.2. Flood Damage Estimation
Flood damage data are scarce. Only a few data sets are publicly available and little is known about data quality. The lack of reliable, consistent and comparable damage data is seen as a major obstacle for flood damage studies and effective and long-term damage prevention [64]. To analyze and investigate the common relationships between flood characteristics and damage, flood damage data are required at various spatial scales, including national, regional, and individual scales [65]. Especially in the developing process of depth-damage curves, individual object-oriented data are essential but hardly accessible in reality. Urban pluvial flooding is characterized by fast arrival of the peak discharge. It follows that flash floods may be highly variable in space and over time, which greatly challenges flood damage estimation.
The presented data and methodology established a very useful framework to assess flood impacts in urban areas. However, the damage of the projected 500-year-flood hazard calculated in this study is difficult to verify by actual measurement. The value of inundation depth obtained by the simulation in the Syracuse area is relatively large (the maximum inundation depth in urban areas was 5.78 m). However, in reality, such inundation depths are rare in urban settings. According to the depth-damage function, greater water depth corresponds to more losses. The extreme inundation depth predicted by the model might lead to lower accuracy of the estimation results, which should be compared with the loss reported during historical flooding events.
This study only evaluated the loss of buildings and population due to flooding in the Syracuse area. Considering that the broad impact of extreme floods on the city is far-reaching (not only these two aspects), with the increase of evaluation items, the city’s flood losses will also increase (such as property loss, reconstruction and mitigation cost, and trauma to the affected people). For example, for environmental loss, the submerged farmlands and vegetation area are considered as damaged. Using an average cost to calculate the total restoration cost is an approximation, but straightforward. Because some landscape restoration costs are often difficult to estimate, their ecological values are also difficult to assess. In fact, the impact of floods on the local ecological environment is far more than the vegetation restoration cost. If it is necessary to systematically assess the impact of floods on the ecosystem and study how to restore it, more influencing factors should be considered and a more complex model should be established.
The population loss of disasters has always been the focus of social and public attention, especially the population loss caused by heavy rains and floods. Regarding the estimated result of flood damage in Syracuse, it is necessary to pay special attention to the central downtown areas. Even though damage to buildings is relatively acceptable, human casualties are severe. This suggests that, in flood mitigation planning, the central downtown area should be the key area of concern where flood evacuation design needs to be created.
5.3. Flood Evacuation Design
This study evaluated the accessibility of evacuation shelters for the affected population during a projected 500-year flood event. The results can be used to map the spatial distribution of the affected population, emergency shelters, and evacuation routes in order to provide a statistical estimation of the shelter demand.
Population and shelter distribution are the most significant factors that influence shelters’ demand and accessibility in actual flood hazard circumstances [66]. Therefore, the proposed algorithm integrated the various aspects associated with the position, especially the spatial distribution of both shelters and populations. It has an obvious advantage in evaluating the imbalance between shelter demand and existing shelter resources during a potential flood event [67].
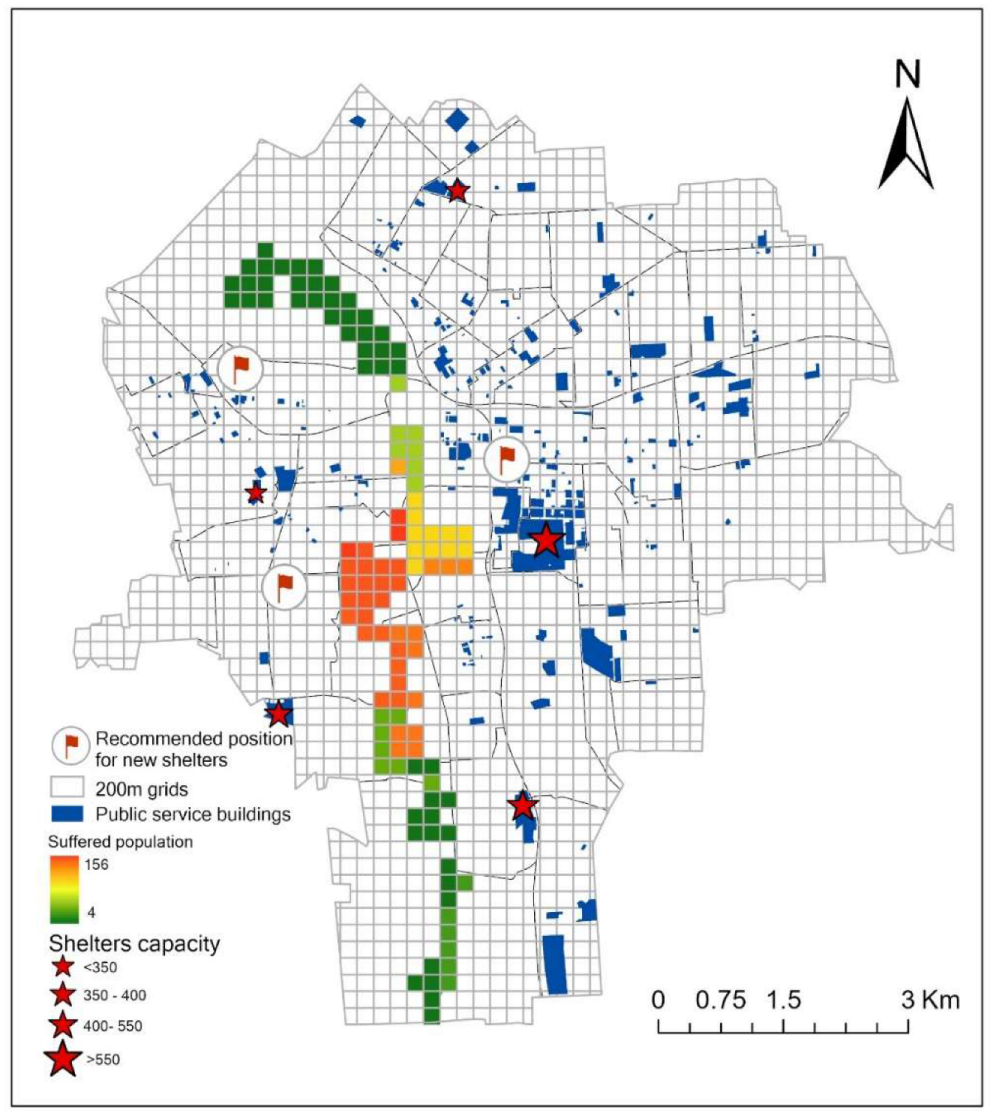
The specific evacuation routes of the closest shelters to each population grid were identified and visualized by a limiting condition of 3 km. This step is meaningful since it has been revealed that the residents in Syracuse have no sense of where to go during a flood event [28]. Therefore, the results from this study indicate the nearest designated evacuation shelter and evacuation route. This assessment is beneficial for disaster preparation by enhancing the awareness of the local people about the location and accessibility of shelters. Central downtown areas in Syracuse need to evacuate more people. Although three shelters are available in the vicinity of the high-capacity area, they may not be able to meet all of the evacuation requirements. Therefore, it is recommended to increase the number of available shelters (Figure A3). This study also showed that people located around the area on the northern and southern borders of the city might have difficulties evacuating to nearby shelters due to the long evacuation distances to the shelters. Based on the findings in this study, it is recommended that some other options for shelters be arranged in those areas, or cooperation with the neighboring towns should be planned.
The distance-based function of the actual road network was taken into account in this study rather than using the Euclidean distance to estimate the accessibility of facilities. Because, in the real world, travel routes could be covered, collapsed, or disconnected due to flood disaster, which could decrease the efficiency and impact of the evacuation and the accessibility of shelters [68]. Another limitation is the ignorance of time in the determination of parameters. If time is taken into account for flood evacuation, then all of the issues should be considered dynamically, which involves the time of the flooding process, and the time of the evacuation process. In reality, the occurrence of a flood is a dynamic process during which flooded water accumulates gradually, leading to a gradually increased inundation depth over time. Considering this dynamic process in a parameter would undoubtedly make the flood simulation more accurate, but may also require the development of new models, which is beyond the scope of this study. Involving time in flood evacuation means establishing a flood warning model, which would consider the flow of people and vehicles, a classic conundrum of network analysis [69]. As a comprise, this study considers the worst-case scenario, which is the design of a flood evacuation plan for a projected 500-year flood event.
6. Conclusions
This study systematically evaluated the potential hazard caused by a projected 500-year flood event in Syracuse City. The results indicated that a total of approximately 1139 buildings would be inundated, of which 326 would be severely damaged. Furthermore, about 7390 people would be directly affected by the flood event, among which, approximately 900 people might lose their lives.
A flood evacuation plan was designed by employing a GIS-based spatial analysis approach. The results explicitly showed the shelters’ service areas and the shortest routes leading to them. In addition, their accessibility was evaluated by integrating the spatial distribution of the population and the designated evacuation shelters.
The analysis results from this study could provide a valuable reference for flood hazard mitigation, enhancing disaster preparedness, and achieving an effective disaster response to future potential flood hazards. Regarding the estimated result of flood damage in Syracuse, it warrants more attention and studies in urban pluvial flooding.
Author Contributions
Y.S. (Yunrui Si) performed formal analysis and wrote the paper; J.L. provided feedback on the research approach and model assessment; and Y.S. (Youbin Si) conceptualized and designed the study. All authors have read and agreed to the published version of the manuscript.
Funding
This research received no external funding.
Data Availability Statement
Not applicable.
Acknowledgments
We thank Peng Gao, Professor of the Department of Geography and the Environment, Syracuse University, for supervising the research and providing us with the information on flood inundation dynamics within the city caused by a 500-year storm event.
Conflicts of Interest
The authors declare no conflict of interest.
Appendix A. Supplementary Data
Figure A1.
Scenarios of the flood event that occurred on 19 August 2021 in Syracuse City. (a,b) Hiawatha Blvd; (c) Franklin Square; (d) Onondaga Park.
Figure A1.
Scenarios of the flood event that occurred on 19 August 2021 in Syracuse City. (a,b) Hiawatha Blvd; (c) Franklin Square; (d) Onondaga Park.

Figure A2.
Annual peak discharges (Qpeak) of Onondaga Creek from 1952 to 2020.

Figure A3.
Recommended locations for new shelters.

References
- Betancourt-Suárez, V.; García-Botella, E.; Ramon-Morte, A. Flood mapping proposal in small watersheds: A case study of the Rebollos and Miranda Ephemeral Streams (Cartagena, Spain). Water 2021, 13, 102. [Google Scholar] [CrossRef]
- Borzi, G.; Roig, A.; Tanjal, C.; Santucci, L.; Tejada, M.; Carol, E. Flood hazard assessment in large plain basins with a scarce slope in the Pampean Plain, Argentina. Environ. Monit. Assess. 2021, 193, 177. [Google Scholar] [CrossRef] [PubMed]
- Rojas, R.; Feyen, L.; Watkiss, P. Climate change and river floods in the European Union: Socio-economic consequences and the costs and benefits of adaptation. Glob. Environ. Chang. 2013, 23, 1737–1751. [Google Scholar] [CrossRef]
- IPCC. Climate Change 2021: The Physical Science Basis Contribution of Working Group I of to the Sixth Assessment Report of the Intergovernmental Panel on Climate Change; Masson-Delmotte, V., Zhai, P., Pirani, A., Connors, S.L., Pean, C., Chen, Y., Berger, S., Yu, R., Zhou, B., Caud, N., et al., Eds.; Cambridge University Press: Cambridge, UK; New York, NY, USA, 2021. [Google Scholar]
- Darabi, H.; Choubin, B.; Rahmati, O.; Haghighi, A.T.; Pradhan, B.; Kløve, B. Urban flood risk mapping using the GARP and QUEST models: A comparative study of machine learning techniques. J. Hydrol. 2019, 569, 142–154. [Google Scholar] [CrossRef]
- Papilloud, T.; Röthlisberger, V.; Loreti, S.; Keiler, M. Flood exposure analysis of road infrastructure—Comparison of different methods at national level. Int. J. Disaster Risk Reduct. 2020, 47, 101548. [Google Scholar] [CrossRef]
- Stefanidis, S.; Alexandridis, V.; Theodoridou, T. Flood exposure of residential areas and infrastructure in Greece. Hydrology 2022, 9, 145. [Google Scholar] [CrossRef]
- Dano, U.; Balogun, A.L.; Matori, A.N.; Yusouf, K.W.; Abubakar, I.; Mohamed, M.S.; Aina, Y.; Pradhan, B. Flood susceptibility mapping using GIS-based analytic network process: A case study of Perlis, Malaysia. Water 2019, 11, 615. [Google Scholar] [CrossRef] [Green Version]
- Shrestha, B.B.; Kawasaki, A.; Zin, W.W. Development of flood damage assessment method for residential areas considering various house types for Bago Region of Myanmar. Int. J. Disaster Risk Reduct. 2021, 66, 102602. [Google Scholar] [CrossRef]
- Skilodimou, H.D.; Bathrellos, G.D.; Alexakis, D.E. Flood hazard assessment mapping in burned and urban areas. Sustainability 2021, 13, 4455. [Google Scholar] [CrossRef]
- Molinari, D.; Ballio, F.; Handmer, J.; Menoni, S. On the modeling of significance for flood damage assessment. Int. J. Disaster Risk Reduct. 2014, 10, 381–391. [Google Scholar] [CrossRef]
- Velascoa, M.; Àngels, C.; Russo, B. Flood damage assessment in urban areas. Application to the Raval district of Barcelona using synthetic depth damage curves. Urban Water J. 2016, 13, 426–440. [Google Scholar] [CrossRef]
- Wang, G.; Liu, Y.; Hu, Z.; Zhang, G.; Liu, J.; Lyu, Y.; Gu, Y.; Huang, X.; Zhang, Q.; Liu, L. Flood risk assessment of subway systems in metropolitan areas under land subsidence scenario: A case study of Beijing. Remote Sens. 2021, 13, 637. [Google Scholar] [CrossRef]
- Kreibich, H.; Seifert, I.; Merz, B.; Thieken, A.H. Development of FLEMOcs—A new model for the estimation of flood losses in the commercial sector. Hydrol. Sci. J. 2010, 55, 1302–1314. [Google Scholar] [CrossRef]
- Merz, B.; Kreibich, H.; Schwarze, R.; Thieken, A. Assessment of economic flood damage. Nat. Hazards Earth Syst. Sci. 2010, 10, 1697–1724. [Google Scholar] [CrossRef]
- Nascimento, N.; Machado, M.L.; Baptista, M.; De Paula, E.; Silva, A. The assessment of damage caused by floods in the Brazilian context. Urban Water J. 2007, 4, 195–210. [Google Scholar] [CrossRef]
- Komolafe, A.A.; Herath, S.; Avtar, R. Methodology to assess potential flood damages in urban areas under the influence of climate change. Nat. Hazards Rev. 2018, 19, 05018001. [Google Scholar] [CrossRef]
- Roccati, A.; Luino, F.; Turconi, L.; Piana, P.; Watkins, C.; Faccini, F. Historical geomorphological research of a Ligurian Coastal Floodplain (Italy) and its value for management of flood risk and environmental sustainability. Sustainability 2018, 10, 3727. [Google Scholar] [CrossRef] [Green Version]
- Masuya, A.; Dewan, A.; Corner, R.J. Population evacuation: Evaluating spatial distribution of flood shelters and vulnerable residential units in Dhaka with geographic information systems. Nat. Hazards 2015, 78, 1859–1882. [Google Scholar] [CrossRef]
- Zhou, Q.; Su, J.; Arnbjerg-Nielsen, K.; Ren, Y.; Luo, J.; Ye, Z.; Feng, J. A GIS-based hydrological modeling approach for rapid urban flood hazard assessment. Water 2021, 13, 1483. [Google Scholar] [CrossRef]
- Lim, H., Jr.; Lim, M.B.; Piantanakulchai, M. A review of recent studies on flood evacuation planning. J. East. Asia Soc. Transp. Stud. 2013, 10, 147–162. [Google Scholar]
- Alaeddine, H.; Serrhini, K.; Maizia, M.; Néron, E. A spatiotemporal optimization model for the evacuation of the population exposed to flood hazard. Nat. Hazards Earth Syst. Sci. 2015, 15, 687–701. [Google Scholar] [CrossRef]
- Liu, X.; Lim, S. Integration of spatial analysis and an agent-based model into evacuation management for shelter assignment and routing. J. Spat. Sci. 2016, 61, 283–298. [Google Scholar] [CrossRef]
- Arabani, A.B.; Farahani, R.Z. Facility location dynamics: An overview of classifications and applications. Comput. Ind. Eng. 2012, 62, 408–420. [Google Scholar] [CrossRef]
- Gong, J.; Liu, Y.L.; Liu, Y.F.; Huang, P.J.; Li, J.W. Evaluating the evacuation and rescue capabilities of urban open space from a land use perspective: A case study in Wuhan, China. ISPRS Int. J. Geo-Inf. 2017, 6, 227. [Google Scholar] [CrossRef] [Green Version]
- Li, L.; Uyttenhove, P.; Van Eetvelde, V. Planning green infrastructure to mitigate urban surface water flooding risk—A methodology to identify priority areas applied in the city of Ghent. Landsc. Urban Plan. 2020, 194, 103703. [Google Scholar] [CrossRef]
- Liu, N.; Shao, X.; Qi, M. A bi-objective evacuation routing engineering model with secondary evacuation expected costs. Syst. Eng. Procedia 2012, 5, 1–7. [Google Scholar]
- Lee, Y.H.; Kim, H.; Han, K.Y.; Hong, W.H. Flood evacuation routes based on spatiotemporal inundation risk assessment. Water 2020, 12, 2271. [Google Scholar] [CrossRef]
- NPCC. Climate Risk Information 2013: Observations, Climate Change Projections, and Maps; NPCC: New York, NY, USA, 2013. [Google Scholar]
- National Oceanic and Atmospheric Administration (NOAA). 2010. Available online: https://www.noaa.gov/weather (accessed on 1 July 2020).
- Northwest Alliance for Computational Science & Engineering. PRISM Climate Data. 2020. Available online: http://prism.oregonstate.edu/explorer/ (accessed on 1 July 2020).
- Squier-Babcock, M.; Davidson, C.I. Hydrologic performance of an extensive green roof in Syracuse, NY. Water 2020, 12, 1535. [Google Scholar] [CrossRef]
- Northeast Regional Climate Center (NRCC). 2021. Available online: http://www.nrcc.cornell.edu/ (accessed on 1 July 2020).
- Patrick, L.; Solecki, W.; Jacob, K.H.; Kunreuther, H.; Nordenson, G. New York City panel on climate change 2015 report chapter 3: Static coastal flood mapping. Ann. N. Y. Acad. Sci. 2015, 1336, 45–55. [Google Scholar] [CrossRef] [Green Version]
- US Geological Survey. StreamStats. 2020. Available online: https://streamstats.usgs.gov/ss/ (accessed on 1 July 2020).
- Dormitory Authority of the State of New York. Onondaga Creek Flood and Sediment Study; Department of Environmental Conservation: New York, NY, USA, 2016. [Google Scholar]
- Federal Emergency Management Agency (FEMA). Risk Mapping, Assessment and Planning (Risk MAP). 2017. Available online: https://www.fema.gov/risk-mapping-assessment-and-planning-risk-map (accessed on 1 July 2020).
- Gao, P.; Gao, W.; Ke, N. Assessing the impact of flood inundation dynamics on an urban environment. Nat. Hazards 2021, 109, 1047–1072. [Google Scholar] [CrossRef]
- Blessing, R.; Sebastian, A.; Brody, S.D. Flood risk delineation in the United States: How much loss are we capturing? Nat. Hazards Rev. 2017, 18, 1–10. [Google Scholar] [CrossRef]
- DeGaetano, A.T.; Castellano, C.M. Future projections of extreme precipitation intensity-duration-frequency curves for climate adaptation planning in New York State. Clim. Serv. 2017, 5, 23–35. [Google Scholar] [CrossRef]
- Saksena, S.; Dey, S.; Merwade, V.; Singhofen, P.J. A computationally efficient and physically based approach for urban flood modeling using a flexible spatiotemporal structure. Water Resour. Res. 2019, 56, e2019WR025769. [Google Scholar] [CrossRef] [Green Version]
- Seenu, P.Z.; Venkata, R.E.; Jayakumar, K.V. Visualisation of urban flood inundation using SWMM and 4D GIS. Spat. Inf. Res. 2020, 28, 459–467. [Google Scholar] [CrossRef]
- Ghimire, E.; Sharma, S. Flood damage assessment in HAZUS using various resolution of data and one-dimensional and two-dimensional HEC-RAS depth grids. Nat. Hazards Rev. 2021, 22, 04020054. [Google Scholar] [CrossRef]
- Lindenschmidt, K.E.; Herrmann, U.; Pech, I.; Suhr, U.; Apel, H.; Thieken, A. Risk assessment and mapping of extreme floods in non-Dyked communities along the Elbe and Mulde Rivers. Adv. Geosci. 2006, 9, 15–23. [Google Scholar] [CrossRef] [Green Version]
- Karamouz, M.; Fereshtehpour, M.; Ahmadvand, F.; Zahmatkesh, Z. Coastal flood damage estimator: An alternative to FEMA’s HAZUS platform. J. Irrig. Drain. Eng. 2016, 142, 04016016. [Google Scholar] [CrossRef]
- Boyd, E.; Levitan, M.; van Heerden, I. Further Specification of the Dose-Response Relationship for Flood Fatality Estimation. In Proceedings of the US-Bangladesh Workshop on Innovation in Windstorm/Storm Surge Mitigation Construction, National Science Foundation and Ministry of Disaster & Relief, Government of Bangladesh, Dhaka, Bangladesh, 20–21 December 2005. [Google Scholar]
- Kablan, M.K.A.; Dongo, K.; Coulibaly, M. Assessment of social vulnerability to flood in urban Côte d’Ivoire using the MOVE framework. Water 2017, 9, 292. [Google Scholar] [CrossRef] [Green Version]
- Feng, B.; Wang, J.; Zhang, Y.; Hall, B.; Zeng, C. Urban flood hazard mapping using a hydraulic–GIS combined model. Nat. Hazards 2020, 100, 1089–1104. [Google Scholar] [CrossRef]
- Wang, Z.Q.; Huang, J.; Wang, H.M.; Kang, J.L.; Cao, W.W. Analysis of flood evacuation process in vulnerable community with mutual aid mechanism: An agent-based simulation framework. Int. J. Environ. Res. Public Health 2020, 17, 560. [Google Scholar] [CrossRef] [Green Version]
- Sanyal, J.; Lu, X.X. Ideal location for flood shelter: A geographic information system approach. J. Flood Risk Manag. 2009, 2, 262–271. [Google Scholar] [CrossRef]
- Mohamed, S.A. Development of a GIS-based alert system to mitigate flash flood impacts in Asyut governorate, Egypt. Nat. Hazards 2021, 108, 2739–2763. [Google Scholar] [CrossRef]
- Trindade, A.; Teves-Costa, P.; Catita, C. A GIS-based analysis of constraints on pedestrian tsunami evacuation routes: Cascais case study (Portugal). Nat. Hazards 2018, 93, 169–185. [Google Scholar] [CrossRef]
- Misra, J. A walk over the shortest path: Dijkstra’s Algorithm viewed as fixed-point computation. Inf. Process. Lett. 2001, 77, 197–200. [Google Scholar] [CrossRef]
- Deng, Y.; Chen, Y.X.; Zhang, Y.J.; Mahadevan, S. Fuzzy Dijkstra algorithm for shortest path problem under uncertain environment. Appl. Soft Comput. 2012, 12, 1231–1237. [Google Scholar] [CrossRef]
- Pralle, S. Drawing lines: FEMA and the politics of mapping flood zones. Clim. Chang. 2019, 152, 227–237. [Google Scholar] [CrossRef]
- Zhou, Q.; Mikkelsen, P.S.; Halsnæs, K.; Arnbjerg-Nielsen, K. Framework for economic pluvial flood risk assessment considering climate change effects and adaptation benefits. J. Hydrol. 2012, 414, 539–549. [Google Scholar] [CrossRef]
- Guerreiro, S.B.; Glenis, V.; Dawson, R.J.; Kilsby, C. Pluvial flooding in European cities—A continental approach to urban flood modelling. Water 2017, 9, 296. [Google Scholar] [CrossRef] [Green Version]
- Rosenzweig, B.R.; McPhillips, L.; Chang, H.; Cheng, C.W.; Welty, C.; Matsler, M.; Iwaniec, D.; Davidson, C.I. Pluvial flood risk and opportunities for resilience. WIREs Water 2018, 5, e1302. [Google Scholar] [CrossRef]
- Moftakhari, H.R.; AghaKouchak, A.; Sanders, B.F.; Matthew, R.A. Cumulative hazard: The case of nuisance flooding. Earths Future 2017, 5, 214–223. [Google Scholar] [CrossRef]
- Tanaka, T.; Kiyohara, K.; Tachikawa, Y. Comparison of fluvial and pluvial flood risk curves in urban cities derived from a large ensemble climate simulation dataset: A case study in Nagoya. J. Hydrol. 2020, 584, 124706. [Google Scholar] [CrossRef]
- Huang, H.; Chen, X.; Wang, X.; Wang, X.; Liu, L. A depression-based index to represent topographic control in urban pluvial flooding. Water 2019, 11, 2115. [Google Scholar] [CrossRef]
- Wu, Q.; Lane, C.R.; Wang, L.; Vanderhoof, M.K.; Christensen, J.R.; Liu, H. Efficient delineation of nested depression hierarchy in digital elevation models for hydrological analysis using level-set method. J. Am. Water Resour. Assoc. 2018, 55, 354–368. [Google Scholar] [CrossRef] [PubMed]
- Samela, C.; Persiano, S.; Bagli, S.; Luzzi, V.; Mazzoli, P.; Humer, G.; Reithofer, A.; Essenfelder, A.H.; Amadio, M.; Mysiak, J.; et al. Safer_RAIN: A DEM-Based hierarchical filling-&-spilling algorithm for pluvial flood hazard assessment and mapping across large urban areas. Water 2020, 12, 1514. [Google Scholar] [CrossRef]
- Downton, M.W.; Pielke, R.A. How accurate are disaster loss data? The case of U.S. flood damage. Nat. Hazards 2005, 35, 211–228. [Google Scholar] [CrossRef] [Green Version]
- Jonkman, S.N. Global perspectives on loss of human life caused by floods. Nat. Hazards 2005, 34, 151–175. [Google Scholar] [CrossRef]
- Kebede, A.S.; Nicholls, R.J. Exposure and vulnerability to climate extremes: Population and asset exposure to coastal flooding in Dar es Salaam, Tanzania. Reg. Environ. Chang. 2012, 12, 81–94. [Google Scholar] [CrossRef]
- Lim, J.; Lee, K. Flood mapping using multi-source remotely sensed data and logistic regression in the heterogeneous mountainous regions in North Korea. Remote Sens. 2018, 10, 1036. [Google Scholar] [CrossRef] [Green Version]
- Jato-Espino, D.; Sillanpää, N.; Andrés-Doménech, I.; Rodriguez-Hernandez, J. Flood risk assessment in urban catchments using multiple regression analysis. J. Water Resour. Plan. Manag. 2018, 144, 04017085. [Google Scholar] [CrossRef] [Green Version]
- Williams, J.B. Critical flow centrality measures on interdependent networks with time-varying demands. Int. J. Crit. Infrastruct. Prot. 2021, 35, 100462. [Google Scholar] [CrossRef]
Figure 1.
Geographic location of the study area.

Figure 2.
Elevation map of Syracuse City.

Figure 3.
Map of different land use categories in Syracuse City.

Figure 4.
Depth-damage curves for different buildings.

Figure 5.
Inundation depth in Syracuse for a 500-year flood event.

Figure 6.
The map of inundated buildings near Onondaga Creek (Red color represents inundated residential buildings; Blue represents inundated commercial buildings; Green represents inundated industrial buildings; Darker color represents a higher percentage of damage. The two figures on the right side are the enlarged maps of inundated buildings in the downtown area).

Figure 7.
Population death rate of the 500-year flood.

Figure 8.
Spatial distribution of the inundated population and identified flood shelters.

Figure 9.
Spatial distribution of the inundated population points and the designated evacuation routes.
Figure 9.
Spatial distribution of the inundated population points and the designated evacuation routes.


Table 1.
Data collected for analyses in this study.
| Data Category | Data Type | Resolution/Scale | Year | Source |
|---|---|---|---|---|
| DEM | Raster | 0.3 m | 2010 | USGS |
| Landsat-8 Remote sensing image | Raster | 30 m | 2015 | USGS |
| Census | Vector | Household-level | 2010 | U.S. Census Bureau |
| Land use | Vector | Household-level | 2015 | SOCPA |
| Building footprint | Vector | Household-level | 2015 | SOCPA |
| Hydrological data | Numeric | Daily | 1970–2020 | USGS |
Disclaimer/Publisher’s Note: The statements, opinions and data contained in all publications are solely those of the individual author(s) and contributor(s) and not of MDPI and/or the editor(s). MDPI and/or the editor(s) disclaim responsibility for any injury to people or property resulting from any ideas, methods, instructions or products referred to in the content. |
© 2022 by the authors. Licensee MDPI, Basel, Switzerland. This article is an open access article distributed under the terms and conditions of the Creative Commons Attribution (CC BY) license (https://creativecommons.org/licenses/by/4.0/).
Share and Cite
MDPI and ACS Style
Si, Y.; Li, J.; Si, Y. Urban Flood Loss Estimation and Evacuation Design Based on a 500-Year Extreme Flood Event in Syracuse City. Water 2023, 15, 3. https://doi.org/10.3390/w15010003
AMA Style
Si Y, Li J, Si Y. Urban Flood Loss Estimation and Evacuation Design Based on a 500-Year Extreme Flood Event in Syracuse City. Water. 2023; 15(1):3. https://doi.org/10.3390/w15010003
Chicago/Turabian StyleSi, Yunrui, Junli Li, and Youbin Si. 2023. "Urban Flood Loss Estimation and Evacuation Design Based on a 500-Year Extreme Flood Event in Syracuse City" Water 15, no. 1: 3. https://doi.org/10.3390/w15010003
Note that from the first issue of 2016, this journal uses article numbers instead of page numbers. See further details here.