
An Evaluation Framework for Urban Pluvial Flooding Based on Open-Access Data

Department of Hydrosciences, Institute for Urban Water Management, TU Dresden, 01069 Dresden, Germany
*
Author to whom correspondence should be addressed.
Water 2023, 15(1), 46; https://doi.org/10.3390/w15010046
Submission received: 6 December 2022
/
Revised: 19 December 2022
/
Accepted: 20 December 2022
/
Published: 23 December 2022
(This article belongs to the Special Issue Innovative Methods and Applications of Stormwater Management)
Abstract
:Identifying the location and estimating the magnitude of urban pluvial flooding events is essential to assess their impacts, particularly in areas where data are unavailable. The present work focused on developing and exemplifying a tool to evaluate urban pluvial flooding based on open-access information. The tool has three separate submodules: (1) sewer network generation and design; (2) hydrodynamic model development; (3) urban pluvial flood evaluation. Application of the first two modules in two catchments and comparison of these results with real data indicated that the tool was able to generate systems with realistic layouts and hydraulic properties. Hydrodynamic models derived from this data were able to simulate realistic flow dynamics. The third module was evaluated for one of the study cases. The results of this indicated that the current approach could be used to identify flood areas and associated flood depths during different rainfall scenarios. The outcomes of this study could be used in a wide variety of contexts. For example, it could provide information in areas with data scarcity or uncertainty or serve as a tool for prospective planning, design, and decision making.
1. Introduction
Urban drainage networks (UDNs) are gravity-driven anthropogenic systems designed for the safe collection and transport of sanitary wastewater (i.e., excess water from human activities) and stormwater runoff into specific outlets, e.g., wastewater treatment plants or nearby bodies of water. This can be performed following two different schemes [1]. On the one hand, in the separate sewer system scheme, stormwater is collected independently from sanitary wastewater, discharging the first one into nearby water bodies while transporting sewage into treatment facilities. On the other hand, in the combined sewer system scheme, sanitary wastewater and stormwater are mixed and transported in a single drainage network to a defined outlet [1]. UDNs provide then a vital service for urban environments, and understanding their functioning, processes, and dynamics is necessary for improving the system itself and the natural and urban environments.
UDNs are designed based on a predefined “satisfactory service level”, which represents the degree of protection against urban pluvial flooding events [1]. These types of incidents occur when the sewer network capacity is exceeded due to large amounts of stormwater runoff entering the system. This is mainly associated with rain events with intensity and/or duration considerably higher than the design storms used for the network’s dimensioning. In such types of floods, untreated wastewater is then released into the surface through overflowing manholes and gully pots, leading to different socio-economic and environmental impacts [2,3,4,5,6,7,8]. In this context, accurately identifying the location of overflowing manholes and estimating the magnitude of these events becomes essential to properly evaluate their impacts and to develop suitable mitigation strategies.
In this context, hydrodynamic models have proved to be useful tools for analyzing the complex and dynamic processes involved in urban drainage, serving as support for the management, evaluation, operation, and planning of UDNs. Their proper development and implementation require comprehensive information. First of all, data regarding the sewer spatial layout network’s geometric and pipe hydraulic characteristics are needed to properly represent the flow paths and flow dynamics in the system [1,9]. Furthermore, data regarding the contributing impervious and pervious areas and connected populations are needed to determine the quantity and spatial distribution of inflows into the system. Nevertheless, this type of data (i.e., network and inflows information) is not always available or accessible for a fraction of the entire sewer system, thus affecting the proper development and implementation of urban drainage models.
To overcome this, several approaches have focused on generating virtual UDNs with similar properties as real systems. In this context, several artificial sewer network generators have been developed. Initial approaches used space-filling “Tokunaga” fractal tree geometry [10] and stochastic branching processes [11] for the generation of drainage networks. These studies, however, did not consider spatial characteristics (e.g., topography, land use, or population density) and therefore created virtual networks with non-realistic layouts or hydraulic behaviors. In order to overcome this limitation, Ulrich et al. [12] proposed an agent-based approach for the generation of virtual sewer systems, considering surface properties such as elevation and land use maps, and population distribution. Nevertheless, this procedure was applied only for virtual cases, and applications with real data remain to be tested. Other approaches, such as Blumensaat et al. [13] and Döring and Neuweiler [14], have obtained realistic sewer layouts by assuming that urban drainage structure follows similar spatial patterns as the street networks. This is a valid assumption since the degree of colocation between roads and urban water infrastructures are high [15]. Furthermore, Duque et al. [16] developed a sewer network generator approach to represent key characteristics of a real system. In this approach, surface features (e.g., topography and land use) and population distribution data are used to derive a simplified UDN layout. Regarding hydraulic dimensioning, most of the previously mentioned studies follow standard design procedures. Blumensaat et al. [13] use an approach based on the ‘Modified Rational Method’ proposed by Butler and Davies [17] and modified by Maurer et al. [18]. Urich et al. [12] use the time-area method [2] to design circular pipes [17]. Möderl et al. [11] use a simplified approach to derive pipe diameter based on stormwater runoff inflow to each pipe and an assumed flow velocity. Furthermore, Duque et al. [16] compared two design methods in their approach, the sewer network design algorithm [19] and the pipe-by-pipe method. Results suggested that the second method yielded better and more robust results.
Although these approaches to generating and designing virtual UDNs proved suitable for questions related to asset management, exploratory modeling, system-scale hydraulic performance, and strategic planning, they are not adequate for analyzing local processes, such as urban pluvial flooding events. Model efficiency in this regard depends heavily on the algorithms used for the layout and design of the sewer system. An unrealistic or simplified layout might lead to an inadequate identification of the flooding node location and magnitude [20,21,22], thus leading to an incorrect estimation of the flood extension and impacts. Moreover, an improper network design will not reflect the real hydrodynamic properties and dynamics of the UDN [21], thus leading to wrong estimations of flooded volumes.
In this context, the main aim of the present work is the development of a tool to evaluate urban pluvial flooding in a more accurate way based on open-access information. The efficiency of the tool is determined by its capacity to automatically generate and design realistic sewer networks, from which more accurate hydrodynamic models can be developed, thus improving their performance and fidelity. Hydrodynamic models are implemented in the Environmental Protection Agency Stormwater Management Model (EPA SWMM) [9] and coupled with a diffusive overland flow model ach to generate flood maps. Furthermore, the usage of open-access data allows the application of the tool in a wide variety of contexts: providing information in areas with data scarcity or uncertainty or as a tool for prospective planning, design, and decision making. The capacity of the tool to generate UDNs with realistic sewer layouts, hydraulics characteristics, and flow behavior is assessed by comparing the tool results for two small catchments in Dresden, Germany, with real sewer network data.
2. Materials and Methods
2.1. Urban Pluvial Flooding Evaluation Tool
The present approach focuses on developing a spatial tool that allows the assessment of urban pluvial flooding events, particularly in areas where sewer network data are either unavailable or non-existing. In order to do so, three separate submodules are created: (1) sewer network generation and design; (2) hydrodynamic model development; (3) urban pluvial flood evaluation. Further details on each of these submodules are provided in the following sections. Each submodule is independent of the other in order to provide more flexibility to the user. In other words, each submodule can be used separately depending on the data the user has and on his/her/their needs. For example, if the sewer network data are already available and the goal is only to create a hydrodynamic model, then only the second submodule can be used. Nevertheless, in the present work, all submodules are used and exemplified.
For the spatial approach, the tool requires input data in a shapefile or raster format. For all submodules, data regarding street networks, buildings, study area boundaries, desired outlet, population density, and a digital elevation model (DEM) are required. All this information can be obtained freely from open sources. For example, street network and building data can be gathered from the OpenStreetMaps geodatabases [23], while population density information and DEMs can be obtained either from local authorities or online databases, for example (REFS). Moreover, both the study area boundaries and the desired outlet are user-defined. In other words, the user needs to create the corresponding shapefiles for these elements based on the needed requirements and prior knowledge of the area. The proposed tool is developed under the Python environment of the geographic information system (GIS) software QGIS 3.16.8 [24].
2.1.1. Sewer Network Generation and Design
The main processes in this module are:
- Pre-processing of input data.
Before the application of the tool, the user needs to obtain and format the required input data. The study area boundaries and the location of the desired outlet need to be defined by the user, based on their previous knowledge about the area or specific requirements, for example, the area of new development and its connection with an existing UDN. Furthermore, all spatial data should have the same geographical and projected coordinate systems.
- II.
- Definition of sewer network layout.
As a first step, a realistic spatial arrangement of the sewer network needs to be defined. In other words, it is necessary to determine a sewer layout that matches the spatial characteristics and patterns of the area to be analyzed. To do so, it is assumed that the layout of the sewer system is the same as the street network. This is based on the high degree of colocation between roads and urban water infrastructures [15]. The sewer network layout in the area is then defined based on all the streets within the study area boundaries that are connected to the outlet. Junctions in the system are defined as the point where streets start or intersect each other.
- III.
- Simplification of the network and correction of flow direction.
Traditionally, optimal UDN layouts correspond to the ones with the least amount of pipes connecting any point of the catchment to the outlet. Therefore, according to the user-defined outlet and the topography of the area, a network layout with the minimum amount of pipes connecting any point to the outlet is identified. This layout corresponds to the minimum spanning tree (MST) configuration and is determined using Kruskal’s algorithm [25]. Furthermore, the location of each node with regard to the DEM is determined in order to estimate an initial node height. Node invert elevations are then calculated as the difference between the initial elevation of each junction and an assumed node depth. A value of 2 m is set as the default for this node depth. A further evaluation and correction of these elevations are performed in order to ensure a gravitational flow to the network outlet.
- IV.
- Determination of contributing areas.
Buildings and streets are defined as the only contributing areas and are connected to the nearest pipe node. Only buildings and streets within a user-defined distance threshold are connected to the system. As a default, a value of 100 m is used for this threshold. This is performed based on the assumption that local connections cannot have a length higher than 100 m. This threshold corresponds to the assumed maximum length of local connections.
- V.
- Allocation and estimation of dry weather inflows.
The user can select the option to design a separate or combined system. If the latter is chosen, population density data are used to identify the spatial distribution and quantities of dry weather inflows. The amount of people connected to a sewer node corresponds to the sum of people within a predefined radius around each junction. Domestic flow discharge quantities are calculated by multiplying the number of people connected to each node by a user-defined daily per capita water consumption. This value is set as 100 L/cap × day by default. Furthermore, extraneous water is calculated as a function of domestic flows. It is assumed to be equivalent to 10% of the domestic flow. However, these values can be modified by the user depending on the local conditions. Dry weather inflows correspond then to the sum of domestic and extraneous flows.
- VI.
- Hydraulic dimensioning.
Pipe design is performed following the guidelines established by the German Association for Water, Wastewater, and Waste’s worksheets DWA-A 110 and DWA-A 118 [26]. The UDN is designed using the rational method and a synthetic design storm. The return period and duration of this event are user-defined. Using the rational method, pipes are dimensioned, starting with the most upstream sections. The diameters of each conduit are determined based on an iterative process. Different commercial diameters are tested until all conditions according to the DWA are fulfilled [26].
2.1.2. Urban Drainage Model Implementation
Hydrodynamic models of the generated networks are implemented in the EPA Storm Water Management Model (EPA SWMM) software [9]. Information regarding the sewer network structure, connectivity, type of profile, and diameters are implemented based on the results of the previous module. Furthermore, the length and slope of each pipe section are calculated in QGIS. Conduit parameters such as offsets or initial flow are set to 0, while pipe roughness is assumed as 0.015, a typical value for concrete pipes [9].
Buildings and streets are defined as subcatchments in EPA SWMM. Surface parameters such as area, imperviousness, slope, width, and outlet are determined and/or calculated based on the shapefile data and results obtained in the previous module. Other EPA SWMM surface parameters, e.g., roughness and depression storage, are determined using the recommended values in the EPA SWMM manual.
Distribution and magnitude of dry weather inflows along the network are determined based on the results of the first module. Furthermore, the user needs to define an hourly pattern. It is recommended to derive these from observed values in the area or to use reference values.
2.1.3. Flood Propagation
Hydrodynamic models implemented in EPA SWMM are used to determine the location and magnitude of flooding nodes during a rain event. Such results are used then as input for a diffusive overland flow model. This approach, developed by Chen et al. [27], replicates in a simplified manner the surface water flow and estimates the surface inundation extension and depths. In this model, the study area is arranged as a grid with uniform square cells. Each individual cell acts as a storage unit. Cells on top of flooding junctions become source cells, where the flooding volume of the node is initially stored. The algorithm then allocates the flooding water of each source cell into its adjacent cells when topography allows, i.e., only if the height of the source cell is higher than the nearby ones, thus resembling gravitational surface flow. An initial flood depth is then calculated based on the number of cells with water and the initial flood volume. If this depth is higher than a given threshold or storage capacity, the new cells filled with water act as new source cells, and the process continues iteratively until a depth threshold is reached. As a result, a raster file with the extent of the flooded area and the flood depth associated with each flooded node is generated. This approach is implemented as a Python script for QGIS and developed for event-based simulations.
2.2. Study Cases
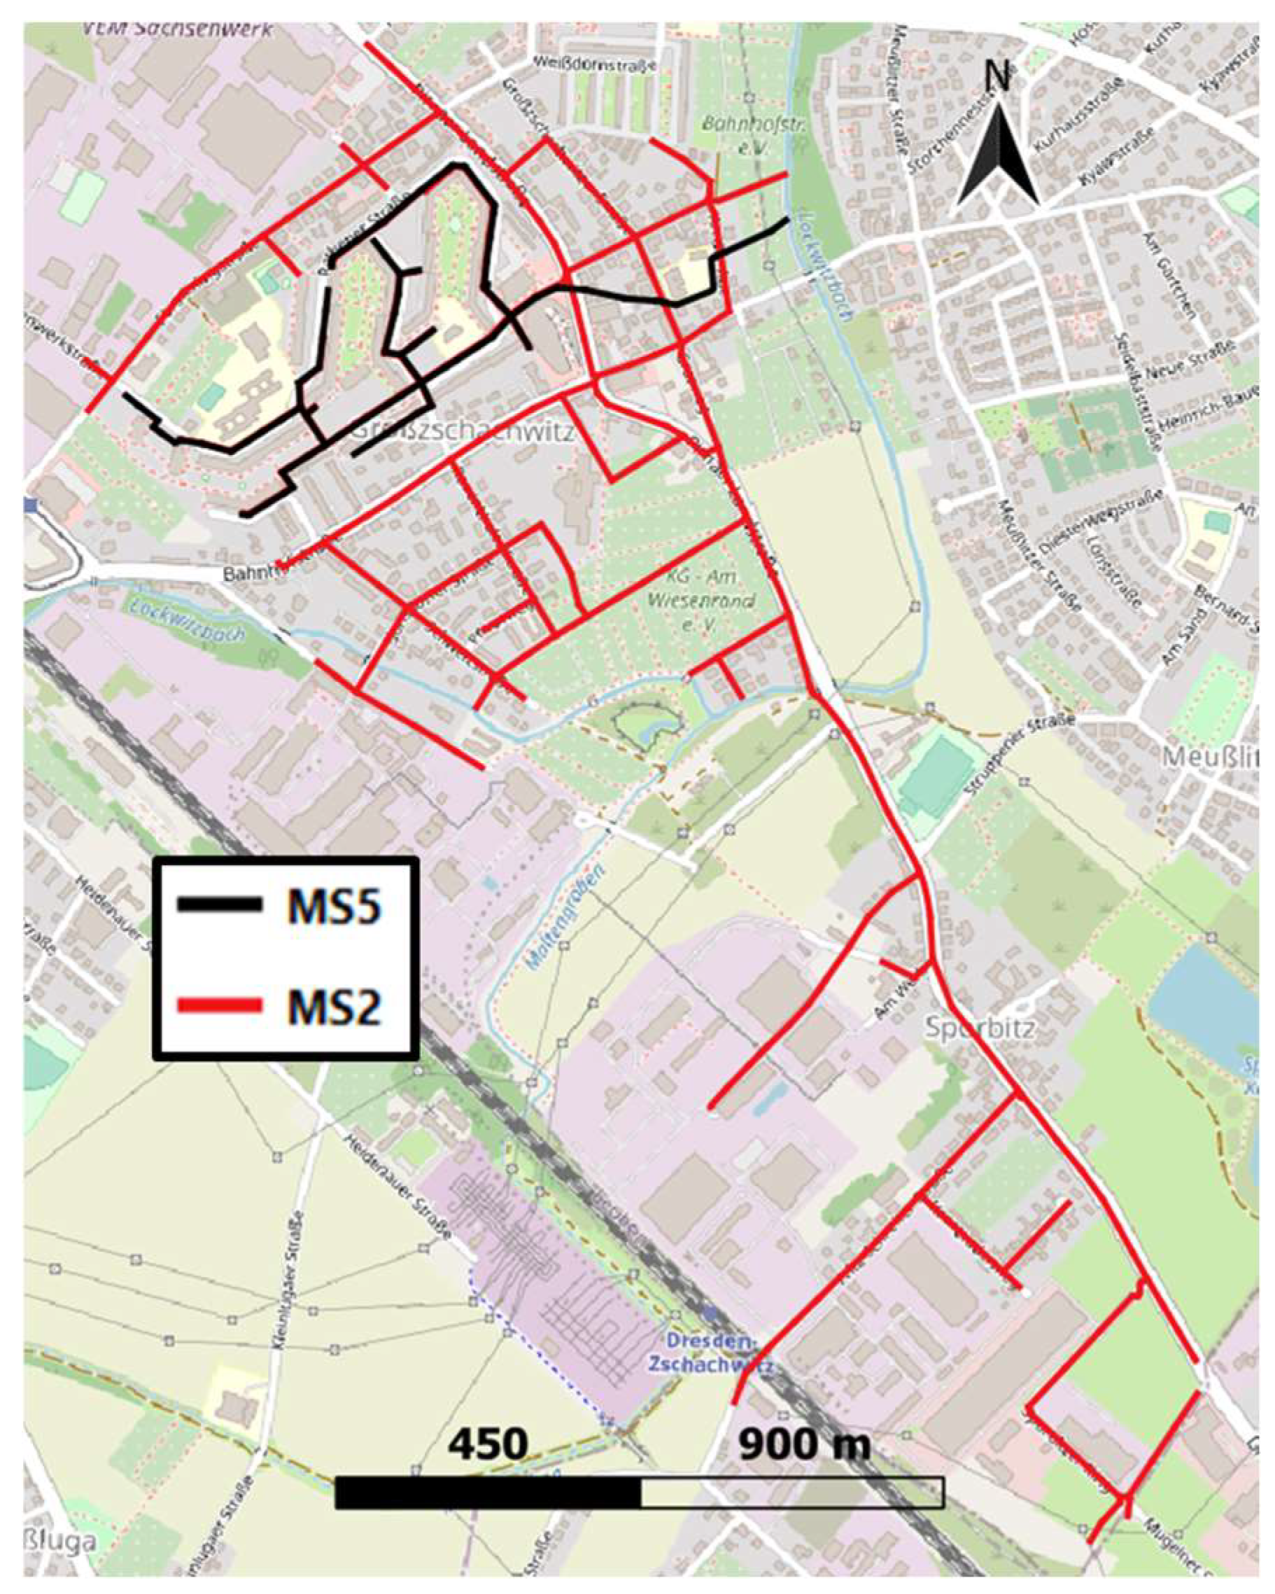
In order to test the approach, the tool is applied for the generation and design of two subnetworks of the Dresden drainage system. One of these is a combined sewer system, referred to here as MS2 and the other is a separate sewer system, labeled here as MS5 (see Figure 1). These areas are selected due to the fact that real sewer system data are available, i.e., information regarding the real sewer layout, pipe hydraulic characteristics, and measured flows are available. Results from the proposed approach can then be compared with the data of the real UDNs in order to assess their validity. Specifically, the performance of the tool is evaluated based on its capacity to: (1) generate a sewer network with a similar layout as the existing system; (2) design a network with a similar pipe diameter distribution, i.e., similar hydraulic properties; and (3) properly represent stormwater and wastewater flow dynamics and volumes.
The necessary input spatial data for these study cases are obtained from different sources. Shapefiles of streets and buildings are obtained from the OpenStreetMap (REF) database, and a 100 by 100 m population density raster of the areas is obtained from the last census in Germany [28]. Furthermore, a 2 by 2 m digital surface model (DSM) is obtained from the state service for geoinformation and geodesy Saxony (Staatsbetrieb Geobasisinformation und Vermessung Sachsen (GeoSN)) [29].
Catchment boundaries and outlet location are defined based on previous knowledge of the area. Furthermore, a design storm with return period of two years is used for the initial design. This value corresponds to the reference return period for the design of pipes in residential areas according to local guidelines [26]. Observed data are used to derive hourly variations and contributions of groundwater to the dry weather flow.
3. Results
This section is divided into two parts. In the first place, the capacity of the tool to generate a realistic sewer system is evaluated. For this, three main criteria are considered: (1) the capacity of the tool to create sewer networks with realistic layouts (i.e., a realistic physical arrangement of the pipes); (2) the efficiency of the approach to generate systems with realistic hydraulic properties, mainly focused on generating a realistic distribution of pipe diameters; and (3) the capacity of the artificial systems to properly represent hydrological and hydraulic processes in the area, i.e., generating accurate hydrodynamic models. These criteria are evaluated by comparing the results obtained from the first two submodules of the tool (see Section 2.1.1 and Section 2.1.2) in the two selected study areas. Results of the current approach are compared with real structural and hydraulic data to assess their validity
Furthermore, the second part of this section corresponds to the full application of the proposed approach for one of the two study areas. In other words, the three submodules are applied to evaluate urban pluvial flooding events in the MS2 study case. This area is selected since it corresponds to a larger catchment, thus allowing to analyze different spatial patterns in flood behavior. Examples of potential results and insights regarding the occurrence, magnitude and extension of flood events that can be derived from the application of the proposed tool are presented.
3.1. Evaluation of the Tool’s Capacity to Generate Realistic Sewer Networks
3.1.1. Layout
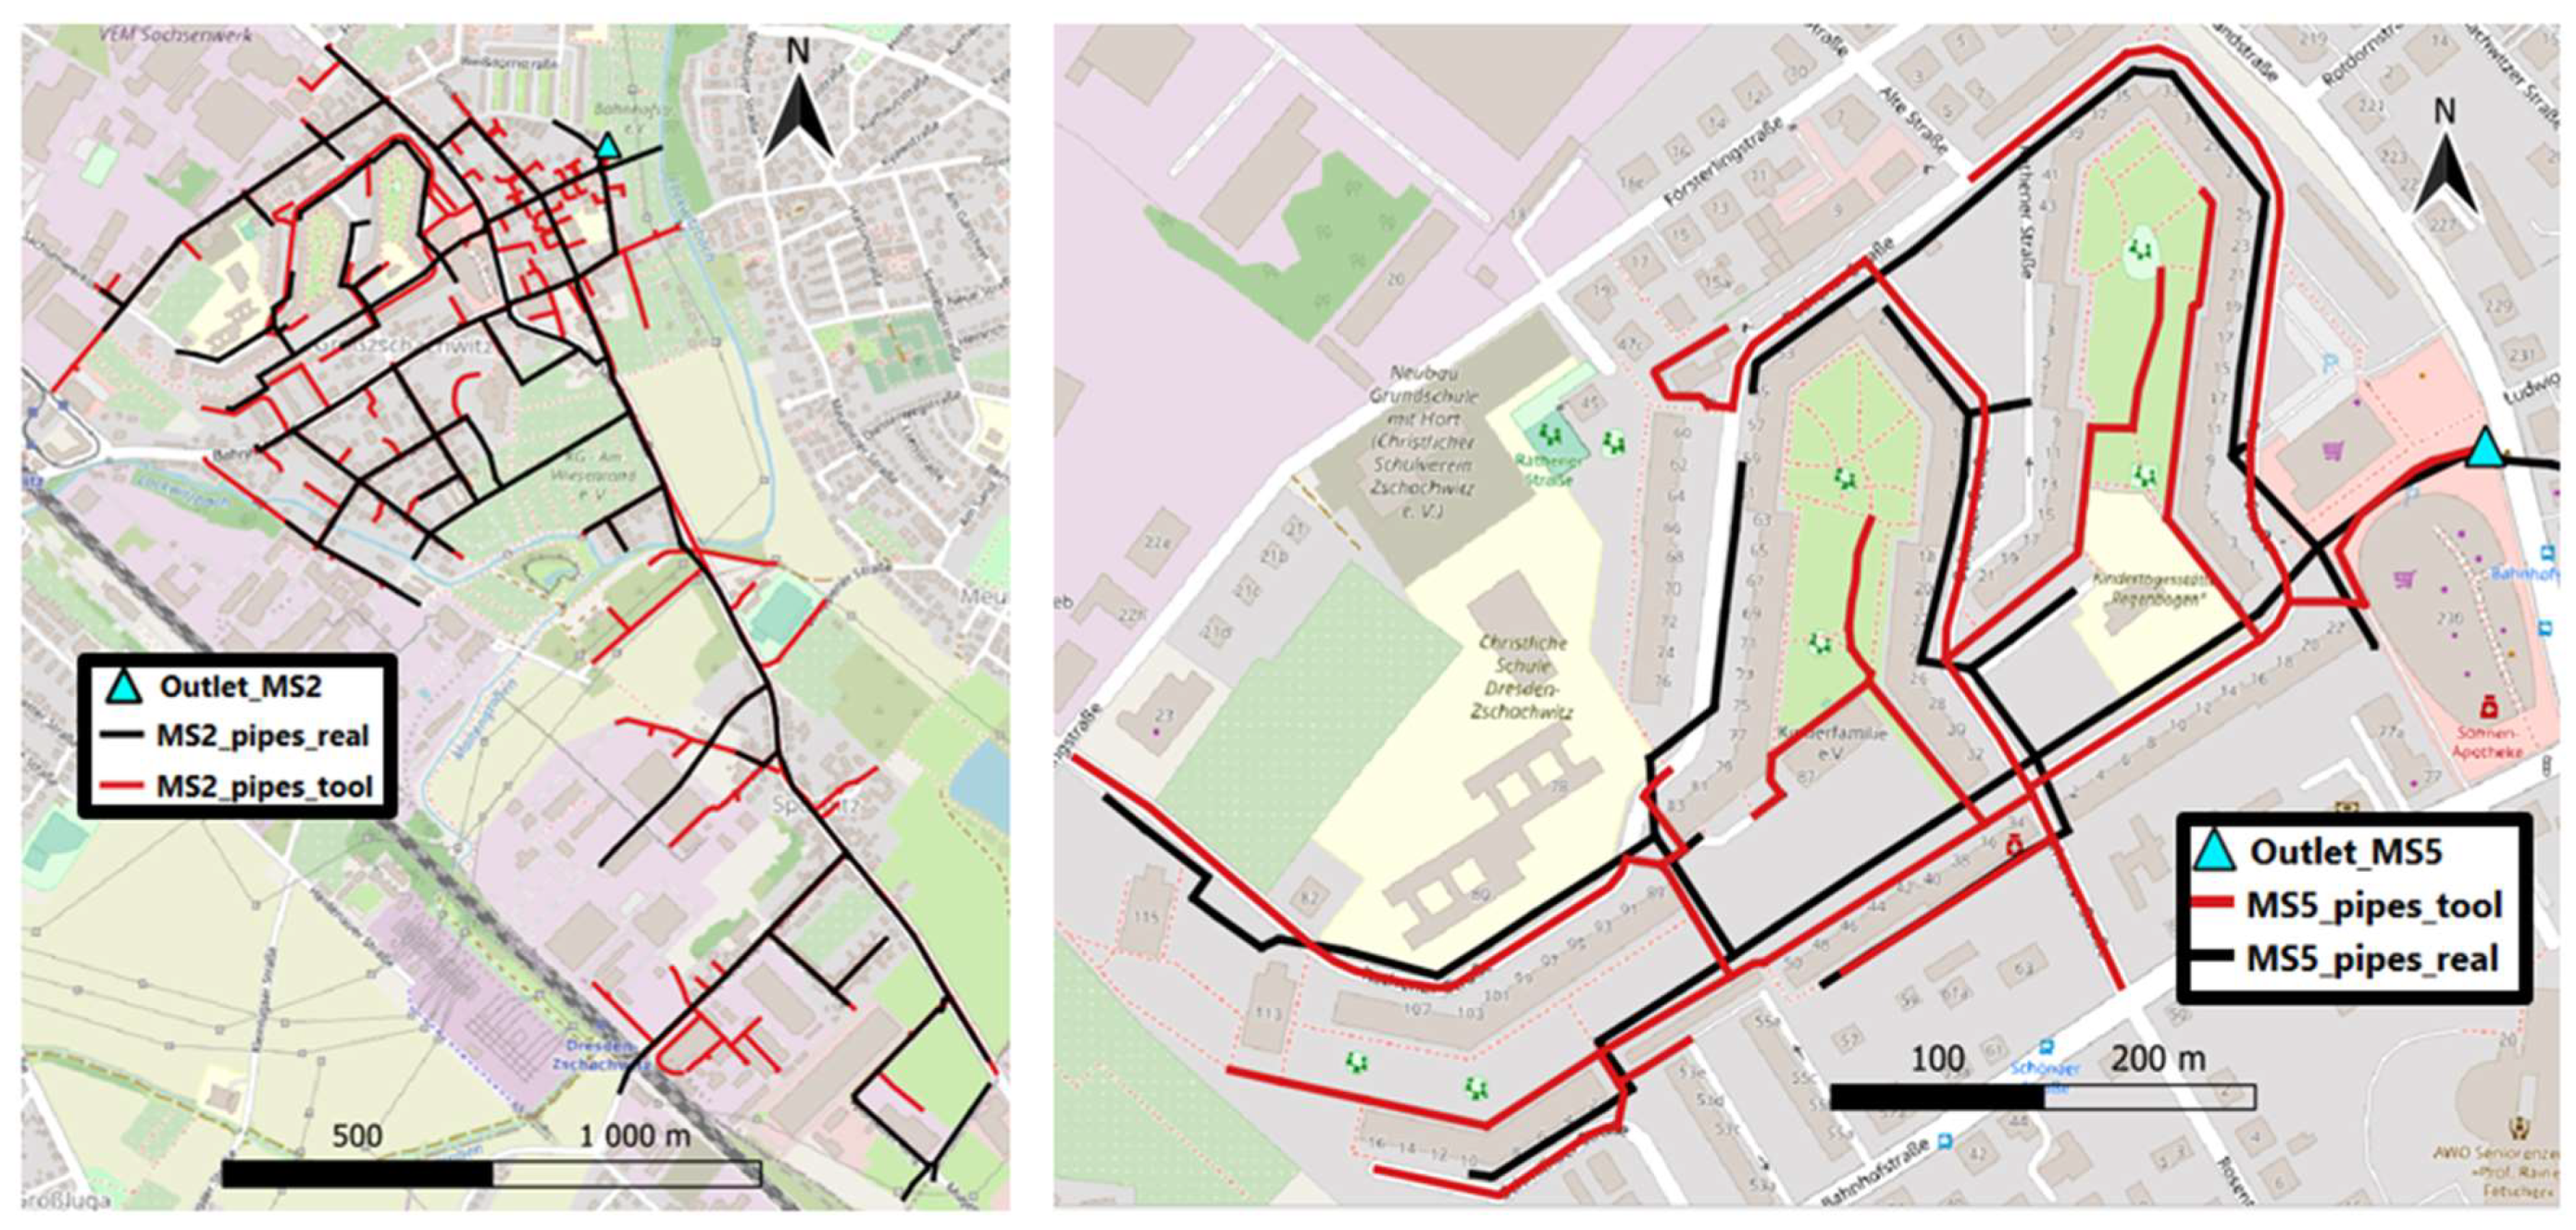
The proposed tool is able to generate sewer networks with a realistic layout. As can be seen in Figure 2, the spatial arrangement of the generated systems is consistent with the real sewer network. In the combined system MS2, approximately 234 out of 297 of all the real pipes overlap with the pipes generated by the proposed approach (see left panel of Figure 2). In other words, the generated sewer network system is able to represent approximately 80% of the real sewer layout. Regarding MS5, results suggest that the tool is able to generate a network with around 88% of the original layout, i.e., 70 out of 79 of all the real pipes either overlap or were within a 5 m distance of the generated pipes (see right panel of Figure 2).
The differences between the real and generated systems can be related to the fact that the tool generates a layout with the minimum amount of pipes connecting all the nodes without causing any disconnection. In other words, it generates a network layout with a branched structure that represents the main drainage paths in the system. Additional pipes that might be present in the real network and therefore additional flow paths are not considered. Further improvements regarding the analysis of an optimal layout need to be evaluated. Such improvements can be carried out, for example, by making a prior selection of the streets that will be used as input for the tool. This can be achieved based on previous knowledge and information about the area. If there are areas where pipes should not or cannot be constructed, then streets or paths passing through these areas should not be considered. In this way, a more accurate layout could be obtained.
3.1.2. Hydraulic Properties
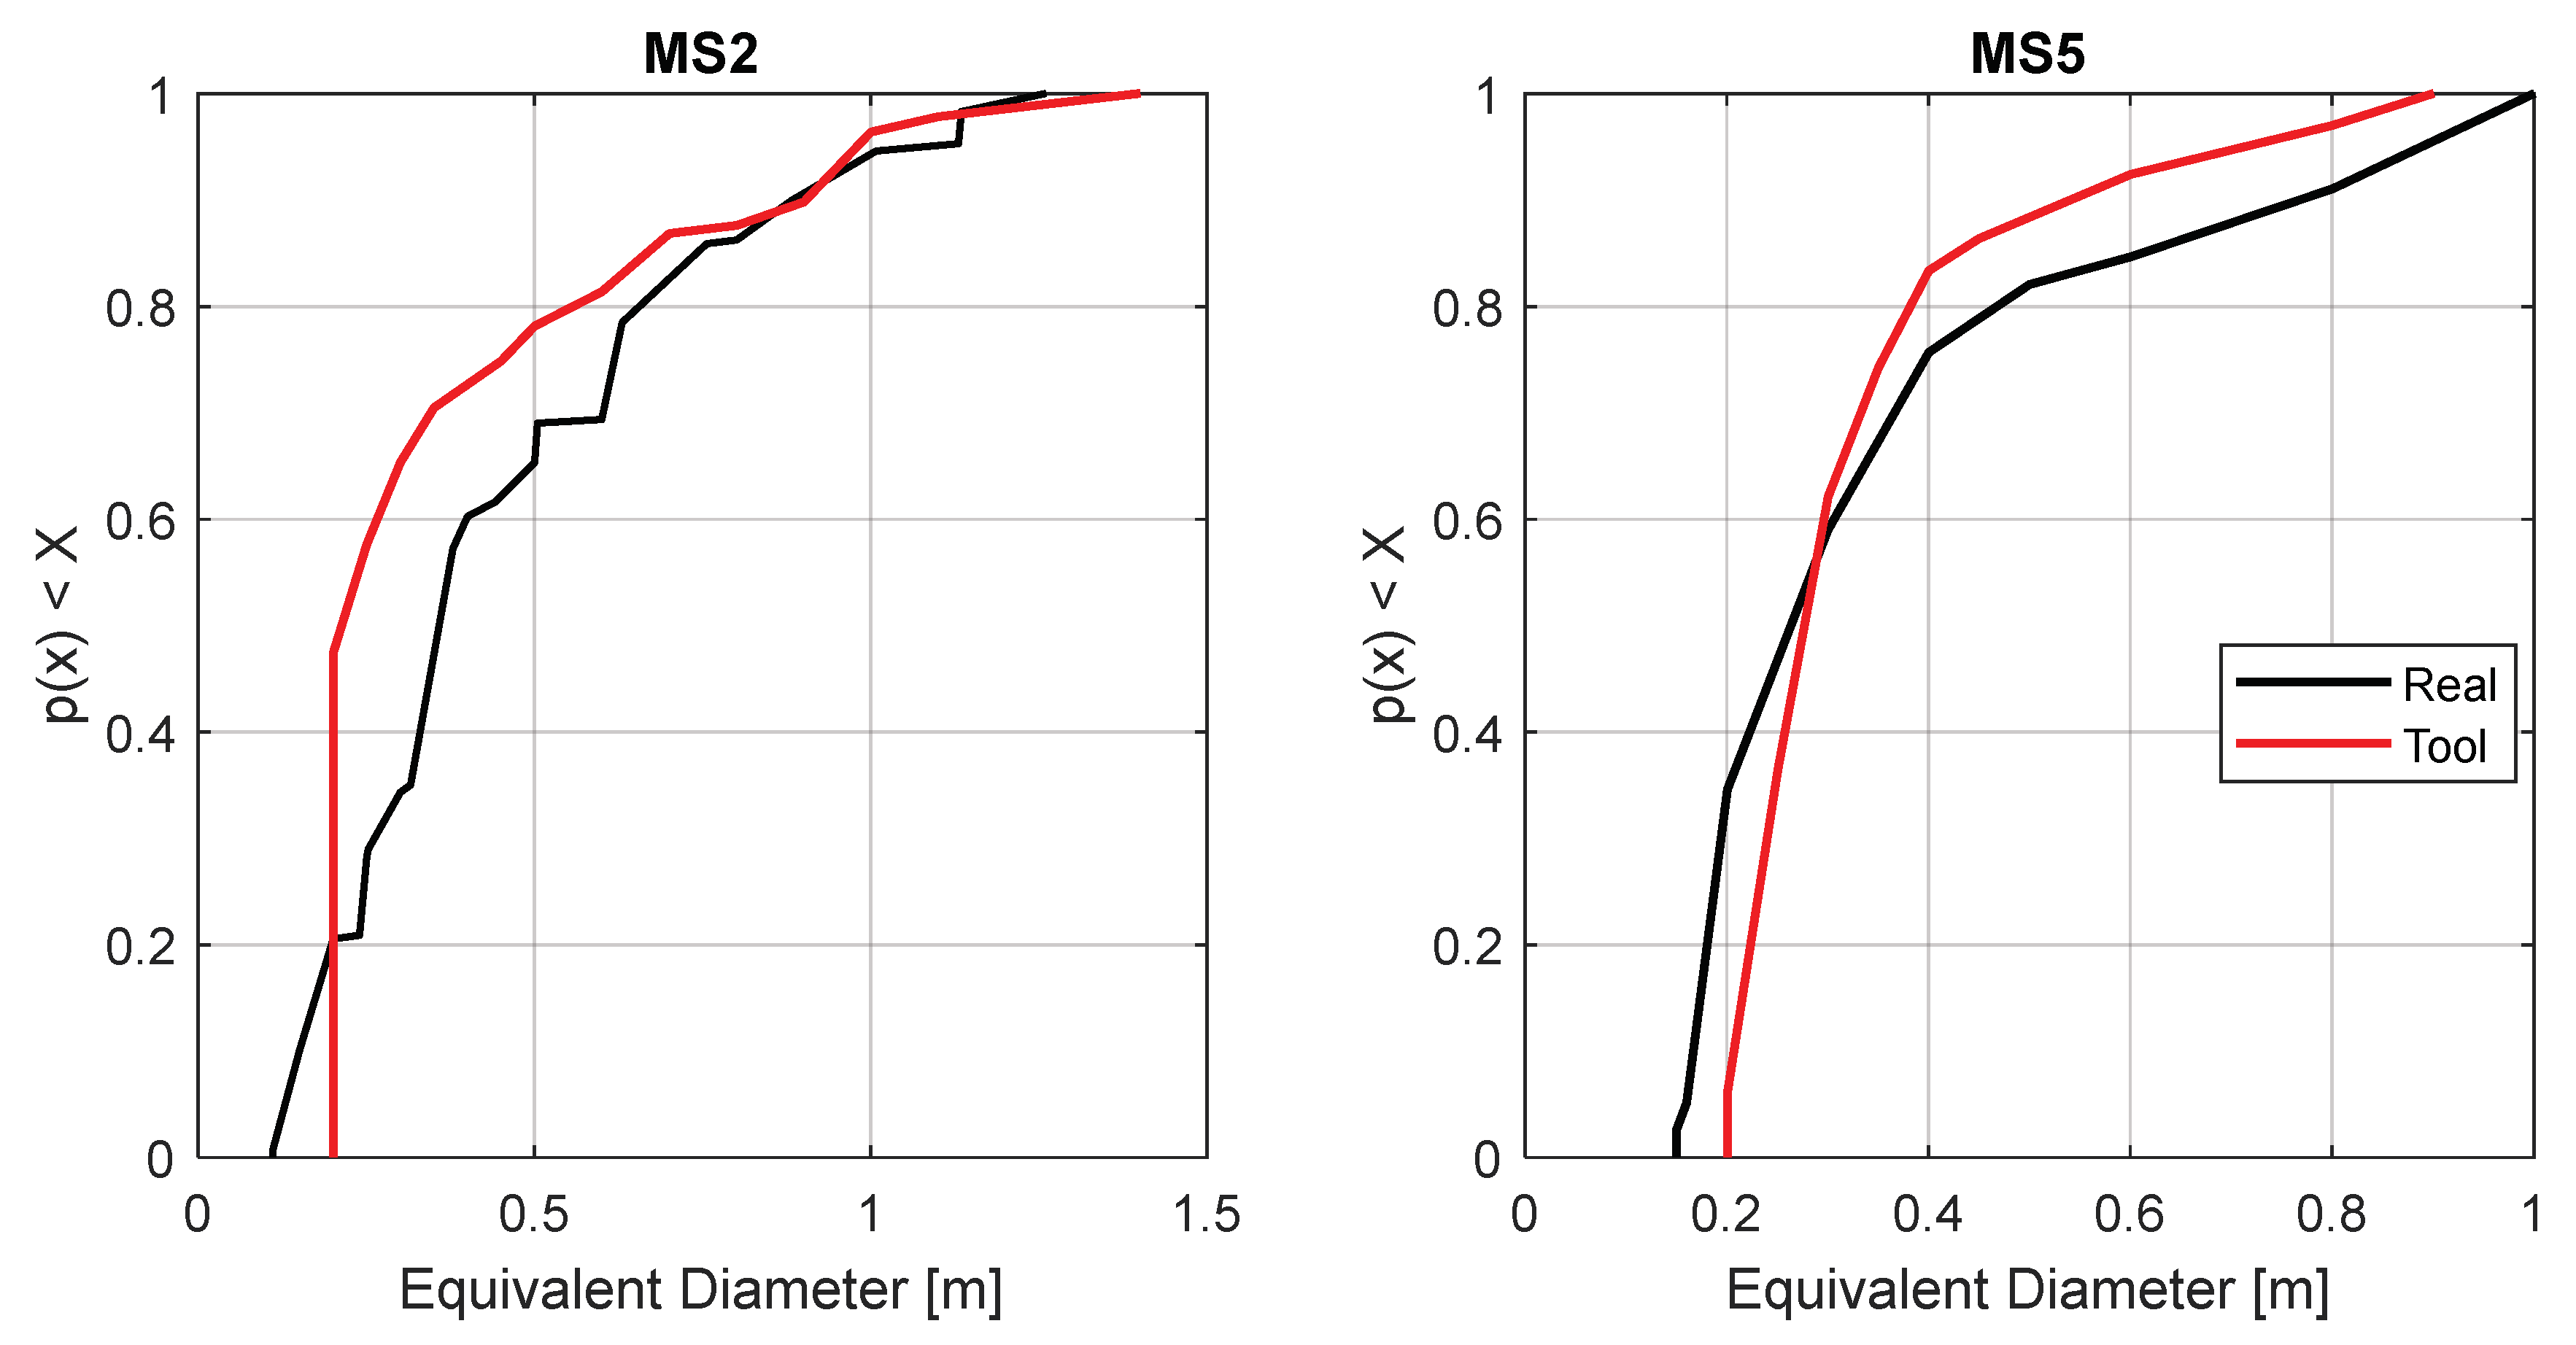
Results obtained suggest that the proposed tool is also able to generate systems with hydraulic properties similar to the real ones. This can be seen by comparing the empirical cumulative distribution functions (ECDFs) of pipe diameters for the generated and the real sewer networks. Since several pipes of the real sewer systems include egg-shaped cross-sections, equivalent diameters are calculated to facilitate comparisons between the generated and real systems. The similarity of these two systems in each case study is evaluated based on a two-sample Kolmogorov–Smirnov test [30] with a 95% significance (α = 0.05.) As can be seen in Figure 3, results indicate that the ECDFs of pipe diameters for the generated and the real sewer networks are statistically similar and hence have similar hydraulic properties. This is represented by the low p-values obtained in each case, 2.70 × 10⁻¹⁶ for MS2 and 4.5 × 10⁻³ for MS5.
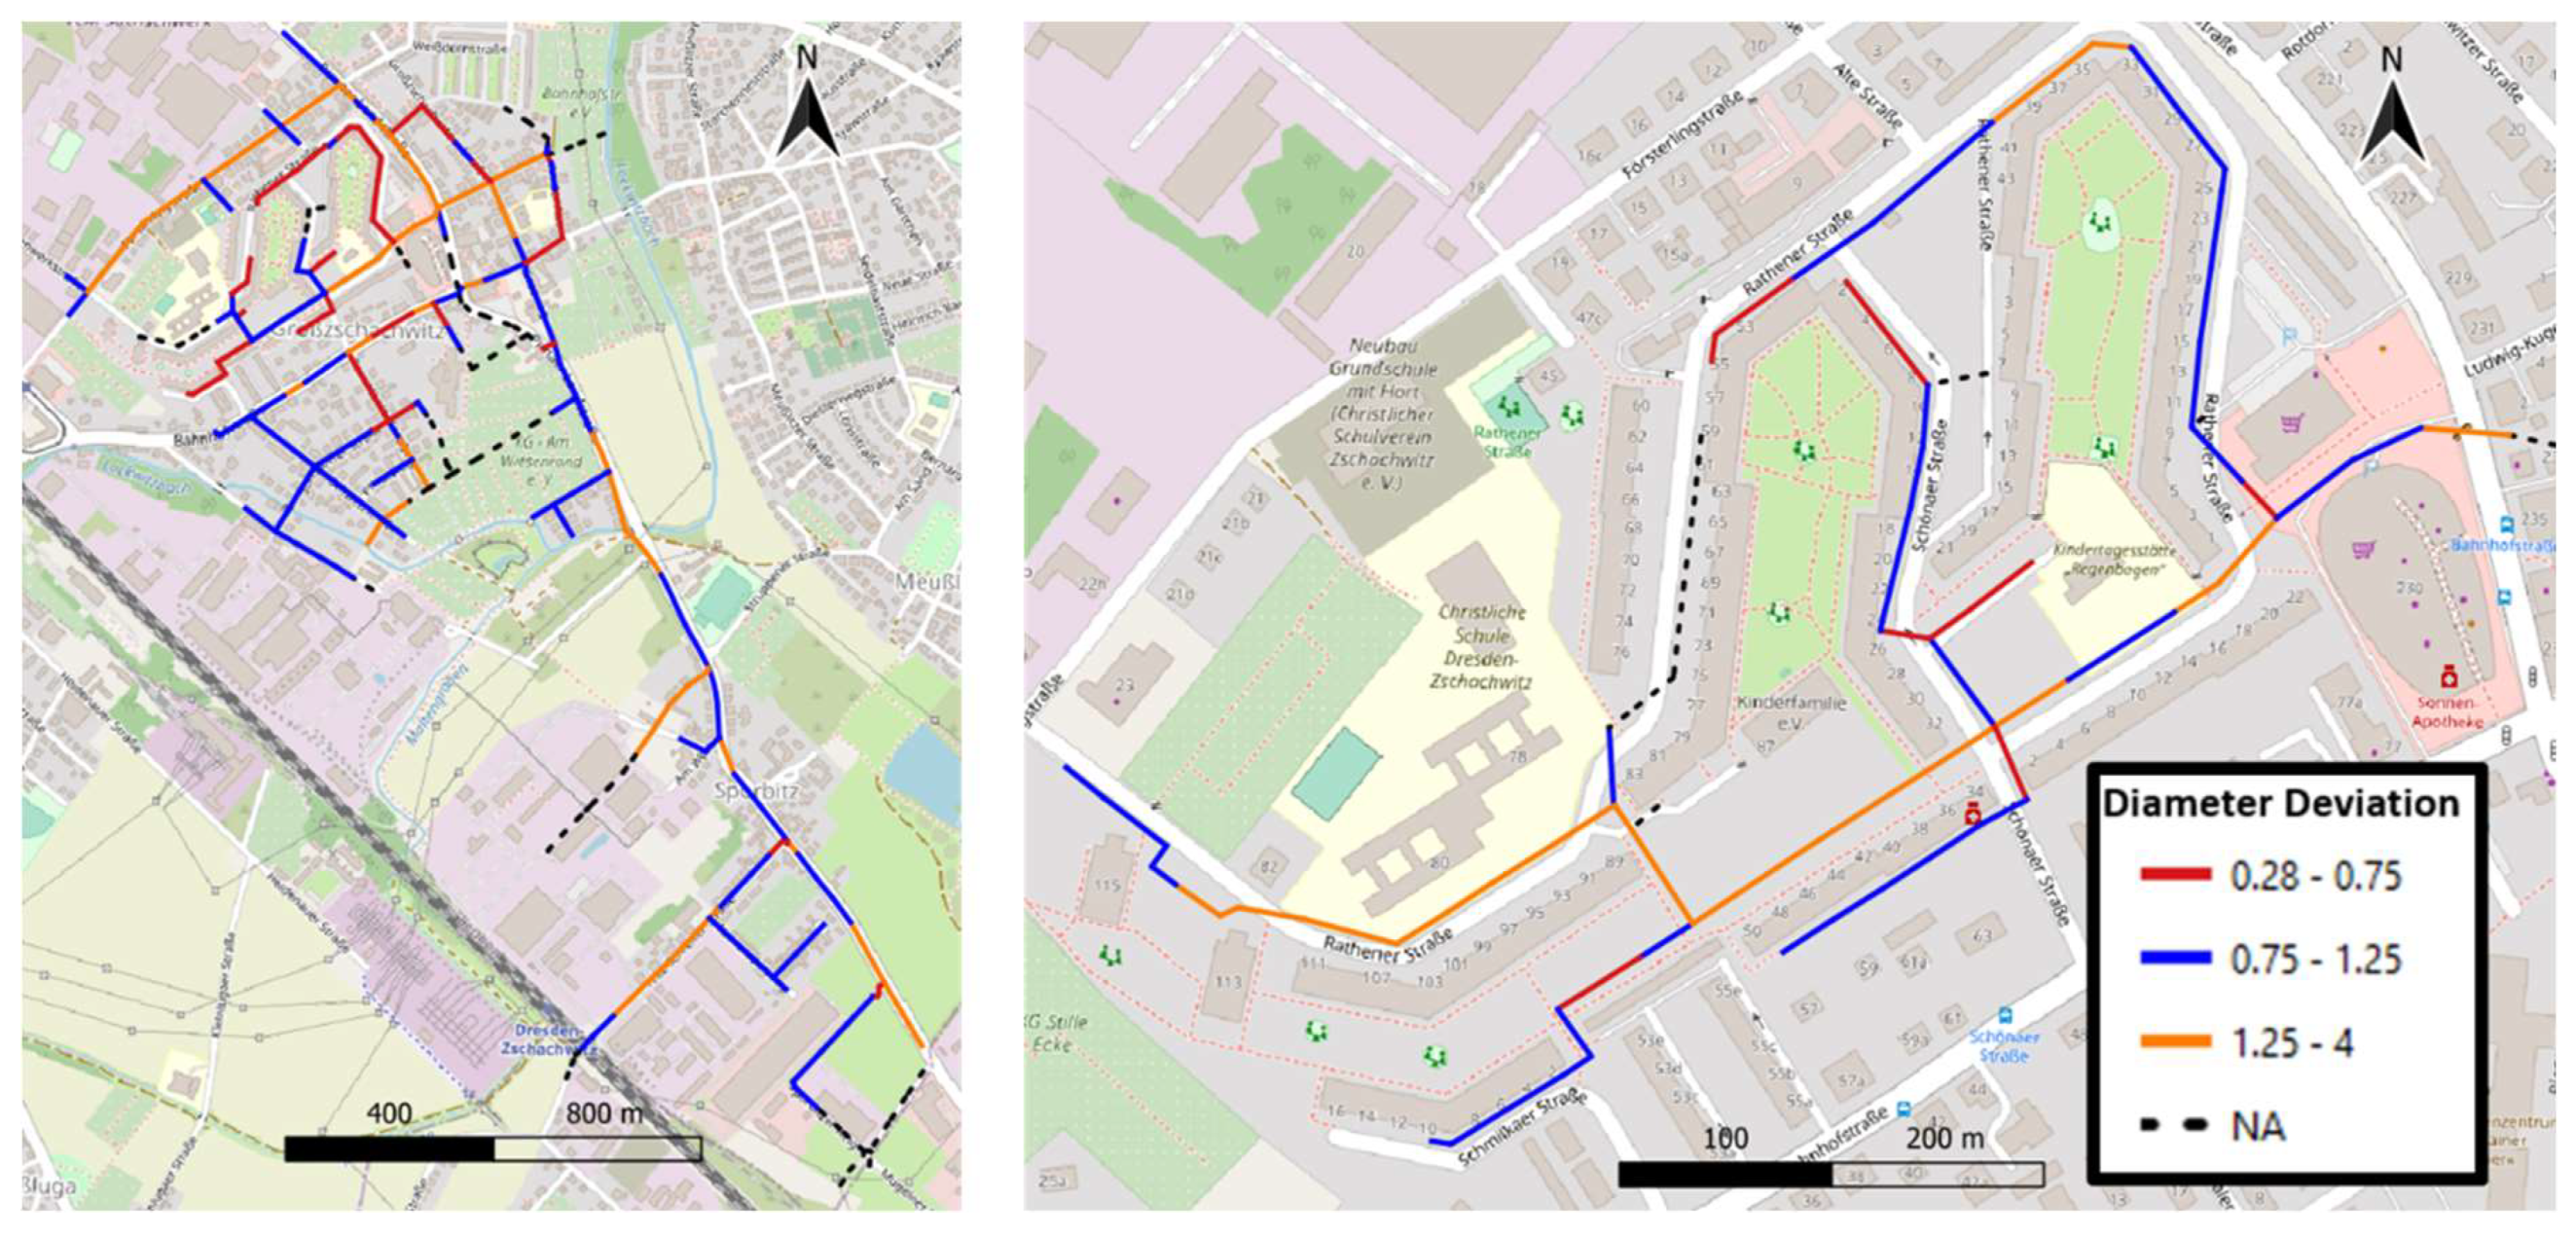
A spatial comparison between the real and simulated pipes is made to analyze the capacity of the tool to estimate correctly the location and equivalent diameters of conduits. This can be seen in Figure 4, which illustrates the ratio between the real and simulated equivalent diameters, referred to here as diameter deviation, for the co-located pipes in both study cases. A perfectly correct estimation corresponds to a diameter deviation value of 1. Nevertheless, a correct estimation is considered here to be any value between 0.75 and 1.25. Values below 0.75 represent an overestimation of real pipe diameters since the simulated values are higher than the real ones; hence, the ratios are low. On the contrary, values higher than 1.25 indicate an underestimation of pipe diameters. Results of this analysis indicate that in both study cases, the proposed tool is able to correctly identify the location and equivalent diameter of 47% of the original pipes. Furthermore, 24% of the pipes are underestimated in MS2, and 29% are overestimated. For MS5, 16% are underestimated, while 37% are overestimated. These results indicate that the current approach is able to correctly identify the location and equivalent diameter of almost half of the original network. Over and underestimations may be associated with the identification of flow paths derived from the layout generation process. Although the location of the pipes might be similar to in real conditions (see Section 3.1.1), drainage patterns might be different, thus affecting flow accumulation and, therefore, pipe dimensioning. Furthermore, the difference between real and simulated diameters may also be associated with the selected design storm for pipe dimensioning. Both study cases are residential areas, and therefore a 2-year return period event was selected for pipe dimensioning, following the local guidelines [24]. Nevertheless, it may be that a different value was used for the real system, thus leading to such differences. Further analyses about alternative layouts and impacts of different design storms need to be performed.
3.1.3. Hydrological and Hydraulic Processes
Based on the generated networks, EPA SWMM models of each study case are developed and used to assess the capacity of the artificial systems to properly represent flow dynamics. To do so, simulation results are compared to measured data. Rain events with a total precipitation height above 5 mm and at least 5 h of dry weather conditions before and after the event are selected. Observed discharge data with a 5 min resolution in each of the outlets are used as measured values. Furthermore, Nash–Sutcliffe efficiency (NSE) [31] and a modified version of the peak flow error (PFE) proposed by Kim et al. [32] are used as goodness-of-fit measures to assess the agreement between observed ad simulated flows. In this paper, PFE is calculated as:
where:
- -
- PFE is the peak flow error (-);
- -
- Max(obs) is the peak flow for observed values;
- -
- Max(sim) is the peak flow of simulated values.
It should be mentioned that the generated models are not calibrated. Values for the different model parameters are the ones used or calculated in the sewer network generation and design module.
Regarding MS5, measured discharge data at the outlet are available for 14 rain events, see Table 1. Results indicate that the generated network can simulate realistic flow dynamics. This can be seen by the fact that for nine events (i.e., for more than 60% of the cases), the NSE values are high, i.e., bigger than 0.7, thus indicating that the model is able to reproduce relatively accurately the real flow dynamics in the sewer system. With regard to the other events, NSE values ranged between 0.59 and 0.69, which can still be considered an adequate model efficiency. Furthermore, results regarding PFE values for the different events indicate that the model using the artificial network is able to properly reproduce flow peaks in half of the events, with PFE absolute values lower than 0.2. In the other cases, PFE values are not higher than 0.37, which can still be considered as an adequate model efficiency, i.e., lower than 0.4. Moreover, it is not possible to assess if the model consistently overestimates or underestimates flow peaks, as can be seen by the equal amount of positive and negative PFE values for all events.
In the case of MS2, measured discharge data at the outlet is available for nine rain events, see Table 2. As for the previous network, the comparison between observed and simulated data also indicates that the generated network can simulate realistic flow dynamics. In fact, two-thirds of the events report NSE values higher than 0.7, while in the other events, the model efficiency is not so adequate, with NSE values between 0.52 and 0.61. Furthermore, results indicate a clear tendency of the model to underestimate the flow peaks. In fact, for almost all events, PFE values are positive, thus indicating that the observed peak values are higher than the simulated ones. This indicates that the generated runoff volumes in the model are lower than in reality, thus suggesting that other runoff sources might exist, i.e., runoff from pervious areas or from other impervious surfaces, that are not being considered and might play an important role in terms of runoff contribution. This, however, needs to be further tested.
3.2. Urban Pluvial Flooding Evaluation
In order to exemplify the potential results and insights regarding the occurrence, magnitude and extension of flood events that can be derived from the application of the proposed tool, the present approach is applied to evaluate urban pluvial flooding events in the MS2 study case. This is achieved by applying the three submodules of the tool into the selected area (see Section 3.1). Previous sections describe the results from the first two submodules, i.e., the network generation and design and the subsequent EPA SWMM model development. These results are used and integrated within the third submodule of the current approach in order to determine the flood extension and flood water depths caused for a given heavy precipitation event.
Illustrations of the outcomes and the potential insights gained from the application of the tool are obtained based on four rainfall scenarios. They are ‘Euler Type II’ design storms [26], determined based on reference precipitation intensities for the city of Dresden, Germany. All the scenarios have a duration of two hours and return periods (RPs) of 5, 10, 20, and 50 years, respectively. Design storms are selected instead of real rain events in order to systematically analyze the behavior of the networks during such conditions.
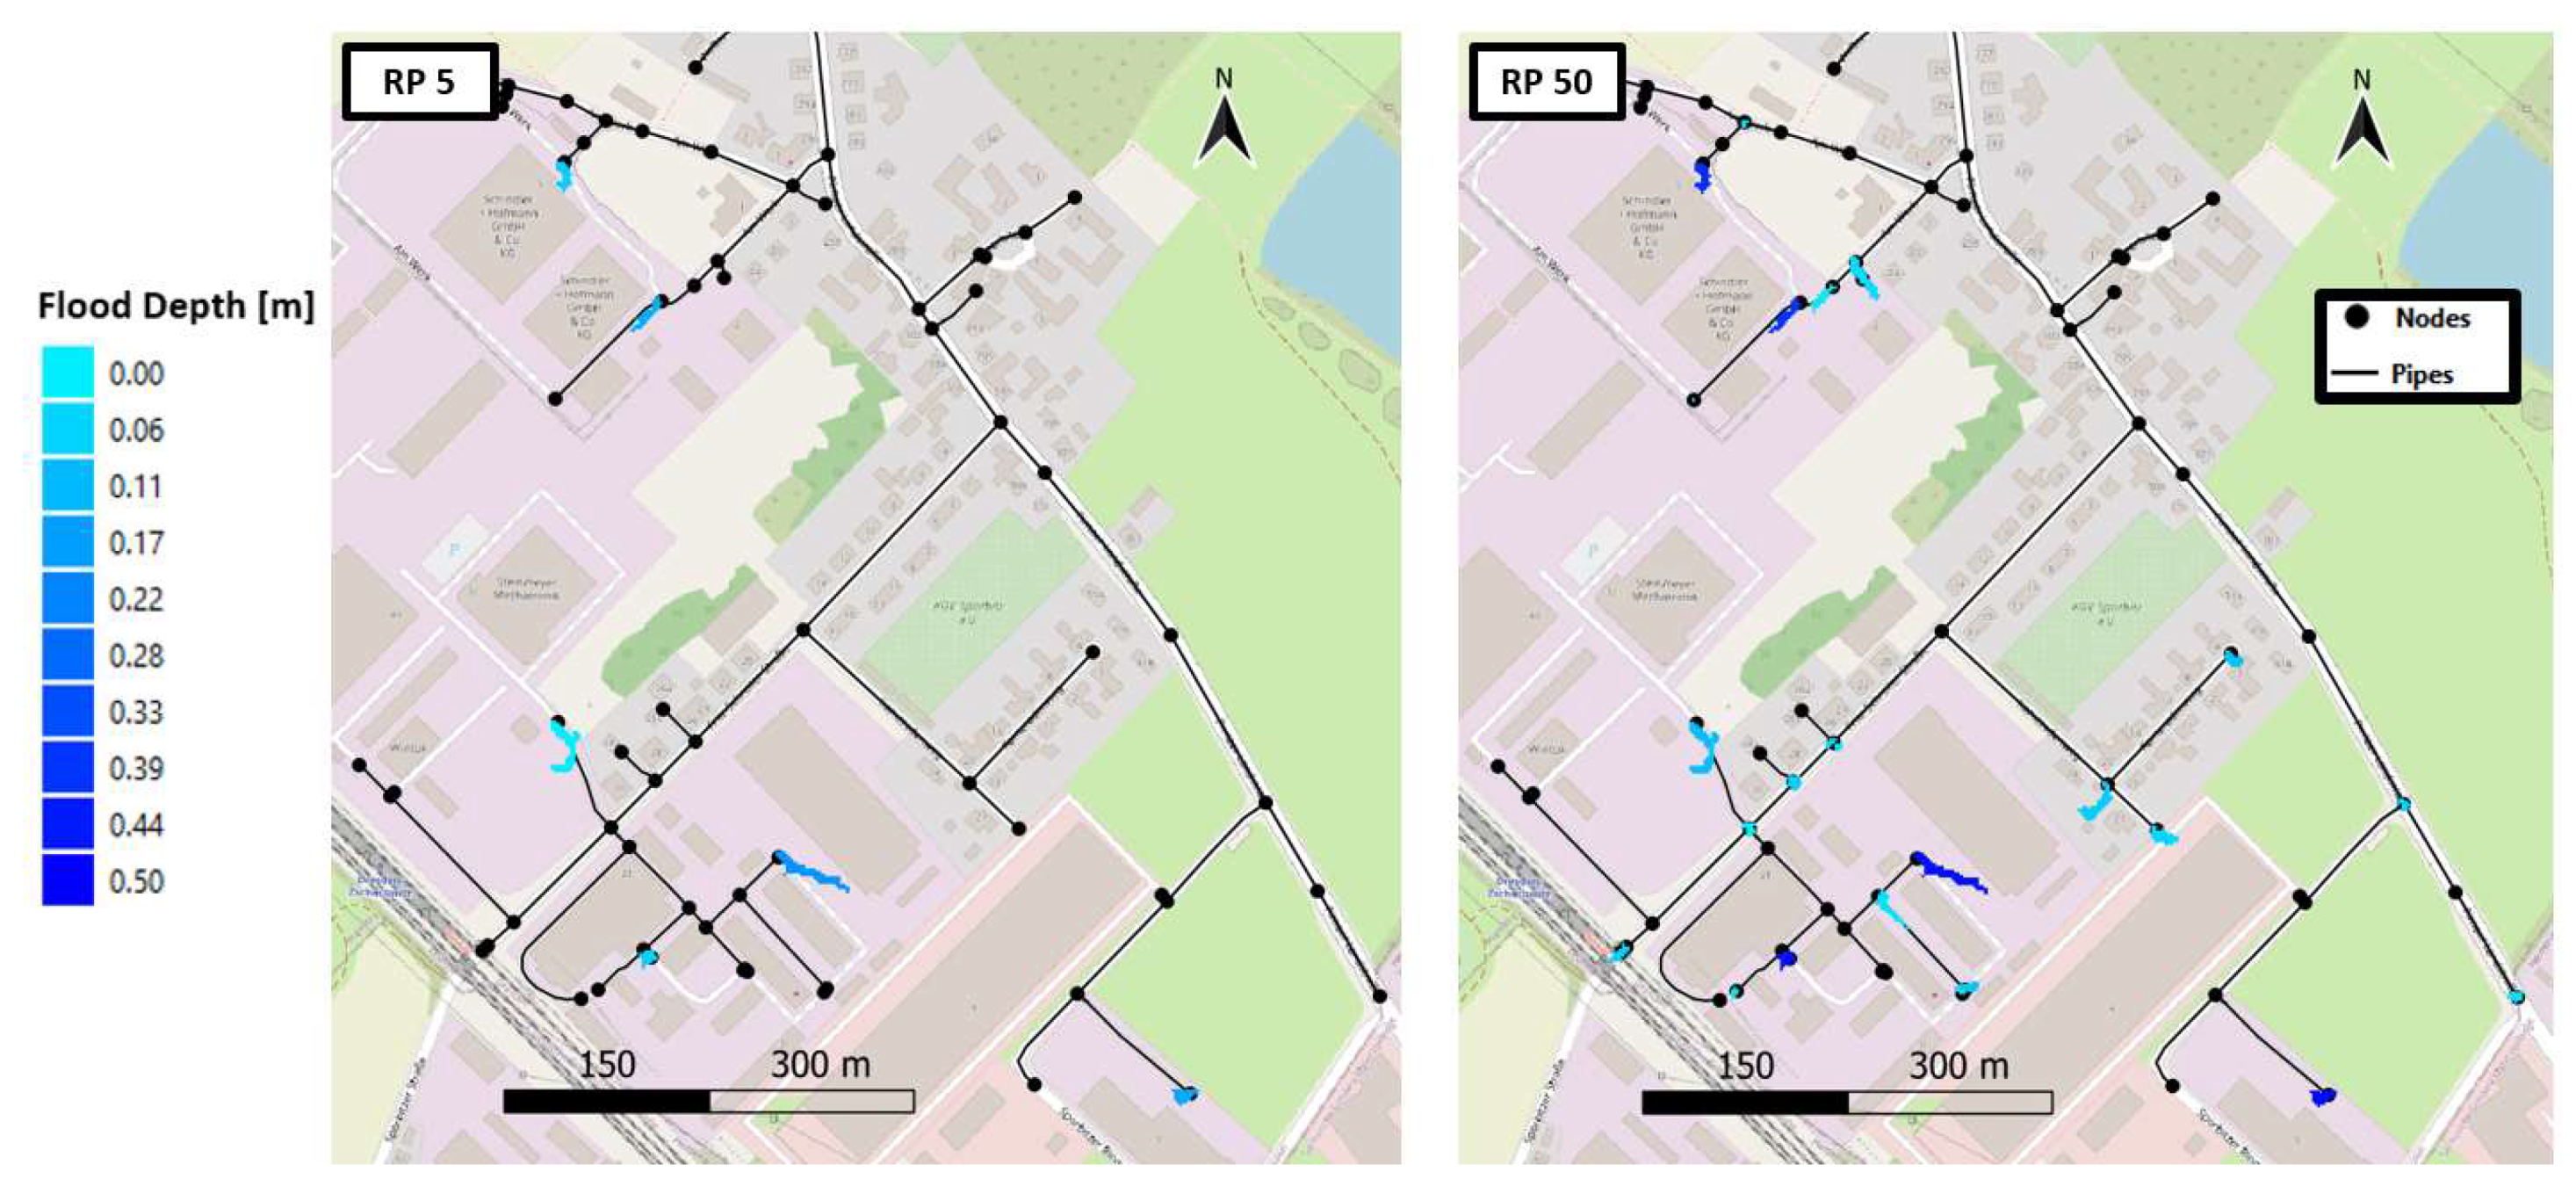
For a given heavy precipitation event, the proposed tool is able to generate high-resolution flood maps, depicting not only the location but also the extension and different water depths of the over flooding manholes. An example of this can be seen in Figure 5, which illustrates the flood maps obtained for the south region of the MS2 area using the 5 and 50-year return period synthetic rain events. As expected, the precipitation event with the higher intensity leads to a higher amount of flooded nodes and larger flooded areas. This can be seen by the increase on the amount of “blue” areas in the map on the right (results from the 50-year return period rain event), in comparison with the flood map on the left (results from the 5-year return period rain event). Furthermore, changes in flood depth as a function of the rain event can also be seen. Higher rain intensity leads to higher flood volumes. In some cases, topography does not allow the further diffusion of flooded water, i.e., the flooded area remains constant, thus leading to an increase in flooded depths. This can be seen by the increment of darker areas (higher flood depth) in the flood map associated with the 50-year return period event.
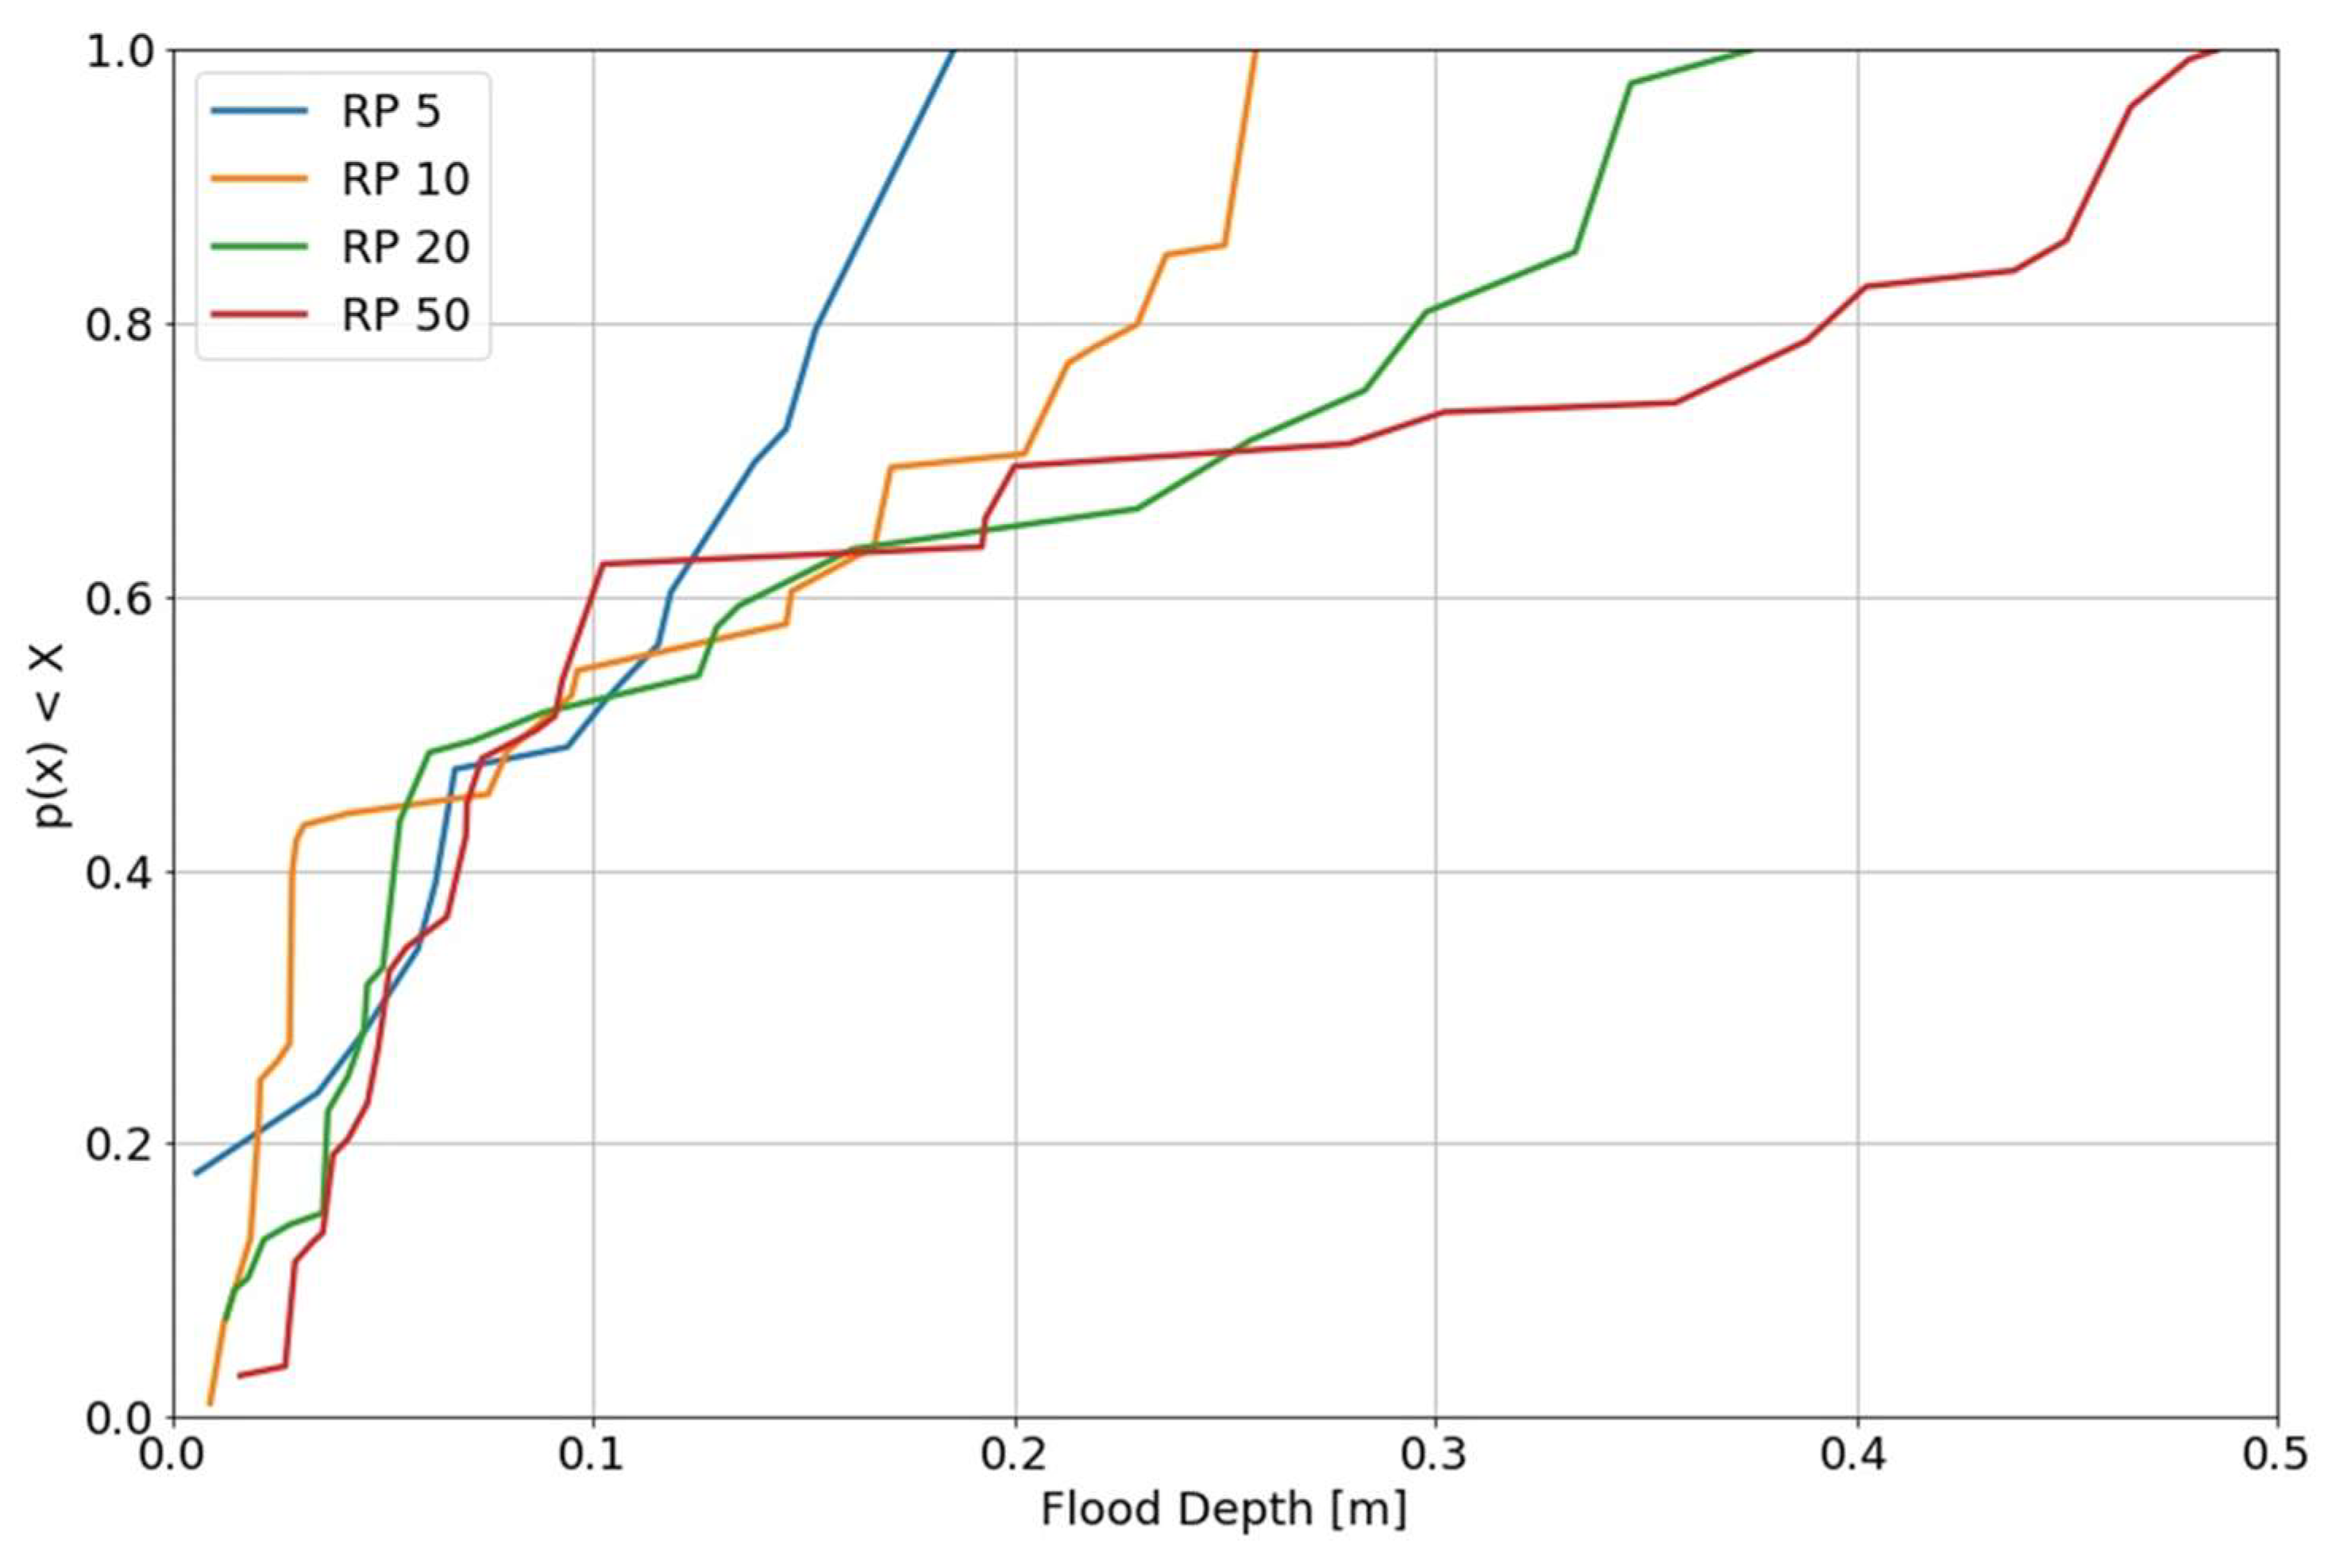
Based on the generated flood maps, further analyses can be performed. On the one hand, for a given rain event, the total flooded areas in the analyzed region can be quantified. This can be easily determined based on the number of pixels in the generated flood map and on the area of each pixel. For example, results suggest that the total flooded area caused by the 5-year return period rain event is 1976 m2, while for a 50-year event, it increases up to 4136 m2. On the other hand, the information regarding the flooded areas and their corresponding water heights can be used to analyze how flood depths vary according to the intensity of the precipitation event. An example of this can be seen in Figure 6, which illustrates the cumulative distributions of flood depths for each rainfall scenario (RPs 5, 10, 20, and 50). As expected, maximum flood depths increase consistently when increasing the event intensity, i.e., for higher return periods. Furthermore, results suggest that for all scenarios, between 50% and 60% of the flooded areas have an associated water depth equal to or lower than 0.1 m. These outcomes suggest that regardless of the rain event, it is expected that at least half of the flooded areas would have a depth of a maximum of 0.1 m. These results could serve as a basis for the implementation of management strategies or derive initial estimations related to flood damages.
4. Discussion
The proposed tool is able to generate realistic UDNs in terms of layout, hydraulic properties, and hydrodynamic processes. Results suggest that hydrodynamic models developed based on the generated systems can properly represent the complex rain-runoff processes in an urban catchment during wet-weather conditions. Based on this, the models can be used to analyze the behavior of UDNs under extreme rain events and evaluate the dynamics of associated adverse events, e.g., urban pluvial flooding, in areas where data are scarce or uncertain. Several studies have suggested that heavy rainfall events, and hence urban pluvial flooding events, are becoming more frequent [33]. In this context, it is expected that the proposed approach can be used for system evaluation or prospective planning and design and hence serve as a support for decision making regarding urban flood management. To support this, an additional module regarding not only pipe-related costs but also flood damages is planned.
Further developments of the current approach can be performed to include analyses regarding potential adaptation measures to extreme rain events and the associated urban pluvial flood events. Such improvements could be focused on determining the optimal location of gray and/or green infrastructures under the framework of flood volume reduction. In other words, the present tool could be further developed to perform network-scale analyses to evaluate the impact of placing different infrastructural elements, such as storage tanks, green roofs, infiltration trenches, and others, with regard to the frequency, magnitude, and extent of urban pluvial flood events. Furthermore, the present tool could also be extended to evaluate alternative sewer network layouts and their impacts with regard to network performance. Several studies have suggested that spatial arrangement can play an important role in the frequency of adverse drainage events, such as combined sewer overflows [34] and node flooding [35,36,37,38,39,40]. In this context, the proposed tool could be further developed to also analyze optimal sewer network layouts that decrease the occurrence and magnitude of such adverse events.
Although these are promising results, the current approach is based on several assumptions and therefore is associated with several uncertainties. As mentioned before, the sewer layout is derived from the street layout. However, there are many types of streets, and therefore, it is not clear which type to select for the analyses. In the present study, only streets classified as “trunk”, “primary”, “secondary”, “tertiary”, “residential”, “service”, and “unclassified” are considered and included in the analyses. This is achieved under the assumption that the main sewer network system, i.e., main pipes, lies under these types of streets, and it is based on the results obtained by Mair et al. [15]. Outcomes of the aforementioned study suggested that the majority of the pipes, between 62% and 85%, can be found below streets classified as “residential”, “service”, and “unclassified”. The rest of the pipes can be found under streets categorized as “motorway”, “primary”, “secondary”, and “tertiary”. Although this holds true also in the present investigation, it is hypothesized that further improvements with regard to sewer network layout definition can be obtained by considering other street types, e.g., “cycle ways” or “footways”. This may be particularly relevant for small subnetworks or for small urban catchments, i.e., at a neighborhood scale; however, it remains to be tested.
Further sources of uncertainty are related to the identification and estimation of stormwater and wastewater inflows into the system. In the first case, outcomes for the present study suggested the tool is able to replicate the rain-runoff process in the catchment (see Section 3.1.3). However, in particular for the MS2 case, the flow peaks were consistently underestimated. This suggests that there are other sources of runoff in the area that have not been accounted for in the present approach, e.g., compacted pervious areas, parking lots, driveways, or other sealed surfaces. It is recommended that input data for the tool should also cover the aforementioned surfaces in order to improve its efficiency. Furthermore, the underestimation of flow peaks may also be associated with uncertainties related to wastewater inflows. In fact, low values of the assumed per capita water consumption used to derive the sanitary inflows and of the percentile contribution of groundwater to dry weather inflows may lead to low base flow values in comparison to real conditions. This may lead to reduced wastewater volumes and hence reduced flow peaks. It is recommended to perform an adequate estimation of water consumption rates and groundwater contributions prior to the application of the tool. This can be achieved based on previous knowledge of the user about the study area or based on approaches such as the one proposed by Schilling and Tränckner [41], who derived dry weather inflows based on open-access data. Furthermore, it is always recommended that, if observed data are available, calibration and validation procedures of the model should be conducted in order to have more accurate and reliable results.
Although the diffusive overland flow model used to determine flooded areas and depths neglects several hydrodynamic processes of surface water diffusion, its results can be considered accurate enough. Chen et al. [27], developers of the approach, compared historical flood records with diffusive model results for three rain scenarios. Results suggested that the proposed model was able to accurately determine flooded depths based on low absolute errors between model results and recorded data (between −0.17 and 0.15). The efficiency of the diffusive overland flow model depends, however, on its input data. A DEM with a coarse resolution may lead to an unrealistic flood propagation, i.e., not following spatial patterns. Moreover, the presence of sink areas in the DEM can cause flooded areas with the limited surface but high and unrealistic water depths. To improve the efficiency of the approach, it is recommended to use Digital Surface Models (DSM, i.e., elevation models, which include natural and artificial features) with high resolutions and no sinks [42,43,44].
In this study, the proposed tool was applied for relatively small sewer systems, i.e., less than 300 pipes. Nevertheless, it has the potential to be used in bigger UDNs. Applications are limited to the quality of the input data and available computational capacity. In the first case, not having enough or adequate spatial information about the study area, e.g., no information about buildings and streets in the region, can lead to a bad performance of the tool. Moreover, network design and flood propagation are iterative processes that may require high computational times in large networks. It should be noted, however, that in urban areas, several independent drainage networks can coexist due to different construction customs and infrastructure evolution throughout time. Hence, city-scale applications of the proposed tool should take into account the possibility of multiple networks. For city-scale applications, it is recommended then to perform prior research about major drainage areas and apply the tool for the individual design of UDNs in each of them.
5. Summary and Conclusions
The present work focused on the development of a tool to evaluate urban pluvial flooding in a more accurate way based on open-access information. The efficiency of the tool is determined by its capacity to automatically generate and design realistic sewer networks, from which more accurate hydrodynamic models can be developed. This capacity was assessed by comparing the tool results with real sewer network data when applied in two small catchments in Dresden, Germany.
Results suggest that the proposed tool is able to generate sewer network systems with realistic layouts and hydraulic properties. In fact, in both cases, at least 80% of the real sewer network layouts can be derived using the proposed approach. Furthermore, in both study cases, the frequency distribution of pipe diameters from the simulated and real systems was statistically similar (based on a two-sample Kolmogorov–Simonov test), thus indicating they had similar hydraulic properties.
Furthermore, the generated networks can be used to develop adequate hydrodynamic models, i.e., models able to represent the different processes involved in the generation and transport of storm and wastewater. Nevertheless, in most of the rain events analyzed for both study cases, a consistent underestimation of flow peaks was identified. It is hypothesized that the main reason behind this is uncertainties regarding the definition of inflows in the system. In other words, further improvements can be made in order to better predict runoff and wastewater volumes entering a system.
The module for urban pluvial flooding evaluation was applied to one of the study cases. The results of this indicated that the current approach could be used to identify flood areas and associated flood depths during different rainfall scenarios. These results can be further processed to perform more complex analyses. For example, they can be used to evaluate how flood depths vary in an area as a function of different rain intensities.
The outcomes of this study suggest that the proposed tool can generate realistic results and hence could be used in a wide variety of contexts. For example, it could provide information in areas with data scarcity or uncertainty or serve as a tool for prospective planning, design, and decision making. Further developments of the proposed tool can be performed in order to increase its application potential. For example, analyses could be further expanded to include cost analyses, not only in terms of pipe installation, operation, and maintenance but also regarding flood damages. It is expected that the present approach could serve as support for better design, management, and operational actions of urban drainage networks, particularly in regions where data are scarce or unavailable.
Author Contributions
Conceptualization, J.D.R.-S. and B.H.; methodology, J.D.R.-S.; software, J.D.R.-S. and D.N.; validation, J.D.R.-S. and D.N.; formal analysis, all.; investigation, J.D.R.-S.; resources, P.K.; data curation, J.D.R.-S.; writing—original draft preparation, J.D.R.-S.; writing—review and editing, all.; visualization J.D.R.-S.; supervision, B.H. and P.K.; project administration, B.H.; funding acquisition, P.K. All authors have read and agreed to the published version of the manuscript.
Funding
This research was funded by the German Federal Ministry of Education and Research, grant number 01LR2005A.
Data Availability Statement
The data presented in this study is available on request from the corresponding author.
Acknowledgments
The presented work was conducted under the framework of the KlimaKonform project. It is supported by the German Federal Ministry of Education and Research through the funding measure RegIKlim (Regional Information on Climate Action, focus on Model Regions). The KlimaKonform project is a joint initiative between the Technische Universität Dresden, the Sächsisches Landesamt für Umwelt, Landwirtschaft und Geologie, the Friedrich-Schiller-Universität Jena, the Helmholtz Zentrum für Umweltforschung and the Leibniz-Institut für ökologische Raumentwicklung e.V. The authors gratefully acknowledge the cooperation with the Stadentwässerung Dresden GmbH. Map data are copyrighted by OpenStreetMap contributors and available from https://www.openstreetmap.org [Accessed on 15 October 2022].
Conflicts of Interest
The authors declare no conflict of interest.
References
- Butler, D.; Digman, C.; Makropoulos, C.; Davies, J.W. Urban Drainage, 4th ed.; Spon Press: London, UK; Taylor and Francis Group: New York, NY, USA, 2018. [Google Scholar]
- Sofia, G.; Roder, G.; Dalla Fontana, G.; Tarolli, P. Flood dynamics in urbanised landscapes: 100 years of climate and humans’ interaction. Sci. Rep. 2017, 7, 40527. [Google Scholar] [CrossRef] [PubMed]
- Pagliacci, F.; Defrancesco, E.; Bettella, F.; D’Agostino, V. Mitigation of Urban Pluvial Flooding: What Drives Residents’ Willingness to Implement Green or Grey Stormwater Infrastructures on Their Property? Water 2020, 12, 3069. [Google Scholar] [CrossRef]
- Freni, G.; La Loggia, G.; Notaro, V. Uncertainty in urban flood damage assessment due to urban drainage modelling and depth-damage curve estimation. Water Sci. Technol. 2010, 61, 2979–2993. [Google Scholar] [CrossRef] [PubMed]
- Douglas, I.; Garvin, S.; Lawson, N.; Richards, J.; Tippett, J.; White, I. Uncertainty in urban flood damage assessment due to urban drainage modelling and depth-damage curve estimation. J. Flood Risk Manag. 2010, 3, 112–125. [Google Scholar] [CrossRef]
- Bhattarai, R.; Yoshimura, K.; Seto, S.; Nakamura, S.; Oki, T. Statistical model for economic damage from pluvial floods in Japan using rainfall data and socioeconomic parameters. Nat. Hazards Earth Syst. Sci. 2016, 16, 1063–1077. [Google Scholar] [CrossRef] [Green Version]
- Jiang, Y.; Zevenbergen, C.; Ma, Y. Urban pluvial flooding and stormwater management: A contemporary review of China’s challenges and “sponge cities” strategy. Environ. Sci. Policy 2018, 80, 132–143. [Google Scholar] [CrossRef]
- Petrucci, O.; Aceto, L.; Bianchi, C.; Bigot, V.; Brázdil, R.; Pereira, S.; Kahraman, A.; Kilic, O.; Kotroni, V.; Llasat, M.C.; et al. Flood Fatalities in Europe, 1980–2018: Variability, Features, and Lessons to Learn. Water 2018, 11, 1682. [Google Scholar] [CrossRef] [Green Version]
- Rossman, L.A. Storm Water Management Model, User’s Manual, Version 5.1; U.S. EPA: Cincinnati, OH, USA, 2015.
- Ghosh, I.; Hellweger, F.L.; Fritch, T.G. Fractal Generation of Artificial Sewer Networks for Hydrologic Simulation. In Proceedings of the ESRI International User Conference, San Diego, CA, USA, 7–11 August 2006. [Google Scholar]
- Möderl, M.; Butler, D.; Rauch, W. A stochastic approach for automatic generation of urban drainage systems. Water Sci. Technol. 2009, 59, 1137–1143. [Google Scholar] [CrossRef]
- Urich, C.; Sitzenfrei, R.; Möderl, M.; Rauch, W. An agent-based approach for generating virtual sewer systems. Water Sci. Technol. 2010, 62, 1090–1097. [Google Scholar] [CrossRef]
- Blumensaat, F.; Wolfram, M.; Krebs, P. Sewer model development under minimum data requierements. Environ. Earth Sci. 2012, 65, 1427–1437. [Google Scholar] [CrossRef]
- Döring, A.; Neuweiler, I. Generation of Stormwater Drainage Networks Using Spatial Data. In New Trends in Urban Drainage Modelling—UDM 2018; Mannina, G., Ed.; Springer: Cham, Switzerland, 2018; pp. 576–581. [Google Scholar] [CrossRef]
- Mair, M.; Zischg, J.; Rauch, W.; Sitzenfrei, R. Where to find water pipes and sewers?- On the correlation of INfrastructure Networks in the Urban Ennvironment. Water 2017, 9, 146. [Google Scholar] [CrossRef] [Green Version]
- Duque, N.; Bach, P.M.; Scholten, L.; Fappiano, F.; Maurer, M. A Simplified Sanitary Sewer System Generator for Exploratory Modelling at City-Scale. Water Res. 2022, 209, 117903. [Google Scholar] [CrossRef] [PubMed]
- Butler, D.; Davis, J.W. Urban Drainage, 2nd ed.; Spon Press: London, UK, 2004. [Google Scholar]
- Maurer, M.; Wolfram, M.; Anja, H. Factors affecting economies of scale in combined sewer systems. Water Sci. Technol. 2010, 62, 36–41. [Google Scholar] [CrossRef] [PubMed]
- Duque, N.; Duque, D.; Saldarriaga, J. A new methodology for the optimal design of series of pipes in sewer systems. J. Hydroinform. 2016, 18, 757–772. [Google Scholar] [CrossRef] [Green Version]
- Cao, X.J.; Ni, G.H. Effect of storm network simplification on flooding prediction with varying rainfall conditions. IOP Conf. Ser. Earth Environ. Sci. 2019, 344, 012093. [Google Scholar] [CrossRef]
- Davidsen, S.; Löwe, R.; Thrysoe, C.; Arnbjerg-Nielsen, K. Simplification of one-dimensional hydraulic networks by automated processes evaluated on 1D/2D deterministic flood models. Hydroinformatics 2017, 19, 686–700. [Google Scholar] [CrossRef] [Green Version]
- Yang, Q.; Dai, Q.; Han, D.; Zhu, X.; Zhang, S. Impact of the Storm Sewer Network Complexity on Flood Simulations According to the Stroke Scaling Method. Water 2018, 10, 645. [Google Scholar] [CrossRef] [Green Version]
- OpenStreetMap Contributors. Planet Dump. 2015. Available online: https://planet.openstreetmap.org (accessed on 15 October 2022).
- QGIS.org. QGIS Geographic Information System. QGIS Association. Available online: http://www.qgis.org (accessed on 15 October 2022).
- Kruskal, J.B. On the shortest spanning subtree of a graph and the traveling salesman problem. Proc. Am. Math. Soc. 1956, 7, 48–50. [Google Scholar] [CrossRef]
- DWA-A118; Arbeitsblatt DWA-A 118 Hydraulische Bemessung und Nachweis Hydraulische Bemessung und Nachweis. DWA Deutsche Vereinigung für Wasserwirtschaft, Abwasser und Abfall e. V.: Hennef, Germany, 2006.
- Chen, W.; Huang, G.; Zhang, H. Urban stormwater inundation simulation based on SWMM and diffusive overland-flow model. Water Sci. Technol. 2017, 76, 3392–3403. [Google Scholar] [CrossRef] [Green Version]
- Federal Statistical Office. Special Evaluation Results of the Census of 9 May 2011 per Grid Cell. Online Database. 2013. Available online: https://www.zensus2011.de/DE/Home/home_node.html (accessed on 18 October 2019).
- S. G. u. V. S. [GeoSN]. Sachsen Geoportal. 2020. Available online: https://www.geodaten.sachsen.de/downloadbereich-dgm25-4162.html (accessed on 24 April 2022).
- Kolmogorv, A. Sulla determinazione empirica di una legge di distribuzione. G. Ist. Ital. Attuari 1933, 4, 83–91. [Google Scholar]
- Nash, J.E.; Sutcliffe, J.V. River flow forecasting through conceptual models part I—A discussion of principles. J. Hydrol. 1970, 10, 282–290. [Google Scholar] [CrossRef]
- Kim, Y.; Chung, E.-S.; Won, K.; Gil, K. Robust Parameter Estimation Framework of a Rainfall-Runoff Model Using Pareto Optimum and Minimax Regret Approach. Water 2015, 7, 1246–1263. [Google Scholar] [CrossRef]
- IPCC. Summary for Policymakers. In Climate Change 2022: Impacts, Adaptation, and Vulnerability; Pörtner, H., Roberts, D.C., Poloczanska, E.S., Minitenbeck, K., Tignor, M., Alegria, A., Craig, M., Langsdorf, S., Löschke, S., Möller, V., et al., Eds.; Cambridge University Press: Cambridge, UK; New York, NY, USA, 2022; pp. 3–33. [Google Scholar]
- Reyes-Silva, J.; Bangura, E.; Helm, B.; Benisch, J.; Krebs, P. The Role of Sewer Network Structure on theOccurrence and Magnitude of Combined SewerOverflows (CSOs). Water 2020, 12, 2675. [Google Scholar] [CrossRef]
- Hesarkazzazi, S.; Hajibabaei, M.; Reyes-Silva, J.D.; Krebs, P.; Sitzenfrei, R. Assessing Redundancy in Stormwater Structures Under Hydraulic Design. Water 2020, 12, 1003. [Google Scholar] [CrossRef] [Green Version]
- Reyes-Silva, J.; Frauches, A.; Rojas-Gómez, K.; Helm, B.; Krebs, P. Determination of Optimal Meshness of Sewer Network Based on a Cost—Benefit Analysis. Water 2021, 13, 1090. [Google Scholar] [CrossRef]
- Reyes-Silva, J.D.; Helm, B.; Krebs, P. Meshness of sewer networks and its implications for flooding occurrence. Water Sci. Technol. 2020, 81, 40–51. [Google Scholar] [CrossRef]
- Zhang, C.; Wang, Y.; Li, Y.; Ding, W. Vulnerability Analysis of Urban Drainage Systems: Tree vs. Loop Networks. Sustainability 2017, 9, 397. [Google Scholar] [CrossRef] [Green Version]
- Gebreegziabher, M.; Demissie, Y. Modeling Urban Flood Inundation and Recession Impacted by Manholes. Water 2020, 12, 1160. [Google Scholar] [CrossRef] [Green Version]
- Nkwunowo, U.C.; Whitworth, M.; Baily, B. A review of the current status of flood modelling for urban flood risk man-agement in the developing countries. Sci. Afr. 2020, 7, e00269. [Google Scholar]
- Schilling, J.; Tränckner, J. Estimation of Wastewater Discharges by Means of OpenStreetMap Data. Water 2020, 12, 628. [Google Scholar] [CrossRef] [Green Version]
- Liu, J.; Shao, W.; Xiang, C.; Mei, C.; Li, Z. Uncertainties of urban flood modeling: Influence of parameters for different underlying surfaces. Environ. Res. 2020, 182, 108929. [Google Scholar] [CrossRef] [PubMed]
- Bulti, D.T.; Abebe, B.G. A review of flood modeling methods for urban pluvial flood application. Model. Earth Syst. Environ. 2020, 6, 1293–1302. [Google Scholar] [CrossRef]
- Arrighi, C.; Campo, L. Effects of digital terrain model uncertainties on high-resolution urban flood damage. J. Flood Risk Manag. 2019, 12, e12530. [Google Scholar] [CrossRef]
Figure 1.
Combined (MS2) and separate (MS5) sewer networks in the study area.

Figure 2.
Comparison of generated and real sewer network layouts for MS2 (left) and MS5 (right).

Figure 3.
Empirical cumulative distribution functions (ECDFs) of pipes maximum cross section height for the generated and real drainage network. Results for MS2 are on the (left) and results for MS5 are on the (right).
Figure 3.
Empirical cumulative distribution functions (ECDFs) of pipes maximum cross section height for the generated and real drainage network. Results for MS2 are on the (left) and results for MS5 are on the (right).

Figure 4.
Comparison of simulated and real diamaters.

Figure 5.
Examples of generated flood maps in the MS2 study area for a 5-year (left) and 50-year (right) return period synthetic rain events.
Figure 5.
Examples of generated flood maps in the MS2 study area for a 5-year (left) and 50-year (right) return period synthetic rain events.

Figure 6.
Cumulative distributions of flooded depths for four rainfall scenarios (5-, 10-, 20-, and 50-year return period synthetic rain events).
Figure 6.
Cumulative distributions of flooded depths for four rainfall scenarios (5-, 10-, 20-, and 50-year return period synthetic rain events).


Table 1.
Goodness-of-fit results for MS5.
| Date | NSE | PFE |
|---|---|---|
| 16 September 2016 | 0.71 | 0.28 |
| 4 April 2017 | 0.59 | 0.21 |
| 12 July 2017 | 0.77 | −0.37 |
| 26 July 2017 | 0.84 | 0.06 |
| 1 August 2017 | 0.60 | 0.30 |
| 9 August 2017 | 0.81 | −0.33 |
| 11 August 2017 | 0.82 | −0.14 |
| 16 August 2017 | 0.59 | 0.36 |
| 3 October 2017 | 0.60 | 0.10 |
| 5 October /2017 | 0.69 | 0.31 |
| 9 October 2017 | 0.71 | −0.18 |
| 21 October /2017 | 0.88 | 0.13 |
| 27 October 2017 | 0.81 | −0.33 |
| 5 November 2017 | 0.88 | −0.11 |
Table 2.
Goodness-of-fit results for MS2.
| Date | NSE | PFE |
|---|---|---|
| 22 June 2017 | 0.78 | 0.49 |
| 11 July 2017 | 0.78 | 0.45 |
| 12 July 2017 | 0.54 | 0.51 |
| 26 July 2017 | 0.96 | 0.14 |
| 1 August 2017 | 0.52 | −0.15 |
| 8 August /2017 | 0.61 | 0.23 |
| 10 August 2017 | 0.95 | 0.15 |
| 11 August 2017 | 0.82 | 0.31 |
| 18 August 2017 | 0.73 | 0.53 |
Disclaimer/Publisher’s Note: The statements, opinions and data contained in all publications are solely those of the individual author(s) and contributor(s) and not of MDPI and/or the editor(s). MDPI and/or the editor(s) disclaim responsibility for any injury to people or property resulting from any ideas, methods, instructions or products referred to in the content. |
© 2022 by the authors. Licensee MDPI, Basel, Switzerland. This article is an open access article distributed under the terms and conditions of the Creative Commons Attribution (CC BY) license (https://creativecommons.org/licenses/by/4.0/).
Share and Cite
MDPI and ACS Style
Reyes-Silva, J.D.; Novoa, D.; Helm, B.; Krebs, P. An Evaluation Framework for Urban Pluvial Flooding Based on Open-Access Data. Water 2023, 15, 46. https://doi.org/10.3390/w15010046
AMA Style
Reyes-Silva JD, Novoa D, Helm B, Krebs P. An Evaluation Framework for Urban Pluvial Flooding Based on Open-Access Data. Water. 2023; 15(1):46. https://doi.org/10.3390/w15010046
Chicago/Turabian StyleReyes-Silva, Julian D., Diego Novoa, Björn Helm, and Peter Krebs. 2023. "An Evaluation Framework for Urban Pluvial Flooding Based on Open-Access Data" Water 15, no. 1: 46. https://doi.org/10.3390/w15010046
Note that from the first issue of 2016, this journal uses article numbers instead of page numbers. See further details here.